the Creative Commons Attribution 4.0 License.
the Creative Commons Attribution 4.0 License.
 | 26 Sep 2025
Effectiveness of emission controls on atmospheric oxidation capacity and air pollutant concentrations: uncertainties due to chemical mechanisms and inventories
Mingjie Kang
Hongliang Zhang
Qi Ying
In this study, three photochemical mechanisms of varying complexity from the Statewide Air Pollution Research Center (SAPRC) family and two widely used anthropogenic emission inventories are employed to quantify the discrepancies in the predicted effectiveness of nitrogen oxides (NOx) and volatile organic compound (VOC) emission controls on ozone (O3), secondary inorganic aerosols (SIAs), and hydroxyl (OH) and nitrate (NO3) radicals using the Community Multiscale Air Quality (CMAQ) model. For maximum daily average 8 h O3 (O3-8 h), relative reductions predicted using different emission inventory and mechanism combinations are consistent for up to 80 % NOx or VOC reductions, with maximum differences of approximately 15 %. For SIA, while the predicted relative changes in their daily average concentrations due to NOx reductions are quite similar, very large differences of up to 30 % occur for VOC reductions. Sometimes even the direction of change (i.e., increase or decrease) is different. For the oxidants OH and NO3 radicals, the uncertainties in the relative changes due to emission changes are even larger among different inventory–mechanism combinations, sometimes by as much as 200 %. Our results suggest that while the O3-8 h responses to emission changes are not sensitive to the choice of chemical mechanism and emission inventories, using a single model and mechanism to evaluate the effectiveness of emission controls on SIA and atmospheric oxidation capacity may have large errors. For these species, the evaluation of the control strategies may require an ensemble approach with multiple inventories and mechanisms.
- Article
(4550 KB) - Full-text XML
-
Supplement
(5611 KB) - BibTeX
- EndNote


Tropospheric ozone (O3) pollution remains a major global concern. O3 plays a critical role in atmospheric chemistry and is an important target for air quality improvement (Lu et al., 2018; Lyu et al., 2023; Real et al., 2024) because high levels of surface O3 negatively affect human health, agricultural crop yields, and plant growth (Du et al., 2024; Feng et al., 2022; Ghude et al., 2016; Lu et al., 2020; West et al., 2006). Surface O3 is mainly formed by the photochemical reactions of NOx and volatile organic compounds (VOCs) emitted from anthropogenic and biogenic sources (Finlayson-Pitts and Pitts, 1999; Seinfeld and Pandis, 2016). The development of effective O3 control strategies is hampered by the considerable spatial and temporal variability of surface O3 concentrations and their non-linear relationship with emissions and meteorological conditions.
Three-dimensional chemical transport models (CTMs) are a valuable tool for developing effective air pollution control strategies. They can provide spatial and temporal information on O3, particulate matter and toxic air pollutants by numerically solving the mathematical equations describing the emission, reaction, transport, and deposition of primary and secondary atmospheric pollutants (Byun and Schere, 2006; Russell, 1997). The impact of meteorology uncertainties on air quality model predictions of O3 and particulate matter has been studied by Gilliam et al. (2015) and Wen et al. (2025), respectively. Additionally, the veracity of modeling outcomes is contingent upon the gas-phase chemical mechanisms and emission inventories. Reliance on a single chemical mechanism and emission inventory may result in substantial uncertainty in modeled pollutant concentrations. A common approach to reduce uncertainty in air quality model predictions is to use an ensemble of simulations with different emission inventories and chemical mechanisms (Hu et al., 2017a).
The photochemical mechanism is one of the core components of all CTMs. While the representation of inorganic chemistry is generally similar across mechanisms, the representation of atmospheric organic chemistry differs significantly in terms of the number of explicit model species, the lumping schemes, and the radical chemistry, leading to variations in the model predictions of O3, PM2.5, air toxics, and some important radical species (Griffith et al., 2016; Kim et al., 2009). Furthermore, the responses of the predictions to changes in emissions may also differ depending on the photochemical mechanism employed, which may impact the assessment of emission control strategies. In practical applications, it is of the utmost importance to strike a balance between mechanism complexity and computational efficiency. For long-term modeling studies of criteria pollutants and the evaluation of numerous emission control strategies, condensed mechanisms may prove to be the optimal choice. More detailed mechanisms are appropriate for a broader range of applications, such as investigations into specific reaction products that are not explicitly represented in condensed mechanisms. However, they are more demanding on computational resources.
In this context, several mechanism comparison studies have been conducted. Differences in predicted O3 levels using various photochemical mechanisms have been reported (Yu et al., 2010; Venecek et al., 2018). In addition to directly comparing the model predictions of O3 concentrations, comparative analyses were also undertaken to examine the similarities and differences between these mechanisms in predicting O3 changes in response to changes in precursor emissions. For example, Li et al. (2012) and Kang et al. (2022) compared several mechanisms from the Statewide Air Pollution Research Center (SAPRC) family, including the standard versions of SAPRC-99, SAPRC-07, SAPRC-11, and a highly condensed version of SAPRC-07. Their results showed that, despite discrepancies in the predictions for O3, key radicals such as OH and HO2, and oxidation products such as HNO3, H2O2, NO2, PAN, and HCHO, the relative changes in O3 due to changes in NOx and VOC emissions were almost identical.
On the other hand, the accuracy of model predictions is also significantly affected by uncertainties in anthropogenic emission inventories (Hu et al., 2017a; Kang et al., 2022; Placet et al., 2000), which primarily arise from uncertainties and variability in activity levels (e.g., industrial production or energy consumption) and emission factors (Akimoto et al., 2006; Lei et al., 2011; Streets et al., 2003). For example, when local speciation profiles are not available for the generation of mechanism-specific VOC emissions from the emission rate of non-methane hydrocarbons, average speciation profiles from the SPECIATE database developed by the US EPA were often adopted (Bray et al., 2019; Li et al., 2014; Streets et al., 2003; Wu and Xie, 2017). However, the emission factors from the SPECIATE profiles are predominantly representative of the characteristics of local emissions, as a consequence of the disparities in emission standards and control technologies among diverse geographical regions (Sha et al., 2021). This introduces uncertainties into the emissions and the predicted pollutant concentrations.
To date, several emission inventories covering China have been developed, such as the Multi-resolution Emission Inventory for China (MEIC), the Regional Emission inventory in ASia (REAS), and the Emission Database for Global Atmospheric Research (EDGAR). These inventories have been successfully applied in chemical transport modeling to investigate the concentration and spatial distribution of O3 and other pollutants (Hu et al., 2017b; Kang et al., 2021; Li et al., 2019, 2018; Saikawa et al., 2017; Xue et al., 2020; Yamaji et al., 2008). Hu et al. (2017a) reported inconsistencies in emission inventories in predicting O3 and PM2.5 using the Weather Research and Forecasting/Community Multiscale Air Quality (WRF/CMAQ) model system. Ma and van Aardenne (2004) identified variations in NOx and VOC emissions among different inventories as the main factors influencing modeled O3 concentrations. Our previous study, which employed the condensed SAPRC-07 mechanism and two anthropogenic emission inventories (MEIC and REAS), also observed relatively larger differences in O3 predictions between inventories in megacities of Beijing and Shanghai, especially on days with elevated O3 levels (Kang et al., 2022).
While several studies have explored the differences in model predictions due to varying chemical mechanisms or emission inventories, a comprehensive analysis of the influence of diverse combinations of these two factors on the sensitivity of O3 and other air pollutants to emission changes in China has yet to be undertaken. In this study, our motivation is to address this gap by applying the CMAQ model, integrated with three photochemical mechanisms and two widely used emission inventories, to quantify the effects of different combinations of mechanisms and inventories on the predictions of maximum daily average 8 h ozone (O3-8 h) and other secondary pollutants in different regions of China. In addition, the impacts on atmospheric oxidation capacity and key gaseous pollutants are investigated. To gain insight into the variations in pollutant sensitivity, a series of incremental emission reduction scenarios were used, thereby enabling the quantification of the influence of different mechanism and inventory combinations on the response of O3 and related pollutants. The findings of this study can assist policymakers in the development of more effective and adaptive pollution control strategies.
2.1 The CS07, SAPRC-11, and SAPRC-18 mechanisms
The SAPRC mechanism is a widely used photochemical mechanism that represents complex atmospheric reactions in computationally tractable forms. Instead of tracking the oxidation of individual precursor organic compounds and their reaction products explicitly, the SAPRC is a lumped-molecule chemical mechanism that groups structurally similar VOC species (e.g., alkanes, akenes, and aromatics) into several groups of lumped model species. Some important species, such as isoprene and formaldehyde, are represented explicitly. The reactions of each lumped model species with common oxidants (OH, NO3, and O3) are derived based on the reactions of individual species within that group, which are generated automatically using a mechanism generator (Carter et al., 2025). One of the complexities in representing VOC reactions is the intermediate oxidation products and radical species. In the SAPRC mechanism, the radicals such as peroxyl radicals and intermediate products such as organic nitrates are represented by a group of common species to reduce the number of reactions and model species. A brief comparison of the three SAPRC mechanisms is summarized in Table S1 in the Supplement.
Three different chemical mechanisms from the SAPRC mechanism family were used in this study, i.e., the condensed SAPRC-07 (CS07) (Carter, 2010), the standard SAPRC-11 (S11) (Carter and Heo, 2013), and the standard SAPRC-18 (S18) (Carter, 2020). These mechanisms were selected to represent different levels of detail in gas-phase reactions in a regional chemical transport model. The CS07 was derived from the widely used SAPRC-07 mechanism and has a high condensation level similar to that of the carbon bond mechanism, which is also widely used. The S11 is an updated version of the SAPRC-07 mechanism, with significant revisions made to the aromatic chemistry. The S11 mechanism employed in this study is identical to that utilized in our previous study (Kang et al., 2021). For a detailed description of CS07 and S11 regarding O3 source apportionment and emission sensitivity, please refer to Kang et al. (2022). The S18 mechanism represents a complete update of the SAPRC mechanism since SAPRC-07. S18 incorporates a greater number of model species, a more explicit representation of peroxyl radical chemistry, and a lumping scheme that is more suitable for predicting secondary organic aerosol (SOA) formation. Due to these modifications, S18 is more extensive than S11 in terms of both the number of species and chemical reactions. Although it has been successfully applied in photochemical box models (Jiang et al., 2020; Li et al., 2022a, b), it has not yet been implemented in 3D regional CTMs.
2.2 Anthropogenic emission inventories
The present study compares two widely used anthropogenic emission inventories, MEIC (http://www.meicmodel.org, last access: 16 September 2025) and REAS 3.1 (https://www.nies.go.jp/REAS/, last access: 16 September 2025), to investigate O3 pollution in China. The emission data from these inventories were processed using an in-house emission processor. Detailed VOC speciation profiles selected from the US EPA-developed SPECIATE database were processed using the speciation profile processor from Carter (2015) to generate profiles for the CS07, SAPRC-11, and SAPRC-18 mechanisms, which are used to estimate emissions of CMAQ-ready VOCs. The MEIC emission inventory includes only emission estimates in China, whereas the REAS emission inventory has complete spatial coverage for Asian countries. In the MEIC simulation, emissions from other countries are supplemented using data from the REAS inventory.
2.3 Model application
The CS07, S11, and S18 mechanisms were incorporated into the CMAQ model (version 5.0.2) to evaluate the differences of mechanisms and inventories in predicting O3-8 h, OH and NO3 radicals, secondary inorganic aerosols, and reactive VOC species (HCHO) in July 2017 in China. July is widely used in modeling studies to represent conditions of a typical summer month (Kang et al., 2021). The model domain, which covers China and surrounding areas in eastern and southeastern Asia at a 36 km × 36 km horizontal resolution, along with the locations of cities mentioned in the article, is illustrated in Fig. S1 in the Supplement.
The simulations included model runs with the following combinations: S11 mechanism with MEIC inventory (S11–MEIC), S11 with REAS (S11–REAS), CS07 with MEIC (CS07–MEIC), CS07 with REAS (CS07–REAS), and S18 with REAS (S18–REAS). The MEIC only has five emission sectors, making it difficult to re-speciate the emissions for the S18 mechanism. Specifically, solvent utilization emissions are not represented in the public version of MEIC as a separate sector (Wang et al., 2018). Since solvent utilization accounts for a significant fraction of VOC emissions in urban areas and has very different emission characteristics than fuel combustion sources, re-speciating the five-sector MEIC VOC emissions will be inaccurate. It should be noted that while the MEIC emission inventory is for 2017, the most recent year in the REAS inventory is 2015, which is the one used in the current study.
The July anthropogenic emission inventories from MEIC and REAS were processed using an in-house emission processor, with updated speciation profiles employed to generate CMAQ-ready VOC emissions (Kang et al., 2022). The speciation profiles for different chemical mechanisms were derived from the same detailed speciation profiles extracted from the SPECIATE database. Comprehensive overviews of MEIC and REAS inventories were provided by Kang et al. (2022). Comparisons of major species, including NOx (NO + NO2), SO2, ethene (ETHENE), formaldehyde (HCHO), higher olefins (OLE) (comprising OLE1 and OLE2, which are lumped alkene species with propylene and trans-2-pentene as representative compounds), isoprene (ISOPRENE), and monoterpenes (TRP1), are shown in Tables S2–S3 and Figs. S2–S3 for municipalities and provinces in July 2017. Note that OLE and TRP1 emissions are from the S11 mechanisms. Emissions for CS07 are similar, but some of the species in OLE and TRP1 are explicit species in S18. There are notable spatial differences in the weekday emissions of HCHO, ETHENE, OLE, SO2, and NOx between MEIC and REAS. Specifically, REAS exhibits higher HCHO emissions in locations like Beijing, Tianjin, Henan, Shanghai, and Guangzhou than MEIC (Fig. S2). In the south of Henan, ethene emissions are significantly higher in REAS relative to MEIC. The emissions of OLE in REAS are lower than those in MEIC in Beijing, Tianjin, Shanghai, Guangzhou, Chengdu, and Chongqing. SO2 emissions in MEIC are generally lower than those in REAS, except for Shanghai and Guangzhou. NOx emissions differ significantly between MEIC and REAS. In eastern China, including cities like Shanghai and Guangzhou, NOx emissions from REAS are typically lower than those from MEIC, although some areas demonstrate a notable increase. These discrepancies inevitably affect the accuracy of air pollutant predictions, underscoring the necessity for a comprehensive assessment of emission inventories in the development of effective pollution control policies.
Biogenic emissions were generated using the Model of Emissions of Gases and Aerosols from Nature (MEGAN) version 2.10, which has been observed to emit higher levels of isoprene and monoterpenes in comparison to anthropogenic sources (Fig. S3). Open burning emissions were produced using the FINN inventory from the National Center for Atmospheric Research (NCAR) (Wiedinmyer et al., 2011). Sea salt and windblown dust emissions were simulated online using the CMAQ model. Initial and boundary conditions for the model simulation were generated using CMAQ default profiles. The initial 3 d of the simulation serve as a spinup and are excluded from subsequent analyses.
Meteorological inputs were generated using the Weather Research and Forecasting (WRF) model version 4.2 for the 36 × 36 km domain with 44 vertical layers. The initial and boundary conditions for WRF were derived from the FNL global reanalysis data (available at https://rda.ucar.edu/datasets/ds083.2/, last access: 16 September 2025). Further details on the configuration of WRF model can be found in the work of Kang et al. (2022). WRF-derived meteorological parameters, including temperature and relative humidity at a height of 2 m above the surface and wind speed and direction at 10 m, have been validated against observational data from the National Climatic Data Center (NCDC), demonstrating good performance (Kang et al., 2021).
2.4 Sensitivity of O3 and related pollutants to emission controls across different mechanisms and inventories
A large number of sensitivity simulations with systematic reductions in NOx and VOC emissions were conducted to explore variations in the sensitivity of O3-8 h and related pollutants to emission reductions across different mechanisms and inventories. Three sets of simulations were performed for each mechanism/inventory combination considered in this study (see Sect. 2.3). In the first set of simulations, NOx emissions were reduced by 20 %, 40 %, 50 %, 60 %, and 80 %, while the emissions of VOCs were maintained at their base-case level. In the second set of simulations, VOC emissions were reduced by 20 %, 40 %, 50 %, 60 %, and 80 %, while NOx emissions remained constant. In the third set of simulations, both NOx and VOC emissions were reduced by 20 %, 40 %, 50 %, 60 %, and 80 %.
3.1 Model evaluation of O3 and PM2.5 predictions across various mechanisms and inventories
Observations of O3-8 h and PM2.5 at a large number of surface monitoring stations nationwide in July 2017 were obtained from the publication website of the China National Environmental Monitoring Center (http://www.cnemc.cn, last access: 16 September 2025). The model performance statistics were evaluated separately for different regions: the North China Plain (NCP), Yangtze River Delta (YRD), Central China (Center), Pearl River Delta (PRD), and Sichuan Basin (SCB). Specifically, NCP includes Beijing, Tianjin, and some cities in Hebei and Shandong provinces; Center includes cities in the provinces of Henan, Hubei, Hunan, and Jiangxi; YRD includes Shanghai and some cities in the provinces of Anhui, Jiangsu, and Zhejiang; PRD includes Shenzhen and some cities in Guangdong province; and SCB includes Chongqing and some cities in Sichuan province. As shown in Figs. S4–S5, the model performance for O3-8 h and PM2.5 predicted by different mechanisms and emission inventories in major regions of China exhibits large variations, due to differences in climate, topography, and emission sources. Overall, the average values of mean normalized bias (MNB) and mean normalized error (MNE) for O3-8 h predictions across all combinations of mechanisms and inventories are generally within the recommended model performance criteria (MNB ≤ ± 0.15 and MNE ≤ 0.3) (Emery et al., 2017) in most regions. Similarly, the model shows good performance for PM2.5 in most areas, except for the PRD region, where the mean fractional biases (MFB) for PM2.5 using S18–REAS, CS07–REAS, and S11–REAS are slightly outside the recommended range (Boylan and Russell, 2006). The underestimation of PM2.5 predictions using REAS in the PRD, as shown in Fig. S5, is likely related to biases in this inventory specific to this region.
3.2 Spatial variations in predictions of O3 and related pollutants by different mechanisms and inventories
Figure 1 shows the spatial distribution of monthly averaged O3-8 h concentrations predicted by S11–MEIC in July, along with the absolute differences between O3-8 h predictions from S11–MEIC and those from other mechanisms and inventories. Based on S11–MEIC, high O3-8 h levels exceeding 80 ppb occurred in eastern China, especially in Beijing, Tianjin, Hebei, northern Henan, SCB, and Shanghai. Extremely high O3-8 h levels above 100 ppb are also observed over the Bohai Bay and the Yellow Sea, likely due to regional transport of polluted air from the continent, reduced NOx titration with O3, and lower O3 dry deposition velocities over the ocean (Luhar et al., 2017; Silva and Heald, 2018). Similar spatial distributions of O3-8 h concentrations are also found in the simulations using other mechanisms and inventories (Fig. S6). In comparison, O3-8 h concentrations predicted by S11–REAS are generally 2–7 ppb higher than those by S11–MEIC in most parts of China, especially in the central region, Zhejiang, and Fujian provinces, but about 2–7 ppb lower in Beijing, Shanghai, Chengdu, and the PRD region. S18–REAS predicted significantly lower O3-8 h levels, with reductions greater than 7 ppb in regions such as Beijing, Tianjin, Hebei, Shanghai, SCB, PRD, and other developed areas such as Zhengzhou and Hefei.
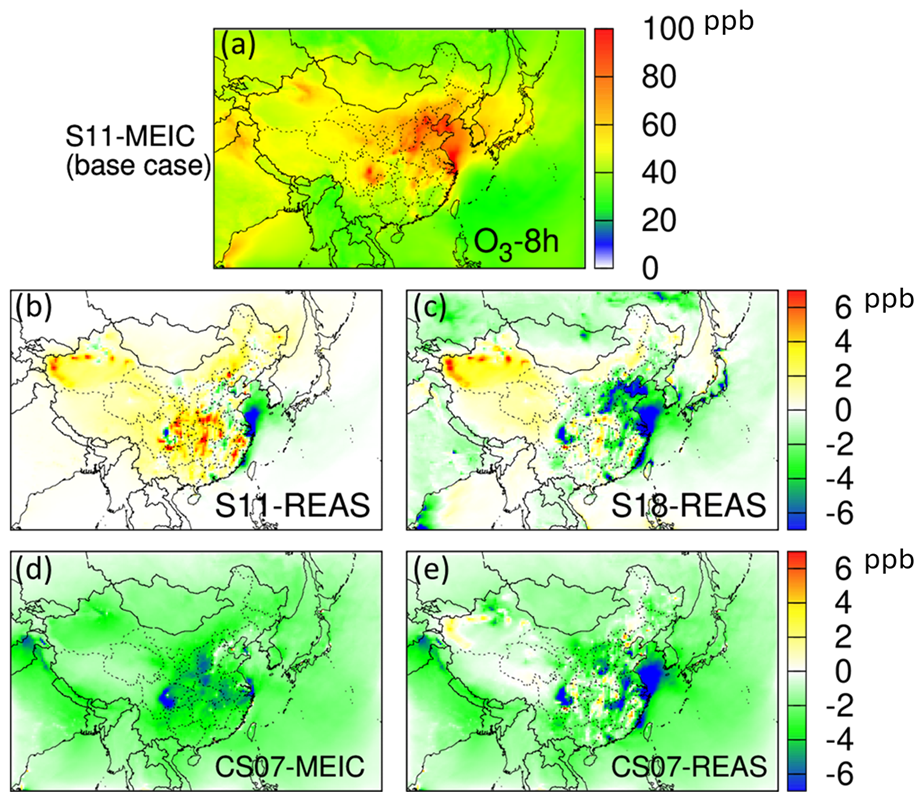
Figure 1Predicted monthly averages of MDA8 O3 (O3-8 h) concentrations in July 2017 using (a) the S11 mechanism and MEIC emission inventory (base case) and the differences between the base case and cases using alternative photochemical mechanisms and emission inventories (alternative case – base case): (b) S11 and REAS, (c) S18 and REAS, (d) CS07 and MEIC, and (e) CS07 and REAS inventories. Units are ppb.
In contrast, CS07–MEIC predicted lower O3-8 h levels overall, with apparent reductions of ∼ 6–7 ppb in the SCB, central China, and coastal areas near Shanghai. Similarly, CS07–REAS also showed generally lower O3-8 h concentrations compared to S11–MEIC, particularly in Chengdu, Luoyang, Shanghai, Guangzhou, Ningbo, Hefei, Nanchang, and the Yellow Sea (∼ 7 ppb lower or more), although some locations exhibit higher O3-8 h levels than those predicted by S11–MEIC. These discrepancies highlight that the accuracy of O3 predictions is sensitive to variations in photochemical mechanisms and emission inventories. This underscores the importance of adopting and comparing multiple mechanisms and inventories when developing region-specific pollution control policies.
The difference in Fig. 1c for other countries is mainly due to the difference between S11 and S18. Predicted O3 concentrations by S18 are lower than those by S11, especially in urban areas (e.g., in Ulaanbaatar in Mongolia). This is consistent with the box-model simulation results reported by Carter (2020). In Fig. 1a, the difference of the monthly O3 in other countries is negligible when the same chemical mechanism is used, which further confirms our conclusion.
In Fig. 1b, O3 concentrations from S11–REAS are significantly lower than those from S11–MEIC over the Yellow Sea. This is because the O3 formation sensitivity regime over the Yellow Sea is likely NOx-limited as the VOC-sensitive urban plume is advected to the marine environment (Vermeuel et al., 2019). Furthermore, satellite-observed HCHO/NOx columns over the Yellow Sea are greater than 6, clearly indicating a NOx-limited regime (Kang et al., 2021). Since the NOx emissions in the upwind regions in the REAS inventory are significantly lower than these in the MEIC inventory, this leads to reduced O3 formation in the S11–REAS results compared to the S11–MEIC results.
Figure 2 illustrates the differences in spatial distribution of monthly averaged secondary inorganic aerosol (SIA) concentrations modeled with different mechanisms and inventories. According to S11–MEIC, high SIA concentrations are mainly concentrated in NCP and SCB, exceeding 15 µg m−3. High SIA concentrations are also found in Bohai Bay, likely due to long-range transport of polluted air from land sources. Compared to S11–MEIC, S11–REAS predicts higher SIA concentrations (> 1 µg m−3) in most areas, especially in NCP, Henan, and SCB (higher by about 6 µg m−3 or even more). Nationwide, SIA concentrations predicted by S18–REAS are generally higher than those predicted by S11–MEIC, with increases of up to 6 µg m−3 or more in the NCP, Central China, SCB, Bohai Bay, and the Yellow Sea. CS07–MEIC shows similar SIA levels to S11–MEIC, with slightly lower concentrations of ∼ 1 µg m−3 in SCB and Bohai Bay. The spatial differences in SIA predictions between CS07–REAS and S11–MEIC are similar to those between S11–REAS and S11–MEIC, suggesting that SIA concentrations from CS07–REAS and S11–REAS are comparable.
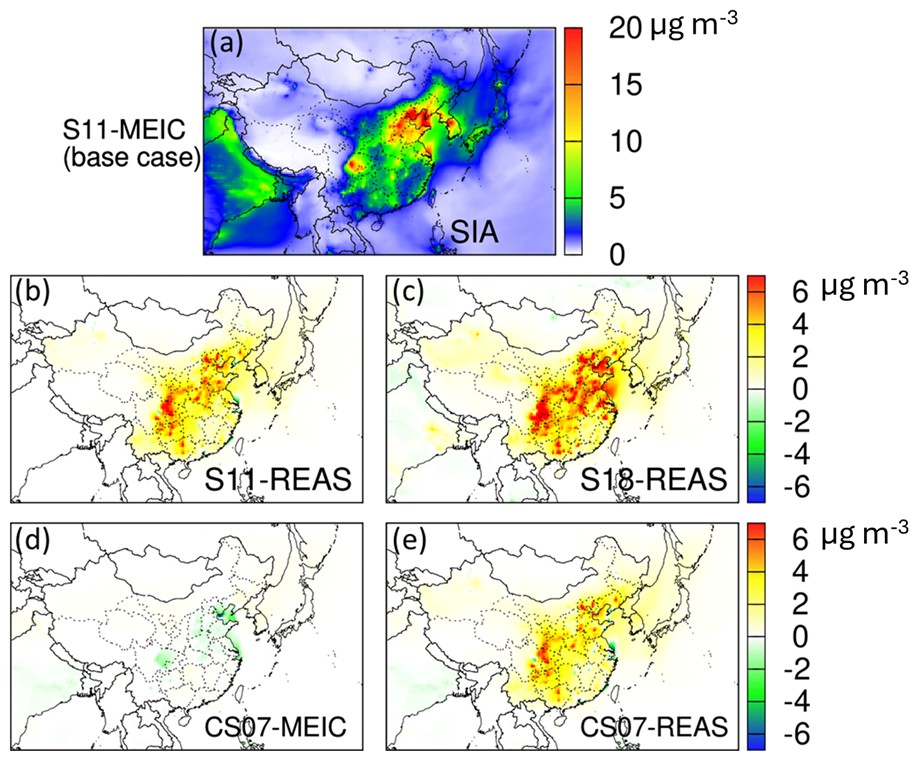
Figure 2Predicted monthly averages of secondary inorganic aerosol (the sum of nitrate, sulfate, and ammonium ion, SIA) concentrations in July 2017 using (a) the S11 mechanism and MEIC emission inventory (base case) and the differences between base case and cases using other photochemical mechanisms and emission inventories (alternative case – base case): (b) S11 and REAS, (c) S18 and REAS, (d) CS07 and MEIC, and (e) CS07 and REAS. Units are µg m−3.
3.3 Impacts of mechanisms and inventories on predicted atmospheric oxidation capacity
Atmospheric oxidation capacity (AOC), which governs the removal rate of primary pollutants and the production of secondary pollutants (Elshorbany et al., 2009; Prinn, 2003), is primarily controlled by the hydroxyl (OH) and nitrate (NO3) radicals in the atmosphere (Geyer et al., 2001; Liu et al., 2022). The spatial differences in OH and NO3 predictions for different mechanisms and inventories are illustrated in Figs. 3–4.
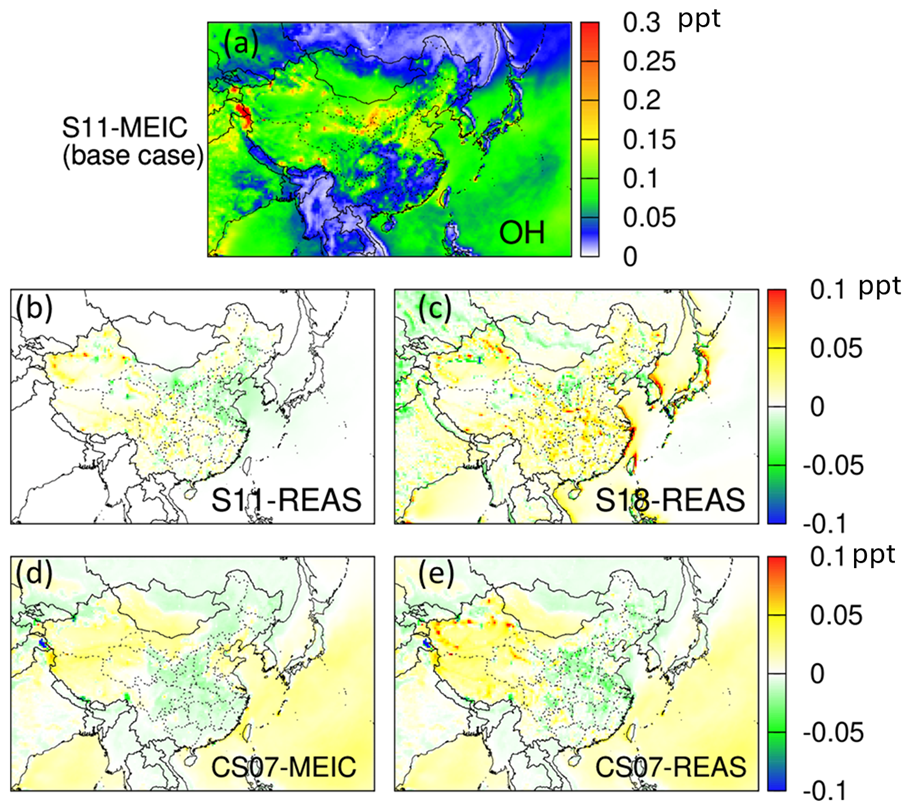
Figure 3Predicted monthly averages of OH radical concentrations in July 2017 using (a) the S11 mechanism and MEIC emission inventory (base case) and the differences between the base case and cases using other photochemical mechanisms and emission inventories (alternative case – base case): (b) S11 and REAS, (c) S18 and REAS, (d) CS07 and MEIC, and (e) CS07 and REAS. Units are ppt (0.1 ppt ∼ 2.46 × 10⁶ molec. cm−3).
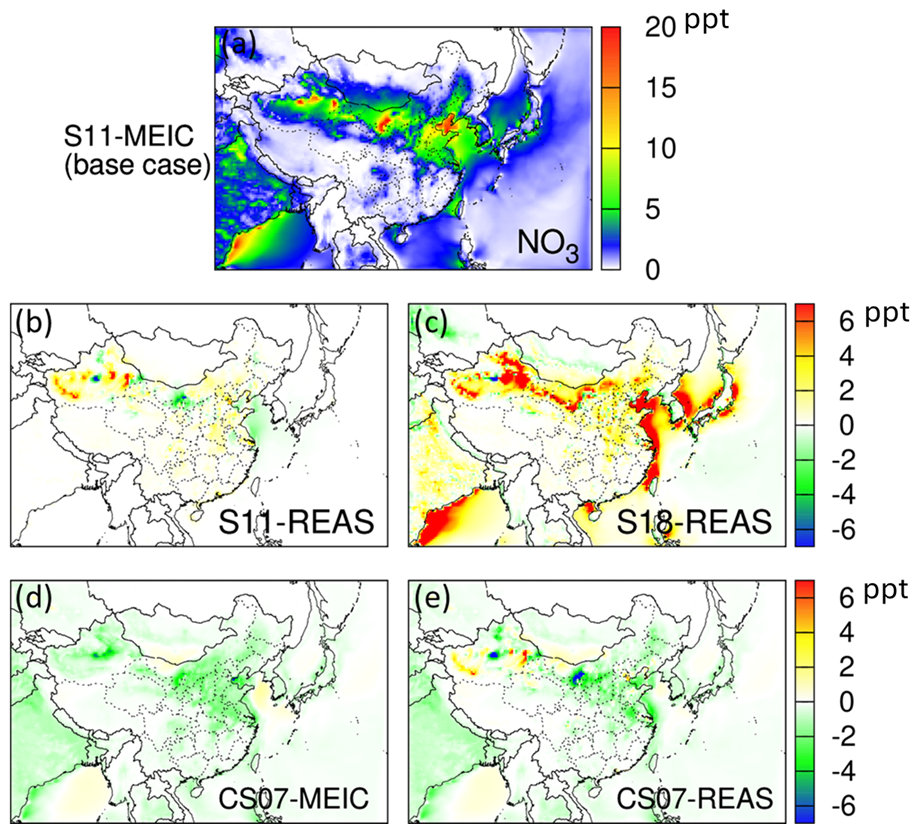
Figure 4Predicted monthly averages of NO3 radical concentrations in July 2017 using (a) the S11 mechanism and MEIC emission inventory (base case) and the differences between the base case and cases using alternative photochemical mechanisms and emission inventories (alternative case – base case): (b) S11 and REAS, (c) S18 and REAS, (d) CS07 and MEIC, and (e) CS07 and REAS. Units are in ppt (0.1 ppt ∼ 2.46 × 10⁶ molec. cm−3).
S11–MEIC predicts high OH concentrations exceeding 3.7 × 10⁶ molec. cm−3 (0.15 ppt) mainly in northern China, including NCP, Inner Mongolia, and some western sites. Compared to S11–MEIC, S11–REAS predicts lower OH concentrations in NCP, Jiangsu, Shanghai, PRD, SCB, and other urban nuclei but higher concentrations in rural areas. In contrast, S18–REAS predicts higher OH concentrations than S11–MEIC in most regions, except in some northern locations. CS07–MEIC produces elevated OH concentrations in northwestern China, Chengdu, Chongqing, Shanghai, Hebei, Shandong, and northern Henan but lower OH levels in other regions. Similar to S11–REAS, CS07–REAS shows much higher OH levels in northwestern China but lower OH levels in eastern regions than S11–MEIC. The variability in OH levels can significantly affect the formation of O3 and other gaseous and particulate pollutants.
The spatial distribution of NO3 concentrations modeled by S11–MEIC exhibits high values in Xinjiang, Inner Mongolia, NCP, and Bohai Bay, with NO3 concentrations reaching up to 20 ppt. Obvious differences in NO3 predictions between S11–REAS and S11–MEIC are primarily observed in Xinjiang and Inner Mongolia, with smaller differences in other regions. S18–REAS generally predicted higher NO3 concentrations than S11–MEIC, especially in Xinjiang, Inner Mongolia, Bohai Bay, Yellow Sea, and Taiwan Strait, by ∼ 6 ppt or more. In contrast, CS07–MEIC consistently predicts lower NO3 levels than S11–MEIC. CS07–REAS predicted lower NO3 concentrations in the eastern regions but higher concentrations in parts of Xinjiang compared to S11–MEIC.
3.4 Impacts of mechanisms and inventories on HCHO prediction
Spatial variations in AOC, as reflected in OH and NO3 predictions from different mechanisms and inventories, imply that photochemical formation and loss rates for air toxics may also vary depending on the mechanism and inventory used. To explore how these variations affect the modeling results for gaseous pollutants, we examined HCHO, one of the most important gaseous air toxics with both primary and secondary sources. It is also a significant contributor to O3 formation and OH production, thus playing a crucial role in tropospheric photochemistry (Wang et al., 2017; Zhang et al., 2013).
Monthly average surface HCHO concentrations from S11–MEIC are similar to the surface observations made in China (Zhang et al., 2021). HCHO concentrations are generally high in the SCB and eastern China, areas with significant biogenic VOC emissions (Kang et al., 2023a), particularly in Chengdu, Shanghai, and Changsha, where HCHO concentrations reach or exceed 7 ppb (Fig. 5). This suggests that a significant fraction of the HCHO is due to secondary formation. HCHO levels predicted by S11–REAS are similar to those predicted by S11–MEIC, with only minor differences of less than 1 ppb. In contrast, S18–REAS predicts significantly lower HCHO levels than S11–MEIC, with differences > 1 ppb, especially in SCB, NCP, PRD, YRD, and central China. CS07–MEIC and CS07–REAS predict higher HCHO levels than S11–MEIC, especially in SCB and eastern China, with differences exceeding 1 ppb. These results indicate that HCHO predictions are more strongly influenced by photochemical mechanisms than by uncertainties in emission inventories, due to its secondary formation.
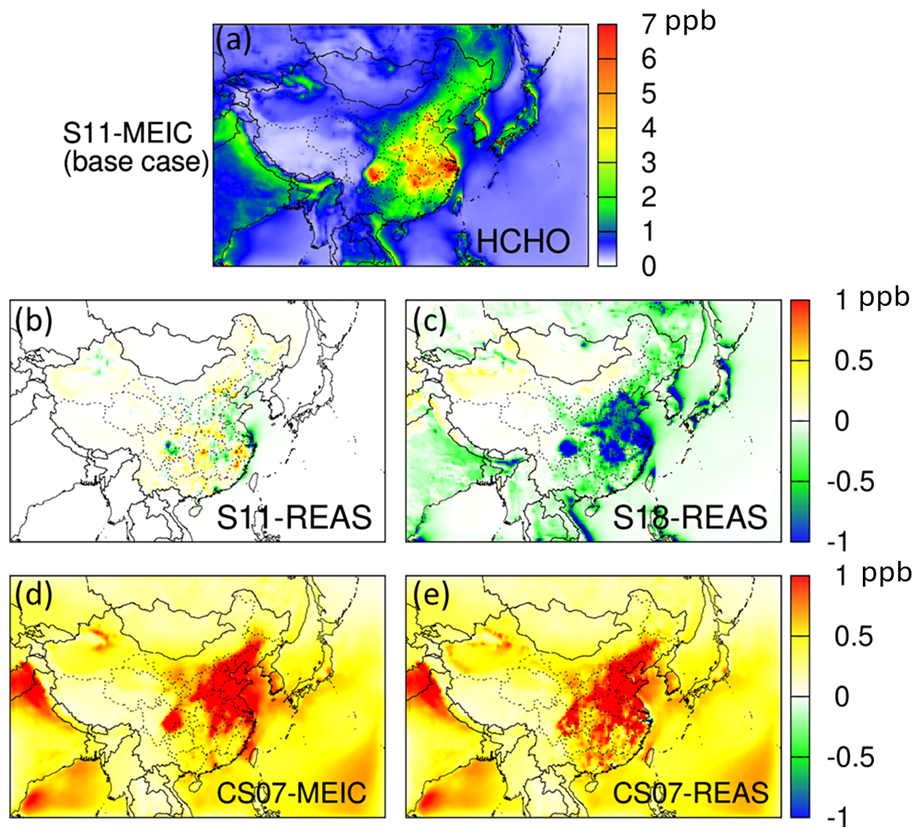
Figure 5Predicted monthly averages of HCHO concentrations in July 2017 using (a) the S11 mechanism and MEIC emission inventory (base case) and the differences between the base case and cases using alternative photochemical mechanisms and emission inventories (alternative case – base case): (b) S11 and REAS, (c) S18 and REAS, (d) CS07 and MEIC, and (e) CS07 and REAS. Units are ppb.
3.5 Impacts of mechanisms and inventories on the sensitivity of O3 and related pollutants to emission controls
Figures 6–10 and S6–S15 display the fractional changes in predictions of O3 and related pollutants due to NOx and VOC reductions using various mechanisms and inventories.
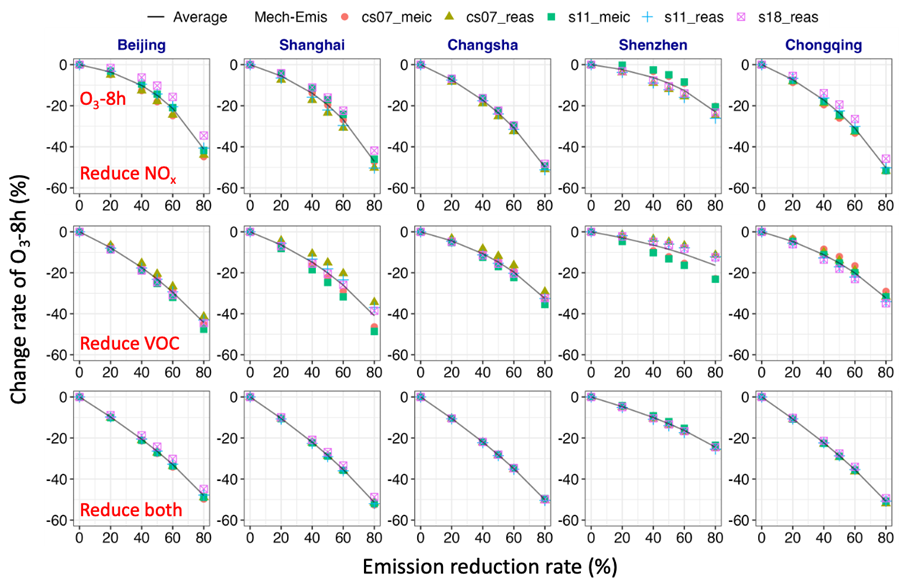
Figure 6Predicted changes of monthly average MDA8 O3 (O3-8 h) concentrations in July 2017 due to reductions of NOx only (first row), VOCs only (second row), and NOx and VOCs (third row) using different photochemical mechanisms and emission inventories. The black line represents the average change across all mechanisms and inventories at different levels of emission reductions.
3.5.1 Impacts of mechanisms and inventories on O3 sensitivity to emission controls
For all mechanisms and inventories, O3-8 h concentrations consistently decrease with reductions in NOx, VOCs, or both in all five cities in July. The efficiency of emission controls improves with increasingly higher emission reductions of NOx and VOCs. These trends are consistent with the findings of Kang et al. (2021), suggesting that the mechanisms and inventories do not affect the trend of change in O3 but do affect the magnitude of the change. These results also show that in July, the sensitivity of O3 formation to NOx and VOCs is in transition or NOx-limited regimes. In Beijing, when NOx emissions are reduced, CS07–MEIC and CS07–REAS show the largest O3-8 h reductions compared to other mechanisms and inventories, while S18–REAS exhibits the smallest changes, especially with larger NOx reductions. In Shanghai, the largest O3-8 h reductions due to NOx controls are observed with CS07–REAS, followed by S11–REAS, while S18–REAS again shows the smallest changes. In Changsha, there are no significant differences among mechanisms and inventories in the sensitivity tests. In Shenzhen, S11–REAS shows the greatest decreases in O3-8 h, followed by CS07–REAS and S18–REAS, while S11–MEIC and CS07–MEIC show the smallest changes. Except for S18–REAS, predictions from other mechanisms and inventories are similar in Chongqing.
When only VOC emissions are reduced in Beijing, S11–MEIC predicts the largest O3-8 h reductions, while CS07–REAS predicts the smallest changes. Similar patterns are found in Shanghai and Changsha, with larger differences among different mechanisms and inventories in Shanghai. In Shenzhen, S11–MEIC also exhibits the largest O3-8 h decreases, followed by CS07–MEIC, while CS07–REAS, S11–REAS, and S18–REAS show smaller changes. In Chongqing, S18–REAS predicts the largest changes and CS07–MEIC the smallest, although the differences among these scenarios are not substantial. When both NOx and VOC emissions are reduced, the predicted change rates of O3-8 h do not vary much across different mechanisms and emission inventories for all five cities. Additionally, the sensitivity tests for Shenzhen, as presented in Fig. 6, suggest that differences in emission inventories may have a greater impact on emission control outcomes than differences in chemical mechanisms. O3 in Shenzhen is lower than other cities included in Fig. 6, and most of the O3 there is background O3 on typical days (Kang et al., 2023b). Thus, it is less responsive to emission reductions than other cities.
Figure S6 illustrates the national-scale relative changes in O3-8 h due to NOx emission reductions evaluated using different mechanisms and inventories. The results are consistent with those shown in Fig. 6, with the greatest O3-8 h reductions occurring in the SCB, Central, and YRD. For all mechanisms and inventories, increasingly higher NOx reductions generally lead to increasingly lower O3 in July, with relative changes in O3-8 h ranging from approximately 5 % to 60 % as NOx reductions increase from 20 % to 80 %. In comparison, the O3-8 h reductions predicted by S18–REAS are less pronounced than other mechanisms and inventories in most areas. Similar to NOx reductions, higher VOC reductions typically result in larger O3 reductions in July, with significant reductions observed in NCP, Chengdu, PRD, Shanghai, and Bohai Bay. The relative changes in O3-8 h increase from 5 % to 40 % as VOC reductions increase from 20 % to 80 % in these areas (Fig. S7). The comparison between Figs. S6 and S7 suggests that NOx reduction tends to be more effective in controlling O3 pollution in non-VOC-limited regions than VOC reduction, given the same level of emission reduction.
3.5.2 Impacts of mechanisms and inventories on SIA sensitivity to emission controls
Reducing NOx emissions typically leads to decreasing SIA levels across the five cities, with the efficiency of reductions improving as NOx reduction increases. As illustrated in Fig. 7, the predicted changes in SIA are quite similar for different mechanisms and inventories. However, VOC controls do not always effectively reduce SIA concentrations, likely attributable to an increase in NO3 radicals, as shown in Fig. 9. In Beijing, changes in SIA in response to VOC reductions vary with mechanisms and inventories. For S11–MEIC and CS07–MEIC, SIA concentration first increases and then decreases with decreasing VOCs. S18–REAS shows a general decrease in SIA concentrations with decreasing VOCs. In contrast, CS07–REAS and S11–REAS predict an increase in SIA concentrations with VOC reductions, with the rate of SIA growth initially increasing and then decreasing as VOC emission decreases. In Shanghai, VOC reductions generally increase SIA concentrations across all mechanisms and inventories, especially for CS07–REAS and S11–REAS, which show that SIA concentrations consistently increase as VOCs are progressively reduced. In Changsha, SIA concentrations also consistently increase with increasing VOC reductions for all mechanisms and inventories. In Shenzhen, SIA concentrations increase with VOC reductions; however, the changes are more pronounced for S11–REAS compared to the less significant variations observed for CS07–MEIC. Except for S18–REAS, Chongqing shows an increase in SIA concentrations with VOC reductions, particularly for CS07–REAS. Overall, simultaneous reductions in NOx and VOCs decrease SIA levels in most cities, similar to the effects of NOx controls alone.
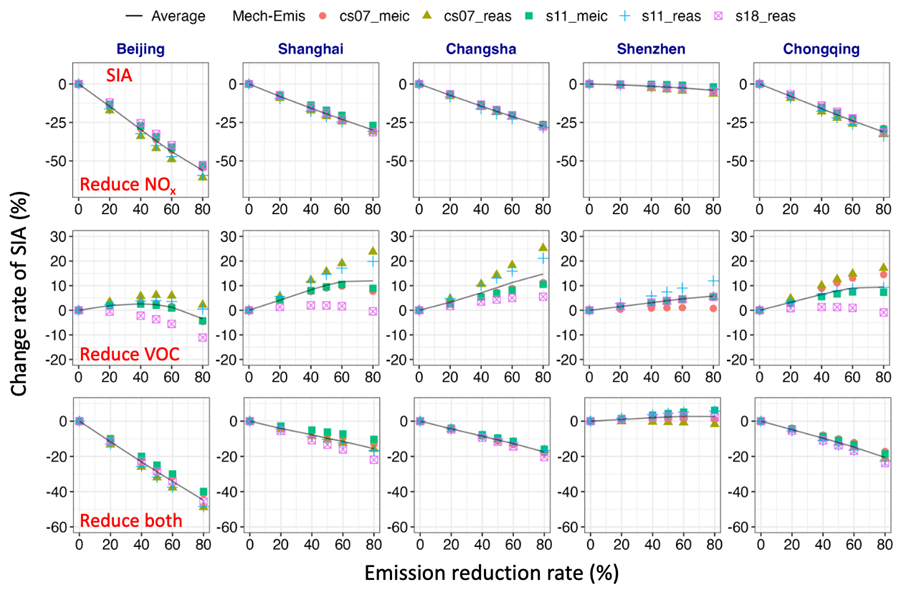
Figure 7Predicted changes of monthly average secondary inorganic aerosol (nitrate, sulfate, and ammonium, SIA) concentrations in July 2017 due to reductions of NOx only (first row), VOCs only (second row), and NOx and VOCs (third row) using different photochemical mechanisms and emission inventories. The black line represents the average change across all mechanisms and inventories at different levels of emission reductions.
Figure S8 shows the relative changes in SIA due to NOx controls on a national scale, using different mechanisms and inventories. The stepwise reductions in NOx emissions lead to an overall decrease in SIA concentrations, with the most pronounced reductions observed in the NCP, SCB, Jiangsu, Bohai Bay, and Yellow Sea. The decreases in SIA increase from ∼ 5 % to 60 % as NOx reduction increases from 20 % to 80 %. On the contrary, VOC reduction causes an overall increase in SIA concentrations (Fig. S9), indicating that VOC controls are less effective than NOx controls in reducing SIA levels in July. Notably, the largest increases in SIA are seen in SCB, Central, and YRD, where SIA increases grow from ∼ 6 % to 30 % as VOC reduction increases from 20 % to 80 %. In comparison, S18–REAS shows relatively smaller changes in SIA, with some areas in NCP showing obvious decreases in SIA concentrations.
3.5.3 Impacts of mechanisms and inventories on OH and NO3 sensitivity
As shown in Fig. 8, the effects of NOx reductions on OH concentrations vary depending on the mechanism and inventory used. In most regions, OH production decreases with reducing NOx emissions, likely due to the decrease in O3 concentrations, as O3 photolysis in the presence of water vapor is a significant source of atmospheric OH (Seinfeld and Pandis, 2016). Except for Shenzhen, CS07–MEIC and CS07–REAS predict the largest decreases in OH due to NOx control in other cities, while S18–REAS predicts the smallest OH change rates. In Shenzhen, OH levels predicted by S11–MEIC and CS07–MEIC initially increase and then decrease as NOx emissions decrease, while those predicted by S18–REAS, CS07–REAS, and S11–REAS exhibit a consistent decrease in OH levels. When only VOCs are reduced, the changes in OH vary across different mechanisms and inventories. In Beijing, except for S18–REAS, OH concentration initially increases and then decreases with decreasing VOC emissions. In Shanghai, OH concentrations from CS07–REAS and S11–REAS basically increase with decreasing VOCs, while those from CS07–MEIC and S11–MEIC show an initial increase followed by a decrease. S18–REAS predicts a general decrease of OH with decreasing VOCs in Beijing and Shanghai. In Changsha, OH concentrations consistently increase with reduced VOCs across all mechanisms and inventories, with CS07–REAS showing a rapid increase of up to 75 %. In Shenzhen, OH levels from CS07–REAS, S11–REAS, and S18–REAS increase with decreasing VOCs, while those from S11–MEIC and CS07–MEIC decrease. In Chongqing, all mechanisms and inventories except S18–REAS predict an increase in OH concentrations with decreasing VOCs, with CS07–MEIC showing a significant increase of up to 75 %. When both NOx and VOC emissions are reduced, OH concentrations generally increase for all mechanisms and inventories, although the relative changes are relatively small (< 25 %).
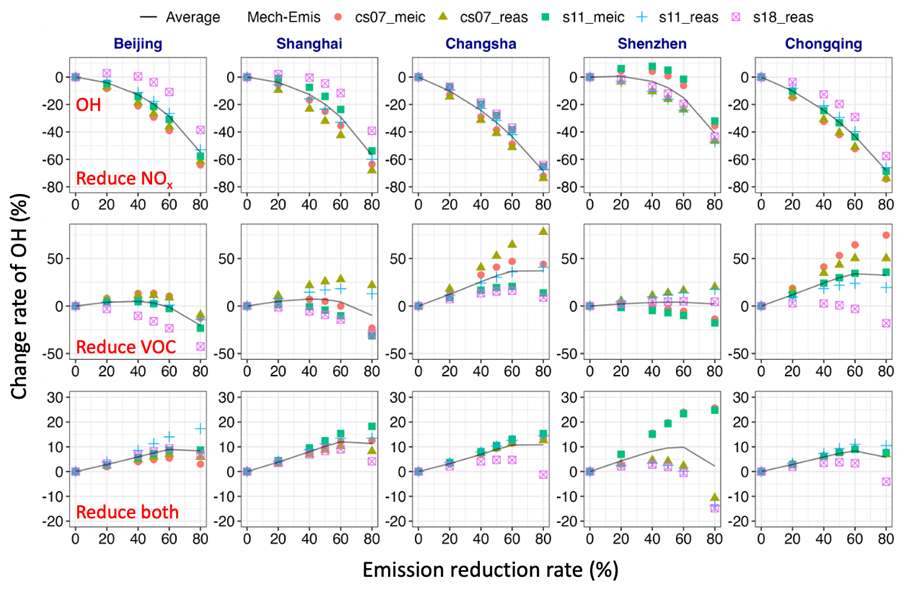
Figure 8Predicted changes of monthly average OH radical concentrations in July 2017 due to reductions of NOx only (first row), VOCs only (second row), and NOx and VOCs (third row) using different photochemical mechanisms and emission inventories. The black line represents the average change across all mechanisms and inventories at different levels of emission reductions.
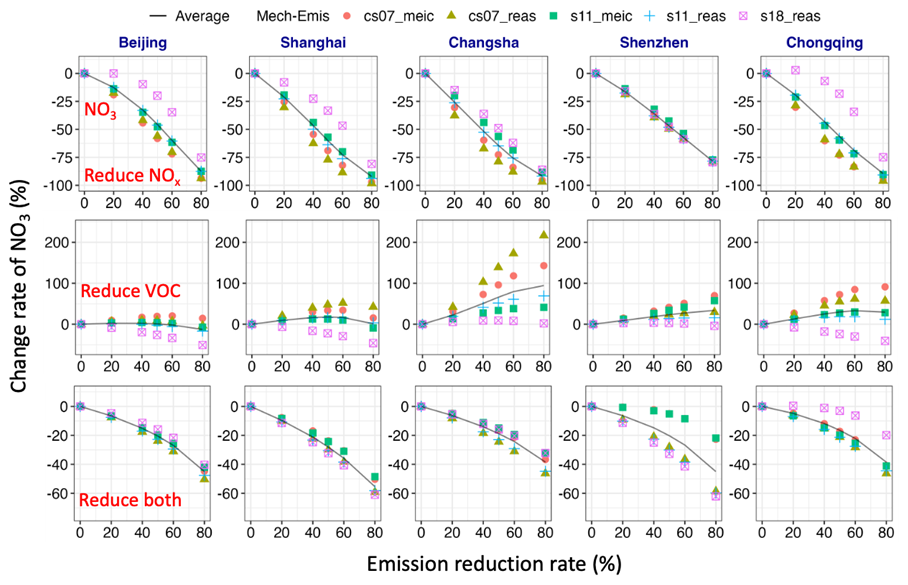
Figure 9Predicted changes of monthly average NO3 radical concentrations in July 2017 due to reductions of NOx only (first row), VOCs only (second row), and NOx and VOCs (third row) using different photochemical mechanisms and emission inventories. The black line represents the average change across all mechanisms and inventories at different levels of emission reductions.
Figures S10–S11 display the spatial distribution of OH changes due to incremental emission controls across different mechanisms and inventories. There is a nationwide decrease in OH concentrations due to NOx reductions, with more pronounced decreases in central and eastern China, where OH levels drop by ∼ 20 % to 80 % as NOx reduction increases from 20 % to 80 %. Instead, VOC reductions generally lead to increased OH concentrations across most of China, significantly in some regions with large vegetation cover (Kang et al., 2023a), such as central and southeastern China. In these areas, OH levels increase by 20 %–200 % in response to stepwise VOC reductions. This increase occurs because high atmospheric VOC concentrations in rural and vegetation-rich areas react with OH radicals to produce RO2 and HO2, depleting OH; thus reducing VOCs in these areas increases OH levels. However, in some urban centers, such as Beijing and Shanghai, changes in OH levels due to VOC controls depend on the extent of reduction and the choice of mechanism and inventory.
Similar to OH, NO3 levels predicted by different mechanisms and inventories basically decrease with decreasing NOx emissions, likely related to the decline of O3 concentrations since NO3 radicals are predominantly formed by the reaction of NO2 with O3 (Geyer et al., 2001). In general, the change rates of NO3 due to NOx reductions are higher for CS07–MEIC and CS07–REAS, while they are lower for S18–REAS. When VOC emissions are reduced, NO3 production increases, except for S18–REAS. In Changsha, a particularly dramatic increase of over 200 % and 150 % is observed for CS07–REAS and CS07–MEIC, respectively, when VOC emissions are cut by 80 %. This increase in NO3 radicals could be attributed to a decline in the rapid reaction of NO3 with unsaturated hydrocarbons. However, for S18–REAS, NO3 concentrations decrease with decreasing VOCs in Beijing, Shanghai, and Chongqing. Unlike OH, simultaneous reductions in NOx and VOCs result in lower NO3 levels across all mechanisms and inventories.
Figures S12–13 illustrate the spatial variation in NO3 changes due to systematic emission reductions for all mechanisms and inventories. NO3 radicals show a decreasing trend, particularly in eastern China, where reductions in NO3 levels vary from 40 % to 100 %. Except for S18–REAS, other mechanisms and inventories generally predict a nationwide increase in NO3 radicals with reduced VOCs, particularly in central and southeastern China, where NO3 levels increase by ∼ 30 %–300 % or even more with increasing VOC reductions. S18–REAS predicts a decrease in NO3 levels with reduced VOCs in some megacities such as Beijing, Shanghai, Chengdu, and Chongqing, while NO3 levels increase elsewhere.
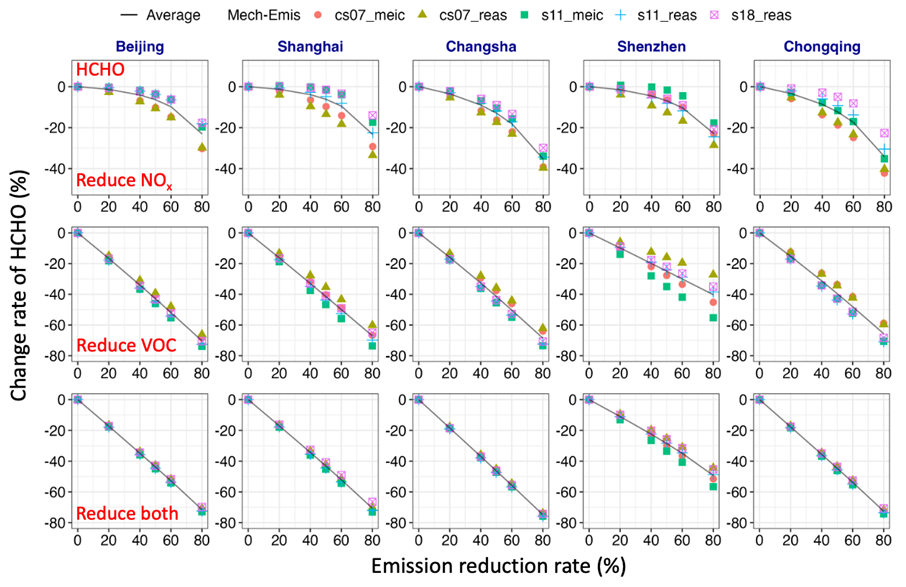
Figure 10Predicted changes of monthly average HCHO concentrations in July 2017 due to reductions of NOx only (first row), VOCs only (second row), and NOx and VOCs (third row) using different photochemical mechanisms and emission inventories. The black line represents the average change across all mechanisms and inventories at different levels of emission reductions.
3.5.4 Impacts of mechanisms and inventories on the sensitivity of secondary gaseous pollutants to emission controls
As shown in Fig. 10, HCHO concentrations decrease with decreasing NOx emissions, likely due to decreased AOC, as evidenced by decreased OH and NO3 levels. This indicates that secondary formation from the oxidation of atmospheric VOCs is the dominant source of HCHO, in accordance with previous studies (Wang et al., 2017; Yang et al., 2019; Zhang et al., 2013). In addition, the most significant decreases in HCHO levels due to NOx reductions are observed for CS07–REAS in all five cities, particularly in Changsha and Chongqing, where HCHO levels drop by about 40 %. When VOCs are reduced alone, HCHO levels decrease linearly across all mechanisms and inventories, a trend similar to the simultaneous reduction of NOx and VOCs. Variations in HCHO changes across different mechanisms and inventories suggest the need to evaluate different mechanisms and inventories when formulating regional emission control policies for carbonyl pollution.
Figures S14–S15 illustrate the spatial distribution of relative changes in HCHO due to NOx and VOC controls using different mechanisms and inventories. VOC and NOx controls lead to reductions in HCHO concentration, especially in eastern China. However, VOC controls generally lead to larger reductions in HCHO concentrations (∼ 10 %–80 %) than NOx controls (∼ 4 %–40 %), as shown in Figs. S14–15 and Fig. 10. This suggests that VOC controls are also essential and more effective for reducing secondary gaseous organic pollutants in the atmosphere.
This study utilized the CMAQ model to evaluate the impacts of different mechanisms and inventories on the prediction of O3 and other air pollutants. It also examined how these mechanisms and inventories affect the sensitivity of O3 and related species to emission reductions. For O3-8 h, relative reductions predicted using different emission inventory and mechanism combinations are consistent for up to 80 % NOx or VOC reductions, with maximum differences of approximately 15 %. For SIA, while the predicted relative changes in their daily average concentrations due to NOx reductions are quite similar, very large differences of up to 30 % occur for VOC reductions. Sometimes even the direction of change (i.e., increase or decrease) is different. For the oxidants OH and NO3 radicals, the uncertainties in the relative changes due to emission changes are even larger among different inventory–mechanism combinations, sometimes by as much as 200 %. Our results suggest that while the O3-8 h responses to emission changes are not sensitive to the choice of chemical mechanism and emission inventories, using a single model and mechanism to evaluate the effectiveness of emission controls on SIA and atmospheric oxidation capacity may have large errors. For these species, the evaluation of the control strategies may require an ensemble approach with multiple inventories and mechanisms.
The dataset for this paper is available upon request from the corresponding author (qying@ust.hk).
The supplement related to this article is available online at https://doi.org/10.5194/acp-25-11453-2025-supplement.
QY designed the study. QY and MJK developed the CMAQ model. MJK conducted the simulations, analyzed the data, and wrote the manuscript. All coauthors contributed to the discussion and revision of the paper.
The contact author has declared that none of the authors has any competing interests.
Publisher’s note: Copernicus Publications remains neutral with regard to jurisdictional claims made in the text, published maps, institutional affiliations, or any other geographical representation in this paper. While Copernicus Publications makes every effort to include appropriate place names, the final responsibility lies with the authors.
This work was partly supported by the National Natural Science Foundation of China (grant no. 42307142).
This paper was edited by Dantong Liu and reviewed by four anonymous referees.
Akimoto, H., Ohara, T., Kurokawa, J., and Horii, N.: Verification of energy consumption in China during 1996–2003 by using satellite observational data, Atmos. Environ., 40, 7663–7667, https://doi.org/10.1016/j.atmosenv.2006.07.052, 2006.
Boylan, J. W. and Russell, A. G.: PM and light extinction model performance metrics, goals, and criteria for three-dimensional air quality models, Atmos. Environ., 40, 4946–4959, https://doi.org/10.1016/j.atmosenv.2005.09.087, 2006.
Bray, C. D., Strum, M., Simon, H., Riddick, L., Kosusko, M., Menetrez, M., Hays, M. D., and Rao, V.: An assessment of important SPECIATE profiles in the EPA emissions modeling platform and current data gaps, Atmos. Environ., 207, 93–104, https://doi.org/10.1016/j.atmosenv.2019.03.013, 2019.
Byun, D. and Schere, K. L.: Review of the Governing Equations, Computational Algorithms, and Other Components of the Models-3 Community Multiscale Air Quality (CMAQ) Modeling System, Appl. Mech. Rev., 59, 51–77, https://doi.org/10.1115/1.2128636, 2006.
Carter, W. P. L.: Development of a condensed SAPRC-07 chemical mechanism, Atmos. Environ., 44, 5336–5345, https://doi.org/10.1016/j.atmosenv.2010.01.024, 2010.
Carter, W. P. L.: Development of a database for chemical mechanism assignments for volatile organic emissions, JAPCA J. Air Waste Ma., 65, 1171–1184, https://doi.org/10.1080/10962247.2015.1013646, 2015.
Carter, W. P. L.: Documentation of the SAPRC-18 mechansim, Report to the California Air Resources Board, https://intra.cert.ucr.edu/~carter/SAPRC/18/ (last access: 16 September 2025), 2020.
Carter, W. P. L. and Heo, G.: Development of revised SAPRC aromatics mechanisms, Atmos. Environ., 77, 404–414, https://doi.org/10.1016/j.atmosenv.2013.05.021, 2013.
Carter, W. P. L., Jiang, J., Orlando, J. J., and Barsanti, K. C.: Derivation of atmospheric reaction mechanisms for volatile organic compounds by the SAPRC mechanism generation system (MechGen), Atmos. Chem. Phys., 25, 199–242, https://doi.org/10.5194/acp-25-199-2025, 2025.
Du, H., Yan, M., Liu, X., Zhong, Y., Ban, J., Lu, K., and Li, T.: Exposure to Concurrent Heatwaves and Ozone Pollution and Associations with Mortality Risk: A Nationwide Study in China, Environ. Health Persp., 132, 047012, https://doi.org/10.1289/EHP13790, 2024.
Elshorbany, Y. F., Kurtenbach, R., Wiesen, P., Lissi, E., Rubio, M., Villena, G., Gramsch, E., Rickard, A. R., Pilling, M. J., and Kleffmann, J.: Oxidation capacity of the city air of Santiago, Chile, Atmos. Chem. Phys., 9, 2257–2273, https://doi.org/10.5194/acp-9-2257-2009, 2009.
Emery, C., Liu, Z., Russell, A. G., Odman, M. T., Yarwood, G., and Kumar, N.: Recommendations on statistics and benchmarks to assess photochemical model performance, JAPCA J. Air Waste Ma., 67, 582–598, https://doi.org/10.1080/10962247.2016.1265027, 2017.
Feng, Z., Xu, Y., Kobayashi, K., Dai, L., Zhang, T., Agathokleous, E., Calatayud, V., Paoletti, E., Mukherjee, A., Agrawal, M., Park, R. J., Oak, Y. J., and Yue, X.: Ozone pollution threatens the production of major staple crops in East Asia, Nat. Food, 3, 47–56, https://doi.org/10.1038/s43016-021-00422-6, 2022.
Finlayson-Pitts, B. J. and Pitts Jr., J. N.: Chemistry of the upper and lower atmosphere: theory, experiments, and applications, Elsevier, ISBN 978-0-12-257060-5, 1999.
Geyer, A., Alicke, B., Konrad, S., Schmitz, T., Stutz, J., and Platt, U.: Chemistry and oxidation capacity of the nitrate radical in the continental boundary layer near Berlin, J. Geophys. Res.-Atmos., 106, 8013–8025, https://doi.org/10.1029/2000JD900681, 2001.
Ghude, S. D., Chate, D. M., Jena, C., Beig, G., Kumar, R., Barth, M. C., Pfister, G. G., Fadnavis, S., and Pithani, P.: Premature mortality in India due to PM2.5 and ozone exposure, Geophys. Res. Lett., 43, 4650–4658, https://doi.org/10.1002/2016GL068949, 2016.
Gilliam, R. C., Hogrefe, C., Godowitch, J. M., Napelenok, S., Mathur, R., and Rao, S. T.: Impact of inherent meteorology uncertainty on air quality model predictions, J. Geophys. Res.-Atmos., 120, 12259–12280, https://doi.org/10.1002/2015JD023674, 2015.
Griffith, S. M., Hansen, R. F., Dusanter, S., Michoud, V., Gilman, J. B., Kuster, W. C., Veres, P. R., Graus, M., de Gouw, J. A., Roberts, J., Young, C., Washenfelder, R., Brown, S. S., Thalman, R., Waxman, E., Volkamer, R., Tsai, C., Stutz, J., Flynn, J. H., Grossberg, N., Lefer, B., Alvarez, S. L., Rappenglueck, B., Mielke, L. H., Osthoff, H. D., and Stevens, P. S.: Measurements of hydroxyl and hydroperoxy radicals during CalNex-LA: Model comparisons and radical budgets, J. Geophys. Res.-Atmos., 121, 4211–4232, https://doi.org/10.1002/2015JD024358, 2016.
Hu, J., Li, X., Huang, L., Ying, Q., Zhang, Q., Zhao, B., Wang, S., and Zhang, H.: Ensemble prediction of air quality using the WRF/CMAQ model system for health effect studies in China, Atmos. Chem. Phys., 17, 13103–13118, https://doi.org/10.5194/acp-17-13103-2017, 2017a.
Hu, J., Huang, L., Chen, M., Liao, H., Zhang, H., Wang, S., Zhang, Q., and Ying, Q.: Premature Mortality Attributable to Particulate Matter in China: Source Contributions and Responses to Reductions, Environ. Sci. Technol., 51, 9950–9959, https://doi.org/10.1021/acs.est.7b03193, 2017b.
Jiang, J., Carter, W. P. L., Cocker, D. R. I., and Barsanti, K. C.: Development and Evaluation of a Detailed Mechanism for Gas-Phase Atmospheric Reactions of Furans, ACS Earth Space Chem., 4, 1254–1268, https://doi.org/10.1021/acsearthspacechem.0c00058, 2020.
Kang, M., Zhang, J., Zhang, H., and Ying, Q.: On the Relevancy of Observed Ozone Increase during COVID-19 Lockdown to Summertime Ozone and PM2.5 Control Policies in China, Environ. Sci. Tech. Let., 8, 289–294, https://doi.org/10.1021/acs.estlett.1c00036, 2021.
Kang, M., Hu, J., Zhang, H., and Ying, Q.: Evaluation of a highly condensed SAPRC chemical mechanism and two emission inventories for ozone source apportionment and emission control strategy assessments in China, Sci. Total Environ., 813, 151922, https://doi.org/10.1016/j.scitotenv.2021.151922, 2022.
Kang, M., Zhang, H., and Ying, Q.: Enhanced summertime background ozone by anthropogenic emissions – Implications on ozone control policy and health risk assessment, Atmos. Environ., 314, 120116, https://doi.org/10.1016/j.atmosenv.2023.120116, 2023a.
Kang, M., Zhang, H., and Ying, Q.: Enhanced summertime background ozone by anthropogenic emissions – Implications on ozone control policy and health risk assessment, Atmos. Environ., 120116, https://doi.org/10.1016/j.atmosenv.2023.120116, 2023b.
Kim, Y., Sartelet, K., and Seigneur, C.: Comparison of two gas-phase chemical kinetic mechanisms of ozone formation over Europe, J. Atmos. Chem., 62, 89–119, https://doi.org/10.1007/s10874-009-9142-5, 2009.
Lei, Y., Zhang, Q., He, K. B., and Streets, D. G.: Primary anthropogenic aerosol emission trends for China, 1990–2005, Atmos. Chem. Phys., 11, 931–954, https://doi.org/10.5194/acp-11-931-2011, 2011.
Li, J., Zhang, H., and Ying, Q.: Comparison of the SAPRC07 and SAPRC99 photochemical mechanisms during a high ozone episode in Texas: Differences in concentrations, OH budget and relative response factors, Atmos. Environ., 54, 25–35, https://doi.org/10.1016/j.atmosenv.2012.02.034, 2012.
Li, K., Jacob, D. J., Liao, H., Shen, L., Zhang, Q., and Bates, K. H.: Anthropogenic drivers of 2013–2017 trends in summer surface ozone in China, P. Natl. Acad. Sci. USA, 116, 422–427, https://doi.org/10.1073/pnas.1812168116, 2019.
Li, K., Zhang, X., Zhao, B., Bloss, W. J., Lin, C., White, S., Yu, H., Chen, L., Geng, C., Yang, W., Azzi, M., George, C., and Bai, Z.: Suppression of anthropogenic secondary organic aerosol formation by isoprene, npj Clim. Atmos. Sci., 5, 1–9, https://doi.org/10.1038/s41612-022-00233-x, 2022a.
Li, M., Zhang, Q., Streets, D. G., He, K. B., Cheng, Y. F., Emmons, L. K., Huo, H., Kang, S. C., Lu, Z., Shao, M., Su, H., Yu, X., and Zhang, Y.: Mapping Asian anthropogenic emissions of non-methane volatile organic compounds to multiple chemical mechanisms, Atmos. Chem. Phys., 14, 5617–5638, https://doi.org/10.5194/acp-14-5617-2014, 2014.
Li, N., He, Q., Greenberg, J., Guenther, A., Li, J., Cao, J., Wang, J., Liao, H., Wang, Q., and Zhang, Q.: Impacts of biogenic and anthropogenic emissions on summertime ozone formation in the Guanzhong Basin, China, Atmos. Chem. Phys., 18, 7489–7507, https://doi.org/10.5194/acp-18-7489-2018, 2018.
Li, Q., Jiang, J., Afreh, I. K., Barsanti, K. C., and Cocker III, D. R.: Secondary organic aerosol formation from camphene oxidation: measurements and modeling, Atmos. Chem. Phys., 22, 3131–3147, https://doi.org/10.5194/acp-22-3131-2022, 2022b.
Liu, T., Hong, Y., Li, M., Xu, L., Chen, J., Bian, Y., Yang, C., Dan, Y., Zhang, Y., Xue, L., Zhao, M., Huang, Z., and Wang, H.: Atmospheric oxidation capacity and ozone pollution mechanism in a coastal city of southeastern China: analysis of a typical photochemical episode by an observation-based model, Atmos. Chem. Phys., 22, 2173–2190, https://doi.org/10.5194/acp-22-2173-2022, 2022.
Lu, X., Hong, J., Zhang, L., Cooper, O. R., Schultz, M. G., Xu, X., Wang, T., Gao, M., Zhao, Y., and Zhang, Y.: Severe surface ozone pollution in China: A global perspective, Environ. Sci. Tech. Let., 5, 487–494, 2018.
Lu, X., Zhang, L., Wang, X., Gao, M., Li, K., Zhang, Y., Yue, X., and Zhang, Y.: Rapid Increases in Warm-Season Surface Ozone and Resulting Health Impact in China Since 2013, Environ. Sci. Tech. Let., 7, 240–247, https://doi.org/10.1021/acs.estlett.0c00171, 2020.
Luhar, A. K., Galbally, I. E., Woodhouse, M. T., and Thatcher, M.: An improved parameterisation of ozone dry deposition to the ocean and its impact in a global climate–chemistry model, Atmos. Chem. Phys., 17, 3749–3767, https://doi.org/10.5194/acp-17-3749-2017, 2017.
Lyu, X., Li, K., Guo, H., Morawska, L., Zhou, B., Zeren, Y., Jiang, F., Chen, C., Goldstein, A. H., Xu, X., Wang, T., Lu, X., Zhu, T., Querol, X., Chatani, S., Latif, M. T., Schuch, D., Sinha, V., Kumar, P., Mullins, B., Seguel, R., Shao, M., Xue, L., Wang, N., Chen, J., Gao, J., Chai, F., Simpson, I., Sinha, B., and Blake, D. R.: A synergistic ozone-climate control to address emerging ozone pollution challenges, One Earth, 6, 964–977, https://doi.org/10.1016/j.oneear.2023.07.004, 2023.
Ma, J. and van Aardenne, J. A.: Impact of different emission inventories on simulated tropospheric ozone over China: a regional chemical transport model evaluation, Atmos. Chem. Phys., 4, 877–887, https://doi.org/10.5194/acp-4-877-2004, 2004.
Placet, M., Mann, C. O., Gilbert, R. O., and Niefer, M. J.: Emissions of ozone precursors from stationary sources:: a critical review, Atmos. Environ., 34, 2183–2204, https://doi.org/10.1016/S1352-2310(99)00464-1, 2000.
Prinn, R. G.: The Cleansing Capacity of the Atmosphere, Annu. Rev. Env. Resour., 28, 29–57, https://doi.org/10.1146/annurev.energy.28.011503.163425, 2003.
Real, E., Megaritis, A., Colette, A., Valastro, G., and Messina, P.: Atlas of ozone chemical regimes in Europe, Atmos. Environ., 320, 120323, https://doi.org/10.1016/j.atmosenv.2023.120323, 2024.
Russell, A.: REGIONAL PHOTOCHEMICAL AIR QUALITY MODELING:Model Formulations, History, and State of the Science, Annu. Rev. Env. Resour., 22, 537–588, https://doi.org/10.1146/annurev.energy.22.1.537, 1997.
Saikawa, E., Kim, H., Zhong, M., Avramov, A., Zhao, Y., Janssens-Maenhout, G., Kurokawa, J.-I., Klimont, Z., Wagner, F., Naik, V., Horowitz, L. W., and Zhang, Q.: Comparison of emissions inventories of anthropogenic air pollutants and greenhouse gases in China, Atmos. Chem. Phys., 17, 6393–6421, https://doi.org/10.5194/acp-17-6393-2017, 2017.
Seinfeld, J. H. and Pandis, S. N.: Atmospheric Chemistry and Physics: From Air Pollution to Climate Change, John Wiley & Sons, 1152 pp., ISBN 978-1-118-94740-1, 2016.
Sha, Q., Zhu, M., Huang, H., Wang, Y., Huang, Z., Zhang, X., Tang, M., Lu, M., Chen, C., Shi, B., Chen, Z., Wu, L., Zhong, Z., Li, C., Xu, Y., Yu, F., Jia, G., Liao, S., Cui, X., Liu, J., and Zheng, J.: A newly integrated dataset of volatile organic compounds (VOCs) source profiles and implications for the future development of VOCs profiles in China, Sci. Total Environ., 793, 148348, https://doi.org/10.1016/j.scitotenv.2021.148348, 2021.
Silva, S. J. and Heald, C. L.: Investigating Dry Deposition of Ozone to Vegetation, J. Geophys. Res.-Atmos., 123, 559–573, https://doi.org/10.1002/2017JD027278, 2018.
Streets, D. G., Bond, T. C., Carmichael, G. R., Fernandes, S. D., Fu, Q., He, D., Klimont, Z., Nelson, S. M., Tsai, N. Y., Wang, M. Q., Woo, J.-H., and Yarber, K. F.: An inventory of gaseous and primary aerosol emissions in Asia in the year 2000, J. Geophys. Res.-Atmos., 108, https://doi.org/10.1029/2002JD003093, 2003.
Venecek, M. A., Cai, C., Kaduwela, A., Avise, J., Carter, W. P. L., and Kleeman, M. J.: Analysis of SAPRC16 chemical mechanism for ambient simulations, Atmos. Environ., 192, 136–150, https://doi.org/10.1016/j.atmosenv.2018.08.039, 2018.
Vermeuel, M. P., Novak, G. A., Alwe, H. D., Hughes, D. D., Kaleel, R., Dickens, A. F., Kenski, D., Czarnetzki, A. C., Stone, E. A., Stanier, C. O., Pierce, R. B., Millet, D. B., and Bertram, T. H.: Sensitivity of Ozone Production to NOx and VOC Along the Lake Michigan Coastline, J. Geophys. Res.-Atmos., 124, 10989–11006, https://doi.org/10.1029/2019JD030842, 2019.
Wang, C., Huang, X.-F., Han, Y., Zhu, B., and He, L.-Y.: Sources and Potential Photochemical Roles of Formaldehyde in an Urban Atmosphere in South China, J. Geophys. Res.-Atmos., 122, 11934–11947, https://doi.org/10.1002/2017JD027266, 2017.
Wang, P., Ying, Q., Zhang, H., Hu, J., Lin, Y., and Mao, H.: Source apportionment of secondary organic aerosol in China using a regional source-oriented chemical transport model and two emission inventories, Environ. Pollut., 237, 756–766, https://doi.org/10.1016/j.envpol.2017.10.122, 2018.
Wen, W., Shen, L., Sheng, L., Ma, X., Wang, J., Guan, C., Deng, G., Li, H., and Zhou, B.: Impact of meteorological uncertainties on PM2.5 forecast: An ensemble air quality forecast study during 2022 Beijing Winter Olympics, Atmos. Environ., 344, 121027, https://doi.org/10.1016/j.atmosenv.2025.121027, 2025.
West, J. J., Fiore, A. M., Horowitz, L. W., and Mauzerall, D. L.: Global health benefits of mitigating ozone pollution with methane emission controls, P. Natl. Acad. Sci. USA, 103, 3988, https://doi.org/10.1073/pnas.0600201103, 2006.
Wiedinmyer, C., Akagi, S. K., Yokelson, R. J., Emmons, L. K., Al-Saadi, J. A., Orlando, J. J., and Soja, A. J.: The Fire INventory from NCAR (FINN): a high resolution global model to estimate the emissions from open burning, Geosci. Model Dev., 4, 625–641, https://doi.org/10.5194/gmd-4-625-2011, 2011.
Wu, R. and Xie, S.: Spatial Distribution of Ozone Formation in China Derived from Emissions of Speciated Volatile Organic Compounds, Environ. Sci. Technol., 51, 2574–2583, https://doi.org/10.1021/acs.est.6b03634, 2017.
Xue, T., Zheng, Y., Geng, G., Xiao, Q., Meng, X., Wang, M., Li, X., Wu, N., Zhang, Q., and Zhu, T.: Estimating Spatiotemporal Variation in Ambient Ozone Exposure during 2013–2017 Using a Data-Fusion Model, Environ. Sci. Technol., 54, 14877–14888, https://doi.org/10.1021/acs.est.0c03098, 2020.
Yamaji, K., Ohara, T., Uno, I., Kurokawa, J., Pochanart, P., and Akimoto, H.: Future prediction of surface ozone over east Asia using models-3 community multiscale air quality modeling system and regional emission inventory in Asia, J. Geophys. Res.-Atmos., 113, D08306, https://doi.org/10.1029/2007JD008663, 2008.
Yang, Z., Cheng, H. R., Wang, Z. W., Peng, J., Zhu, J. X., Lyu, X. P., and Guo, H.: Chemical characteristics of atmospheric carbonyl compounds and source identification of formaldehyde in Wuhan, Central China, Atmos. Res., 228, 95–106, https://doi.org/10.1016/j.atmosres.2019.05.020, 2019.
Yu, S., Mathur, R., Sarwar, G., Kang, D., Tong, D., Pouliot, G., and Pleim, J.: Eta-CMAQ air quality forecasts for O3 and related species using three different photochemical mechanisms (CB4, CB05, SAPRC-99): comparisons with measurements during the 2004 ICARTT study, Atmos. Chem. Phys., 10, 3001–3025, https://doi.org/10.5194/acp-10-3001-2010, 2010.
Zhang, H., Li, J., Ying, Q., Guven, B. B., and Olaguer, E. P.: Source apportionment of formaldehyde during TexAQS 2006 using a source-oriented chemical transport model, J. Geophys. Res.-Atmos., 118, 1525–1535, https://doi.org/10.1002/jgrd.50197, 2013.
Zhang, K., Duan, Y., Huo, J., Huang, L., Wang, Y., Fu, Q., Wang, Y., and Li, L.: Formation mechanism of HCHO pollution in the suburban Yangtze River Delta region, China: A box model study and policy implementations, Atmos. Environ., 267, 118755, https://doi.org/10.1016/j.atmosenv.2021.118755, 2021.