the Creative Commons Attribution 4.0 License.
the Creative Commons Attribution 4.0 License.
 | 25 Sep 2025
Refractive index enhancement by secondary organic aerosol formation in humid southern China challenges model assumptions
Junlin Shen
Li Liu
Fengling Yuan
Biao Luo
Hongqing Qiao
Miaomiao Zhai
Gang Zhao
Hanbing Xu
Tao Deng
Xuejiao Deng
Aerosol–radiation interactions play a crucial role in air pollution and climate change, with scattering being the dominant process. The complex refractive index of organic aerosols is essential for accurately simulating these interactions, with the scattering capability being predominantly determined by the real part of the refractive index (mr). Prevailing models often assume a constant mr for organic aerosols (e.g., 1.53 or 1.45) at different wavelengths or claim that the mr of primary organic aerosols (POAs) is substantially higher than that of secondary organic aerosols (SOAs) (e.g., 1.63 for POA and 1.43 for SOA), largely due to a lack of direct measurements. This study employs direct measurements from the DMA-SP2 system to demonstrate a strong diameter dependence of dry state mr at 1064 nm, closely associated with primary aerosol emissions and secondary aerosol formation. Source apportionment of aerosol size distributions reveals that the mr of SOA is substantially higher than that of POA. Optical closure calculations, based on extensive dry-state observations of aerosol scattering at 525 nm, size distributions, and chemical compositions, confirm that SOA formation can enhance aerosol mr substantially (from lower than 1.45 when POA dominates to higher than 1.55 when SOA dominates). These results challenge existing model assumptions. In addition, further analysis reveals the mr of SOA increases substantially with oxidation level, which is likely associated with multiphase SOA formation. Our analysis recommends mr values at 525 nm of 1.37 for POA and 1.59 for SOA in urban regions with emissions and meteorological conditions similar to those at the observation site in Guangzhou, a city located in humid southern China. These findings underscore that current modeling practices may introduce substantial inaccuracies in estimating the radiative effects of organic aerosols.
- Article
(1557 KB) - Full-text XML
-
Supplement
(1896 KB) - BibTeX
- EndNote


Aerosol–radiation interactions play a crucial role in air pollution and climate change. Atmospheric aerosols scatter and absorb solar radiation, which can alter the thermal structure of the atmosphere and the radiative energy balance of the Earth–atmosphere system, and affect atmospheric visibility. On the one hand, aerosols influence the thermal structure of the surface and atmosphere, affecting the development of the atmospheric boundary layer (Zhong et al., 2019), thereby playing an important role in the evolution of pollution processes and air quality. On the other hand, by scattering and absorbing solar radiation, aerosols can affect the radiative energy balance of the Earth–atmosphere system, impacting both local and global climates. Due to the complexity of atmospheric aerosol components, the direct radiative effect of aerosols (referred to as Aerosol–radiation interactions in the latest IPCC report) is the second-largest source of error in accurately assessing anthropogenic climate forcing (IPCC, AR6, 2023) and is a significant factor limiting accurate prediction of global climate change.
The inability to accurately characterize the complex refractive index of organic aerosols is one of the major sources of error in accurately simulating the direct radiative effects of aerosols (Redemann et al., 2000; Li et al., 2021; Tsigaridis and Kanakidou, 2018). Organic aerosols are a significant component of atmospheric aerosols, on average accounting for about 20 %–60 % of submicron aerosols in most continental regions (Zhang et al., 2007). In some areas, such as tropical rainforest regions, the organic proportion can be as high as 90 % (Kanakidou et al., 2005). Therefore, organic aerosols are one of the main contributors to the direct radiative effects of aerosols and likely a major source of error in accurately assessing these effects (Moise et al., 2015). Compared to inorganic aerosols, the complex chemical composition of organic aerosols poses a core challenge to accurately quantifying their optical properties (Wu et al., 2021). Based on Mie scattering theory, the core parameters affecting aerosol optical properties in a dry state are aerosol size and complex refractive index. In both climate models and atmospheric chemical transport models, the complex refractive index is a fundamental parameter for calculating key optical parameters such as the extinction coefficient, single-scattering albedo, and asymmetry factor (Moise et al., 2015). The real part (mr) of the complex refractive index corresponds mainly to scattering properties, while the imaginary part corresponds mainly to absorption properties. The extinction of solar radiation by aerosols is determined by aerosol scattering and absorption, with scattering being the dominant process (Moise et al., 2015). Accurately characterizing the mr of organic aerosols (mr,OA) is thus crucial for accurately simulating aerosol radiative effects (Li et al., 2021; McMeeking et al., 2005). The review by Tsigaridis and Kanakidou (2018) pointed out that existing models either treat mr,OA as a constant or treat mr for POA and SOA (mr,POA and mr,SOA) as constants. For example, Curci et al. (2019) set mr,POA to 1.63 and mr,SOA to 1.43 in their model.
However, results from the existing literature on laboratory studies demonstrate that mr,OA varies significantly. The advantage of laboratory studies is that they can produce aerosol systems containing only organic components, with a relatively narrow size range, allowing the retrieval of mr,OA based on scattering or extinction measurements. Consequently, laboratory quantitative studies on mr,SOA have been conducted broadly (Moise et al., 2015), while mr,POA is rarely investigated. The results show that the mr,SOA varies mainly in the range of 1.36–1.66, and the variation of mr,SOA is closely related to its precursors and oxidation pathways (Moise et al., 2015; Kim et al., 2014; Lambe et al., 2013; He et al., 2018). For example, the results of He et al. (2018) demonstrate that mr,SOA first increases with the oxidation state parameter O C and then decreases with O C during aging. Li et al. (2023c) further developed a parameterization scheme for mr,SOA based on O C and H C and validated it using laboratory experiment results; however, its applicability to POA and SOA based on field measurements remains lacking. Overall, the difficulty in direct quantification of mr,OA based on field measurements has made the variation characteristics of mr,OA in the atmosphere unclear.
In this study, using field measurements of aerosol refractive index, aerosol size distributions, aerosol scattering properties, and aerosol chemical compositions, the remarkable difference in mr,POA and mr,SOA is revealed. It was found that SOA formation at the observation site substantially enhances mr. These findings provide strong observational evidence that mr,SOA is much higher than mr,POA in many regions, and values for model settings of mr,POA and mr,SOA are recommended based on observations.
2.1 Field measurements
In this study, we utilized datasets from two field campaigns conducted at Haizhu Wetland Park, Guangzhou, China. The first campaign lasted less than two months, from 12 January to 27 February 2022, while the second was a longer-term campaign spanning approximately seven months, from 27 July 2022 to 28 February 2023.
During the first campaign, we observed the particle number size distribution (PNSD) in a dry state, ranging from 13 to 800 nm, using a Scanning Mobility Particle Sizer (SMPS, model 3086 and particle counter 3776 from TSI) with a temporal resolution of 5 min. The mr of BC-free aerosols with diameters of 235, 270, 300, 335, 370, and 400 nm was measured using the DMA-SP2 system (differential mobility analyzer in tandem with the single-particle soot photometer from Droplet Measurement Technologies, Boulder, Colorado; Schwarz et al., 2006). This measurement method for mr was previously proposed by Zhao et al. (2019c). To briefly explain the mr measurement using the DMA-SP2 system, the SP2 channels receive both scattering and incandescent signals from sampled aerosols. For pure scattering aerosols, the peak of the scattering signal is positively correlated with aerosol scattering ability, which is determined by aerosol size and mr for spherical particles. The scattering strength (S) at 1064 nm can be expressed as (Zhao et al., 2019c)
where I0 is the instrument's laser intensity, C is a constant determined by the instrument's response characteristics, σ is the scattering coefficient of aerosols, and PF45° and PF135° are the scattering phase functions at 45 and 135°, respectively. The relationship between the peak of the scattering signal and the scattering strength of pure scattering aerosols has been calibrated using ammonium sulfate (see Sect. S1 of the Supplement). Consequently, the mr at 1064 nm (mr1064) of the SP2 laser for pure scattering aerosols can be retrieved using the particle size from the DMA and the scattering strength from the SP2, following the method demonstrated by Zhao et al. (2019c). The DMA-SP2 technique offers the advantage of providing direct measurements of mr1064. However, it also has certain limitations. For instance, in this study, the mr1064 measurements are constrained to a diameter range of approximately 235 to 400 nm, depending on laser intensity, thereby excluding smaller particles (< 200 nm) and relatively larger submicron particles (> 400 nm). Additionally, some BC-free particles exhibit absorptive properties, such as brown-carbon-containing particles that may absorb at infrared wavelengths (Hoffer et al., 2017). Thus, these particles may absorb laser energy during scattering measurements, causing heating that can lead to the evaporation of semi-volatile or even low-volatility species from the particle phase, potentially biasing the mr1064 measurements. However, this effect is likely very small because this type of brown carbon aerosol likely accounts for a very small portion of BC-free aerosols (Luo et al., 2022). Non-refractory submicron (NR-PM1) aerosol chemical compositions – including ammonium (NH4), nitrate (NO3), sulfate (SO4), chloride (Cl), and organic components – were measured using a Quadrupole Aerosol Chemical Speciation Monitor (Q-ACSM). Aerosol absorptions at multiple wavelengths were measured using the AE33 from MAGEE (Drinovec et al., 2015). Note that a PM2.5 inlet (BGI, SCC 2.354) with a required flow rate of 8 L min−1 was used for aerosol sampling, with a Nafion dryer of 1.8 m length downstream of the impactor, which ensured the sampling RH in instruments was down to around 10 % as recorded by the inlet RH sensor of the Q-ACSM. The flow rates of the Q-ACSM, SMPS, SP2, and AE33 instruments were set to 3, 0.3, 0.1, and 5 L min−1, respectively. The Nafion dryer and all sampling tubes were placed vertically before the instruments to reduce sampling loss. Details about the quality assurance of Q-ACSM measurements during this campaign are provided by Li et al. (2023a).
During the second campaign, direct measurements of mr1064 were not conducted. Instead, dry-state aerosol scattering coefficients of total suspended particles (TSP) at 450, 525, and 635 nm were measured using a nephelometer (Aurora 3000 from Ecotech; Müller et al., 2011) under nearly dry conditions (below 15 % relative humidity). The dry-state (relative humidity below 20 %) PNSD, ranging from 13 to 800 nm, was again measured using the SMPS. Additionally, multi-wavelength aerosol absorption measurements were performed using an AE33 Aethalometer (Drinovec et al., 2015), and the NR-PM1 aerosol chemical compositions were also measured using the Q-ACSM.
2.2 Source analysis methods of organic aerosols and aerosol size distributions
The multilinear engine (ME-2) technique (Canonaco et al., 2013, 2021) was applied to the organic aerosol mass spectra to resolve the sources of organic aerosols. The Multilinear Engine (ME-2) is an upgrade of the widely used positive matrix factorization (PMF) technique and runs on an IGOR-based interface (Canonaco et al., 2013). Different from traditional PMF, ME-2 offers the capability to constrain the spectra variation extent of OA factors with given priori mass spectra (Canonaco et al., 2013; Guo et al., 2020). Four factors were identified across both field campaigns: two primary organic aerosol (POA) factors and two secondary organic aerosol (SOA) factors. The POA factors consisted of hydrocarbon-like organic aerosol (HOA) and cooking-like organic aerosol (COA), while the SOA factors consisted of less oxygenated organic aerosol (LOOA) and more oxygenated organic aerosol (MOOA). The spectral profiles of HOA and COA obtained in Liu et al. (2022) were used in the ME-2 procedure to constrain POA factor variations.
The POA factors exhibited consistent spectral profiles and elemental ratios between the two campaigns. For example, the O C ratios of HOA were 0.16 and 0.17, and the O C ratios of COA were 0.12 and 0.14, respectively. However, the resolved SOA factors differed between the campaigns. The O C ratio of LOOA in the short-term campaign was 0.89, while it was 0.60 in the long-term campaign. Similarly, the O C ratio of MOOA was 0.93 in the short-term campaign and 1.27 in the long-term campaign. These differences do not affect the overall analysis of this study, as the focus is primarily on the distinction between POA and SOA. More details about the source analysis of organic aerosols can be found in the Supplement of Li et al. (2023a) for the short-term campaign and Qiao et al. (2024) for the long-term campaign.
Additionally, following the PMF procedure for the PNSD measurements and the source apportionment method introduced by Cai et al. (2020), five PNSD factors were identified (PMF 2, ver. 4.2, 111 bins for PNSD ranging from 14 to 736 nm as inputs). For details on the determination of the factor numbers and the PNSD factor analysis, please refer to Sect. S2 of the Supplement. In the source apportionment of PNSD factors, ammonium, nitrate, and sulfate measurements were paired as ammonium sulfate (AS) and ammonium nitrate (AN) using the scheme proposed by Gysel et al. (2007), considering the different impacts of AS and AN formation on PNSD. The mass concentrations of refractory black carbon (rBC) during the short-term campaign were integrated from size-resolved rBC measurements obtained using the DMA-SP2 system, as described in Li et al. (2023a). Correlation analysis between mass concentrations of OA factors, rBC, AS, and AN, and resolved PNSD factors was performed to help explore the sources of different PNSD factors.
In addition, the densities of aerosol species used for volume calculations in this study were consistent with those in Kuang et al. (2021): 1.78 g cm−3 for AS and AN, 1.0 g cm−3 for HOA and COA, 1.2 g cm−3 for LOOA, and 1.4 g cm−3 for MOOA. However, 1.0 g cm−3 was chosen for rBC based on previous observational results (Zhang et al., 2016b; Zhao et al., 2020; Zhou et al., 2022). Calculating BC volume for hygroscopicity requires the material density of BC, as described in Kuang et al. (2021). However, for Mie calculations in this study, effective BC density is needed to determine the BC core size, since the presence of air voids (Zhang et al., 2016b; Zhao et al., 2020) within BC particles increases their apparent size compared to calculations based on the material density. The source analysis of resolved PNSD factors through the combination of ACSM measurements was discussed comprehensively in Sect. 3.1 to help explore the observed mr diameter dependence.
2.3 Optical closure and associated mr retrieval
During the second long-term field campaign, dry-state aerosol scattering coefficients of TSP and PNSD (ranging from 13 to 800 nm, generally covering dry-state PM1), as well as BC mass concentrations, were simultaneously measured, making it feasible to perform a closure between the measured and simulated aerosol scattering (σsp, obs vs. σsp, sim). Details about aerosol scattering calculation procedures and simulations using the Mie code of BHCOAT (Bohren and Huffman, 1998; Cheng et al., 2009) can be found in Sect. S4. Five key issues needed to be addressed for this closure: (1) the size range mismatch between aerosol scattering measurements (TSP) and PNSD measurements (dry-state PM1); (2) BC mass size distributions and mixing state, and other BC-related parameters such as density and refractive index; (3) the mr of BC-free aerosols at 525 nm; (4) the imaginary part of BC-free aerosols, which is mostly associated with brown carbon; and (5) corrections for integrating nephelometer measurements to account for truncation errors and light source non-idealities (Müller et al., 2011).
Recent field observations (detailed in Sect. S3 of the Supplement), utilizing a system (Kuang et al., 2024) that coupled different aerosol inlets with an integrating nephelometer, demonstrated that in Guangzhou's urban area, scattering coefficients of dry-state PM1 and TSP ( vs. σsp, TSP) generally agreed well (Fig. S4a, R = 0.99). However, their ratio varies substantially depending on aerosol scattering levels (Fig. S4b). Specifically, the ratio at 525 nm exceeds 1.2 when σsp, TSP is below 50 Mm−1 , reaching approximately 1.5 when σsp, TSP is around 10 Mm−1. This ratio decreases as σsp, TSP increases and stabilizes (near 1.08) when σsp, TSP exceeds 90 Mm−1 . Consequently, for the closure, measured dry-state σsp, TSP was corrected to dry-state using the observed σsp, TSP-dependent relationship shown in Fig. S4b (ratio of 1.08). This ratio may vary across seasons. However, aerosol scattering simulation results based on particle size distribution measurements that cover the supermicron range, conducted during six campaigns across various locations and seasons in the North China Plain, indicate that PM1 on average contributes approximately 90 % to TSP scattering (Fig. 2 of Kuang et al., 2018). This aligns closely with the average ratio of 1.08 determined in this study through direct scattering measurements, suggesting that this ratio likely does not vary substantially.
The BC mass size distributions and mixing state during the first short-term campaign were analyzed systematically in a previous study conducted by Li et al. (2023a). Two key findings emerged: (1) BC mass size distributions for diameters > 100 nm could be represented by a single lognormal mode, with a geometric mean diameter (Dg) of 258 (±16) nm and a geometric standard deviation (σg) of 1.69; (2) nearly half of the BC mass was identified as externally mixed. The mass fraction of externally mixed BC in total BC (Rext) was calculated as 0.56 ± 0.16, and the number fraction (Rcsm) of internally mixed BC (represented by the core–shell model) in total number of internally mixed BC and BC-free particles was 0.13 ± 0.12. These findings indicated that, despite clear evidence of secondary aerosol formation during the first campaign, BC mass size distributions and mixing states varied within a relatively narrow range, primarily influenced by traffic emissions (Li et al., 2023a). Therefore, the parameters Dg = 258 nm, σg = 1.69, Rext = 0.56, and Rcsm = 0.13 were used to distribute the BC mass concentrations measured by the AE33 and account for BC mixing states. In brief, aerosol particles were divided into three types: external BC, internally mixed BC with BC as the core, and BC-free. BC mass was distributed into different diameters using the established lognormal function and further allocated to externally and internally mixed BC-containing particles using parameters Rext and Rcsm. Note that these values regarding BC size distributions and mixing states are not expected to remain constant throughout the campaign. However, sensitivity tests conducted on the basis of observations in the short campaign help boost confidence. Sensitivity test results shown in Fig. S5 show that even if the geometric mean diameter of the BC mass size distribution changes from 180 to 600 nm, a very large variation according to reported distributions in the literature occurs (Zhao et al., 2019b), and the relative changes in scattering calculations remain relatively small (∼ 2 %). Instead, the BC mixing state plays a more critical role. For example, changing the mixing state from completely externally mixed to a fully core-shell internal mixture results in changes of approximately 10 %. However, such a scenario represents an extreme condition. Considering the observation site is located near BC source regions, BC aerosols are likely closer to being externally mixed. Errors associated with the BC mixing state parameter are estimated to be less than 2.5 %. This inference assumes that BC mixing states in this region vary from completely externally mixed to half externally mixed (much larger than observed in the first short campaign). Using an average value in this case would result in uncertainties of less than 2.5 %. Errors associated with the BC mixing state would likely be smaller. In addition, other BC-related parameters might also induce retrieval errors, such as uncertainties associated with BC density, BC mass, and BC refractive index. In particular, the BC mass concentrations derived from AE33 measurements would bear uncertainties associated with variations in mass absorption coefficient (Zhao et al., 2021b). Sensitivity tests about these parameters are also included in Fig. S5. Results of a previous study reveal that the refractive index of BC have almost minimal impact on scattering calculations (Ma et al., 2012a). This is confirmed by the sensitivity test results shown in Fig. S5, with variations in possible reported ranges of BC refractive index inducing variations less than 2 %. Results also show that uncertainties in BC mass concentrations and BC density would only induce small scattering changes (near or less than 1 %).
Note that the sensitivity results shown here are somewhat contrary to the conclusion drawn by Zhao et al. (2019b) that BC mass size distributions should have comparable impacts with BC mixing states on simulations of aerosol scattering. This was further explored in Sect. S5. The results demonstrate that the simulations in Zhao et al. (2019b) assume all aerosols contain BC, which is not the case in the ambient atmosphere; details about this discussion can be found in Sect. S5.
In this region, both primary and secondary aerosols contribute to aerosol absorption (Yuan et al., 2016; Luo et al., 2022), which affects the imaginary refractive index part (mi) of BC-free aerosols. The sensitivity tests about the impacts of mi on scattering calculations were also included in Fig. S5. It shows that varying mi from 10−2 to 10−7 (reported mi for different types of brown carbons; Saleh, 2020) could result in scattering changes of ∼ 5 %. However, even for biomass-burning organic aerosols, which are the most absorbing aerosol type, their mi at 525 nm is on the order of 10−2. The BC-free aerosols during this campaign mostly consist of inorganic and secondary organic aerosols. The overall mi of BC-free aerosols is less than 10−3, estimated using the brown carbon absorption at 520 nm observed during the campaign even when biomass-burning activities prevail (Luo et al., 2022), meaning that scattering deviations induced by errors in assumed mi are less than 1 % when assuming mi of 10−7.
Truncation errors and light source non-idealities were accounted for in the Mie calculations by applying angular light intensity correction functions from Müller et al. (2011). Details of the Mie theory calculations for the optical closure can be found in Sect. S4 of the Supplement. Sensitivity tests (discussed in Sect. 5 of the Supplement) and the above-mentioned discussions make it clear that mr is the most influential parameter affecting the variations in aerosol scattering calculations.
Therefore, the optical closure calculations could be conducted iteratively to retrieve an mr value that aligns simulated aerosol scattering at 525 nm with the measured scattering at the same wavelength (Sect. S4). This retrieved mr at 525 nm, obtained through optical closure, is termed mrc525. The sensitivity test results shown in Fig. S7 demonstrate the accuracy of conversion as one of the most important factors that would influence the accuracy of retrieved mrc525. The accuracy of depends largely on the accuracy of the ratio used for converting measured σsp, TSP to as discussed. A large standard deviation of the ratio (> 10 %) exists for data points of σsp, TSP at 525 nm below 50 Mm−1 (shown in Fig. S4b). For these points, even if correcting the inlet inconsistency with the average curve shown in Fig. S4, large uncertainty would inevitably be introduced to the optical closure. Therefore, mrc525 was only retrieved when σsp, TSP at 525 nm exceeded 50 Mm−1 (∼ 75 % of data points), where the ratio between and σsp, TSP varied with standard deviations less than 5 % (Fig. S4).
3.1 Strong diameter dependence of mr1064 and remarkable difference in mr,POA and mr,SOA revealed by direct mr1064 measurements
During the first campaign, significant variations in the mr1064 were revealed using DMA-SP2 measurements (Fig. S9), with mr1064 values ranging from 1.40 to 1.59 (mean: 1.49 ± 0.03). Figure 1a and b illustrate the diameter-dependent characteristics of the measured mr1064. Aerosols larger than 300 nm generally exhibited higher mr1064 values compared to those smaller than 300 nm, with average mr1064 values at diameters of 253, 270, 300, 335, 370, and 400 nm being 1.46, 1.49, 1.48, 1.51, 1.51, and 1.51, respectively. This is consistent with previous findings indicating a clear diameter dependence, where mr1064 tends to increase with particle diameter (Benko et al., 2009; Zhao et al., 2019a). Using the mr1064 ratio between 400 and 235 nm () as an indicator of mr1064 diameter dependence, we found that this ratio increases with mr1064,400 (Fig. 1b). Specifically, the ratio rose from 1.02 to 1.07 as mr1064,400 increased from 1.46 to 1.58, while mr1064,235 showed only a slight increase from 1.45 to 1.47. This suggests that the chemical processes responsible for the increase in mr1064,400 have minimal influence on the chemical properties of aerosol particles near 235 nm. These findings indicate that variations in mr1064,400 and mr1064,235 are governed by different chemical and emission processes. The aerosol chemical compositions of NR-PM1 presented in Fig. 1b reveal that the condition corresponding to mr1064,400 of 1.56 has an overall higher content of MOOA than that near mr1064,400 of 1.48. This is further confirmed by the probability distribution of MOOA mass fractions in two regions of Fig. 1b shown in Fig. S10. Although the size distribution of secondary aerosols matters, this general result suggests that secondary organic aerosol formation has possibly contributed to the substantial increase in mr1064,400. However, these results reflect bulk compositional changes that may differ considerably from changes in composition fractions at 400 nm. In addition, these findings suggest that the chemical processes responsible for the increase in mr1064,400 have minimal influence on the chemical properties of aerosol particles near 235 nm and that variations in mr1064,235 and mr1064,400 are governed by different chemical and emission processes.
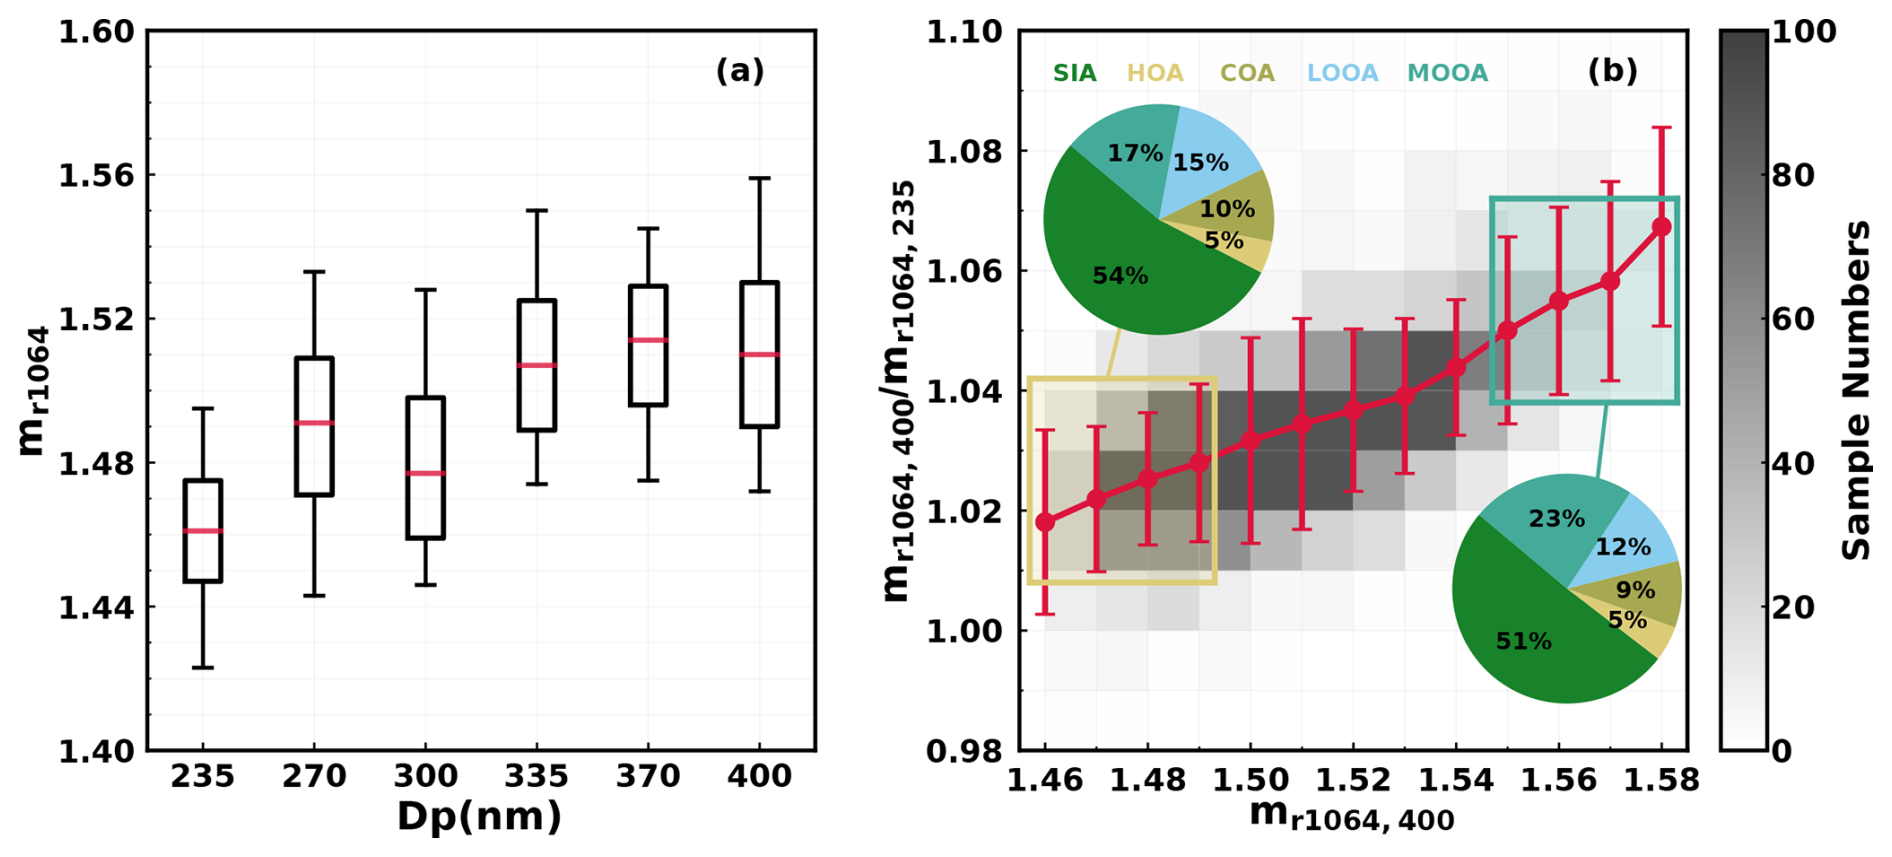
Figure 1(a) The box-and-whisker plot (5th, 25th, 75th, and 95th percentiles) of mr1064 at different diameters; (b) variations of under different mr1064,400 levels, the intensity of colors indicating the number of samples, while red spots and error bars represent average values and standard deviations. Pie charts correspond to average aerosol compositions under different mr1064,400 ranges.
As introduced in the previous section, the PMF source apportionment technique was applied to aerosol chemical composition measurements and aerosol volume size distribution measurements during the first short-term field campaign. The results of these two approaches were combined to resolve the chemical fingerprints of sources at different diameters. The average mass fractions during this campaign are as follows: POA (HOA + COA) at 15.4 %, SOA (LOOA + MOOA) at 34.7 %, ammonium nitrate (AN) at 26.8 %, and ammonium sulfate (AS) at 23.2 %, demonstrating a dominant contribution from secondary sources. Figure 2a illustrates the average volume size distributions of five resolved factors based on PNSD measurements. It shows that aerosols at a diameter of 235 nm are primarily contributed to by factors 1, 3, and 5, with factor 3 being the most significant contributor. In contrast, aerosols at 400 nm are mainly contributed to by factors 1, 2, and 3, with factor 1 as the dominant contributor.
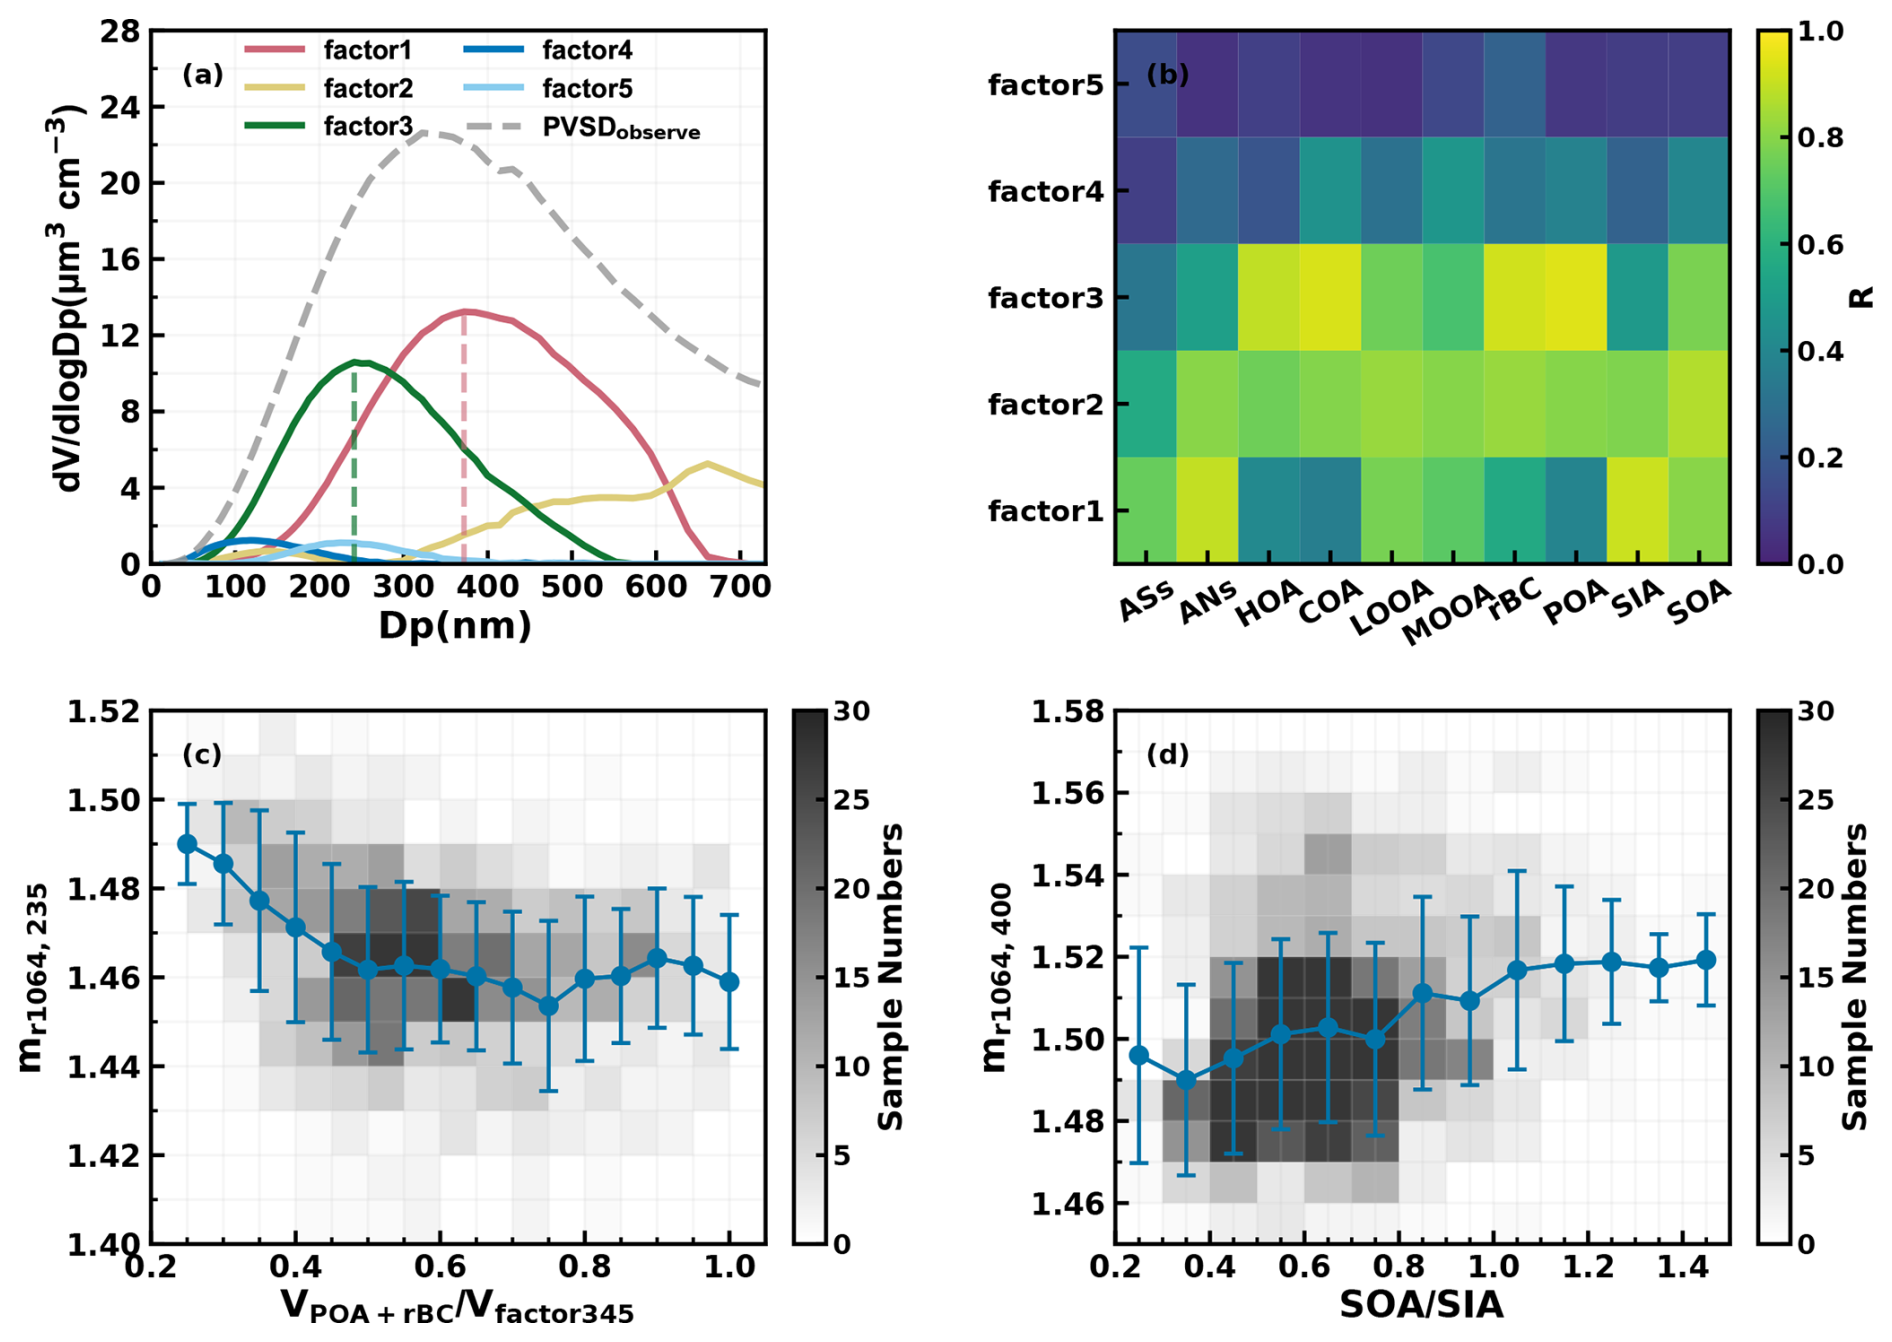
Figure 2(a) The volume size distributions of factors from PNSD PMF analysis; (b) the correlation coefficient between volume concentrations of chemical compositions and resolved PNSD size factors; (c) mr1064,235 varies with changes in the ratio of the volume sum of POA and rBC to the volume sum of factor 3, factor 4, and factor 5 (factor 345); (d) mr1064,400 varies with SOA to SIA when the mass summation of factor1 and factor 2 accounts for over 70 % at 400 nm. The intensity of colors indicates the number of samples, while red spots and error bars represent average values and standard deviations in panels (c) and (d).
Cai et al. (2020) introduced an analytical method linking resolved aerosol size distributions to different sources obtained from mass spectrometer measurements; this method is adopted here. The correlation coefficients for mass concentrations of different aerosol sources and volumes of different factors are shown in Fig. 2b. For factor 1, the volume peak size is around 400 nm, contributing an average of 58 % to the total measured aerosol volume, and shows a strong correlation with secondary inorganic aerosols (SIAs, R = 0.91), as well as a notable correlation with SOA (R = 0.80). Factor 2 contributes an average of 5.61 % to the total volume and exhibits the highest correlation with SOA (R = 0.87). The correlation analysis indicates that factors 1 and 2 are indeed linked to secondary sources, with the correlation coefficient between the volume sums of factors 1 and 2 and the mass concentrations of secondary components (SIA + SOA) reaching as high as 0.95. Taken together, these findings suggest that secondary organic matter and inorganic particulate matter are dominant components in particles larger than 400 nm, consistent with previous observations that larger particles are generally more aged than smaller ones (Sun et al., 2012; Xu et al., 2021).
The volume size distribution of factor 3 ranges from 40 to 500 nm, with a geometric mean diameter of approximately 240 nm, contributing 46 % to the total volume concentration. It shows strong correlations with HOA (R = 0.89), COA (R = 0.93), and rBC (R = 0.92). This finding aligns with previous studies, which indicate that the peak volume size for HOA, COA, and rBC from traffic emissions typically occurs between 200 and 300 nm (Cai et al., 2020; Sun et al., 2012; Xu et al., 2021; Li et al., 2023a). Furthermore, the correlation coefficient between the volume of factor 3 and the total mass concentrations of HOA, COA, and rBC reaches 0.95, suggesting that factor 3 is predominantly associated with primary aerosol emissions. In addition, both factors 4 and 5 exhibit smaller volume size distributions, collectively contributing 12 % to the total volume in the 20 to 500 nm range. Although the volume contributions of factors 4 and 5 are generally minor, as shown in Fig. 2a, their diurnal volume variations (illustrated in Fig. S3) and correlations with primary HOA, COA, and rBC are consistently higher than their correlations with secondary species (Fig. 2b). This suggests that factors 4 and 5 are more likely linked to primary sources.
Moreover, the total volume concentrations of factors 3, 4, and 5 are generally consistent with the total volume derived from the mass concentrations of HOA, COA, and rBC (5.8 vs. 6.1 µm3 cm−3). However, in 53 % of cases, the volume concentrations of factor 3 exceed those derived from the measurements of HOA, COA, and rBC, indicating that factor 3 may sometimes include contributions from other secondary sources, despite primary sources being dominant in most instances. Additionally, as shown in Fig. 2a, while factors 3, 4, and 5 primarily contribute to the mass of aerosols with a diameter of 235 nm, factor 1 also plays a significant role. This suggests that both primary emissions and secondary aerosol formation influence variations in mr1064,235. In contrast, variations in mr1064,400 are predominantly controlled by secondary aerosol sources, with primary emissions playing a much lesser role. The differing sources of aerosols at diameters of 235 and 400 nm, along with the distinct variation characteristics of mr1064,235 and mr1064,400, may provide insights into mr differences between POA and SOA.
Based on the PNSD PMF results, the volume contribution of factor 3 at a diameter of 235 nm ranges from below 1 % to nearly 99 %, with an average of 60 %. In comparison, the volume contribution of factor 1 varied between nearly 0 % and 93 %, averaging around 30 %. Figure 2c illustrates the variations of mr1064,235 as a function of the ratio between the total volume of POA and rBC and the total volume of factors 3, 4, and 5 (referred to as factor 345) under conditions where the volume of factor 345 dominates at 235 nm (volume fraction greater than 75 %). The results indicate that as the contributions of POA and rBC increase within factor 345, mr1064,235 decreases from approximately 1.49 to about 1.46 when their volume fraction exceeds 0.5, subsequently fluctuating within a narrow range (1.46 ± 0.02). This suggests that mr1064,POA is likely substantially lower than 1.46, considering that other secondary species contribute more than 30 % to aerosol volume at 235 nm under these conditions.
Both primary and secondary sources contribute to aerosols of 400 nm; however, volume fractions of factor 1 plus factor 2 at 400 nm varied between nearly 0 % and 99 %, with an average of 61 %, demonstrating that aerosols at 400 nm are composed primarily of SIA and SOA; thus, variations in SOA and SIA mainly control changes in mr1064,400. With regard to the mr values of AS and AN, the mr of AS is consistently reported as 1.53 (Tang, 1996; Stelson, 1990; Lide, 2004), while the reported mr values of AN vary in a relatively large range of 1.41 to 1.56 (Jarzembski et al., 2003; Lide, 2004; Ouimette and Flagan, 1982; Schuster et al., 2005; Zhang et al., 2012). However, known mr values of AS and AN demonstrate that it is likely not the formation of SIA that has led to mr,400 being as high as 1.58 and could most possibly result from SOA formations, and results of previous laboratory (Li et al., 2017) and field studies (Zhao et al., 2021a) suggested that SOA formations might enhance mr to reach beyond 1.6. However, the direct subtraction of mr1064,SOA from current measurements is quite challenging due to the lack of size distribution measurements of aerosol chemical compositions. To give a glimpse into the influences of SOA, the variations of mr1064,400 under different mass ratios of SOA to SIA are shown in Fig. 2d. It shows that on average, mr1064,400 indeed increases as a function of SOA fraction, confirming that the mr1064,SOA is higher than that of SIA. Especially, the mr1064,400 showed obviously higher correlations with MOOA (R = 0.25, p < 0.01) than with LOOA (R = −0.24, p < 0.01) (Fig. S11), demonstrating that the higher mr of MOOA compared with LOOA and the mr of LOOA are likely close to those of SIA basis on the results shown in Fig. S8b. The results of a few existing field measurements support the finding. For example, the results of Aldhaif et al. (2018) suggested that mr,OA was likely positively correlated with the O C. Results of Liu et al. (2022) revealed much stronger scattering abilities of MOOA, which likely cannot be solely explained by the larger size of MOOA. Li et al. (2023b) established a semi-empirical model to predict the mr,OA from O C and H C, which was partly confirmed using their laboratory measurements. On the basis of this model and element ratios of OA factors, mr values for retrieved HOA, COA, LOOA, and MOOA during the first campaign are 1.48, 1.48, 1.45, and 1.63, respectively, which is partly consistent with the field finding of this research that mr,POA has a remarkable difference from mr,SOA, with the mr of MOOA being substantially higher; however, the mr values for HOA and COA might be overestimated by the scheme of Li et al. (2023b).
3.2 Optical closure confirms remarkably higher mr,SOA than mr,POA
The probability distributions of retrieved mrc using the optical closure method presented in Sect. 2.3 are presented in Fig. 3a; mrc525 generally ranges between 1.4 and 1.6, with an average of 1.52. This average mrc525 is close to the value of 1.53 typically used in optical closure studies based on field measurements (Ma et al., 2011; Wexler and Clegg, 2002) and generally consistent with the previously reported mr range in Guangzhou (Zhang et al., 2016a). The retrieved mrc525 is a parameter that represents the bulk mr of ambient aerosols, and therefore contains the influences of both organic and inorganic components. To further reveal possible effects of POA and SOA on mrc525 variations, average mrc525 under different OA mass fractions in NR-PM1 and SOA fractions in OA are presented in Fig. 3b. A general characteristic is revealed that when OA accounts for more than 50 % of NR-PM1, mrc525 tends to be lower as the mass fraction of POA increases, suggesting that increases in POA would generally lower the mrc525. The fact that mrc525 would be even lower than 1.45 when POA dominates suggests that mrc525,POA is likely lower than 1.45, which is consistent with the finding revealed in Sect. 3.1 that mr1064,POA should be lower than 1.46. Results of Liu et al. (2013) revealed a small mr wavelength dependence of organic aerosols at wavelengths higher than 500 nm. The finding about mrc525,POA and mr1064,POA here demonstrates that both optical closure calculations and DMA-SP2 measurements reveal the same results on the value of mr,POA. However, as SOA dominates in OA, the mrc525 is enhanced to more than the average of 1.52, suggesting that the mrc525,SOA is at least higher than 1.52, considering that mr525 of AS and AN is close to or lower than 1.52. These results qualitatively confirm the finding in Sect. 3.1 that mr,SOA is substantially higher than mr,POA.
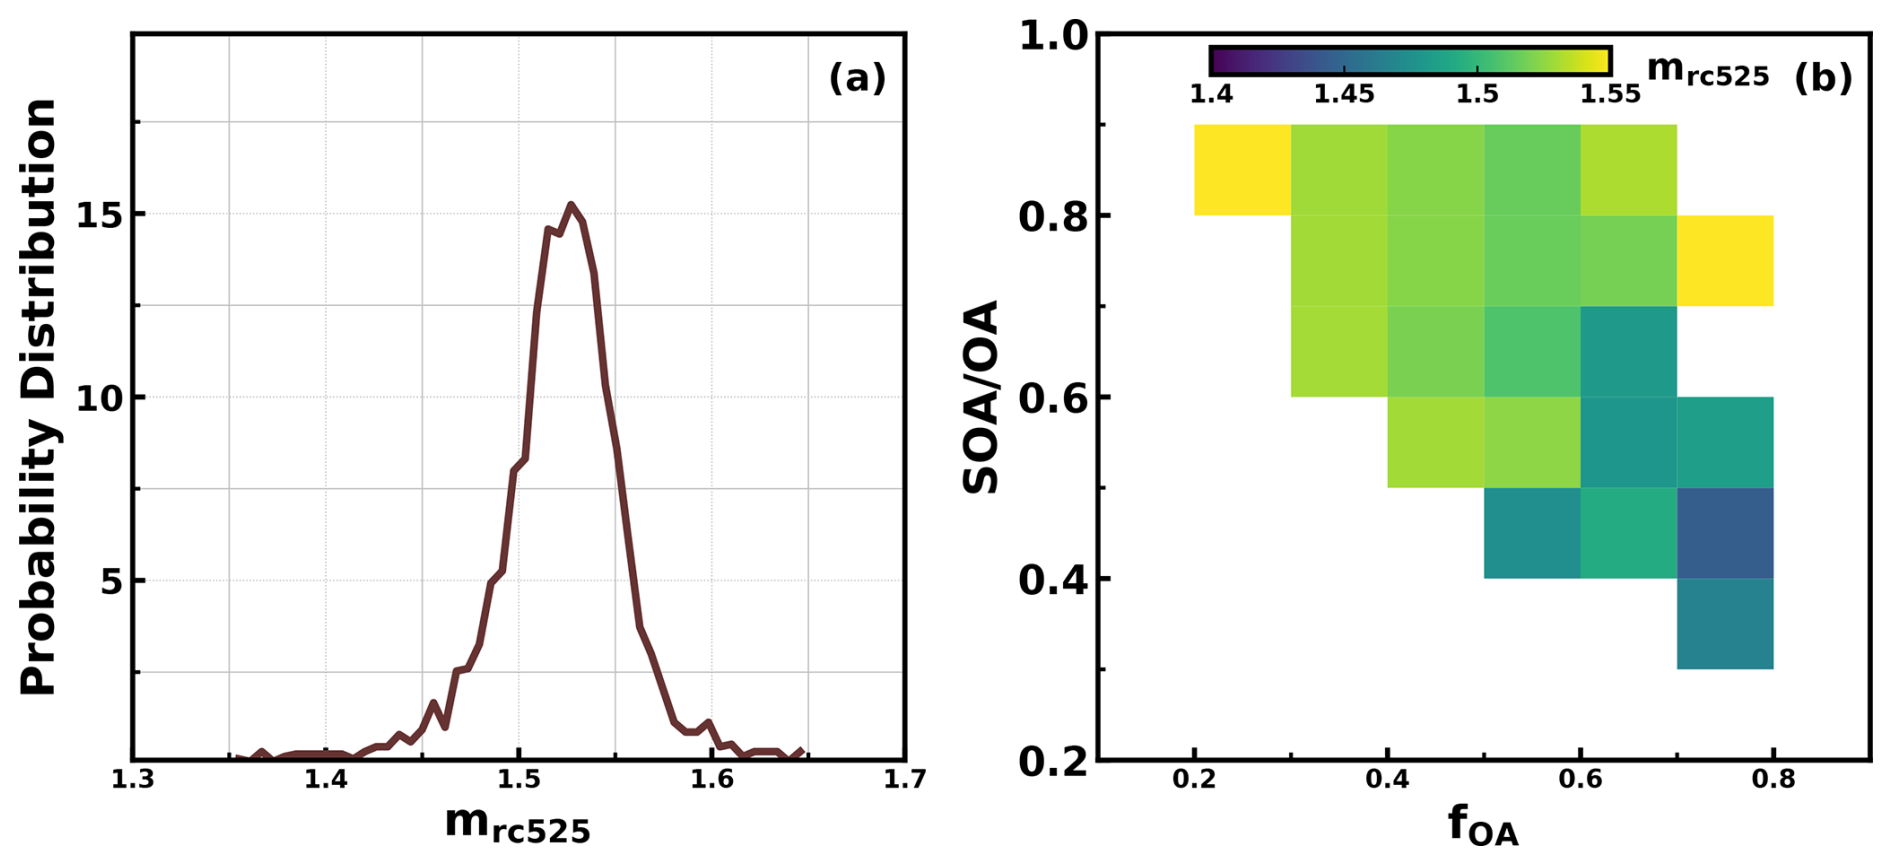
Figure 3(a) Probability distribution of mrc525; (b) variations of mrc525 under different OA mass fractions in NR-PM1 (fOA) and SOA mass fractions in total OA (SOA OA).
The complex compositions of ambient aerosols and complex mixing states and refractive index mixing rules (Liu and Daum, 2008; Zhao et al., 2019a) mean that retrieving mr,SOA and mr,POA on the basis of direct mrc525 measurements and aerosol composition measurements is extremely challenging (Zhao et al., 2022). In fact, mr,SOA and mr,POA are never reported on the basis of field measurements. The volume mixing rule was first applied in this study to all retrieved mrc525 points and corresponding aerosol chemical compositions to tentatively retrieve mrc525,SOA and mrc525,POA. The multilinear regression formula with the volume mixing rule is expressed as , where ε represents the volume fraction of each species in the total measured NR-PM1, εAC represents the volume fraction of ammonium chloride by assuming all measured chloride mass is ammonium chloride. In this formula, the mrc525,AS and mrc525,AC are set to 1.53, and mrc525,AN is set to 1.5 (a middle value reported in the literature) in the retrieval based on the existing literature as listed in Sect. 3.1. As shown in Fig. 4a, if all retrieved mrc525 points were used, mrc525,POA and mrc525,SOA values of 1.45 and 1.54 could be retrieved (using the Python curve_fit function of the module scipy.optimize). However, this rule could not reproduce observed large variations in mrc525. It became clear that the volume mixing rule would oversimplify the interactions in complex mixtures with respect to aerosol refractive index (Liu and Daum, 2008). This was confirmed by a few aerosol refractive index studies (Zhao et al., 2019a).
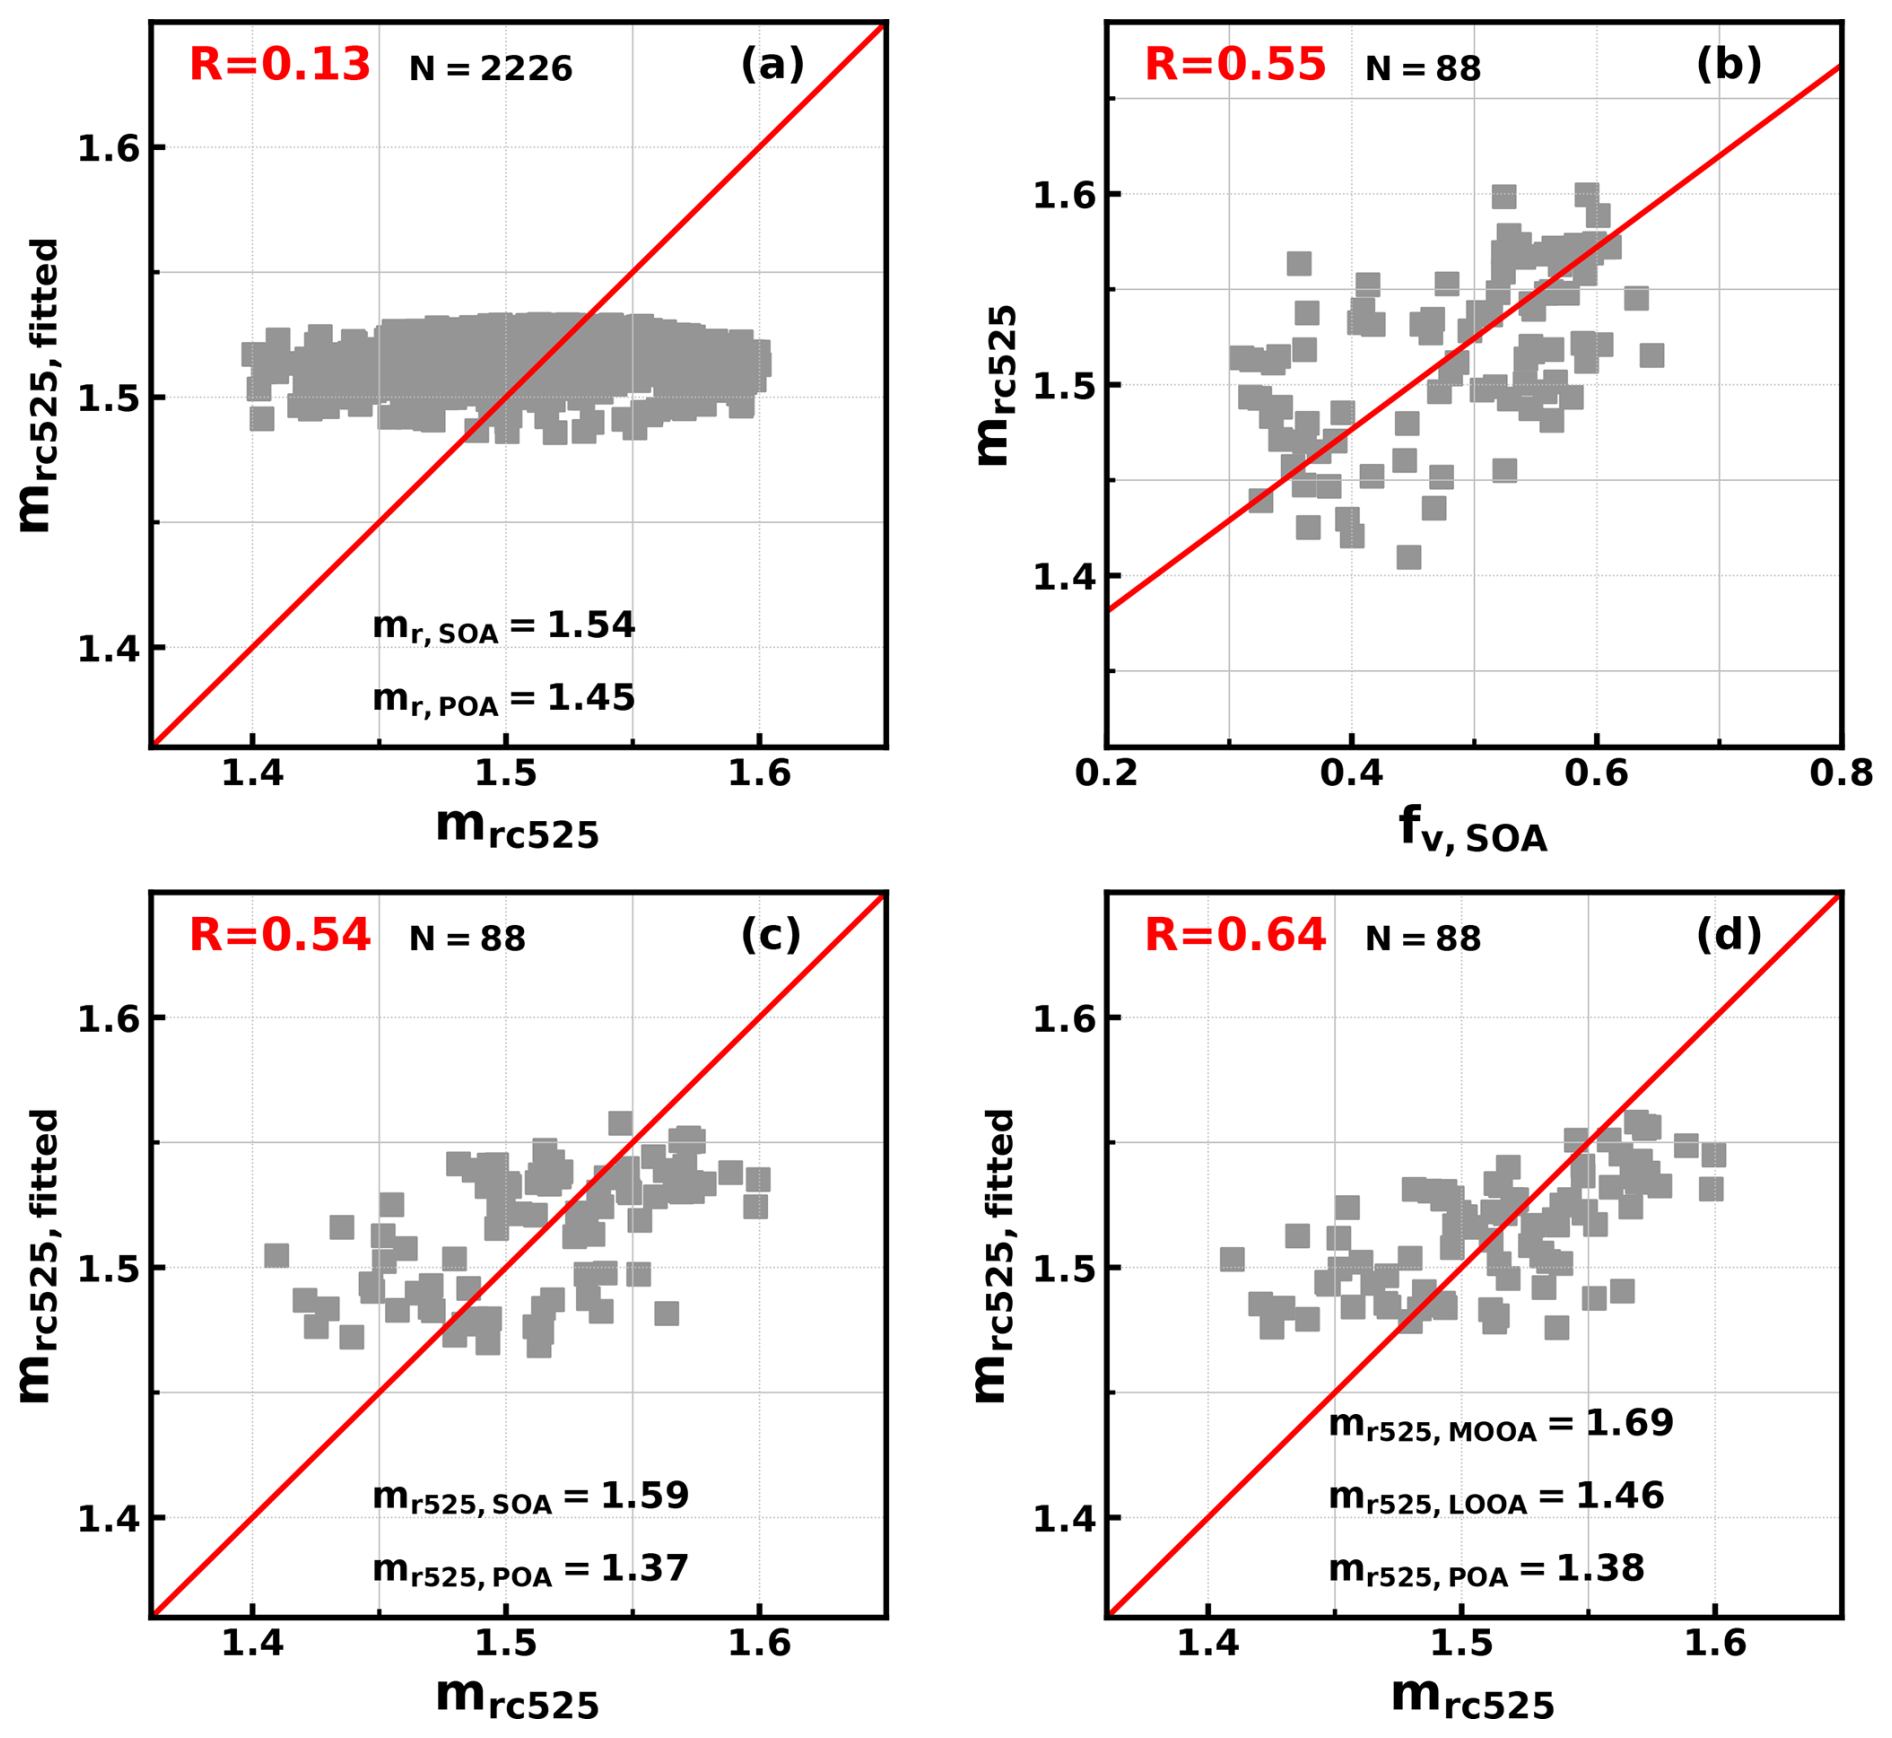
Figure 4(a) Comparison between mrc525 and fitted mr525 using the volume mixing rule, N is the sample number; (b) relationships between mrc525 and volume fractions of SOA in NR-PM1 (fv,SOA) when OA volume fractions in NR-PM1 is higher than 75 %; (c) comparisons between mrc525 and fitted mr525 for points in panel (b) using the volume mixing rule; (d) comparisons between mrc525 and fitted mr525 for points in panel (b) using the volume mixing rule, while LOOA and MOOA are treated separately. Red lines indicate the 1 : 1 reference lines.
If we focus on periods when OA dominates aerosol volume (OA volume in total NR-PM1 accounts for more than 75 %), mrc525 shows an almost linear trend with the volume fractions of SOA in NR-PM1 as shown in Fig. 4b. The question remains as to whether the volume mixing rule can be used to retrieve mrc525 of POA and SOA from these organic aerosol-dominant points. The analysis in Sect. 3.1 demonstrates that the mass concentration of the resolved PNSD factor related to primary sources could mostly be explained by POA and BC, meaning that PNSD of primary sources and secondary sources could be generally separated in the PMF procedure, suggesting that POA and SOA are likely prone to being externally mixed. This could be explained by the fact that the observation site is located near POA source regions in an urban area. This indicates that POA and SOA tend to be optically independent at the single-particle level. The optical test experiment introduced in Sect. S6 demonstrates that the volume mixing rule can generally be used to retrieve mrc525 of POA and SOA if aerosol particles of SOA and POA are externally mixed. In view of this, the volume mixing rule was further applied to scenarios when OA volume dominates (data points in Fig. 4b), meaning that the effects of other chemical components are minimized. The overall mrc525 changes were captured by the fitting, while retrieved values for mrc525,POA and mrc525,SOA are 1.37 ± 0.026 and 1.59 ± 0.017, as shown in Fig. 4c. The relatively small uncertainty ranges for estimated mrc525,POA and mrc525,SOA confirm the quantitative difference between mrc525,POA and mrc525,SOA. For the average PNSD in the retrievals, increasing mrc525 from 1.37 to 1.59 would result in a ∼ 60 % increase in aerosol scattering, which is significant for aerosol radiative forcing estimations (Kuang et al., 2015). Models that assume mr,POA of 1.63 and mr,SOA to 1.43, which is contrary to the finding here, would inevitably result in significant bias in organic aerosol radiative forcing estimations (Curci et al., 2019). Based on the above analysis, mr,SOA and mr,POA of 1.37 and 1.59 might be better choices for model settings in regions that share similar emissions and meteorological conditions with the observation site.
Considering that the O C ratios of LOOA and MOOA differ greatly (0.6 vs. 1.27) during the long-term campaign. If SOA were further treated separately as LOOA and MOOA in the fitting, extending the volume mixing rule formula as , a better correlation coefficient could be achieved, as shown in Fig. 4d. Note that LOOA and MOOA are generally not externally mixed and are likely prone to being internally mixed on the basis of knowledge about the organic aerosol aging chain (Jimenez et al., 2009); therefore the volume mixing rule is likely not applicable, and the retrieved results serve better as qualitatively analysis. Retrieved mrc525,POA of 1.38 ± 0.024 and retrieved mrc525,LOOA and mrc525,MOOA of 1.46 ± 0.069 and 1.69 ± 0.059 are consistent with the speculations in Sect. 3.2 that mr,MOOA is likely substantially higher than mr,LOOA (Fig. S11), although there is significant retrieval bias in mrc525,LOOA and mrc525,MOOA. Retrieved mrc525,LOOA and mrc525,MOOA of 1.46 and 1.69 show a remarkable difference from those (mr,LOOA and mr,MOOA of 1.56 and 1.57) predicted with their O C and H C ratios as inputs to the scheme proposed by Li, et al. (2023b). This result suggests that qualitatively, mr increases with the oxidation degree of SOA. Previous laboratory results demonstrate that mr could increase (Li et al., 2019; He et al., 2022) or decrease (He et al., 2018) with O C depending on aerosol types, precursors, and oxidation conditions. However, as summarized in Moise et al. (2015), most existing laboratory studies conducted in the context of gas-phase reactions reveal that the increase in O C would generally decrease mr at the O C range of LOOA and MOOA in this study (0.6 to 1.27). The finding here is likely associated with the fact that MOOA in the Guangzhou urban area is mainly formed through multiphase reactions (Zhai et al., 2023); thus, it is expected to have a higher mr, as demonstrated by Li et al. (2017).
This study thoroughly leverages field measurements and multiple analytical techniques to constrain the real part of the scattering refractive index of organic aerosols. The results reveal substantially higher values for SOA compared to POA, helping to clarify a long-standing discrepancy in their optical properties. The mr is a fundamental parameter for accurate simulations of aerosol optical properties and their roles in visibility degradation and direct aerosol radiative forcing. In addition, aerosol optical properties are also key for radiative flux simulations, which are fundamental for atmospheric photochemistry (Tao et al., 2014; Tian et al., 2019). Therefore, the results of these studies have significant implications for both environmental and climate issues.
Results of Redemann et al. (2000) demonstrate that a 5 % variation in mr can lead to approximately a 30 % change in the radiative flux at the top of the atmosphere. Li et al. (2021) further demonstrated that for mr,OA changing from 1.3 to 1.65, stratospheric aerosol optical depth relatively changed from −20 % to +50 % and led to ±100 % variability in shortwave radiative forcing, which matters more than the mixing state. While OA is mainly composed of POA and SOA, and they both are major components of atmospheric aerosols, accurate representations of mr,POA and mr,SOA are essential for accurate simulations of direct aerosol radiative effects, whose uncertainties are the second largest contributions to overall climate forcing estimations (IPCC, AR6, 2023). Our long-term field observation results suggest that utilizing constant values for mr,OA in models would lead to either significant underestimations or overestimations in the scattering coefficient and therefore significant deviations in the estimations of direct aerosol radiative effects. The used constant value is another issue; as presented by Tsigaridis and Kanakidou (2018), most models use 1.53 as mr,OA, which is generally appropriate on the basis of this study if mr,OA has to be assumed. Some models, however, even use a constant, for example, 1.45 for both SOA and POA, which might cause systematic underestimation of OA scattering (Aouizerats et al., 2010; Ma et al., 2012b). If OA is further categorized into SOA and POA in models as applied in Curci et al. (2019), the appropriate mr,POA and mr,SOA should be used. Large bias would be expected if mr,POA and mr,SOA are set to 1.63 and 1.43, as in Curci et al. (2019). In addition, in most models, element ratios of organic components are not available, and organic aerosols are generally categorized as several types of POA and SOA, and SOA is generally treated as a whole in these models (Zhang et al., 2023; Pöhlker et al., 2023). Therefore, mr,POA and mr,SOA values of 1.37 and 1.59, respectively, retrieved at 525 nm in this study, are recommended for regions that share similar emissions and meteorological conditions with the observation site.
It should be noteworthy that the POA in this study is primarily composed of fossil combustion from traffic and cooking-related organic aerosols; however, organic aerosols directly emitted from biomass burning (BBOA) and other fossil combustion sources such as coal burning also represent a major POA source. Mathai et al. (2023) reported the mr of homogeneously and inhomogeneously mixed tar balls in the free troposphere from biomass burning as 1.26 and 1.4, which is close to the recommended mr,POA. However, the results of Womack et al. (2021) showed that mr of biomass burning aerosols at 475 nm could be higher than 1.6. The results of Luo et al. (2022) further demonstrated that mr of BBOA might vary a lot and depend highly on combustion conditions. Accurate representations of mr,BBOA are an urgent need, considering the increasing trends of biomass burning events against the background of current global warming. However, the biggest challenge lies in accurate representations of organic aerosols' mr due to mr,SOA variations, because SOA could be formed through varying pathways (condensational growth or multiphase reactions) of different precursor sources of volatile organic compounds (biogenic versus anthropogenic), and existing results already prove that SOA formed from varying precursors and pathways has distinct mr. Therefore, the recommended value of mr,SOA in this study might represent more the mr of SOA that formed from anthropogenic precursors in urban and humid regions. Overall, the results of this study underscore the substantially higher mr,SOA than mr,POA, which is not the case currently assumed in models.
In addition, results of this study imply that mr likely increases with the oxidation level, suggesting crucial impacts of SOA formation mechanisms on mr variations. Future studies should further examine variations and the evolution of mr,SOA than mr,POA under different emission characteristics and chemistry pathways to reduce uncertainties of direct aerosol radiative effects simulations in chemical, weather, and climate models.
All data presented in figures of this paper are freely available at https://doi.org/10.5281/zenodo.15786937 (Kuang, 2025), and more specific raw data will be made available on request due to the data restriction policy.
The supplement related to this article is available online at https://doi.org/10.5194/acp-25-11233-2025-supplement.
YK and LL designed the two field campaigns; YK conceived and led this research. LL, BL, JLS, HX, GZ, FLY, MMZ, FL, and YK performed measurements of aerosol physical and chemical properties. TD and XD supported this campaign. JLS performed the analysis with YK and LL, and JLS and YK wrote the manuscript. All authors contributed to revisions of this paper.
The contact author has declared that none of the authors has any competing interests.
Publisher's note: Copernicus Publications remains neutral with regard to jurisdictional claims made in the text, published maps, institutional affiliations, or any other geographical representation in this paper. While Copernicus Publications makes every effort to include appropriate place names, the final responsibility lies with the authors.
The authors thank the editor for her careful handling of the manuscript and the two anonymous reviewers for their constructive suggestions, which helped improve the quality of this paper.
This research has been supported by the National Natural Science Foundation of China (grant nos. 42175083, 42105092 and 42475139).
This paper was edited by Stefania Gilardoni and reviewed by two anonymous referees.
Aldhaif, A. M., Stahl, C., Braun, R. A., Moghaddam, M. A., Shingler, T., Crosbie, E., Sawamura, P., Dadashazar, H., Ziemba, L., Jimenez, J. L., Campuzano-Jost, P., and Sorooshian, A.: Characterization of the Real Part of Dry Aerosol Refractive Index Over North America From the Surface to 12 km, J. Geophys. Res.-Atmos., 123, 8283–8300, https://doi.org/10.1029/2018JD028504, 2018.
Aouizerats, B., Thouron, O., Tulet, P., Mallet, M., Gomes, L., and Henzing, J. S.: Development of an online radiative module for the computation of aerosol optical properties in 3-D atmospheric models: validation during the EUCAARI campaign, Geosci. Model Dev., 3, 553–564, https://doi.org/10.5194/gmd-3-553-2010, 2010.
Benko, D., Molnár, A., and Imre, K.: Study on the size dependence of complex refractive index of atmospheric aerosol particles over Central Europe, IDOJARAS, 113, 157–175, 2009.
Bohren, C. F. and Huffman, D. R.: Absorption and Scattering by a Sphere, in: Absorption and Scattering of Light by Small Particles, 82–129, ISBN 9780471293408, https://doi.org/10.1002/9783527618156, 1998.
Cai, J., Chu, B., Yao, L., Yan, C., Heikkinen, L. M., Zheng, F., Li, C., Fan, X., Zhang, S., Yang, D., Wang, Y., Kokkonen, T. V., Chan, T., Zhou, Y., Dada, L., Liu, Y., He, H., Paasonen, P., Kujansuu, J. T., Petäjä, T., Mohr, C., Kangasluoma, J., Bianchi, F., Sun, Y., Croteau, P. L., Worsnop, D. R., Kerminen, V.-M., Du, W., Kulmala, M., and Daellenbach, K. R.: Size-segregated particle number and mass concentrations from different emission sources in urban Beijing, Atmos. Chem. Phys., 20, 12721–12740, https://doi.org/10.5194/acp-20-12721-2020, 2020.
Canonaco, F., Crippa, M., Slowik, J. G., Baltensperger, U., and Prévôt, A. S. H.: SoFi, an IGOR-based interface for the efficient use of the generalized multilinear engine (ME-2) for the source apportionment: ME-2 application to aerosol mass spectrometer data, Atmos. Meas. Tech., 6, 3649–3661, https://doi.org/10.5194/amt-6-3649-2013, 2013.
Canonaco, F., Tobler, A., Chen, G., Sosedova, Y., Slowik, J. G., Bozzetti, C., Daellenbach, K. R., El Haddad, I., Crippa, M., Huang, R.-J., Furger, M., Baltensperger, U., and Prévôt, A. S. H.: A new method for long-term source apportionment with time-dependent factor profiles and uncertainty assessment using SoFi Pro: application to 1 year of organic aerosol data, Atmos. Meas. Tech., 14, 923–943, https://doi.org/10.5194/amt-14-923-2021, 2021.
Cheng, Y. F., Berghof, M., Garland, R. M., Wiedensohler, A., Wehner, B., Müller, T., Su, H., Zhang, Y. H., Achtert, P., Nowak, A., Pöschl, U., Zhu, T., Hu, M., and Zeng, L. M.: Influence of soot mixing state on aerosol light absorption and single scattering albedo during air mass aging at a polluted regional site in northeastern China, J. Geophys. Res.-Atmos., 114, https://doi.org/10.1029/2008JD010883, 2009.
Curci, G., Alyuz, U., Barò, R., Bianconi, R., Bieser, J., Christensen, J. H., Colette, A., Farrow, A., Francis, X., Jiménez-Guerrero, P., Im, U., Liu, P., Manders, A., Palacios-Peña, L., Prank, M., Pozzoli, L., Sokhi, R., Solazzo, E., Tuccella, P., Unal, A., Vivanco, M. G., Hogrefe, C., and Galmarini, S.: Modelling black carbon absorption of solar radiation: combining external and internal mixing assumptions, Atmos. Chem. Phys., 19, 181–204, https://doi.org/10.5194/acp-19-181-2019, 2019.
Drinovec, L., Močnik, G., Zotter, P., Prévôt, A. S. H., Ruckstuhl, C., Coz, E., Rupakheti, M., Sciare, J., Müller, T., Wiedensohler, A., and Hansen, A. D. A.: The ”dual-spot” Aethalometer: an improved measurement of aerosol black carbon with real-time loading compensation, Atmos. Meas. Tech., 8, 1965–1979, https://doi.org/10.5194/amt-8-1965-2015, 2015.
Guo, J., Zhou, S., Cai, M., Zhao, J., Song, W., Zhao, W., Hu, W., Sun, Y., He, Y., Yang, C., Xu, X., Zhang, Z., Cheng, P., Fan, Q., Hang, J., Fan, S., Wang, X., and Wang, X.: Characterization of submicron particles by time-of-flight aerosol chemical speciation monitor (ToF-ACSM) during wintertime: aerosol composition, sources, and chemical processes in Guangzhou, China, Atmos. Chem. Phys., 20, 7595–7615, https://doi.org/10.5194/acp-20-7595-2020, 2020.
Gysel, M., Crosier, J., Topping, D. O., Whitehead, J. D., Bower, K. N., Cubison, M. J., Williams, P. I., Flynn, M. J., McFiggans, G. B., and Coe, H.: Closure study between chemical composition and hygroscopic growth of aerosol particles during TORCH2, Atmos. Chem. Phys., 7, 6131–6144, https://doi.org/10.5194/acp-7-6131-2007, 2007.
He, Q., Bluvshtein, N., Segev, L., Meidan, D., Flores, J. M., Brown, S. S., Brune, W., and Rudich, Y.: Evolution of the Complex Refractive Index of Secondary Organic Aerosols during Atmospheric Aging, Environ. Sci. Technol., 52, 3456–3465, https://doi.org/10.1021/acs.est.7b05742, 2018.
He, Q., Li, C., Siemens, K., Morales, A. C., Hettiyadura, A. P. S., Laskin, A., and Rudich, Y.: Optical Properties of Secondary Organic Aerosol Produced by Photooxidation of Naphthalene under NOx Condition, Environ. Sci. Technol., 56, 4816–4827, https://doi.org/10.1021/acs.est.1c07328, 2022.
Hoffer, A., Tóth, Á., Pósfai, M., Chung, C. E., and Gelencsér, A.: Brown carbon absorption in the red and near-infrared spectral region, Atmos. Meas. Tech., 10, 2353–2359, https://doi.org/10.5194/amt-10-2353-2017, 2017.
IPCC, AR6: The Earth's Energy Budget, Climate Feedbacks and Climate Sensitivity, in: Climate Change 2021 – The Physical Science Basis: Working Group I Contribution to the Sixth Assessment Report of the Intergovernmental Panel on Climate Change, edited by: Intergovernmental Panel on Climate Change, Cambridge University Press, Cambridge, 923–1054, ISBN 9781009157889, https://doi.org/10.1017/9781009157896.009, 2023.
Jarzembski, M. A., Norman, M. L., Fuller, K. A., Srivastava, V., and Cutten, D. R.: Complex refractive index of ammonium nitrate in the 2–20-µm spectral range, Appl. Opt., 42, 922–930, https://doi.org/10.1364/AO.42.000922, 2003.
Jimenez, J. L., Canagaratna, M. R., Donahue, N. M., Prevot, A. S. H., Zhang, Q., Kroll, J. H., DeCarlo, P. F., Allan, J. D., Coe, H., Ng, N. L., Aiken, A. C., Docherty, K. S., Ulbrich, I. M., Grieshop, A. P., Robinson, A. L., Duplissy, J., Smith, J. D., Wilson, K. R., Lanz, V. A., Hueglin, C., Sun, Y. L., Tian, J., Laaksonen, A., Raatikainen, T., Rautiainen, J., Vaattovaara, P., Ehn, M., Kulmala, M., Tomlinson, J. M., Collins, D. R., Cubison, M. J., Dunlea, J., Huffman, J. A., Onasch, T. B., Alfarra, M. R., Williams, P. I., Bower, K., Kondo, Y., Schneider, J., Drewnick, F., Borrmann, S., Weimer, S., Demerjian, K., Salcedo, D., Cottrell, L., Griffin, R., Takami, A., Miyoshi, T., Hatakeyama, S., Shimono, A., Sun, J. Y., Zhang, Y. M., Dzepina, K., Kimmel, J. R., Sueper, D., Jayne, J. T., Herndon, S. C., Trimborn, A. M., Williams, L. R., Wood, E. C., Middlebrook, A. M., Kolb, C. E., Baltensperger, U., and Worsnop, D. R.: Evolution of Organic Aerosols in the Atmosphere, Science, 326, 1525–1529, https://doi.org/10.1126/science.1180353, 2009.
Kanakidou, M., Seinfeld, J. H., Pandis, S. N., Barnes, I., Dentener, F. J., Facchini, M. C., Van Dingenen, R., Ervens, B., Nenes, A., Nielsen, C. J., Swietlicki, E., Putaud, J. P., Balkanski, Y., Fuzzi, S., Horth, J., Moortgat, G. K., Winterhalter, R., Myhre, C. E. L., Tsigaridis, K., Vignati, E., Stephanou, E. G., and Wilson, J.: Organic aerosol and global climate modelling: a review, Atmos. Chem. Phys., 5, 1053–1123, https://doi.org/10.5194/acp-5-1053-2005, 2005.
Kim, H., Liu, S., Russell, L. M., and Paulson, S. E.: Dependence of Real Refractive Indices on O : C, H : C and Mass Fragments of Secondary Organic Aerosol Generated from Ozonolysis and Photooxidation of Limonene and α-Pinene, Aerosol Sci. Tech., 48, 498–507, https://doi.org/10.1080/02786826.2014.893278, 2014.
Kuang, Y.: Refractive Index Enhancement by Secondary Organic Aerosol Formation in Humid Southern China Challenges Model Assumptions, Zenodo [data set], https://doi.org/10.5281/zenodo.15786937, 2025.
Kuang, Y., Zhao, C. S., Tao, J. C., and Ma, N.: Diurnal variations of aerosol optical properties in the North China Plain and their influences on the estimates of direct aerosol radiative effect, Atmos. Chem. Phys., 15, 5761–5772, https://doi.org/10.5194/acp-15-5761-2015, 2015.
Kuang, Y., Zhao, C. S., Zhao, G., Tao, J. C., Xu, W., Ma, N., and Bian, Y. X.: A novel method for calculating ambient aerosol liquid water content based on measurements of a humidified nephelometer system, Atmos. Meas. Tech., 11, 2967–2982, https://doi.org/10.5194/amt-11-2967-2018, 2018.
Kuang, Y., Huang, S., Xue, B., Luo, B., Song, Q., Chen, W., Hu, W., Li, W., Zhao, P., Cai, M., Peng, Y., Qi, J., Li, T., Wang, S., Chen, D., Yue, D., Yuan, B., and Shao, M.: Contrasting effects of secondary organic aerosol formations on organic aerosol hygroscopicity, Atmos. Chem. Phys., 21, 10375–10391, https://doi.org/10.5194/acp-21-10375-2021, 2021.
Kuang, Y., Xu, W., Tao, J., Luo, B., Liu, L., Xu, H., Xu, W., Xue, B., Zhai, M., Liu, P., and Sun, Y.: Divergent Impacts of Biomass Burning and Fossil Fuel Combustion Aerosols on Fog-Cloud Microphysics and Chemistry: Novel Insights From Advanced Aerosol-Fog Sampling, Geophys. Res. Lett., 51, e2023GL107147, https://doi.org/10.1029/2023GL107147, 2024.
Lambe, A. T., Cappa, C. D., Massoli, P., Onasch, T. B., Forestieri, S. D., Martin, A. T., Cummings, M. J., Croasdale, D. R., Brune, W. H., Worsnop, D. R., and Davidovits, P.: Relationship between Oxidation Level and Optical Properties of Secondary Organic Aerosol, Environ. Sci. Technol., 47, 6349–6357, https://doi.org/10.1021/es401043j, 2013.
Li, C., He, Q., Schade, J., Passig, J., Zimmermann, R., Meidan, D., Laskin, A., and Rudich, Y.: Dynamic changes in optical and chemical properties of tar ball aerosols by atmospheric photochemical aging, Atmos. Chem. Phys., 19, 139–163, https://doi.org/10.5194/acp-19-139-2019, 2019.
Li, F., Luo, B., Zhai, M., Liu, L., Zhao, G., Xu, H., Deng, T., Deng, X., Tan, H., Kuang, Y., and Zhao, J.: Black carbon content of traffic emissions significantly impacts black carbon mass size distributions and mixing states, Atmos. Chem. Phys., 23, 6545–6558, https://doi.org/10.5194/acp-23-6545-2023, 2023a.
Li, K., Li, J., Liggio, J., Wang, W., Ge, M., Liu, Q., Guo, Y., Tong, S., Li, J., Peng, C., Jing, B., Wang, D., and Fu, P.: Enhanced Light Scattering of Secondary Organic Aerosols by Multiphase Reactions, Environ. Sci. Technol., 51, 1285–1292, https://doi.org/10.1021/acs.est.6b03229, 2017.
Li, Y., Dykema, J., Deshler, T., and Keutsch, F.: Composition Dependence of Stratospheric Aerosol Shortwave Radiative Forcing in Northern Midlatitudes, Geophys. Res. Lett., 48, e2021GL094427, https://doi.org/10.1029/2021GL094427, 2021.
Li, Y., Bai, B., Dykema, J., Shin, N., Lambe, A. T., Chen, Q., Kuwata, M., Ng, N. L., Keutsch, F. N., and Liu, P.: Predicting Real Refractive Index of Organic Aerosols From Elemental Composition, Geophys. Res. Lett., 50, https://doi.org/10.1029/2023gl103446, 2023b.
Li, Y., Bai, B., Dykema, J., Shin, N., Lambe, A. T., Chen, Q., Kuwata, M., Ng, N. L., Keutsch, F. N., and Liu, P.: Predicting Real Refractive Index of Organic Aerosols From Elemental Composition, Geophys. Res. Lett., 50, e2023GL103446, https://doi.org/10.1029/2023GL103446, 2023c.
Lide, D. R.: CRC handbook of chemistry and physics, CRC press, ISBN 9781315380476, https://doi.org/10.1201/9781315380476, 2004.
Liu, L., Kuang, Y., Zhai, M., Xue, B., He, Y., Tao, J., Luo, B., Xu, W., Tao, J., Yin, C., Li, F., Xu, H., Deng, T., Deng, X., Tan, H., and Shao, M.: Strong light scattering of highly oxygenated organic aerosols impacts significantly on visibility degradation, Atmos. Chem. Phys., 22, 7713–7726, https://doi.org/10.5194/acp-22-7713-2022, 2022.
Liu, P., Zhang, Y., and Martin, S. T.: Complex Refractive Indices of Thin Films of Secondary Organic Materials by Spectroscopic Ellipsometry from 220 to 1200 nm, Environ. Sci. Technol., 47, 13594–13601, https://doi.org/10.1021/es403411e, 2013.
Liu, Y. and Daum, P. H.: Relationship of refractive index to mass density and self-consistency of mixing rules for multicomponent mixtures like ambient aerosols, J. Aerosol Sci., 39, 974–986, https://doi.org/10.1016/j.jaerosci.2008.06.006, 2008.
Luo, B., Kuang, Y., Huang, S., Song, Q., Hu, W., Li, W., Peng, Y., Chen, D., Yue, D., Yuan, B., and Shao, M.: Parameterizations of size distribution and refractive index of biomass burning organic aerosol with black carbon content, Atmos. Chem. Phys., 22, 12401–12415, https://doi.org/10.5194/acp-22-12401-2022, 2022.
Ma, N., Zhao, C. S., Nowak, A., Müller, T., Pfeifer, S., Cheng, Y. F., Deng, Z. Z., Liu, P. F., Xu, W. Y., Ran, L., Yan, P., Göbel, T., Hallbauer, E., Mildenberger, K., Henning, S., Yu, J., Chen, L. L., Zhou, X. J., Stratmann, F., and Wiedensohler, A.: Aerosol optical properties in the North China Plain during HaChi campaign: an in-situ optical closure study, Atmos. Chem. Phys., 11, 5959–5973, https://doi.org/10.5194/acp-11-5959-2011, 2011.
Ma, N., Zhao, C. S., Müller, T., Cheng, Y. F., Liu, P. F., Deng, Z. Z., Xu, W. Y., Ran, L., Nekat, B., van Pinxteren, D., Gnauk, T., Müller, K., Herrmann, H., Yan, P., Zhou, X. J., and Wiedensohler, A.: A new method to determine the mixing state of light absorbing carbonaceous using the measured aerosol optical properties and number size distributions, Atmos. Chem. Phys., 12, 2381–2397, https://doi.org/10.5194/acp-12-2381-2012, 2012a.
Ma, X., Yu, F., and Luo, G.: Aerosol direct radiative forcing based on GEOS-Chem-APM and uncertainties, Atmos. Chem. Phys., 12, 5563–5581, https://doi.org/10.5194/acp-12-5563-2012, 2012b.
Mathai, S., Veghte, D., Kovarik, L., Mazzoleni, C., Tseng, K.-P., Bucci, S., Capek, T., Cheng, Z., Marinoni, A., and China, S.: Optical Properties of Individual Tar Balls in the Free Troposphere, Environ. Sci. Technol., 57, 16834–16842, https://doi.org/10.1021/acs.est.3c03498, 2023.
McMeeking, G. R., Kreidenweis, S. M., Carrico, C. M., Collett, J. L., Day, D. E., and Malm, W. C.: Observations of smoke-influenced aerosol during the Yosemite Aerosol Characterization Study: 2. Aerosol scattering and absorbing properties, J. Geophys. Res.-Atmos., 110, https://doi.org/10.1029/2004jd005624, 2005.
Moise, T., Flores, J. M., and Rudich, Y.: Optical Properties of Secondary Organic Aerosols and Their Changes by Chemical Processes, Chem. Rev., 115, 4400–4439, https://doi.org/10.1021/cr5005259, 2015.
Müller, T., Laborde, M., Kassell, G., and Wiedensohler, A.: Design and performance of a three-wavelength LED-based total scatter and backscatter integrating nephelometer, Atmos. Meas. Tech., 4, 1291–1303, https://doi.org/10.5194/amt-4-1291-2011, 2011.
Ouimette, J. R. and Flagan, R. C.: The extinction coefficient of multicomponent aerosols, Atmos. Environ., 16, 2405–2419, https://doi.org/10.1016/0004-6981(82)90131-7, 1982.
Pöhlker, M. L., Pöhlker, C., Quaas, J., Mülmenstädt, J., Pozzer, A., Andreae, M. O., Artaxo, P., Block, K., Coe, H., Ervens, B., Gallimore, P., Gaston, C. J., Gunthe, S. S., Henning, S., Herrmann, H., Krüger, O. O., McFiggans, G., Poulain, L., Raj, S. S., Reyes-Villegas, E., Royer, H. M., Walter, D., Wang, Y., and Pöschl, U.: Global organic and inorganic aerosol hygroscopicity and its effect on radiative forcing, Nat. Commun., 14, 6139, https://doi.org/10.1038/s41467-023-41695-8, 2023.
Qiao, H., Kuang, Y., Yuan, F., Liu, L., Zhai, M., Xu, H., Zou, Y., Deng, T., and Deng, X.: Unlocking the Mystery of Aerosol Phase Transitions Governed by Relative Humidity History Through an Advanced Outdoor Nephelometer System, Geophys. Res. Lett., 51, e2023GL107179, https://doi.org/10.1029/2023GL107179, 2024.
Redemann, J., Turco, R. P., Liou, K. N., Hobbs, P. V., Hartley, W. S., Bergstrom, R. W., Browell, E. V., and Russell, P. B.: Case studies of the vertical structure of the direct shortwave aerosol radiative forcing during TARFOX, J. Geophys. Res.-Atmos., 105, 9971–9979, https://doi.org/10.1029/1999JD901042, 2000.
Saleh, R.: From Measurements to Models: Toward Accurate Representation of Brown Carbon in Climate Calculations, Current Pollution Reports, 6, 90–104, https://doi.org/10.1007/s40726-020-00139-3, 2020.
Schuster, G. L., Dubovik, O., Holben, B. N., and Clothiaux, E. E.: Inferring black carbon content and specific absorption from Aerosol Robotic Network (AERONET) aerosol retrievals, J. Geophys. Res.-Atmos., 110, https://doi.org/10.1029/2004JD004548, 2005.
Schwarz, J. P., Gao, R. S., Fahey, D. W., Thomson, D. S., Watts, L. A., Wilson, J. C., Reeves, J. M., Darbeheshti, M., Baumgardner, D. G., Kok, G. L., Chung, S. H., Schulz, M., Hendricks, J., Lauer, A., Kärcher, B., Slowik, J. G., Rosenlof, K. H., Thompson, T. L., Langford, A. O., Loewenstein, M., and Aikin, K. C.: Single-particle measurements of midlatitude black carbon and light-scattering aerosols from the boundary layer to the lower stratosphere, J. Geophys. Res.-Atmos., 111, D16207, https://doi.org/10.1029/2006JD007076, 2006.
Stelson, A. W.: Urban aerosol refractive index prediction by partial molar refraction approach, Environ. Sci. Technol., 24, 1676–1679, 1990.
Sun, Y. L., Zhang, Q., Schwab, J. J., Yang, T., Ng, N. L., and Demerjian, K. L.: Factor analysis of combined organic and inorganic aerosol mass spectra from high resolution aerosol mass spectrometer measurements, Atmos. Chem. Phys., 12, 8537–8551, https://doi.org/10.5194/acp-12-8537-2012, 2012.
Tang, I. N.: Chemical and size effects of hygroscopic aerosols on light scattering coefficients, J. Geophys. Res.-Atmos., 101, 19245–19250, https://doi.org/10.1029/96JD03003, 1996.
Tao, J. C., Zhao, C. S., Ma, N., and Liu, P. F.: The impact of aerosol hygroscopic growth on the single-scattering albedo and its application on the NO2 photolysis rate coefficient, Atmos. Chem. Phys., 14, 12055–12067, https://doi.org/10.5194/acp-14-12055-2014, 2014.
Tian, R., Ma, X., Jia, H., Yu, F., Sha, T., and Zan, Y.: Aerosol radiative effects on tropospheric photochemistry with GEOS-Chem simulations, Atmos. Environ., 208, 82–94, https://doi.org/10.1016/j.atmosenv.2019.03.032, 2019.
Tsigaridis, K. and Kanakidou, M.: The Present and Future of Secondary Organic Aerosol Direct Forcing on Climate, Current Climate Change Reports, 4, 84–98, https://doi.org/10.1007/s40641-018-0092-3, 2018.
Wexler, A. S. and Clegg, S. L.: Atmospheric aerosol models for systems including the ions H+, NH, Na+, SO, NO, Cl−, Br−, and H2O, J. Geophys. Res.-Atmos., 107, ACH 14-11–ACH 14-14, https://doi.org/10.1029/2001jd000451, 2002.
Womack, C. C., Manfred, K. M., Wagner, N. L., Adler, G., Franchin, A., Lamb, K. D., Middlebrook, A. M., Schwarz, J. P., Brock, C. A., Brown, S. S., and Washenfelder, R. A.: Complex refractive indices in the ultraviolet and visible spectral region for highly absorbing non-spherical biomass burning aerosol, Atmos. Chem. Phys., 21, 7235–7252, https://doi.org/10.5194/acp-21-7235-2021, 2021.
Wu, Y., Li, J., Xia, Y., Deng, Z., Tao, J., Tian, P., Gao, Z., Xia, X., and Zhang, R.: Size-resolved refractive index of scattering aerosols in urban Beijing: A seasonal comparison, Aerosol Sci. Tech., 55, 1070–1083, https://doi.org/10.1080/02786826.2021.1924357, 2021.
Xu, W., Chen, C., Qiu, Y., Xie, C., Chen, Y., Ma, N., Xu, W., Fu, P., Wang, Z., Pan, X., Zhu, J., Ng, N. L., and Sun, Y.: Size-resolved characterization of organic aerosol in the North China Plain: new insights from high resolution spectral analysis, Environ. Sci. Atmos., 1, 346–358, https://doi.org/10.1039/d1ea00025j, 2021.
Yuan, J.-F., Huang, X.-F., Cao, L.-M., Cui, J., Zhu, Q., Huang, C.-N., Lan, Z.-J., and He, L.-Y.: Light absorption of brown carbon aerosol in the PRD region of China, Atmos. Chem. Phys., 16, 1433–1443, https://doi.org/10.5194/acp-16-1433-2016, 2016.
Zhai, M., Kuang, Y., Liu, L., He, Y., Luo, B., Xu, W., Tao, J., Zou, Y., Li, F., Yin, C., Li, C., Xu, H., and Deng, X.: Insights into characteristics and formation mechanisms of secondary organic aerosols in the Guangzhou urban area, Atmos. Chem. Phys., 23, 5119–5133, https://doi.org/10.5194/acp-23-5119-2023, 2023.
Zhang, G., Bi, X., Qiu, N., Han, B., Lin, Q., Peng, L., Chen, D., Wang, X., Peng, P., Sheng, G., and Zhou, Z.: The real part of the refractive indices and effective densities for chemically segregated ambient aerosols in Guangzhou measured by a single-particle aerosol mass spectrometer, Atmos. Chem. Phys., 16, 2631–2640, https://doi.org/10.5194/acp-16-2631-2016, 2016a.
Zhang, H., Shen, Z., Wei, X., Zhang, M., and Li, Z.: Comparison of optical properties of nitrate and sulfate aerosol and the direct radiative forcing due to nitrate in China, Atmos. Res., 113, 113–125, https://doi.org/10.1016/j.atmosres.2012.04.020, 2012.
Zhang, Q., Jimenez, J. L., Canagaratna, M. R., Allan, J. D., Coe, H., Ulbrich, I., Alfarra, M. R., Takami, A., Middlebrook, A. M., Sun, Y. L., Dzepina, K., Dunlea, E., Docherty, K., DeCarlo, P. F., Salcedo, D., Onasch, T., Jayne, J. T., Miyoshi, T., Shimono, A., Hatakeyama, S., Takegawa, N., Kondo, Y., Schneider, J., Drewnick, F., Borrmann, S., Weimer, S., Demerjian, K., Williams, P., Bower, K., Bahreini, R., Cottrell, L., Griffin, R. J., Rautiainen, J., Sun, J. Y., Zhang, Y. M., and Worsnop, D. R.: Ubiquity and dominance of oxygenated species in organic aerosols in anthropogenically-influenced Northern Hemisphere midlatitudes, Geophys. Res. Lett., 34, https://doi.org/10.1029/2007GL029979, 2007.
Zhang, S., Shen, X., Sun, J., Zhang, Y., Zhang, X., Xia, C., Hu, X., Zhong, J., Wang, J., and Liu, S.: Atmospheric Particle Hygroscopicity and the Influence by Oxidation State of Organic Aerosols in Urban Beijing, J. Environ. Sci., 124, 544–556, https://doi.org/10.1016/j.jes.2021.11.019, 2023.
Zhang, Y., Zhang, Q., Cheng, Y., Su, H., Kecorius, S., Wang, Z., Wu, Z., Hu, M., Zhu, T., Wiedensohler, A., and He, K.: Measuring the morphology and density of internally mixed black carbon with SP2 and VTDMA: new insight into the absorption enhancement of black carbon in the atmosphere, Atmos. Meas. Tech., 9, 1833–1843, https://doi.org/10.5194/amt-9-1833-2016, 2016b.
Zhao, G., Tan, T., Zhao, W., Guo, S., Tian, P., and Zhao, C.: A new parameterization scheme for the real part of the ambient urban aerosol refractive index, Atmos. Chem. Phys., 19, 12875–12885, https://doi.org/10.5194/acp-19-12875-2019, 2019a.
Zhao, G., Tao, J., Kuang, Y., Shen, C., Yu, Y., and Zhao, C.: Role of black carbon mass size distribution in the direct aerosol radiative forcing, Atmos. Chem. Phys., 19, 13175–13188, https://doi.org/10.5194/acp-19-13175-2019, 2019b.
Zhao, G., Zhao, W., and Zhao, C.: Method to measure the size-resolved real part of aerosol refractive index using differential mobility analyzer in tandem with single-particle soot photometer, Atmos. Meas. Tech., 12, 3541–3550, https://doi.org/10.5194/amt-12-3541-2019, 2019c.
Zhao, G., Li, F., and Zhao, C.: Determination of the refractive index of ambient aerosols, Atmos. Environ., 240, 117800, https://doi.org/10.1016/j.atmosenv.2020.117800, 2020.
Zhao, G., Hu, M., Fang, X., Tan, T., Xiao, Y., Du, Z., Zheng, J., Shang, D., Wu, Z., Guo, S., and Zhao, C.: Larger than expected variation range in the real part of the refractive index for ambient aerosols in China, Sci. Total Environ., 779, 146443, https://doi.org/10.1016/j.scitotenv.2021.146443, 2021a.
Zhao, G., Hu, M., Zhu, W., Tan, T., Shang, D., Zheng, J., Du, Z., Guo, S., Wu, Z., Zeng, L., and Zhao, C.: Parameterization of the ambient aerosol refractive index with source appointed chemical compositions, Sci. Total Environ., 842, 156573, https://doi.org/10.1016/j.scitotenv.2022.156573, 2022.
Zhao, W., Tan, W., Zhao, G., Shen, C., Yu, Y., and Zhao, C.: Determination of equivalent black carbon mass concentration from aerosol light absorption using variable mass absorption cross section, Atmos. Meas. Tech., 14, 1319–1331, https://doi.org/10.5194/amt-14-1319-2021, 2021b.
Zhong, J., Zhang, X., Wang, Y., Wang, J., Shen, X., Zhang, H., Wang, T., Xie, Z., Liu, C., Zhang, H., Zhao, T., Sun, J., Fan, S., Gao, Z., Li, Y., and Wang, L.: The two-way feedback mechanism between unfavorable meteorological conditions and cumulative aerosol pollution in various haze regions of China, Atmos. Chem. Phys., 19, 3287–3306, https://doi.org/10.5194/acp-19-3287-2019, 2019.
Zhou, Y., Ma, N., Wang, Q., Wang, Z., Chen, C., Tao, J., Hong, J., Peng, L., He, Y., Xie, L., Zhu, S., Zhang, Y., Li, G., Xu, W., Cheng, P., Kuhn, U., Zhou, G., Fu, P., Zhang, Q., Su, H., and Cheng, Y.: Bimodal distribution of size-resolved particle effective density: results from a short campaign in a rural environment over the North China Plain, Atmos. Chem. Phys., 22, 2029–2047, https://doi.org/10.5194/acp-22-2029-2022, 2022.
This study provides direct observational evidence that secondary organic aerosol formation enhances the aerosol scattering refractive index and has substantially higher real refractive indices than primary organic aerosols in humid southern China, challenging current model assumptions and offering recommended values that might improve the accuracy of aerosol radiative effect simulations.
This study provides direct observational evidence that secondary organic aerosol formation...