the Creative Commons Attribution 4.0 License.
the Creative Commons Attribution 4.0 License.
 | 23 Sep 2025
Dry and warm conditions in Australia exacerbated by aerosol reduction in China
Jiyuan Gao
Hailong Wang
Pinya Wang
Hong Liao
A substantial decline in anthropogenic aerosols in China has been observed since the initiation of clean air actions in 2013. This study reveals a linkage between aerosol reductions in China and drier and warmer conditions in Australia. Aerosol decline in China trigger alterations in temperature and pressure gradients between the two hemispheres, leading to intensified outflow from Asia towards the South Indian Ocean, strengthening the Southern Indian Subtropical High and its related Southern Trade Winds. Consequently, this atmospheric pattern results in a moisture divergence over Australia. The reduction in surface moisture further results in more surface energy being converted into sensible heat instead of evaporating as latent heat, warming the near-surface air. The intensified dry and warm climate conditions further cause the increase in wildfire risks during fire seasons in Australia. Our study illuminates the potential impact of distant aerosols on precipitation and temperature variations in Australia, offering valuable insights for drought and wildfire risk mitigation in Australia.
- Article
(11872 KB) - Full-text XML
-
Supplement
(2620 KB) - BibTeX
- EndNote


Australia encompasses various climate zones, ranging from the tropical climate in the north to arid conditions in the interior and temperate climates in the south (Head et al., 2014). The continent is predominantly dry, receiving an average annual rainfall of less than 600 mm and less than 300 mm over half of the land. Evident long-term trends can be observed in Australia's historical rainfall records. These trends reveal a notable shift towards drier conditions across southern Australia (Dey et al., 2019a; Nicholls, 2006; Rauniyar and Power, 2020; Wasko et al., 2021), and an increase in rainfall before 2010 (Dey et al., 2019a, b; Evans et al., 2014; Nicholls, 2006; Rotstayn et al., 2007; Wasko et al., 2021) followed by a slight decreasing trend of rainfall after 2010 (CSIRO and BOM, 2022) in the northern Australia.
Precipitation in Australia is influenced by a variety of atmospheric circulation systems, including East Coast Lows (ECLs), the Australian-Indonesian Monsoon, tropical cyclones (TCs), fronts, and different modes of large-scale climate variabilities, such as the El Niño-Southern Oscillation (ENSO), Indian Ocean Dipole (IOD), Interdecadal Pacific Oscillation (IPO), Subtropical ridge (STR), Southern Annular Mode (SAM), and Madden Julian Oscillation (MJO) (Dey et al., 2019a; Risbey et al., 2009). The linkages between Australia's rainfall characteristics and these drivers could change in response to the internal natural variabilities and external anthropogenic forcings. Rauniyar and Power (2020) reported that the drier conditions across the southern Australia could be attributed to a combination of both decadal-scale natural variability and changes in large-scale atmospheric circulation patterns, which was linked to the escalating emissions of greenhouse gases (GHGs), while Rotstayn et al. (2007) found that the increased levels of rainfall in northern Australia before 2010 was linked to the increases in aerosols in Asia.
Human activities have led to a rise of global surface air temperature by approximately 1.29 °C (0.99 to 1.65 °C) from 1750 to 2019, mainly due to an enhanced greenhouse effect from increasing GHG emissions (IPCC, 2021). In addition to GHGs, human activities also emit a variety of aerosols and their gaseous precursors into the atmosphere. Since industrialization, there has been a significant rise in the levels of aerosols and precursors (Hoesly et al., 2018). Atmospheric aerosols are the second-largest anthropogenic climate forcer, exerting an overall cooling effect that partially masks the warming induced by GHGs (IPCC, 2013, 2021). However, as anthropogenic aerosols declined during the past decades in many countries of the world related to the clean air actions, the associated “unmask” effect is likely to exacerbate GHG-induced warming (Kloster et al., 2010). For example, in the 1980s, clean air actions were implemented in North America and Europe, leading to a decrease in the emissions of aerosols and their precursors (Hoesly et al., 2018). Reductions in aerosol emissions in the U.S. have led to changes in aerosol direct radiative forcing (DRF) by 0.8 W m−2 and indirect radiative forcing (IRF) by 1.0 W m−2 over the eastern U.S. during 1980–2010 (Leibensperger et al., 2012). Similarly, aerosol decreases over Europe between the 1980s and 1990s have caused a change in regional DRF by 1.26 W m−2 (Pozzoli et al., 2011). In China, the emissions of aerosols and their precursors have been reduced since 2013 due to the implementation of Air Pollution Prevention and Control Action Plan. Dang and Liao (2019) reported a 1.18 W m−2 change in DRF between 2012 and 2017 due to decreased aerosol levels over eastern China. Gao et al. (2022) estimated a warming of 0.20 °C in China, 0.15 °C in North America, and 0.14 °C in Europe, attributed to the decreases in aerosols during 2013–2019.
Monsoonal rainfall serves as a vital resource for agriculture, industry, and ecosystems across the monsoon-affected regions, affecting approximately two-thirds of the world's population (Wang et al., 2021a). Apart from GHGs-induced warming (Cook and Seager, 2013) and nature variabilities (e.g., ENSO) (Oh and Ha, 2015), aerosol also modulates monsoon system mainly through changing land-sea temperature and pressure gradient. The impact of aerosols on Asian monsoon has been widely investigated. Based on climate model simulations, Liu et al. (2023) found that aerosol reductions in East Asia during 2013–2017 resulted in an approximately 5 % increase in the strength of the East Asian summer monsoon (EASM). The EASM is also reported to enhance due to future aerosol reductions from 2000 to 2100 (Wang et al., 2016). Dong et al. (2019) explored the effects of increased aerosol in Asia from 1970s to 2000s on atmospheric circulation and rainfall patterns and found anomalous moisture convergence and increased precipitation over the Maritime continent. Non-Asian aerosols also have an effect on South Asian monsoon rainfall through changes in the interhemispheric temperature gradient and meridional shifts of the Intertropical Convergence Zone (Bollasina et al., 2011, 2014; Cowan and Cai, 2011; Undorf et al., 2018). Australia, especially in northern Australia, is largely affected by the Australian monsoon, which is characterized by winds that blow from the southeast during cold season and from the northwest during the warm season (Gallego et al., 2017; Heidemann et al., 2023). Australia has a relatively low level of anthropogenic aerosols, which suggests that the impact of domestic anthropogenic aerosols on Australian monsoon should not be significant. However, the impact of remote aerosols on Australian monsoon have been investigated in previous studies, and they reported that the increases in Asian aerosols could enhance rainfall in Australia through increasing monsoonal winds towards Australia (Rotstayn et al., 2007; Fahrenbach et al., 2023).
Wildfires, which are uncontrolled fires spreading rapidly across natural landscapes, are significantly influenced by meteorological conditions (He et al., 2019; Jones et al., 2022). In Australia, these fires, also known as bushfires, present a major environmental and social threat (Johnston et al., 2021; Ward et al., 2020). According to Dowdy (2020), the most favorable seasons for wildfires in most regions of Australia are austral spring and summer. Key meteorological factors such as extended periods of drought, elevated temperatures, low humidity, and strong winds are crucial in determining the occurrence and intensity of wildfires (Zacharakis and Tsihrintzis, 2023). Under the recent historical climate change, Australia has witnessed a rise in extreme fire weather conditions and an extended fire season (CSIRO and BOM, 2022).
Since the implementation of clean air policies in 2013, there has been a noticeable decrease in aerosol levels in China (Zhang et al., 2019; Zheng et al., 2018). Numerous studies have shown the local and global climate effects of the aerosol reductions in China (Dang and Liao, 2019; Gao et al., 2022, 2023; Liu et al., 2023; Zheng et al., 2020). The Australian monsoonal wind patterns, reported to be influenced by Asian aerosol emissions in the past decades (Rotstayn et al., 2007; Fahrenbach et al., 2023), may have also influenced by the radiative effects due to the aerosol decline in China. The objective of this study is to explore how aerosol emission reductions in China affect the climate and wildfire risk in Australia and to investigate the underlying mechanisms driving these impacts.
2.1 Observational and Reanalysis Data
Ground-based observational data of near-surface PM2.5 concentrations in China 2013–2019 are acquired from the China National Environmental Monitoring Centre (CNEMC), which offers daily records of near-surface air pollutant concentrations for nearly 1800 sites. Aerosol Optical Depth (AOD) data are obtained from the Moderate Resolution Imaging Spectroradiometer (MODIS) Deep Blue retrieval (Hsu et al., 2013). These observational data are used for evaluating the performance of model simulated aerosols.
ERA5, the fifth generation of the European Centre for Medium-range Weather Forecasts (ECMWF) atmospheric reanalysis, is a comprehensive dataset that provides a detailed and globally consistent view of the earth's atmospheric conditions over the past several decades (Hersbach et al., 2020). In this study, ERA5 data are employed to evaluate the climate condition in Australia and analyze its linkage with aerosol reductions in China during the 2013–2019 by using the 2 m temperature, total precipitation, relative humidity, cloud cover, wind fields, vertical velocity, surface latent and sensible heat flux, and surface and top of the atmosphere (TOA) solar and longwave radiative flux under both clear and all sky conditions.
The Global Precipitation Measurement (GPM) mission is a joint initiative by National Aeronautics and Space Administration (NASA) and the Japan Aerospace Exploration Agency (JAXA) aimed at providing accurate and frequent measurements of global precipitation (Skofronick-Jackson et al., 2017). GPM includes a core satellite equipped with advanced radar and microwave sensors, enabling the observation of rain and snowfall in real-time. The data are crucial for understanding weather patterns, climate dynamics, and hydrological processes. The Global Precipitation Climatology Project (GPCP) is an international initiative under the World Climate Research Programme (WCRP) that integrates satellite and gauge-based observations to provide long-term, global precipitation estimates (Adler et al., 2018). GPCP offers monthly and daily precipitation datasets with global coverage, combining data from rain gauges, satellite infrared (IR), and microwave sensors to enhance accuracy. Precipitation rate data from GPM and GPCP are also used in the study. GPM provides higher temporal and spatial resolution data compared to Global Precipitation Climatology Project (GPCP), making it more suitable for studies focused on short-term precipitation variability and regional climate dynamics.
2.2 Model Description and Experimental Design
In this research, we conduct simulations to explore the impact of aerosols on climate using the Community Earth System Model version 1 (CESM1). CESM1 simulates the major aerosols including sulfate, black carbon (BC), primary organic matter (POM), secondary organic aerosol (SOA), dust and sea salt in a four-mode Modal Aerosol Module (MAM4), as described in Liu et al. (2016). CESM1 simulations are carried out with 30 vertical layers and a horizontal resolution of 2.5° longitude by 1.9° latitude. In addition to the default model physics, several supplementary features are incorporated into the model in this study to improve the model's performance in simulating aerosol wet scavenging and convective transport (Wang et al., 2013).
The global anthropogenic emissions of aerosols and their precursors are obtained from the Community Emissions Data System (CEDS) v_2021_04_21. In contrast to the prior CEDS v_2016_07_26, which exhibits significant regional emission biases (Wang et al., 2021b), the newer CEDS version of anthropogenic emissions of aerosols and precursors considers the substantial reductions in emissions in China, related to the recent clean air actions since 2013 (Fig. S1 in the Supplement). Specifically, anthropogenic sulfur dioxide (SO2), BC, and organic carbon (OC) emissions decreased by −12.48, −0.30, and −0.21 Tg yr−1, respectively, over China between 2013 and 2019. Biogenic emissions are from the Model of Emissions of Gases and Aerosols from Nature version 2.1 (MEGAN v2.1) (Guenther et al., 2012), while the emissions from open biomass burning are derived from the CMIP6 (Coupled Model Intercomparison Project Phase 6) (van Marle et al., 2017).
A series of model experiments are conducted using CESM1 with a fully-coupled model configuration, as detailed in Table S1. In the baseline scenario (referred to as BASE), anthropogenic emissions of aerosols and precursors are fixed at year 2013 worldwide. In CHN, anthropogenic emissions of aerosols and precursors over China are fixed at year 2019, while emissions in all other regions are remained at year 2013. In NAEU, the simulation is performed with anthropogenic emissions of aerosols and precursors over North America and Europe set at year 2019, while emissions in other regions remained at year 2013. In OTH, anthropogenic emissions of aerosols and precursors in other regions except for China are set at year 2019, while emissions in China are kept at year 2013. In SASEA, anthropogenic emissions of aerosols and precursors over South Asia and Southeast Asia are fixed at year 2019, while emissions in other regions remained at year 2013. Biogenic and biomass burning emissions worldwide in all experiments are fixed at year 2013. To reduce model biases related to internal variability, three ensemble members are conducted by perturbing the initial atmospheric temperature conditions. All simulations are run for 150 years, with the last 100 years for detailed analysis. To additionally examine the fast climate responses to aerosol reductions in China, supplementary atmosphere-only experiments (BASE_FAST and CN_FAST) were conducted using the CESM1 atmospheric component (CAM5) with prescribed sea surface temperatures and sea ice concentrations derived from BASE. These simulations were run for 30 years, and the outputs from the last 15 years were analyzed.
2.3 Model Evaluation
To validate whether CESM1 can reproduce the aerosol reductions in China during the 2010s, changes in simulated near-surface PM2.5 concentrations (sum of sulfate, BC, POM, SOA, dust × 0.1, and sea-salt × 0.25 following Turnock et al., 2020) in China during 2013–2019 are compared with the observations. Figure S2 shows spatial distributions of observed and modeled annual mean near-surface PM2.5 concentration changes over China (2017–2019 minus 2013–2015), which exhibited a statistically significant correlation coefficient of 0.52 between simulations and observations. However, the model underestimates the PM2.5 concentration changes by 76 % in China. The considerable underestimation has been reported in many previous studies, resulting from coarse model resolution, uncertainties in emissions of aerosols and precursor gases, strong aerosol wet removal, and the model's deficiency in simulating nitrate and ammonium aerosols (Fan et al., 2018, 2022; Gao et al., 2022, 2023; Zeng et al., 2021). The model has a good capability in replicating the spatial distribution of AOD changes in China during 2013–2019 (Fig. S3), as evidenced by a high correlation coefficient of 0.83, but the model also exhibits an underestimation in the AOD reductions by 69 %. However, the apparent underestimation of absolute changes may largely stem from the inherently low background aerosol concentrations in CESM1. When considering the relative changes rather than absolute values, the bias appears much less pronounced (Figs. S4 and S5).
Climate variables, including precipitation rate, surface air temperature, relative humidity, total cloud cover, surface solar radiation, 10 m wind speed, and surface and TOA net total radiative fluxes under both clear and all sky conditions over Australia simulated by CESM1 model are also compared with those from ERA5 reanalysis (Figs. S6–S8). The model demonstrates a good performance in simulating Australian climate, with normalized mean bias (NMB) values consistently below or near 40 % for surface air temperature, relative humidity, total cloud cover, surface downward solar radiation, and 10 m wind speed, and surface and TOA net total radiative fluxes, but it tends to overestimate annual precipitation by about 90 %, especially over coastal regions likely related to the coarse model resolution. The model accurately reproduces spatial patterns of all climate variables, closely aligning with observations, as indicated by correlation coefficients ranging from 0.7 to 1.0.
2.4 Wildfire Risk Indices
In this study, several climatological indices are used to indicate wildfire risk during fire seasons (austral spring and summer, from September to February of the next year) in Australia (Ren et al., 2022; Irmak et al., 2003; Seager et al., 2015; Sharples et al., 2009).
- i.
Reference Potential Evapotranspiration (ET0): ET0 is a climatological index used to estimate the amount of water that could potentially evaporate and be transpired from the Earth's surface under specific meteorological conditions. The calculation of ET0 takes into account factors such as temperature (T, unit: °C), and surface downward solar radiation (Rs, unit: W m−2) to estimate the maximum amount of water loss due to evaporation and transpiration. ET0 is important in wildfire studies because it helps to gauge the environmental moisture conditions and the potential for drought, which can be a significant factor in wildfire risks assessment. ET0 is given by the following expression (Irmak et al., 2003):
- ii.
Vapor Pressure Deficit (VPD): Vapor Pressure Deficit (VPD) is a meteorological parameter that measures the difference between the amount of moisture in the air and the maximum amount of moisture the air can hold at a given temperature (T, unit: °C) and moisture (relative humidity, RH, unit: %). High VPD values indicate that the air is dry. VPD is important in the context of wildfires because it reflects the drying potential of the atmosphere. When VPD is high, it can lead to rapid moisture loss from vegetation, making it more susceptible to ignition and increasing the risk of wildfires. VPD is given by (Seager et al., 2015):
- iii.
McArthur Forest Fire Danger Index (FFDI): The McArthur Forest Fire Danger Index (FFDI) is a widely used index in Australia to assess the potential for bushfires and forest fires. It takes into account various meteorological factors, including T (unit: °C), RH (unit: %), wind speed (U, unit: m s−1), and drought factor (DF, unitless). We set DF as 10 here following Sharples et al. (2009), as it would not significantly affect the methods of comparison used later in their study. While we acknowledge that this assumption is idealized, we find it applicable in our case. To verify this, we calculated gridded DFs for Australia (Fig. S9), which show that the DFs are close to 10 and exhibit nearly homogeneous spatial distributions. As such, setting DF = 10 for Australia is reasonable for our analysis. In addition, FFDI calculated using DF = 10 and FFDI using gridded DFs are compared (Fig. S10). The patterns and regional averages of both datasets are very similar, further supporting the use of DF = 10 in our study. The FFDI provides a numerical rating that indicates the level of fire danger, with higher values corresponding to greater fire risks. This index is particularly valuable for assessing the immediate risk of wildfires and is commonly used in fire management and prediction. FFDI is defined as (Sharples et al., 2009):
3.1 Intensified Dry and Warm Conditions in Australia by aerosol changes
Figure 1 shows simulated responses in annual precipitation rate, surface air temperature and relative humidity in Australia to changes in anthropogenic emissions of aerosols and precursors. In response to aerosol reductions in China, Australia experiences significant decreases in precipitation and relative humidity, while the temperature has an increase from 2013 to 2019. On regional average, annual precipitation, surface air temperature and relative humidity change by −0.10 mm d−1, 0.06 °C, and −1.20 %, respectively, in Australia caused by the aerosol reduction in China during this time period, contributing to the dry and warm climate in Australia. Notably, Northern Australia experiences the most significant reduction in convective precipitation, whereas Southern Australia has the greatest decline in large-scale precipitation related to the aerosol reduction in China, as simulated by the CESM1 model (Fig. S11). The direction of seasonal responses in precipitation rate, surface air temperature and relative humidity are the same as the annual averages, with the largest changes occurring in austral spring (Fig. 2). Regarding the strong seasonal component observed in the responses, there are two main contributing factors: (1) the background seasonality of the Southern Hemisphere trade winds, and (2) the seasonality of China's emission changes themselves. However, determining which of these factors dominates requires further detailed quantitative analysis.
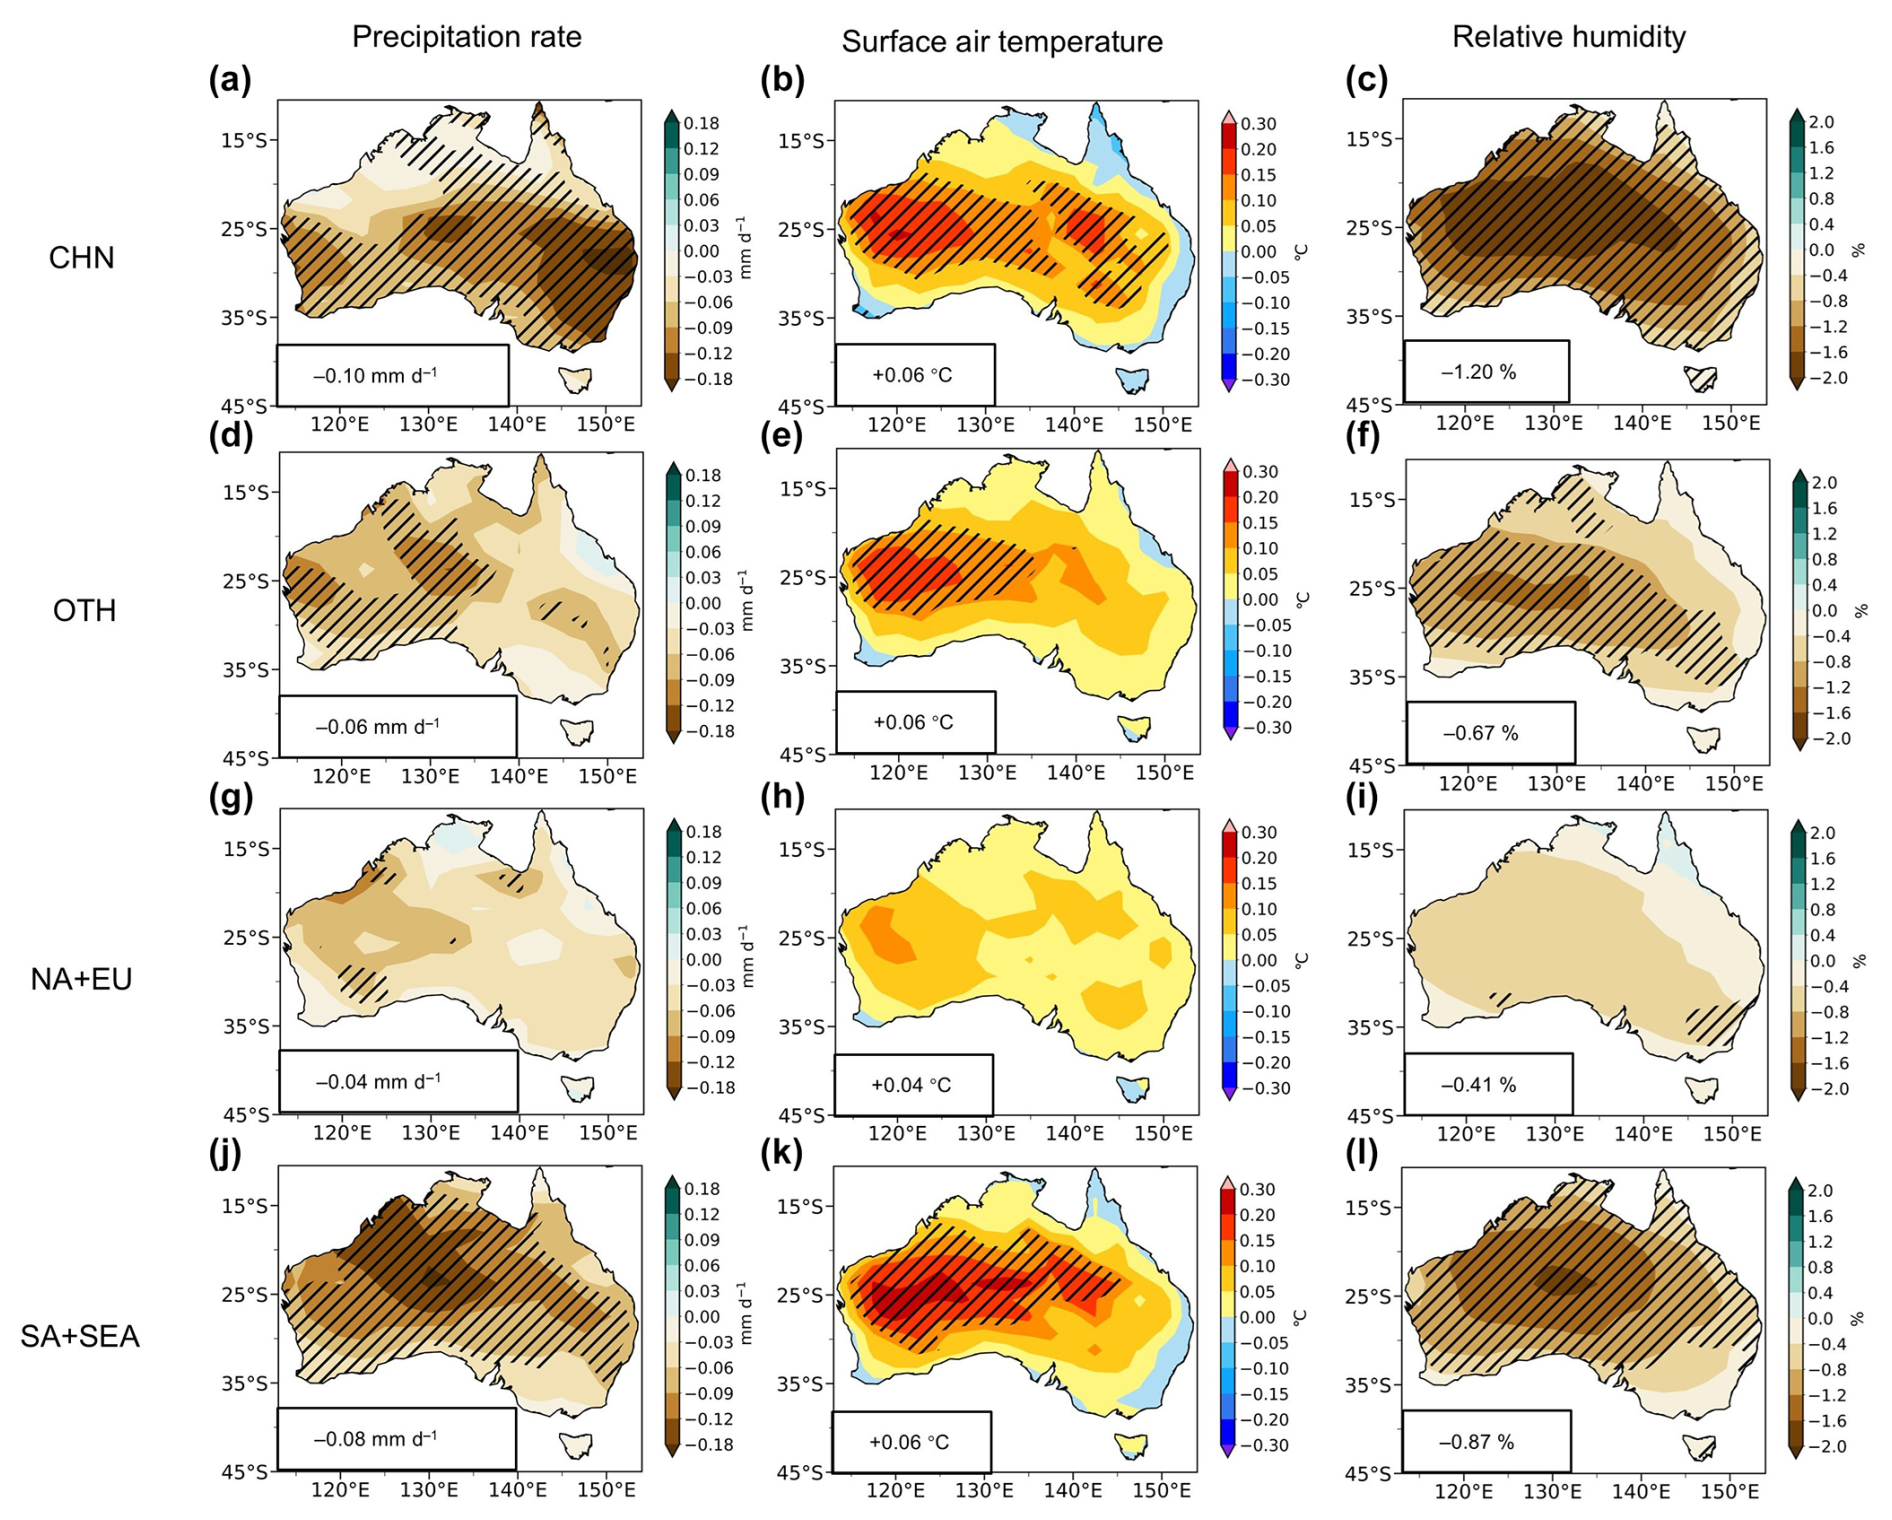
Figure 1Simulated changes in precipitation rate, surface air temperature and relative humidity in Australia due to aerosol changes between 2013 and 2019. Spatial distributions of simulated differences in annual mean precipitation rate (Pr, (a), (d), and (g), unit: mm d−1), surface air temperature (TS, (b), (e), and (h), unit: °C) and relative humidity (RH, (c), (f), and (i), unit: %) in Australia between BASE and CHN (CHN minus BASE, (a)–(c)), between BASE and OTH (OTH minus BASE, (d)–(f)), between BASE and NAEU (NAEU minus BASE, (g)–(i)), and between BASE and SASEA (SASEA minus BASE, (j)–(l)). The shaded areas indicate results are statistically significant at the 90 % confidence level. Regional averages over Australia are noted at the bottom-left corner of each panel.
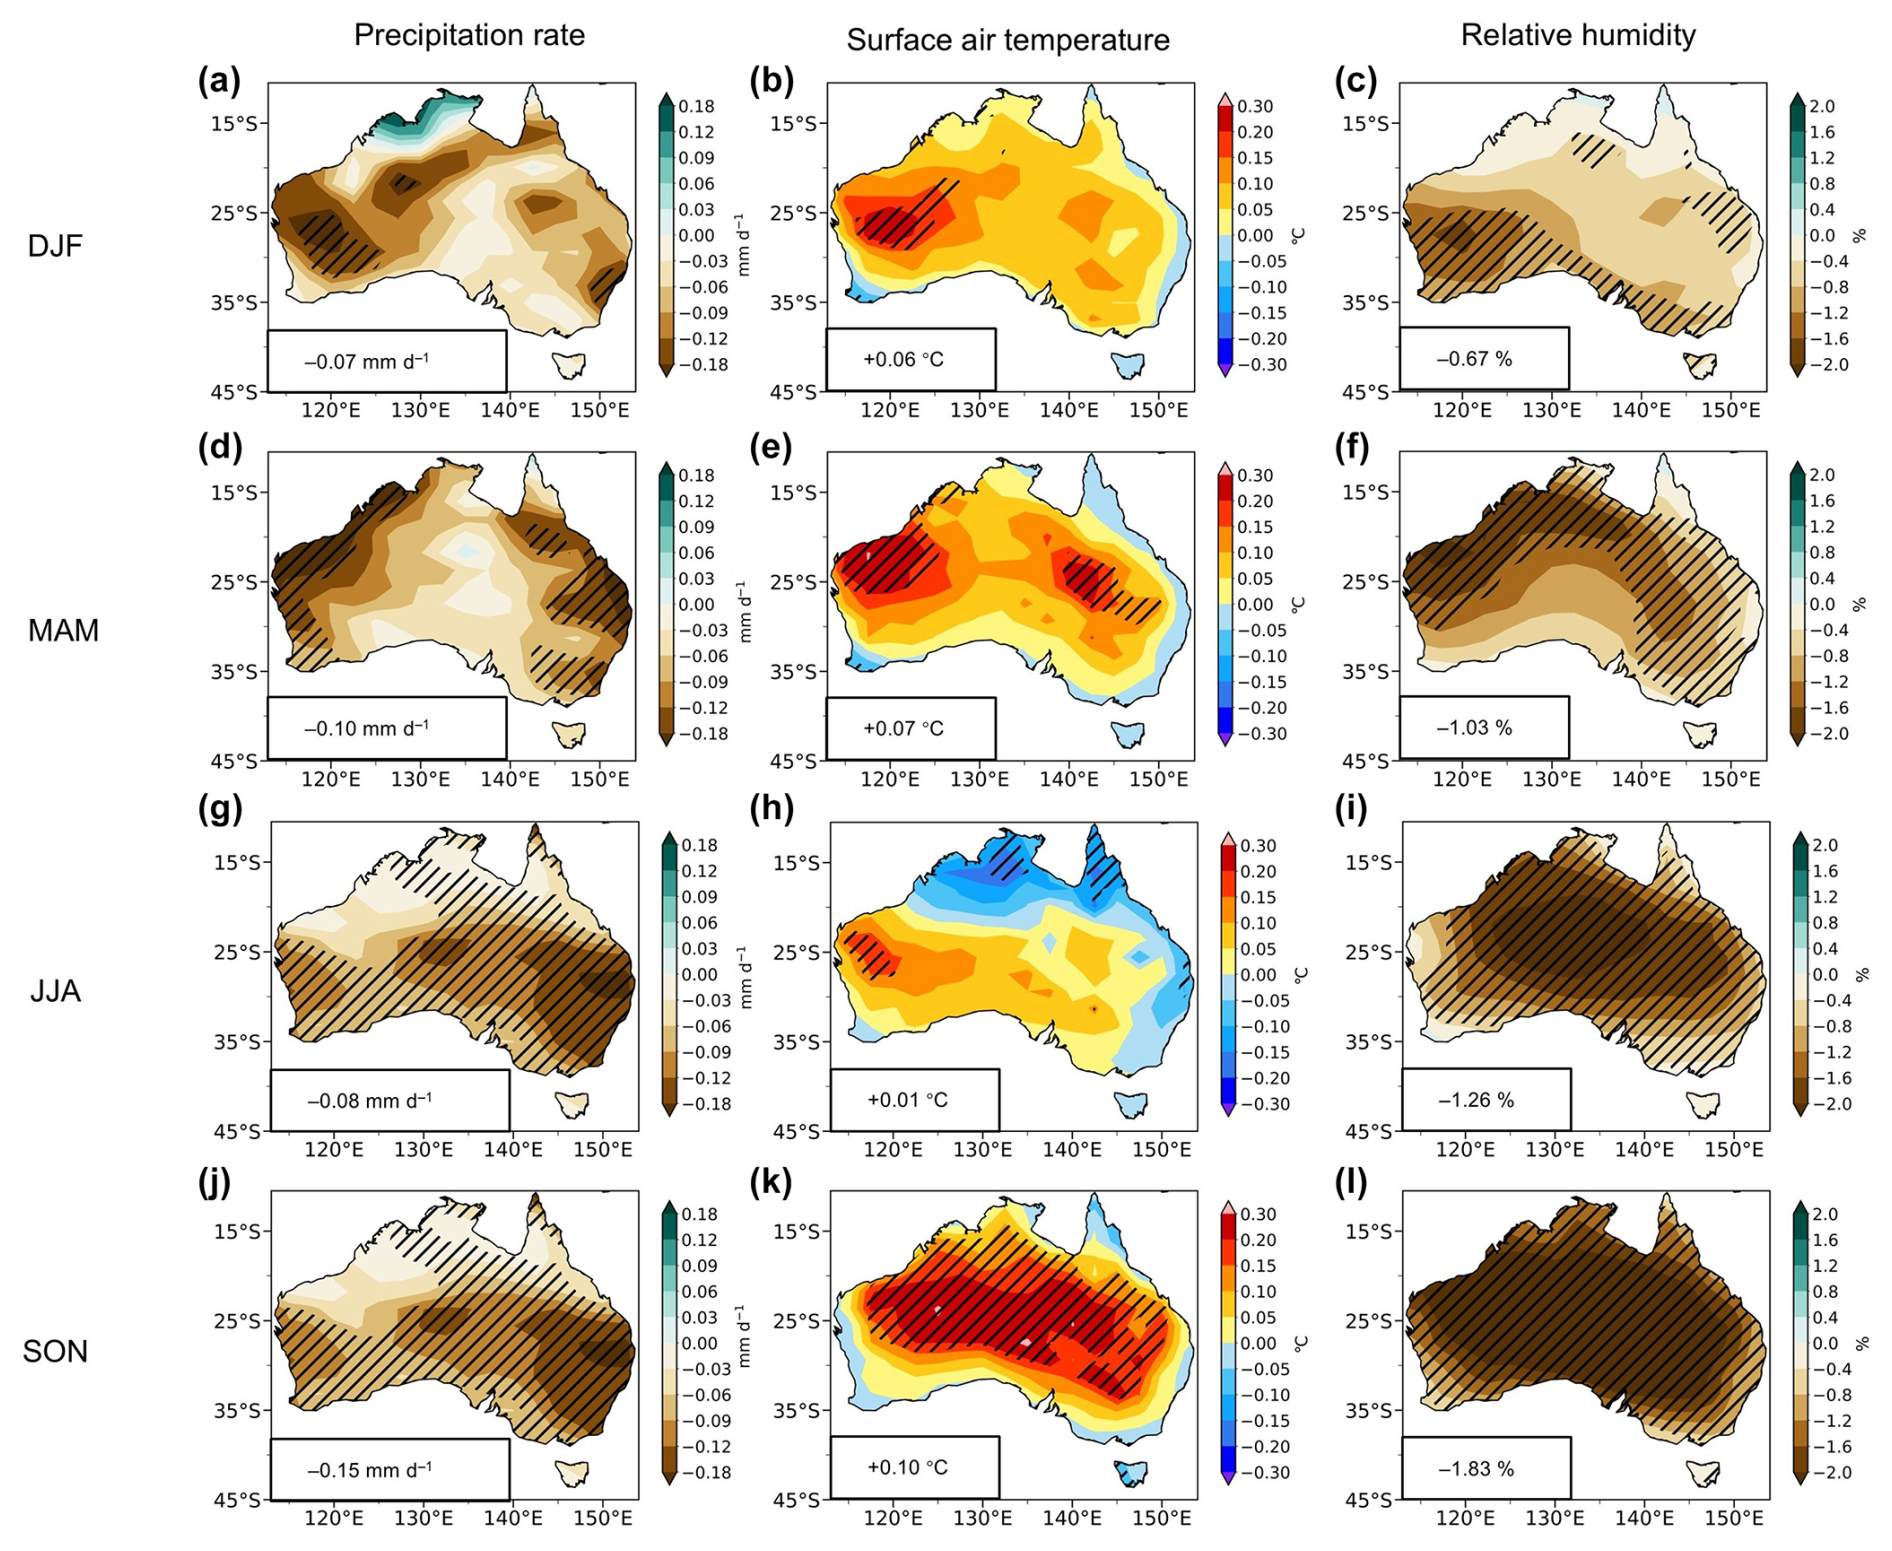
Figure 2Simulated changes in precipitation rate, surface air temperature and relative humidity in Australia due to aerosol changes in China between 2013 and 2019. Spatial distributions of simulated differences in DJF (December, January and February, (a)–(c)), MAM (March, April and May, (d)–(f)), JJA (June, July and August, (g)–(i)) and SON (September, October and November, (j)–(l)) mean precipitation rate (Pr, (a), (d), (g), and (j), unit: mm d−1), surface air temperature (TS, (b), (e), (h), and (k), unit: °C) and relative humidity (RH, (c), (f), (i), and (l), unit: %) in Australia between BASE and CHN (CHN minus BASE). The shaded areas indicate results are statistically significant at the 90 % confidence level. Regional averages over Australia are noted at the bottom-left corner of each panel.
The intensified dry and warm conditions in Australia can also be seen in the observations, as indicated by ERA5 reanalysis data (Fig. 3). Since 2010, precipitation and relative humidity have significantly decreased in Australia, especially in Northern and Eastern Australia, at a rate of 0.086 mm d−1 yr−1 and 1.07 % yr−1, respectively, while surface air temperature has increased at a rate of 0.17 °C yr−1. In addition, time series of precipitation have also been extended to cover 2001–2019 (Fig. S12). To account for the potential influence of internal variability, particularly ENSO, which is a major driver of Australia's precipitation variability (Fig. S13), the time series are also given after removing the influence of Niño 3.4 index. The adjusted results exhibit a similar drying trend since the 2010s (Fig. S12). The GPM and GPCP data also exhibit a similar decreasing trend in precipitation over Australia (Fig. S14). The reduction in anthropogenic SO2 emissions in China shows strong correlations with the decrease in precipitation and the increase in temperature in Australia during 2010–2019 (Fig. S15). However, when extending the time frame to the period before emissions reductions in China (1940–2019), the increase in temperature becomes less pronounced, with a slight rise in precipitation and relative humidity, likely attributed to greenhouse gas warming, which can serve as indication that the decrease in precipitation and increase in temperature in Australia from 2010 to 2019 are not primarily caused by GHGs (Fig. S16). To place the recent drying trend in a longer-term context, all 10-year precipitation trends in ERA5 data from 1940 onwards were calculated. The 10-year trends (unit: mm d−1 yr−1) were found to be +0.016 (1940–1949), −0.012 (1950–1959), +0.001 (1960–1969), +0.031 (1970–1979), −0.002 (1980–1989), +0.030 (1990–1999), −0.032 (2000–2009), and −0.086 (2010–2019). These results indicate that the drying trend during 2010–2019 was unusually large compared to other decades since 1940, suggesting that despite the influence of internal variability, a pronounced reduction in precipitation over Australia has been observed in recent years. The rainfall decrease is consistent with changes in clouds. Spatial distributions of simulated changes in vertically-integrated cloud cover are shown in Fig. S17, indicating a reduction in clouds of all levels, including high, mid-level, and low clouds. In addition, the spatial distributions of these changes closely resemble the patterns of responses in precipitation and relative humidity.
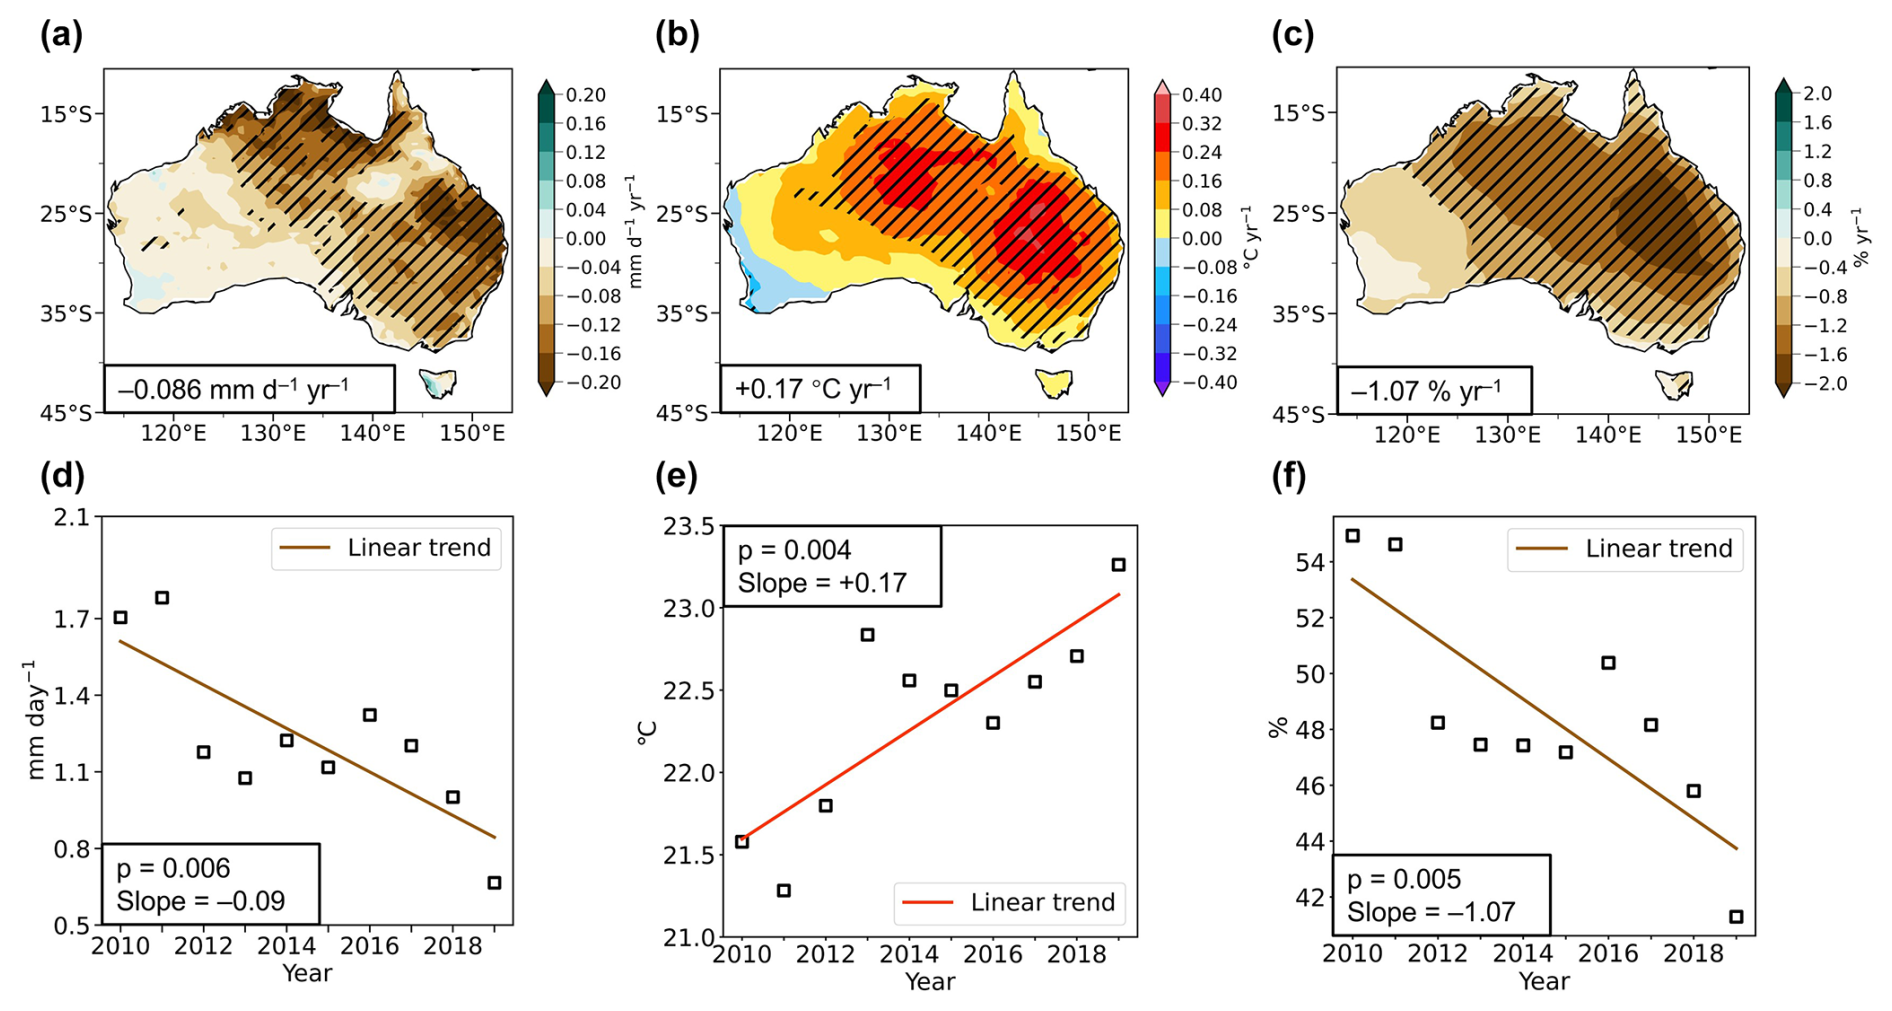
Figure 3Linear trends of observed precipitation rate, surface air temperature and relative humidity in Australia based on ERA5. Spatial distributions of linear trends (a, b, c) and time series (d, e, f) of annual mean precipitation rate (Pr, (a) and (d), unit: mm d−1), surface air temperature (TS, (b) and (e), unit: °C) and relative humidity (RH, (c) and (f), unit: %) in Australia during 2010–2019 from ERA5 reanalysis. The shaded areas indicate trends are statistically significant at the 90 % confidence level. Regional averages over Australia are noted at the bottom-left corner of panels (a), (b), and (c). The p values and slopes of linear trends are noted in panels (d), (e), and (f).
Aerosol emissions have changed globally during 2013–2019, not only in China but also in regions such as South Asia, Southeast Asia, North America, Europe, and Australia, affecting climate both locally and remotely. Figure 1 shows the changes in climate variables in Australia resulting from aerosol emission changes in these regions. Emission changes in other regions except China yield an overall decrease in precipitation by 0.06 mm d−1, an increase in temperature by 0.06 °C, and a decrease in relative humidity by 0.67 %. Among them, aerosol emission changes in South Asia and Southeast Asia yield the largest responses, with a decrease in precipitation by 0.08 mm d−1, an increase in temperature by 0.06 °C, and a decrease in relative humidity by 0.87 %. Emission changes in North America and Europe contribute to a decrease in precipitation by 0.04 mm d−1, an increase in temperature by 0.04 °C, and a decrease in relative humidity by 0.41 %, although these responses are mostly insignificant (Fig. 1).
3.2 Mechanisms of Dry and Warm conditions in Australia Amplified by Aerosol Reductions in China
The rising levels of Asian aerosols could influence the meridional temperature and pressure gradients across the Indian Ocean and therefore affect monsoonal winds and rainfall in Australia since the middle of the 20th century, as reported in several previous studies (Fahrenbach et al., 2023; Rotstayn et al., 2007). Since 2013, aerosol levels in China have substantially decreased due to clean air actions initiated by the Chinese government (Zhang et al., 2019). At the same time, precipitation in Australia exhibited a declining trend, which could be partly attributed to the decrease in China's anthropogenic aerosol forcing as quantified through CESM1 simulations.
Asian monsoon region is closely connected with the meridional Hadley circulation and zonal Walker circulation through monsoon outflow to the South India ocean subtropical high (SISH) and North Pacific subtropical high (NPSH) (Beck et al., 2018). Figure 4a illustrates the climatological mean wind fields at 850 hPa, indicating the persistent existence of SISH in the Indian Ocean and NPSH in the North Pacific. With reductions in aerosols in China, the sea surface temperature (SST) increases in the North Pacific but decreases in the Indian Ocean (Fig. 4b), which is concurrent with the northward shift of the Intertropical Convergence Zone (ITCZ) (Basha et al., 2015). Over Asia, this migration of ITCZ is accompanied by the northward movement of the upper-tropospheric subtropical zonal westerly jet (Chiang et al., 2015; Schiemann et al., 2009), which moves to the north of the Tibetan Plateau. It then enhances the circulation pattern of the Tibetan high, redirects the outflow from the Asian monsoon to the southern Indian Ocean subtropical high (Fig. 5c), strengthens the SISH, and leads to the enhancement of the Southern Trade Winds (Fig. 5d). On the other hand, the increase in SST in the North Pacific induces ascending motion around the 130–150° E and the subsequent descending motion around the 90–110° E (Fig. 5b), with anomalous westerly winds near the surface, leading to a weakening of NPSH along with a decrease in the Northern Trade Winds (Fig. 5d). Note that, the descending motion partly compensates the ascending motion related to the meridional circulation between 10–30° N (Fig. 5c). The mechanism of China's aerosol reductions on the large-scale 3D circulation in the Asia-Pacific region is shown in Fig. 6. The enhancement of the Southern Trade Winds further causes moisture advection away from Australia, accompanied by moisture divergence in Australia, especially over the northern Australia (Fig. S18). This moisture divergence in Australia then intensifies the dryness in Australia (Fig. 1).
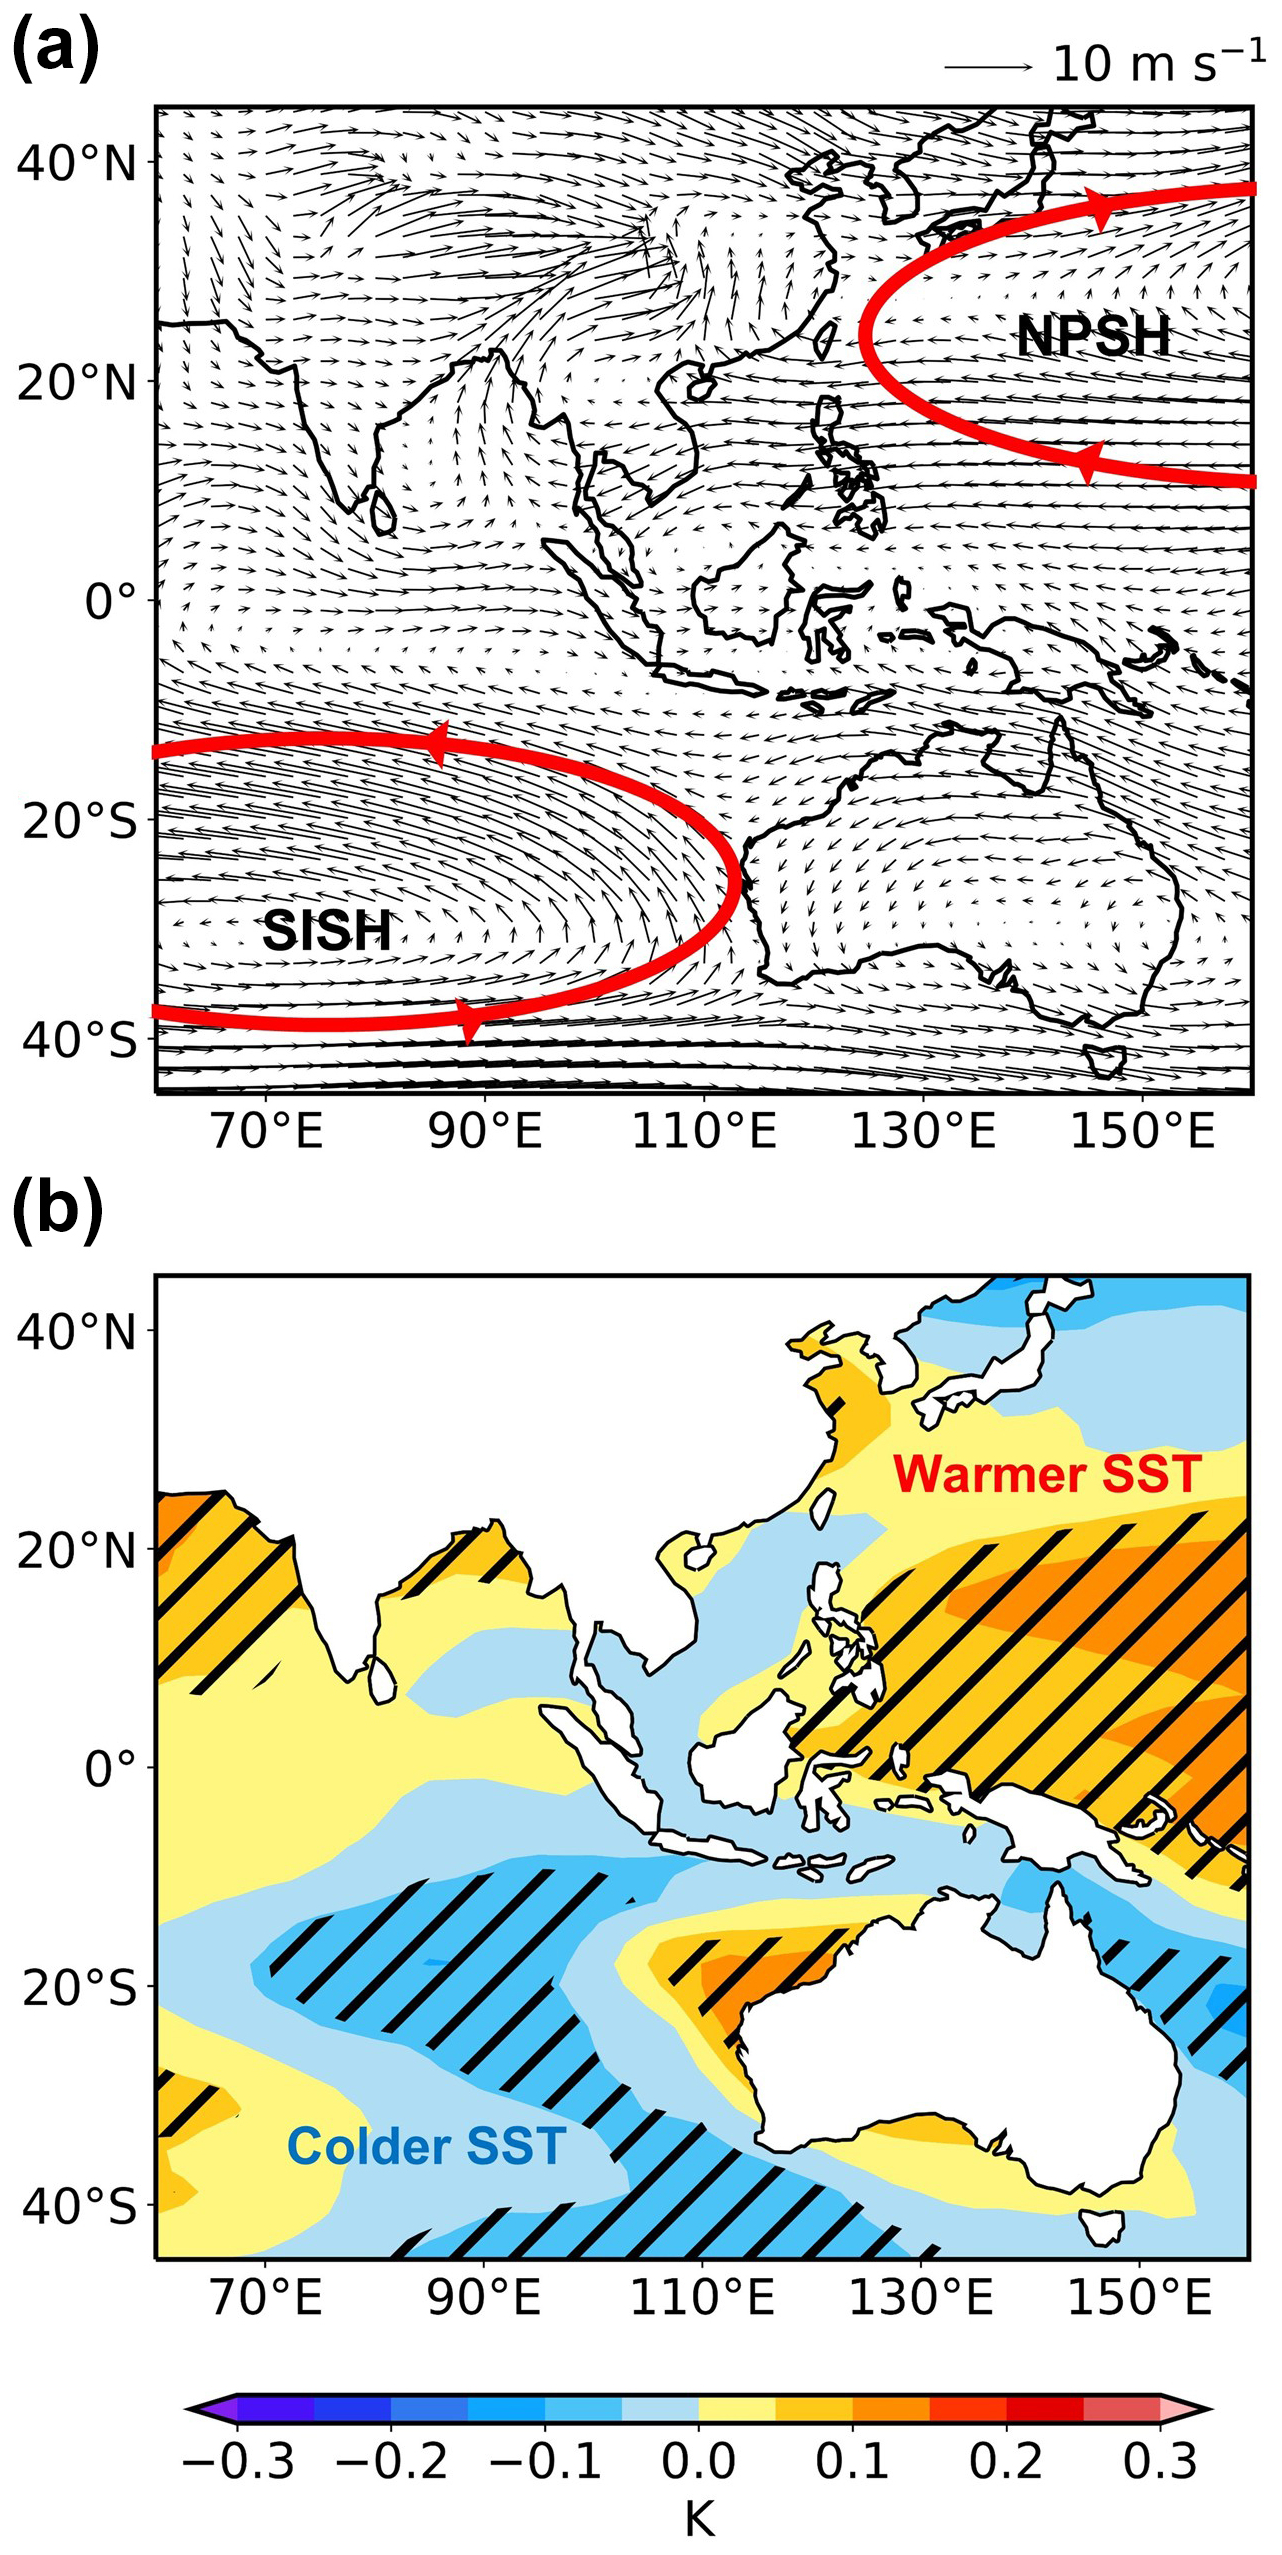
Figure 4Climatological mean wind fields at 850 hPa and Simulated sea surface temperature changes due to aerosol changes in China between 2013 and 2019. (a) Climatological mean wind fields (unit: m s−1, vectors) at 850 hPa from the BASE experiment. NPSH and SISH shown in red circles represents North Pacific Subtropical High and Southern Indian ocean Subtropical High, respectively. (b) Spatial distributions of simulated differences in annual mean sea surface temperature (SST, unit: mm d−1) in Australia between BASE and CHN (CHN minus BASE). The shaded areas indicate results are statistically significant at the 90 % confidence level.
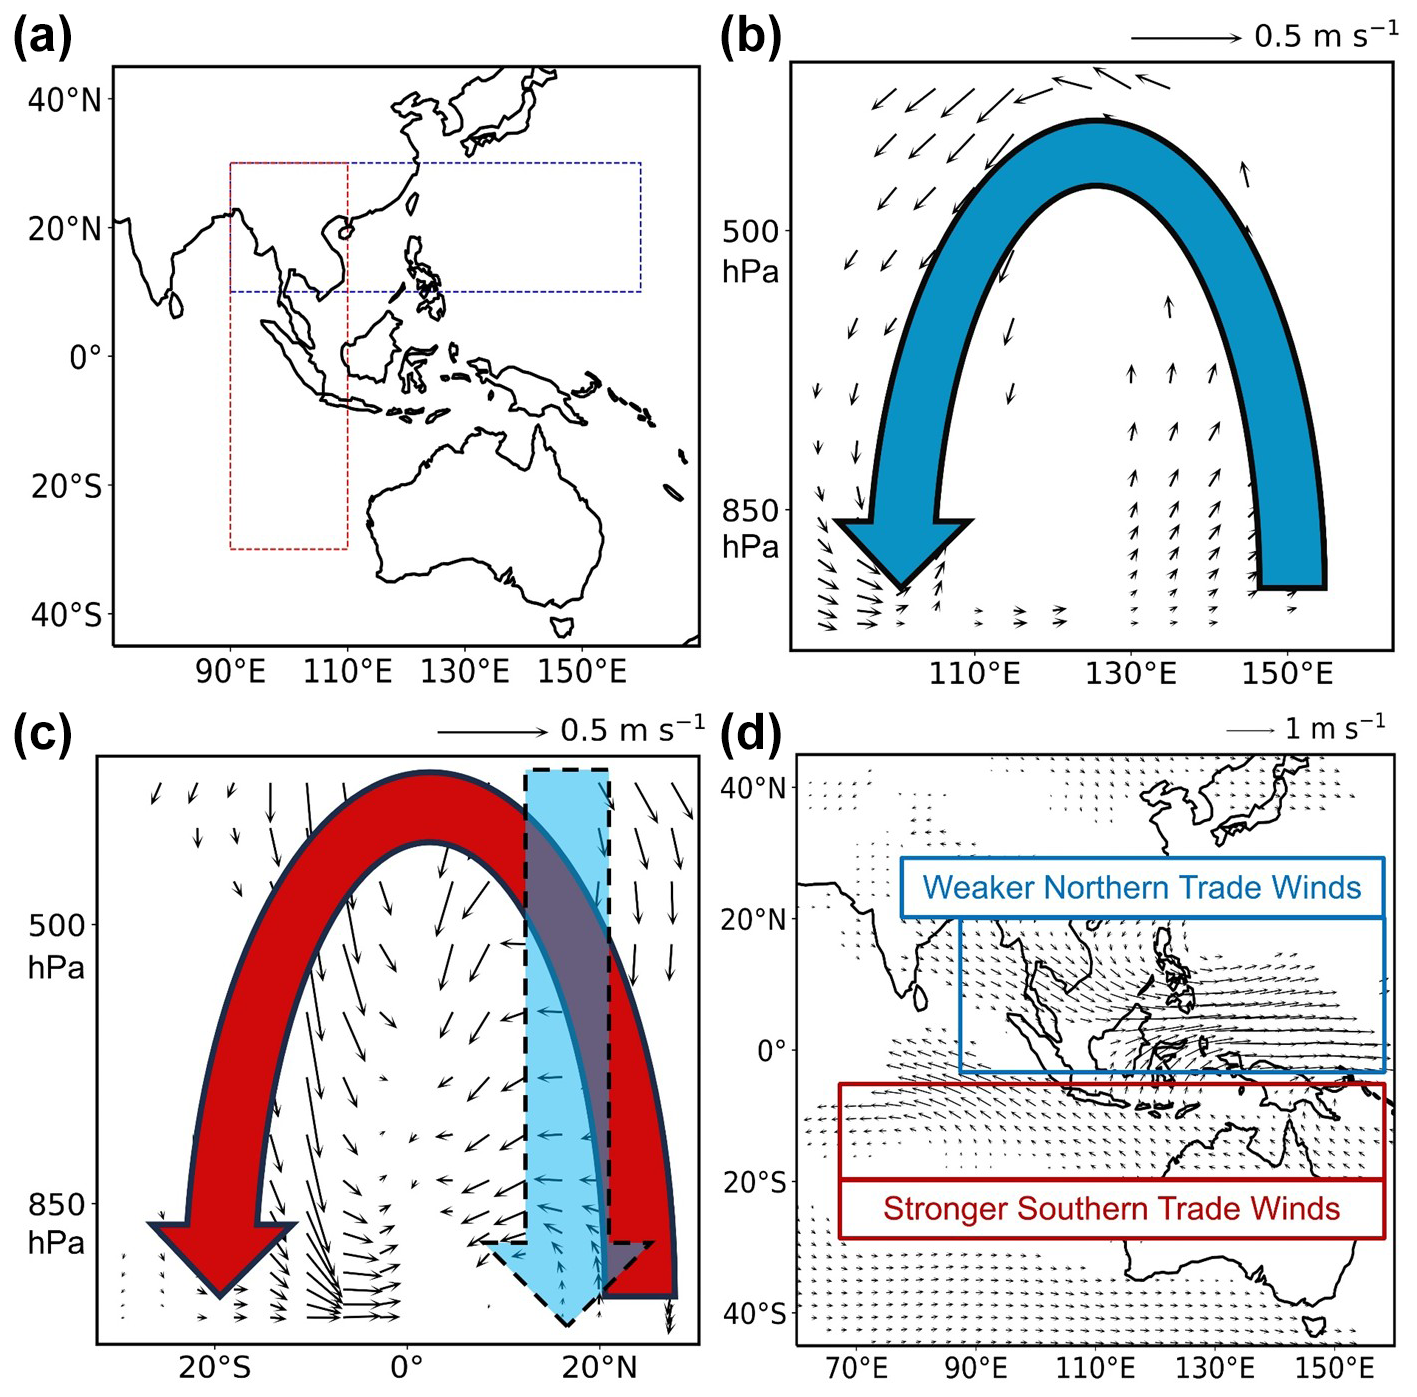
Figure 5Simulated changes in vertical circulations and 850 hPa wind fields in Asia-Pacific regions due to aerosol changes in China between 2013 and 2019. Panels (b) and (c) show pressure–longitude and pressure–latitude cross-section of responses in annual mean atmospheric circulations (unit: m s−1, vectors), respectively, over the areas marked with the blue and red box in panel (a). Panel (d) shows annual mean changes in wind fields (unit: m s−1, vectors) at 850 hPa in Asia-Pacific regions. Only atmospheric circulations and winds statistically significant at the 90 % confidence level are shown.
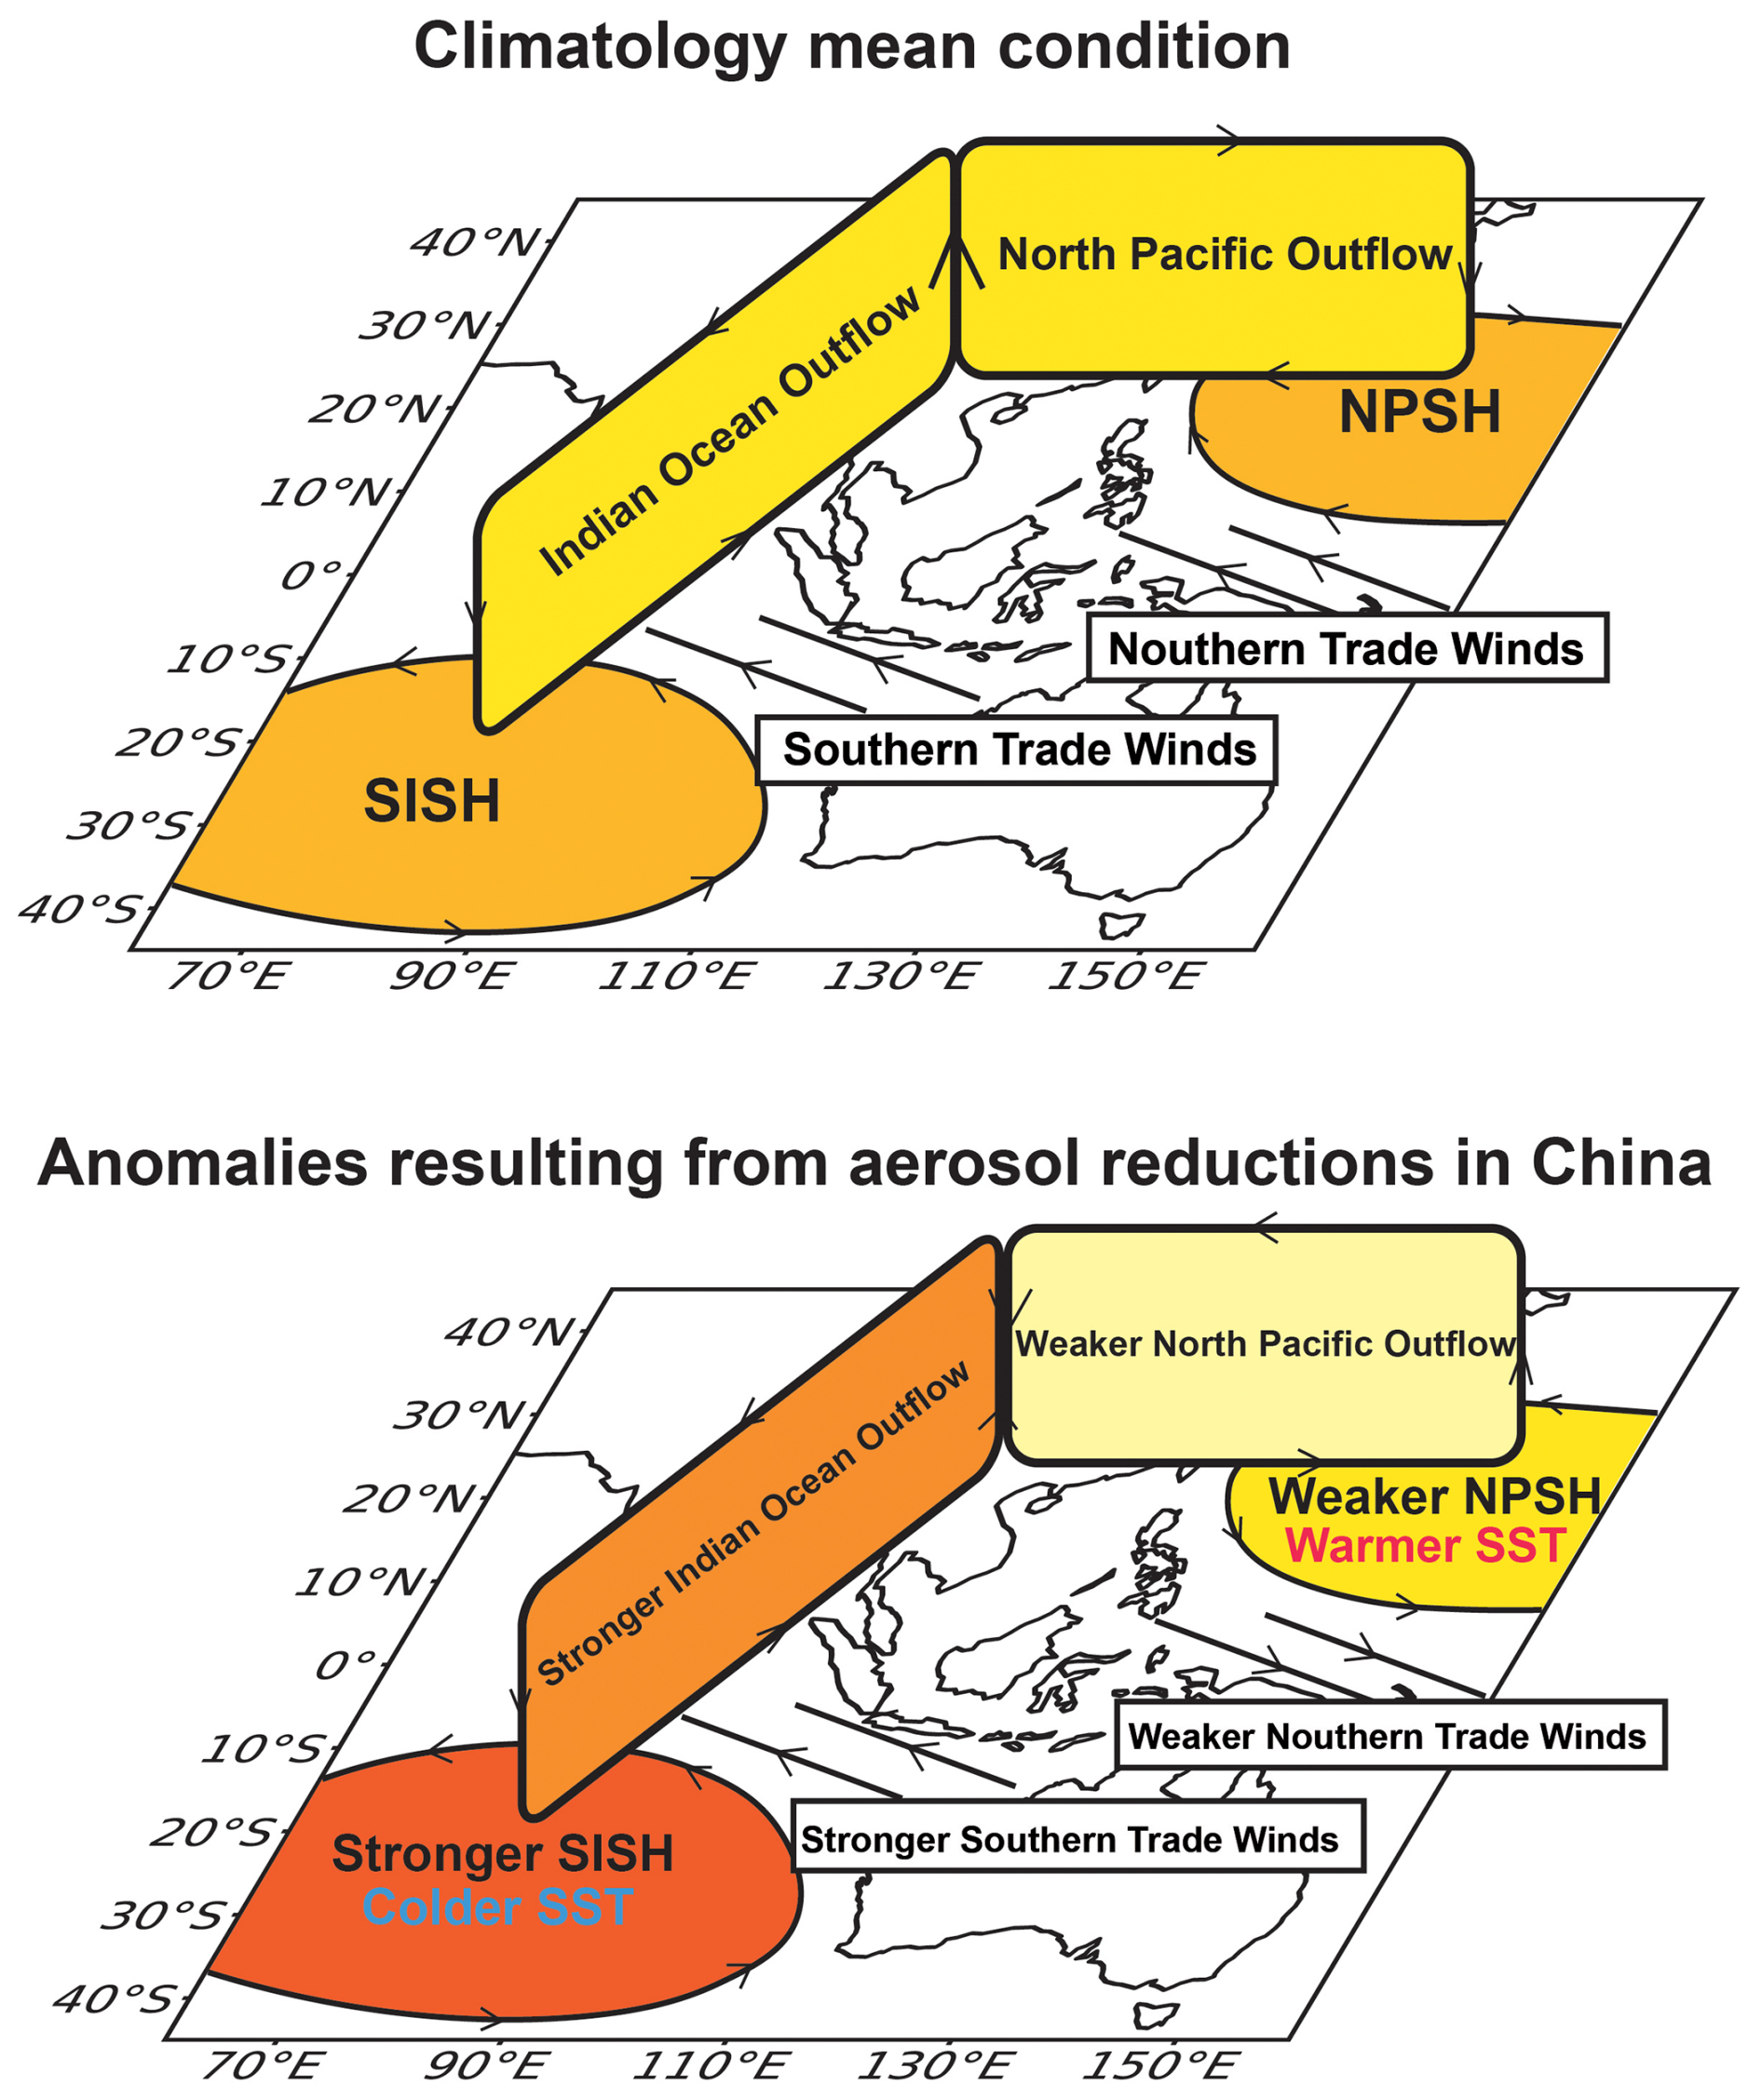
Figure 6Schematic of the response in large-scale 3D circulations in the Asian-Pacific region to aerosol reductions in China. The top panel shows climatology mean condition, and the bottom panel shows anomalies resulting from aerosol reductions in China.
Figure 7 illustrate the changes in relevant radiative fluxes in Australia resulting from aerosol changes in China. Under the clear sky condition, both surface and top of the atmosphere (TOA) radiative flux decrease (Fig. 7c, d). It is due to increased sea salt and dust aerosols (Fig. S19b–d) due to the stronger Southern Trade Winds (Figs. S19a and 5d) and dryer conditions (Fig. 1). The decrease in cloud cover (Fig. S17) leads to an overall increase in both surface and TOA radiative flux (Fig. 7e, f). The overall changes in radiative fluxes are offset by these two factors (Fig. 7a, b) and insufficient to explain the significant increase in surface air temperature in Australia (Fig. 1).
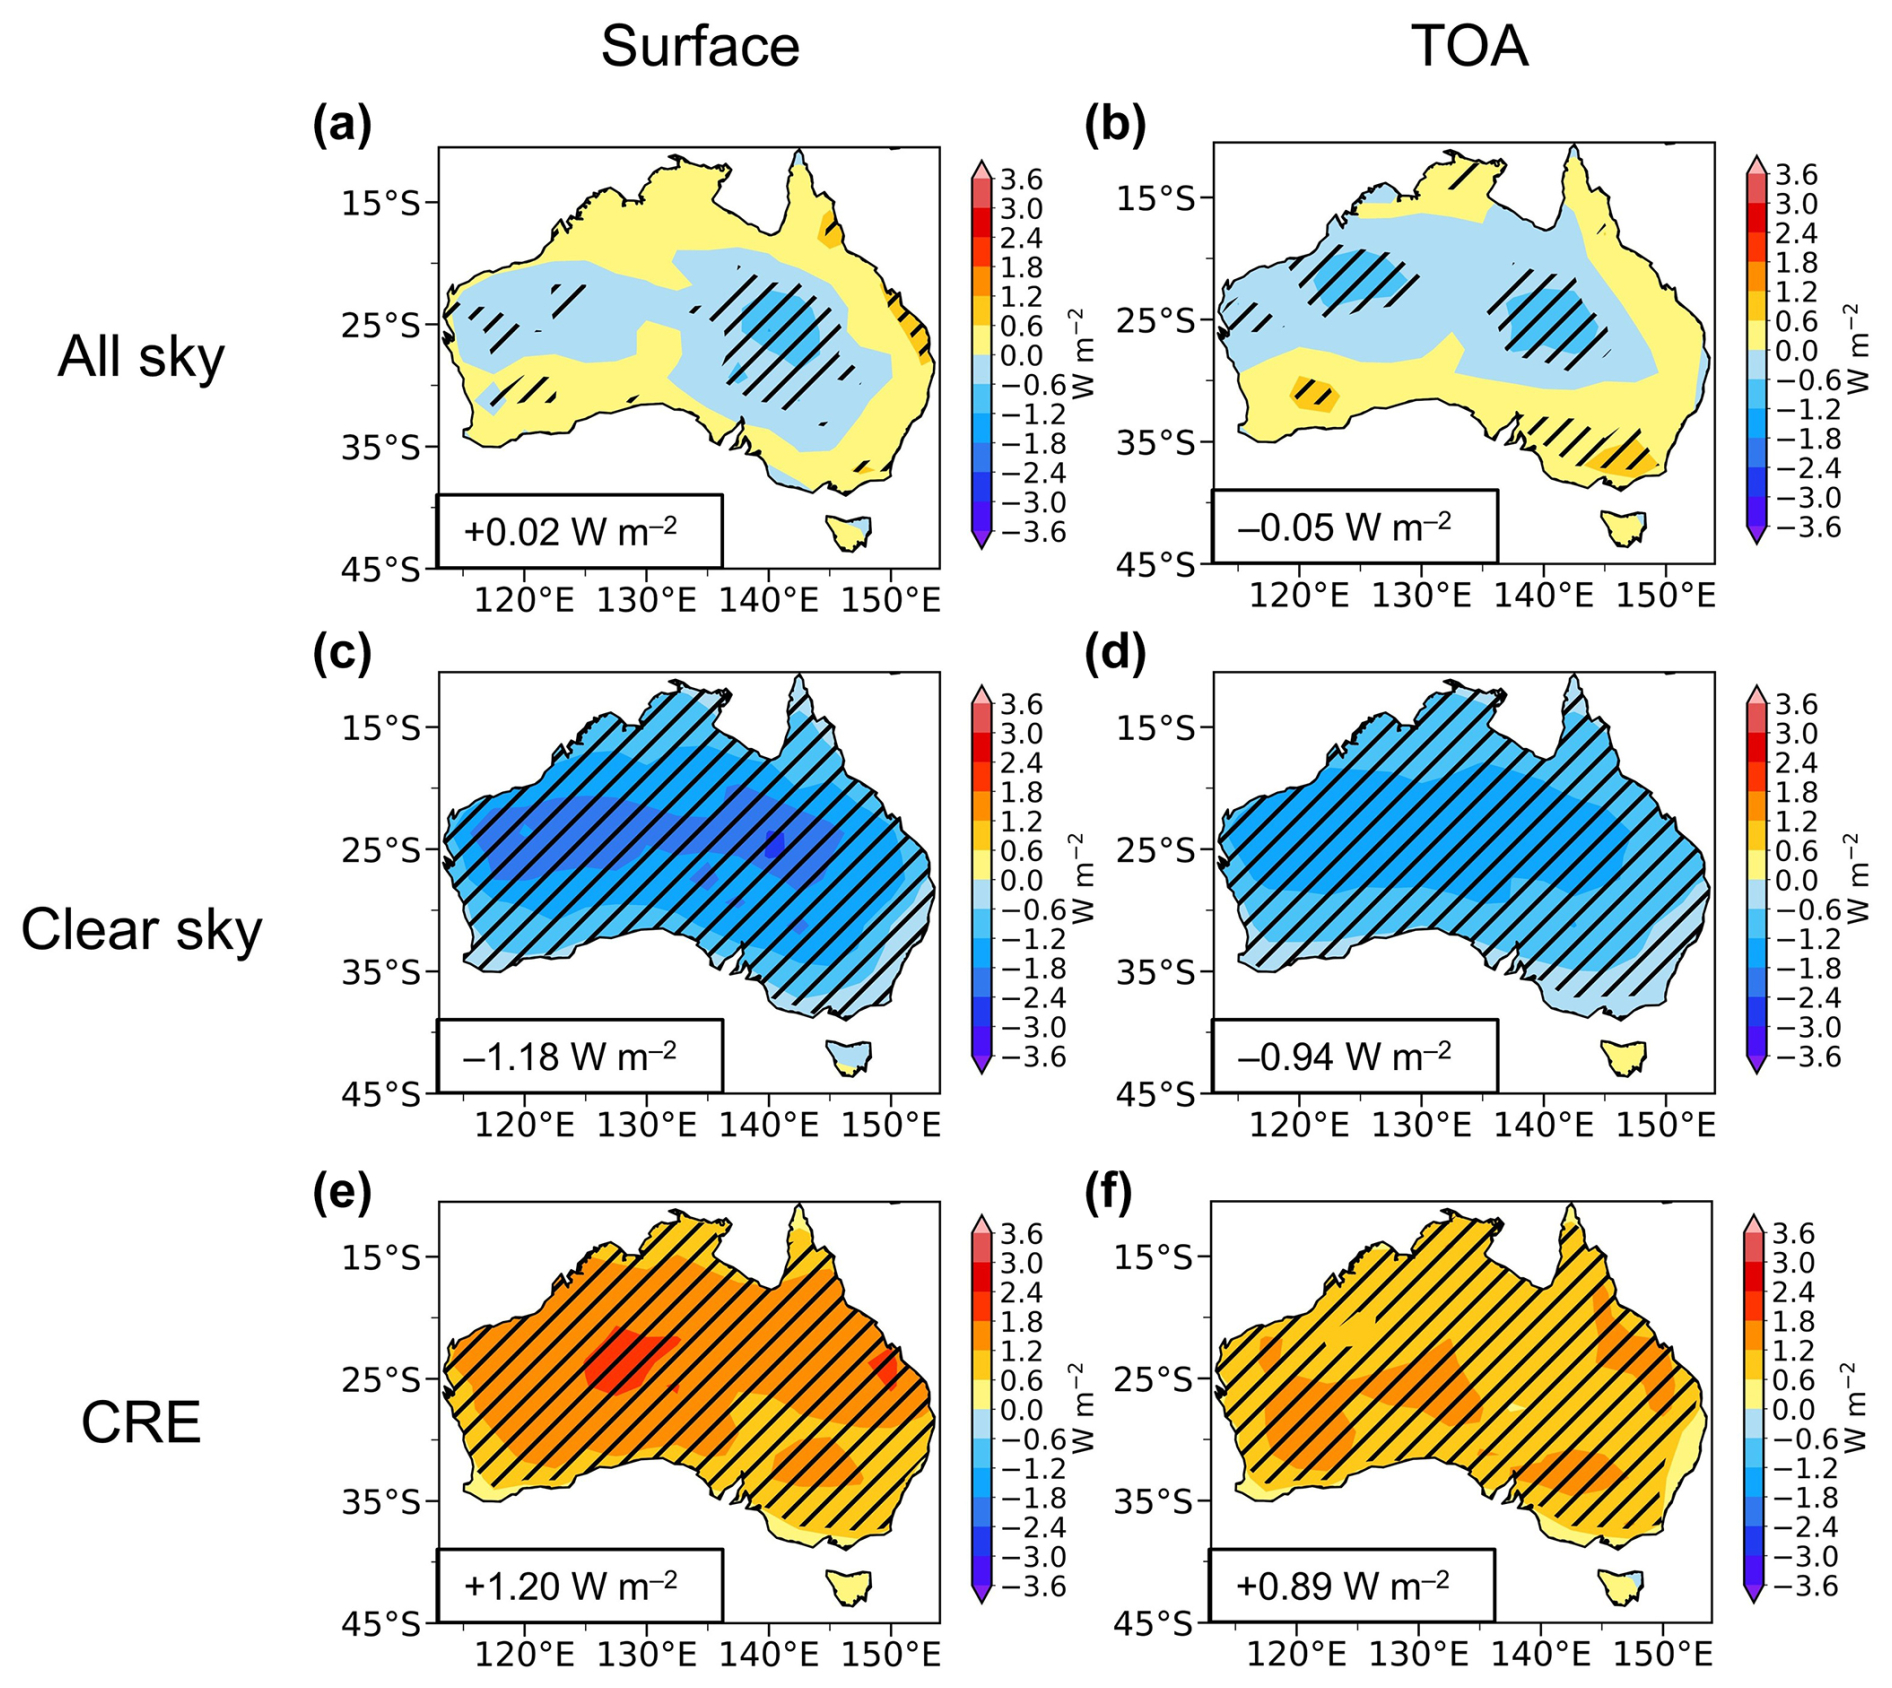
Figure 7Simulated changes in surface and Top of the Atmosphere (TOA) net total radiative flux under all sky conditions, under clear sky conditions, and from cloud radiative effects in Australia due to aerosol changes in China between 2013 and 2019. Spatial distributions of simulated differences in annual mean surface (a, c, e) and Top of the Atmosphere (TOA, (b), (d), and (f)) net total radiative flux (unit: W m−2) under all sky conditions (a, b), under clear sky conditions (c, d), and from cloud radiative effects (CRE, (e) and (f)) in Australia between BASE and CHN (CHN minus BASE). Cloud radiative effects refer to differences under all sky and clear sky conditions (All sky minus Clear sky). The shaded areas indicate results are statistically significant at the 90 % confidence level. Regional averages of the responses over Australia are noted at the bottom-left corner of each panel.
Decreases in precipitation lead to a decrease in surface specific humidity (Fig. S20a), which declines more than that at 850 hPa (Fig. S20b). This results in excess energy being converted into sensible heat rather than latent heat through evaporation (Chiang et al., 2018; Fischer et al., 2007; Seneviratne et al., 2006; Su et al., 2014), which is indicated by a decrease in surface upward latent heat flux and an increase in surface upward sensible heat flux in Australia due to aerosol changes in China in Fig. 8. The increased surface upward sensible heat flux heats the near-surface air and contributes to the warm conditions in Australia.
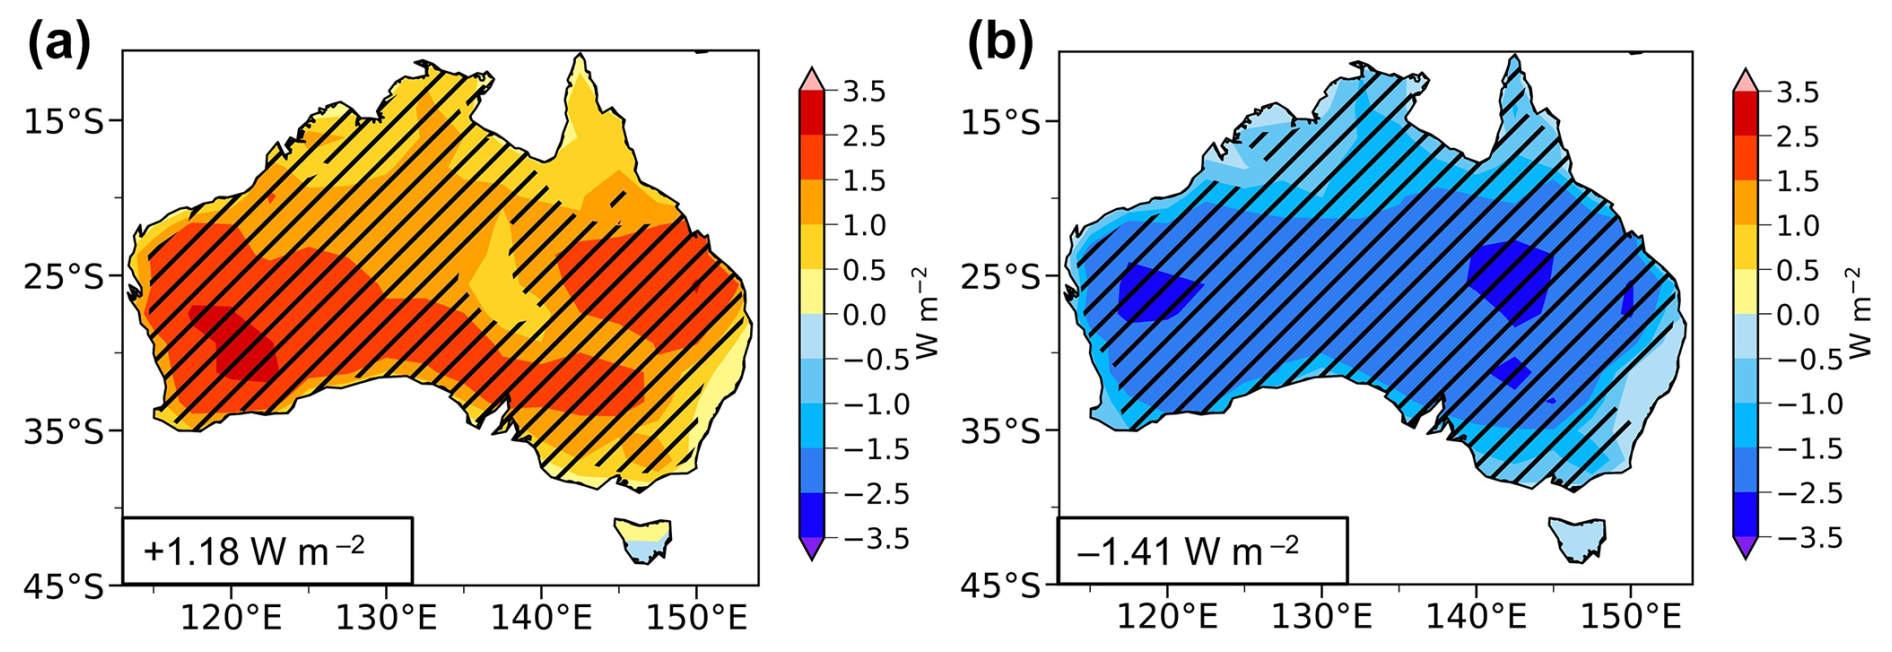
Figure 8Simulated changes in surface upward sensible and latent heat flux in Australia due to aerosol changes in China between 2013 and 2019. Spatial distributions of simulated differences in annual mean surface upward sensible (a) and latent (b) heat flux (unit: W m−2) in Australia between BASE and CHN (CHN minus BASE). The shaded areas indicate results are statistically significant at the 90 % confidence level. Regional averages over Australia are noted at the bottom-left corner of each panel.
3.3 Increases in Wildfire Risk in Australia
Wildfires represent a biosphere-atmosphere phenomenon, arising from the intricate interplay of weather, climate, fuels, and human activities (Moritz et al., 2014). Notably, wildfires are ranked among the most significant natural disasters in Australia, causing extensive damage (Shi et al., 2021). Collins et al. (2022) reported that warmer and drier conditions increased the potential for large and severe wildfire in Australia. Given that changes in aerosols in China have led to a warmer and drier climate condition in Australia in recent years, the change in this climate state could also impact on the occurrence of wildfires. Three wildfire risk indices (ET0, VPD, and FFDI) are selected to assess the risks of wildfires occurrence. Detailed information about the three wildfire risk indices can be found in the Methods section.
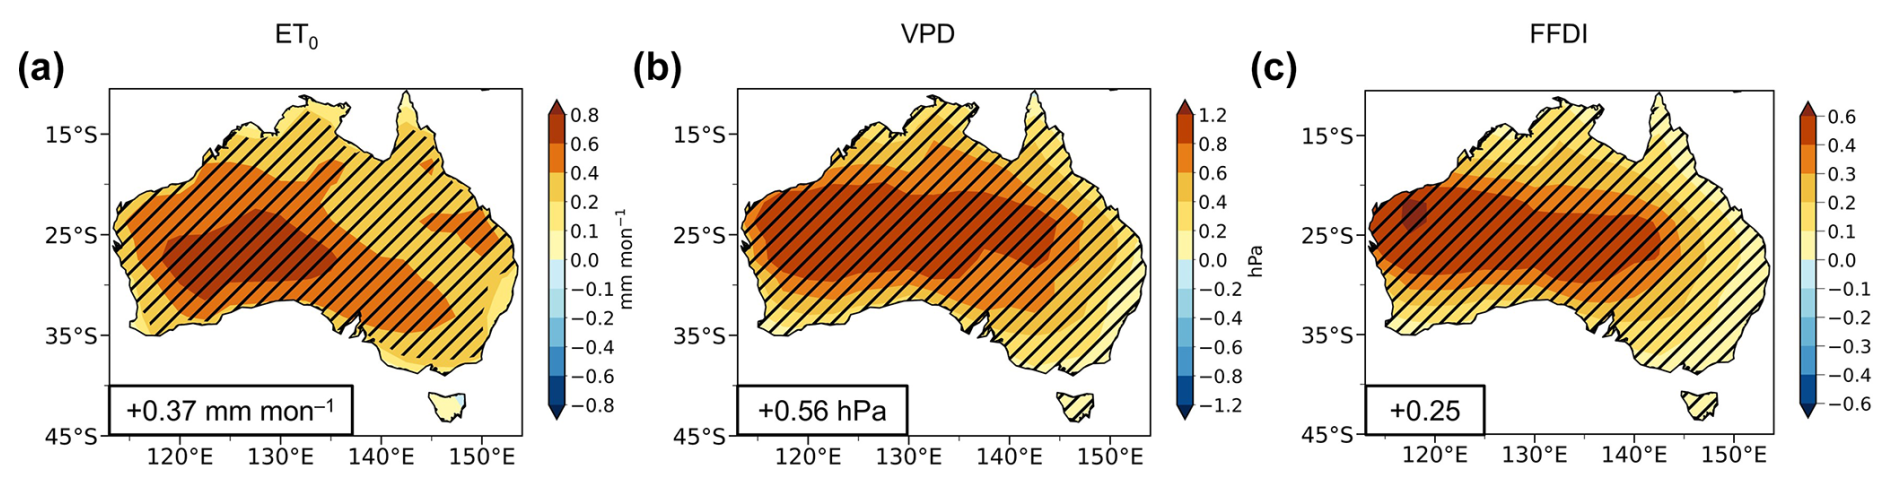
Figure 9Simulated changes in reference potential evapotranspiration, vapor pressure deficit, and McArthur forest fire danger index during fire seasons in Australia due to aerosol changes in China between 2013 and 2019. Spatial distributions of simulated changes in reference potential evapotranspiration (ET0, (a), unit: mm per month), vapor pressure deficit (VPD, (b), unit: hPa), and McArthur forest fire danger index (FFDI, (c), unitless) during fire seasons (austral spring and summer, from September to the February of the next year) in Australia between BASE and CHN (CHN minus BASE). The shaded areas indicate results are statistically significant at the 90 % confidence level. Regional averages over Australia are noted at the bottom-left corner of each panel.
All three indices exhibit increases (+0.37 mm per month for ET0, +0.56 hPa for VPD, and +0.25 for FFDI) during fire seasons (September to February) in Australia due to changes in aerosols in China during 2013–2019 (Fig. 9), although they do not show the same spatial distribution possibly due to different considerations regarding climate variables in the indices.
This study reveals that the substantial aerosol reduction in China can lead to drier and warmer conditions in Australia. Aerosol reductions in China induce changes in temperature and pressure gradients, which lead to an increased outflow from Asia towards the South Indian Ocean, strengthening the SISH and the associated Southern Trade Winds. Consequently, this atmospheric pattern results in moisture divergence over Australia, causing a decrease in humidity and precipitation. The reduction in surface moisture leads to more surface energy being converted into sensible heat, rather than evaporating as latent heat, thereby heating the near-surface air. This perspective sheds light on the influence of distant aerosols on climate in Australia. The CESM1 simulations depict warmer and drier conditions in Australia related to China's aerosol reductions than otherwise, a pattern also evident in observations represented by ERA5. It should be noted that the short-term precipitation trends examined in this study may be influenced by internal climate variability, especially given the relatively short period since 2013. Therefore, we extended the analysis back to around 2010, when emission reductions in China had already begun. We also performed additional analysis examining different time periods, including the 2013–2019 period (Fig. S21) and a longer period (2010–2023; Fig. S22). Both patterns consistently show a decreasing trend in Australia's precipitation, supporting the robustness of the recent drying trend in Australia. However, we acknowledge that these observed short-term trends could still be affected by internal climate variability, and the potential contribution from internal variability should not be ignored.
Although aerosol reductions may contribute to worsened climate conditions in Australia, air quality and human health improvements owing to aerosol reductions cannot be ignored (Giani et al., 2020; Zheng et al., 2017). In addition, the drier and warmer conditions in Australia linked to aerosol reductions should be considered resulting from the rise in long-lived GHGs, while the aerosol reductions unmask the effect rooted in the GHGs (Wang et al., 2023). In addition, other factors such as internal climate variability (Heidemann et al., 2023) appear to have contributed more to the changes in Australia's climate conditions.
Rotstayn et al. (2007) and Fahrenbach et al. (2023) investigated the impact of increasing anthropogenic aerosols over Asia during the late 20th century and early 21st century and indicated that enhanced aerosol emissions strengthened the meridional temperature and pressure gradients, intensifying the monsoonal circulation and leading to increased precipitation over Australia. In contrast, our study focuses on the reductions in anthropogenic aerosols in China, showing that the aerosol reductions reversed circulation changes induced by the previous aerosol increases and led to drying rather than increased rainfall over Australia. Our study also explores the subsequent impact of aerosol reductions in China on Australian temperature. We find that reduced moisture availability over Australia led to a shift in surface energy partitioning, with more energy being converted into sensible heat rather than latent heat, resulting in near-surface warming. In summary, while previous studies have demonstrated the role of increasing Asian aerosols in enhancing Australia's precipitation, our work complements these findings by showing that decreasing aerosols, particularly from China, can drive the opposite effect, leading to both drier and warmer conditions in Australia.
Liu et al. (2018) used multi-model simulations to investigate the fast and slow precipitation responses to regional aerosol forcing from Asia and Europe under the PDRMIP framework. They showed that Asian sulfate aerosols are strong drivers of global temperature and precipitation changes, with fast precipitation responses scaling with atmospheric absorption and slow responses scaling with surface temperature. However, their analysis focused on aerosol forcing from the entire Asian region, rather than emission reductions from China alone, and the precipitation responses over Australia were not significant in their results because of cancellation between the responses to aerosol changes in different parts of Asia. Hwang et al. (2024) explored the combined fast and slow climate responses to aerosol emission changes at the global scale. They highlighted that fast adjustments of atmospheric circulation and joint feedback between low clouds, wind, evaporation, and sea surface temperature, followed by slower oceanic responses, can sustain La Niña-like cooling patterns in the equatorial Pacific for decades. However, neither study specifically examined the climate impacts of China's recent emission reductions.
We acknowledge that fast and slow climate responses can have different mechanisms and regional impacts, and there can be differences between the slow and fast responses. Both fast and slow climate responses contribute to the simulated precipitation changes in Australia resulting from China's emission reductions. Fast responses are primarily driven by rapid atmospheric adjustments to aerosol-induced radiative forcing without requiring full ocean adjustment, while slow responses involve gradual changes mediated by ocean circulation and sea surface temperature adjustments over longer timescales. In our additional fast response experiments using the CAM5 atmospheric component, we found a decreasing pattern in Australia's precipitation (Fig. S23), which is consistent with the long-term equilibrium simulation results. Although the equilibrium simulations represent the fully adjusted climate system response and are not appropriate to be directly compared to short-term observational changes, the fast response experiments suggest that fast response has contributed 86 % to the fully climate response in the changing precipitation in Australia. It demonstrates that the immediate atmospheric response to Chinese aerosol reductions alone can produce a drying effect similar to that found in long-period equilibrium experiments, providing confidence in the robustness of the results.
One limitation of this study is the use of equilibrium experiments. Although the equilibrium method is useful for isolating aerosol-induced climate responses, it does not fully capture the transient climatic evolution. Attributing observed climate changes directly to modeled aerosol-induced responses involves inherent uncertainties. Given the uncertainties, here we did not attempt to quantitatively attribute the observed climate change to aerosols in this study, but showed the mechanisms that how aerosol decline influence remote climate. Future work could also consider transient simulations, which can better represent the role of aerosols in the climatic evolution of the real world.
There are some other potential uncertainties in this study. Firstly, the low bias in simulated aerosol concentrations in CESM1 and CESM1's larger sensitivity to aerosol forcing could introduce some uncertainties. Secondly, our findings are derived from simulations conducted with a single fully-coupled climate model, and it is vital for future research to employ multi-model ensemble simulations to reduce the possibility of model-dependent specific results. While the CMIP6 and PDRMIP (Precipitation Driver Response Model Intercomparison Project) can assist in minimizing such model dependencies, they also present certain drawbacks. Anthropogenic emissions input in CMIP6 inadequately accounts for aerosol reductions resulting from clean air actions in China since 2013 (Wang et al., 2021b). Additionally, CMIP6 considers aerosol changes globally, making it challenging to isolate effects specifically induced by changes in aerosols in China. The experimental design of PDRMIP, which scales the concentrations of sulfate and BC in Asia to ten times of their present-day levels, is generally idealistic and may not accurately and proportionally represent aerosol changes observed in the real world. Finally, in addition to aerosols, GHGs and nature variabilities also contribute to regional and global climate change. The extent to which GHGs and nature variabilities could contribute to weather condition and climate changes in Australia remains unknown, which warrants further investigation.
Nonetheless, our study examined how China's aerosol reductions could affect Australia's climate condition changes. Substantial emission reductions will continue in China following the carbon neutral pathway (Yang et al., 2023), while future changes in emissions in South Asia remain uncertain (Samset et al., 2019). Apart from natural climate variabilities that affect the Australian monsoon, further investigation of changes in monsoon precipitation in Australia should also consider the effects of remote aerosol changes simultaneously, which is crucial to effective drought and wildfire management and mitigation in Australia.
Ground-based observed PM2.5 concentrations from CNEMC are available at https://quotsoft.net/air/ (last access: September 2024) (CNEMC, 2024). AOD from MODIS Deep Blue retrieval are available at https://modis.gsfc.nasa.gov/ (last access: September 2024) (Platnick et al., 2015). ERA5 reanalysis data are available at https://cds.climate.copernicus.eu/ (last access: September 2024) (C3S, 2017). GPM data are available at https://doi.org/10.5067/GPM/IMERG/3B-MONTH/07 (Huffman et al., 2023). GPCP data are available at https://psl.noaa.gov/data/gridded/data.gpcp.html (last access: April 2025) (Adler et al., 2003). The source code of CESM (National Center for Atmospheric Research (NCAR), 2024) is available at https://github.com/ESCOMP/CESM (last access: September 2024) (NCAR, 2024). Our model results can be available at https://doi.org/10.5281/zenodo.13682943 (Gao, 2024).
The supplement related to this article is available online at https://doi.org/10.5194/acp-25-10949-2025-supplement.
YY conceived the research and directed the analysis. JG conceived the research, conducted the model simulations, and performed the analysis. All the authors including HW, PW, and HL discussed the results and wrote the paper.
At least one of the (co-)authors is a member of the editorial board of Atmospheric Chemistry and Physics. The peer-review process was guided by an independent editor, and the authors also have no other competing interests to declare.
Publisher's note: Copernicus Publications remains neutral with regard to jurisdictional claims made in the text, published maps, institutional affiliations, or any other geographical representation in this paper. While Copernicus Publications makes every effort to include appropriate place names, the final responsibility lies with the authors. Also, please note that this paper has not received English language copy-editing.
The Pacific Northwest National Laboratory (PNNL) is operated for DOE by the Battelle Memorial Institute under contract DE-AC05-76RLO1830.
This research has been supported by the National Natural Science Foundation of China (grant nos. 42475032 and 42521006), the Jiangsu Science Fund for Carbon Neutrality (grant no. BK20220031), Jiangsu Innovation and Entrepreneurship Team (grant no. JSSCTD202346), and Postgraduate Research Practice Innovation Program of Jiangsu Province (grant no. KYCX25_1669).
This paper was edited by Laura Wilcox and reviewed by two anonymous referees.
Adler, R. F., Huffman, G. J., Chang, A., Ferraro, R., Xie, P.-P., Janowiak, J., Rudolf, B., Schneider, U., Curtis, S., Bolvin, D., Gruber, A., Susskind, J., Arkin, P., and Nelkin, E.: Global Precipitation Climatology Project (GPCP) Monthly Analysis (Version 3.2), NOAA PSL [data set], https://psl.noaa.gov/data/gridded/data.gpcp.html (last access: April 2025), 2003.
Adler, R., Sapiano, M., Huffman, G., Wang, J.-J., Gu, G., Bolvin, D., Chiu, L., Schneider, U., Becker, A., Nelkin, E., Xie, P., Ferraro, R., and Shin, D.-B.: The Global Precipitation Climatology Project (GPCP) Monthly Analysis (New Version 2.3) and a Review of 2017 Global Precipitation, Atmosphere, 9, 138, https://doi.org/10.3390/atmos9040138, 2018.
Basha, G., Kishore, P., Venkat Ratnam, M., Ouarda, T. B. M. J., Velicogna, I., and Sutterley, T.: Vertical and latitudinal variation of the intertropical convergence zone derived using GPS radio occultation measurements, Remote Sens. Environ., 163, 262–269, https://doi.org/10.1016/j.rse.2015.03.024, 2015.
Beck, J. W., Zhou, W., Li, C., Wu, Z., White, L., Xian, F., Kong, X., and An, Z.: A 550,000-year record of East Asian monsoon rainfall from 10Be in loess, Science, 360, 877–881, https://doi.org/10.1126/science.aam5825, 2018.
Bollasina, M. A., Ming, Y., and Ramaswamy, V.: Anthropogenic Aerosols and the Weakening of the South Asian Summer Monsoon, Science, 334, 502–505, https://doi.org/10.1126/science.1204994, 2011.
Bollasina, M. A., Ming, Y., Ramaswamy, V., Schwarzkopf, M. D., and Naik, V.: Contribution of local and remote anthropogenic aerosols to the twentieth century weakening of the South Asian Monsoon, Geophys. Res. Lett., 41, 680–687, https://doi.org/10.1002/2013GL058183, 2014.
Chiang, F., Mazdiyasni, O., and AghaKouchak, A.: Amplified warming of droughts in southern United States in observations and model simulations, Sci. Adv., 4, eaat2380, https://doi.org/10.1126/sciadv.aat2380, 2018.
Chiang, J. C. H., Fung, I. Y., Wu, C.-H., Cai, Y., Edman, J. P., Liu, Y., Day, J. A., Bhattacharya, T., Mondal, Y., and Labrousse, C. A.: Role of seasonal transitions and westerly jets in East Asian paleoclimate, Quat. Sci. Rev., 108, 111–129, https://doi.org/10.1016/j.quascirev.2014.11.009, 2015.
CNEMC: Air Quality Historical Data, QuotSoft [data set], https://quotsoft.net/air/ (last access: September 2024), 2024.
Collins, L., Clarke, H., Clarke, M. F., McColl Gausden, S. C., Nolan, R. H., Penman, T., and Bradstock, R.: Warmer and drier conditions have increased the potential for large and severe fire seasons across south-eastern Australia, Glob. Ecol. Biogeogr., 31, 1933–1948, https://doi.org/10.1111/geb.13514, 2022.
Cook, B. I. and Seager, R.: The response of the North American Monsoon to increased greenhouse gas forcing, J. Geophys. Res.-Atmos., 118, 1690–1699, https://doi.org/10.1002/jgrd.50111, 2013.
Copernicus Climate Change Service (C3S): ERA5 monthly averaged data on single levels from 1940 to present, Copernicus Climate Change Service Climate Data Store (CDS) [data set], https://doi.org/10.24381/cds.f17050d7, 2017.
Cowan, T. and Cai, W.: The impact of Asian and non-Asian anthropogenic aerosols on 20th century Asian summer monsoon: Asian Monsoon And Aerosols, Geophys. Res. Lett., 38, L11703, https://doi.org/10.1029/2011GL047268, 2011.
CSIRO and BOM: State of the Climate 2022, Australia, https://www.csiro.au/en/research/environmental-impacts/climate-change/State-of-the-Climate/Previous/State-of-the-Climate-2022 (last access: September 2025), 2022.
Dang, R. and Liao, H.: Radiative Forcing and Health Impact of Aerosols and Ozone in China as the Consequence of Clean Air Actions over 2012–2017, Geophys. Res. Lett., 46, 12511–12519, https://doi.org/10.1029/2019GL084605, 2019.
Dey, R., Lewis, S. C., Arblaster, J. M., and Abram, N. J.: A review of past and projected changes in Australia's rainfall, WIREs Clim. Change, 10, e577, https://doi.org/10.1002/wcc.577, 2019a.
Dey, R., Lewis, S. C., and Abram, N. J.: Investigating observed northwest Australian rainfall trends in Coupled Model Intercomparison Project phase 5 detection and attribution experiments, Int. J. Climatol., 39, 112–127, https://doi.org/10.1002/joc.5788, 2019b.
Dong, B., Wilcox, L. J., Highwood, E. J., and Sutton, R. T.: Impacts of recent decadal changes in Asian aerosols on the East Asian summer monsoon: roles of aerosol–radiation and aerosol–cloud interactions, Clim. Dyn., 53, 3235–3256, https://doi.org/10.1007/s00382-019-04698-0, 2019.
Dowdy, A. J.: Seamless climate change projections and seasonal predictions for bushfires in Australia, J. South. Hemisph. Earth Syst. Sci., 70, 120–138, https://doi.org/10.1071/ES20001, 2020.
Evans, S., Marchand, R., and Ackerman, T.: Variability of the Australian Monsoon and Precipitation Trends at Darwin, J. Climate, 27, 8487–8500, https://doi.org/10.1175/JCLI-D-13-00422.1, 2014.
Fahrenbach, N. L. S., Bollasina, M. A., Samset, B. H., Cowan, T., and Ekman, A. M. L.: Asian anthropogenic aerosol forcing played a key role in the multi-decadal increase in Australian summer monsoon rainfall, J. Climate, 1, https://doi.org/10.1175/JCLI-D-23-0313.1, 2023.
Fan, T., Liu, X., Ma, P.-L., Zhang, Q., Li, Z., Jiang, Y., Zhang, F., Zhao, C., Yang, X., Wu, F., and Wang, Y.: Emission or atmospheric processes? An attempt to attribute the source of large bias of aerosols in eastern China simulated by global climate models, Atmos. Chem. Phys., 18, 1395–1417, https://doi.org/10.5194/acp-18-1395-2018, 2018.
Fan, T., Liu, X., Wu, C., Zhang, Q., Zhao, C., Yang, X., and Li, Y.: Comparison of the Anthropogenic Emission Inventory for CMIP6 Models with a Country-Level Inventory over China and the Simulations of the Aerosol Properties, Adv. Atmos. Sci., 39, 80–96, https://doi.org/10.1007/s00376-021-1119-6, 2022.
Fischer, E. M., Seneviratne, S. I., Lüthi, D., and Schär, C.: Contribution of land-atmosphere coupling to recent European summer heat waves, Geophys. Res. Lett., 34, 2006GL029068, https://doi.org/10.1029/2006GL029068, 2007.
Gallego, D., García-Herrera, R., Peña-Ortiz, C., and Ribera, P.: The steady enhancement of the Australian Summer Monsoon in the last 200 years, Sci. Rep., 7, 16166, https://doi.org/10.1038/s41598-017-16414-1, 2017.
Gao, J.: Data for “Drier and warmer conditions in Australia exacerbated by aerosol reduction in China”, Zenodo [data set], https://doi.org/10.5281/zenodo.13682943, 2024.
Gao, J., Yang, Y., Wang, H., Wang, P., Li, H., Li, M., Ren, L., Yue, X., and Liao, H.: Fast climate responses to emission reductions in aerosol and ozone precursors in China during 2013–2017, Atmos. Chem. Phys., 22, 7131–7142, https://doi.org/10.5194/acp-22-7131-2022, 2022.
Gao, J., Yang, Y., Wang, H., Wang, P., Li, B., Li, J., Wei, J., Gao, M., and Liao, H.: Climate responses in China to domestic and foreign aerosol changes due to clean air actions during 2013–2019, npj Clim. Atmos. Sci., 6, 160, https://doi.org/10.1038/s41612-023-00488-y, 2023.
Giani, P., Castruccio, S., Anav, A., Howard, D., Hu, W., and Crippa, P.: Short-term and long-term health impacts of air pollution reductions from COVID-19 lockdowns in China and Europe: a modelling study, Lancet Planet. Health, 4, e474–e482, https://doi.org/10.1016/S2542-5196(20)30224-2, 2020.
Guenther, A. B., Jiang, X., Heald, C. L., Sakulyanontvittaya, T., Duhl, T., Emmons, L. K., and Wang, X.: The Model of Emissions of Gases and Aerosols from Nature version 2.1 (MEGAN2.1): an extended and updated framework for modeling biogenic emissions, Geosci. Model Dev., 5, 1471–1492, https://doi.org/10.5194/gmd-5-1471-2012, 2012.
He, T., Lamont, B. B., and Pausas, J. G.: Fire as a key driver of Earth's biodiversity, Biol. Rev., 94, 1983–2010, https://doi.org/10.1111/brv.12544, 2019.
Head, L., Adams, M., McGregor, H. V., and Toole, S.: Climate change and Australia, WIREs Clim. Change, 5, 175–197, https://doi.org/10.1002/wcc.255, 2014.
Heidemann, H., Cowan, T., Henley, B. J., Ribbe, J., Freund, M., and Power, S.: Variability and long-term change in Australian monsoon rainfall: A review, WIREs Clim. Change, 14, e823, https://doi.org/10.1002/wcc.823, 2023.
Hersbach, H., Bell, B., Berrisford, P., Hirahara, S., Horányi, A., Muñoz-Sabater, J., Nicolas, J., Peubey, C., Radu, R., Schepers, D., Simmons, A., Soci, C., Abdalla, S., Abellan, X., Balsamo, G., Bechtold, P., Biavati, G., Bidlot, J., Bonavita, M., De Chiara, G., Dahlgren, P., Dee, D., Diamantakis, M., Dragani, R., Flemming, J., Forbes, R., Fuentes, M., Geer, A., Haimberger, L., Healy, S., Hogan, R. J., Hólm, E., Janisková, M., Keeley, S., Laloyaux, P., Lopez, P., Lupu, C., Radnoti, G., De Rosnay, P., Rozum, I., Vamborg, F., Villaume, S., and Thépaut, J.: The ERA5 global reanalysis, Q. J. R. Meteorol. Soc., 146, 1999–2049, https://doi.org/10.1002/qj.3803, 2020.
Hoesly, R. M., Smith, S. J., Feng, L., Klimont, Z., Janssens-Maenhout, G., Pitkanen, T., Seibert, J. J., Vu, L., Andres, R. J., Bolt, R. M., Bond, T. C., Dawidowski, L., Kholod, N., Kurokawa, J.-I., Li, M., Liu, L., Lu, Z., Moura, M. C. P., O'Rourke, P. R., and Zhang, Q.: Historical (1750–2014) anthropogenic emissions of reactive gases and aerosols from the Community Emissions Data System (CEDS), Geosci. Model Dev., 11, 369–408, https://doi.org/10.5194/gmd-11-369-2018, 2018.
Hsu, N. C., Jeong, M. -J., Bettenhausen, C., Sayer, A. M., Hansell, R., Seftor, C. S., Huang, J., and Tsay, S. -C.: Enhanced Deep Blue aerosol retrieval algorithm: The second generation, J. Geophys. Res.-Atmos., 118, 9296–9315, https://doi.org/10.1002/jgrd.50712, 2013.
Huffman, G. J., Stocker, E. F., Bolvin, D. T., Nelkin, E. J., and Tan, J.: GPM IMERG Final Precipitation L3 1 month 0.1 degree x 0.1 degree V07, Goddard Earth Sciences Data and Information Services Center (GES DISC), Greenbelt, MD [data set], https://doi.org/10.5067/GPM/IMERG/3B-MONTH/07 2023.
Hwang, Y.-T., Xie, S.-P., Chen, P.-J., Tseng, H.-Y., and Deser, C.: Contribution of anthropogenic aerosols to persistent La Niña-like conditions in the early 21st century, Proc. Natl. Acad. Sci., 121, e2315124121, https://doi.org/10.1073/pnas.2315124121, 2024.
IPCC: Climate Change 2013: The Physical Science Basis, https://doi.org/10.1017/CBO9781107415324, 2013.
IPCC: Climate Change 2021: The Physical Science Basis, https://doi.org/10.1017/9781009157896, 2021.
Irmak, S., Irmak, A., Allen, R. G., and Jones, J. W.: Solar and Net Radiation-Based Equations to Estimate Reference Evapotranspiration in Humid Climates, J. Irrig. Drain. Eng., 129, 336–347, https://doi.org/10.1061/(ASCE)0733-9437(2003)129:5(336), 2003.
Johnston, F. H., Borchers-Arriagada, N., Morgan, G. G., Jalaludin, B., Palmer, A. J., Williamson, G. J., and Bowman, D. M. J. S.: Unprecedented health costs of smoke-related PM2.5 from the 2019–20 Australian megafires, Nat. Sustain., 4, 42–47, https://doi.org/10.1038/s41893-020-00610-5, 2021.
Jones, M. W., Abatzoglou, J. T., Veraverbeke, S., Andela, N., Lasslop, G., Forkel, M., Smith, A. J. P., Burton, C., Betts, R. A., van der Werf, G. R., Sitch, S., Canadell, J. G., Santín, C., Kolden, C., Doerr, S. H., and Le Quéré, C.: Global and Regional Trends and Drivers of Fire Under Climate Change, Rev. Geophys., 60, e2020RG000726, https://doi.org/10.1029/2020RG000726, 2022.
Kloster, S., Dentener, F., Feichter, J., Raes, F., Lohmann, U., Roeckner, E., and Fischer-Bruns, I.: A GCM study of future climate response to aerosol pollution reductions, Clim. Dyn., 34, 1177–1194, https://doi.org/10.1007/s00382-009-0573-0, 2010.
Leibensperger, E. M., Mickley, L. J., Jacob, D. J., Chen, W.-T., Seinfeld, J. H., Nenes, A., Adams, P. J., Streets, D. G., Kumar, N., and Rind, D.: Climatic effects of 1950–2050 changes in US anthropogenic aerosols – Part 1: Aerosol trends and radiative forcing, Atmos. Chem. Phys., 12, 3333–3348, https://doi.org/10.5194/acp-12-3333-2012, 2012.
Liu, C., Yang, Y., Wang, H., Ren, L., Wei, J., Wang, P., and Liao, H.: Influence of Spatial Dipole Pattern in Asian Aerosol Changes on East Asian Summer Monsoon, J. Climate, 36, 1575–1585, https://doi.org/10.1175/JCLI-D-22-0335.1, 2023.
Liu, L., Shawki, D., Voulgarakis, A., Kasoar, M., Samset, B. H., Myhre, G., Forster, P. M., Hodnebrog, Ø., Sillmann, J., Aalbergsjø, S. G., Boucher, O., Faluvegi, G., Iversen, T., Kirkevåg, A., Lamarque, J.-F., Olivié, D., Richardson, T., Shindell, D., and Takemura, T.: A PDRMIP Multimodel Study on the Impacts of Regional Aerosol Forcings on Global and Regional Precipitation, J. Climate, 31, 4429–4447, https://doi.org/10.1175/JCLI-D-17-0439.1, 2018.
Liu, X., Ma, P.-L., Wang, H., Tilmes, S., Singh, B., Easter, R. C., Ghan, S. J., and Rasch, P. J.: Description and evaluation of a new four-mode version of the Modal Aerosol Module (MAM4) within version 5.3 of the Community Atmosphere Model, Geosci. Model Dev., 9, 505–522, https://doi.org/10.5194/gmd-9-505-2016, 2016.
Moritz, M. A., Batllori, E., Bradstock, R. A., Gill, A. M., Handmer, J., Hessburg, P. F., Leonard, J., McCaffrey, S., Odion, D. C., Schoennagel, T., and Syphard, A. D.: Learning to coexist with wildfire, Nature, 515, 58–66, https://doi.org/10.1038/nature13946, 2014.
National Center for Atmospheric Research (NCAR): Community Earth System Model (CESM), GitHub [code], https://github.com/ESCOMP/CESM (last access: September 2024), 2024.
Nicholls, N.: Detecting and attributing Australian climate change: a review, Aust. Meteorol. Mag., https://doi.org/10.1002/ppp3.70090, 2006.
Oh, H. and Ha, K.-J.: Thermodynamic characteristics and responses to ENSO of dominant intraseasonal modes in the East Asian summer monsoon, Clim. Dyn., 44, 1751–1766, https://doi.org/10.1007/s00382-014-2268-4, 2015.
Platnick, S., Hubanks, P., Meyer, K., and King, M. D.: MODIS Atmosphere L3 Monthly Product, NASA MODIS Adaptive Processing System [data set], https://doi.org/10.5067/MODIS/MOD08_M3.061, 2015.
Pozzoli, L., Janssens-Maenhout, G., Diehl, T., Bey, I., Schultz, M. G., Feichter, J., Vignati, E., and Dentener, F.: Re-analysis of tropospheric sulfate aerosol and ozone for the period 1980–2005 using the aerosol-chemistry-climate model ECHAM5-HAMMOZ, Atmos. Chem. Phys., 11, 9563–9594, https://doi.org/10.5194/acp-11-9563-2011, 2011.
Rauniyar, S. P. and Power, S. B.: The Impact of Anthropogenic Forcing and Natural Processes on Past, Present, and Future Rainfall over Victoria, Australia, J. Climate, 33, 8087–8106, https://doi.org/10.1175/JCLI-D-19-0759.1, 2020.
Ren, L., Yang, Y., Wang, H., Wang, P., Yue, X., and Liao, H.: Widespread Wildfires Over the Western United States in 2020 Linked to Emissions Reductions During COVID-19, Geophys. Res. Lett., 49, e2022GL099308, https://doi.org/10.1029/2022GL099308, 2022.
Risbey, J. S., Pook, M. J., McIntosh, P. C., Wheeler, M. C., and Hendon, H. H.: On the Remote Drivers of Rainfall Variability in Australia, Mon. Wea. Rev., 137, 3233–3253, https://doi.org/10.1175/2009MWR2861.1, 2009.
Rotstayn, L. D., Cai, W., Dix, M. R., Farquhar, G. D., Feng, Y., Ginoux, P., Herzog, M., Ito, A., Penner, J. E., Roderick, M. L., and Wang, M.: Have Australian rainfall and cloudiness increased due to the remote effects of Asian anthropogenic aerosols?, J. Geophys. Res.-Atmos., 112, 2006JD007712, https://doi.org/10.1029/2006JD007712, 2007.
Samset, B. H., Lund, M. T., Bollasina, M., Myhre, G., and Wilcox, L.: Emerging Asian aerosol patterns, Nat. Geosci., 12, 582–584, https://doi.org/10.1038/s41561-019-0424-5, 2019.
Schiemann, R., Lüthi, D., and Schär, C.: Seasonality and Interannual Variability of the Westerly Jet in the Tibetan Plateau Region, J. Climate, 22, 2940–2957, https://doi.org/10.1175/2008JCLI2625.1, 2009.
Seager, R., Hooks, A., Williams, A. P., Cook, B., Nakamura, J., and Henderson, N.: Climatology, Variability, and Trends in the U.S. Vapor Pressure Deficit, an Important Fire-Related Meteorological Quantity, J. Appl. Meteorol. Clim., 54, 1121–1141, https://doi.org/10.1175/JAMC-D-14-0321.1, 2015.
Seneviratne, S. I., Lüthi, D., Litschi, M., and Schär, C.: Land–atmosphere coupling and climate change in Europe, Nature, 443, 205–209, https://doi.org/10.1038/nature05095, 2006.
Sharples, J. J., McRae, R. H. D., Weber, R. O., and Gill, A. M.: A simple index for assessing fire danger rating, Environ. Modell. Softw., 24, 764–774, https://doi.org/10.1016/j.envsoft.2008.11.004, 2009.
Shi, G., Yan, H., Zhang, W., Dodson, J., Heijnis, H., and Burrows, M.: Rapid warming has resulted in more wildfires in northeastern Australia, Sci. Total Environ., 771, 144888, https://doi.org/10.1016/j.scitotenv.2020.144888, 2021.
Skofronick-Jackson, G., Petersen, W. A., Berg, W., Kidd, C., Stocker, E. F., Kirschbaum, D. B., Kakar, R., Braun, S. A., Huffman, G. J., Iguchi, T., Kirstetter, P. E., Kummerow, C., Meneghini, R., Oki, R., Olson, W. S., Takayabu, Y. N., Furukawa, K., and Wilheit, T.: The Global Precipitation Measurement (GPM) Mission for Science and Society, Bull. Am. Meteorol. Soc., 98, 1679–1695, https://doi.org/10.1175/BAMS-D-15-00306.1, 2017.
Su, H., Yang, Z., Dickinson, R. E., and Wei, J.: Spring soil moisture-precipitation feedback in the Southern Great Plains: How is it related to large-scale atmospheric conditions?, Geophys. Res. Lett., 41, 1283–1289, https://doi.org/10.1002/2013GL058931, 2014.
Turnock, S. T., Allen, R. J., Andrews, M., Bauer, S. E., Deushi, M., Emmons, L., Good, P., Horowitz, L., John, J. G., Michou, M., Nabat, P., Naik, V., Neubauer, D., O'Connor, F. M., Olivié, D., Oshima, N., Schulz, M., Sellar, A., Shim, S., Takemura, T., Tilmes, S., Tsigaridis, K., Wu, T., and Zhang, J.: Historical and future changes in air pollutants from CMIP6 models, Atmos. Chem. Phys., 20, 14547–14579, https://doi.org/10.5194/acp-20-14547-2020, 2020.
Undorf, S., Polson, D., Bollasina, M. A., Ming, Y., Schurer, A., and Hegerl, G. C.: Detectable Impact of Local and Remote Anthropogenic Aerosols on the 20th Century Changes of West African and South Asian Monsoon Precipitation, J. Geophys. Res.-Atmos., 123, 4871–4889, https://doi.org/10.1029/2017JD027711, 2018.
van Marle, M. J. E., Kloster, S., Magi, B. I., Marlon, J. R., Daniau, A.-L., Field, R. D., Arneth, A., Forrest, M., Hantson, S., Kehrwald, N. M., Knorr, W., Lasslop, G., Li, F., Mangeon, S., Yue, C., Kaiser, J. W., and van der Werf, G. R.: Historic global biomass burning emissions for CMIP6 (BB4CMIP) based on merging satellite observations with proxies and fire models (1750–2015), Geosci. Model Dev., 10, 3329–3357, https://doi.org/10.5194/gmd-10-3329-2017, 2017.
Wang, B., Biasutti, M., Byrne, M. P., Castro, C., Chang, C.-P., Cook, K., Fu, R., Grimm, A. M., Ha, K.-J., Hendon, H., Kitoh, A., Krishnan, R., Lee, J.-Y., Li, J., Liu, J., Moise, A., Pascale, S., Roxy, M. K., Seth, A., Sui, C.-H., Turner, A., Yang, S., Yun, K.-S., Zhang, L., and Zhou, T.: Monsoons Climate Change Assessment, Bull. Am. Meteorol. Soc., 102, E1–E19, https://doi.org/10.1175/BAMS-D-19-0335.1, 2021a.
Wang, H., Easter, R. C., Rasch, P. J., Wang, M., Liu, X., Ghan, S. J., Qian, Y., Yoon, J.-H., Ma, P.-L., and Vinoj, V.: Sensitivity of remote aerosol distributions to representation of cloud–aerosol interactions in a global climate model, Geosci. Model Dev., 6, 765–782, https://doi.org/10.5194/gmd-6-765-2013, 2013.
Wang, P., Yang, Y., Xue, D., Ren, L., Tang, J., Leung, L. R., and Liao, H.: Aerosols overtake greenhouse gases causing a warmer climate and more weather extremes toward carbon neutrality, Nat. Commun., 14, 7257, https://doi.org/10.1038/s41467-023-42891-2, 2023.
Wang, Z., Zhang, H., and Zhang, X.: Projected response of East Asian summer monsoon system to future reductions in emissions of anthropogenic aerosols and their precursors, Clim. Dyn., 47, 1455–1468, https://doi.org/10.1007/s00382-015-2912-7, 2016.
Wang, Z., Lin, L., Xu, Y., Che, H., Zhang, X., Zhang, H., Dong, W., Wang, C., Gui, K., and Xie, B.: Incorrect Asian aerosols affecting the attribution and projection of regional climate change in CMIP6 models, npj Clim. Atmos. Sci., 4, 2, https://doi.org/10.1038/s41612-020-00159-2, 2021b.
Ward, M., Tulloch, A. I. T., Radford, J. Q., Williams, B. A., Reside, A. E., Macdonald, S. L., Mayfield, H. J., Maron, M., Possingham, H. P., Vine, S. J., O'Connor, J. L., Massingham, E. J., Greenville, A. C., Woinarski, J. C. Z., Garnett, S. T., Lintermans, M., Scheele, B. C., Carwardine, J., Nimmo, D. G., Lindenmayer, D. B., Kooyman, R. M., Simmonds, J. S., Sonter, L. J., and Watson, J. E. M.: Impact of 2019–2020 mega-fires on Australian fauna habitat, Nat. Ecol. Evol., 4, 1321–1326, https://doi.org/10.1038/s41559-020-1251-1, 2020.
Wasko, C., Shao, Y., Vogel, E., Wilson, L., Wang, Q. J., Frost, A., and Donnelly, C.: Understanding trends in hydrologic extremes across Australia, J. Hydrol., 593, 125877, https://doi.org/10.1016/j.jhydrol.2020.125877, 2021.
Yang, Y., Zeng, L., Wang, H., Wang, P., and Liao, H.: Climate effects of future aerosol reductions for achieving carbon neutrality in China, Sci. Bull., 68, 902–905, https://doi.org/10.1016/j.scib.2023.03.048, 2023.
Zacharakis, I. and Tsihrintzis, V. A.: Integrated wildfire danger models and factors: A review, Sci. Total Environ., 899, 165704, https://doi.org/10.1016/j.scitotenv.2023.165704, 2023.
Zeng, L., Yang, Y., Wang, H., Wang, J., Li, J., Ren, L., Li, H., Zhou, Y., Wang, P., and Liao, H.: Intensified modulation of winter aerosol pollution in China by El Niño with short duration, Atmos. Chem. Phys., 21, 10745–10761, https://doi.org/10.5194/acp-21-10745-2021, 2021.
Zhang, Q., Zheng, Y., Tong, D., Shao, M., Wang, S., Zhang, Y., Xu, X., Wang, J., He, H., Liu, W., Ding, Y., Lei, Y., Li, J., Wang, Z., Zhang, X., Wang, Y., Cheng, J., Liu, Y., Shi, Q., Yan, L., Geng, G., Hong, C., Li, M., Liu, F., Zheng, B., Cao, J., Ding, A., Gao, J., Fu, Q., Huo, J., Liu, B., Liu, Z., Yang, F., He, K., and Hao, J.: Drivers of improved PM2.5 air quality in China from 2013 to 2017, Proc. Natl. Acad. Sci., 116, 24463–24469, https://doi.org/10.1073/pnas.1907956116, 2019.
Zheng, B., Tong, D., Li, M., Liu, F., Hong, C., Geng, G., Li, H., Li, X., Peng, L., Qi, J., Yan, L., Zhang, Y., Zhao, H., Zheng, Y., He, K., and Zhang, Q.: Trends in China's anthropogenic emissions since 2010 as the consequence of clean air actions, Atmos. Chem. Phys., 18, 14095–14111, https://doi.org/10.5194/acp-18-14095-2018, 2018.
Zheng, Y., Xue, T., Zhang, Q., Geng, G., Tong, D., Li, X., and He, K.: Air quality improvements and health benefits from China's clean air action since 2013, Environ. Res. Lett., 12, 114020, https://doi.org/10.1088/1748-9326/aa8a32, 2017.
Zheng, Y., Zhang, Q., Tong, D., Davis, S. J., and Caldeira, K.: Climate effects of China's efforts to improve its air quality, Environ. Res. Lett., 15, 104052, https://doi.org/10.1088/1748-9326/ab9e21, 2020.