the Creative Commons Attribution 4.0 License.
the Creative Commons Attribution 4.0 License.
 | 17 Sep 2025
Sectoral contributions of high-emitting methane point sources from major US onshore oil and gas producing basins using airborne measurements from MethaneAIR
Maryann Sargent
James P. Williams
Mark Omara
Christopher C. Miller
Sebastien Roche
Katlyn MacKay
Ethan Manninen
Apisada Chulakadabba
Anthony Himmelberger
Joshua Benmergui
Zhan Zhang
Luis Guanter
Steve Wofsy
Ritesh Gautam
High-emitting methane point sources, quantified by remote sensing methods at individual facilities, have gained significant interest for enabling rapid monitoring and mitigation of methane emissions from the oil and gas sector. Here, we present new methane point source quantifications from MethaneAIR, the airborne precursor to MethaneSAT, from campaigns in 2021–2023, which targeted major oil and gas basins covering ∼ 80 % of US onshore production. Flying at ∼ 12 km above ground, MethaneAIR provides wide-area methane mapping and high-resolution measurements of high-emitting methane point sources. Across 13 major basins, MethaneAIR detected over 400 point sources with emission rates , for which we performed detailed attribution to facility categories within oil and gas and non-oil and gas sectors. In 2023, we quantified total point source methane emissions of 357 t h−1 (95 % confidence interval: 277–435 t h−1), with ∼ 80 % of the total attributable to oil and gas sources. Non-oil and gas sources made up 50 %–80 % of observed point source emissions in certain basins, with coal facilities in the Appalachian Basin being the largest source of non-oil and gas methane emissions (30–40 t h−1). We observe emission source intermittency and significant variation across facility types and basins, highlighting the complex characteristics of high-emitting point sources. Our results emphasize the importance of detailed source attribution for prioritizing mitigation efforts and provide the first analysis of methane point sources in several regions, which will be improved by the observational capabilities of a growing set of methane satellites.
- Article
(6814 KB) - Full-text XML
-
Supplement
(1706 KB) - BibTeX
- EndNote


Methane is a short-lived greenhouse gas responsible for over a quarter of today's warming (Ocko et al., 2018). Multinational agreements, including the Global Methane Pledge (https://www.globalmethanepledge.org/, last access: 18 August 2025), have pledged to reduce anthropogenic methane emissions 30 % by 2030, with a specific focus on emissions coming from the oil and gas industry that make up approximately a quarter of anthropogenic methane emissions (IEA, 2024). National inventories of methane emissions, such as the EPA Greenhouse Gas Inventory (EPA, 2025), offer a way for nations to identify dominant sources of methane emissions and prioritize mitigation efforts. However, peer-reviewed measurement-based studies have consistently found substantial underestimation – generally by a factor of 2× – of the magnitude of total oil and gas methane emissions when compared with official “bottom-up” inventories (Alvarez et al., 2018; Lu et al., 2023; Shen et al., 2022). Previous research suggests that a key contributor to this gap comes from a small number of high-emitting methane point sources (Brandt et al., 2014; Omara et al., 2018; Zavala-Araiza et al., 2017), whose contributions to regional and national methane emissions are not adequately accounted for in “bottom-up” source-level inventory data and methods.
High-emitting oil and gas methane point sources, with individual methane emission rates generally of the order of several tens to thousands of kg h−1 methane emissions (Varon et al., 2018; Cusworth et al., 2022; Irakulis-Loitxate et al., 2021), are often the result of intentional and unplanned emission venting due to abnormal process conditions, including equipment malfunctions and blowdowns (Duren et al., 2019; Zavala-Araiza et al., 2017). These emissions can be short in duration (Tullos et al., 2021), but recent research suggests that point source emissions may be persistent or recurring in many cases (Cusworth et al., 2021). Several studies using airborne spectrometers and lidar have demonstrated the ability to quantify methane point sources across several regions in the United States (Cusworth et al., 2022; Kunkel et al., 2023; Sherwin et al., 2024). Research by Cusworth et al. (2022) comparing point source quantifications to overlapping satellite-based inversions showed that methane point sources – above a minimum detection limit of 10 kg h−1 – from all sectors can contribute up to 13 %–59 % of total regional flux in certain US basins. Globally, sources with individual facility-level methane emissions greater than approximately 10 t h−1 are estimated to contribute 8 %–12 % (∼ 8 Tg yr−1) of total global oil and gas production methane emissions (Lauvaux et al., 2022).
Previous research of high-emitting methane point sources has indicated variation in the overall contribution from oil and gas industry segments (e.g., upstream versus midstream facilities) from basin to basin (Cusworth et al., 2022). Additionally, large point sources can occur at non-oil and gas facilities, such as landfills (Cusworth et al., 2024) or coal mines (Sadavarte et al., 2022), and can possibly contribute a significant portion of emissions in specific oil and gas basins. However, the investigations of large point sources by facility types have been limited to a relatively few basins in the United States (Cusworth et al., 2022; Sherwin et al., 2024), with most research focusing on the Permian Basin (Chen et al., 2022; Cusworth et al., 2021; Kunkel et al., 2023; Yu et al., 2022), the largest oil producing basin in the United States (Enverus, 2025), and where almost all high-emitting methane point source emissions originate from oil and gas sources. Given that operational practices and emission dynamics can change over time (Lyon et al., 2021), there is a strong need to close the geographic and temporal gaps in high-resolution remote sensing measurements of methane point sources to characterize emissions magnitude and variation across basins.
In this study we use MethaneAIR, an airborne imaging spectrometer with capabilities of quantifying both high-emitting methane point sources and diffuse area emissions, to investigate the trends and magnitude of point source emissions in the United States. MethaneAIR is the precursor instrument to the MethaneSAT satellite mission and is designed to fly at a 12 km altitude and observe a 4.5 km swath. The aircraft has much greater spatial coverage than other airborne spectrometers currently used to detect methane emissions yet still maintains high enough spatial resolution to enable facility level investigations (Staebell et al., 2021). We use MethaneAIR's flights from 2021–2023 to explore the contribution of methane emissions from over 400 high-emitting methane point sources across all major oil and gas regions in the United States, many of which have been previously unexplored in the literature. Using these novel point source quantifications, we investigate and address the following three-fold objectives: (i) what is the estimated distribution and contribution of high-emitting methane point emissions for major basins in the United States across a varying mix of oil and gas and non-oil and gas methane sources? (ii) For basins previously explored in the literature, is there evidence that high-emitting methane point source emissions have changed over time? (iii) How does the relative sectoral contribution of high-emitting methane point sources vary basin to basin? Overall, the results of this work shine new light on the characteristics of high-emitting methane point sources and emphasize the importance of detailed methane source attribution for prioritizing mitigation efforts while providing the first analysis of methane point sources in several key US oil and gas production regions previously unexplored in the literature.
2.1 An overview of the MethaneAIR instrument and 2021–2023 measurement campaigns
Detailed descriptions of the MethaneAIR instrument's calibration (Conway et al., 2024; Staebell et al., 2021), retrieval methods (Chan Miller et al., 2024), point source quantification (Chulakadabba et al., 2023), and controlled-release validation (Abbadi et al., 2024) are explored at length in prior studies. MethaneAIR is an infrared imaging spectrometer which uses a CO2 proxy retrieval to calculate column xCH4. In 2021 and 2022, the MethaneAIR instrument was flown aboard the NCAR GV aircraft over a few select oil and gas regions (Permian, Uinta, and Anadarko basins). In 2023, the instrument was flown aboard a modified Learjet aircraft and collected observations for 64 flight days between 25 May and 15 October. MethaneAIR flew over all major US onshore oil and gas regions (Fig. 1), with a goal of observing at least 80 % of onshore production within a single year.
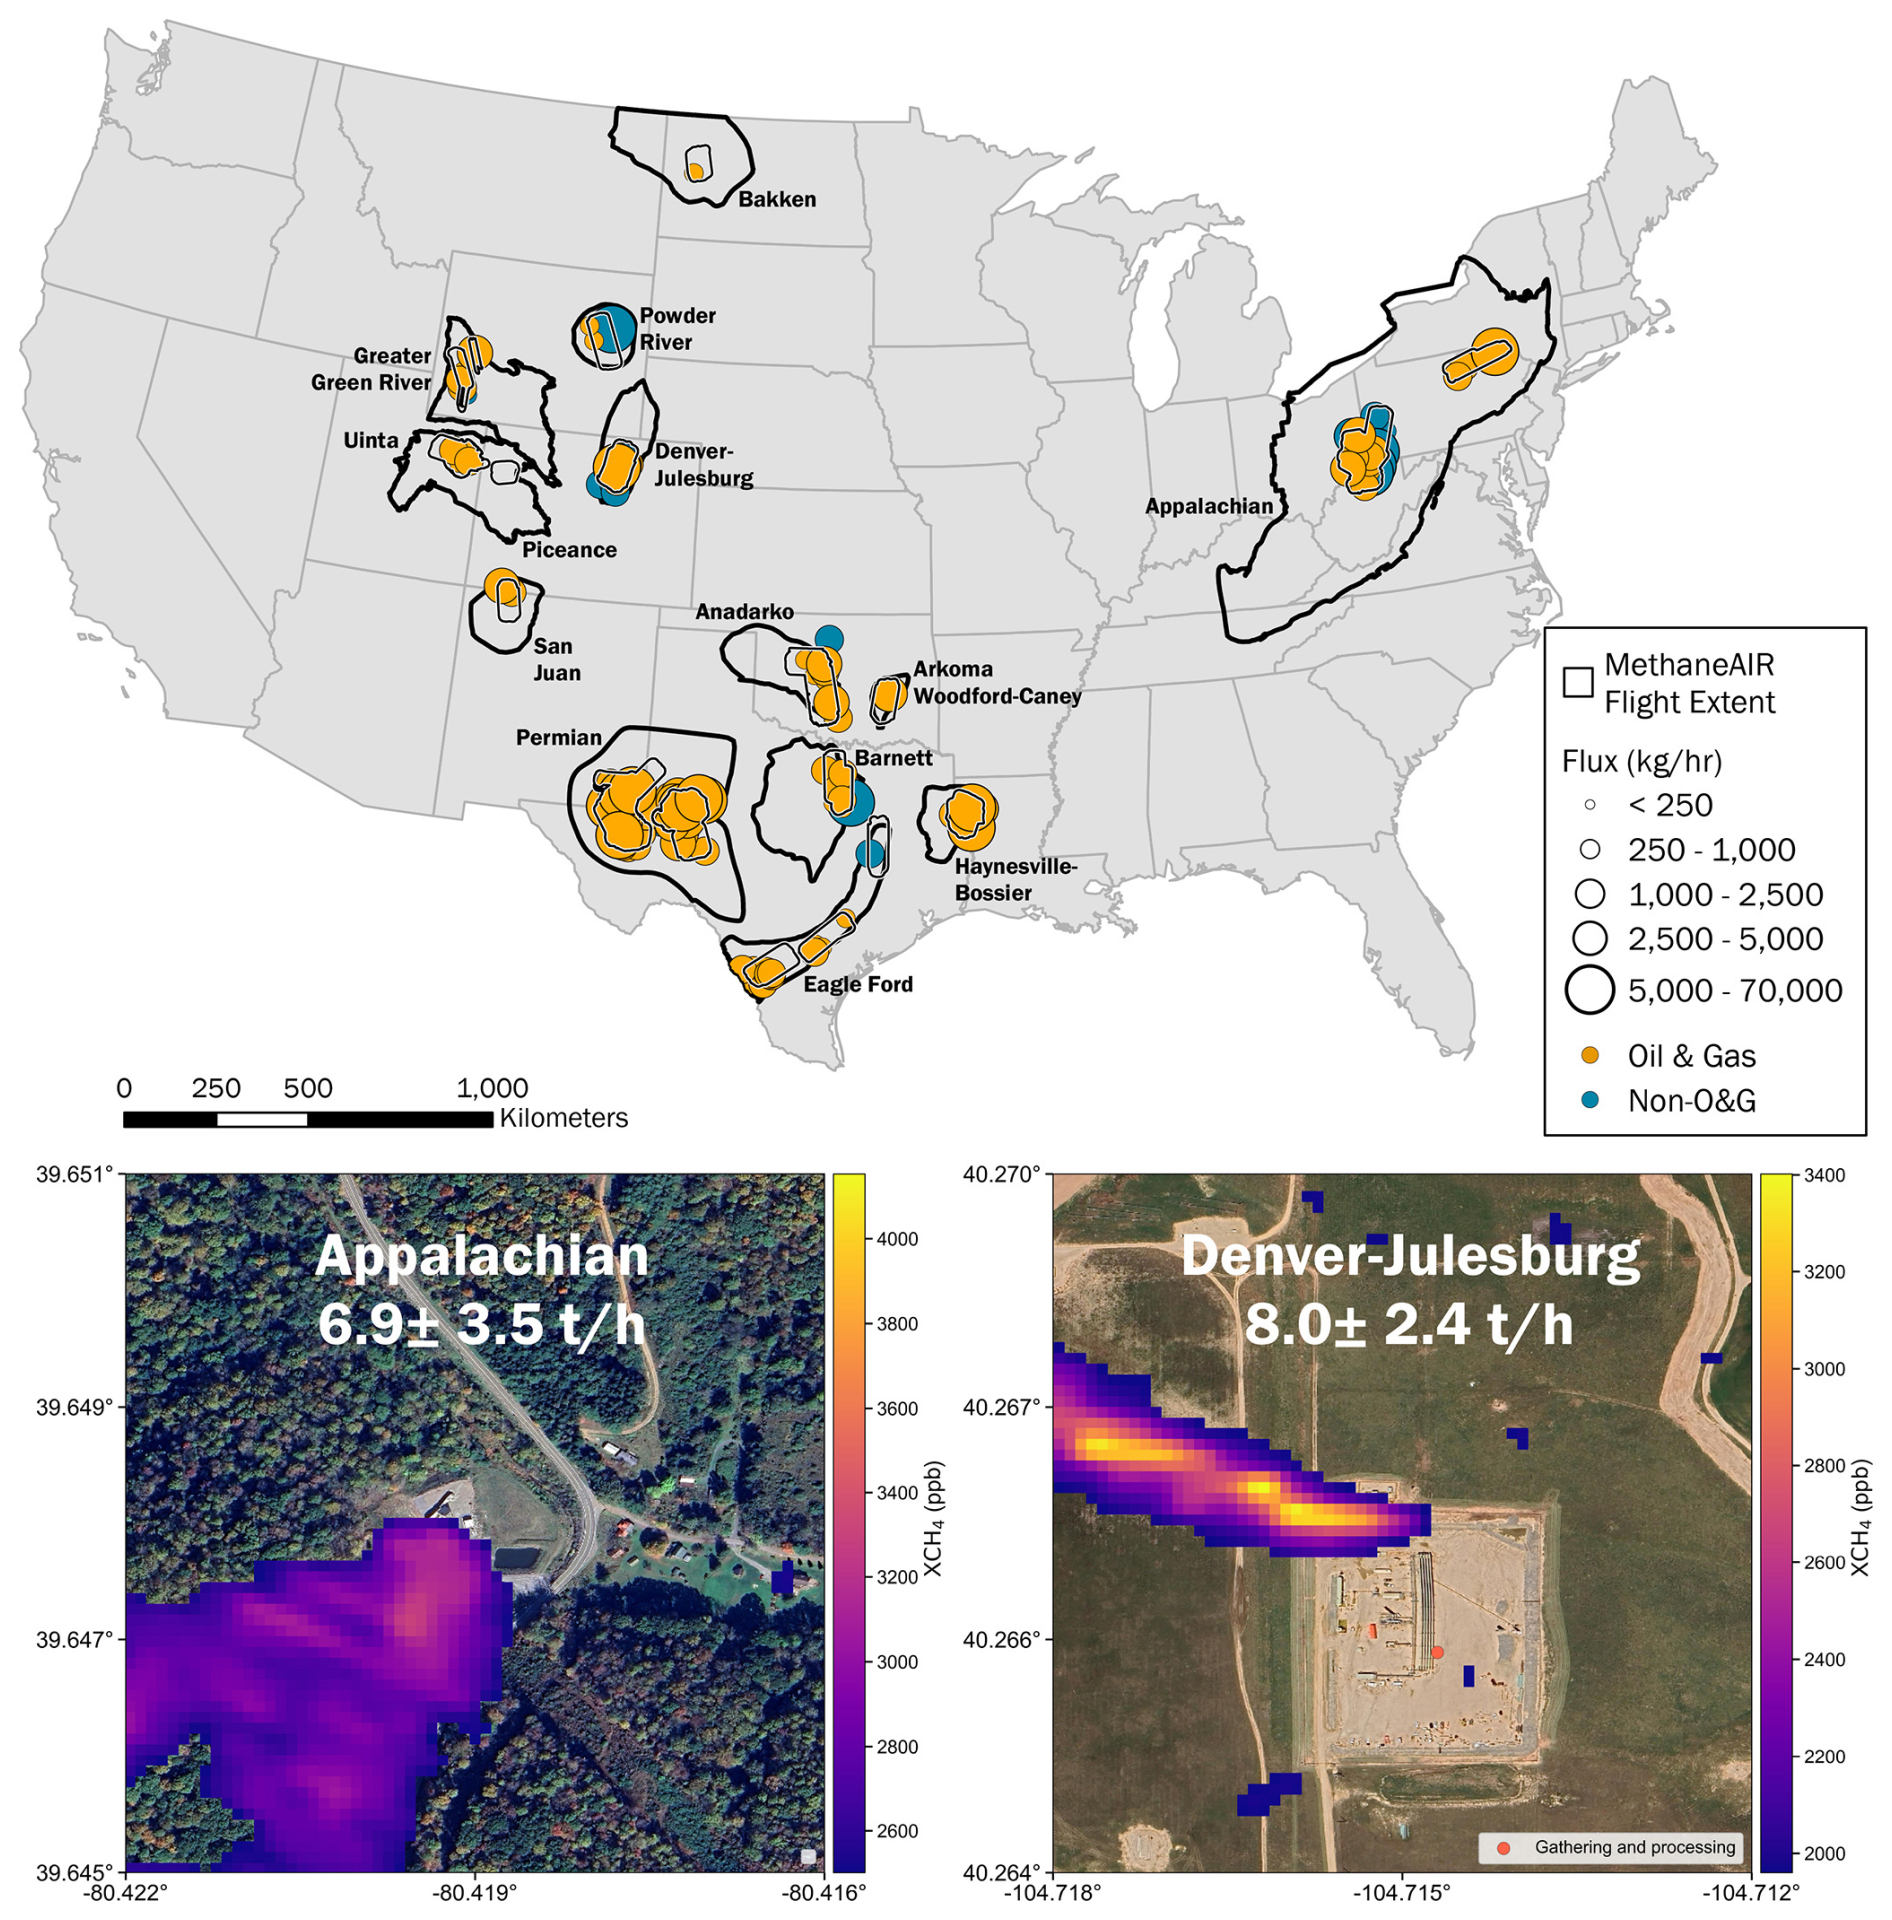
Figure 1High-emitting methane point sources detected by MethaneAIR from 2021–2023. Emission sources (circles) are sized by emission rate and colored according to emission source type (orange: oil and gas sources; dark green: non-oil and gas sources). Bold black outlines indicate basin boundaries (https://www.eia.gov/maps/maps.php, last access: 18 August 2025) while gray outlines indicate regions flown by MethaneAIR without the inbound and outbound flight tails. Subpanels depict two examples of the detected methane plumes, labeled with emission rate and basin, from a coal facility (left) and processing plant (right). Discussed geologic sub-basin boundaries are illustrated in Fig. S3.1 in the Supplement.
Flown at cruising altitude of approximately 12 km, MethaneAIR can cover over 100 km×100 km in approximately 3 h. As discussed in Chen et al. (2022, 2024), a single expansive scan of an entire region to estimate total point source emissions, as is the case with MethaneAIR, will have a lower standard error than combining several smaller scans for estimating a region's average point source emissions. However, differences in the facility composition and emission sources in sub-basin regions can increase the required sampling to develop a representative estimate of basin-level emissions (Chen et al., 2024). Determining the number of overflights needed for a representative sample is likely possible with the combination of multiscale measurements and long-term campaigns, which is outside the scope of this work. Therefore, we prioritized our sampling based on the goal of first scanning at least 80 % of onshore oil and gas production and then collecting additional overpasses where conditions were favorable. We then prioritized regions of concentrated oil and gas activity or where prior investigations occurred for additional overflights. The required number of overflights relative to total emissions uncertainty is retrospectively explored using the daily flux variation of basin subregions with the most number of overflights (Sect. S6 in the Supplement).
2.2 Methane point source plume identification and flux quantification methods
Within the ∼ 10 000 km2 area xCH4 maps produced by MethaneAIR, coherent plumes were identified using a thresholding method and quantified using a divergence integral (DI) method (Chulakadabba et al., 2023). The automated plume-finding algorithm uses a two-part threshold-based clumping technique and a manual QA/QC of the found plumes. We first produced a gridded flux product by calculating the divergence of the flux for 600 m×600 m squares, which were tiled across the scene, oversampling by moving the squares over by 200 m at a time (Fig. S1.1). The methane flux from each square was calculated using HRRR wind products and the DI method described in Chulakadabba et al. (2023) and briefly explained in the Supplement (Sect. 1). We found that the gridded flux product for the scene helped to identify the upwind end of plumes, which had larger flux divergence than the downwind end of plumes. To locate plumes in the scene, we first took the absolute value of the gridded flux map, as inaccuracies in the meteorological product's wind direction often lead to positive and negative dipoles around plumes. We identified and isolated “clumps” of elevated [absolute value of] flux by defining a threshold of 1.3 × [standard deviation of scene's gridded flux] + [mean of scene's gridded flux] and setting values below that threshold to null values. For each flux clump with >12 (200 m×200 m) pixels, we cropped the xCH4 map to ±3 km around the center of the clump. For the cropped scene, we then repeated the thresholding and clumping algorithm to find xCH4 clumps above the threshold. To keep an xCH4 clump, it must have >200 (10 m×10 m) pixels, and part of the clump must be within 1.5 km of the DI clump centroid. Multiple xCH4 clumps can be considered part of the same plume mask if they meet those criteria.
We then calculated the major axis and eccentricity of the xCH4 plume mask. Using the wind direction from HRRR, we found the ends of the xCH4 mask in the upwind and downwind directions, and the difference between the two points was taken to be the plume length. The origin of the plume was taken to be either the upwind end of the plume mask or the center of the elevated DI flux clump, whichever was farther upwind (Fig. S1.2). Finally, the flux from the plume was calculated using the growing box DI method, starting at the plume origin and extending to the plume length, as described by Chulakadabba et al. (2023) (Sect. S1). Plumes with a flux less than 150 kg h−1 were discarded as being below the detection threshold of the methodology. In addition, we manually reviewed all identified plumes and discarded plumes with known artifacts.
2.3 Facility attribution of high-emitting methane point sources
Attribution of point sources to facility types has been achieved through spatially querying known infrastructure locations (Hmiel et al., 2023) or by manual review of available high-resolution satellite imagery (Cusworth et al., 2022; Irakulis-Loitxate et al., 2021). Here, we apply both methods, using a combination of automated spatial querying from a collection of public geospatial oil and gas and non-oil and gas infrastructure datasets with subsequent manual review to identify emitting facility types. The applied infrastructure collection included state and federal inventories of air emission sources, oil and gas infrastructure databases (Omara et al., 2023), and several sources dedicated to accounting for non-oil and gas methane emitting sectors such as waste management or concentrated animal feeding operations (CAFOs) (Active Air Pollution Emitting Facilities, 2025; CAFOs in the US, 2025; CDPHE Oil and gas greenhouse gas intensity program, 2025; Coal Mining Operation, 2025; Mineral Resources of Wyoming, 2025 New Mexico Environment Department Data, 2025; Underground and Surface Coal Mines, 2025; West Virginia Department of Environmental Protection GIS Data, 2025). Full details on the spatial attribution methods, definitions of facility types, and infrastructure databases used can be found in Sect. S2.
2.4 Analyses of high-emitting methane point source emissions
To calculate a basin's total point source emissions, we divide each plume's quantified emission rate by the total number of overpasses of that respective location before summing all plumes in the basin. This is analogous to persistence-weighted emissions as described in Chen et al. (2022) and Cusworth et al. (2022). Prior studies have taken an additional step and used Monte Carlo simulations to sample a range of persistence values from a given basin according to the facility type for regions with limited overflights. This approach relies on having a large collection of site level observations that altogether form a representative distribution of a facility's possible intermittency. However, basin and emissions dynamics change over time, and samples from prior years may not be representative of recent emissions. Additionally, the intermittency of a facility type may differ across regions, and since we sampled several regions not previously explored, in many cases we do not have a suitable collection of source-level persistence values to sample for persistence simulations. Nonetheless, we explore possible differences of results based on point source total calculation methods (Sect. S4), in which results are broadly consistent regardless of whether persistence is modeled for subregions with few overflights. For aggregated basin-level point source emissions estimates, we report a 95 % confidence interval that is estimated through a simulation-based approach. In each simulation, we iteratively assign a new emission rate to the full suite of point source detections using a random draw from a normal probability distribution defined by the quantified plume-level emission rate and uncertainty. New emission rates are then divided by the number of overflights and summed per simulation. Reported confidence intervals represent the range between the 2.5th and 97.5th percentile of simulated sums across 10 000 iterations.
Finally, we compare the relative contribution of high-emitting point source emissions from various facility types per basin by normalizing total attributed emissions by the basin's total point source emissions for MethaneAIR's 2023 campaign. To create a definite comparison, we limit this portion of the analysis to emission rates with a high probability of detection. Detection of a point source is dependent on both the size of the source and in situ conditions, such as wind speed, surface brightness and heterogeneity, or background concentration of methane (Conrad et al., 2023). As the probability of detection decreases, collective point source observations are not likely to characterize the complete nature of emissions in an area due to the possibility of present but unidentified emission sources in an individual scan. MethaneAIR has been tested in blind-controlled release experiments and accurately quantified emissions as low as 33 kg h−1 (Abbadi et al., 2024). However, the ability to quantify point sources in relatively controlled field testing can greatly differ from basin-scale campaigns where source locations are not known beforehand (Conrad et al., 2023). We define our emission rate threshold for comparison based on the drop-off in observational frequency in the cumulative observed emissions distribution (Chen et al., 2024) (Sect. S5). We then apply this same detection threshold in overlapping regions for the observations from Cusworth et al. (2022) and MethaneAIR's research flight phase, which allows us to compare and to explore whether the relative point source emissions characteristics have changed over time (Chen et al., 2024).
3.1 National point source methane emissions and sectoral attribution
Throughout the entire 2023 campaign, MethaneAIR quantified a total of 320 plumes at 268 unique facilities across 13 oil and gas producing basins (Fig. 1). Altogether, the 2023 flights in this study comprise a unique area covering 79 % of onshore US oil and gas production. To our knowledge, this campaign represents the largest coverage of unique US onshore oil and gas production in a single year by an airborne spectrometer quantifying methane point sources to date. With the addition of the research flights from 2021 and 2022 included in this study, the totals rise to 423 plumes and 80 % of onshore production.
MethaneAIR detected and quantified high-emitting methane point sources with individual emission rates ranging from ∼ 160 kg h−1 to ∼ 70 t h−1. For the flights in this study, images produced by MethaneAIR had a pixel precision of 25–35 ppb depending on the observing conditions. Detection frequency of plumes peaked at approximately 550 kg h−1, which we use as the emissions detection threshold for subsequent comparisons of sectoral variation (see Sect. S5) and prior published studies.
Overall, MethaneAIR quantified an average total of 357 t h−1 (95 % CI: 277–435 t h−1) from high-emitting point sources across all surveyed regions in 2023, with 286 t h−1 (95 % CI: 210–365), or ∼ 80 % of the total, coming from oil and gas sources (Table 1). The quantified emissions from these MethaneAIR-detected high-emitting point sources represent roughly one-fifth of the estimated national oil and gas methane emissions of ∼ 13 Tg yr−1 (∼ 1500 t h−1; Alvarez et al., 2018; Shen et al., 2022).
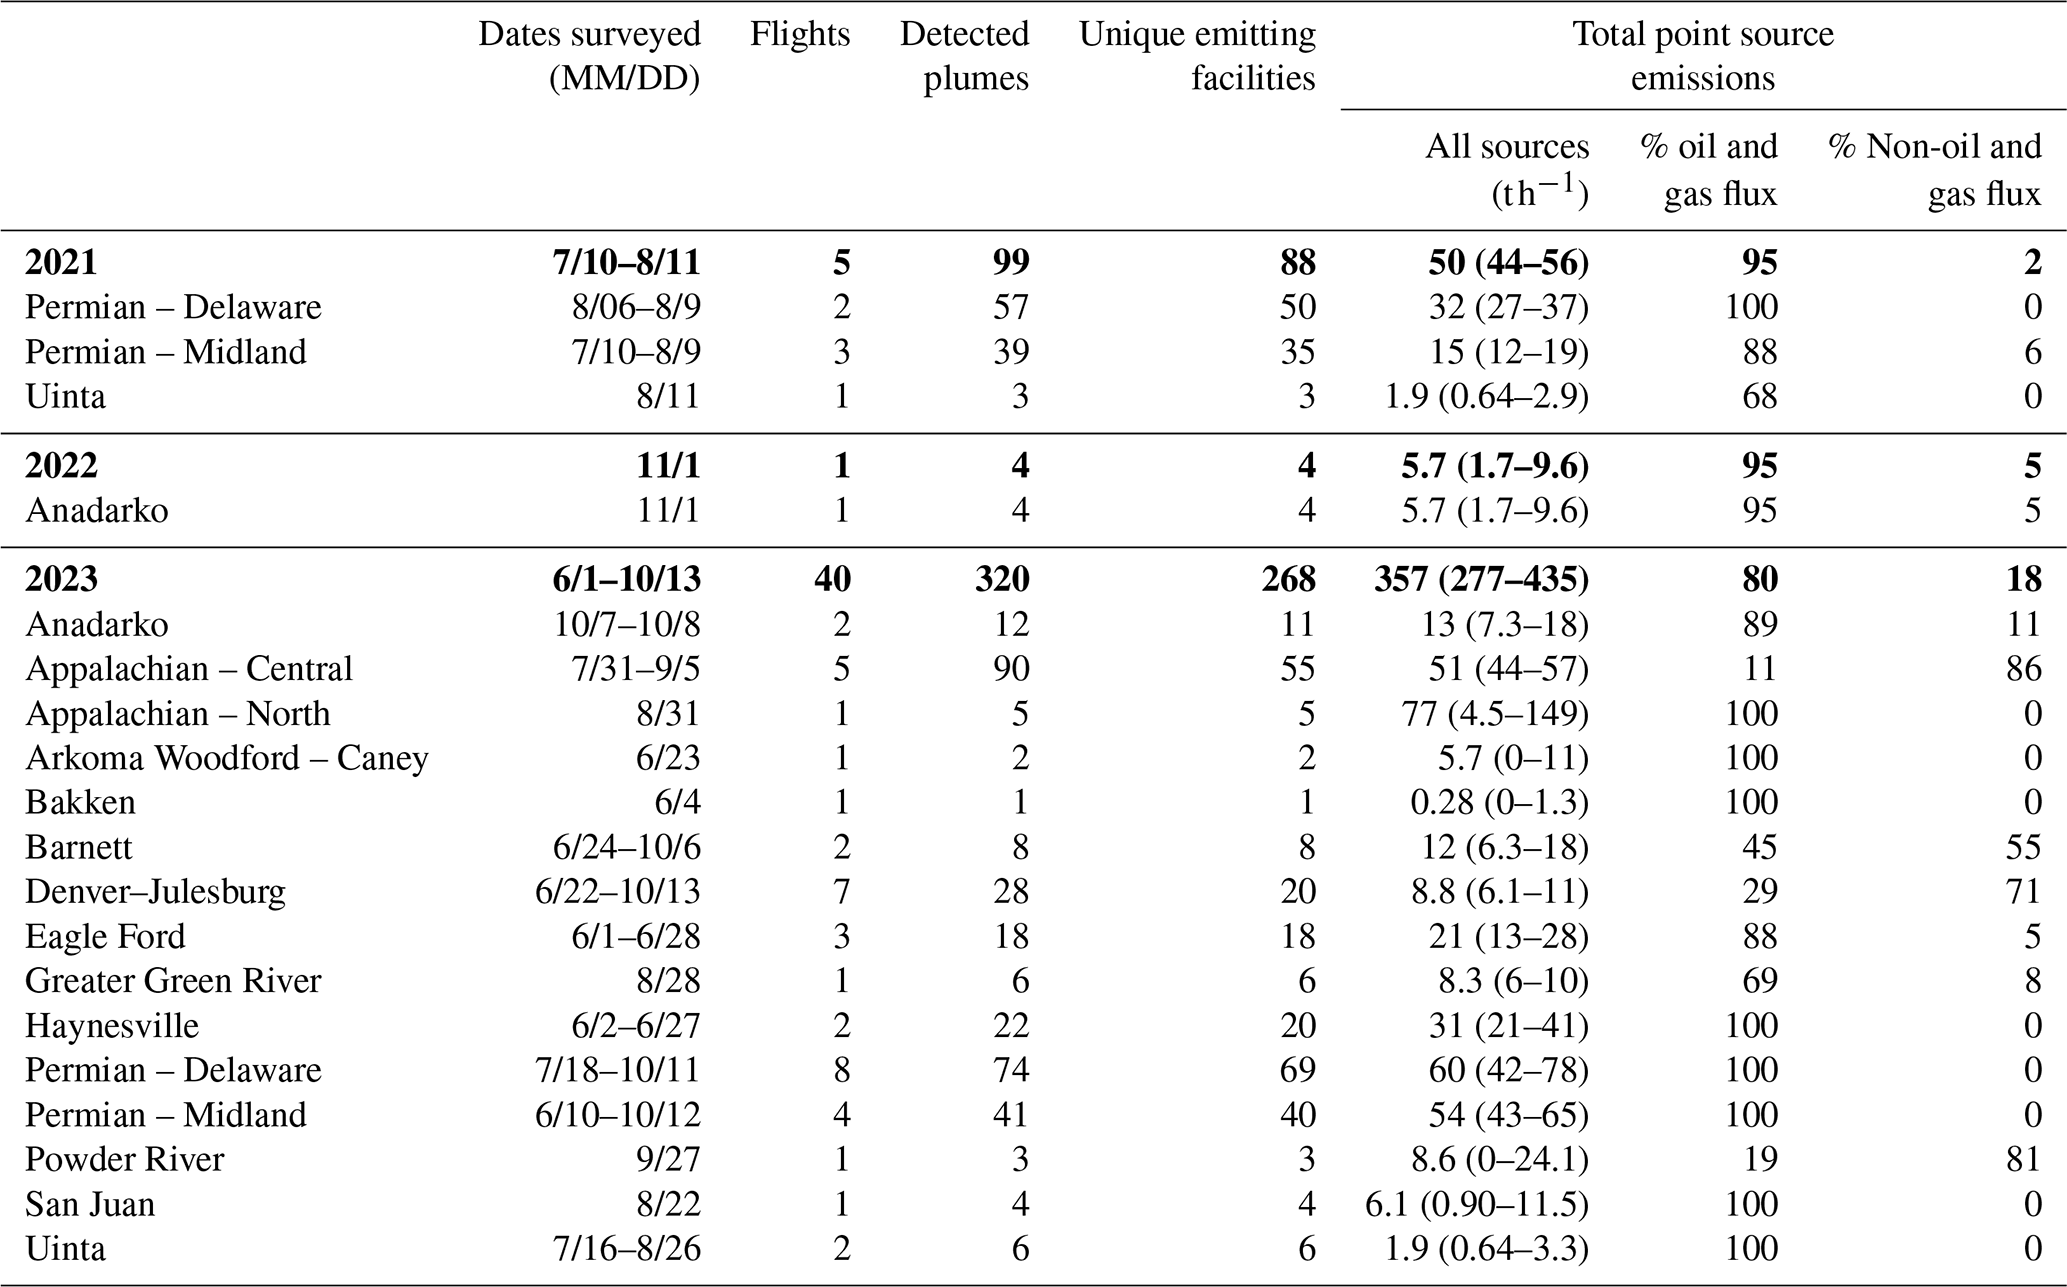
Table 1Observational summary of MethaneAIR campaigns 2021–2023. Values in parentheses represent the simulated 95 % confidence interval, and values in bold represent totals across all regions within the respective year. Total point source emissions are calculated using the persistence-weighted total of all detections.
Point source attribution was successful in specifically determining the facility type of 400 point sources (94 %) (Table 1). Across all regions, we identified high-emitting methane point sources at major oil and gas facilities (well sites, natural gas compressor stations, central tank batteries, processing plants, and pipelines) and non-oil and gas facilities (e.g., coal and landfills). MethaneAIR observed emissions from several other facilities not commonly considered for their methane emissions, including power plants, a biogas storage facility, and a fertilizer plant. Plumes were detected at both a coal-fired power plant in Eagle Ford and a natural gas-fired power plant in the Barnett. Emissions detected at the natural gas-fired power plant () exceed the estimated methane emissions rate of uncombusted natural gas from typical stack operations in prior measurement based work (8–135 kg h−1) (Hajny et al., 2019), suggesting MethaneAIR's observation was a result of upset conditions or a separate fugitive source.
Comparing the relative distributions of emission rates across sectors (Fig. 2a), our results indicate some stratification of emission rates between the major oil and gas and non-oil and gas facility types. For oil and gas facilities, the observed median emission rate is consistent across pipelines, well sites, and compressor stations (1.1–0.99 t h−1) and slightly elevated at processing plants (1.3 t h−1), but all share large amounts of overlap in the interquartile range. Coal facilities had the highest median emission rate (2.0 t h−1) and differentiated themselves from all other non-oil and gas facility types, which had lower median emission rates compared to all oil and gas facilities (1.0–0.80 t h−1). Due to the abundance of coal sources, the central region of the Appalachian Basin had the highest median emission rate (1.5 t h−1) compared to all other basins (Fig. 3a). Conversely, sources in the Denver–Julesburg Basin had some of the lowest median emission rate (0.83 t h−1, Fig. 3a), driven by solid-waste disposal facilities (landfills) and CAFOs.
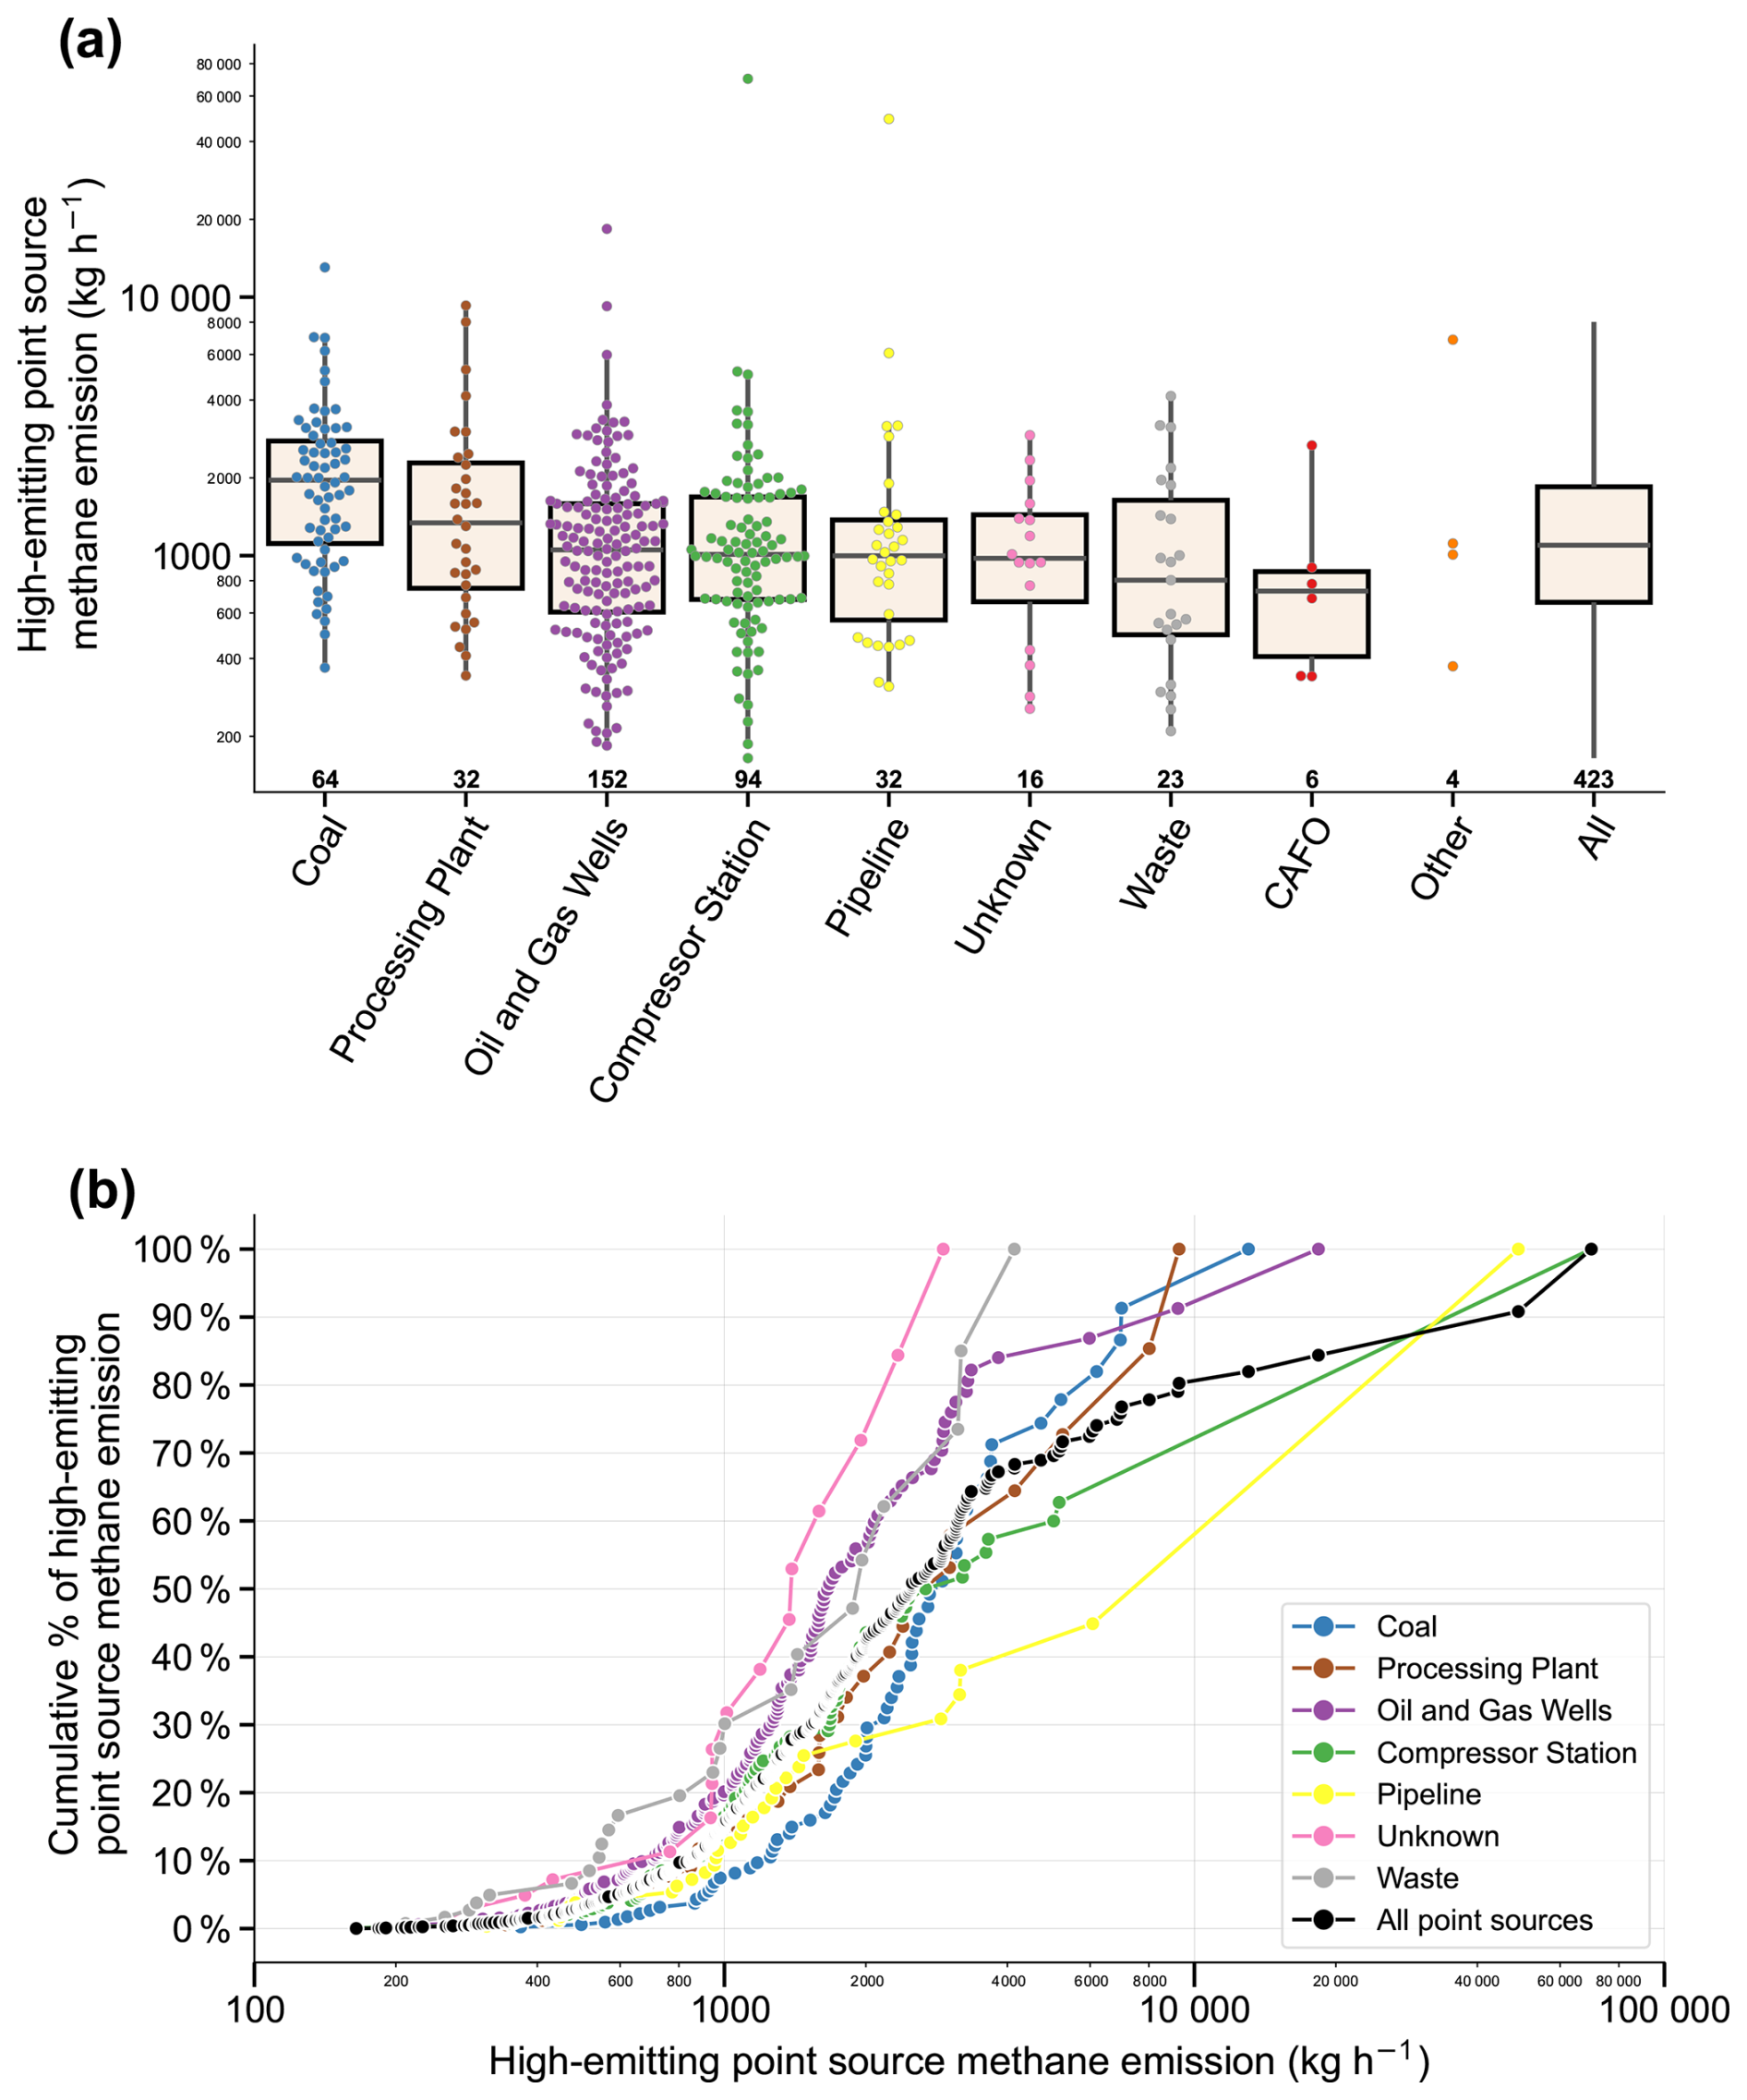
Figure 2(a) Box-and-whisker plot of emission source distribution by facility type from 2021–2023. Points represent each emission source, while numbers in bold below box plots indicate total sample size per category. The boxes represent the 25th and 75th percentiles, while the whiskers extend to 1.5× the interquartile range. Box plots are omitted for categories with a sample size of < 6 total. (b) Cumulative emission rate distribution of all sources by facility types, ranked in ascending order of emission rates (e.g., the red line for all point sources show that facilities emitting < 10 000 kg h−1 contribute 80 % of the total point source methane emissions quantified herein). Individual points represent each emission source. Facility types with a sample size of <6 total are omitted.
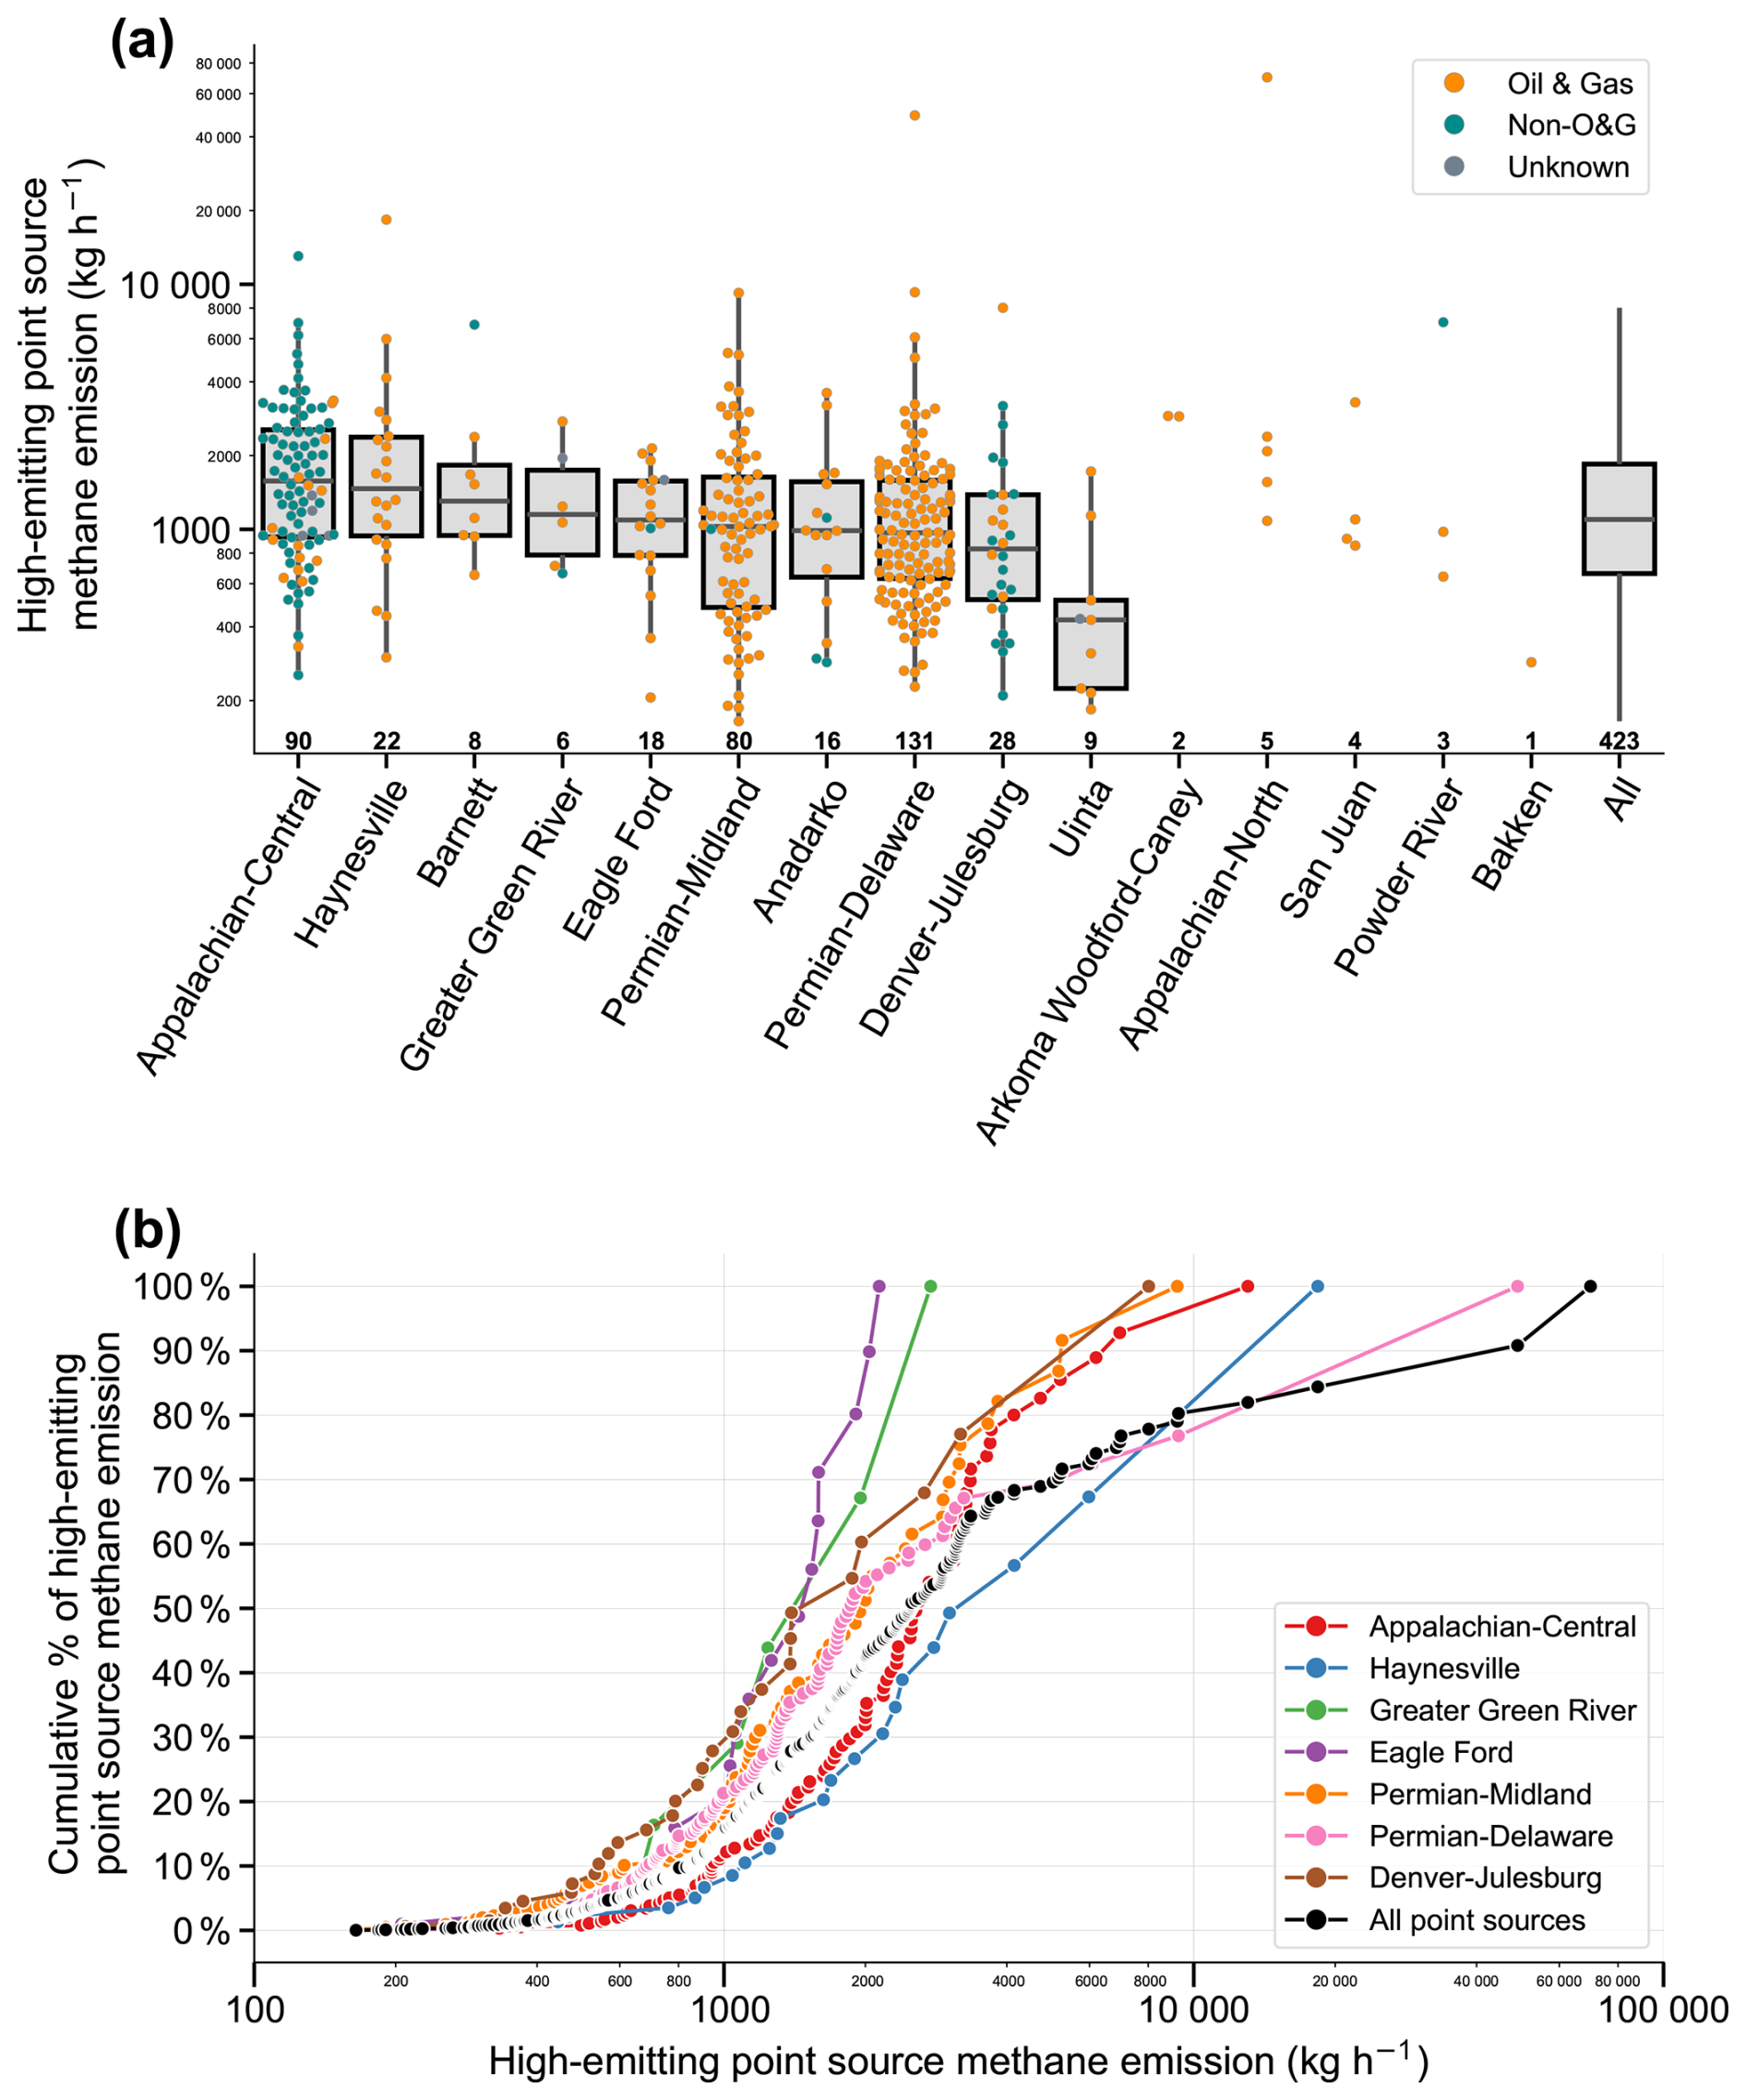
Figure 3(a) Box-and-whisker plot of emission source distribution by region from 2021–2023. Points represent each emission source, while numbers in bold below box plots indicate total sample size per category. The boxes represent the 25th and 75th percentiles, while the whiskers extend to 1.5× the interquartile range. Box plots are omitted for categories with a sample size of <6 total. Box plots are omitted for categories with a sample size of <6 total. (b) Cumulative emission rate distribution of all sources by region. Points represent each emission source, ranked in ascending order of emission rates (e.g., the red line for all point sources show that facilities emitting < 10 000 kg h−1 contribute 80 % of the total point source methane emissions quantified herein). Individual points represent each emission source. Regions with a sample size of <6 total are omitted.
Of the 423 plumes observed in 2021–2023, 233 (∼ 55 % of all point sources) emitted at rates >1 t h−1, accounting for a cumulative total of ∼ 84 % of all detected point source emissions (Fig. 2b). In addition, only four methane “ultra” emitters (Lauvaux et al., 2022), with individual emission rates>10 t h−1, were responsible for ∼ 20 % of all observed point source methane emissions (see black curves in Fig. 2b and c), underscoring the skewed characteristics of point source emission distributions, as has been discussed elsewhere (Brandt et al., 2016; Cusworth et al., 2022). Overall, the confluence of observed emission ranges suggests individual large point source emission magnitude is shared across all facility types despite differing equipment and operational processes occurring on these sites. Delineation of specific categories within these types (e.g., transmission vs. gathering compressor stations or high vs. low production wells and/or the application of higher sensitivity instruments) was outside the scope of this work, but it is necessary to reveal possible emission rate stratification across facility sub-types.
3.2 Ultra-emission events and basin-level point source emission characteristics
All named facility types, except waste sector facilities and CAFOs, had at least one observed emission source approximately (Fig. 2a), the range of what has been referred to as ultra-emitters (Lauvaux et al., 2022). In the Permian Basin, we quantified a pipeline leak in the Delaware subbasin on 19 July 2023. According to air emissions event reporting from the New Mexico Oil Conservation Division (OCD Permitting Incident Details, 2024), our detection was a part of controlled blowdown of a gas gathering system in response to a detected leak. The gas gatherer reported total natural gas vented of 169 Mm3 with a methane fraction of 75 % over a duration of 2 h, from which we estimate a reported methane emission rate of approximately 43 t h−1, which is in reasonable agreement with our flyover quantification within uncertainty bounds.
In the northern region of the Appalachian Basin, we detected a emission from a natural gas compressor station. As a result of this detection alone and only one overflight in the region, the northern region of the Appalachian Basin had the highest observed basin-level point source flux (Fig. 4a). These two detections alone notably skew the cumulative emissions distribution for pipelines and natural gas compressor stations towards the fat tail of the distribution (Fig. 3b).
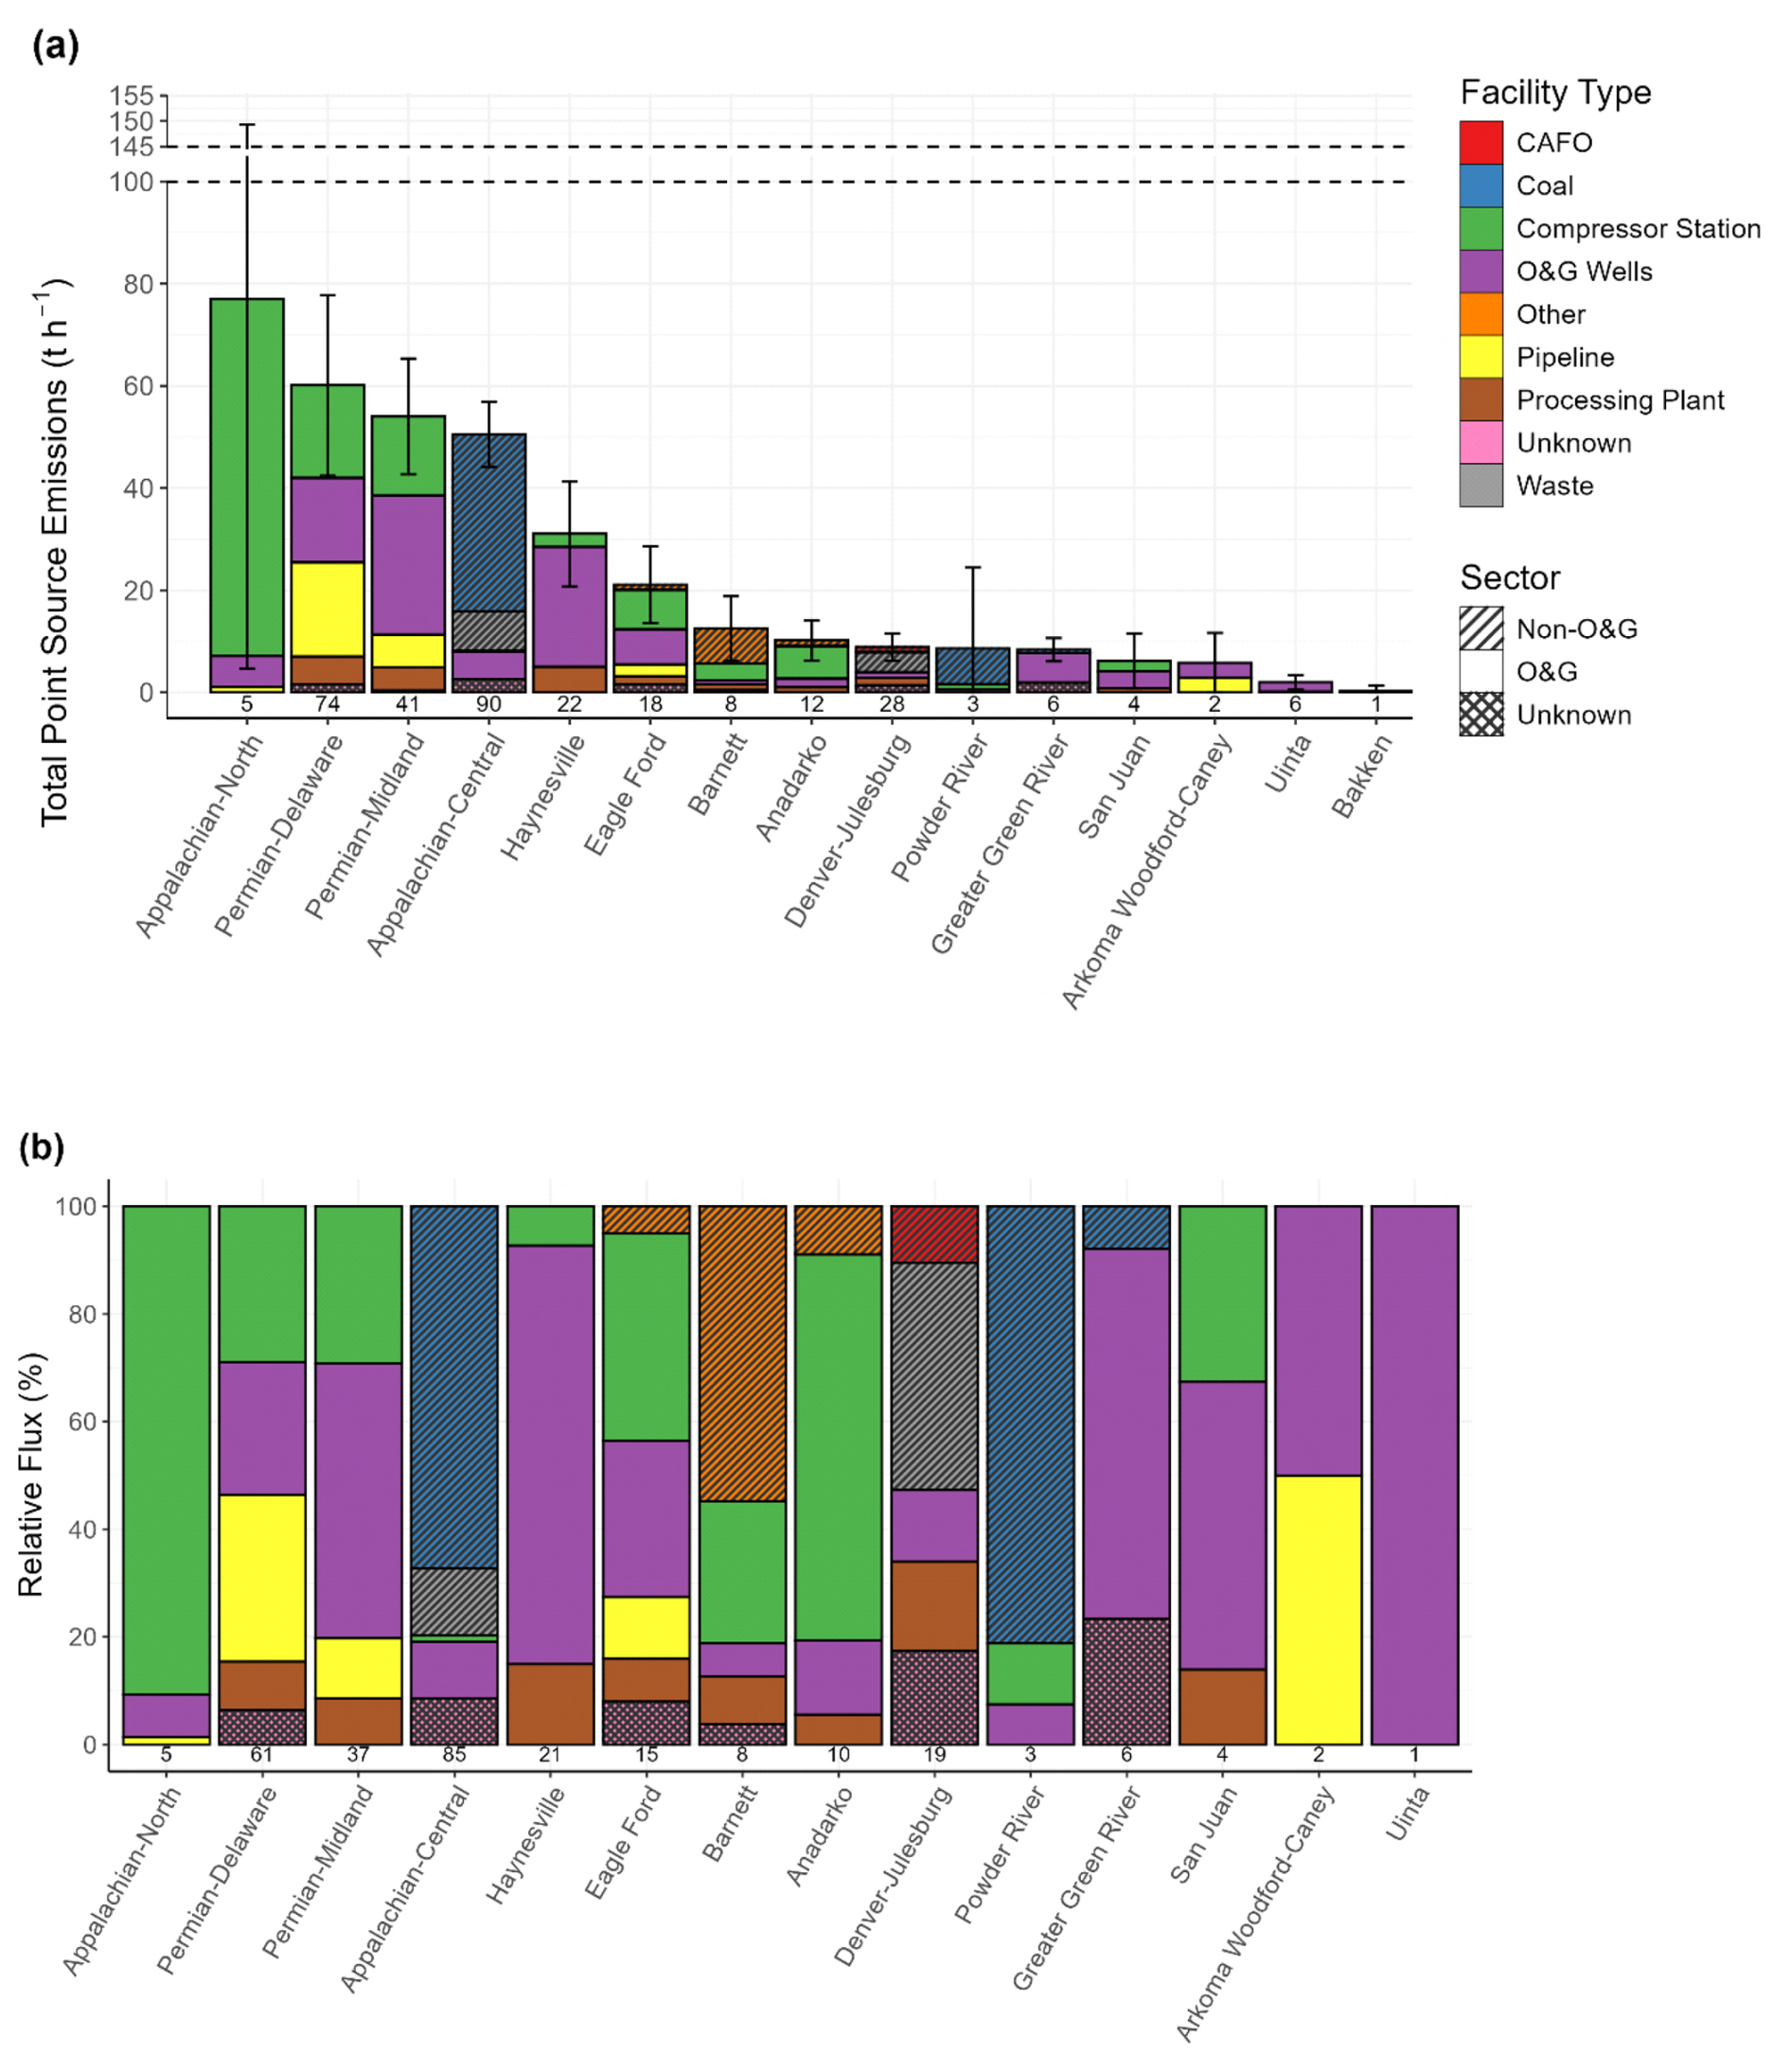
Figure 4(a) Average basin-level emissions totals for all high-emitting methane point sources detected by MethaneAIR in 2023. Colors indicate specific facility types, while texture indicates non-oil and gas sectors. Numbers below the stacked bar chart represent total plume sample size. Error bars represent the 95 % confidence interval of the basin-level total emissions for all high-emitting methane point sources. Note the axis break between 100 t h−1 and 145 t h−1. (b) Normalized average basin-level emissions totals for high-emitting point sources above 550 kg h−1 detected by MethaneAIR in 2023. For each region, the relative flux represents the ratio of each facility type's total methane emissions as a fraction of the total emissions from all sources or facility types in the region.
Even given multiple overflights, large but intermittent events can have an outsized impact on our understanding of a region's total emissions. Despite flying the core region of the Denver–Julesburg Basin six times, one detection from a processing plant () made up over one-third (34 %) of the basin's aggregated point source emissions from oil and gas sources (Fig. 4). Recurrence of site-level emissions was seen only from non-oil and gas facilities. While it is possible that there were undetected but present emissions below this study's detection limit or within the range 150–550 kg h−1 range, our results indicate that emissions from oil and gas facilities were all single occurrences as observed by MethaneAIR for six overflights covering the core part of the basin. Prior research using process level models of oil and gas emissions that takes into account the changes in the regulatory environment suggests that production normalized gas loss rates have decreased in response to regulatory requirements starting in 2014 (Riddick et al., 2024). The observed lack of recurrent emissions from oil and gas facilities could possibly be due to this regulatory environment, which has included an empirically based oil and gas methane intensity verification program that was adopted in 2023 (CDPHE).
Despite our survey's focus on oil and gas regions, MethaneAIR quantified a large portion of non-oil and gas sector emissions in many basins. In the Denver–Julesburg Basin, over half of average total point source emissions above 550 kg h−1 came from waste facilities (42 %) and CAFOs (10 %) (Fig. 4b). In our single flyover of the Barnett, over half (54 %) of point source emissions came from a plume at a power plant (). Coal sources make up the majority of emissions in the Powder River (81 %), the largest source of coal in the United States (Luppens et al., 2015), and central region of the Appalachian Basin, which also had the largest magnitude of non-oil and gas emissions (mean 42 t h−1, 36–48 t h−1 95 % CI) across the entire study. Over half of the coal facilities in the Appalachian Basin were detected across multiple flights, with average persistence (detections/times overflown) being 0.54 – the highest in the study. Waste facilities in the central region of the Appalachian Basin also contributed a significant portion of emission sources above 550 kg h−1 (13 %). Overall, non-oil and gas emissions from multiple sectors make up significant portions of large point source emissions in these mixed basins, underscoring the importance of attribution or apportionment of top-down data in these regions.
Outside of the prior mentioned four regions, oil and gas sector sources make up the majority of emissions in all other studied regions. Of the regions flown multiple times within the 2023 campaign, the highest magnitude of oil and gas sector point source emissions was from the Permian Delaware Basin (mean 60 t h−1, 95 % CI: 42–77 t h−1) (Fig. 4a). The Anadarko Basin, despite contributing approximately 6 % to the nation's overall oil and gas emissions (Shen et al., 2022), has been largely unexplored in multi-basin methane point source studies to date (Cusworth et al., 2022; Sherwin et al., 2024). Compressor station emissions were the largest contributor to observed point source emissions in the Anadarko Basin for both 2023 (mean: 8.8 t h−1, 95 % CI: 2.7–14 t h−1) (Fig. 4) and MethaneAIR's research flight in 2022 (mean: 3.7 t h−1, 95 % CI: 0.71–6.3 t h−1). MethaneAIR also observed emissions from a fertilizer plant in the Anadarko Basin that was previously sampled using mobile surveys in 2016 (Zhou et al., 2019). Emissions quantified by MethaneAIR in 2023 () greatly exceed the prior estimated fertilizer plant emission rate from mobile survey sampling across 2 d ().
In Haynesville and Eagle Ford basins, high-emitting methane point sources were concentrated in certain portions of the basin. In the Haynesville Basin, sources were more frequent in the Louisiana portion of the basin, while in Eagle Ford, point sources were focused in the southwesternmost area. Temporary events, such as a shutdown of midstream infrastructure, can lead to widespread emissions for a short period. However, in the Haynesville Basin, we sampled a large overlapping region 25 d apart and saw a high frequency of point sources on both days, suggesting that our observations are not likely due to some kind of short-term high emission events. Results from Eagle Ford are based on a single overflight, and prior research in the region has shown that aggregate emissions from large sources varied from 2 to 3 times on different days (Lavoie et al., 2017). Even though MethaneAIR covered a much larger total area of Eagle Ford than Lavoie et al. (2017), repeated scans are likely necessary to more comprehensively characterize total and sectoral contribution of point sources.
Similarly, our results in the San Juan, Arkoma, Greater Green River, Powder River, Barnett, and Bakken basins are derived from one comprehensive overflight and resulted in relatively few detections. Building a representative sample of total point source emissions and sectoral contributions will likely require several overflights depending on the basin and particular sub-basin region (see Sect. S6 “Daily variation of basin sub-regions”), and thus these results represent a baseline for future studies on point source methane emissions in these basins.
The top six basins according to oil and gas point source methane emissions total – Permian, Appalachian, Haynesville, Eagle Ford, Anadarko, and Barnett basins (Fig. 3) – are also the top six basins for basin level total oil and gas methane emission results, as estimated from satellite-based inversions using TROPOMI (Shen et al., 2022) and GOSAT (Lu et al., 2023), as well as measurement-based emissions inventory (Omara et al., 2024). However, across all three studies there are uncertainties in the ordering of these basins by total oil and gas emissions, except for the Permian Basin, which is consistently observed as the highest emitting basin in the United States. Future investigations with simultaneous quantification of both the total area emissions and high-emitting methane point sources are needed to better characterize the relative contribution of point sources to the overall emissions, which are expected to vary across basins (Williams et al., 2025).
3.3 High-emitting methane point source total emissions, sectoral contribution, and total variability over time
Our estimate of 114 t h−1 (95 % confidence interval: 85–143 t h−1 ) of methane emissions from Permian Basin point sources from MethaneAIR in 2023 initially appears significantly higher than the estimate reported in Cusworth et al. (2022) for the year 2021 (, summer 2021; , fall 2021) despite the relatively lower detection threshold of the AVIRIS-NG instrument used in Cusworth et al. (2022). However, the presented values from the AVIRIS-NG instrument used in Cusworth et al. (2022) cover a different spatial extent and use a different definition of persistence, with an additional step of Monte Carlo simulations which is not applied here. If we limit our comparison to only the overlapping core areas of the Delaware and Midland basins observed in both studies, apply the same calculation methods, and use a minimum threshold of 550 kg h−1 to align sensor sensitivities, MethaneAIR's 2023 95 % confidence interval for average total point source emissions estimate in the Delaware Basin (12–18 t h−1) is consistent within statistical uncertainty with Carbon Mapper's estimate in summer 2021 (17–20 t h−1) and MethaneAIR's research flights in 2021 (14–21 t h−1) in the same region. Overall, 2023 average total point source emissions in both Permian Delaware (12–18 t h−1) and Midland basins (3.6–12 t h−1) show a decreasing trend from measured highs in 2019 as measured by Carbon Mapper (Midland: 39–45 t h−1, Delaware: 50–54 t h−1) (Fig. 5).
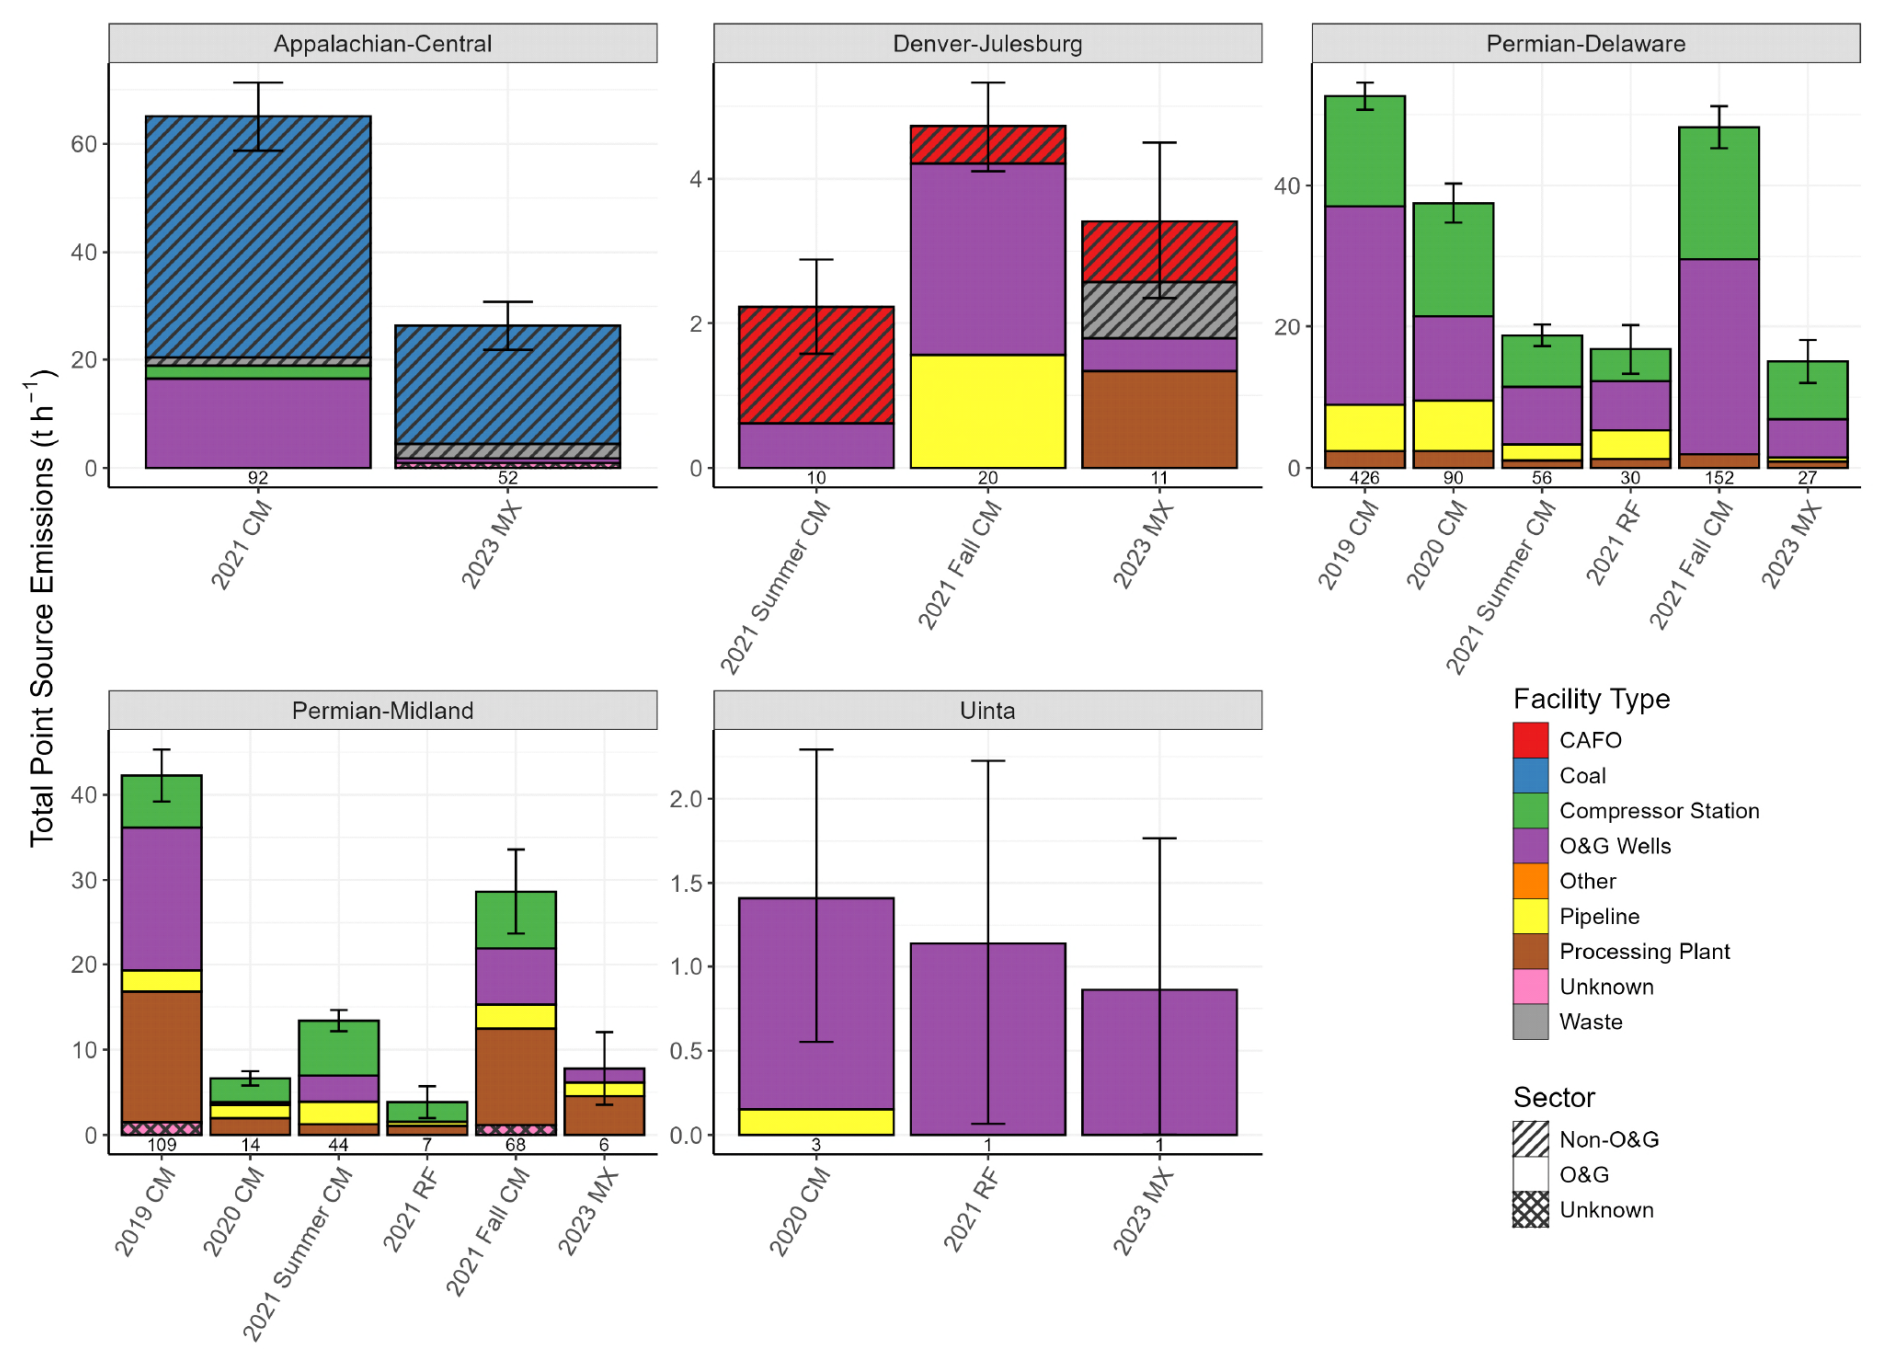
Figure 5Temporal comparison of average point source emissions in shared study regions. Comparison is limited to observations above the threshold for comparison (550 kg h−1) and from a shared sampling regions across all campaigns. Error bars represent simulated 95 % confidence interval. Numbers below the stacked bar chart represent total plume sample size. X axis refers to individual measurement platform campaign with the following abbreviations: CM denotes the Carbon Mapper estimate using the AVIRIS NG and GAO instruments from Cusworth et al. (2022); RF denotes MethaneAIR research flights phase; MX denotes MethaneAIR 2023 observations.
Outside of the Permian Basin, Uinta Basin point source emissions above 550 kg h−1 are consistent and time-invariant across Carbon Mapper's 2020 campaign (0.55–2.2 t h−1), MethaneAIR's 2021 research flight (0.008–2.2 t h−1), and MethaneAIR's 2023 flights (0.0–1.7 t h−1). Average total point source emissions in the central region of the Appalachian Basin from overlapping regions show a decrease from Carbon Mapper's observations in 2021 (58–71 t h−1) to MethaneAIR's in 2023 (23–32 t h−1). MethaneAIR's point source emissions total in the Denver–Julesburg Basin for 2023 (2.3–4.5 t h−1) is between estimates from Carbon Mapper in summer (1.6–2.9 t h−1) and fall (4.1–5.3 t h−1) of 2021, underscoring the variable nature of point source estimates in specific basins due to the underlying intermittency of sources even in shorter time frames. While these comparisons illustrate changes in point source emissions over time, emissions trends in the overlapping regions of these studies may not necessarily represent emissions trends of the entire basin or cumulative emissions from all emission rates and sources.
When comparing the relative sectoral contributions of point source contributions over time, we see a broad level of consistency from MethaneAIR 2023 to results in Cusworth et al. (2022) from prior years (Fig. 5). The same facility types are represented each year with relatively small fluctuations over time when considering uncertainty. Our results suggest an increase in waste sector point source emissions in the Denver–Julesburg Basin for 2023 relative to the 2021 Carbon Mapper observations. Given that many large point sources represent abnormal process conditions and are highly intermittent, we expect inherent variability in a region unless a highly persistent facility type is abundant. This expectation is confirmed when looking at results in the central region of the Appalachian Basin, where 60 % of high-emitting point sources emissions are from coal facilities in both 2021 and 2023.
3.4 Implications for policy and future scientific work
This study investigates the relative contribution of methane emissions from various facility types using high-emitting point source detections from MethaneAIR. However, contribution by a facility type can change depending on the observed portion of the emissions distribution. For example, low-producing wells are estimated to make up about half of all production-related emissions in the United States, primarily from sources emitting below 5 kg h−1 (Omara et al., 2022). Given the relatively high detection threshold of point sources for MethaneAIR, certain sub-facility types are not characterized by this study. Extensive sampling with instruments of lower detection limits (Johnson et al., 2023) and additional processing methods of existing data (Guanter et al., 2024) offer an avenue for comprehensive investigation across a larger distribution of emission rates. Under recently finalized regulations, US EPA will begin requiring the reporting of large methane releases under the Super-Emitter Response Program (SERP), including emissions at facilities with an instantaneous emission rate of at least 100 kg h−1 (EPA, 2024). Therefore, all plumes within this study would be reported if collected by a SERP reporter. While our results indicate MethaneAIR's sensitivity does not comprehensively extend to the lower limit of SERP's threshold, the attribution analysis presented here begins to illustrate what we can begin to expect from the program.
As a precursor mission to MethaneSAT, MethaneAIR and its point source observations offer a baseline for the satellite to expand with its observational capacity while also improving what we can interpret from the satellite data. National campaigns with an airborne platform like MethaneAIR, even with a relatively large observational swath, are limited in the number of repeat overflights to a given region. Representative sampling to characterize overall emissions variability can require multiple overpasses (Chen et al., 2024; Lavoie et al., 2017), and characterizing the sectoral contributions magnifies this sampling need depending on the intermittency of the underlying facility types. The revisit frequency and ability to observe multiple targets in a single day using satellite platforms, such as MethaneSAT (https://www.methanesat.org, last access: 18 August 2025) and the Carbon Mapper satellites (Carbon Mapper, 2024), will provide a solution to this sampling need. Facility-level and sectoral source attribution is possible with satellite-observed point sources, depending in part on each instrument's spatial resolution specifications for point source quantification. More research and application of source-apportionment methods (Carranza et al., 2022; Fiehn et al., 2023) is needed, particularly for low-emitting sources that will appear as diffuse area emissions in top-down inversions.
Herein we presented results on high-emitting methane point source from airborne campaigns covering 13 US oil and gas basins from 2021–2023. We attributed these detections to specific facility types and analyzed the relative flux contribution of respective industrial sectors and segments for ∼ 80 % of US onshore oil and gas producing regions. Our 2023 results represent the most geographically extensive survey by an airborne methane imaging spectrometer in a single year to date and contribute analyses from multiple regions that have not been represented in the methane point source literature thus far.
The study quantified ∼ 360 t h−1 across all surveyed regions in 2023, with 80 % of these emissions attributed to oil and gas facilities. Total high emitting point source flux and the relative contribution from explored facility types varied greatly from basin to basin. While oil and gas facilities contributed most methane point source flux at the national level, non-oil and gas facilities contributed the majority of emissions in several respective regions, particularly in the Appalachian and Denver–Julesburg basins, where we find significant contributions from coal and waste, respectively. For the observed emission rate range, we find a large difference in the emission rate distribution of coal facilities relative to all other non-oil and gas facility types. Cross-platform comparisons over multiple years showed varying temporal trends across basins, with decreasing high-emitting point source emissions from 2019–2023 in the Permian and in Appalachian basins from 2021–2023. Conversely, we found high-emitting point source emissions were stable in the Denver–Julesburg Basin from 2021–2023 and the Uinta Basin from 2020–2023. The work shines new light on the methane emission characteristics of high-emitting methane point sources and the varying contributions of facility types to total emissions across several unique oil and gas producing regions. Our work underscores the importance of detailed attribution for high-emitting methane point sources detected and quantified by remote sensing methods. Such attributions are needed in support of effective methane mitigation strategies, which will need to be tailored by region to efficiently reduce methane emissions.
Python 3.12 and R code used for data analyses and visualizations can be obtained from the corresponding authors upon reasonable request.
MethaneAIR point source data can be accessed online from the Earth Engine Data Catalog at https://developers.google.com/earth-engine/datasets/tags/methaneair (Earth Engine Data Catalog, 2025).
The supplement related to this article is available online at https://doi.org/10.5194/acp-25-10661-2025-supplement.
Conceptualization and design of this study were led by RG and SW. Processing and development of the MethaneAIR observations were conducted by MS, CCM, SR, EM, AC, JB, ZZ, and SW. JDW performed source attribution and analysis and visualizations of high-emitting methane point sources, with contributions from JPW, MO, AH, KM, and LG. JDW wrote the manuscript, with contributions from all authors.
The contact author has declared that none of the authors has any competing interests.
Publisher's note: Copernicus Publications remains neutral with regard to jurisdictional claims made in the text, published maps, institutional affiliations, or any other geographical representation in this paper. While Copernicus Publications makes every effort to include appropriate place names, the final responsibility lies with the authors.
We thank the two anonymous reviewers for their helpful comments on the manuscript.
This paper was edited by Steven Brown and reviewed by two anonymous referees.
Funding for MethaneSAT and MethaneAIR activities was provided in part by an anonymous source, Arnold Ventures, The Audacious Project, Ballmer Group, Bezos Earth Fund, The Children’s Investment Fund Foundation, Heising-Simons Family Fund, King Philanthropies, Robertson Foundation, Skyline Foundation, and Valhalla Foundation. For a more complete list of funders, please visit https://www.methanesat.org (last access: 18 August 2025).
Abbadi, S. H. E., Chen, Z., Burdeau, P. M., Rutherford, J. S., Chen, Y., Zhang, Z., Sherwin, E. D., and Brandt, A. R.: Technological Maturity of Aircraft-Based Methane Sensing for Greenhouse Gas Mitigation, Environ. Sci. Technol., 58, 9591–9600, https://doi.org/10.1021/acs.est.4c02439 2024.
Active Air Pollution Emitting Facilities: https://data-cdphe.opendata.arcgis.com/datasets/CDPHE::all-active-air-pollution-emitting-facilities/, last access: 18 August 2025.
Alvarez, R. A., Zavala-Araiza, D., Lyon, D. R., Allen, D. T., Barkley, Z. R., Brandt, A. R., Davis, K. J., Herndon, S. C., Jacob, D. J., Karion, A., Kort, E. A., Lamb, B. K., Lauvaux, T., Maasakkers, J. D., Marchese, A. J., Omara, M., Pacala, S. W., Peischl, J., Robinson, A. L., Shepson, P. B., Sweeney, C., Townsend-Small, A., Wofsy, S. C., and Hamburg, S. P.: Assessment of methane emissions from the U. S. oil and gas supply chain, Science, 361, eaar7204, https://doi.org/10.1126/science.aar7204 , 2018.
Brandt, A. R., Heath, G. A., Kort, E. A., O'Sullivan, F., Pétron, G., Jordaan, S. M., Tans, P., Wilcox, J., Gopstein, A. M., Arent, D., Wofsy, S., Brown, N. J., Bradley, R., Stucky, G. D., Eardley, D., and Harriss, R.: Methane Leaks from North American Natural Gas Systems, Science, 343, 733–735, https://doi.org/10.1126/science.1247045, 2014.
Brandt, A. R., Heath, G. A., and Cooley, D.: Methane Leaks from Natural Gas Systems Follow Extreme Distributions, Environ. Sci. Technol., 50, 12512–12520, https://doi.org/10.1021/acs.est.6b04303 , 2016.
CAFOs in the US: https://cafomaps.org/overview.html, last access: 18 August 2025.
Carbon Mapper: Carbon Mapper Coalition launches Tanager-1 satellite to drive transparency of methane and CO2 super-emitters and prompt global action: https://www.prnewswire.com/news-releases/carbon-mapper-coalition-launches-tanager-1-satellite-to-drive-transparency-of-methane-and-co2-super-emitters-and-prompt-global-action-302224666.html (last access: 18 August 2025), 2024.
Carranza, V., Biggs, B., Meyer, D., Townsend-Small, A., Thiruvenkatachari, R. R., Venkatram, A., Fischer, M. L., and Hopkins, F. M.: Isotopic Signatures of Methane Emissions From Dairy Farms in California's San Joaquin Valley, J. Geophys. Res., 127, e2021JG006675, https://doi.org/10.1029/2021JG006675, 2022.
CDPHE Oil and gas greenhouse gas intensity program: https://cdphe.colorado.gov/oil-and-gas-greenhouse-gas- intensity-program, last access: 18 August 2025.
Chan Miller, C., Roche, S., Wilzewski, J. S., Liu, X., Chance, K., Souri, A. H., Conway, E., Luo, B., Samra, J., Hawthorne, J., Sun, K., Staebell, C., Chulakadabba, A., Sargent, M., Benmergui, J. S., Franklin, J. E., Daube, B. C., Li, Y., Laughner, J. L., Baier, B. C., Gautam, R., Omara, M., and Wofsy, S. C.: Methane retrieval from MethaneAIR using the CO2 proxy approach: a demonstration for the upcoming MethaneSAT mission, Atmos. Meas. Tech., 17, 5429–5454, https://doi.org/10.5194/amt-17-5429-2024, 2024.
Chen, Y., Sherwin, E. D., Berman, E. S. F., Jones, B. B., Gordon, M. P., Wetherley, E. B., Kort, E. A., and Brandt, A. R.: Quantifying Regional Methane Emissions in the New Mexico Permian Basin with a Comprehensive Aerial Survey, Environ. Sci. Technol., 56, 4317–4323, https://doi.org/10.1021/acs.est.1c06458, 2022.
Chen, Y., Sherwin, E. D., Wetherley, E. B., Yakovlev, P. V., Berman, E. S. F., Hmiel, B., Lyon, D. R., Duren, R. M., Cusworth, D. H., and Brandt, A. R.: Reconciling ultra-emitter detections from two aerial hyperspectral imaging surveys in the Permian Basin, EarthArXiv [preprint], https://doi.org/10.31223/X5G68V, 2024.
Chulakadabba, A., Sargent, M., Lauvaux, T., Benmergui, J. S., Franklin, J. E., Chan Miller, C., Wilzewski, J. S., Roche, S., Conway, E., Souri, A. H., Sun, K., Luo, B., Hawthrone, J., Samra, J., Daube, B. C., Liu, X., Chance, K., Li, Y., Gautam, R., Omara, M., Rutherford, J. S., Sherwin, E. D., Brandt, A., and Wofsy, S. C.: Methane point source quantification using MethaneAIR: a new airborne imaging spectrometer, Atmos. Meas. Tech., 16, 5771–5785, https://doi.org/10.5194/amt-16-5771-2023, 2023.
Coal Mining Operation: Underground Mines, https://www.arcgis.com/home/item.html?id=88fb668bc9fb46f29fde924202e93ed2, last access: 18 August 2025.
Conrad, B. M., Tyner, D. R., and Johnson, M. R.: Robust probabilities of detection and quantification uncertainty for aerial methane detection: Examples for three airborne technologies, Remote Sens. Environ., 288, 113499, https://doi.org/10.1016/j.rse.2023.113499, 2023.
Conway, E. K., Souri, A. H., Benmergui, J., Sun, K., Liu, X., Staebell, C., Chan Miller, C., Franklin, J., Samra, J., Wilzewski, J., Roche, S., Luo, B., Chulakadabba, A., Sargent, M., Hohl, J., Daube, B., Gordon, I., Chance, K., and Wofsy, S.: Level0 to Level1B processor for MethaneAIR, Atmos. Meas. Tech., 17, 1347–1362, https://doi.org/10.5194/amt-17-1347-2024, 2024.
Cusworth, D. H., Duren, R. M., Thorpe, A. K., Olson-Duvall, W., Heckler, J., Chapman, J. W., Eastwood, M. L., Helmlinger, M. C., Green, R. O., Asner, G. P., Dennison, P. E., and Miller, C. E.: Intermittency of Large Methane Emitters in the Permian Basin, Environ. Sci. Technol. Lett., 8, 567–573, https://doi.org/10.1021/acs.estlett.1c00173, 2021.
Cusworth, D. H., Thorpe, A. K., Ayasse, A. K., Stepp, D., Heckler, J., Asner, G. P., Miller, C. E., Yadav, V., Chapman, J. W., Eastwood, M. L., Green, R. O., Hmiel, B., Lyon, D. R., and Duren, R. M.: Strong methane point sources contribute a disproportionate fraction of total emissions across multiple basins in the United States, P. Natl. Acad. Sci. USA, 119, e2202338119, https://doi.org/10.1073/pnas.2202338119, 2022.
Cusworth, D. H., Duren, R. M., Ayasse, A. K., Jiorle, R., Howell, K., Aubrey, A., Green, R. O., Eastwood, M. L., Chapman, J. W., Thorpe, A. K., Heckler, J., Asner, G. P., Smith, M. L., Thoma, E., Krause, M. J., Heins, D., and Thorneloe, S.: Quantifying methane emissions from United States landfills, Science, 383, 1499–1504, https://10.1126/science.adi7735, 2024.
Duren, R. M., Thorpe, A. K., Foster, K. T., Rafiq, T., Hopkins, F. M., Yadav, V., Bue, B. D., Thompson, D. R., Conley, S., Colombi, N. K., Frankenberg, C., McCubbin, I. B., Eastwood, M. L., Falk, M., Herner, J. D., Croes, B. E., Green, R. O., and Miller, C. E.: California's methane super-emitters, Nature, 575, 180–184, https://doi.org/10.1038/s41586-019-1720-3, 2019.
Earth Engine Data Catalog: MethaneAIR point source data, https://developers.google.com/earth-engine/datasets/tags/methaneair, last access: 18 August 2025.
Enverus: Solutions for Exploration and Production Online, https://www.enverus.com/solutions/energy-analytics/ep/, last access: 30 March 2025.
EPA (U.S. Environmental Protection Agency): Standards of Performance for New, Reconstructed, and Modified Sources and Emissions Guidelines for Existing Sources: Oil and Natural Gas Sector Climate Review, 40 CFR Part 60, Federal Register, 89, 2024.
EPA: Inventory of U. S. Greenhouse Gas Emissions and Sinks: 1990–2020, https://www.epa.gov/ghgemissions/inventory-us-greenhouse-gas-emissions-and-sinks, last access: 18 August 2025.
Fiehn, A., Eckl, M., Kostinek, J., Gałkowski, M., Gerbig, C., Rothe, M., Röckmann, T., Menoud, M., Maazallahi, H., Schmidt, M., Korbeń, P., Neçki, J., Stanisavljević, M., Swolkień, J., Fix, A., and Roiger, A.: Source apportionment of methane emissions from the Upper Silesian Coal Basin using isotopic signatures, Atmos. Chem. Phys., 23, 15749–15765, https://doi.org/10.5194/acp-23-15749-2023, 2023.
Guanter, L., Warren, J., Omara, M., Chulakadabba, A., Roger, J., Sargent, M., Franklin, J. E., Wofsy, S. C., and Gautam, R.: Remote sensing of methane point sources with the MethaneAIR airborne spectrometer, EGUsphere [preprint], https://doi.org/10.5194/egusphere-2024-3577, 2025.
Hajny, K. D., Salmon, O. E., Rudek, J., Lyon, D. R., Stuff, A. A., Stirm, B. H., Kaeser, R., Floerchinger, C. R., Conley, S., Smith, M. L., and Shepson, P. B.: Observations of Methane Emissions from Natural Gas-Fired Power Plants, Environ. Sci. Technol., 53, 8976–8984, https://doi.org/10.1021/acs.est.9b01875, 2019.
Hmiel, B., Lyon, D. R., Warren, J. D., Yu, J., Cusworth, D. H., Duren, R. M., and Hamburg, S. P.: Empirical quantification of methane emission intensity from oil and gas producers in the Permian basin, Environ. Res. Lett., 18, 024029, https://doi.org/10.1088/1748-9326/acb27e, 2023.
IEA: Global Methane Tracker, https://www.iea.org/reports/global-methane-tracker-2024 (last access: 18 August 2025), 2024.
Irakulis-Loitxate, I., Guanter, L., Liu, Y.-N., Varon, D. J., Maasakkers, J. D., Zhang, Y., Chulakadabba, A., Wofsy, S. C., Thorpe, A. K., Duren, R. M., Frankenberg, C., Lyon, D. R., Hmiel, B., Cusworth, D. H., Zhang, Y., Segl, K., Gorroño, J., Sánchez-García, E., Sulprizio, M. P., Cao, K., Zhu, H., Liang, J., Li, X., Aben, I., and Jacob, D. J.: Satellite-based survey of extreme methane emissions in the Permian basin, Sci. Adv., 7, eabf4507, https://doi.org/10.1126/sciadv.abf4507, 2021.
Johnson, M. R., Bradley, C. M., and Tyner, D. R.: Creating measurement-based oil and gas sector methane inventories using source-resolved aerial surveys, Communications Earth and Environment, 4, 139, https://doi.org/10.1038/s43247-023-00769-7, 2023.
Kunkel, W., Thorpe, M., Carre-Burritt, A., Aivazian, G., Snow, N., Harris, J., Mueller, T., and Roos, P.: Extension of Methane Emission Rate Distribution for Permian Basin Oil and Gas Production Infrastructure by Aerial LiDAR, Environ. Sci. Technol., 57, 12234–12241, https://doi.org/10.1021/acs.est.3c00229, 2023.
Lauvaux, T., Giron, C., Mazzolini, M., Shindell, D., and Ciais, P.: Global assessment of oil and gas methane ultra-emitters, Science, 375, 557–561, https://doi.org/10.1126/science.abj4351, 2022.
Lavoie, T. N., Shepson, P. B., Cambaliza, M. O. L., Stirm, B. H., Conley, S., Mehrotra, S., Faloona, I. C., and Lyon, D.: Spatiotemporal Variability of Methane Emissions at Oil and Natural Gas Operations in the Eagle Ford Basin, Environ. Sci. Technol., 51, 8001–8009, https://doi.org/10.1021/acs.est.7b00814, 2017.
LMOP Landfill and Project Database: https://www.epa.gov/lmop/lmop-landfill-and-project-database, last access: 6 December 2024.
Lu, X., Jacob, D. J., Zhang, Y., Shen, L., Sulprizio, M. P., Maasakkers, J. D., Varon, D. J., Qu, Z., Chen, Z., Hmiel, B., Parker, R. J., Boesch, H., Wang, H., He, C., and Fan, S.: Observation-derived 2010–2019 trends in methane emissions and intensities from US oil and gas fields tied to activity metrics, P. Natl. Acad. Sci. USA, 120, e2217900120, https://doi.org/10.1073/pnas.2217900120, 2023.
Luppens, J. A., Scott, D. C., Haacke, J. E., Osmonson, L. M., and Pierce, P. E.: Coal geology and assessment of coal resources and reserves in the Powder River Basin, Wyoming and Montana, U.S. Geological Survey, https://doi.org/10.3133/pp1809, 2015.
Lyon, D. R., Hmiel, B., Gautam, R., Omara, M., Roberts, K. A., Barkley, Z. R., Davis, K. J., Miles, N. L., Monteiro, V. C., Richardson, S. J., Conley, S., Smith, M. L., Jacob, D. J., Shen, L., Varon, D. J., Deng, A., Rudelis, X., Sharma, N., Story, K. T., Brandt, A. R., Kang, M., Kort, E. A., Marchese, A. J., and Hamburg, S. P.: Concurrent variation in oil and gas methane emissions and oil price during the COVID-19 pandemic, Atmos. Chem. Phys., 21, 6605–6626, https://doi.org/10.5194/acp-21-6605-2021, 2021.
Mineral Resources of Wyoming: https://portal.wsgs.wyo.gov/arcgis/apps/webappviewer/index.html?id=e421771464634545a284784588515835, last access: 18 August 2025.
New Mexico Environment Department Data: https://data-nmenv.opendata.arcgis.com/, last access: 18 August 2025.
OCD Permitting Incident Details: https://wwwapps.emnrd.nm.gov/OCD/OCDPermitting/Data/Incidents/IncidentDetails.aspx?id=nAPP2320054838 (last access: 18 August 2025), 2024.
Ocko, I. B., Naik, V., and Paynter, D.: Rapid and reliable assessment of methane impacts on climate, Atmos. Chem. Phys., 18, 15555–15568, https://doi.org/10.5194/acp-18-15555-2018, 2018.
Ohio Emissions Inventory point source data: https://epa.ohio.gov/divisions-and-offices/air-pollution-control/reports-and-data/download-eis-data-and-reports, last access: 18 August 20.25
Omara, M., Zimmerman, N., Sullivan, M. R., Li, X., Ellis, A., Cesa, R., Subramanian, R., Presto, A. A., and Robinson, A. L.: Methane Emissions from Natural Gas Production Sites in the United States: Data Synthesis and National Estimate, Environ. Sci. Technol., 52, 12915–12925, https://doi.org/10.1021/acs.est.8b03535, 2018.
Omara, M., Zavala-Araiza, D., Lyon, D. R., Hmiel, B., Roberts, K. A., and Hamburg, S. P.: Methane emissions from US low production oil and natural gas well sites, Nat. Commun., 13, 2085, https://doi.org/10.1038/s41467-022-29709-3, 2022.
Omara, M., Gautam, R., O'Brien, M. A., Himmelberger, A., Franco, A., Meisenhelder, K., Hauser, G., Lyon, D. R., Chulakadabba, A., Miller, C. C., Franklin, J., Wofsy, S. C., and Hamburg, S. P.: Developing a spatially explicit global oil and gas infrastructure database for characterizing methane emission sources at high resolution, Earth Syst. Sci. Data, 15, 3761–3790, https://doi.org/10.5194/essd-15-3761-2023, 2023.
Omara, M., Himmelberger, A., MacKay, K., Williams, J. P., Benmergui, J., Sargent, M., Wofsy, S. C., and Gautam, R.: Constructing a measurement-based spatially explicit inventory of US oil and gas methane emissions (2021), Earth Syst. Sci. Data, 16, 3973–3991, https://doi.org/10.5194/essd-16-3973-2024, 2024.
Riddick, S. N., Mbua, M., Anand, A., Kiplomo, E., Satos, A., Upreti, A., Zimmerle, D. J.: Estimate Total Methane Emissions from the Denver–Julesburg Basin Using Bottom-Up Approaches, Gases, 4, 236-252, https://doi.org/10.3390/gases4030014, 2024.
Sadavarte, P., Pandey, S., and Maasakkers, J. D.: A high-resolution gridded inventory of coal mine methane emissions for India and Australia, Elementa: Science of the Anthropocene, 10, https://doi.org/10.1525/elementa.2021.00056, 2022.
Shen, L., Gautam, R., Omara, M., Zavala-Araiza, D., Maasakkers, J. D., Scarpelli, T. R., Lorente, A., Lyon, D., Sheng, J., Varon, D. J., Nesser, H., Qu, Z., Lu, X., Sulprizio, M. P., Hamburg, S. P., and Jacob, D. J.: Satellite quantification of oil and natural gas methane emissions in the US and Canada including contributions from individual basins, Atmos. Chem. Phys., 22, 11203–11215, https://doi.org/10.5194/acp-22-11203-2022, 2022.
Sherwin, E. D., Rutherford, J. S., Zhang, Z., Chen, Y., Wetherley, E. B., Yakovlev, P. V., Berman, E. S. F., Jones, B. B., Cusworth, D. H., Thorpe, A. K., Ayasse, A. K., Duren, R. M., and Brandt, A. R.: US oil and gas system emissions from nearly one million aerial site measurements, Nature, 627, 328–334, https://doi.org/10.1038/s41586-024-07117-5, 2024.
Staebell, C., Sun, K., Samra, J., Franklin, J., Chan Miller, C., Liu, X., Conway, E., Chance, K., Milligan, S., and Wofsy, S.: Spectral calibration of the MethaneAIR instrument, Atmos. Meas. Tech., 14, 3737–3753, https://doi.org/10.5194/amt-14-3737-2021, 2021.
Tullos, E. E., Stokes, S. N., Cardoso-Saldaña, F. J., Herndon, S. C., Smith, B. J., and Allen, D. T.: Use of Short Duration Measurements to Estimate Methane Emissions at Oil and Gas Production Sites, Environ. Sci. Tech. Let, 8, 463–467, https://doi.org/10.1021/acs.estlett.1c00239, 2021.
Underground and Surface Coal Mines: https://www.wvgs.wvnet.edu/gis/cbmp/all_mining.html, last access: 18 August 2025.
Varon, D. J., Jacob, D. J., McKeever, J., Jervis, D., Durak, B. O. A., Xia, Y., and Huang, Y.: Quantifying methane point sources from fine-scale satellite observations of atmospheric methane plumes, Atmos. Meas. Tech., 11, 5673–5686, https://doi.org/10.5194/amt-11-5673-2018, 2018.
West Virginia Department of Environmental Protection GIS Data: https://tagis.dep.wv.gov/home/gis%20data, last access: 18 August 2025.
Williams, J. P., Omara, M., Himmelberger, A., Zavala-Araiza, D., MacKay, K., Benmergui, J., Sargent, M., Wofsy, S. C., Hamburg, S. P., and Gautam, R.: Small emission sources in aggregate disproportionately account for a large majority of total methane emissions from the US oil and gas sector, Atmos. Chem. Phys., 25, 1513–1532, https://doi.org/10.5194/acp-25-1513-2025, 2025.
Yu, J., Hmiel, B., Lyon, D. R., Warren, J., Cusworth, D. H., Duren, R. M., Chen, Y., Murphy, E. C., and Brandt, A. R.: Methane Emissions from Natural Gas Gathering Pipelines in the Permian Basin, Environ. Sci. Tech. Let., 9, 969–974, https://doi.org/10.1021/acs.estlett.2c00380, 2022.
Zavala-Araiza, D., Alvarez, R. A., Lyon, D. R., Allen, D. T., Marchese, A. J., Zimmerle, D. J., and Hamburg, S. P.: Super-emitters in natural gas infrastructure are caused by abnormal process conditions, Nat. Commun., 8, 14012, https://doi.org/10.1038/ncomms14012, 2017.
Zhou, X., Passow, F. H., Rudek, J., von Fisher, J. C., Hamburg, S. P., and Albertson, J. D.: Estimation of methane emissions from the U. S. ammonia fertilizer industry using a mobile sensing approach, Elementa: Science of the Anthropocene, 7, 19, https://doi.org/10.1525/elementa.358, 2019.