the Creative Commons Attribution 4.0 License.
the Creative Commons Attribution 4.0 License.
 | 16 Sep 2025
The influence of ammonia emission inventories on size-resolved global atmospheric aerosol composition and acidity
Xurong Wang
Alexandra P. Tsimpidi
Zhenqi Luo
Benedikt Steil
Andrea Pozzer
Jos Lelieveld
Vlassis A. Karydis
Ammonia (NH3) is an abundant alkaline gas in the atmosphere and a key precursor in the formation of particulate matter. While emissions of other aerosol precursors such as SO2 and NOx have decreased significantly, global NH3 emissions are stable or increasing, and this trend is projected to continue. This study investigates the impact of NH3 emission changes on size-resolved aerosol composition and acidity using the atmospheric chemistry–climate model EMAC (ECHAM5/MESSy Atmospheric Chemistry). Rather than directly perturbing NH3 emissions, we employ three distinct emission inventories: two bottom-up inventories and one derived using an updated top-down method. The results reveal that sulfate–nitrate–ammonium aerosols in two fine-mode size ranges (0–1 and 1–2.5 µm) show the greatest sensitivity to NH3 emission changes. Regional responses vary depending on the local chemical environment of secondary inorganic aerosols. In “NH3-rich” regions (e.g., East Asia and Europe), the abundance of NH3 partially offsets the effects of reduced NH3 emissions when NOx and SO2 are available, especially for aerosols in the 1–2.5 µm range. This underscores the importance of coordinated control strategies for NH3, NOx, and SO2 emissions. Further, we find that NH3 has a buffering effect in densely populated areas, maintaining aerosol acidity at moderate levels and mitigating drastic pH shifts. While pH changes correlate strongly with NH3 variability, they are also influenced by concurrent changes in SO2 and NOx emissions. These results highlight the critical role of NH3 in shaping aerosol acidity, arguing for size-specific approaches to managing particulate matter.
- Article
(5776 KB) - Full-text XML
-
Supplement
(2774 KB) - BibTeX
- EndNote


As an abundant alkaline gas in the atmosphere, ammonia (NH3) acts as a precursor in the formation of particulate matter by neutralizing atmospheric acids (e.g., H2SO4, HNO3) to form sulfate–nitrate–ammonium (SNA) aerosols (Li et al., 2018; Chen et al., 2016; Wang et al., 2013), which are the main secondary inorganic components of PM2.5 (particulate matter with a diameter of 2.5 µm or less). By condensing onto freshly nucleated particles, NH3 enhances the growth rate of new particles as well as their hydrophilicity (Wang et al., 2020; Li et al., 2018). This can degrade air quality and change the solar radiative balance by interaction with radiation and clouds (Che et al., 2009; Zhao et al., 2011; Yao et al., 2018). In addition, the conjugate base–acid pair NH3 NH acts as the major buffer that inhibits changes in aerosol acidity (Chen et al., 2019; Zheng et al., 2020; Karydis et al., 2021).
Anthropogenic emissions are the main source of atmospheric NH3, with an average global contribution of 76 %, dominated by agricultural activities, including livestock farming and the fertilization of soils (Schlesinger and Hartley, 1992; Dentener and Crutzen, 1994; Bouwman et al., 1997; Olivier et al., 1998; Van Aardenne et al., 2001; Sutton et al., 2013). Meanwhile, the importance of non-agricultural sources, such as industrial emissions and fossil fuel combustion has been highlighted by studies focusing on severe haze episodes in East Asia (Chang et al., 2019; Liu et al., 2018a; Pan et al., 2016). The construction of high-resolution regional or global datasets has characterized the spatiotemporal patterns of NH3 emissions, with the most common datasets consisting of bottom-up inventories and top-down modeling inversion methods. Bottom-up emission inventories rely on activity data and emission factors, the latter being sensitive to assumptions about fertilizer types, local soil, and meteorological properties (Bouwman et al., 2002; Søgaard et al., 2002; Xu et al., 2024). Zhang et al. (2018) evaluated discrepancies between bottom-up NH3 emission inventories to exceed a factor of 2 due to the uncertainties in emission factors, meteorological properties, and agricultural statistics (Beusen et al., 2008). Crippa et al. (2018) pointed out that the uncertainty in estimated NH3 emissions is largest among all pollutants in the Emissions Database for Global Atmospheric Research (EDGAR v4.3.2), with a range of variation from 186 % to 294 % in 2012. In contrast, the ability of satellites to measure NH3 abundance combined with numerical simulations allows a better characterization of the spatial distribution and seasonality of NH3 emissions, but the low signal-to-noise ratio over low-emission areas limits the accuracy of retrieval products (Morán et al., 2016; Xu et al., 2016; Kong et al., 2019). Using a hybrid inverse modeling approach, Chen et al. (2021) optimized the NH3 emission inventory (NEI) over the United States by combining CMAQ model simulations with constraints from the Infrared Atmospheric Sounding Interferometer (IASI) retrieval product. They found a 26 % low bias of NH3 emissions in the NEI, and the optimized NH3 emission inventory improved the model performance of PM2.5 mass concentration in the Midwest USA, with the normalized mean bias of NH and NO decreasing from 27 % to 22 % and from 64 % to 55 %, respectively.
Recently, the emissions of SO2 and NOx have decreased due to the implementation of related clean-air policies in East Asia, North America, and Europe (Zheng et al., 2018; Hand et al., 2012; Russell et al., 2012; Aas et al., 2019; Gong et al., 2024), while the emissions of NH3 have remained stable or have slightly increased in major agricultural regions such as China (Xu et al., 2016), the United States (Yu et al., 2018), and Europe (Fortems-Cheiney et al., 2022). The increase in NH3 emissions is associated with increasing fertilizer use and local temperatures (Warner et al., 2017; Xu et al., 2016; Skjøth and Geels, 2013; Xu et al., 2019), and such trends are expected to continue on a global scale throughout the century (IPCC, 2014). Driven by such emission trends of SO2, NOx, and NH3, the main composition of SNA has changed in large regions with a shift from an ammonium sulfate to an ammonium nitrate formation regime (Tsimpidi et al., 2024; Lei et al., 2021; Jo et al., 2020; Zhou et al., 2019; Shah et al., 2018; Wang et al., 2013; Hauglustaine et al., 2014). Li et al. (2017) evaluated that during the period 1989 to 2013, the increasing trend of sulfate (SO) and ammonium (NH) mass concentration in India and China occurred at a rate > 0.1 , while decreasing trends were found in North America and Europe at a rate of about 0.1 . The reduction in SO2 and NOx emissions decreases the atmospheric availability of H2SO4 and HNO3, thereby reducing the demand for NH3 to neutralize these acids and form particulate NH. As NH3 emissions have remained stable or slightly increased, this leads to an accumulation of NH3 in the gas phase (Liu et al., 2018b). Warner et al. (2017) assessed that the average increase rate of NH3 mass concentration from 2002 to 2016 in the United States, Europe, and China was 2.6 % yr−1, 1.8 % yr−1, and 2.3 % yr−1, respectively. Some studies further pointed out that the increase in NH3 concentration may offset the effectiveness of PM2.5 control achieved via SO2 and NOx emission reduction by promoting the formation of nitrate (NO) (Huang et al., 2021; Cai et al., 2017; Zhang and Geng, 2019; Fu et al., 2017).
Several studies concluded that reducing NH3 emissions would be a cost-effective way to control PM2.5 concentrations (Gu et al., 2021; Tsimpidi et al., 2007; Erisman and Schaap, 2004). However, the response of SNA to changes in its precursors is not linear (Pozzer et al., 2017; Wang et al., 2011, 2013; Tsimpidi et al., 2007; West et al., 1999) because the gas–particle partitioning of NH3 NH and HNO3 NO is influenced by several parameters, such as temperature, liquid water content, and aerosol acidity (Xu et al., 2020; Nenes et al., 2020; Guo et al., 2018). Nenes et al. (2020) developed a conceptual framework to describe the sensitivity of particulate matter to NOx and NH3 emissions, highlighting the critical influence of aerosol acidity and liquid water content on particulate matter formation. Based on sensitivity tests, Guo et al. (2018) evaluated that the response of NO to NH3 reduction shows an apparent decrease only when the aerosol pH falls below the value of 3.
On the other hand, reductions in SO2 and NOx emissions are expected to reduce aerosol acidity, but recent studies revealed that aerosol acidity does not decrease as expected (Chen et al., 2019; Guo et al., 2017b; Zheng et al., 2022; Karydis et al., 2021). Aerosol acidity affects many processes involving the atmosphere and various aspects of the Earth system (Pye et al., 2020; Tilgner et al., 2021; Karydis et al., 2021) as well as human health (Dockery et al., 1993, 1996; Thurston et al., 1994; Spengler et al., 1996). Weber et al. (2016) found that the acidity of PM2.5 in the southeastern United States has remained at a relatively constant level with a pH value of 0–2 over the past 15 years, despite a 70 % reduction in SO concentration. A lack of aerosol acidity trend was also reported in China (Zhou et al., 2022). This is mainly caused by the buffering effect of NH3 NH (Chen et al., 2019; Zheng et al., 2022; Zheng et al., 2020). To investigate this, Song et al. (2019) derived an equation from the partitioning of NH3 and estimated that a unit increase in pH requires a 10-fold increase in NH3 concentration, which is consistent with the findings of Guo et al. (2017b). The regional variation in aerosol acidity is considerable, and the pH of PM2.5 in northern China is in the range of 4 to 5, which is higher than in Europe and the United States (Shi et al., 2017, 2019; Liu et al., 2017; Guo et al., 2015, 2016, 2017a; Karydis et al., 2021). This is caused by multiple driving factors, including aerosol mass concentration and composition, NH3 mass concentration, aerosol water content, and meteorological factors (Ding et al., 2019; Zhang et al., 2021a). However, the main driver of the difference in aerosol acidity remains controversial. Zheng et al. (2020) pointed out that aerosol water content is the most important factor causing the regional variation in aerosol acidity, while Zhang et al. (2021a) emphasized the equal importance of aerosol mass concentration and chemical composition for the aerosol acidity contrasts between China and the United States.
Almost all recent studies that discuss the response of aerosol composition and acidity to changes in NH3 emission trends focus on the fine mode (e.g., PM2.5). The size-resolved composition of SNA is not uniform (Karydis et al., 2016; Fang et al., 2017; Karydis et al., 2011, 2010; Guo et al., 2017a), and NH and SO are mainly concentrated in the fine mode (Wang et al., 2012; Seinfeld and Pandis, 2016), while NO aerosol can be formed on the surface of supermicron particles via heterogeneous chemistry (Allen et al., 2015). Furthermore, Milousis et al. (2024) revealed that the acidity of fine-mode aerosol is more sensitive to NH3 emission than coarse-mode aerosol. Reducing the NH3 emissions by half, the simulated pH of fine- and coarse-mode aerosol decreased by up to 3 and 1.5 units, respectively. Aerosol acidity tends to decrease with increasing particle size, with pH varying by up to 6 units (Craig et al., 2018; Fang et al., 2017; Bougiatioti et al., 2016). Size-resolved aerosol acidity is associated with different formation pathways (Tilgner et al., 2021; Cheng et al., 2016). Ding et al. (2019) found that the coarse-mode aerosol shifted from neutral to weakly acidic with the increase in NO and SO during severe hazy days. Cheng et al. (2016) further pointed out that the dominant oxidant in SO production by SO2 oxidation changes with the ambient aerosol acidity. Therefore, it is necessary to comprehensively investigate the response of size-resolved chemical composition and acidity to changes in NH3 emissions.
In this study, we investigate the influence of NH3 emissions on size-resolved aerosol composition and acidity using the EMAC (ECHAM5/MESSy Atmospheric Chemistry) model. The EMAC model, coupled with the ISORROPIA II thermodynamic module, provides a robust framework for simulating global aerosol–chemistry–climate interactions and estimating aerosol pH under varying environmental conditions. Rather than directly perturbing NH3 emissions, we employ three distinct emission inventories: two bottom-up inventories (CAMS and CEDS_GBD) and one derived using an updated top-down approach (Luo et al., 2022). These scenarios allow us to assess the sensitivity of size-resolved SNA aerosols to realistic variations in NH3 emissions, in conjunction with co-varying SO2 and NOx trends. Model results are evaluated against satellite-derived NH3 columns and ground-based aerosol composition observations. Our analysis spans four aerosol size ranges (0–1, 1–2.5, 2.5–5, and 5–10 µm) and includes regional assessments over North America, Europe, and East Asia to explore chemical regime shifts and buffering capacity.
EMAC (ECHAM5/MESSy) is a global atmospheric chemistry and climate model that includes a number of submodels describing atmospheric processes and interactions among oceans, land, and anthropogenic influences (Jöckel et al., 2016). These submodels are linked to the base model, the fifth-generation European Centre Hamburg general circulation model (ECHAM5; Roeckner et al., 2006), via the Modular Earth Submodel System (MESSy; Jöckel et al., 2005). In this study, the horizontal resolution of the EMAC model is T63L31, which corresponds to a grid resolution of about 1.875° × 1.875° (Jöckel et al., 2010) and 31 vertical layers extending up to 25 km altitude. EMAC is applied for 4 years, from 2009 to 2012 with the first year used as spin-up. The ERA5 meteorological reanalysis data (Hersbach et al., 2020), with a significantly enhanced horizontal resolution of 31 km and hourly output throughout, are used in EMAC to nudge the simulation.
In EMAC, organic aerosol (OA) formation is simulated by the ORACLE module (Tsimpidi et al., 2014, 2018), where logarithmically spaced saturation concentration bins are used to describe the organic aerosol components based on their volatility. The aerosol microphysics and gas–aerosol partitioning are calculated by the Global Modal-aerosol eXtension (GMXe) module described by Pringle et al. (2010), which has the same microphysical core as the M7 submodel (Vignati et al., 2004). The aerosol size distribution is treated by 7 lognormal modes, including 4 hydrophilic and 3 hydrophobic modes, covering nucleation (soluble only), Aitken, accumulation, and coarse modes (both soluble and insoluble). To determine size-resolved aerosol composition and pH, we sum the contributions of each aerosol component, water content, and H+ concentration across all GMXe modes corresponding to a given size range. This is achieved by calculating the volume fraction of the lognormal distribution of each mode that falls within the specified size limits. The atmospheric chemistry module MECCA (Module Efficiently Calculating the Chemistry of the Atmosphere), which contains a comprehensive atmospheric reaction, is used to calculate the gas concentrations (Sander et al., 2019). The SEDI module is used to compute aerosol particle sedimentation (Kerkweg et al., 2006). Dry deposition and wet deposition of gas and particle species are calculated by the DRYDEP module (Kerkweg et al., 2006) and the SCAV module (Tost et al., 2006), respectively. The CLOUD submodel (Roeckner et al., 2006) is used to calculate cloud properties and microphysics, utilizing the microphysical scheme of Lohmann and Ferrachat (2010) and a physically based treatment of liquid (Karydis et al., 2017) and ice crystal (Bacer et al., 2018) activation processes.
An advanced parameterization scheme is incorporated into the EMAC model to calculate the dust emission flux online (Astitha et al., 2012). The scheme uses the online meteorological fields from the EMAC model, such as temperature, pressure, relative humidity, soil moisture, and surface friction velocity, to calculate the threshold friction velocity, which is the initial step of dust production. Above the threshold friction velocity, dust emission is possible. Following Karydis et al. (2016), the emissions of individual crustal species in this study are estimated as constant fractions of the dust emission (Klingmüller et al., 2018). These fractional factors depend on the geological information, which includes different dust emission sources. Karydis et al. (2021) pointed out that the crustal ions (Ca2+, Mg2+, K+, and Na+), especially Ca2+, have significantly contributed to maintaining the particle pH value at the level of 4.5–5 in East Asia during the last decade. The importance of crustal ions in determining aerosol acidity and factors such as liquid water content, aerosol mass concentration, and chemical composition, has been highlighted in other studies (Zheng et al., 2020; Zhang et al., 2021a; Ding et al., 2019).
2.1 NH3 emission scheme
In this study, three NH3 emission schemes are implemented in specific model simulation cases to assess the impact of NH3 emission variability on aerosol composition and acidity (Table 1). These include two bottom-up inventories used in the base and CEDS cases and one top-down inventory applied in the Top-Dep case. In addition, two sensitivity simulations are conducted: the Meta case, which assumes metastable aerosol thermodynamics (described in detail in Sect. 2.2), and the noNH3 case, in which all NH3 emissions are turned off. The latter is used to provide insights into the role of NH3 in shaping the simulated size-resolved aerosol acidity.
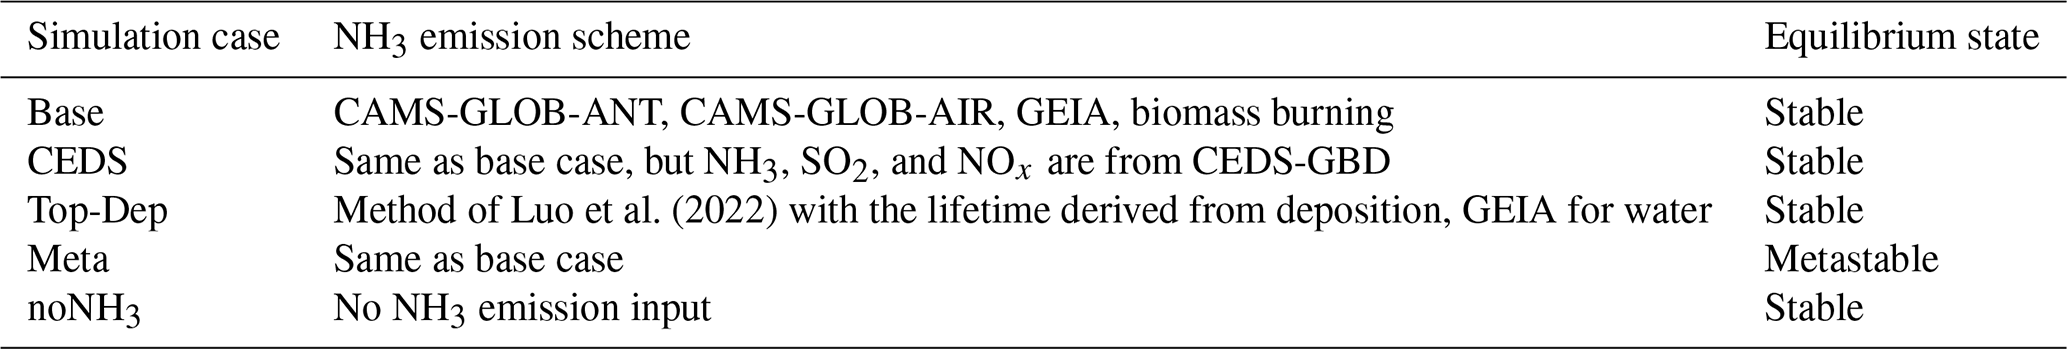
2.2 Bottom-up scheme
Bottom-up schemes are applied in the base and the CEDS case, with different anthropogenic emission inventories. The anthropogenic emission inventory utilized in the base case simulation is CAMS-GLOB-ANT (v4.2, https://eccad.sedoo.fr, last access: 8 September 2025, abbreviated as “CAMS”), which contains 17 sectors with a spatial resolution of 0.1° × 0.1° and monthly temporal resolution. With the basic data of 2010 from the Emission Database for Global Atmospheric Research (EDGAR, v4.3.2), CAMS extends the period to recent years based on the trend factors derived from the Community Emissions Data System (Hoesly et al., 2018). Meanwhile, Hoesly et al. (2018) pointed out that there are limitations to the system, especially in the emission trends for specific sectors, and emphasized the need for more detailed data to be incorporated into regional emission inventories. The emission inventory used in the CEDS sensitivity simulation case for aerosol precursor emissions (NH3, SO2, and NOx) is CEDS_GBD-MAPS (McDuffie et al., 2020), abbreviated as “CEDS_GBD”. The CEDS_GBD is developed using the Community Emissions Data System and is reported as a function of 11 anthropogenic sectors and 4 fuel categories, with a spatial resolution of 0.5° × 0.5° and monthly temporal resolution. Assuming that the specific regional emission inventories are more accurate, McDuffie et al. (2020) updated the activity data and the core scaling procedure, modified the final emission gridding and aggregation procedures, and then utilized several regional emission inventories to improve the previous version of CEDS_GBD via the scaling procedure, which can not only reduce the discrepancy with other global emission inventories but also help to maintain the timeliness and regional accuracy of the global estimates. However, they also pointed out that the sources of uncertainty in the CEDS_GBD are similar to those in the CEDS.
Other NH3 emissions include aircraft emissions from the CAMS-GLOB-AIR inventory (v1.1, https://eccad.sedoo.fr, last access: 8 September 2025, land and water biological emissions from the Global Emissions Inventory Activity (GEIA) inventory, and biomass burning emissions calculated by the BIOBURN submodel (Kaiser et al., 2012). BIOBURN determines the flux based on biomass burning emission factors and dry matter combustion rates from the Global Fire Assimilation System (GFAS), which calculates biomass burning emissions by assimilating fire radiative power (FRP) observations from MODIS (Andreae, 2019).
2.2.1 Top-down scheme
The NH3 emission inventory over land is updated by a top-down method with the constraint of IASI satellite observations (https://iasi.aeris-data.fr/, last access: 8 September 2025 developed by Luo et al. (2022). This fast top-down method updates the prior NH3 emissions (, molec. m−2 s−1) with a correction term positively proportional to the biases between observed (, molec. m−2) and simulated (, molec. m−2) monthly averaged NH3 total column densities and inversely proportional to the NH3 lifetime (, s) (Eq. 1). The is calculated as the ratio of the simulated NH3 column and the sum of the simulated loss rate of the NHx family (NHx ≡ NH3 + NH) through dry and wet deposition (Eq. 2).
The fast top-down method relies on the total column concentrations retrieved by IASI. According to Dammers et al. (2019), the dominant source of uncertainty in the IASI observational product stems from the systematic bias, with the negative bias estimated to be between 25 % and 40 %, compared to site observations (Dammers et al., 2017). While this method simplifies the chemical and physical processes governing NH3, Luo et al. (2022) identified large uncertainties in regions like Central Asia and tropical Africa due to poorly constrained sources by IASI observations in these areas. Nonetheless, they demonstrated that simulations driven by the updated top-down emission inventory show better consistency with satellite observations compared to those driven by the prior emission inventory.
2.2.2 Emission comparison
Overall, the global NH3 emissions used in this study in all simulation cases range from 73 to 85 Tg yr−1 (Table 2), which is within the reported range of the current literature from 52 to 91 Tg yr−1 (Schlesinger and Hartley, 1992; Dentener and Crutzen, 1994; Bouwman et al., 1997; Olivier et al., 1998; Van Aardenne et al., 2001; Sutton et al., 2013). The distribution of the global NH3 emission flux derived from the base case and the absolute emission flux difference between the sensitivity simulation cases and the base case are shown in Fig. 1. Significant regional variations in NH3 emission flux are found in Fig. 1a, with the maximum emission flux exceeding 7 g m−2 yr−1 in northern India, eastern China, and central Europe, all regions with high population density. Other emission hotspots include the eastern United States, southeastern Latin America, and central and eastern Africa. The base case is able to capture the global NH3 emission hotspots reported by Van Damme et al. (2018). Meanwhile, the minimum flux below 0.01 g m−2 yr−1 is located in the Antarctic and Arctic regions and the Sahara, as well as in remote oceans, where there is little impact of human activities. Agricultural activities including livestock and fertilization are the main source of NH3 emissions in China, India, and the United States (Liu et al., 2022; Khan et al., 2020; Van Damme et al., 2018; Sahoo et al., 2024), while soil emissions, biomass burning, and domestic fires are the main contributors to NH3 emissions in central and eastern Africa (Hickman et al., 2021; Delon et al., 2012).
Table 2Comparison of annual NH3 emissions (Tg yr−1) across global and regional scales between the two sensitivity cases and the base case.
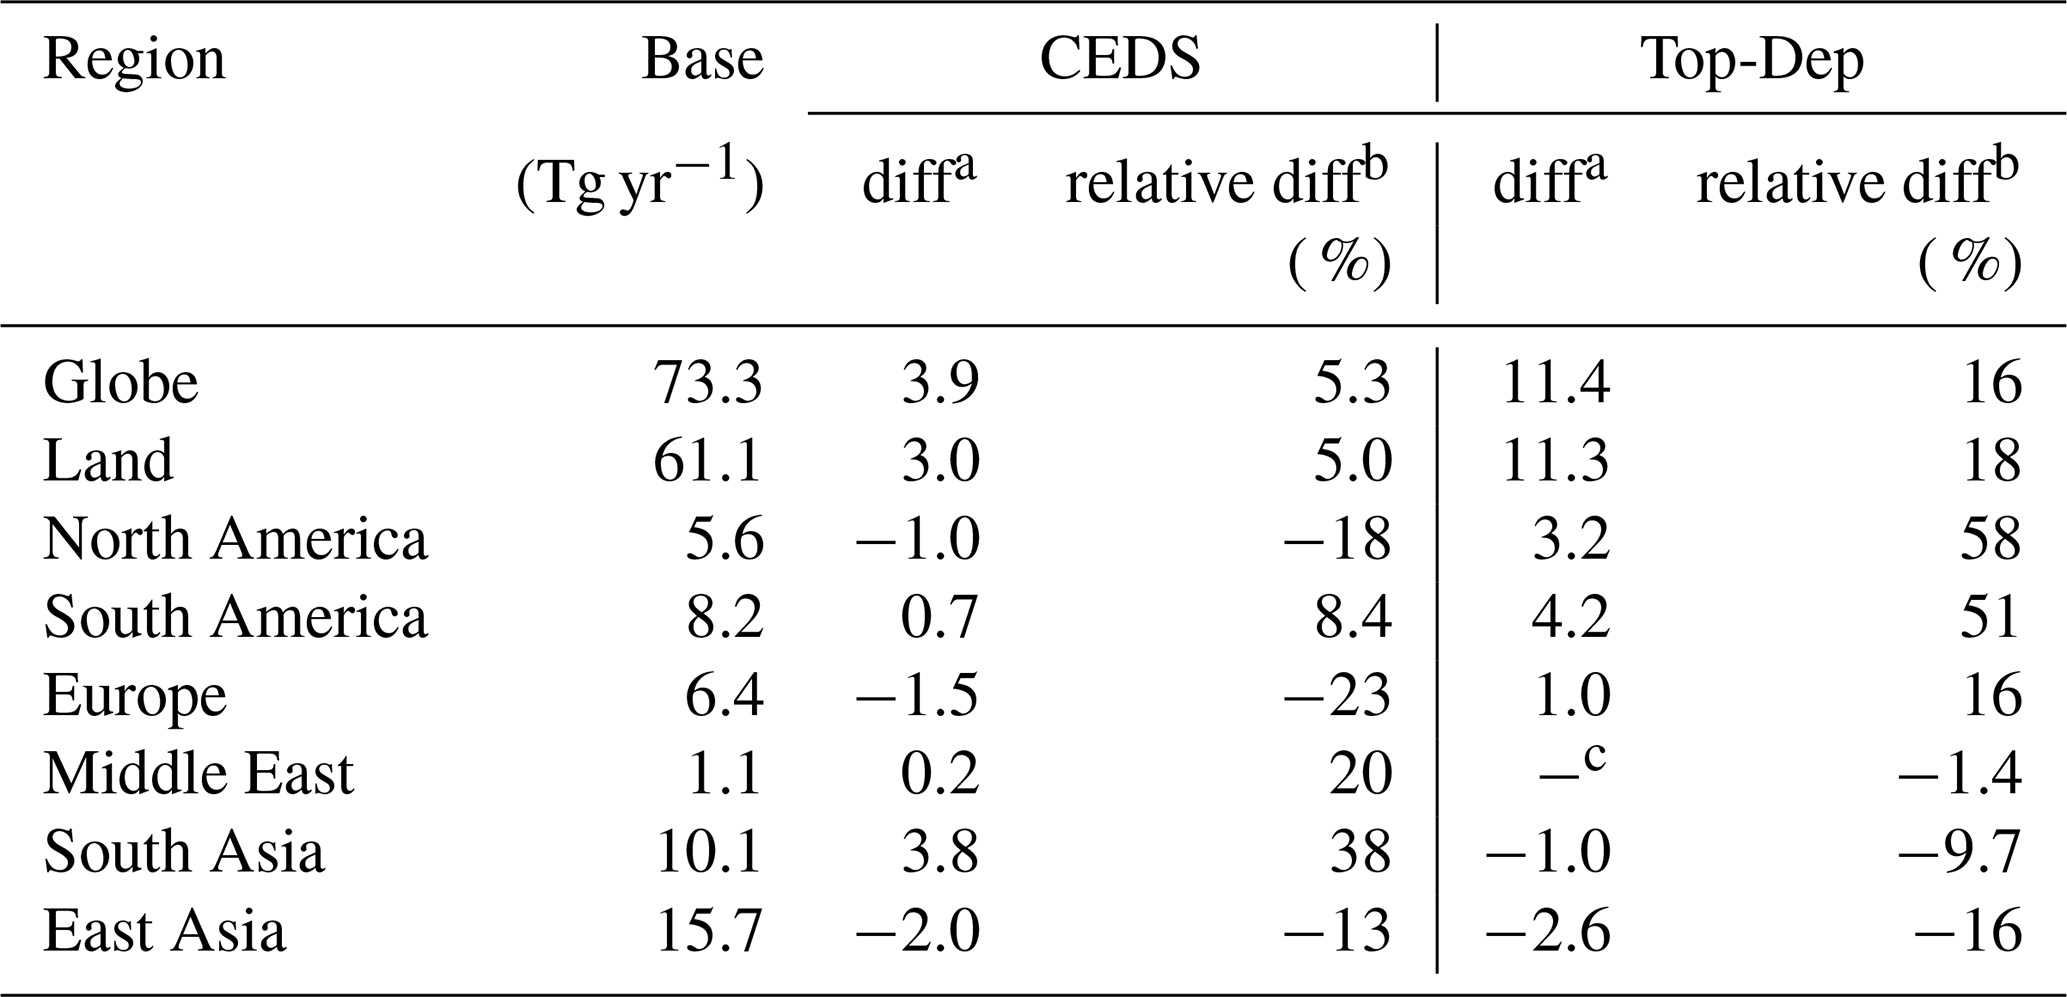
a Absolute difference between sensitivity cases and the base case.
b Relative difference between sensitivity cases and the base case.
c Below the 0.1 precision threshold.
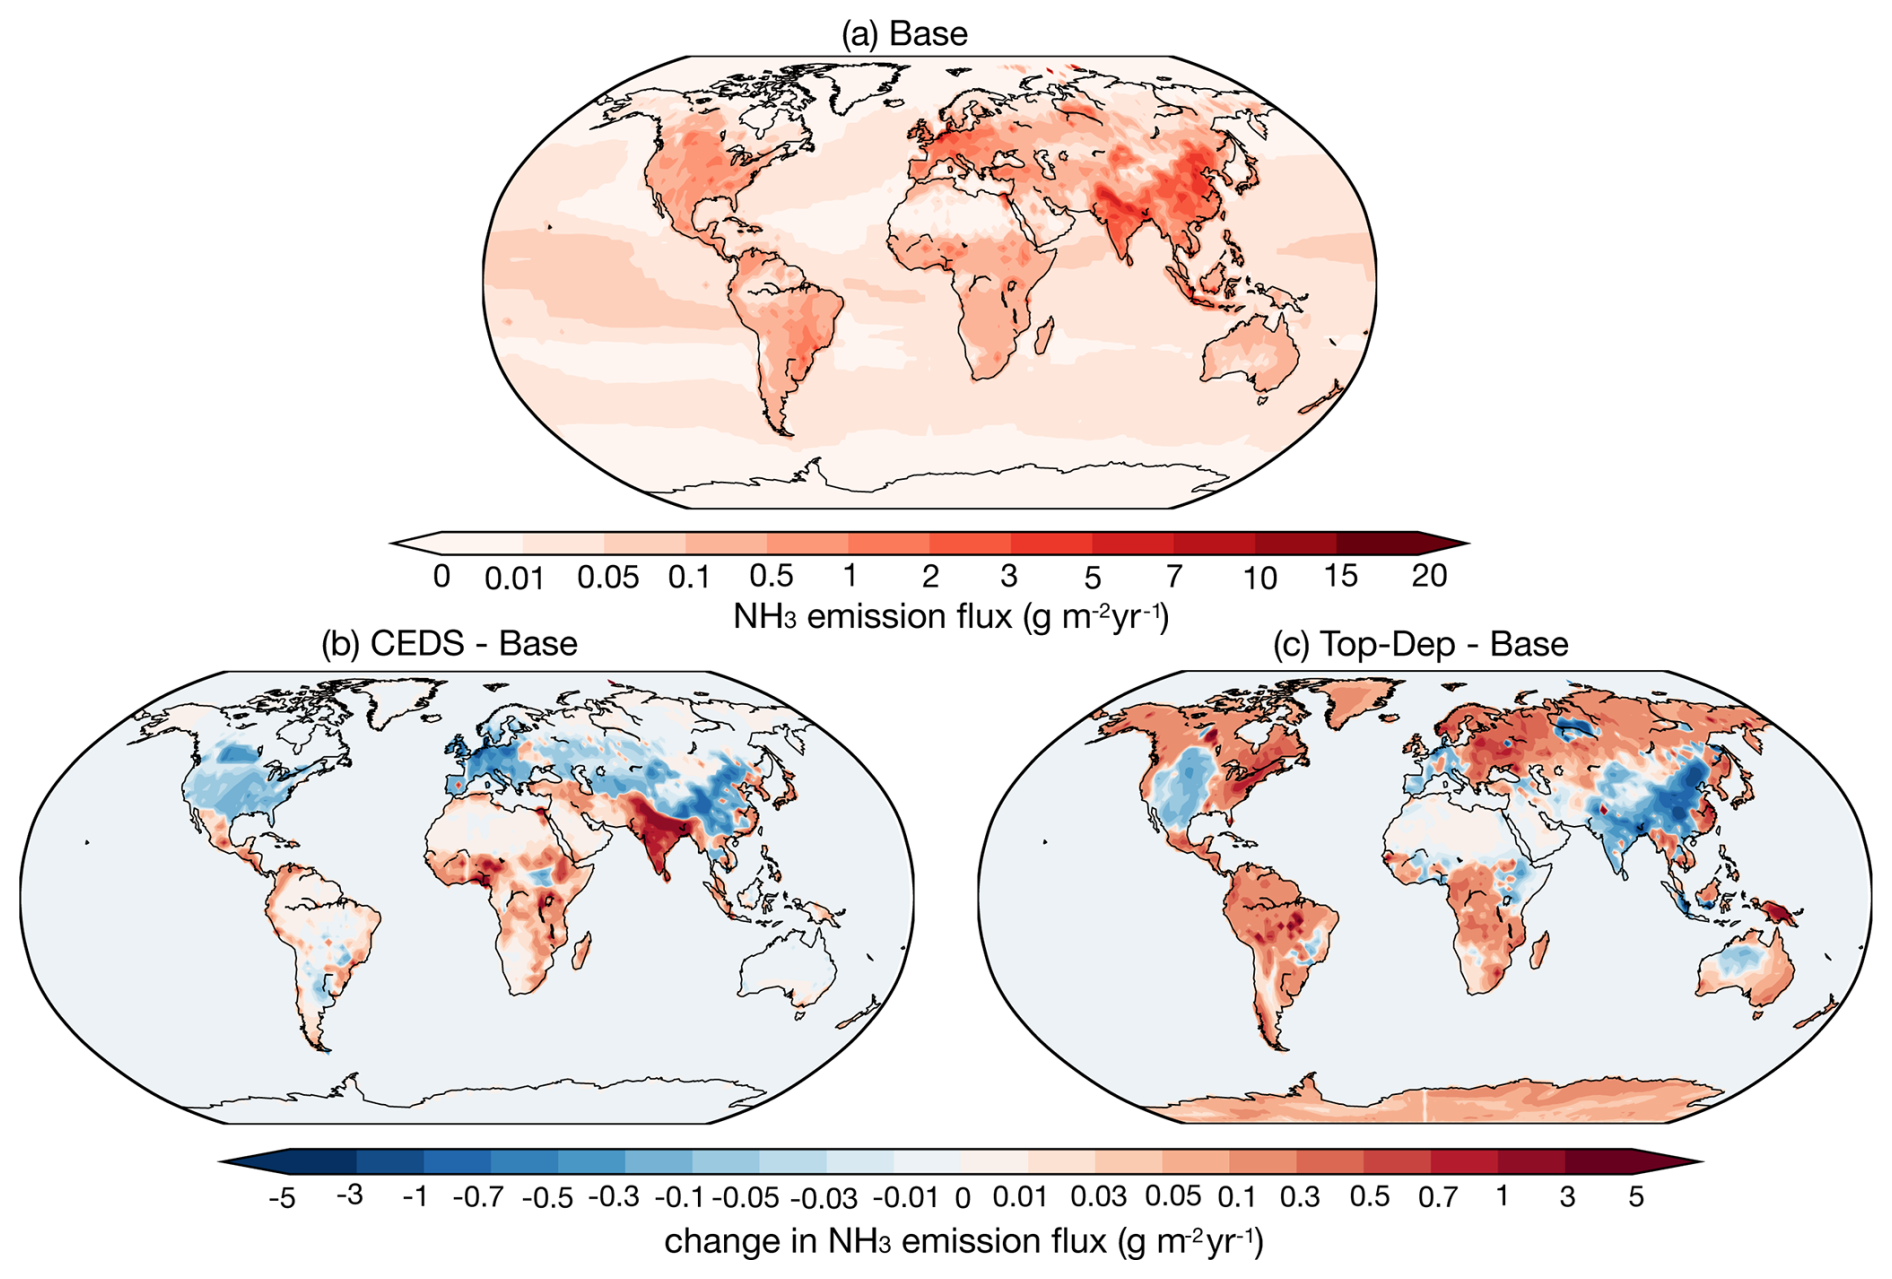
Figure 1Global distribution of the annual average NH3 emission flux for (a) the base case and the absolute differences between (b) the base and CEDS and (c) the base and Top-Dep cases during 2010–2012.
The global NH3 emissions in both the CEDS and the Top-Dep cases exceed those in the base case, with increases of approximately 5 % and 16 %, respectively. The lower NH3 emission fluxes of the CEDS case are found in North America, Europe, and China except for the northeastern and southeastern coastal areas, while emission fluxes are higher throughout India (Fig. 1b). Slightly higher fluxes are also found in western and eastern Africa, the northern Middle East, and southeastern Asia. According to McDuffie et al. (2020), the NH3 emission flux from the Multi-resolution Emission Inventory for China (MEIC, http://www.meicmodel.org, last access: 8 September 2025, European Monitoring and Evaluation Programme (EMEP), and US Environmental Protection Agency (EPA) are used to scale the previous emission (the basic data of 2010 from EDGAR) over mainland China, Europe, and the USA. The NH3 emission flux from India and Africa remains the same as that of the original inventory. Constrained by the IASI satellite observation, the NH3 emission flux of the Top-Dep case is elevated in most regions of the world, but lower emission fluxes are estimated in regions such as western North America, western and southern Europe, India, China except the northeastern and southeastern coastal areas, and western Australia. A comparison of the absolute and relative difference between the base case and the other emission schemes is summarized in Table 2.
2.3 ISORROPIA II
The thermodynamic equilibrium model ISORROPIA II is used to calculate the multiphase mass transfer of the K+–Ca2+–Mg2+–NH–Na+–SO–NO–Cl−–H2O aerosol system (Nenes et al., 1998; Fountoukis and Nenes, 2007). The process of gas–aerosol partitioning is calculated in two steps (Pringle et al., 2010). In the first step, the quantity of gas-phase species kinetically able to condense on the aerosol within one time step is calculated (Vignati et al., 2004). ISORROPIA II then re-distributes the mass between the gas and aerosol phase. In this study, ISORROPIA II runs in the forward mode with the input of relative humidity, temperature, and concentration of aerosol- and gas-phase species. ISORROPIA II determines the subsystem set of equilibrium equations and solves the equilibrium state by the chemical potential method. It outputs the equilibrium concentration of species in gas, solid, and liquid phases by assuming that the particle phase is in the thermodynamically stable-state mode where salts precipitate once the aqueous phase becomes saturated (Fountoukis and Nenes, 2007).
Meanwhile, a sensitivity case assuming the particle phase is in the thermodynamically metastable-state mode is performed with the same emission scheme as the base case (Meta case). In the metastable state, the aerosol may be supersaturated with respect to dissolved salts and always consists only of an aqueous phase (Fountoukis and Nenes, 2007). Karydis et al. (2021) pointed out that more acidic particles (up to 2 pH units) are derived from the metastable assumption in regions affected by high concentrations of crustal cations and consistently low relative humidity values.
According to past studies, the treatment of crustal species (e.g., Ca2+, K+, Mg2+) in ISORROPIA II can improve model predictions (Karydis et al., 2010, 2011), as both the phase partitioning of NO and the thermodynamic interaction between NH and the remaining ions in the aqueous phase are significantly affected. Karydis et al. (2016) found that when these crustal species are included in the EMAC model, the increase in global NO tropospheric load can be up to 44 %, while the global NH tropospheric load decreases by 41 %.
2.3.1 pH calculations
The pH is calculated from the negative decimal logarithm of the hydrogen ion activity:
where and γ represent the molality of hydrogen ions in the solution and the ionic activity coefficient of hydrogen, respectively. With γ assumed to be unity, the pH value is derived using the hydrogen ion concentration in the aqueous-particle-phase output by ISORROPIA II (in mol m−3) and the aerosol water content output by GMXe (in mol mol−1). The effect of water-soluble organic aerosols on aerosol water content is accounted for via the GMXe module, which includes both inorganic and organic contributions. Organic aerosol formation is simulated using the ORACLE module, and the associated water uptake is calculated assuming a κ-hygroscopicity value of 0.14 for all organic components (Tsimpidi et al., 2017). This influences the total aerosol water content used in pH calculations. Both hydrogen ion and aerosol water content are output every 5 h, following Karydis et al. (2021). In addition, the temperature threshold of 269 K is set to ensure that the calculations are performed only when liquid water is present in the aerosol.
Discrepancies among thermodynamic models tend to increase as RH decreases, primarily due to differing assumptions about activity coefficients (Pye et al., 2020). ISORROPIA II assumes constant mean activity coefficients and a unity activity coefficient for H+, which results in relatively invariant and often lower pH predictions under dry conditions. Additionally, the choice between stable and metastable phase state assumptions introduces further uncertainty. Under low RH (e.g., < 35 %), the metastable assumption allows for supersaturated solutions, enabling pH calculations even at low aerosol liquid water content, often resulting in low pH values. Conversely, the stable state permits salt crystallization, and in cases where the aerosol becomes fully solid, pH may no longer be defined. To assess the sensitivity of our results to this assumption, we conducted a simulation using the metastable assumption (Meta case; see Table 1).
The EMAC model does not account for chemical interactions between ammonia and organic acids (e.g., ammonium oxalate formation) and treats inorganic and organic aerosol phases separately. As a result, while organics can indirectly influence pH through their contribution to aerosol water content, changes in NH3 emissions do not affect organic aerosol formation or the associated water content in our simulations. Furthermore, although the influence of organics on hydrogen ion activity coefficients is not explicitly represented, previous studies have shown that water-soluble organic aerosols exert only a minor effect on aerosol pH (Guo et al., 2015; Pye et al., 2018; Vasilakos et al., 2018).
2.3.2 Two factors affecting pH value change
According to Eq. (3), the pH value is determined by the concentrations of H+ and H2O. To evaluate the impact of each factor on the pH value, we independently calculate the changes in pH arising from two pathways: one driven by H+ and the other by H2O.
Here, and represent the changes in pH caused by variations in H2O and H+ concentrations, respectively. The base case concentrations of H2O and H+ are used as references, and the changes in concentration are expressed as ΔH2O and ΔH+, corresponding to the deviations in H2O and H+ from their base case levels.
Multiple observational datasets are used in this study to validate the model simulation in different regions of the world as defined by the IPCC (2022). The information of each dataset is summarized in Table 3, and the site distribution is plotted in Figs. 2 and S1 in the Supplement. These datasets include satellite retrievals from the Infrared Atmospheric Sounding Interferometer (IASI; https://iasi.aeris-data.fr/NH3_IASI_A_L3_data/, last access: 8 September 2025) and the following observation site networks: the Nationwide Nitrogen Deposition Monitoring Network (NNDMN; https://figshare.com/articles/dataset/Data_Descriptor_Xu_et_al_20181211_Scientific_data_docx/7451357/5, last access: 8 September 2025), the European Monitoring and Evaluation Programme (EMEP; https://ebas-data.nilu.no/Default.aspx, last access: 8 September 2025), the Central Pollution Control Board (CPCB; https://cpcb.nic.in/, last access: 8 September 2025), the Acid Deposition Monitoring Network in East Asia (EANET; https://www.eanet.asia/, last access: 8 September 2025), the Ammonia Monitoring Network (AMoN; https://nadp.slh.wisc.edu/networks/ammonia-monitoring-network/, last access: 8 September 2025), the US Environmental Protection Agency (EPA; https://www.epa.gov/data, last access: 8 September 2025), and the Clean Air Status and Trends Network (CASTNET; http://www.epa.gov/castnet, last access: 8 September 2025).
Table 3Information for each observation dataset used to validate model simulation during 2010–2012.
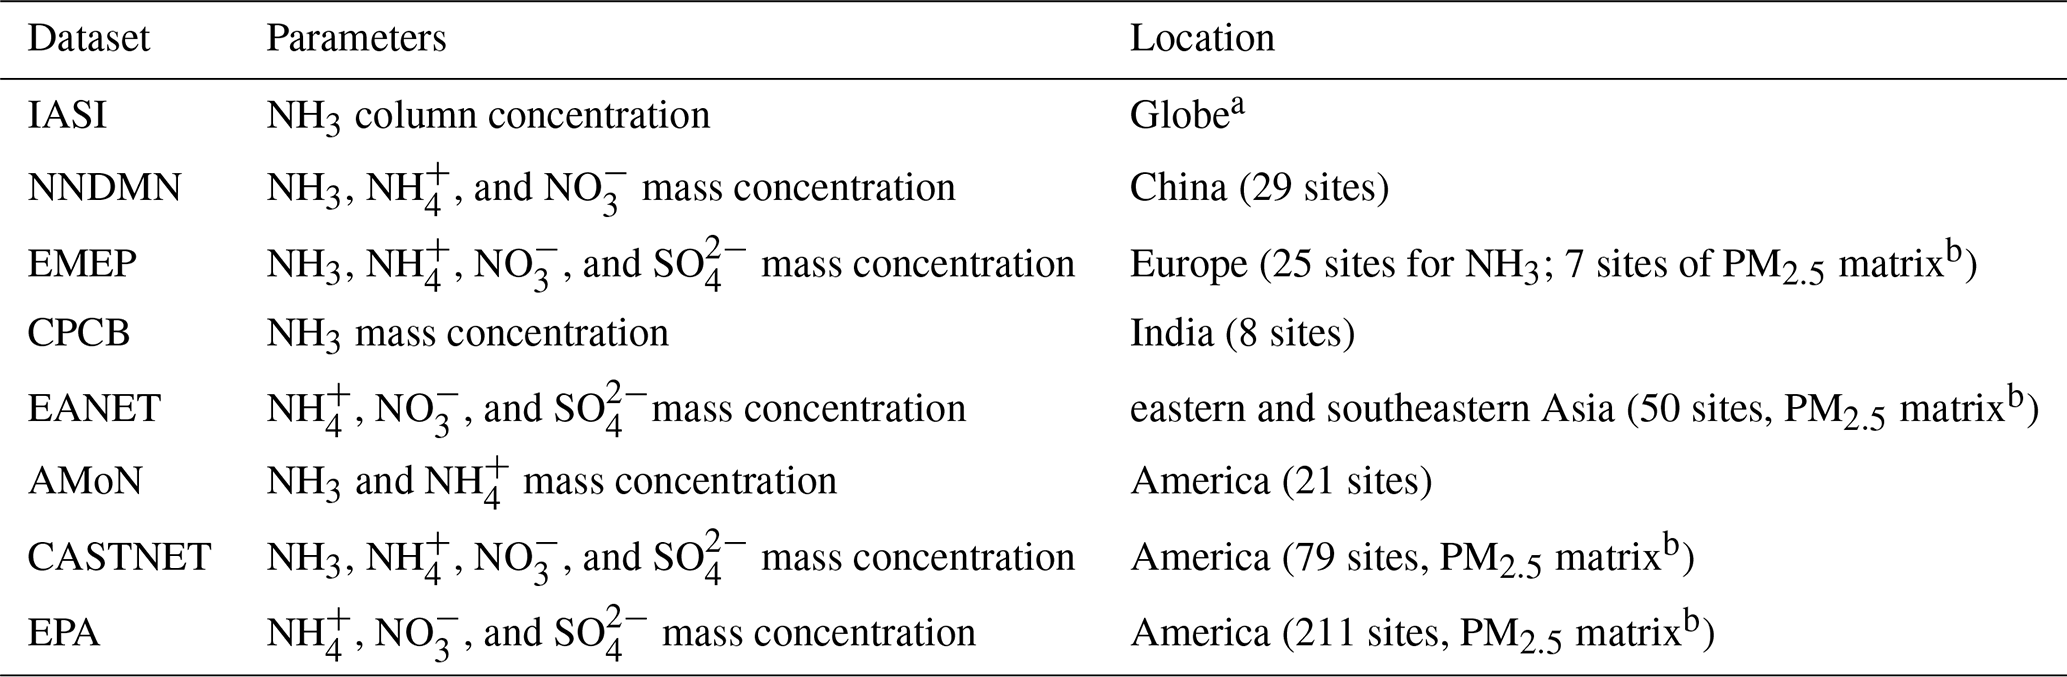
a Only the data over land are used.
b Measurements refer to a chemical or physical property of the total aerosol particle phase in the size fraction with less than 2.5 µm median aerodynamic diameter.
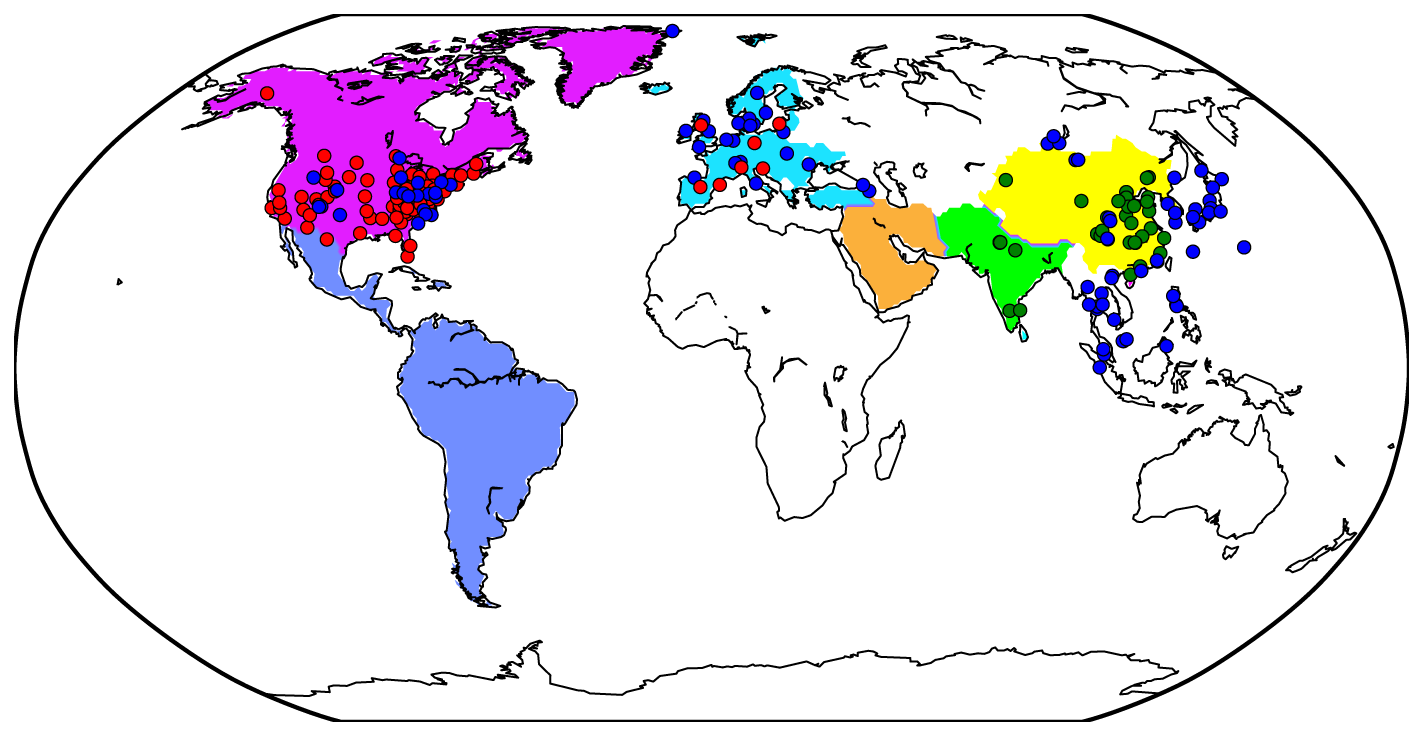
Figure 2Regions and observation sites used in this study. North America, South America, Europe, the Middle East, South Asia, and East Asia are represented by purple, dark blue, sky blue, orange, light green, and yellow, respectively. In North America AMoN and CASTNET sites are shown as blue and red circles, respectively (EPA sites are provided in Fig. S1). In Europe, EMEP sites are shown as blue circles for NH3 and red circles for PM2.5 components. In South Asia, CPCB sites are marked by green circles. In East Asia, NNDMN and EANET sites are indicated by dark-green and dark-blue circles, respectively.
Due to its better precision resulting from favorable thermal contrast conditions (Clarisse et al., 2009), only the morning (around 09:30 local time) overland IASI data are used in this study. The original temporal resolution of the various datasets includes hourly, 3 d, daily, weekly, bi-weekly, and monthly, which we uniformly convert to monthly. The mean bias (MB), mean absolute gross error (MAGE), normalized mean bias (NMB), normalized mean error (NME), and root mean square error (RMSE) are calculated to evaluate the model performance:
where Pi and Oi represent the monthly value of model simulation and measurement, respectively. N is the total number of data points used for comparison.
4.1 Aerosol composition
The comparison between the simulation derived from the base case and the observational datasets is summarized in Tables 4–6. Compared with the NNDMN dataset, which primarily includes sites located in urban and rural areas across China, the base case overestimates the NH3 mass concentration (NMB = 0.19) and underestimates the NH mass concentration (NMB = −0.41), though it reproduces the NO mass concentration well (NMB = −0.02). Xie et al. (2022) summarized the NMB between observed NO and simulated values in China as ranging from −0.97 to 1.90 based on modeling studies in the last decade. The negligible bias of the simulated NO shows the good performance of the EMAC model in this region. However, the biases in the simulation of NH3 and NH indicate that the NH3 NH partitioning treatment is not efficient enough or is oversimplified, as less NH is produced even with sufficient NH3. Similarly, in Europe and North America, we obtain a positive bias of NH3 mass concentration (EMEP dataset: NMB = 2.26; AMoN dataset: NMB = 0.58) and a comparably low NH mass concentration (EMEP dataset: NMB = 0.05; AMoN dataset: NMB = −0.23). On the other hand, the dry deposition of NH3 in China is lower than reported from observations (NMB = −0.28; not shown), which contributes to a higher atmospheric NH3 concentration.
Table 4Comparison of the base case predictions with monthly average observations from China and Europe during 2010–2012.
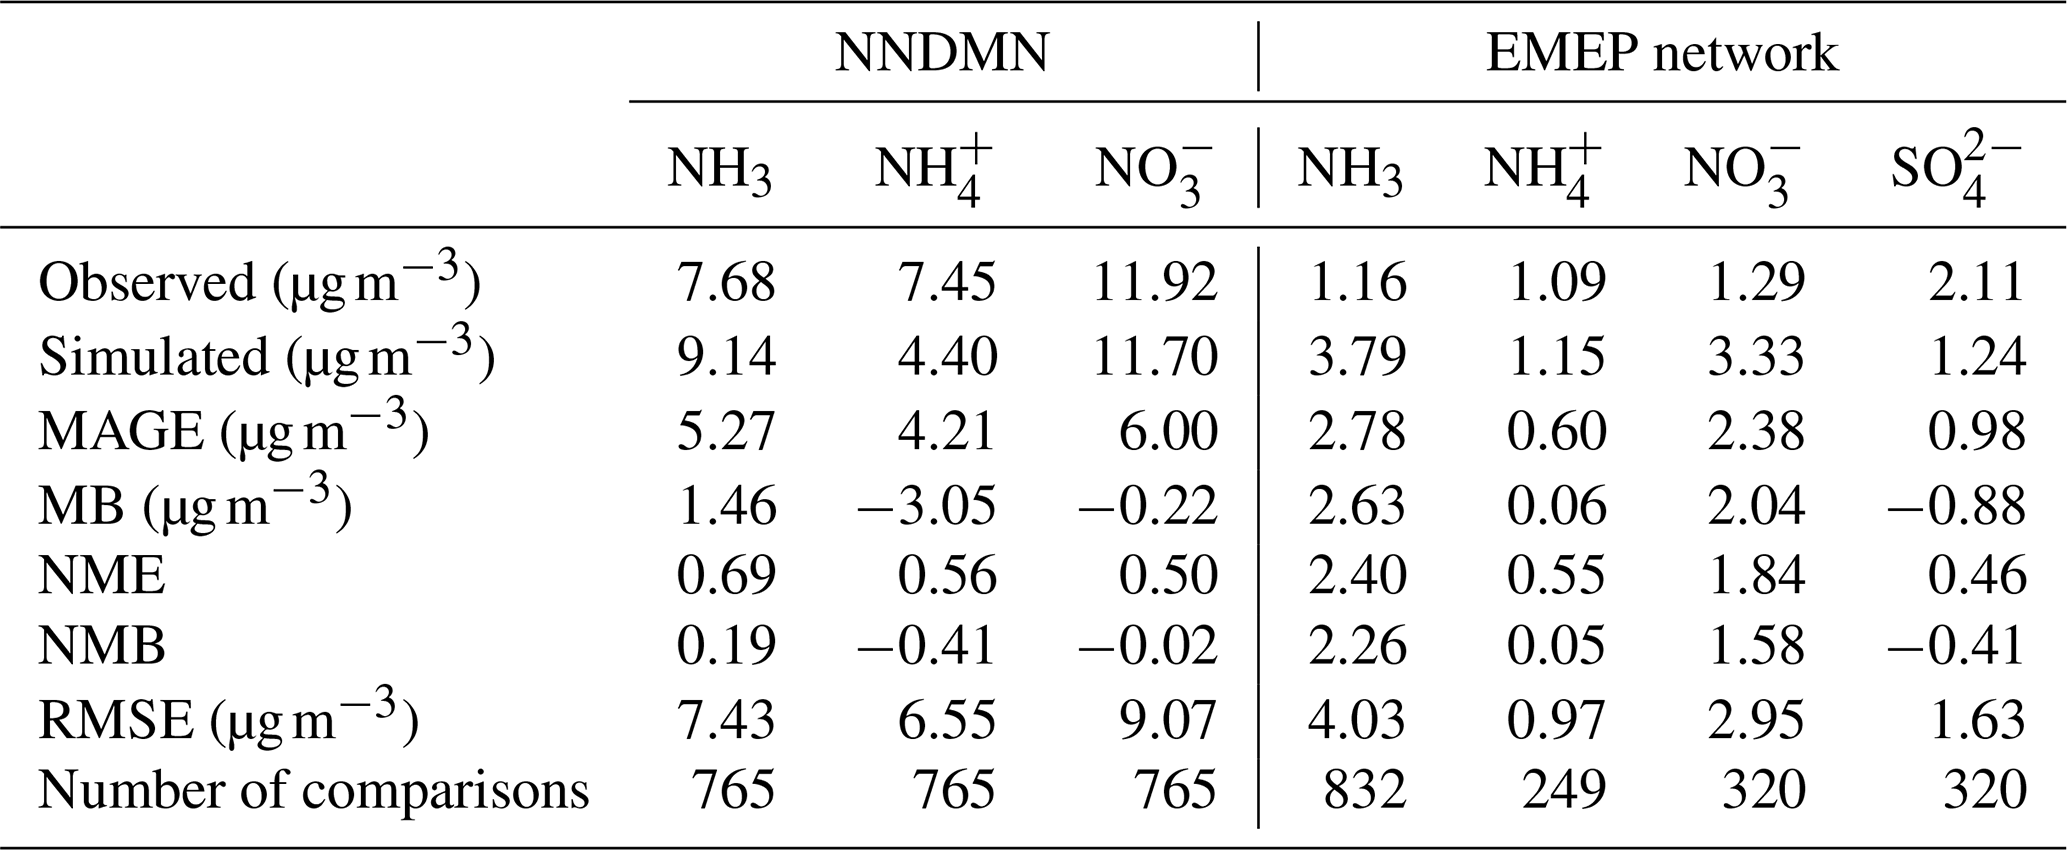
Table 5Comparison of the base case predictions with monthly average observations from India and eastern Asia (PM2.5 matrix) during 2010–2012.
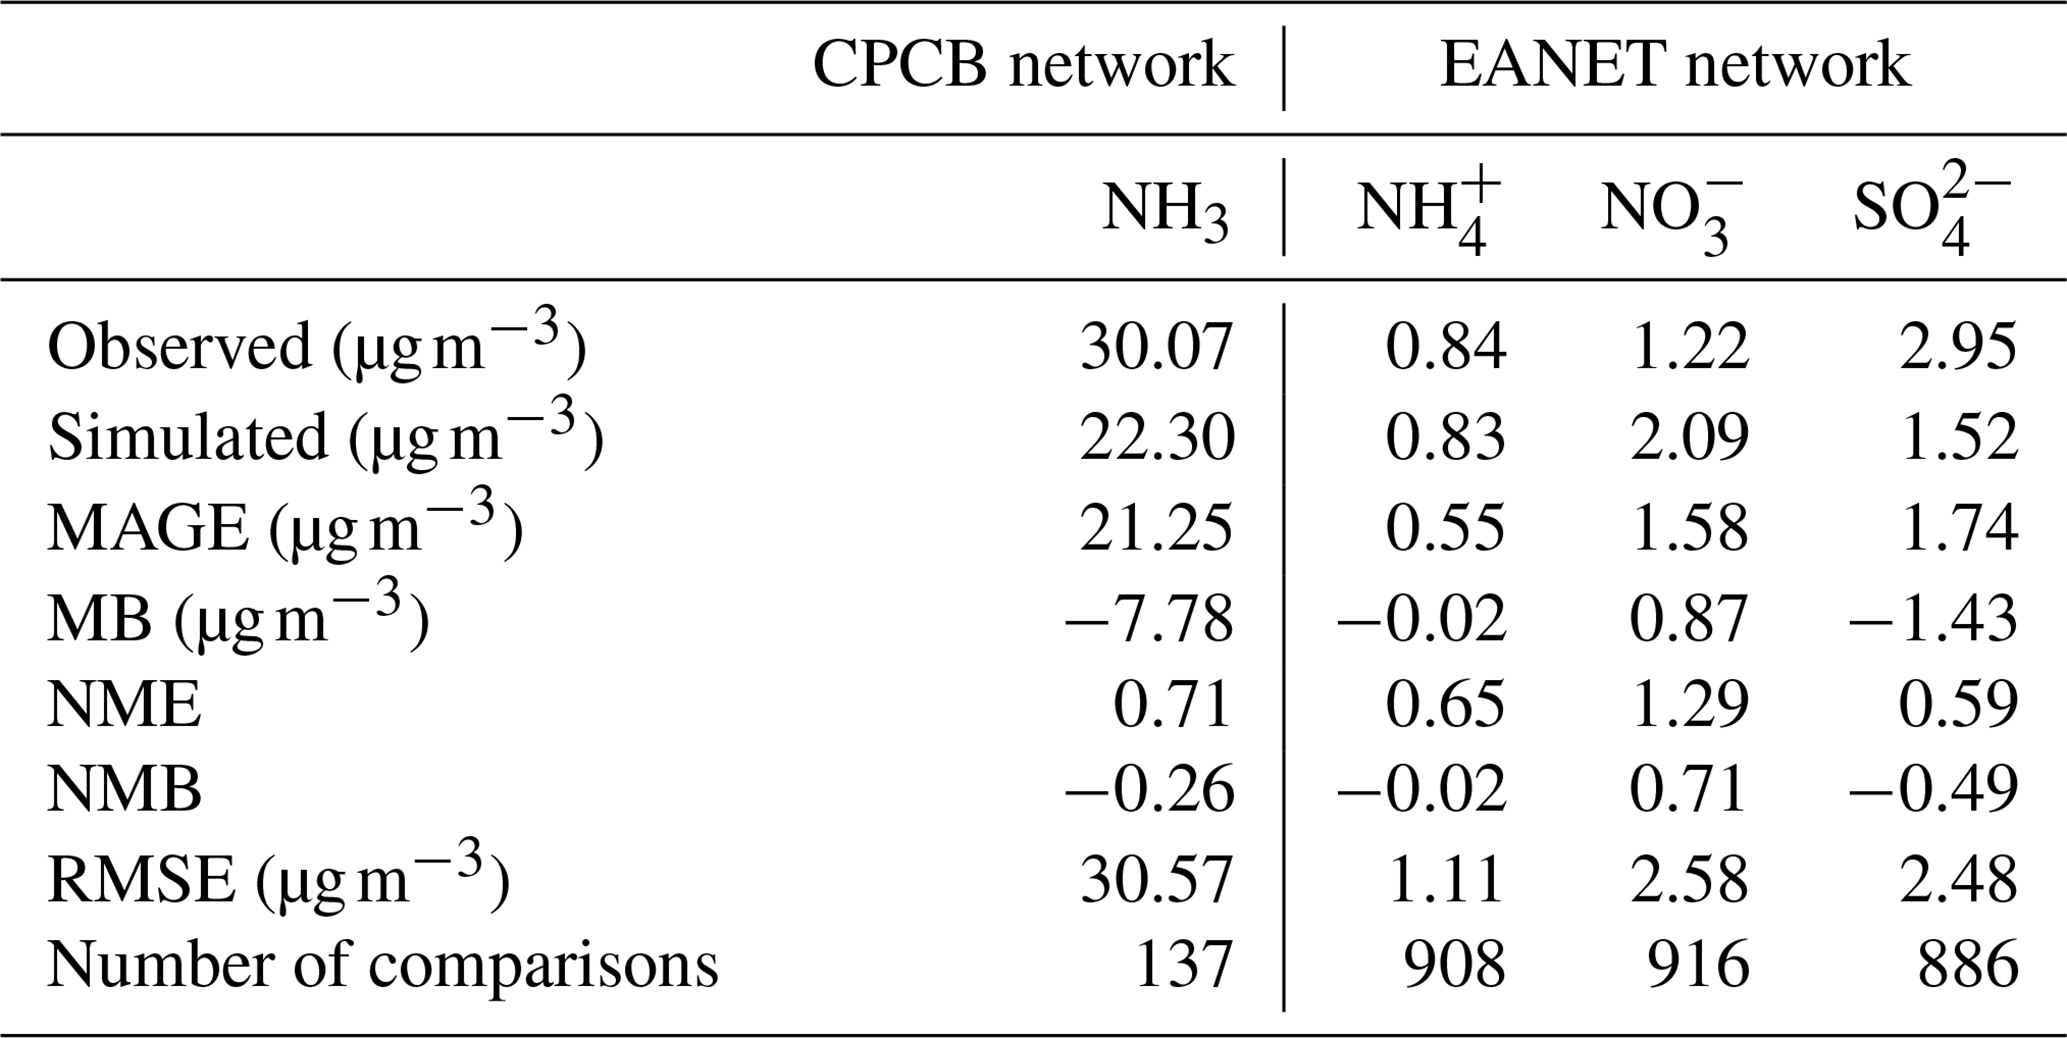
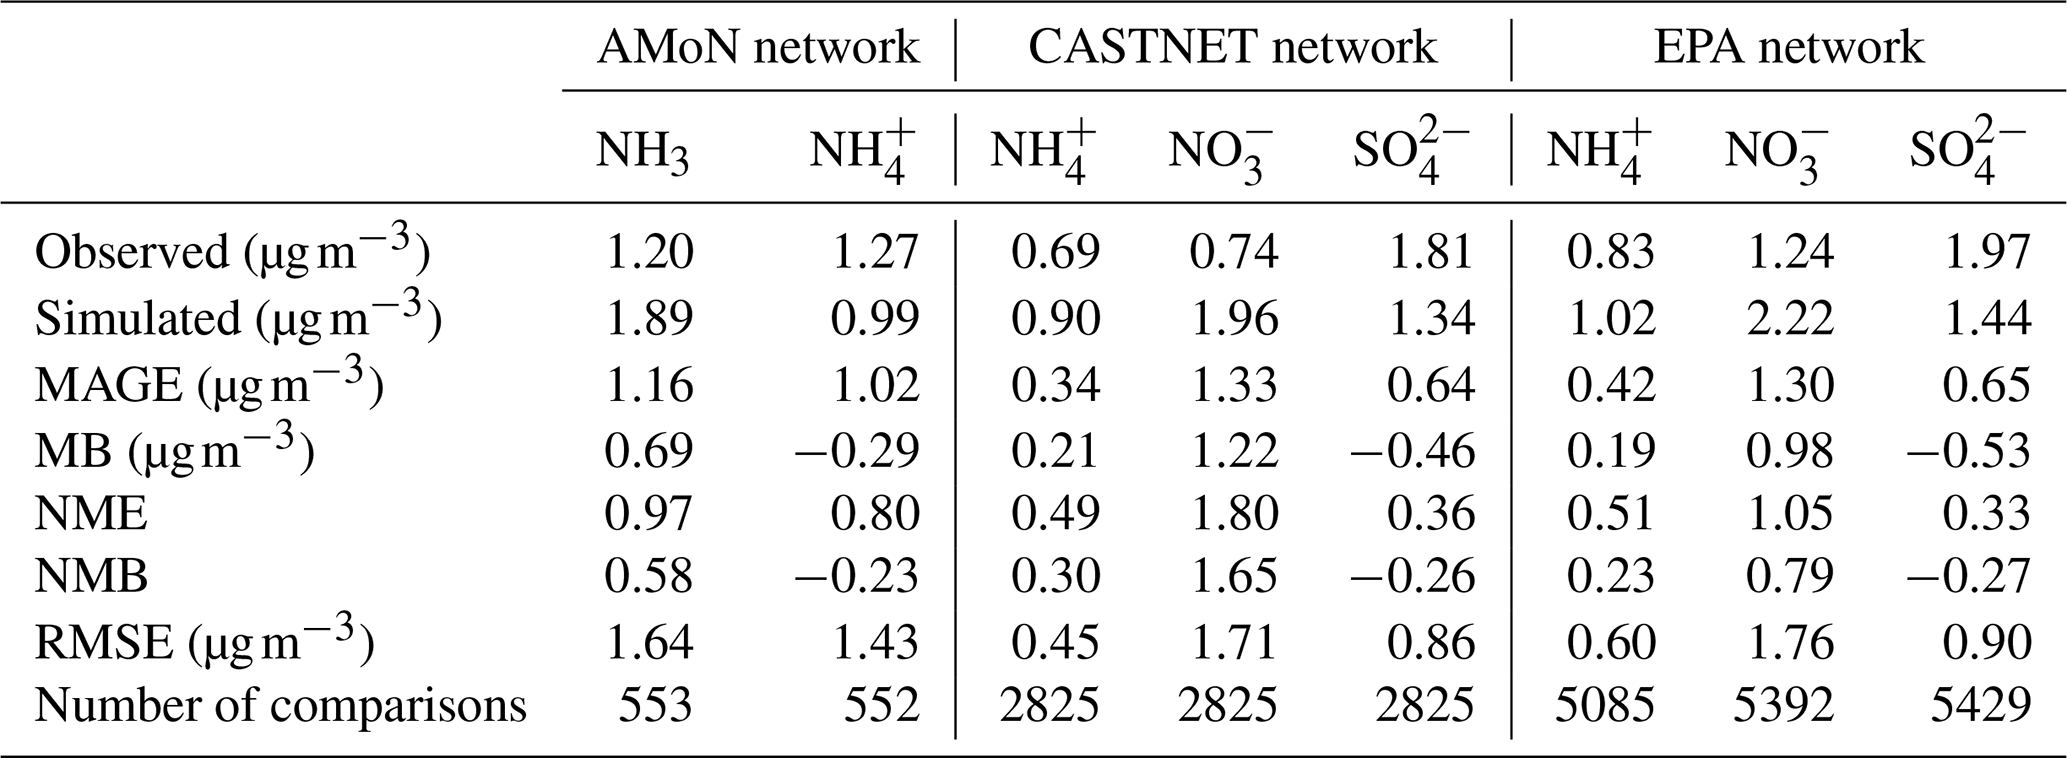
Table 6Comparison of the base case predictions with monthly average observations from America (PM2.5 matrix) during 2010–2012.
In East and Southeast Asia, the mass concentration of NH is well reproduced (NMB = −0.02), while high and low discrepancies are found in the mass concentrations of NO and SO (NMB = 0.71 and −0.49, respectively). Similar results were also found in Europe, with agreement for NH (NMB = 0.05) but an overestimation of the NO mass concentration (NMB = 1.58) and underestimated SO (NMB = −0.41). The positive bias of the simulated NO is reported by many studies (Xie et al., 2022; Heald et al., 2012; Colette et al., 2011; Bian et al., 2017; Pozzer et al., 2022; Milousis et al., 2025). The negative bias of SO is considered a reason for the positive bias of NO regarding the thermodynamic equilibrium between NH, SO, and NO. The discrepancy in SO and NO is also due to the missing heterogeneous oxidation reactions for SO2 and NOx in the model. Several studies have concluded that adding multiphase chemistry can significantly improve the model performance (Zheng et al., 2015; Zhang et al., 2021b). Cheng et al. (2016) and Zheng et al. (2024) pointed out that the multiphase reactions act as an important SO source in haze pollution, while Guo et al. (2017b) argued that the multiphase reactions are not likely limited by the required alkaline environment.
In North America, the base case reproduces the mass concentration of SO (NMB = −0.26) but overpredicts the mass concentrations of NH and NO (NMB = 0.23 and 0.79, respectively), which is in line with the findings of Walker et al. (2012). The excess NH promotes the formation of NO, and the uncertain uptake coefficient of N2O5 used in models may contribute to more NO (Walker et al., 2012). The highest NH3 mass concentration is found in India, especially in the Indo-Gangetic Plain. Our model basically captures the “hotspot”, with a slight negative bias (NMB = −0.26). However, the scarce observation sites and the lack of observed NH, NO, and SO hinder further evaluation of the model performance.
4.2 Aerosol acidity
Due to the lack of direct measurement of aerosol acidity, we collect the PM2.5 pH values from related studies to compare them with our model simulation in Table 7. These pH values are calculated using the thermodynamic equilibrium model ISORROPIA or E-AIM with input from observational datasets. Compared with Guo et al. (2017a), our simulated pH value from the base case is higher in the western USA (4.3 vs. 2.7), but the value from the Meta case is much closer (2.6). Both the base and the Meta cases predict the same aerosol water content, and the high Ca2+ concentration from the Great Basin Desert leading to the precipitation of CaSO4 is the main reason for the lower aerosol acidity in the base case (Karydis et al., 2021). It is worth noting that the effect of Ca2+ on aerosol acidity was not considered by Guo et al. (2017a). The summertime southeastern USA is characterized as relatively clean with aerosol dominated by NH and SO but with negligible mineral cations, and the aerosol is acidic with the observed pH value around ∼ 0.6 (Guo et al., 2015; Pye et al.,2020). However, due to a low bias in simulated SO mass concentration, the model underestimates aerosol acidity, resulting in a higher simulated pH value of approximately 2.0 during the summer period. In Europe, although the good agreement between our simulated pH and the result of Guo et al. (2018) (both are 3.9) supports the model simulations, we note a significant overestimation of alkaline species (sum of NH and NH3, NMB = 17 %) and an underestimation of acidic species (sum of NO and HNO3, NMB = −57 %; SO, NMB = −51 %) in December. These discrepancies emphasize the need for improved representation of aerosol composition in the model. In northern China, Wang et al. (2016) reported pH values that are about 2 units lower than our simulations (4.4 vs. 6.7), and Guo et al. (2017b) found moderate acidic aerosol (pH = 5) during wintertime. We attribute this high bias in simulated pH to the underestimation of cation mass concentrations (e.g., Ca2+, Mg2+) in PM2.5, as the mass concentrations of NH, SO, and NO are in the observational ranges reported by Wang et al. (2016).
Table 7Simulated pH value of PM2.5 at certain locations compared with observational estimates of particle pH.
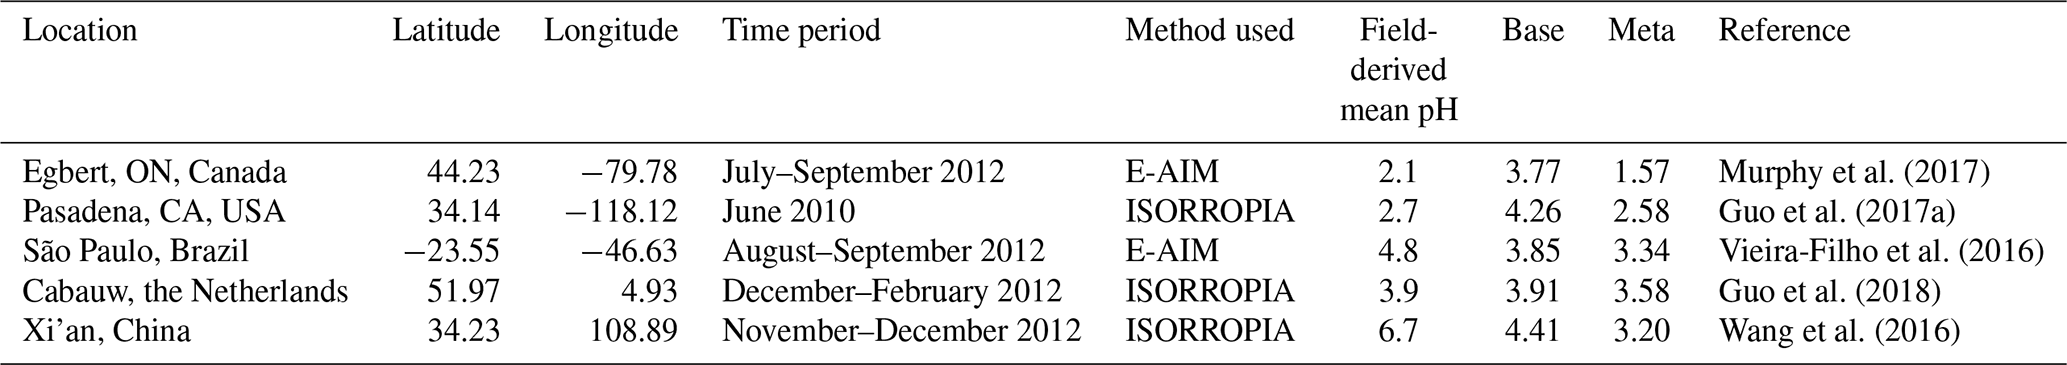
Note that the table was extracted in part from Karydis et al. (2021).
5.1 Size-resolved composition
The regional mass fractions of size-resolved inorganic aerosol components (NH, SO, and NO) are presented as bar charts in Fig. 3, while global distribution maps of their size-resolved mass concentrations are shown in Fig. S2; both the simulation results are derived from the base case. To assess ammonia neutralization of sulfuric and nitric acids, we applied the chemical domain framework defined by Ge et al. (2022) based on SNA molar concentrations in PM10 with a threshold of > 1 µg m−3. The four chemical domains, illustrated in Fig. 4, are defined as follows: SO very rich (totNH3 totSO4 < 1, where totNH3 is the sum of NH3 and NH and totSO4 is the sum of SO and HSO), SO rich (totNH3 totSO4 between 1 and 2), NO rich (free NH3 totNO3 between 0 and 1, where free NH3 is totNH3 minus double totSO4 and totNO3 is the sum of NO and HNO3), and NH3 very rich (free NH3 totNO3 > 1). Figure S3 shows the ratios used to define these domains.
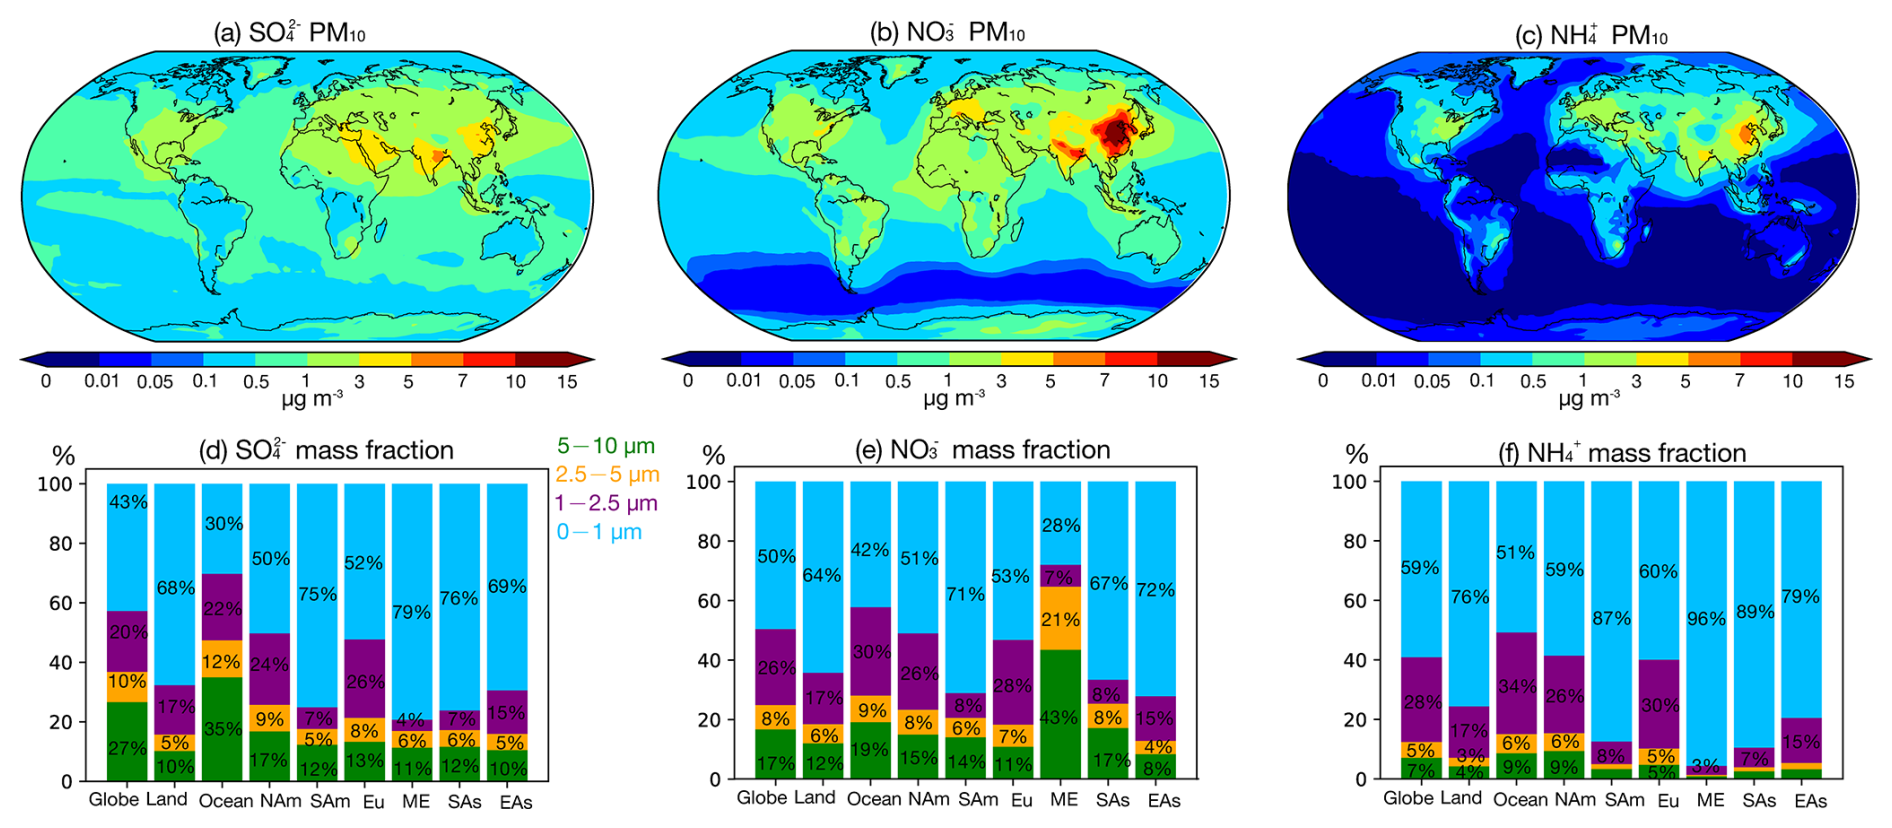
Figure 3(a–c) Global distribution of SO, NO, and NH mass concentration in the size range of 0–10 µm, (d–f) bar plots for mean mass fractions of size-resolved NH, SO, and NO over the globe, land, ocean, and regions (marked in Fig. 2); the size ranges of 5–10, 2.5–5, 1–2.5, and 0–1 µm are marked by green, orange, purple, and blue, respectively (NAm: North America; SAm: South America; Eu: Europe; ME: Middle East; SAs: South Asia; EAs: East Asia).
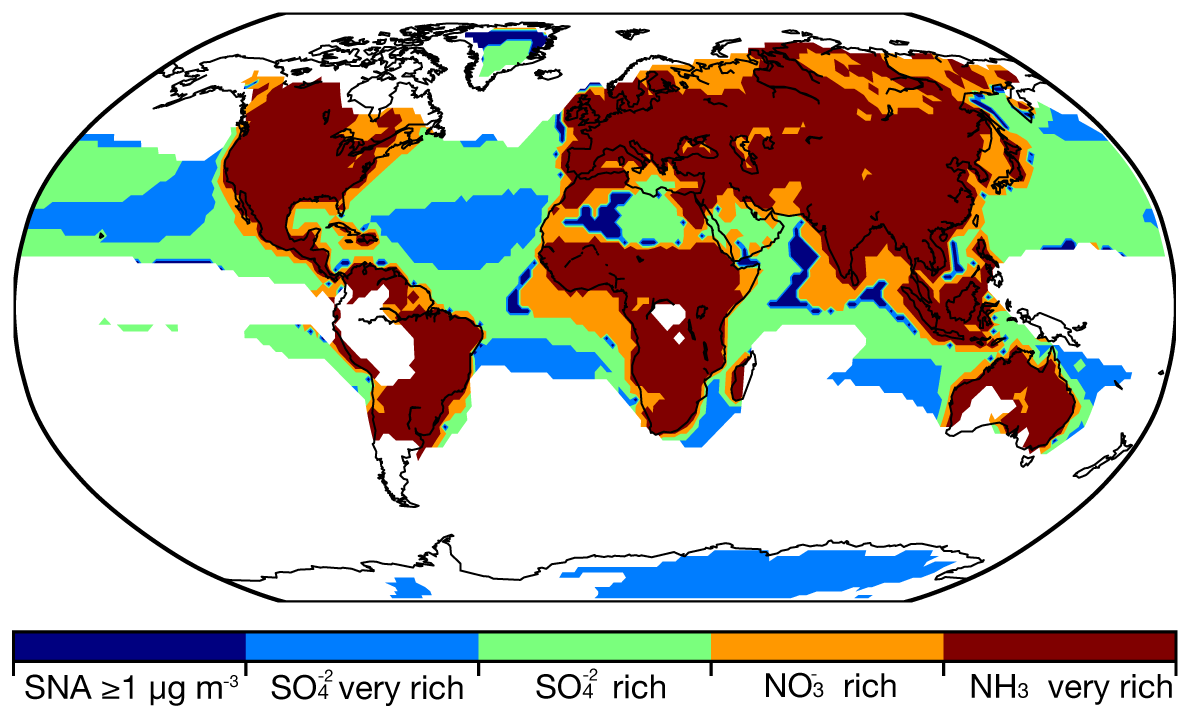
Figure 4Distribution of the ammonia neutralization state of sulfuric and nitric acids, based on SNA molar concentrations in PM10 with a threshold of ≥ 1 µg m−3, where the SNA mass concentration less than the threshold is measured by blank zone. SO very rich represents ratios of totNH3 to totSO4 less than 1 (totNH3: sum of NH3 and NH; totSO4: sum of SO and HSO), SO rich represents ratios of totNH3 to totSO between 1 and 2, NO rich represents ratios of free NH3 to totNO3 between 0 and 1 (free NH3: totNH3 minus double totSO4; totNO3: sum of NO and HNO3), and NH3 very rich represents ratios of the free NH3 to totNO3 over 1.
Regions with low inorganic aerosol concentrations (< 1 µg m−3) are found in the Southern Hemisphere oceans and remote areas such as the North Pole and South America, including the Amazon Basin. These areas represent relatively pristine baselines for evaluating anthropogenic impacts (Andreae et al., 1990; Andreae, 2007). In low northern latitude oceans, the SO very rich and SO rich domains dominate, where NH3 is insufficient to fully neutralize sulfuric acid. As a result, sulfuric acid remains only partially neutralized, contributing to aerosol acidity. This pattern reflects low NH3 emissions over oceans (Fig. 1) and the contribution of biogenic dimethyl sulfide (DMS) to marine SO (Fiddes et al., 2018; Jackson et al., 2020). Additional NOx and SO2 from shipping contribute to marine SO and NO (Wang et al., 2023; Burgard and Bria, 2016). Average PM10 SNA concentrations are lower over oceans compared to land (NH: 0.06 µg m−3 vs. 0.36 µg m−3; NO: 0.37 µg m−3 vs. 1.24 µg m−3; SO: 0.60 µg m−3 vs. 0.95 µg m−3). Marine SO and NO are predominantly in the supermicron mode, with mass fractions of 70 % and 58 %, respectively. Coastal areas exhibit a NO rich domain due to continental outflows (Fig. S3) (Prospero et al., 1985), consistent with prior findings that marine aerosol in the supermicron mode primarily comprises inorganic salts, including sea salt, non-sea-salt sulfate, and nitrate, while organic matter is concentrated in the submicron range (Russell et al., 2023; Cavalli et al., 2004).
On land, except for areas such as northern Russia, central Africa, and the Arabian Peninsula, the aerosol typically falls within the NH3 very rich domain. In this domain, SO is neutralized by the available NH3, with sufficient NH3 remaining to neutralize NO. As a result, NO becomes the limiting factor in the formation of NH4NO3. More than 60 % of SNA mass is in the submicron mode on land, while the supermicron modes (i.e., 1–2.5, 2.5–5, and 5–10 µm) account for a smaller fraction (7 % for NH, 15 % for SO, and 18 % for NO). In polluted regions such as East and South Asia, PM10 SNA concentrations are 3 times higher than the global land average. For example, East Asia shows NH of 1.88 µg m−3, NO of 5.31 µg m−3, and SO of 2.29 µg m−3, while South Asia records NH of 1.58 µg m−3, NO of 3.68 µg m−3, and SO of 3.18 µg m−3. Free NH3 is abundant in regions like southern North America, Europe, South Asia, and East Asia, with mean free NH3 total NO ratios of 2.11, 3.77, 5.30, and 3.78, respectively. Over 75 % of SNA mass in these regions is concentrated in the 0–1 and 1–2.5 µm size ranges. The NH3 surplus reflects recent trends in precursor emissions, with stable or increasing NH3 emissions contrasting with declining SO2 and NOx emissions (Zheng et al., 2018; Hand et al., 2012; Russell et al., 2012). In the Middle East, particularly the Arabian Peninsula, aerosol is dominated by desert dust with negligible NH3 emissions. The SO rich and NO rich domains predominate, where NH3 levels are insufficient to neutralize acidic components, limiting NH4NO3 formation. Mean concentrations of NH, NO, and SO in this region are 0.72, 2.07, and 3.19 µg m−3, respectively. Over 70 % of NO resides in the supermicron modes due to interactions with sea salt and crustal dust, which shift NO from submicron to supermicron modes (Chen et al., 2020; Koçak et al., 2007; Karydis et al., 2016). Submicron NH and SO remain dominant, accounting for 96 % and 79 % of their respective fractions, consistent with Osipov et al. (2022), who identified anthropogenic sources as the primary contributors to fine particles in the region.
5.2 NH3 column concentration
Figure 5a shows the global distribution of NH3 column concentration. The global area-weighted mean value of NH3 column concentration is 0.80 mg m−2, with the highest value up to 30 mg m−2 in the Indo-Gangetic Plain of India and the lowest value of less than 0.01 mg m−2 in the remote oceans of the Southern Hemisphere and the South Pole. Compared with previous studies that investigated NH3 column concentrations based on satellite retrievals (Van Damme et al., 2014, 2015; Zhou et al., 2024), our results can capture the distribution of NH3 hotspots worldwide, including the Indo-Gangetic Plain, the North China Plain, and West Africa and Amazonia, where biomass burning is dominant (Van Damme et al., 2018). However, Van Damme et al. (2018) pointed out that two-thirds of the NH3 emission hotspots are underestimated by at least 1 order of magnitude in the NH3 emission inventory EDGAR (CAMS-GLOB-ANT used in this study is derived from EDGAR; see Sect. 2.1.1). Given such an underestimation in the current NH3 emission inventory, we further improve the emission by applying a new inventory and updating the current inventory using a top-down method introduced in Sect. 2.1. The simulation results are discussed in Sect. 7.
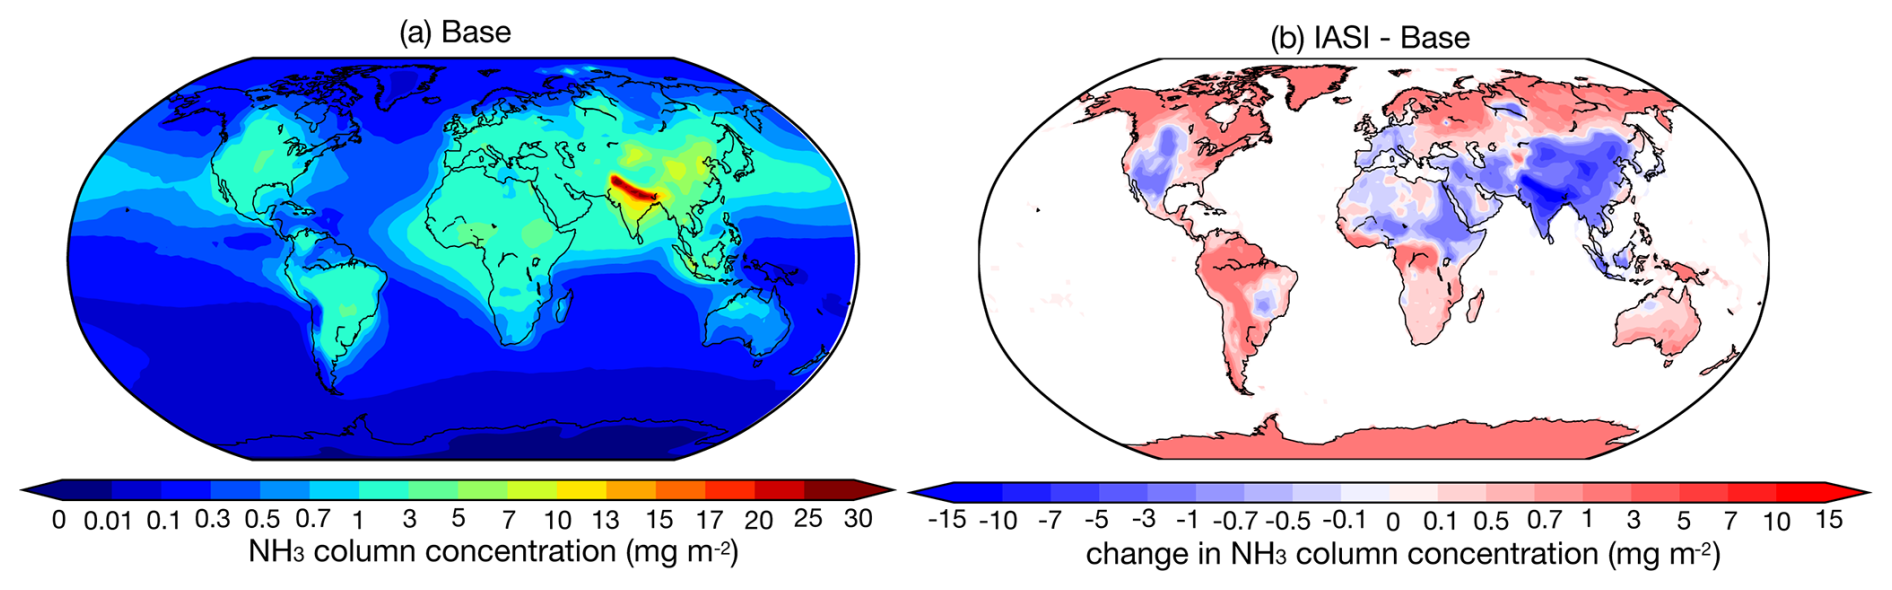
Figure 5Global distribution of (a) the average NH3 column concentration (mg m−2) for the base case and (b) the absolute difference between the IASI satellite retrieval and base case, from 2010 to 2012.
Our simulated NH3 column concentrations show good agreement with the IASI satellite observations (Fig. 5b), with global land mean values at a comparable level of 1.66 mg m−2. However, regional biases can be significant, with an NMB of −0.32. The model overestimates NH3 column concentrations over regions such as India, China, western America, and northeastern Africa, while it has a negative bias in high-latitude regions. It is also important to note that biases in the IASI satellite products have been identified in previous studies (Dammers et al., 2017, 2019); more details are discussed in Sect. 2.1.2.
5.3 Global NH3 budget
The global budget for NH3 and NH is summarized in Table 8. Given a global NH3 emission input of 73.3 Tg yr−1, the global burden and lifetime derived from the base case simulation are 0.4 Tg and 2.0 d, respectively; for NH, the global burden and lifetime are 0.3 Tg and 3.1 d, respectively. Based on the simulations of nine models, Bian et al. (2017) assessed that given the average NH3 emission input of 76.4 Tg yr−1, the average global burden and lifetime for NH3 and NH are 0.2 Tg and 0.7 d and 0.3 Tg and 4.3 d, respectively. Compared to Bian et al. (2017), our study uses the same NH3 emission input; however, the global burden and lifetime of NH3 derived from the base case are larger. This potential overestimation may be attributed to the wet-deposition scheme used in EMAC. The scavenging scheme (SCAV) accounts for pH adjustments in NH3 dissolution. More specifically, the EMAC model implicitly determines the effective Henry's law constant by solving a system of coupled ordinary differential equations, explicitly representing liquid-phase processes in clouds and raindrops, including dissociation, acid–base equilibria, redox reactions, and photolysis (Tost et al., 2006). This approach ensures a comprehensive calculation of total wet deposition for NH and NH3. Notably, the NH3 burdens simulated in the AeroCom model intercomparison by Bian et al. (2017) exhibit significant variability, spanning a factor of 17. This wide range underscores the sensitivity of atmospheric NH and NH3 burdens and lifetimes to model domain definitions, deposition pathways, and NH3 chemical processes across different models (Ge et al., 2022).
Table 8Atmospheric budget of NH3, NH, and NHx (NH3 + NH).
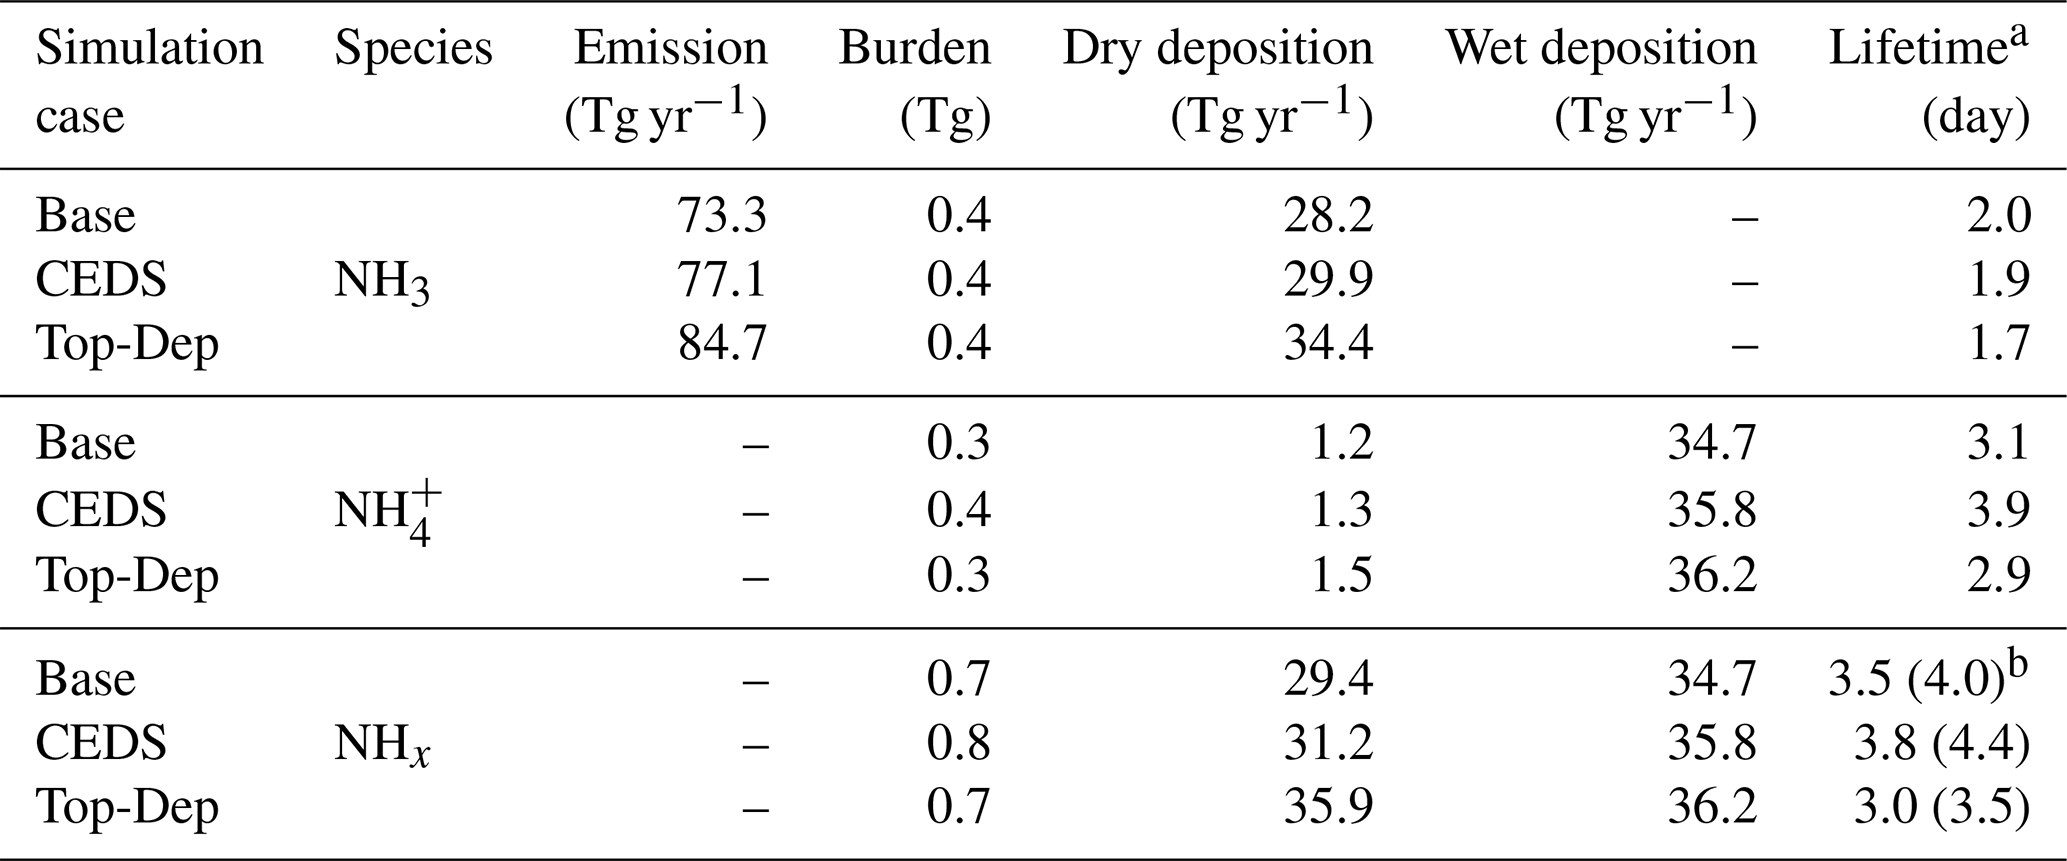
a NH3 lifetime = burden emission; NH lifetime = burden (dry deposition + wet deposition).
b NHx lifetime = NHx burden NH3 emission; in the parentheses, NHx lifetime = NHx burden (dry deposition + wet deposition).
Considering the SCAV scavenging scheme, we further calculate the global budget for NHx (NH3 + NH) in Table 8. The global burden of NHx is 0.7 Tg. Wet deposition and dry deposition contribute almost equally to the sink, accounting for 54 % and 46 %, respectively. The lifetime of NHx is 3.5–4.0 d, depending on the calculation method. Ge et al. (2022) estimated a global budget for NHx, with an input NH3 emission of 64.5 Tg yr−1. They calculated the global burden of NHx to be 0.9 Tg, with a lifetime of 4.9–5.2 d, and found its wet and dry deposition contribute equally to the sink (i.e., 51 % and 49 % of total deposition, respectively).
Figure 6 illustrates the global distributions of size-resolved aerosol pH, with regional averages summarized in Table 9. Aerosol pH exhibits marked spatial variations, influenced by land–sea contrasts and regional sources. Over land in the Northern Hemisphere, excluding deserts, aerosols are generally acidic, whereas marine aerosols are alkaline due to sea salt influence. High-latitude marine aerosols are generally more acidic than those over remote ocean regions, primarily due to the long-range transport of anthropogenic pollutants such as H2SO4 and HNO3 from continental sources (Myhre et al., 2013; Karydis et al., 2021). The average pH values for land-based aerosols are 4.2 (5–10 µm), 4.2 (2.5–5 µm), 3.9 (1–2.5 µm), and 4.3 (0–1 µm). In contrast, marine aerosol pH values are 6.2 (5–10 µm), 5.8 (2.5–5 µm), 5.1 (1–2.5 µm), and 5.1 (0–1 µm). The deserts of North Africa, the Middle East, and the Gobi maintain the highest pH values (> 7) across all size ranges, driven by non-volatile cations (e.g., Ca2+, Mg2+) that neutralize acidic components and enhance water uptake.
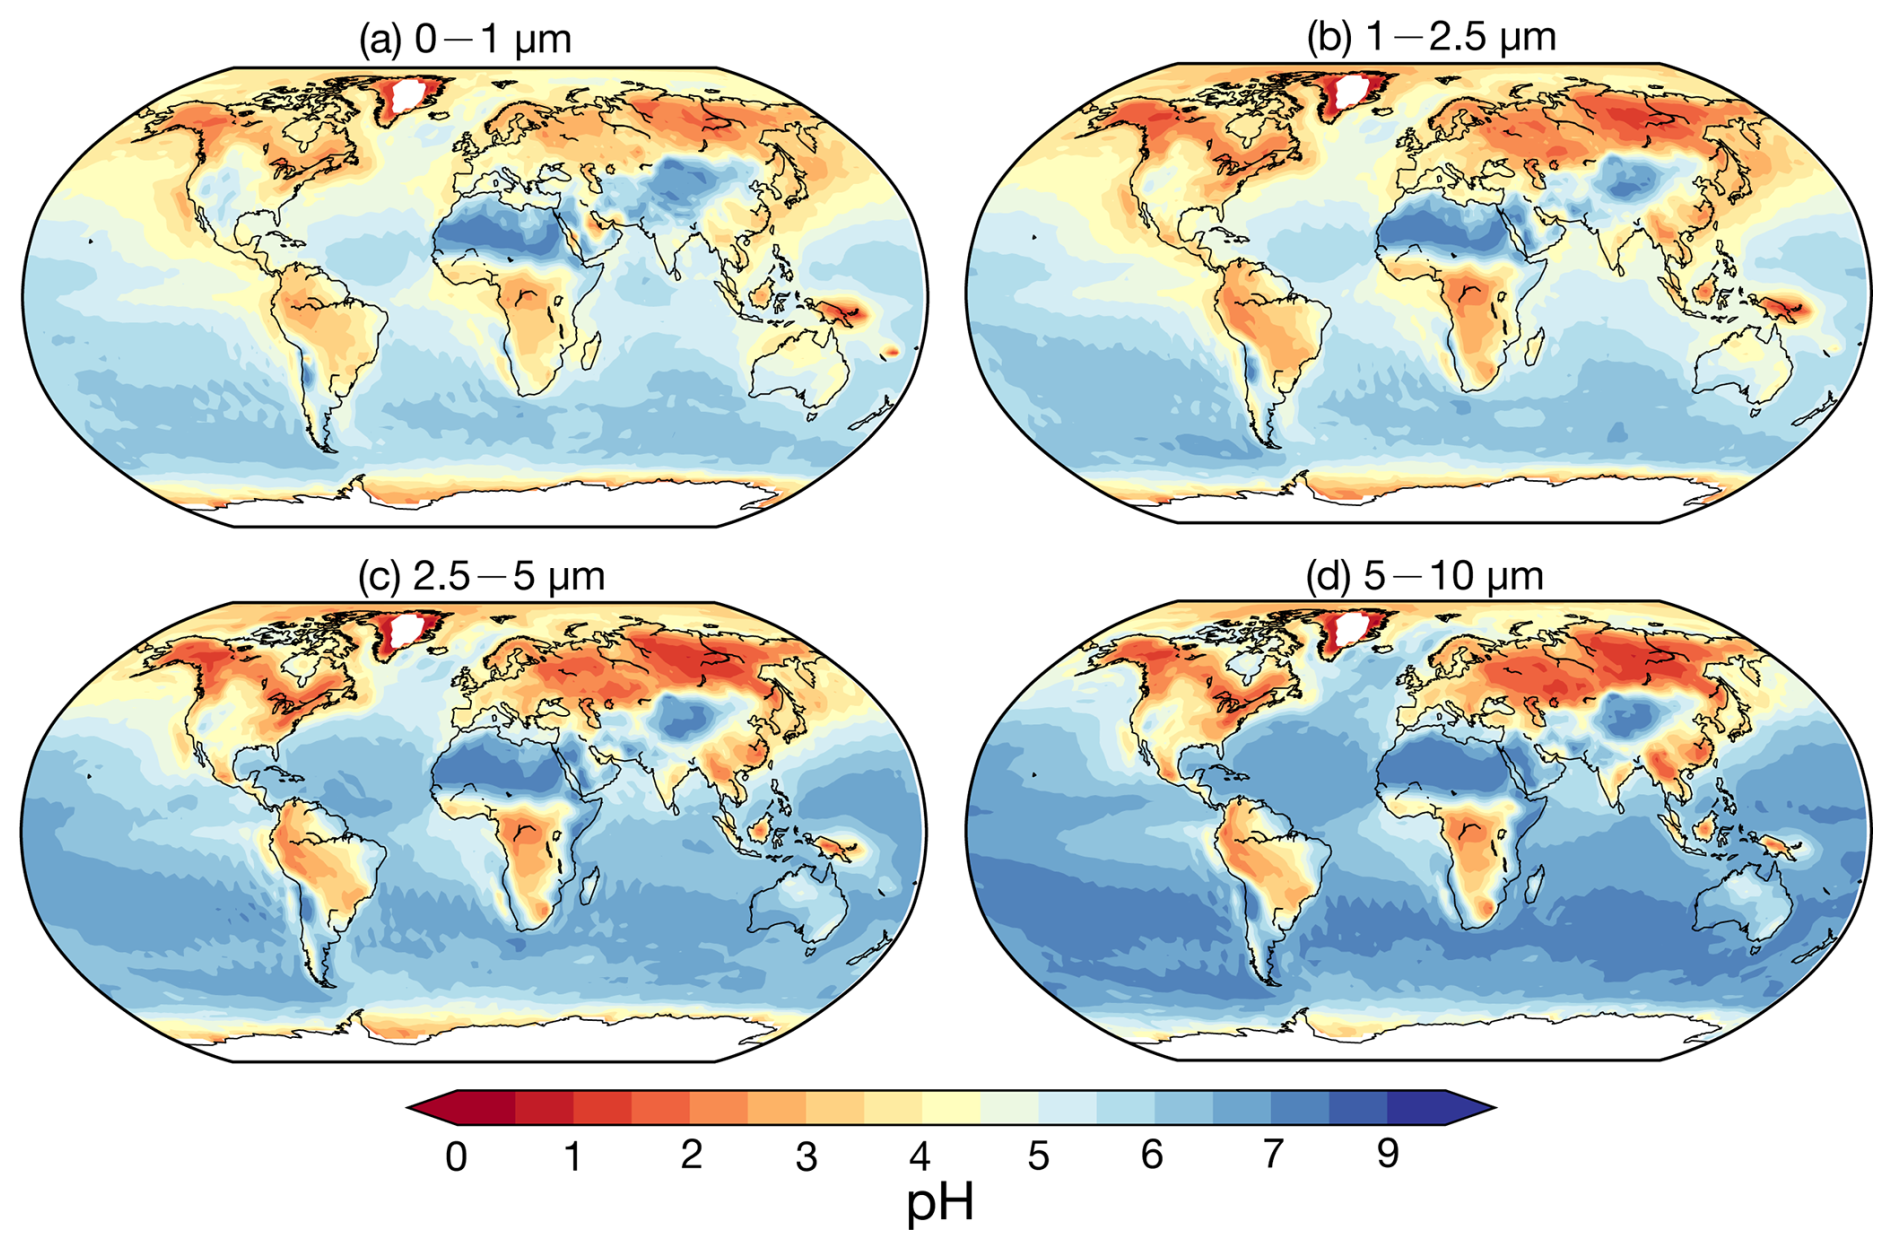
Figure 6Global distribution of surface average aerosol pH values in the following size ranges: (a) 0–1 µm, (b) 1–2.5 µm, (c) 2.5–5 µm, (d) and 5–10 µm. Derived from the base case from 2010 to 2012.
Table 9Size-resolved pH values across the globe and regions from simulation cases.
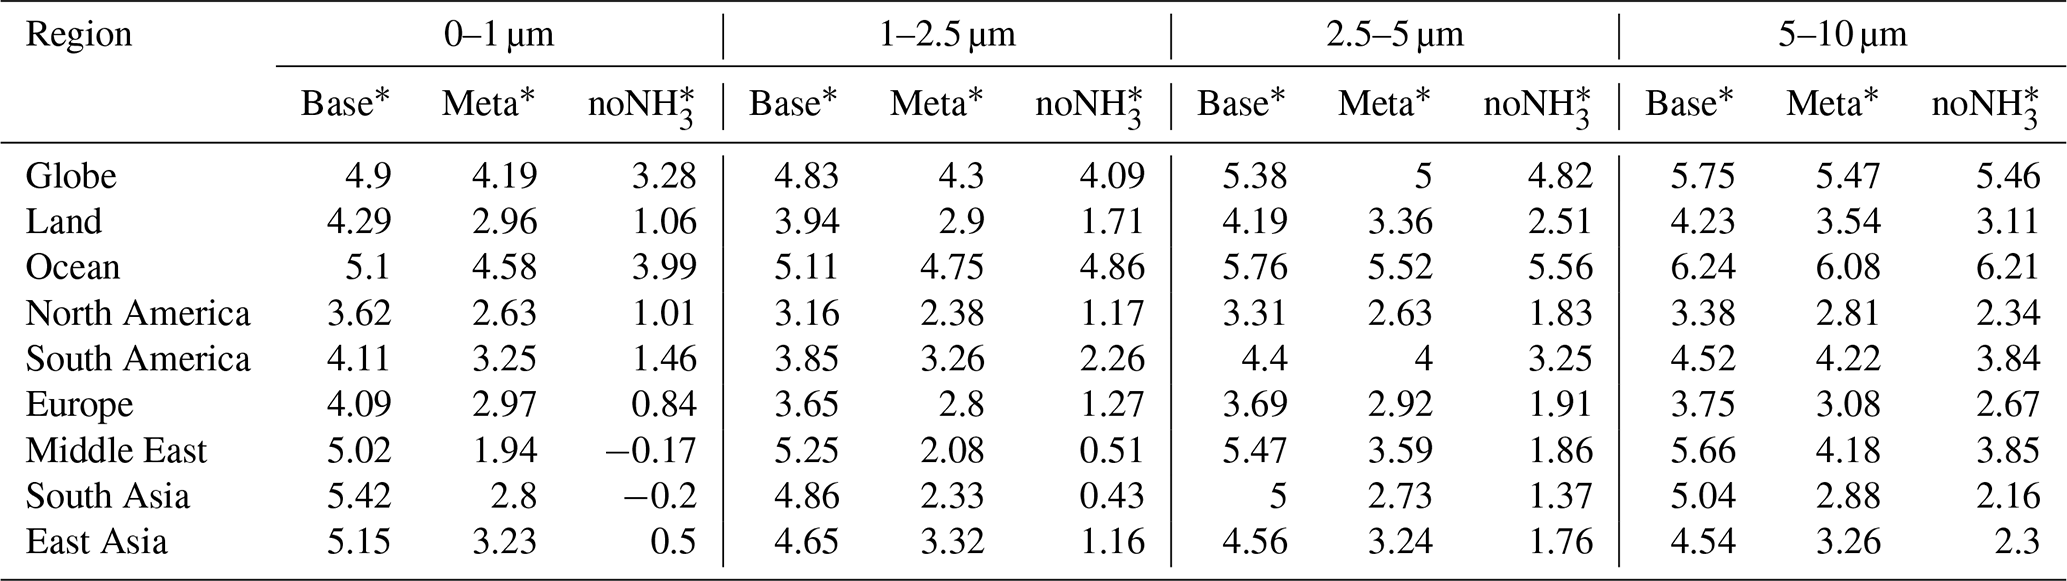
* Average pH value.
Regionally, higher pH values (5–5.7) in the Middle East are attributed to airborne dust, while coastal areas like the western Arabian Gulf have lower aerosol pH (< 3 in 0–1 µm) due to elevated sulfate concentrations. In South Asia, abundant NH3 emissions keep pH values between 5.4 and 4.9 despite high SO2 and NOx emissions. East Asia shows a distinct pH gradient, with desert regions in the northwest reaching pH > 7 across all sizes and southeast coastal areas exhibiting low pH (2–4), linked to significant SO2 emissions and sulfate formation. Europe (pH 3.7–4.1) and North America (pH 3.2–3.6) demonstrate moderate acidity, with the western USA exhibiting higher values (pH 4–6) due to desert influences. In South America, pH ranges from 3.9 to 4.5, with coastal regions exceeding 6 due to sea salt.
An increasing trend in pH is observed from North America to Europe and East Asia, consistent with prior studies (Zhang et al., 2021a; Ding et al., 2019; Guo et al., 2017b). Aerosol alkalinity is driven by NH and non-volatile cations, which neutralize SO and NO, while water-soluble ions (WSIs) enhance liquid water uptake. East Asia exhibits the highest pH among regions, facilitated by relatively low SO, abundant NH and WSIs, and significant NO and non-volatile cations in the coarse modes. These chemical properties outweigh the influence of meteorological effects such as differences in temperature and humidity.
Contrary to previous findings (e.g., Kakavas et al., 2021; Ding et al., 2019), which suggest decreasing aerosol acidity with increasing particle size, pH in the base case (stable state) for 0–1 µm exceeds that of 1–2.5 µm over many regions, excluding oceans and the Middle East. This is examined through three perspectives: first, the assumption of the phase state – as described in Sect. 2.2.1, the pH predictions based on the metastable state tend to be lower than those based on the stable state under low-RH conditions. Although previous studies concluded that the choice between stable and metastable assumptions in ISORROPIA has no significant impact on pH predictions (Song et al., 2018), our sensitivity simulation assuming metastable conditions (Meta case) yields consistently lower pH values across all particle size ranges. The differences in pH relative to the base case are shown in Fig. 7 and Table 9. The most substantial reductions are observed in regions with high mineral cations and/or low RH, such as South Asia and the Middle East, where the pH decreases by more than 2 units. These results are consistent with the findings of Karydis et al. (2021) and Milousis et al. (2024). For instance, Karydis et al. (2021) reported that the stable-state assumption yields global average pH values approximately 0.5 units higher than those from the metastable assumption, comparable to the magnitude of differences calculated in our study (Table 9). While the Meta case explains some discrepancies, pH in the 0–1 µm size range remains higher relative to the 1–2.5 µm range in several regions. Another sensitivity simulation, removing NH3 emissions (noNH3 case), significantly reduced pH across all sizes over land, especially in NH3-rich regions like South Asia and the Middle East, where 0–1 µm pH dropped below zero. This indicates increased pH sensitivity in the fine size ranges (i.e., 0–1 and 1–2.5 µm), particularly in regions where NH3 availability is abundant. Excluding NH3 results in a consistent pH increase with particle size across all regions. Finally, as discussed in Sect. 4.1, the comparison with observed size-resolved mass concentrations and the NH3 NH partitioning ratio reveals an underestimation of acidic components (SO and NO) and an overestimation of alkaline components in the 0–1 µm size range, along with an inadequate treatment of NH3 NH partitioning. This chemical imbalance contributes to the anomalously high simulated pH in the fine mode (0–1 µm). For instance, the observed SO, NO, and NH at 0–1 µm accounts for 91 %, 59 %, and 67 % of 0–2.5 µm, respectively, at the Montseny site during 2010 compared to the accounting of 79 %, 54 %, and 77 % in the simulation, highlighting a need for improved representation of aerosol composition in fine modes. In addition, the observed mean NH partitioning ratios (NH (NH3 + NH), in µmol m−3) during 2010–2012 from EMEP, NNDMN, and AMoN are 49 %, 49 %, and 50 %, respectively. Our model shows low biases, with mean ratios of 32 %, 39 %, and 41 %. These results reinforce the necessity of refining the treatment of NH3 NH partitioning to better capture the size-resolved trend of aerosol acidity.
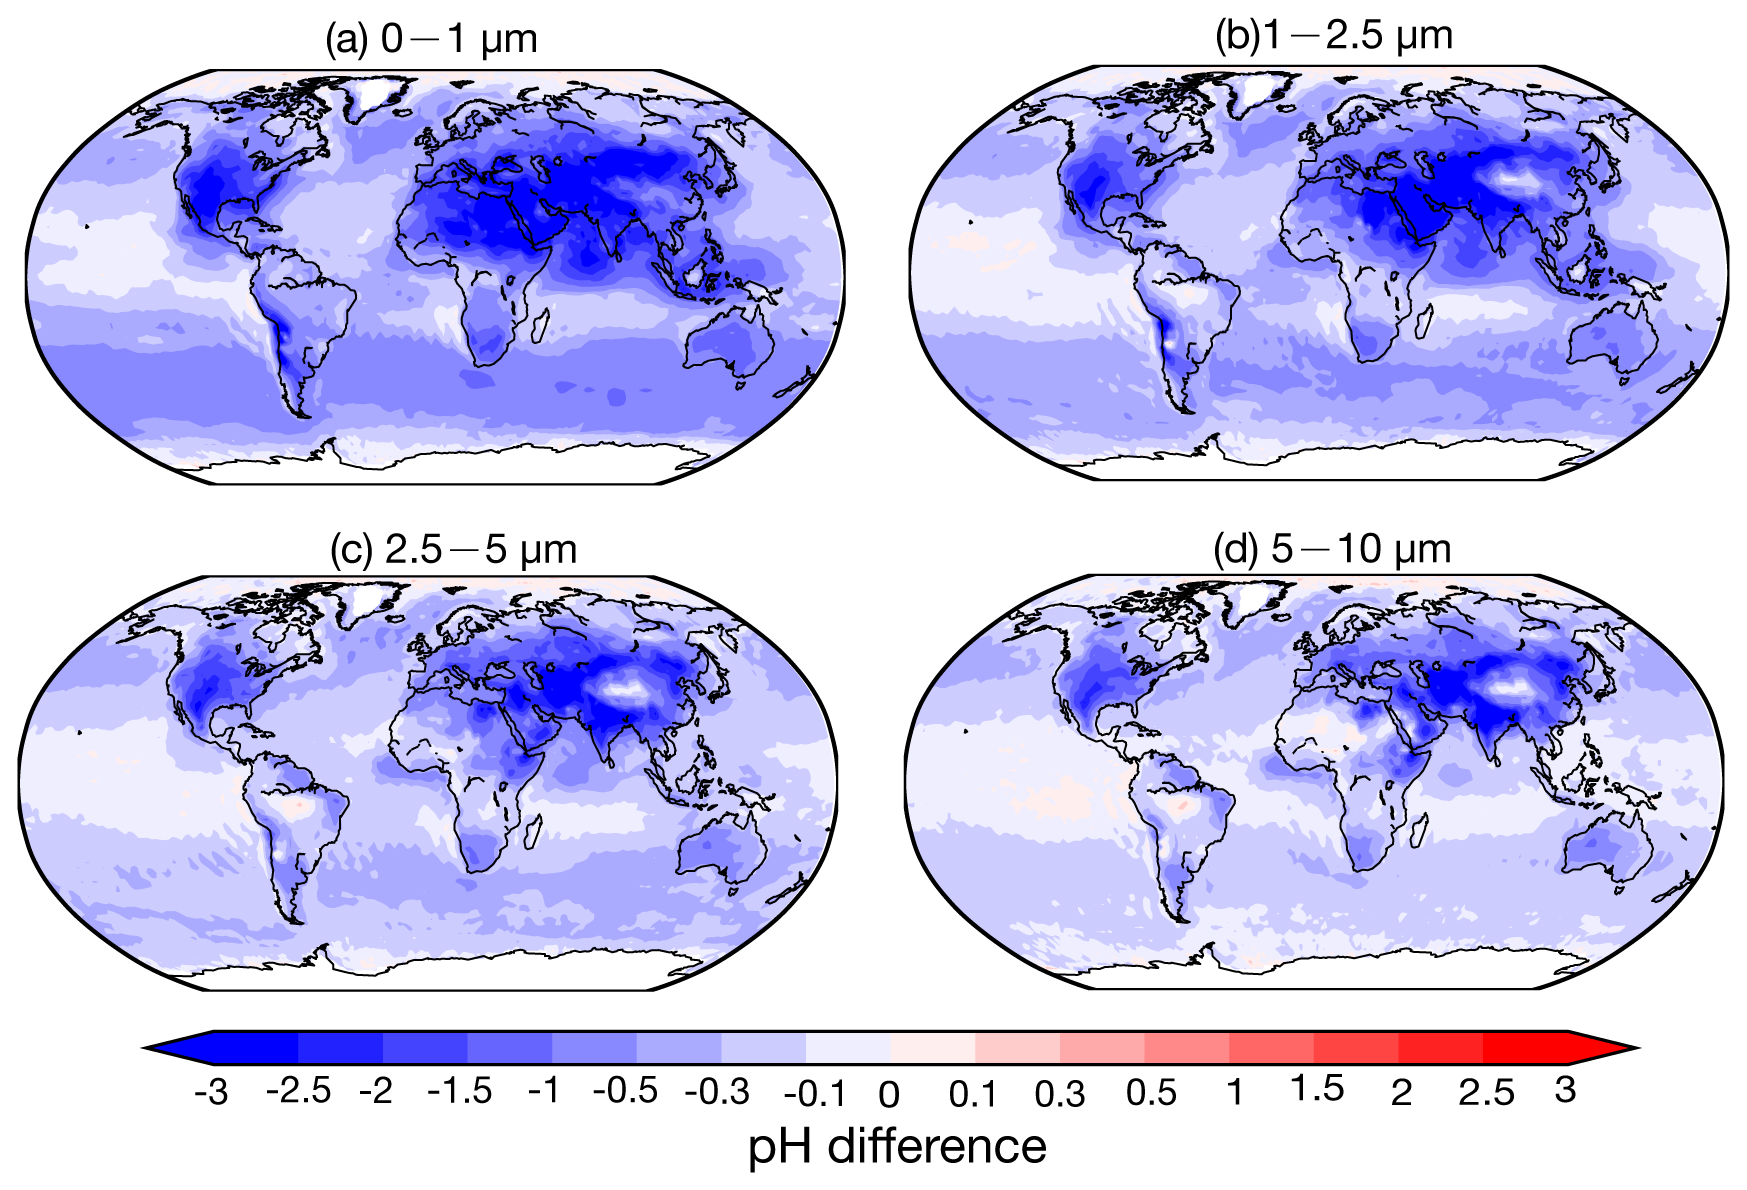
Figure 7Global distribution maps of pH value absolute difference between Meta case and base case in the size ranges of 0–1, 1–2.5, 2.5–5, and 5–10 µm, averaged from 2010 to 2012.
Part of the discrepancy in size-resolved pH calculations between models may arise from differences in how particle size distributions and gas–particle partitioning are treated. EMAC model uses a lognormal size distribution and applies ISORROPIA separately to each size mode to calculate gas–aerosol partitioning. In contrast, other studies (e.g., Kakavas et al., 2021) employ sectional approaches, where gas–aerosol partitioning is first performed on the bulk aerosol phase, and the resulting condensed mass is then distributed across size bins based on the available surface area. These fundamental differences in modeling assumptions can lead to variations in the predicted distribution of aerosol components across size ranges, which in turn affects the calculated size-resolved pH. Moreover, previous studies investigating size-resolved aerosol acidity also have certain limitations. For instance, a laboratory study observed increasing aerosol acidity with decreasing particle size, but this trend only holds for pH below 2 (Craig et al., 2018). Similarly, a field study by Fang et al. (2017) reported the same trend but lacked concurrent measurements of key gas-phase species, which limits the interpretability of the results.
The formation of secondary inorganic aerosols is strongly linked to NH3 emissions (Wu et al., 2016; Chen et al., 2019; Liang et al., 2024). Xu et al. (2020) and Wang et al. (2015) have highlighted the critical role of gas–particle partitioning of NH3 NH in SNA formation, which is influenced by factors such as temperature, aerosol water content, and aerosol acidity (Nenes et al., 2020). Notably, the NH3 NH partitioning process buffers aerosol acidity, maintaining stability even amid shifts in acidic species like NO and SO (Karydis et al., 2021). These findings suggest that the effects of NH3 emissions on SNA formation and aerosol acidity remain understudied (Weber et al., 2016; Zheng et al., 2022; Fu et al., 2017; Zou et al., 2024). However, most studies have focused on fine particles (PM2.5 or PM1), polluted regions (e.g., northern China), and haze episodes (Ge et al., 2019; Gao et al., 2016). Modeling studies often evaluate the effects of NH3 emission changes by uniformly altering emission levels within each grid (Pozzer et al., 2017; Fu et al., 2017). While such approaches provide valuable insights, they may lack feasibility as NH3 abundance correlates with population density, making uniform changes less representative of real-world scenarios. To address this, we compare the effects of two NH3 emission schemes, CEDS and Top-Dep, on size-resolved SNA mass concentration and aerosol acidity relative to the base case.
The NH3 mass concentration serves as a proxy for NH3 emissions, and differences in NH3 mass concentrations between the scenarios and the base case (Fig. S4) align with corresponding emission differences (Fig. 1). Figures 8 and 9 show the responses of size-resolved NH, NO, and SO mass concentrations to NH3 emission changes in the CEDS and Top-Dep cases, respectively. Similarly, Fig. 10 illustrates the size-resolved aerosol acidity responses for the two cases. Additional details are provided in the Supplement: Figs. S5–S7 (CEDS case) and Figs. S8–S10 (Top-Dep case) depict the size-resolved responses of NH, NO, and SO mass concentrations, while Figs. S11 and S12 highlight changes in size-resolved aerosol acidity.
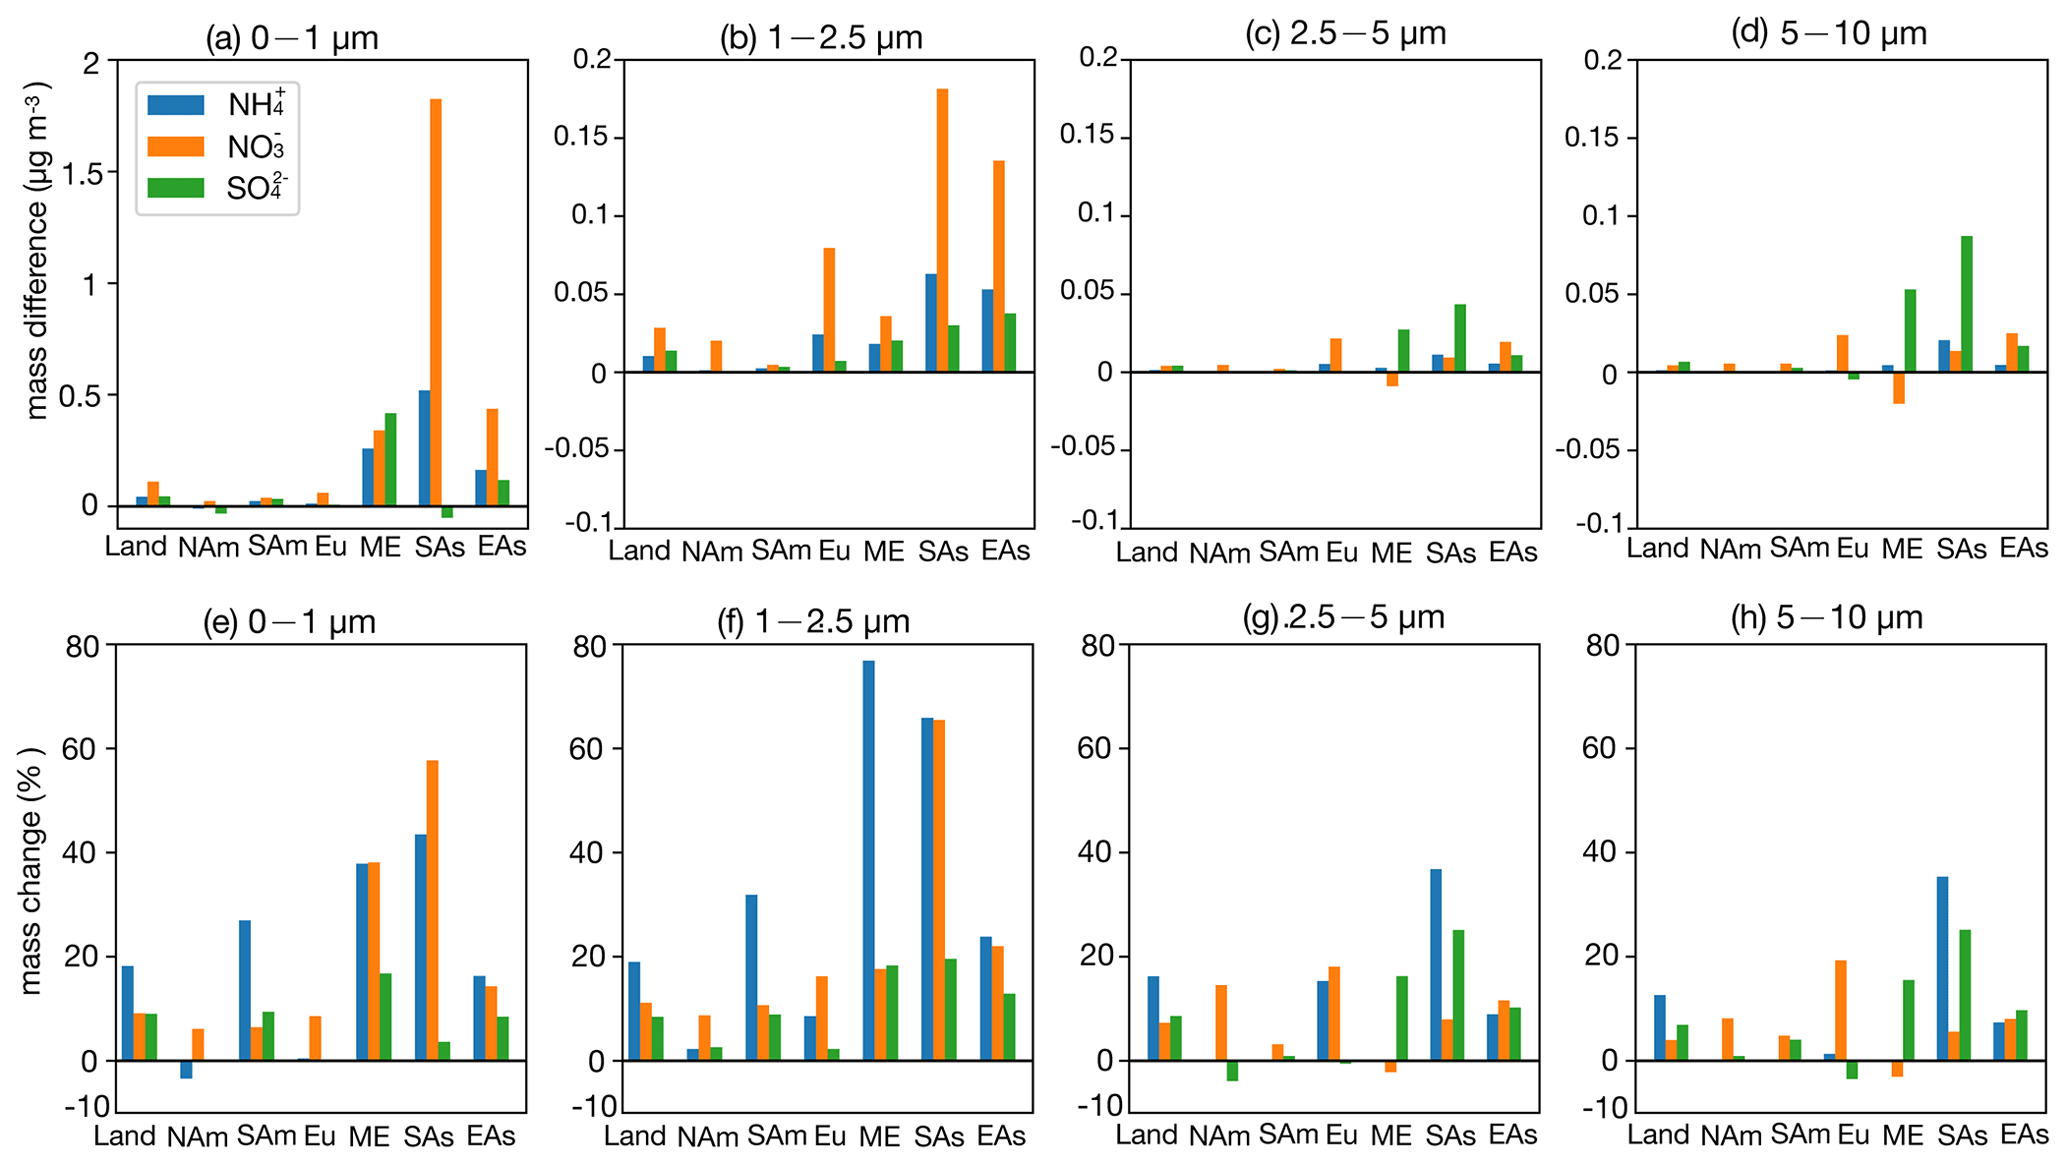
Figure 8Bar plots for regional surface SNA mass concentration (µg m−3) absolute difference between the CEDS case and base case in the four size ranges (a–d); change ratio in the four size ranges (e–h). The calculation of the change ratio in the size range of 0–1 µm is based on the mask of 0.1 µg m−3; the change ratio in the size range of 1–2.5, 2.5–5, and 5–10 µm is based on the mask of 0.05 µg m−3 (Land: global land; NAm: North America; SAm: South America; Eu: Europe; ME: Middle East; SAs: South Asia; EAs: East Asia).
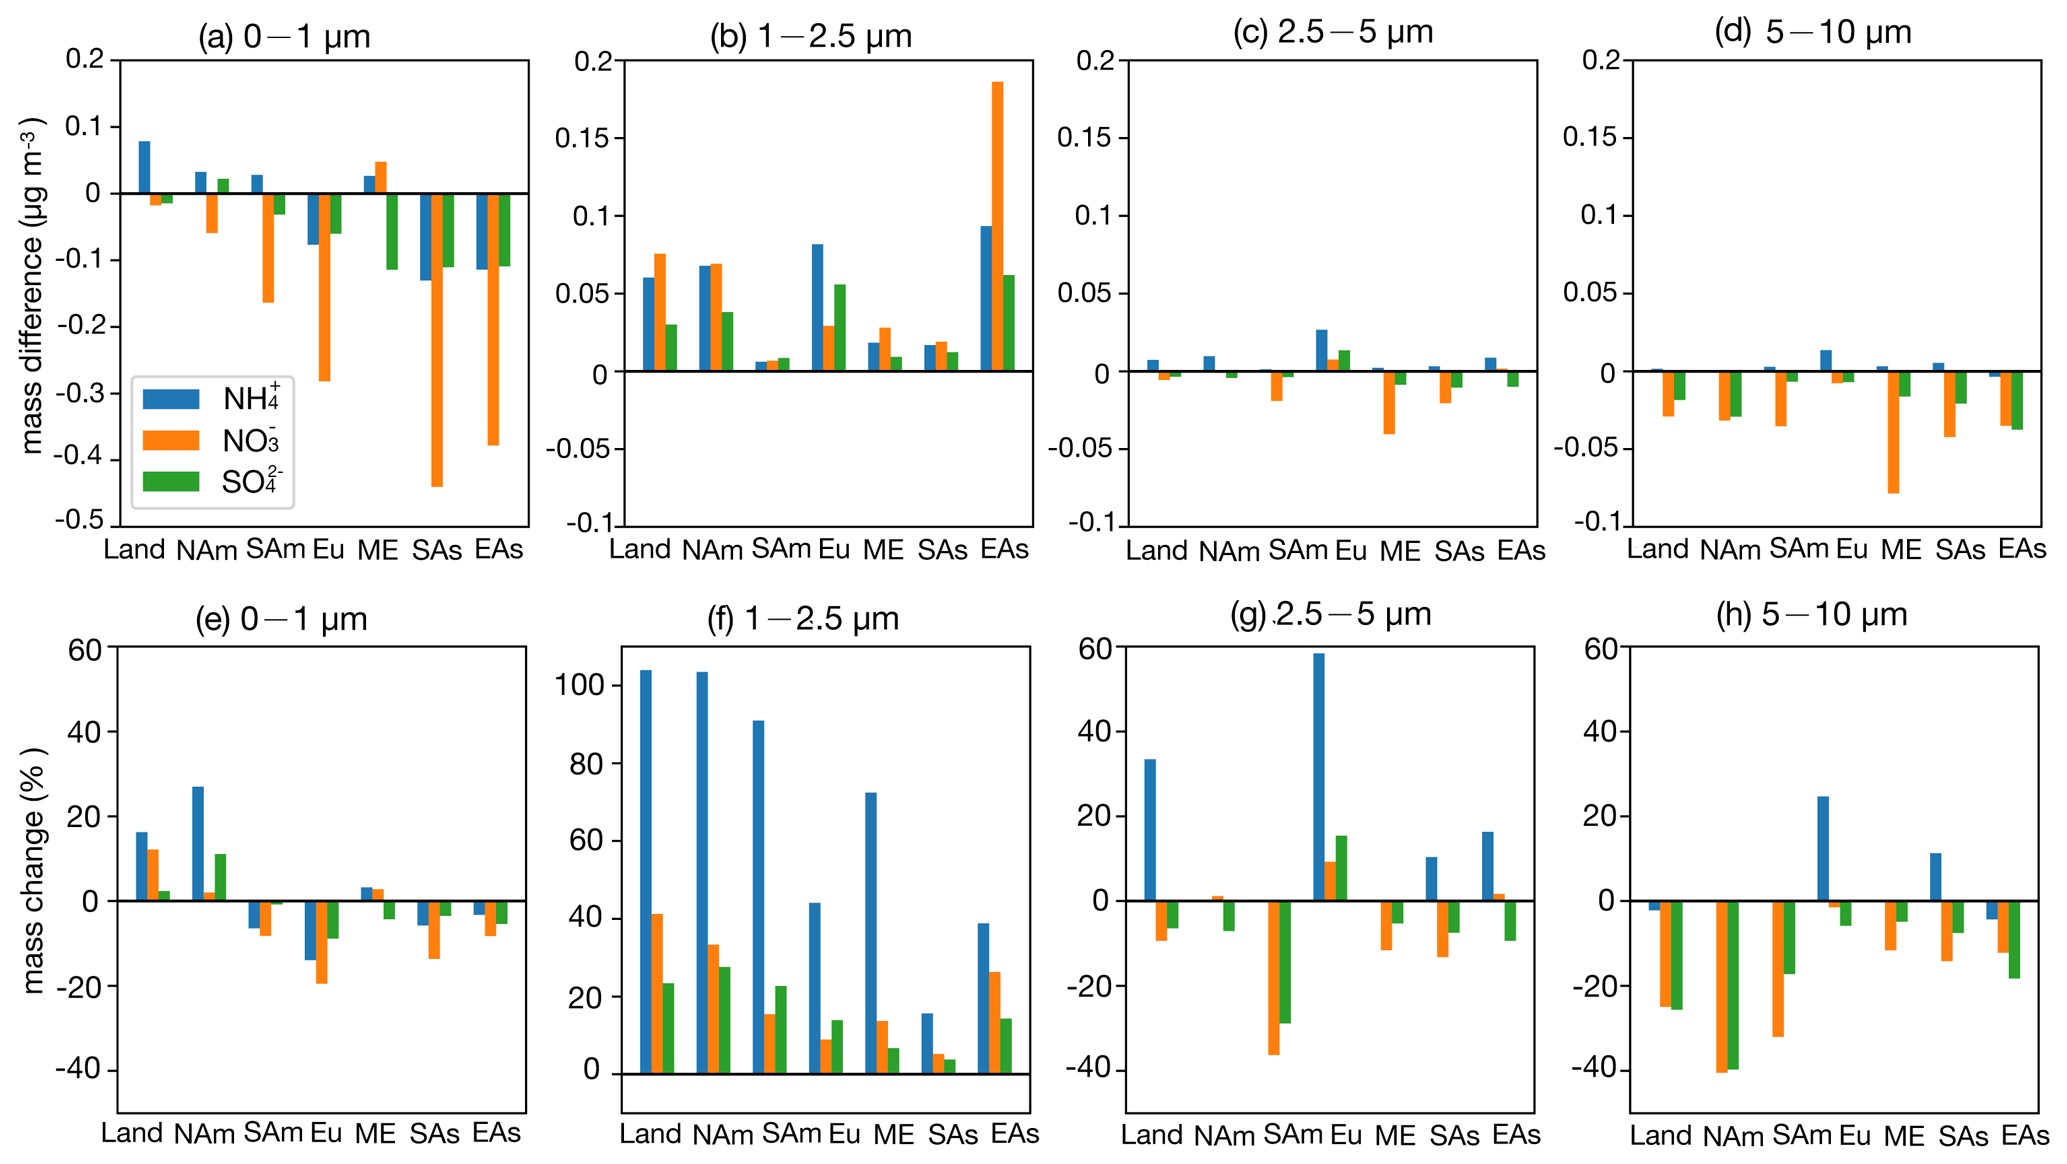
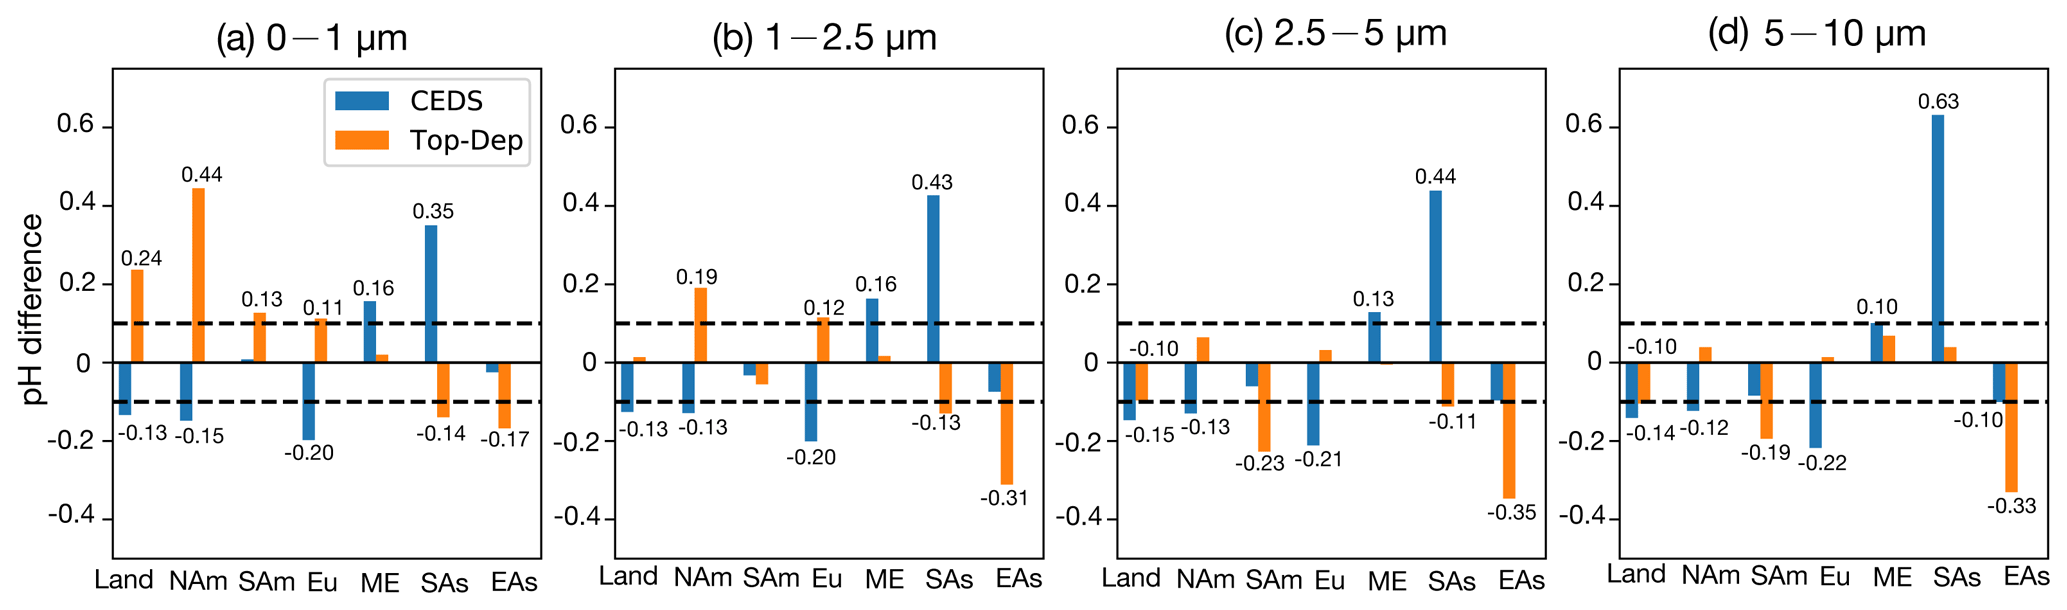
Figure 10Bar plots for the pH value absolute difference between the CEDS/Top-Dep case and base case in the four size ranges (a–d), with the two dashed lines representing the value of 0.1 and −0.1, respectively (Land: global land; NAm: North America; SAm: South America; Eu: Europe; ME: Middle East; SAs: South Asia; EAs: East Asia).
The regional gas–particle partitioning ratios for NH3 NH (ε(NH) = NH (NH + NH3)) and NO HNO3 (ε(NO) = NO (NO + HNO3)) are shown in Fig. S13. Regional emission amounts of NOx and SO2 from the CAMS and CEDS_GBD inventories are detailed in Table S1.
7.1 Size-resolved SNA response
Regarding the atmospheric budget of NH3 (Table 8), a modest increase in global NH3 emissions (CEDS case) slightly raises deposition of NH3 and shortens the lifetime. Meanwhile, both the burden and the deposition of NH are increased, with a longer lifetime. In contrast, the larger emission increase in the Top-Dep cases does not alter the NH3 burden but leads to higher deposition and a shorter lifetime for both species.
Across land regions, a small increase in NH3 emissions (CEDS case), along with rising NOx and SO2 emissions, slightly raises ε(NH) while marginally lowering ε(NO) (Fig. S13). The SNA mass concentration increases consistently across size ranges, with the most notable growth in NH and NO in the 1–2.5 µm range (19 % and 11 %, respectively) and SO in the submicron particles (9 %). Under a larger NH3 emission increase (Top-Dep case), ε(NH) drops significantly and ε(NO) decreases slightly. The SNA response becomes more pronounced, with substantial increases in the 1–2.5 µm range (NH: 104 %; NO: 41 %; SO: 23 %), while NO and SO decrease in coarser particles. These shifts are linked to higher NH3 emissions in relatively clean, high-latitude regions with low NH3 flux (Fig. 1c), which elevate NH3 concentrations (Fig. S4) and enhance NH formation (Fig. S8).
Regional analysis of SNA responses in Europe shows that a 23 % reduction in NH3 emissions, along with increases in NOx and SO2 emissions (CEDS case), raises ε(NH) slightly while causing a minor drop in ε(NO). The SNA mass increases mainly in the 1–2.5 µm range, with a slight decrease in SO in coarser particles. Since Europe has abundant NH3, reductions are offset by existing availability and rising NOx and SO2 levels, leading to additional NH4NO3 and (NH4)2SO4 formation. With higher NH3 emissions (Top-Dep case), the response becomes more complex: SNA decreases in the submicron particles (Fig. 9e) but increases in larger particles (Fig. 9f–g), with the largest growth seen in NH (∼ 50 %).
In East Asia, reducing NH3 emissions while increasing NOx and SO2 emissions (CEDS case) raises ε(NH) and slightly increases ε(NO). SNA grows across all particle sizes, with the most significant changes in the 1–2.5 µm range (Fig. 8f). A similar NH3 reduction in the Top-Dep case produces comparable ε(NH) and ε(NO) changes, with SNA mainly decreasing in the submicron particles. The response in East Asia resembles that of Europe, where abundant NH3 buffers SNA changes. In South Asia, NH3 and NOx emissions rise in the CEDS case, while SO2 emissions decline, slightly lowering ε(NH) and increasing ε(NO). NH and NO concentrations grow across all size ranges (Fig. 8), with the largest NH increase found in 1–2.5 µm particles (66 %) and NO rising in both submicron and 1–2.5 µm particles (∼ 60 %). SO decreases in submicron particles but increases in coarser ones (25 %). Conversely, reducing NH3 emissions in the Top-Dep case raises ε(NH) and lowers ε(NO), leading to SNA declines, especially in submicron particles. South Asia, with abundant NH3, shows NO as the limiting factor for NH4NO3 formation, driving strong ε(NO) and NO responses in finer particles.
In North America, NH3 and SO2 emissions decrease, while NOx emissions slightly rise (CEDS case). ε(NH) increases marginally, whereas ε(NO) declines slightly. NH and SO show minor reductions in submicron particles, while NO increases. In the Top-Dep case, a sharp rise in NH3 emissions, mainly over Canada and Greenland, significantly lowers ε(NH), stabilizes ε(NO), and increases NH and SO in 1–2.5 µm particles. In South America, a small NH3 emission rise (CEDS case) has little effect on ε(NH) or ε(NO), resulting in minimal aerosol composition changes. However, a substantial NH3 increase (Top-Dep case) significantly boosts NH3 concentrations, reduces ε(NH) and ε(NO), and shifts aerosol partitioning to smaller particles, particularly in central regions. Decreased NO and SO in surrounding areas (Figs. S9–S10) suggest NH3 is neutralizing transported species, explaining the observed ε(NO) reduction. Changes in other particle size ranges are minimal. In the Middle East, NH3 emissions rise moderately (20 %), along with slight NOx and SO2 increases (CEDS case). ε(NH) and ε(NO) remain stable, with NH and NO increasing mainly in submicron particles (∼ 40 %), while SO grows across sizes (∼ 15 %). A minor NH3 emission drop (Top-Dep case) reduces NH3 concentrations but enhances SNA in 1–2.5 µm particles, highlighting compensatory NH3 effects in NH3 very rich domains.
Overall, higher NH3 emissions enhance SNA formation, particularly in the fine size ranges (0–1 and 1–2.5 µm). Greater NH formation (e.g., Top-Dep case) depletes NO and SO from coarse size ranges, leading to decreases in the 2.5–5 and 5–10 µm ranges. In low-SNA regions (e.g., South America, Greenland), NH3 increases have limited SNA impacts but substantially elevate NH3 concentrations. In NH3 very rich regions (e.g., East Asia, Europe), NH3 reductions alone may still increase ε(NH), promoting further SNA formation. These findings align with Zou et al. (2024), emphasizing the greater effectiveness of NOx reductions in PM2.5 mitigation compared to NH3 or SO2 control in ammonia-rich environments. Coordinated control of precursor emissions is crucial for mitigating air pollution, especially in heavily polluted regions (Wen et al., 2024).
7.2 Aerosol acidity response
7.2.1 Size-resolved pH changes
Among atmospheric buffering agents (e.g., conjugate acid–base pairs like NH3 NH and CO2 HCO, as well as organic acids), the NH3 NH acid–base pair exhibits the largest buffering capacity for aerosols, dominating much of the continental urban area (Zheng et al., 2023, 2020). When NH3 emissions are entirely eliminated, changes in marine aerosol pH values are negligible compared to the base case (noNH3 case, Table 9 and Fig. S14). However, aerosols over land become significantly more acidic, with pH values in the 0–1 µm size range dropping to −0.2 in South Asia and −0.17 in the Middle East (Fig. 10). The most substantial pH decreases occur in 0–1 µm aerosols, primarily in South Asia, East Asia, Europe, North America, and South America, consistent with the “NH3-buffered regions” identified by Zheng et al. (2020).
Interestingly, while neither the Middle East nor northern Africa is categorized as “NH3-buffered regions”, noticeable pH decreases are observed in the 0–1 and 1–2.5 µm size ranges over the Middle East, including Egypt and Libya. In these regions, the SNA is dominated by SO rich and NO rich chemical domains (Fig. 4), where NH3 levels are insufficient to neutralize acidic components, resulting in available NO and SO. This results in excess acidic components, particularly in the 0–1 and 1–2.5 µm size ranges (Fig. S3). Without NH3 emissions, the abundance of NO and SO further increases aerosol acidity.
Compared to the base case, size-resolved pH values in the CEDS case show an average decrease of −0.13 to −0.15 units over land. The most pronounced decreases occur in remote regions of the Northern Hemisphere (Fig. S11), where NH3 emission flux is relatively low. In contrast, the Top-Dep case exhibits an average pH increase of 0.24 units in the 0–1 µm range over land, driven by the higher NH3 emission flux. This NH3-driven alkalization effect is less pronounced in the 1–2.5 µm range due to counteracting acidification effects from newly formed acidic components, as suggested by Zheng et al. (2024). Notably, pH decreases of −0.10 units are found in the 2.5–5 and 5–10 µm size ranges.
In East Asia, the pH changes in the CEDS case are concentrated in the 2.5–5 and 5–10 µm ranges (−0.10 units in both), with minimal changes in the 0–1 and 1–2.5 µm ranges. In the Top-Dep case, however, pH changes are more drastic across all size ranges: 0–1 µm (−0.17 units), 1–2.5 µm (−0.31 units), 2.5–5 µm (−0.35 units), and 5–10 µm (−0.33 units). These discrepancies between cases highlight that a reduction in NH3 emissions enhances aerosol acidity (as in the Top-Dep case), but this effect can be partially offset by shifts in SO and NO mass concentrations (as in the CEDS case). For instance, in the CEDS case, decreases in SO and NO concentrations result in pH rises of 0.15–0.25 units across all size ranges compared to the Top-Dep case.
Our simulation results align with other studies. For example, Song et al. (2019) found that a ∼ 0.3 increase in log 10[NH3] contributed to a 0.3–0.4 unit rise in PM1 pH in Beijing during winter between 2014/2015 and 2018/2019. Concurrent changes in aerosol composition (increased NO and reduced SO and Cl−) led to a modest increase in pH of 0.1 units. Similarly, Zhou et al. (2022) observed a minor PM2.5 pH decrease of −0.24 units in the Yangtze River Delta region from 2011 to 2019, despite significant changes in aerosol composition resulting from the Air Pollution Prevention and Control Action Plan.
7.2.2 Drivers of pH changes
We further quantify the changes in pH values between the CEDS/Top-Dep cases and the base case, isolating the contributions from changes in H+ and H2O concentrations (detailed in Sect. 2.2.2). The results are presented in Figs. S15 and S16.
In the CEDS case, the decreased pH values across all four aerosol size ranges are primarily driven by changes in H+ concentrations, particularly over the remote regions of the Northern Hemisphere. The effects of H2O concentration changes are particularly relevant in the Middle East and South Asia. Notably, a substantial pH increase is observed in South Asia, with increases of 0.35, 0.43, 0.44, and 0.63 units in the 0–1, 1–2.5, 2.5–5, and 5–10 µm size ranges, respectively. These increases are predominantly caused by changes in H+ concentrations, which fully counteract the pH-decreasing effects of changes in H2O concentrations.
In the Top-Dep case, although changes in H+ concentrations significantly enhance pH values in the 0–1 µm size range, the pH-decreasing effects of changes in H2O concentrations are distributed across all four size ranges over the entire land surface. In East Asia, both H+ and H2O concentration changes contribute substantially to the observed pH decreases, highlighting their combined impact.
In summary, NH3 emissions play a crucial role in maintaining terrestrial aerosols at moderately acidic levels, particularly in the fine-mode size range of 0–1 µm. When NH3 emissions are completely removed in the model, the largest pH decreases are found in this size range. In general, pH changes demonstrate a consistent trend with variations in NH3 emissions in the fine-mode ranges (0–1 and 1–2.5 µm) based on our findings. Overall, pH changes in the fine-mode aerosols (0–1 and 1–2.5 µm) show a consistent response to variations in NH3 emissions. However, increases in SO and NO associated with elevated NH3 emissions can partially offset the expected rise in pH (e.g., over land areas in the 1–2.5 µm range in the CEDS case). Furthermore, in regions with high SO2 and NOx emissions, such as East Asia under the CEDS inventory, the enhanced formation of SO and NO can counteract the pH-lowering effect of reduced NH3 emissions. In the coarser size ranges (2.5–5 and 5–10 µm), however, pH changes are governed by the competing influences of H+ and H2O concentration changes.
This study applied three distinct NH3 emission schemes to the global atmospheric chemistry and climate model (EMAC) to assess the impact of NH3 emissions on the size-resolved sulfate–nitrate–ammonium (SNA) aerosol composition and aerosol acidity. It also explores the synergistic effects arising from concurrent changes in NH3, SO2, and NOx emissions. The emission schemes include two bottom-up inventories and one inventory updated through a top-down approach. By simulating the aerosol size ranges of 0–1, 1–2.5, 2.5–5, and 5–10 µm, the study provides a comprehensive assessment of how NH3 emissions influence global aerosol chemistry and acidity across different particle size fractions.
The model accurately captures the distribution of global NH3 hotspots, but comparisons with observational datasets reveal positive biases in NH3 concentrations and underestimations of NH in some regions such as China, North America, and Europe. This discrepancy suggests inefficiencies or oversimplifications in the NH3 NH partitioning treatment, with insufficient NH generated despite NH3 availability. In East and Southeast Asia, NH concentrations are well-simulated, but discrepancies were found for NO and SO, likely due to the absence of heterogeneous oxidation processes in the model. The simulated global NH3 burden and lifetime are higher than reported in related studies, attributed to the wet-deposition scheme used in EMAC, which accounts for pH adjustments for NH3 dissolution.
Over oceans, NH3 is entirely converted into NH, while SO remains partially neutralized due to low NH3 emissions and high SO levels from biogenic dimethyl sulfide (DMS) emissions and NOx and SO2 from shipping. Marine SO and NO are dominant in the supermicron modes, with mass fractions of 70 % and 58 %, respectively. Over land, total ammonia (the sum of NH3 and NH) generally exceeds SO, enabling more complete neutralization, except in regions such as northern Russia, central Africa, and the Arabian Peninsula. Terrestrial NO is also largely neutralized by NH3, resulting in over 60 % of SNA concentrated in the submicron mode. In polluted areas such as East and South Asia, submicron SNA fractions exceed 70 %, with South Asia exhibiting nearly 90 % submicron NH. In contrast, the Middle East, dominated by dust and with minor NH3 emissions, shows incomplete neutralization of SO and NO. Here, nearly 70 % of NO resides in the supermicron modes, while NH and SO dominate the submicron mode with respective mass fractions of 96 % and 79 %.
In the Northern Hemisphere, terrestrial aerosols are generally more acidic than marine aerosols, except in desert regions. Remote marine and desert aerosols remain neutral due to the alkaline influence of sea salt and non-volatile cations in dust, which enhance water uptake and neutralize SO and NO. However, at high latitudes, marine aerosols become more acidic due to the long-range transport of anthropogenic pollutants from continental sources. The 0–1 µm size range exhibits higher pH values than the 1–2.5 µm range in many regions, influenced by several factors. These include the assumption of a thermodynamically stable aerosol phase in the ISORROPIA model, the high sensitivity of aerosol acidity to NH3 in the 0–1 µm range, and observed lower concentrations of acidic components (SO and NO) in this size range compared to larger sizes.
An 18 % increase in NH3 emissions over land leads to a significant increase in SNA concentrations in the 1–2.5 µm size range (NH: 104 %; NO: 41 %; SO: 23 %), while coarse-mode SNA (2.5–10 µm) decreases. However, changes in size-resolved pH remain minimal, with the largest increase of 0.24 pH units occurring in the 0–1 µm range. In regions with low SNA, such as South America and Greenland, increased NH3 emissions only lead to higher NH3 concentrations due to the limited availability of HNO3 and H2SO4 for SNA formation. Conversely, in NH3-rich regions such as East Asia and Europe, reductions in NH3 emissions trigger compensatory effects, as excess NH3 interacts with available SO2 and NOx to maintain SNA formation despite the reduced NH3 supply. This highlights the buffering capacity of NH3 in stabilizing aerosol acidity in densely populated regions. However, it is important to note that this buffering effect may be partially offset by concurrent increases in SO and NO concentrations.
In summary, this study underscores the critical influence of NH3 emissions on global aerosol composition and acidity, with pronounced impacts on the size-resolved composition and properties of SNA aerosols. NH3 emissions significantly modulate aerosol acidity, particularly in submicron ranges, highlighting the sensitivity of fine-mode aerosols to NH3 levels. By buffering changes in aerosol pH, NH3 emissions contribute to maintaining a relatively stable aerosol acidity, especially in densely populated and heavily industrialized regions. These findings emphasize the importance of accurately representing NH3 dynamics in models for predicting atmospheric chemistry and climate interactions.
The usage of MESSy (Modular Earth Submodel System) and access to the source code is licensed to all affiliates of institutions which are members of the MESSy Consortium. Institutions can become a member of the MESSy Consortium by signing the “MESSy Memorandum of Understanding”. More information can be found on the MESSy Consortium website: http://www.messy-interface.org (last access: 31 January 2025). The code used in this study has been based on MESSy version 2.55 and is archived with a restricted-access DOI (https://doi.org/10.5281/zenodo.8379120, The MESSy Consortium, 2023). The data produced in the study are available from the authors upon request.
The supplement related to this article is available online at https://doi.org/10.5194/acp-25-10559-2025-supplement.
XW and VAK planned the research and wrote the manuscript. XW performed the simulations and analyzed the results, assisted by VAK and APT. XW and APT collected the observational data and conducted the model evaluation. XW and ZL designed the Top-Dep case. All the authors discussed the results and contributed to the paper.
At least one of the (co-)authors is a member of the editorial board of Atmospheric Chemistry and Physics. The peer-review process was guided by an independent editor, and the authors also have no other competing interests to declare.
Publisher's note: Copernicus Publications remains neutral with regard to jurisdictional claims made in the text, published maps, institutional affiliations, or any other geographical representation in this paper. While Copernicus Publications makes every effort to include appropriate place names, the final responsibility lies with the authors.
This article is part of the special issue “The Modular Earth Submodel System (MESSy) (ACP/GMD inter-journal SI)”. It is not associated with a conference.
The work described in this paper has received funding from the Initiative and Networking Fund of the Helmholtz Association through the project “Advanced Earth System Modelling Capacity (ESM)”. The authors gratefully acknowledge the Earth System Modelling Project (ESM) for funding this work by providing computing time on the ESM partition of the supercomputer JUWELS (Alvarez, 2021) at the Jülich Supercomputing Centre (JSC). Xurong Wang has been supported by the China Scholarship Council (CSC, file no. 202106780002).
This research has been supported by China Scholarship Council (CSC, file no. 202106780002).
The article processing charges for this open-access publication were covered by the Forschungszentrum Jülich.
This paper was edited by Kelley Barsanti and reviewed by two anonymous referees.
Aas, W., Mortier, A., Bowersox, V., Cherian, R., Faluvegi, G., Fagerli, H., Hand, J., Klimont, Z., Galy-Lacaux, C., Lehmann, C. M. B., Myhre, C. L., Myhre, G., Olivié, D., Sato, K., Quaas, J., Rao, P. S. P., Schulz, M., Shindell, D., Skeie, R. B., Stein, A., Takemura, T., Tsyro, S., Vet, R., and Xu, X.: Global and regional trends of atmospheric sulfur, Scientific Reports, 9, 953, https://doi.org/10.1038/s41598-018-37304-0, 2019.
Allen, H. M., Draper, D. C., Ayres, B. R., Ault, A., Bondy, A., Takahama, S., Modini, R. L., Baumann, K., Edgerton, E., Knote, C., Laskin, A., Wang, B., and Fry, J. L.: Influence of crustal dust and sea spray supermicron particle concentrations and acidity on inorganic NO aerosol during the 2013 Southern Oxidant and Aerosol Study, Atmos. Chem. Phys., 15, 10669–10685, https://doi.org/10.5194/acp-15-10669-2015, 2015.
Alvarez, D.: JUWELS cluster and booster: Exascale pathfinder with modular supercomputing architecture at juelich supercomputing Centre, Journal of large-scale research facilities JLSRF, 7, A183, https://doi.org/10.17815/jlsrf-7-183, 2021.
Andreae, M. O.: Aerosols Before Pollution, Science, 315, 50–51, https://doi.org/10.1126/science.1136529, 2007.
Andreae, M. O.: Emission of trace gases and aerosols from biomass burning – an updated assessment, Atmos. Chem. Phys., 19, 8523–8546, https://doi.org/10.5194/acp-19-8523-2019, 2019.
Andreae, M. O., Berresheim, H., Bingemer, H., Jacob, D. J., Lewis, B. L., Li, S.-M., and Talbot, R. W.: The atmospheric sulfur cycle over the Amazon Basin: 2. Wet season, J. Geophys. Res.-Atmos., 95, 16813–16824, 1990.
Astitha, M., Lelieveld, J., Abdel Kader, M., Pozzer, A., and de Meij, A.: Parameterization of dust emissions in the global atmospheric chemistry-climate model EMAC: impact of nudging and soil properties, Atmos. Chem. Phys., 12, 11057–11083, https://doi.org/10.5194/acp-12-11057-2012, 2012.
Bacer, S., Sullivan, S. C., Karydis, V. A., Barahona, D., Krämer, M., Nenes, A., Tost, H., Tsimpidi, A. P., Lelieveld, J., and Pozzer, A.: Implementation of a comprehensive ice crystal formation parameterization for cirrus and mixed-phase clouds in the EMAC model (based on MESSy 2.53), Geosci. Model Dev., 11, 4021–4041, https://doi.org/10.5194/gmd-11-4021-2018, 2018.
Beusen, A. H. W., Bouwman, A. F., Heuberger, P. S. C., Van Drecht, G., and Van Der Hoek, K. W.: Bottom-up uncertainty estimates of global ammonia emissions from global agricultural production systems, Atmos. Environ., 42, 6067–6077, https://doi.org/10.1016/j.atmosenv.2008.03.044, 2008.
Bian, H., Chin, M., Hauglustaine, D. A., Schulz, M., Myhre, G., Bauer, S. E., Lund, M. T., Karydis, V. A., Kucsera, T. L., Pan, X., Pozzer, A., Skeie, R. B., Steenrod, S. D., Sudo, K., Tsigaridis, K., Tsimpidi, A. P., and Tsyro, S. G.: Investigation of global particulate nitrate from the AeroCom phase III experiment, Atmos. Chem. Phys., 17, 12911–12940, https://doi.org/10.5194/acp-17-12911-2017, 2017.
Bougiatioti, A., Nikolaou, P., Stavroulas, I., Kouvarakis, G., Weber, R., Nenes, A., Kanakidou, M., and Mihalopoulos, N.: Particle water and pH in the eastern Mediterranean: source variability and implications for nutrient availability, Atmos. Chem. Phys., 16, 4579–4591, https://doi.org/10.5194/acp-16-4579-2016, 2016.
Bouwman, A. F., Boumans, L. J. M., and Batjes, N. H.: Estimation of global NH3 volatilization loss from synthetic fertilizers and animal manure applied to arable lands and grasslands, Global Biogeochem. Cy., 16, 8-1–8-14, https://doi.org/10.1029/2000GB001389, 2002.
Bouwman, A. F., Lee, D. S., Asman, W. A. H., Dentener, F. J., Van Der Hoek, K. W., and Olivier, J. G. J.: A global high-resolution emission inventory for ammonia, Global Biogeochem. Cy., 11, 561–587, https://doi.org/10.1029/97GB02266, 1997.
Burgard, D. A. and Bria, C. R. M.: Bridge-based sensing of NOx and SO2 emissions from ocean-going ships, Atmos. Environ., 136, 54–60, https://doi.org/10.1016/j.atmosenv.2016.04.014, 2016.
Cai, S., Wang, Y., Zhao, B., Wang, S., Chang, X., and Hao, J.: The impact of the “Air Pollution Prevention and Control Action Plan” on PM2.5 concentrations in Jing-Jin-Ji region during 2012–2020, Sci. Total Environ., 580, 197–209, https://doi.org/10.1016/j.scitotenv.2016.11.188, 2017.
Cavalli, F., Facchini, M. C., Decesari, S., Mircea, M., Emblico, L., Fuzzi, S., Ceburnis, D., Yoon, Y. J., O'Dowd, C. D., Putaud, J.-P., and Dell'Acqua, A.: Advances in characterization of size-resolved organic matter in marine aerosol over the North Atlantic, J. Geophys. Res.-Atmos., 109, D24215, https://doi.org/10.1029/2004JD005137, 2004.
Chang, Y., Zou, Z., Zhang, Y., Deng, C., Hu, J., Shi, Z., Dore, A. J., and Collett Jr., J. L.,: Assessing Contributions of Agricultural and Nonagricultural Emissions to Atmospheric Ammonia in a Chinese Megacity, Environ. Sci. Technol., 53, 1822–1833, https://doi.org/10.1021/acs.est.8b05984, 2019.
Che, H., Zhang, X., Li, Y., Zhou, Z., Qu, J. J., and Hao, X.: Haze trends over the capital cities of 31 provinces in China, 1981–2005, Theor. Appl. Climatol., 97, 235–242, https://doi.org/10.1007/s00704-008-0059-8, 2009.
Chen, D., Liu, Z., Fast, J., and Ban, J.: Simulations of sulfate–nitrate–ammonium (SNA) aerosols during the extreme haze events over northern China in October 2014, Atmos. Chem. Phys., 16, 10707–10724, https://doi.org/10.5194/acp-16-10707-2016, 2016.
Chen, Y., Shen, H., and Russell, A. G.: Current and Future Responses of Aerosol pH and Composition in the U.S. to Declining SO2 Emissions and Increasing NH3 Emissions, Environ. Sci. Technol., 53, 9646–9655, https://doi.org/10.1021/acs.est.9b02005, 2019.
Chen, Y., Cheng, Y., Ma, N., Wei, C., Ran, L., Wolke, R., Größ, J., Wang, Q., Pozzer, A., Denier van der Gon, H. A. C., Spindler, G., Lelieveld, J., Tegen, I., Su, H., and Wiedensohler, A.: Natural sea-salt emissions moderate the climate forcing of anthropogenic nitrate, Atmos. Chem. Phys., 20, 771–786, https://doi.org/10.5194/acp-20-771-2020, 2020.
Chen, Y., Shen, H., Kaiser, J., Hu, Y., Capps, S. L., Zhao, S., Hakami, A., Shih, J.-S., Pavur, G. K., Turner, M. D., Henze, D. K., Resler, J., Nenes, A., Napelenok, S. L., Bash, J. O., Fahey, K. M., Carmichael, G. R., Chai, T., Clarisse, L., Coheur, P.-F., Van Damme, M., and Russell, A. G.: High-resolution hybrid inversion of IASI ammonia columns to constrain US ammonia emissions using the CMAQ adjoint model, Atmos. Chem. Phys., 21, 2067–2082, https://doi.org/10.5194/acp-21-2067-2021, 2021.
Cheng, Y., Zheng, G., Wei, C., Mu, Q., Zheng, B., Wang, Z., Gao, M., Zhang, Q., He, K., Carmichael, G., Pöschl, U., and Su, H.: Reactive nitrogen chemistry in aerosol water as a source of sulfate during haze events in China, Science Advances, 2, e1601530, https://doi.org/10.1126/sciadv.1601530, 2016.
Clarisse, L., Clerbaux, C., Dentener, F., Hurtmans, D., and Coheur, P.-F.: Global ammonia distribution derived from infrared satellite observations, Nat. Geosci., 2, 479–483, https://doi.org/10.1038/ngeo551, 2009.
Colette, A., Granier, C., Hodnebrog, Ø., Jakobs, H., Maurizi, A., Nyiri, A., Bessagnet, B., D'Angiola, A., D'Isidoro, M., Gauss, M., Meleux, F., Memmesheimer, M., Mieville, A., Rouïl, L., Russo, F., Solberg, S., Stordal, F., and Tampieri, F.: Air quality trends in Europe over the past decade: a first multi-model assessment, Atmos. Chem. Phys., 11, 11657–11678, https://doi.org/10.5194/acp-11-11657-2011, 2011.
Craig, R. L., Peterson, P. K., Nandy, L., Lei, Z., Hossain, M. A., Camarena, S., Dodson, R. A., Cook, R. D., Dutcher, C. S., and Ault, A. P.: Direct Determination of Aerosol pH: Size-Resolved Measurements of Submicrometer and Supermicrometer Aqueous Particles, Anal. Chem., 90, 11232–11239, https://doi.org/10.1021/acs.analchem.8b00586, 2018.
Crippa, M., Guizzardi, D., Muntean, M., Schaaf, E., Dentener, F., van Aardenne, J. A., Monni, S., Doering, U., Olivier, J. G. J., Pagliari, V., and Janssens-Maenhout, G.: Gridded emissions of air pollutants for the period 1970–2012 within EDGAR v4.3.2, Earth Syst. Sci. Data, 10, 1987–2013, https://doi.org/10.5194/essd-10-1987-2018, 2018.
Dammers, E., McLinden, C. A., Griffin, D., Shephard, M. W., Van Der Graaf, S., Lutsch, E., Schaap, M., Gainairu-Matz, Y., Fioletov, V., Van Damme, M., Whitburn, S., Clarisse, L., Cady-Pereira, K., Clerbaux, C., Coheur, P. F., and Erisman, J. W.: NH3 emissions from large point sources derived from CrIS and IASI satellite observations, Atmos. Chem. Phys., 19, 12261–12293, https://doi.org/10.5194/acp-19-12261-2019, 2019.
Dammers, E., Shephard, M. W., Palm, M., Cady-Pereira, K., Capps, S., Lutsch, E., Strong, K., Hannigan, J. W., Ortega, I., Toon, G. C., Stremme, W., Grutter, M., Jones, N., Smale, D., Siemons, J., Hrpcek, K., Tremblay, D., Schaap, M., Notholt, J., and Erisman, J. W.: Validation of the CrIS fast physical NH3 retrieval with ground-based FTIR, Atmos. Meas. Tech., 10, 2645–2667, https://doi.org/10.5194/amt-10-2645-2017, 2017.
Delon, C., Galy-Lacaux, C., Adon, M., Liousse, C., Serça, D., Diop, B., and Akpo, A.: Nitrogen compounds emission and deposition in West African ecosystems: comparison between wet and dry savanna, Biogeosciences, 9, 385–402, https://doi.org/10.5194/bg-9-385-2012, 2012.
Dentener, F. J. and Crutzen, P. J.: A three-dimensional model of the global ammonia cycle, J. Atmos. Chem., 19, 331–369, https://doi.org/10.1007/BF00694492, 1994.
Ding, J., Zhao, P., Su, J., Dong, Q., Du, X., and Zhang, Y.: Aerosol pH and its driving factors in Beijing, Atmos. Chem. Phys., 19, 7939–7954, https://doi.org/10.5194/acp-19-7939-2019, 2019.
Dockery, D. W., Pope, C. A., Xu, X., Spengler, J. D., Ware, J. H., Fay, M. E., Ferris, B. G., and Speizer, F. E.: An Association between Air Pollution and Mortality in Six U.S. Cities, New Engl. J. Med., 329, 1753–1759, https://doi.org/10.1056/nejm199312093292401, 1993.
Dockery, D. W., Cunningham, J., Damokosh, A. I., Neas, L. M., Spengler, J. D., Koutrakis, P., Ware, J. H., Raizenne, M., and Speizer, F. E.: Health effects of acid aerosols on North American children: respiratory symptoms, Environ. Health Persp., 104, 500–505, https://doi.org/10.1289/ehp.96104500, 1996.
Erisman, J. W. and Schaap, M.: The need for ammonia abatement with respect to secondary PM reductions in Europe, Environ. Pollut., 129, 159–163, https://doi.org/10.1016/j.envpol.2003.08.042, 2004.
Fang, T., Guo, H., Zeng, L., Verma, V., Nenes, A., and Weber, R. J.: Highly Acidic Ambient Particles, Soluble Metals, and Oxidative Potential: A Link between Sulfate and Aerosol Toxicity, Environ. Sci. Technol., 51, 2611–2620, https://doi.org/10.1021/acs.est.6b06151, 2017.
Fiddes, S. L., Woodhouse, M. T., Nicholls, Z., Lane, T. P., and Schofield, R.: Cloud, precipitation and radiation responses to large perturbations in global dimethyl sulfide, Atmos. Chem. Phys., 18, 10177-10198, 10.5194/acp-18-10177-2018, 2018.
Fortems-Cheiney, A., Dufour, G., Foret, G., Siour, G., Van Damme, M., Coheur, P.-F., Clarisse, L., Clerbaux, C., and Beekmann, M.: Understanding the Simulated Ammonia Increasing Trend from 2008 to 2015 over Europe with CHIMERE and Comparison with IASI Observations, Atmosphere, 13, 1101, 2022.
Fountoukis, C. and Nenes, A.: ISORROPIA II: a computationally efficient thermodynamic equilibrium model for K+–Ca2+–Mg2+–NH–Na+–SO–NO–Cl−–H2O aerosols, Atmos. Chem. Phys., 7, 4639–4659, https://doi.org/10.5194/acp-7-4639-2007, 2007.
Fu, X., Wang, S., Xing, J., Zhang, X., Wang, T., and Hao, J.: Increasing Ammonia Concentrations Reduce the Effectiveness of Particle Pollution Control Achieved via SO2 and NOX Emissions Reduction in East China, Environ. Sci. Tech. Let., 4, 221–227, https://doi.org/10.1021/acs.estlett.7b00143, 2017.
Gao, M., Carmichael, G. R., Saide, P. E., Lu, Z., Yu, M., Streets, D. G., and Wang, Z.: Response of winter fine particulate matter concentrations to emission and meteorology changes in North China, Atmos. Chem. Phys., 16, 11837–11851, https://doi.org/10.5194/acp-16-11837-2016, 2016.
Ge, Y., Vieno, M., Stevenson, D. S., Wind, P., and Heal, M. R.: A new assessment of global and regional budgets, fluxes, and lifetimes of atmospheric reactive N and S gases and aerosols, Atmos. Chem. Phys., 22, 8343–8368, https://doi.org/10.5194/acp-22-8343-2022, 2022.
Ge, B., Xu, X., Ma, Z., Pan, X., Wang, Z., Lin, W., Ouyang, B., Xu, D., Lee, J., Zheng, M., Ji, D., Sun, Y., Dong, H., Squires, F. A., Fu, P., and Wang, Z.: Role of Ammonia on the Feedback Between AWC and Inorganic Aerosol Formation During Heavy Pollution in the North China Plain, Earth and Space Science, 6, 1675–1693, https://doi.org/10.1029/2019EA000799, 2019.
Gong, C., Tian, H., Liao, H., Pan, N., Pan, S., Ito, A., Jain, A. K., Kou-Giesbrecht, S., Joos, F., Sun, Q., Shi, H., Vuichard, N., Zhu, Q., Peng, C., Maggi, F., Tang, F. H. M., and Zaehle, S.: Global net climate effects of anthropogenic reactive nitrogen, Nature, 632, 557–563, https://doi.org/10.1038/s41586-024-07714-4, 2024.
Gu, B., Zhang, L., Van Dingenen, R., Vieno, M., Van Grinsven, H. J., Zhang, X., Zhang, S., Chen, Y., Wang, S., Ren, C., Rao, S., Holland, M., Winiwarter, W., Chen, D., Xu, J., and Sutton, M. A.: Abating ammonia is more cost-effective than nitrogen oxides for mitigating PM2.2 air pollution, Science, 374, 758–762, https://doi.org/10.1126/science.abf8623, 2021.
Guo, H., Xu, L., Bougiatioti, A., Cerully, K. M., Capps, S. L., Hite Jr., J. R., Carlton, A. G., Lee, S.-H., Bergin, M. H., Ng, N. L., Nenes, A., and Weber, R. J.: Fine-particle water and pH in the southeastern United States, Atmos. Chem. Phys., 15, 5211–5228, https://doi.org/10.5194/acp-15-5211-2015, 2015.
Guo, H., Sullivan, A. P., Campuzano-Jost, P., Schroder, J. C., Lopez-Hilfiker, F. D., Dibb, J. E., Jimenez, J. L., Thornton, J. A., Brown, S. S., Nenes, A., and Weber, R. J.: Fine particle pH and the partitioning of nitric acid during winter in the northeastern United States, J. Geophys. Res.-Atmos., 121, 10355–10376, https://doi.org/10.1002/2016JD025311, 2016.
Guo, H., Liu, J., Froyd, K. D., Roberts, J. M., Veres, P. R., Hayes, P. L., Jimenez, J. L., Nenes, A., and Weber, R. J.: Fine particle pH and gas–particle phase partitioning of inorganic species in Pasadena, California, during the 2010 CalNex campaign, Atmos. Chem. Phys., 17, 5703–5719, https://doi.org/10.5194/acp-17-5703-2017, 2017a.
Guo, H., Weber, R. J., and Nenes, A.: High levels of ammonia do not raise fine particle pH sufficiently to yield nitrogen oxide-dominated sulfate production, Scientific Reports, 7, 12109, https://doi.org/10.1038/s41598-017-11704-0, 2017b.
Guo, H., Otjes, R., Schlag, P., Kiendler-Scharr, A., Nenes, A., and Weber, R. J.: Effectiveness of ammonia reduction on control of fine particle nitrate, Atmos. Chem. Phys., 18, 12241–12256, https://doi.org/10.5194/acp-18-12241-2018, 2018.
Hand, J. L., Schichtel, B. A., Malm, W. C., and Pitchford, M. L.: Particulate sulfate ion concentration and SO<sub>2</sub>emission trends in the United States from the early 1990s through 2010, Atmos. Chem. Phys., 12, 10353-10365, 10.5194/acp-12-10353-2012, 2012.
Hauglustaine, D. A., Balkanski, Y., and Schulz, M.: A global model simulation of present and future nitrate aerosols and their direct radiative forcing of climate, Atmos. Chem. Phys., 14, 11031-11063, 10.5194/acp-14-11031-2014, 2014.
Heald, C. L., Collett Jr., J. L., Lee, T., Benedict, K. B., Schwandner, F. M., Li, Y., Clarisse, L., Hurtmans, D. R., Van Damme, M., Clerbaux, C., Coheur, P.-F., Philip, S., Martin, R. V., and Pye, H. O. T.: Atmospheric ammonia and particulate inorganic nitrogen over the United States, Atmos. Chem. Phys., 12, 10295–10312, https://doi.org/10.5194/acp-12-10295-2012, 2012.
Hersbach, H., Bell, B., Berrisford, P., Hirahara, S., Horányi, A., Muñoz-Sabater, J., Nicolas, J., Peubey, C., Radu, R., Schepers, D., Simmons, A., Soci, C., Abdalla, S., Abellan, X., Balsamo, G., Bechtold, P., Biavati, G., Bidlot, J., Bonavita, M., De Chiara, G., Dahlgren, P., Dee, D., Diamantakis, M., Dragani, R., Flemming, J., Forbes, R., Fuentes, M., Geer, A., Haimberger, L., Healy, S., Hogan, R. J., Hólm, E., Janisková, M., Keeley, S., Laloyaux, P., Lopez, P., Lupu, C., Radnoti, G., de Rosnay, P., Rozum, I., Vamborg, F., Villaume, S., and Thépaut, J.-N.: The ERA5 global reanalysis, Q. J. Roy. Meteorol. Soc., 146, 1999–2049, https://doi.org/10.1002/qj.3803, 2020.
Hickman, J. E., Andela, N., Tsigaridis, K., Galy-Lacaux, C., Ossohou, M., Dammers, E., Van Damme, M., Clarisse, L., and Bauer, S. E.: Continental and Ecoregion-Specific Drivers of Atmospheric NO2 and NH3 Seasonality Over Africa Revealed by Satellite Observations, Global Biogeochem. Cy., 35, e2020GB006916, https://doi.org/10.1029/2020GB006916, 2021.
Hoesly, R. M., Smith, S. J., Feng, L., Klimont, Z., Janssens-Maenhout, G., Pitkanen, T., Seibert, J. J., Vu, L., Andres, R. J., Bolt, R. M., Bond, T. C., Dawidowski, L., Kholod, N., Kurokawa, J.-I., Li, M., Liu, L., Lu, Z., Moura, M. C. P., O'Rourke, P. R., and Zhang, Q.: Historical (1750–2014) anthropogenic emissions of reactive gases and aerosols from the Community Emissions Data System (CEDS), Geosci. Model Dev., 11, 369–408, https://doi.org/10.5194/gmd-11-369-2018, 2018.
Huang, X., Zhang, J., Zhang, W., Tang, G., and Wang, Y.: Atmospheric ammonia and its effect on PM2.5 pollution in urban Chengdu, Sichuan Basin, China, Environ. Pollut., 291, 118195, https://doi.org/10.1016/j.envpol.2021.118195, 2021.
IPCC: Climate Change 2013: The Physical Science Basis. Working Group I Contribution to the Fifth Assessment Report of the Intergovernmental Panel on Climate Change, Cambridge University Press, Cambridge, https://doi.org/10.1017/CBO9781107415324, 2014.
IPCC: Climate Change 2022 – Mitigation of Climate Change. Working Group III Contribution to the Sixth Assessment Report of the Intergovernmental Panel on Climate Change, Cambridge University Press, Cambridge, https://doi.org/10.1017/9781009157926, 2023.
Jackson, R. L., Gabric, A. J., Cropp, R., and Woodhouse, M. T.: Dimethylsulfide (DMS), marine biogenic aerosols and the ecophysiology of coral reefs, Biogeosciences, 17, 2181–2204, https://doi.org/10.5194/bg-17-2181-2020, 2020.
Jo, Y.-J., Lee, H.-J., Jo, H.-Y., Woo, J.-H., Kim, Y., Lee, T., Heo, G., Park, S.-M., Jung, D., Park, J., and Kim, C.-H.: Changes in inorganic aerosol compositions over the Yellow Sea area from impact of Chinese emissions mitigation, Atmos. Res., 240, 104948, https://doi.org/10.1016/j.atmosres.2020.104948, 2020.
Jöckel, P., Sander, R., Kerkweg, A., Tost, H., and Lelieveld, J.: Technical Note: The Modular Earth Submodel System (MESSy) - a new approach towards Earth System Modeling, Atmos. Chem. Phys., 5, 433–444, https://doi.org/10.5194/acp-5-433-2005, 2005.
Jöckel, P., Kerkweg, A., Pozzer, A., Sander, R., Tost, H., Riede, H., Baumgaertner, A., Gromov, S., and Kern, B.: Development cycle 2 of the Modular Earth Submodel System (MESSy2), Geosci. Model Dev., 3, 717-752, 10.5194/gmd-3-717-2010, 2010.
Jöckel, P., Tost, H., Pozzer, A., Kunze, M., Kirner, O., Brenninkmeijer, C. A. M., Brinkop, S., Cai, D. S., Dyroff, C., Eckstein, J., Frank, F., Garny, H., Gottschaldt, K.-D., Graf, P., Grewe, V., Kerkweg, A., Kern, B., Matthes, S., Mertens, M., Meul, S., Neumaier, M., Nützel, M., Oberländer-Hayn, S., Ruhnke, R., Runde, T., Sander, R., Scharffe, D., and Zahn, A.: Earth System Chemistry integrated Modelling (ESCiMo) with the Modular Earth Submodel System (MESSy) version 2.51, Geosci. Model Dev., 9, 1153–1200, https://doi.org/10.5194/gmd-9-1153-2016, 2016.
Kaiser, J. W., Heil, A., Andreae, M. O., Benedetti, A., Chubarova, N., Jones, L., Morcrette, J.-J., Razinger, M., Schultz, M. G., Suttie, M., and van der Werf, G. R.: Biomass burning emissions estimated with a global fire assimilation system based on observed fire radiative power, Biogeosciences, 9, 527–554, https://doi.org/10.5194/bg-9-527-2012, 2012.
Kakavas, S., Patoulias, D., Zakoura, M., Nenes, A., and Pandis, S. N.: Size-resolved aerosol pH over Europe during summer, Atmos. Chem. Phys., 21, 799–811, https://doi.org/10.5194/acp-21-799-2021, 2021.
Karydis, V. A., Tsimpidi, A. P., Pozzer, A., and Lelieveld, J.: How alkaline compounds control atmospheric aerosol particle acidity, Atmos. Chem. Phys., 21, 14983–15001, https://doi.org/10.5194/acp-21-14983-2021, 2021.
Karydis, V. A., Tsimpidi, A. P., Lei, W., Molina, L. T., and Pandis, S. N.: Formation of semivolatile inorganic aerosols in the Mexico City Metropolitan Area during the MILAGRO campaign, Atmos. Chem. Phys., 11, 13305–13323, https://doi.org/10.5194/acp-11-13305-2011, 2011.
Karydis, V. A., Tsimpidi, A. P., Pozzer, A., Astitha, M., and Lelieveld, J.: Effects of mineral dust on global atmospheric nitrate concentrations, Atmos. Chem. Phys., 16, 1491–1509, https://doi.org/10.5194/acp-16-1491-2016, 2016.
Karydis, V. A., Tsimpidi, A. P., Bacer, S., Pozzer, A., Nenes, A., and Lelieveld, J.: Global impact of mineral dust on cloud droplet number concentration, Atmos. Chem. Phys., 17, 5601–5621, https://doi.org/10.5194/acp-17-5601-2017, 2017.
Karydis, V. A., Tsimpidi, A. P., Fountoukis, C., Nenes, A., Zavala, M., Lei, W., Molina, L. T., and Pandis, S. N.: Simulating the fine and coarse inorganic particulate matter concentrations in a polluted megacity, Atmos. Environ., 44, 608–620, https://doi.org/10.1016/j.atmosenv.2009.11.023, 2010.
Kerkweg, A., Buchholz, J., Ganzeveld, L., Pozzer, A., Tost, H., and Jöckel, P.: Technical Note: An implementation of the dry removal processes DRY DEPosition and SEDImentation in the Modular Earth Submodel System (MESSy), Atmos. Chem. Phys., 6, 4617–4632, https://doi.org/10.5194/acp-6-4617-2006, 2006.
Khan, M. A. H., Lowe, D., Derwent, R. G., Foulds, A., Chhantyal-Pun, R., McFiggans, G., Orr-Ewing, A. J., Percival, C. J., and Shallcross, D. E.: Global and regional model simulations of atmospheric ammonia, Atmos. Res., 234, 104702, https://doi.org/10.1016/j.atmosres.2019.104702, 2020.
Klingmüller, K., Metzger, S., Abdelkader, M., Karydis, V. A., Stenchikov, G. L., Pozzer, A., and Lelieveld, J.: Revised mineral dust emissions in the atmospheric chemistry–climate model EMAC (MESSy 2.52 DU_Astitha1 KKDU2017 patch), Geosci. Model Dev., 11, 989–1008, https://doi.org/10.5194/gmd-11-989-2018, 2018.
Koçak, M., Mihalopoulos, N., and Kubilay, N.: Chemical composition of the fine and coarse fraction of aerosols in the northeastern Mediterranean, Atmos. Environ., 41, 7351–7368, https://doi.org/10.1016/j.atmosenv.2007.05.011, 2007.
Kong, L., Tang, X., Zhu, J., Wang, Z., Pan, Y., Wu, H., Wu, L., Wu, Q., He, Y., Tian, S., Xie, Y., Liu, Z., Sui, W., Han, L., and Carmichael, G.: Improved Inversion of Monthly Ammonia Emissions in China Based on the Chinese Ammonia Monitoring Network and Ensemble Kalman Filter, Environ. Sci. Technol., 53, 12529–12538, https://doi.org/10.1021/acs.est.9b02701, 2019.
Lei, L., Zhou, W., Chen, C., He, Y., Li, Z., Sun, J., Tang, X., Fu, P., Wang, Z., and Sun, Y.: Long-term characterization of aerosol chemistry in cold season from 2013 to 2020 in Beijing, China, Environ. Pollut., 268, 115952, https://doi.org/10.1016/j.envpol.2020.115952, 2021.
Li, C., Martin, R. V., van Donkelaar, A., Boys, B. L., Hammer, M. S., Xu, J.-W., Marais, E. A., Reff, A., Strum, M., Ridley, D. A., Crippa, M., Brauer, M., and Zhang, Q.: Trends in Chemical Composition of Global and Regional Population-Weighted Fine Particulate Matter Estimated for 25 Years, Environ. Sci. Technol., 51, 11185–11195, https://doi.org/10.1021/acs.est.7b02530, 2017.
Li, K., Chen, L., White, S. J., Yu, H., Wu, X., Gao, X., Azzi, M., and Cen, K.: Smog chamber study of the role of NH3 in new particle formation from photo-oxidation of aromatic hydrocarbons, Sci. Total Environ., 619–620, 927–937, https://doi.org/10.1016/j.scitotenv.2017.11.180, 2018.
Liang, Y., Jiang, H., and Liu, X.: Characteristics of atmospheric ammonia and its impacts on SNA formation in PM2.5 of Nanchang, China, Atmospheric Pollution Research, 15, 102059, https://doi.org/10.1016/j.apr.2024.102059, 2024.
Liu, J., Ding, P., Zong, Z., Li, J., Tian, C., Chen, W., Chang, M., Salazar, G., Shen, C., Cheng, Z., Chen, Y., Wang, X., Szidat, S., and Zhang, G.: Evidence of Rural and Suburban Sources of Urban Haze Formation in China: A Case Study From the Pearl River Delta Region, J. Geophys. Res.-Atmos., 123, 4712–4726, https://doi.org/10.1029/2017JD027952, 2018a.
Liu, L., Xu, W., Lu, X., Zhong, B., Guo, Y., Lu, X., Zhao, Y., He, W., Wang, S., Zhang, X., Liu, X., and Vitousek, P.: Exploring global changes in agricultural ammonia emissions and their contribution to nitrogen deposition since 1980, P. Natl. Acad. Sci. USA, 119, e2121998119, https://doi.org/10.1073/pnas.2121998119, 2022.
Liu, M., Song, Y., Zhou, T., Xu, Z., Yan, C., Zheng, M., Wu, Z., Hu, M., Wu, Y., and Zhu, T.: Fine particle pH during severe haze episodes in northern China, Geophys. Res. Lett., 44, 5213–5221, https://doi.org/10.1002/2017GL073210, 2017.
Liu, M., Huang, X., Song, Y., Xu, T., Wang, S., Wu, Z., Hu, M., Zhang, L., Zhang, Q., Pan, Y., Liu, X., and Zhu, T.: Rapid SO2 emission reductions significantly increase tropospheric ammonia concentrations over the North China Plain, Atmos. Chem. Phys., 18, 17933–17943, https://doi.org/10.5194/acp-18-17933-2018, 2018b.
Lohmann, U. and Ferrachat, S.: Impact of parametric uncertainties on the present-day climate and on the anthropogenic aerosol effect, Atmos. Chem. Phys., 10, 11373–11383, https://doi.org/10.5194/acp-10-11373-2010, 2010.
Luo, Z., Zhang, Y., Chen, W., Van Damme, M., Coheur, P.-F., and Clarisse, L.: Estimating global ammonia (NH3) emissions based on IASI observations from 2008 to 2018, Atmos. Chem. Phys., 22, 10375–10388, https://doi.org/10.5194/acp-22-10375-2022, 2022.
McDuffie, E. E., Smith, S. J., O'Rourke, P., Tibrewal, K., Venkataraman, C., Marais, E. A., Zheng, B., Crippa, M., Brauer, M., and Martin, R. V.: A global anthropogenic emission inventory of atmospheric pollutants from sector- and fuel-specific sources (1970–2017): an application of the Community Emissions Data System (CEDS), Earth Syst. Sci. Data, 12, 3413–3442, https://doi.org/10.5194/essd-12-3413-2020, 2020.
Milousis, A., Tsimpidi, A. P., Tost, H., Pandis, S. N., Nenes, A., Kiendler-Scharr, A., and Karydis, V. A.: Implementation of the ISORROPIA-lite aerosol thermodynamics model into the EMAC chemistry climate model (based on MESSy v2.55): implications for aerosol composition and acidity, Geosci. Model Dev., 17, 1111–1131, https://doi.org/10.5194/gmd-17-1111-2024, 2024.
Milousis, A., Scholz, S. M. C., Fuchs, H., Tsimpidi, A. P., and Karydis, V. A.: Global Perspectives on Nitrate Aerosol Dynamics: A Comprehensive Sensitivity Analysis, EGUsphere, 2025, 1-42,https://doi.org/10.5194/egusphere-2025-313, 2025.
Morán, M., Ferreira, J., Martins, H., Monteiro, A., Borrego, C., and González, J. A.: Ammonia agriculture emissions: From EMEP to a high resolution inventory, Atmos. Pollut. Res., 7, 786–798, https://doi.org/10.1016/j.apr.2016.04.001, 2016.
Murphy, J. G., Gregoire, P. K., Tevlin, A. G., Wentworth, G. R., Ellis, R. A., Markovic, M. Z., and VandenBoer, T. C.: Observational constraints on particle acidity using measurements and modelling of particles and gases, Faraday Discussions, 200, 379–395, https://doi.org/10.1039/C7FD00086C, 2017.
Myhre, G., Samset, B. H., Schulz, M., Balkanski, Y., Bauer, S., Berntsen, T. K., Bian, H., Bellouin, N., Chin, M., Diehl, T., Easter, R. C., Feichter, J., Ghan, S. J., Hauglustaine, D., Iversen, T., Kinne, S., Kirkevåg, A., Lamarque, J.-F., Lin, G., Liu, X., Lund, M. T., Luo, G., Ma, X., van Noije, T., Penner, J. E., Rasch, P. J., Ruiz, A., Seland, Ø., Skeie, R. B., Stier, P., Takemura, T., Tsigaridis, K., Wang, P., Wang, Z., Xu, L., Yu, H., Yu, F., Yoon, J.-H., Zhang, K., Zhang, H., and Zhou, C.: Radiative forcing of the direct aerosol effect from AeroCom Phase II simulations, Atmos. Chem. Phys., 13, 1853–1877, https://doi.org/10.5194/acp-13-1853-2013, 2013.
Nenes, A., Pandis, S. N., and Pilinis, C.: ISORROPIA: A New Thermodynamic Equilibrium Model for Multiphase Multicomponent Inorganic Aerosols, Aquat. Geochem., 4, 123–152,https://doi.org/10.1023/A:1009604003981, 1998.
Nenes, A., Pandis, S. N., Weber, R. J., and Russell, A.: Aerosol pH and liquid water content determine when particulate matter is sensitive to ammonia and nitrate availability, Atmos. Chem. Phys., 20, 3249–3258, https://doi.org/10.5194/acp-20-3249-2020, 2020.
Olivier, J. G. J., Bouwman, A. F., Van der Hoek, K. W., and Berdowski, J. J. M.: Global air emission inventories for anthropogenic sources of NOx, NH3 and N2O in 1990, Environ. Pollut., 102, 135–148, https://doi.org/10.1016/S0269-7491(98)80026-2, 1998.
Osipov, S., Chowdhury, S., Crowley, J. N., Tadic, I., Drewnick, F., Borrmann, S., Eger, P., Fachinger, F., Fischer, H., Predybaylo, E., Fnais, M., Harder, H., Pikridas, M., Vouterakos, P., Pozzer, A., Sciare, J., Ukhov, A., Stenchikov, G. L., Williams, J., and Lelieveld, J.: Severe atmospheric pollution in the Middle East is attributable to anthropogenic sources, Communications Earth & Environment, 3, 203, https://doi.org/10.1038/s43247-022-00514-6, 2022.
Pan, Y., Tian, S., Liu, D., Fang, Y., Zhu, X., Zhang, Q., Zheng, B., Michalski, G., and Wang, Y.: Fossil Fuel Combustion-Related Emissions Dominate Atmospheric Ammonia Sources during Severe Haze Episodes: Evidence from 15N-Stable Isotope in Size-Resolved Aerosol Ammonium, Environ. Sci. Technol., 50, 8049–8056, https://doi.org/10.1021/acs.est.6b00634, 2016.
Pozzer, A., Reifenberg, S. F., Kumar, V., Franco, B., Kohl, M., Taraborrelli, D., Gromov, S., Ehrhart, S., Jöckel, P., Sander, R., Fall, V., Rosanka, S., Karydis, V., Akritidis, D., Emmerichs, T., Crippa, M., Guizzardi, D., Kaiser, J. W., Clarisse, L., Kiendler-Scharr, A., Tost, H., and Tsimpidi, A.: Simulation of organics in the atmosphere: evaluation of EMACv2.54 with the Mainz Organic Mechanism (MOM) coupled to the ORACLE (v1.0) submodel, Geosci. Model Dev., 15, 2673–2710, https://doi.org/10.5194/gmd-15-2673-2022, 2022.
Pozzer, A., Tsimpidi, A. P., Karydis, V. A., de Meij, A., and Lelieveld, J.: Impact of agricultural emission reductions on fine-particulate matter and public health, Atmos. Chem. Phys., 17, 12813–12826, https://doi.org/10.5194/acp-17-12813-2017, 2017.
Pringle, K. J., Tost, H., Message, S., Steil, B., Giannadaki, D., Nenes, A., Fountoukis, C., Stier, P., Vignati, E., and Lelieveld, J.: Description and evaluation of GMXe: a new aerosol submodel for global simulations (v1), Geosci. Model Dev., 3, 391–412, https://doi.org/10.5194/gmd-3-391-2010, 2010.
Prospero, J. M., Savoie, D. L., Nees, R. T., Duce, R. A., and Merrill, J.: Particulate sulfate and nitrate in the boundary layer over the North Pacific Ocean, J. Geophys. Res.-Atmos., 90, 10586–10596, https://doi.org/10.1029/JD090iD06p10586, 1985.
Pye, H. O. T., Nenes, A., Alexander, B., Ault, A. P., Barth, M. C., Clegg, S. L., Collett Jr., J. L., Fahey, K. M., Hennigan, C. J., Herrmann, H., Kanakidou, M., Kelly, J. T., Ku, I.-T., McNeill, V. F., Riemer, N., Schaefer, T., Shi, G., Tilgner, A., Walker, J. T., Wang, T., Weber, R., Xing, J., Zaveri, R. A., and Zuend, A.: The acidity of atmospheric particles and clouds, Atmos. Chem. Phys., 20, 4809–4888, https://doi.org/10.5194/acp-20-4809-2020, 2020.
Pye, H. O. T., Zuend, A., Fry, J. L., Isaacman-VanWertz, G., Capps, S. L., Appel, K. W., Foroutan, H., Xu, L., Ng, N. L., and Goldstein, A. H.: Coupling of organic and inorganic aerosol systems and the effect on gas–particle partitioning in the southeastern US, Atmos. Chem. Phys., 18, 357–370, https://doi.org/10.5194/acp-18-357-2018, 2018.
Roeckner, E., Brokopf, R., Esch, M., Giorgetta, M., Hagemann, S., Kornblueh, L., Manzini, E., Schlese, U., and Schulzweida, U.: Sensitivity of simulated climate to horizontal and vertical resolution in the ECHAM5 atmosphere model, J. Climate, 19, 3771–3791, https://doi.org/10.1175/jcli3824.1, 2006.
Russell, A. R., Valin, L. C., and Cohen, R. C.: Trends in OMI NO2 observations over the United States: effects of emission control technology and the economic recession, Atmos. Chem. Phys., 12, 12197–12209, https://doi.org/10.5194/acp-12-12197-2012, 2012.
Russell, L. M., Moore, R. H., Burrows, S. M., and Quinn, P. K.: Ocean flux of salt, sulfate, and organic components to atmospheric aerosol, Earth-Sci. Rev., 239, 104364, https://doi.org/10.1016/j.earscirev.2023.104364, 2023.
Sahoo, P., Sahu, S. K., Mangaraj, P., Mishra, A., Beig, G., and Gunthe, S. S.: Reporting of gridded ammonia emission and assessment of hotspots across India: A comprehensive study of 24 anthropogenic sources, J. Hazard. Mater., 479, 135557, https://doi.org/10.1016/j.jhazmat.2024.135557, 2024.
Sander, R., Baumgaertner, A., Cabrera-Perez, D., Frank, F., Gromov, S., Grooß, J.-U., Harder, H., Huijnen, V., Jöckel, P., Karydis, V. A., Niemeyer, K. E., Pozzer, A., Riede, H., Schultz, M. G., Taraborrelli, D., and Tauer, S.: The community atmospheric chemistry box model CAABA/MECCA-4.0, Geosci. Model Dev., 12, 1365–1385, https://doi.org/10.5194/gmd-12-1365-2019, 2019.
Schlesinger, W. H. and Hartley, A. E.: A global budget for atmospheric NH3, Biogeochemistry, 15, 191–211, https://doi.org/10.1007/BF00002936, 1992.
Seinfeld, J. H. and Pandis, S. N.: Atmospheric chemistry and physics: from air pollution to climate change, 3rd edn., John Wiley & Sons, Inc. Hoboken, New Jersey, Hoboken, New Jersey, ISBN 978-1-118-94740-1, 2016.
Shah, V., Jaeglé, L., Thornton, J. A., Lopez-Hilfiker, F. D., Lee, B. H., Schroder, J. C., Campuzano-Jost, P., Jimenez, J. L., Guo, H., Sullivan, A. P., Weber, R. J., Green, J. R., Fiddler, M. N., Bililign, S., Campos, T. L., Stell, M., Weinheimer, A. J., Montzka, D. D., and Brown, S. S.: Chemical feedbacks weaken the wintertime response of particulate sulfate and nitrate to emissions reductions over the eastern United States, P. Natl. Acad. Sci. USA, 115, 8110–8115, https://doi.org/10.1073/pnas.1803295115, 2018.
Shi, G., Xu, J., Peng, X., Xiao, Z., Chen, K., Tian, Y., Guan, X., Feng, Y., Yu, H., Nenes, A., and Russell, A. G.: pH of Aerosols in a Polluted Atmosphere: Source Contributions to Highly Acidic Aerosol, Environ. Sci. Technol., 51, 4289–4296, https://doi.org/10.1021/acs.est.6b05736, 2017.
Shi, G., Xu, J., Shi, X., Liu, B., Bi, X., Xiao, Z., Chen, K., Wen, J., Dong, S., Tian, Y., Feng, Y., Yu, H., Song, S., Zhao, Q., Gao, J., and Russell, A. G.: Aerosol pH Dynamics During Haze Periods in an Urban Environment in China: Use of Detailed, Hourly, Speciated Observations to Study the Role of Ammonia Availability and Secondary Aerosol Formation and Urban Environment, J. Geophys. Res.-Atmos., 124, 9730–9742, https://doi.org/10.1029/2018JD029976, 2019.
Skjøth, C. A. and Geels, C.: The effect of climate and climate change on ammonia emissions in Europe, Atmos. Chem. Phys., 13, 117–128, https://doi.org/10.5194/acp-13-117-2013, 2013.
Søgaard, H. T., Sommer, S. G., Hutchings, N. J., Huijsmans, J. F. M., Bussink, D. W., and Nicholson, F.: Ammonia volatilization from field-applied animal slurry – the ALFAM model, Atmos. Environ., 36, 3309–3319, https://doi.org/10.1016/S1352-2310(02)00300-X, 2002.
Song, S., Gao, M., Xu, W., Shao, J., Shi, G., Wang, S., Wang, Y., Sun, Y., and McElroy, M. B.: Fine-particle pH for Beijing winter haze as inferred from different thermodynamic equilibrium models, Atmos. Chem. Phys., 18, 7423–7438, https://doi.org/10.5194/acp-18-7423-2018, 2018.
Song, S., Nenes, A., Gao, M., Zhang, Y., Liu, P., Shao, J., Ye, D., Xu, W., Lei, L., Sun, Y., Liu, B., Wang, S., and McElroy, M. B.: Thermodynamic Modeling Suggests Declines in Water Uptake and Acidity of Inorganic Aerosols in Beijing Winter Haze Events during 2014/2015–2018/2019, Environ. Sci. Tech. Let., 6, 752–760, https://doi.org/10.1021/acs.estlett.9b00621, 2019.
Spengler, J. D., Koutrakis, P., Dockery, D. W., Raizenne, M., and Speizer, F. E.: Health effects of acid aerosols on North American children: air pollution exposures, Environ. Health Persp., 104, 492–499, https://doi.org/10.1289/ehp.96104492, 1996.
Sutton, M. A., Reis, S., Riddick, S. N., Dragosits, U., Nemitz, E., Theobald, M. R., Tang, Y. S., Braban, C. F., Vieno, M., Dore, A. J., Mitchell, R. F., Wanless, S., Daunt, F., Fowler, D., Blackall, T. D., Milford, C., Flechard, C. R., Loubet, B., Massad, R., Cellier, P., Personne, E., Coheur, P. F., Clarisse, L., Van Damme, M., Ngadi, Y., Clerbaux, C., Skjøth, C. A., Geels, C., Hertel, O., Wichink Kruit, R. J., Pinder, R. W., Bash, J. O., Walker, J. T., Simpson, D., Horváth, L., Misselbrook, T. H., Bleeker, A., Dentener, F., and de Vries, W.: Towards a climate-dependent paradigm of ammonia emission and deposition, Philosophical Transactions of the Royal Society B: Biological Sciences, 368, 20130166, https://doi.org/10.1098/rstb.2013.0166, 2013.
The MESSy Consortium: The Modular Earth Submodel System, Version 2.55.2_842-isorropia-light, Zenodo [code], https://doi.org/10.5281/zenodo.8379120, 2023.
Thurston, G. D., Ito, K., Hayes, C. G., Bates, D. V., and Lippmann, M.: Respiratory Hospital Admissions and Summertime Haze Air Pollution in Toronto, Ontario: Consideration of the Role of Acid Aerosols, Environ. Res., 65, 271–290, https://doi.org/10.1006/enrs.1994.1037, 1994.
Tilgner, A., Schaefer, T., Alexander, B., Barth, M., Collett Jr., J. L., Fahey, K. M., Nenes, A., Pye, H. O. T., Herrmann, H., and McNeill, V. F.: Acidity and the multiphase chemistry of atmospheric aqueous particles and clouds, Atmos. Chem. Phys., 21, 13483–13536, https://doi.org/10.5194/acp-21-13483-2021, 2021.
Tost, H., Jöckel, P., Kerkweg, A., Sander, R., and Lelieveld, J.: Technical note: A new comprehensive SCAVenging submodel for global atmospheric chemistry modelling, Atmos. Chem. Phys., 6, 565–574, https://doi.org/10.5194/acp-6-565-2006, 2006.
Tsimpidi, A. P., Karydis, V. A., and Pandis, S. N.: Response of Inorganic Fine Particulate Matter to Emission Changes of Sulfur Dioxide and Ammonia: The Eastern United States as a Case Study, J. Air Waste Manage., 57, 1489–1498,https://doi.org/10.3155/1047-3289.57.12.1489, 2007.
Tsimpidi, A. P., Karydis, V. A., Pozzer, A., Pandis, S. N., and Lelieveld, J.: ORACLE (v1.0): module to simulate the organic aerosol composition and evolution in the atmosphere, Geosci. Model Dev., 7, 3153–3172, https://doi.org/10.5194/gmd-7-3153-2014, 2014.
Tsimpidi, A. P., Karydis, V. A., Pandis, S. N., and Lelieveld, J.: Global-scale combustion sources of organic aerosols: sensitivity to formation and removal mechanisms, Atmos. Chem. Phys., 17, 7345–7364, https://doi.org/10.5194/acp-17-7345-2017, 2017.
Tsimpidi, A. P., Karydis, V. A., Pozzer, A., Pandis, S. N., and Lelieveld, J.: ORACLE 2-D (v2.0): an efficient module to compute the volatility and oxygen content of organic aerosol with a global chemistry–climate model, Geosci. Model Dev., 11, 3369–3389, https://doi.org/10.5194/gmd-11-3369-2018, 2018.
Tsimpidi, A. P., Scholz, S. M. C., Milousis, A., Mihalopoulos, N., and Karydis, V. A.: Aerosol Composition Trends during 2000–2020: In depth insights from model predictions and multiple worldwide observation datasets, EGUsphere [preprint], https://doi.org/10.5194/egusphere-2024-3590, 2024.
van Aardenne, J. A., Dentener, F. J., Olivier, J. G. J., Goldewijk, C. G. M. K., and Lelieveld, J.: A 1° × 1° resolution data set of historical anthropogenic trace gas emissions for the period 1890–1990, Global Biogeochem. Cy., 15, 909–928, https://doi.org/10.1029/2000GB001265, 2001.
Van Damme, M., Clarisse, L., Heald, C. L., Hurtmans, D., Ngadi, Y., Clerbaux, C., Dolman, A. J., Erisman, J. W., and Coheur, P. F.: Global distributions, time series and error characterization of atmospheric ammonia (NH3) from IASI satellite observations, Atmos. Chem. Phys., 14, 2905–2922, https://doi.org/10.5194/acp-14-2905-2014, 2014.
Van Damme, M., Erisman, J. W., Clarisse, L., Dammers, E., Whitburn, S., Clerbaux, C., Dolman, A. J., and Coheur, P.-F.: Worldwide spatiotemporal atmospheric ammonia (NH3) columns variability revealed by satellite, Geophys. Res. Lett., 42, 8660–8668, https://doi.org/10.1002/2015GL065496, 2015.
Van Damme, M., Clarisse, L., Whitburn, S., Hadji-Lazaro, J., Hurtmans, D., Clerbaux, C., and Coheur, P.-F.: Industrial and agricultural ammonia point sources exposed, Nature, 564, 99–103, https://doi.org/10.1038/s41586-018-0747-1, 2018.
Vasilakos, P., Russell, A., Weber, R., and Nenes, A.: Understanding nitrate formation in a world with less sulfate, Atmos. Chem. Phys., 18, 12765–12775, https://doi.org/10.5194/acp-18-12765-2018, 2018.
Vieira-Filho, M., Pedrotti, J. J., and Fornaro, A.: Water-soluble ions species of size-resolved aerosols: Implications for the atmospheric acidity in São Paulo megacity, Brazil, Atmospheric Research, 181, 281–287, https://doi.org/10.1016/j.atmosres.2016.07.006, 2016.
Vignati, E., Wilson, J., and Stier, P.: M7: An efficient size-resolved aerosol microphysics module for large-scale aerosol transport models, J. Geophys. Res., 109, D22202, https://doi.org/10.1029/2003JD004485, 2004.
Walker, J. M., Philip, S., Martin, R. V., and Seinfeld, J. H.: Simulation of nitrate, sulfate, and ammonium aerosols over the United States, Atmos. Chem. Phys., 12, 11213–11227, https://doi.org/10.5194/acp-12-11213-2012, 2012.
Wang, G., Zhang, R., Gomez, M. E., Yang, L., Levy Zamora, M., Hu, M., Lin, Y., Peng, J., Guo, S., Meng, J., Li, J., Cheng, C., Hu, T., Ren, Y., Wang, Y., Gao, J., Cao, J., An, Z., Zhou, W., Li, G., Wang, J., Tian, P., Marrero-Ortiz, W., Secrest, J., Du, Z., Zheng, J., Shang, D., Zeng, L., Shao, M., Wang, W., Huang, Y., Wang, Y., Zhu, Y., Li, Y., Hu, J., Pan, B., Cai, L., Cheng, Y., Ji, Y., Zhang, F., Rosenfeld, D., Liss, P. S., Duce, R. A., Kolb, C. E., and Molina, M. J.: Persistent sulfate formation from London Fog to Chinese haze, P. Natl. Acad. Sci. USA, 113, 13630–13635, https://doi.org/10.1073/pnas.1616540113, 2016.
Wang, M., Kong, W., Marten, R., He, X.-C., Chen, D., Pfeifer, J., Heitto, A., Kontkanen, J., Dada, L., Kürten, A., Yli-Juuti, T., Manninen, H. E., Amanatidis, S., Amorim, A., Baalbaki, R., Baccarini, A., Bell, D. M., Bertozzi, B., Bräkling, S., Brilke, S., Murillo, L. C., Chiu, R., Chu, B., De Menezes, L.-P., Duplissy, J., Finkenzeller, H., Carracedo, L. G., Granzin, M., Guida, R., Hansel, A., Hofbauer, V., Krechmer, J., Lehtipalo, K., Lamkaddam, H., Lampimäki, M., Lee, C. P., Makhmutov, V., Marie, G., Mathot, S., Mauldin, R. L., Mentler, B., Müller, T., Onnela, A., Partoll, E., Petäjä, T., Philippov, M., Pospisilova, V., Ranjithkumar, A., Rissanen, M., Rörup, B., Scholz, W., Shen, J., Simon, M., Sipilä, M., Steiner, G., Stolzenburg, D., Tham, Y. J., Tomé, A., Wagner, A. C., Wang, D. S., Wang, Y., Weber, S. K., Winkler, P. M., Wlasits, P. J., Wu, Y., Xiao, M., Ye, Q., Zauner-Wieczorek, M., Zhou, X., Volkamer, R., Riipinen, I., Dommen, J., Curtius, J., Baltensperger, U., Kulmala, M., Worsnop, D. R., Kirkby, J., Seinfeld, J. H., El-Haddad, I., Flagan, R. C., and Donahue, N. M.: Rapid growth of new atmospheric particles by nitric acid and ammonia condensation, Nature, 581, 184–189, https://doi.org/10.1038/s41586-020-2270-4, 2020.
Wang, S., Nan, J., Shi, C., Fu, Q., Gao, S., Wang, D., Cui, H., Saiz-Lopez, A., and Zhou, B.: Atmospheric ammonia and its impacts on regional air quality over the megacity of Shanghai, China, Scientific Reports, 5, 15842, https://doi.org/10.1038/srep15842, 2015.
Wang, S., Xing, J., Jang, C., Zhu, Y., Fu, J. S., and Hao, J.: Impact Assessment of Ammonia Emissions on Inorganic Aerosols in East China Using Response Surface Modeling Technique, Environ. Sci. Technol., 45, 9293–9300, https://doi.org/10.1021/es2022347, 2011.
Wang, X., Zhang, C., Gao, Y., Ji, X., Su, W., and Liu, C.: Satellite unravels recent changes in atmospheric nitrogen oxides emissions from global ocean shipping, J. Clean. Prod., 429, 139591, https://doi.org/10.1016/j.jclepro.2023.139591, 2023.
Wang, X., Wang, W., Yang, L., Gao, X., Nie, W., Yu, Y., Xu, P., Zhou, Y., and Wang, Z.: The secondary formation of inorganic aerosols in the droplet mode through heterogeneous aqueous reactions under haze conditions, Atmos. Environ., 63, 68–76, https://doi.org/10.1016/j.atmosenv.2012.09.029, 2012.
Wang, Y., Zhang, Q. Q., He, K., Zhang, Q., and Chai, L.: Sulfate-nitrate-ammonium aerosols over China: response to 2000–2015 emission changes of sulfur dioxide, nitrogen oxides, and ammonia, Atmos. Chem. Phys., 13, 2635–2652, https://doi.org/10.5194/acp-13-2635-2013, 2013.
Warner, J. X., Dickerson, R. R., Wei, Z., Strow, L. L., Wang, Y., and Liang, Q.: Increased atmospheric ammonia over the world's major agricultural areas detected from space, Geophys. Res. Lett., 44, 2875–2884, https://doi.org/10.1002/2016GL072305, 2017.
Weber, R. J., Guo, H., Russell, A. G., and Nenes, A.: High aerosol acidity despite declining atmospheric sulfate concentrations over the past 15 years, Nat. Geosci., 9, 282–285, https://doi.org/10.1038/ngeo2665, 2016.
Wen, Z., Ma, X., Xu, W., Si, R., Liu, L., Ma, M., Zhao, Y., Tang, A., Zhang, Y., Wang, K., Zhang, Y., Shen, J., Zhang, L., Zhao, Y., Zhang, F., Goulding, K., and Liu, X.: Combined short-term and long-term emission controls improve air quality sustainably in China, Nature Communications, 15, 5169, https://doi.org/10.1038/s41467-024-49539-9, 2024.
West, J. J., Ansari, A. S., and Pandis, S. N.: Marginal PM25: Nonlinear Aerosol Mass Response to Sulfate Reductions in the Eastern United States, J. Air Waste Manage., 49, 1415–1424, https://doi.org/10.1080/10473289.1999.10463973, 1999.
Wu, Y., Gu, B., Erisman, J. W., Reis, S., Fang, Y., Lu, X., and Zhang, X.: PM2.5 pollution is substantially affected by ammonia emissions in China, Environmental Pollution, 218, 86–94, https://doi.org/10.1016/j.envpol.2016.08.027, 2016.
Xie, X., Hu, J., Qin, M., Guo, S., Hu, M., Wang, H., Lou, S., Li, J., Sun, J., Li, X., Sheng, L., Zhu, J., Chen, G., Yin, J., Fu, W., Huang, C., and Zhang, Y.: Modeling particulate nitrate in China: Current findings and future directions, Enviro. Int., 166, 107369, https://doi.org/10.1016/j.envint.2022.107369, 2022.
Xu, J., Chen, J., Zhao, N., Wang, G., Yu, G., Li, H., Huo, J., Lin, Y., Fu, Q., Guo, H., Deng, C., Lee, S.-H., Chen, J., and Huang, K.: Importance of gas-particle partitioning of ammonia in haze formation in the rural agricultural environment, Atmos. Chem. Phys., 20, 7259–7269, https://doi.org/10.5194/acp-20-7259-2020, 2020.
Xu, P., Liao, Y. J., Lin, Y. H., Zhao, C. X., Yan, C. H., Cao, M. N., Wang, G. S., and Luan, S. J.: High-resolution inventory of ammonia emissions from agricultural fertilizer in China from 1978 to 2008, Atmos. Chem. Phys., 16, 1207–1218, https://doi.org/10.5194/acp-16-1207-2016, 2016.
Xu, P., Li, G., Zheng, Y., Fung, J. C. H., Chen, A., Zeng, Z., Shen, H., Hu, M., Mao, J., Zheng, Y., Cui, X., Guo, Z., Chen, Y., Feng, L., He, S., Zhang, X., Lau, A. K. H., Tao, S., and Houlton, B. Z.: Fertilizer management for global ammonia emission reduction, Nature, 626, 792–798, 10.1038/s41586-024-07020-z, 2024.
Xu, R., Tian, H., Pan, S., Prior, S. A., Feng, Y., Batchelor, W. D., Chen, J., and Yang, J.: Global ammonia emissions from synthetic nitrogen fertilizer applications in agricultural systems: Empirical and process-based estimates and uncertainty, Glob. Change Biol., 25, 314–326, https://doi.org/10.1111/gcb.14499, 2019.
Yao, W., Zhang, C., Hao, H., Wang, X., and Li, X.: A support vector machine approach to estimate global solar radiation with the influence of fog and haze, Renew. Energ., 128, 155–162, https://doi.org/10.1016/j.renene.2018.05.069, 2018.
Yu, F., Nair, A. A., and Luo, G.: Long-Term Trend of Gaseous Ammonia Over the United States: Modeling and Comparison With Observations, J. Geophys. Res.-Atmos., 123, 8315–8325, https://doi.org/10.1029/2018JD028412, 2018.
Zhang, B., Shen, H., Liu, P., Guo, H., Hu, Y., Chen, Y., Xie, S., Xi, Z., Skipper, T. N., and Russell, A. G.: Significant contrasts in aerosol acidity between China and the United States, Atmos. Chem. Phys., 21, 8341–8356, https://doi.org/10.5194/acp-21-8341-2021, 2021a.
Zhang, L., Chen, Y., Zhao, Y., Henze, D. K., Zhu, L., Song, Y., Paulot, F., Liu, X., Pan, Y., Lin, Y., and Huang, B.: Agricultural ammonia emissions in China: reconciling bottom-up and top-down estimates, Atmos. Chem. Phys., 18, 339–355, https://doi.org/10.5194/acp-18-339-20188, 2018.
Zhang, L., Gong, S., Zhao, T., Zhou, C., Wang, Y., Li, J., Ji, D., He, J., Liu, H., Gui, K., Guo, X., Gao, J., Shan, Y., Wang, H., Wang, Y., Che, H., and Zhang, X.: Development of WRF/CUACE v1.0 model and its preliminary application in simulating air quality in China, Geosci. Model Dev., 14, 703–718, https://doi.org/10.5194/gmd-14-703-2021, 2021b.
Zhang, Q. and Geng, G.: Impact of clean air action on PM2.5 pollution in China, Sci. China Earth Sci., 62, 1845–1846, https://doi.org/10.1007/s11430-019-9531-4, 2019.
Zhao, P., Zhang, X., Xu, X., and Zhao, X.: Long-term visibility trends and characteristics in the region of Beijing, Tianjin, and Hebei, China, Atmos. Res., 101, 711–718, https://doi.org/10.1016/j.atmosres.2011.04.019, 2011.
Zheng, B., Zhang, Q., Zhang, Y., He, K. B., Wang, K., Zheng, G. J., Duan, F. K., Ma, Y. L., and Kimoto, T.: Heterogeneous chemistry: a mechanism missing in current models to explain secondary inorganic aerosol formation during the January 2013 haze episode in North China, Atmos. Chem. Phys., 15, 2031–2049, https://doi.org/10.5194/acp-15-2031-2015, 2015.
Zheng, B., Tong, D., Li, M., Liu, F., Hong, C., Geng, G., Li, H., Li, X., Peng, L., Qi, J., Yan, L., Zhang, Y., Zhao, H., Zheng, Y., He, K., and Zhang, Q.: Trends in China's anthropogenic emissions since 2010 as the consequence of clean air actions, Atmos. Chem. Phys., 18, 14095–14111, https://doi.org/10.5194/acp-18-14095-2018, 2018.
Zheng, G., Su, H., and Cheng, Y.: Revisiting the Key Driving Processes of the Decadal Trend of Aerosol Acidity in the U.S, ACS Environmental Au, 2, 346–353, https://doi.org/10.1021/acsenvironau.1c00055, 2022.
Zheng, G., Su, H., Andreae, M. O., Pöschl, U., and Cheng, Y.: Multiphase Buffering by Ammonia Sustains Sulfate Production in Atmospheric Aerosols, AGU Advances, 5, e2024AV001238, https://doi.org/10.1029/2024AV001238, 2024.
Zheng, G., Su, H., and Cheng, Y.: Role of Carbon Dioxide, Ammonia, and Organic Acids in Buffering Atmospheric Acidity: The Distinct Contribution in Clouds and Aerosols, Environmental Science and Technology, 57, 12571–12582, https://doi.org/10.1021/acs.est.2c09851, 2023.
Zheng, G., Su, H., Wang, S., Andreae, M. O., Pöschl, U., and Cheng, Y.: Multiphase buffer theory explains contrasts in atmospheric aerosol acidity, Science, 369, 1374–1377, https://doi.org/10.1126/science.aba3719, 2020.
Zhou, M., Deng, Z., Robert, C., Zhang, X., Zhang, L., Wang, Y., Qi, C., Wang, P., and Mazière, M. D.: The First Global Map of Atmospheric Ammonia (NH3) as Observed by the HIRAS/FY-3D Satellite, Adv. Atmos. Sci., 41, 379–390,https://doi.org/10.1007/s00376-023-3059-9, 2024.
Zhou, M., Zheng, G., Wang, H., Qiao, L., Zhu, S., Huang, D., An, J., Lou, S., Tao, S., Wang, Q., Yan, R., Ma, Y., Chen, C., Cheng, Y., Su, H., and Huang, C.: Long-term trends and drivers of aerosol pH in eastern China, Atmos. Chem. Phys., 22, 13833–13844, https://doi.org/10.5194/acp-22-13833-2022, 2022.
Zhou, W., Gao, M., He, Y., Wang, Q., Xie, C., Xu, W., Zhao, J., Du, W., Qiu, Y., Lei, L., Fu, P., Wang, Z., Worsnop, D. R., Zhang, Q., and Sun, Y.: Response of aerosol chemistry to clean air action in Beijing, China: Insights from two-year ACSM measurements and model simulations, Environ. Pollut., 255, 113345, https://doi.org/10.1016/j.envpol.2019.113345, 2019.
Zou, X., Wang, S., Liu, J., Zhu, J., Zhang, S., Xue, R., Gu, C., and Zhou, B.: Role of gas-particle conversion of ammonia in haze pollution under ammonia-rich environment in Northern China and prospects of effective emission reduction, Science of The Total Environment, 934, 173277, https://doi.org/10.1016/j.scitotenv.2024.173277, 2024.
- Abstract
- Introduction
- Modeling description
- Observations
- Model evaluation
- Secondary inorganic aerosol composition
- Aerosol acidity
- Emission sensitivity analysis
- Conclusion
- Data availability
- Author contributions
- Competing interests
- Disclaimer
- Special issue statement
- Acknowledgements
- Financial support
- Review statement
- References
- Supplement