the Creative Commons Attribution 4.0 License.
the Creative Commons Attribution 4.0 License.
 | 11 Sep 2025
Spatiotemporal patterns and drivers of wildfire CO2 emissions in China from 2001 to 2022
Xuehong Gong
Jie Tian
Qiyuan Wang
Guohui Li
Zhisheng An
Wildfires release large amounts of greenhouse gases into the atmosphere, exacerbating climate change and causing severe impacts on air quality and human health. In this study, based on a bottom-up approach and using satellite data, combined with emission factor and aboveground biomass data for different vegetation cover types (forest, shrub, grassland, and cropland), the dynamic changes in CO2 emissions from wildfires in China from 2001 to 2022 were analyzed. The results showed that between 2001 and 2022, the total CO2 emissions from wildfires in China were 937.7 Tg (522.6–1516.0 Tg, 1 Tg = 1012 g), with an annual average of 42.6 Tg (23.8–68.9 Tg). The CO2 emissions from cropland and forest fires were relatively high, accounting for 45 % and 46 % of the total, respectively. The yearly variation in CO2 emissions from forest and shrub fires showed a significant downward trend, while emissions from grassland fires remained relatively stable. In contrast, the CO2 emissions from cropland fires showed an upward trend, primarily in Northeast China. Hot spot analysis and geographically and temporally weighted regression (GTWR) models revealed significant spatial heterogeneity in emissions across vegetation types. Persistent hot spots of shrub and forest fires were located in Southwest and South China, while Northeast China experienced sporadic but extreme fire events. The GTWR model for shrub fire CO2 emissions exhibited the highest predictive performance (R2= 0.87), and climatic factors (particularly temperature and humidity) were the main influencing factors. Notably, the recent rise in cropland fire CO2 emissions in Northeast China is closely linked to region-specific straw-burning policies. The research results provide valuable references for atmospheric transport models, regional fire management, and national carbon accounting frameworks in the context of climate change.
- Article
(8257 KB) - Full-text XML
-
Supplement
(1192 KB) - BibTeX
- EndNote


To limit the global average surface temperature rise to 1.5 °C higher than preindustrial levels, carbon dioxide (CO2) emissions must reach net zero by mid-century through various pathways (Rogelj et al., 2018). Globally, wildfires reduced carbon storage in vegetation by approximately 10 % from 2001 to 2012 (Lasslop et al., 2020). This significantly impacted the concentration of CO2 in the atmosphere (Langenfelds et al., 2002; van der Werf et al., 2004; Wotawa and Trainer, 2000). According to Global Wildfire Information System data compiled by Our World in Data (Our World in Data, 2025), global wildfire CO2 emissions have increased since 2020, fluctuating between 5 and 7 Gt CO2 per year (1 Gt = 1015 g), with record-high levels observed in 2021 and 2023. However, the role of wildfires as a critical factor in carbon sinks and sources is often overlooked. To mitigate climate change and fully understand the carbon exchange mechanisms between terrestrial ecosystems and the atmosphere, it is essential to consider the impacts of wildfire CO2 emissions on the Earth system (Chuvieco et al., 2019; Giglio et al., 2018; Kasischke et al., 1995; McGuire et al., 2001; Zhang et al., 2013).
The significant differences in global wildfire CO2 emissions among countries highlight the complexity of wildfire CO2 emissions. Extreme forest fires in several countries, such as Australia, Canada, and the United States, often release CO2 that exceeds the cumulative CO2 emissions of several years in the same region, significantly impacting the global climate and the environment. Boreal fires, which usually contribute 10 % of global fire CO2 emissions, accounted for 23 % in 2021 (0.48 Gt C), marking the highest fraction since 2000 (Zhang et al., 2023b). The unprecedented wildfires in Canada in 2023 released significant amounts of air pollutants and greenhouse gases into the atmosphere. Simulation results (Wang et al., 2023) have indicated that these wildfires emitted more than 1.3 Gt CO2 and 0.14 Gt CO2 equivalent of other greenhouse gases, including CH4 and N2O. The greenhouse gas emissions associated with wildfires exceeded twice the planned cumulative anthropogenic emissions reductions in Canada over a decade. Shiraishi et al. (2021) used a bottom-up approach to estimate CO2 emissions from catastrophic fires in Australia between 2019 and 2020. The results showed that from March 2019 to February 2020, Australia's annual CO2 emissions were estimated to be 806 ± 69.7 Tg (1 Tg = 1012 g) CO2 yr−1, equivalent to 1.5 times its total greenhouse gas emissions (CO2 equivalent) in 2017. Phillips et al. (2022) reported that by the middle of this century, wildfires in northern North America could lead to a cumulative net source of approximately 12 Gt CO2, accounting for approximately 3 % of the remaining global CO2 emissions, which is closely related to the temperature targets of the Paris Agreement. In the context of climate change, wildfires are becoming more frequent, and CO2 emissions from wildfires are often influenced by human intervention. Phillips et al. (2022) found that increasing investment in fire management to avoid CO2 emissions is equivalent to or lower than other mitigation strategies. Therefore, changes in fire management may impact global atmospheric CO2 concentrations, and proactive management strategies effectively reduce CO2 emissions (Kelly et al., 2013; Phillips et al., 2022; Van Wees et al., 2021). Despite the growing importance of wildfire CO2 emissions in climate change, such emissions are often excluded from international climate frameworks, including national inventories under the United Nations Framework Convention on Climate Change (UNFCCC), due to their classification as “natural disturbances” in the Intergovernmental Panel on Climate Change (IPCC) guidelines for Land Use, Land-Use Change, and Forestry (LULUCF) (IPCC, 2019).
China has released numerous wildfire emission inventories, but previous research on wildfire emissions in China has focused chiefly on small-scale regions and short-term periods (Cao et al., 2005; Huang et al., 2012; Qiu et al., 2016; Tian et al., 2011; Wu et al., 2018). Wang and Zhang (2008) established an atmospheric pollutant emission inventory of cropland fires in China in 2006 using the emission factor method and analyzed its spatiotemporal distribution characteristics. Wu et al. (2018) estimated pollutant emission inventories from wildfires in central and eastern China from 2003 to 2015 using remote sensing images but did not include the heavily polluted northeast region. In addition, most studies have focused mainly on atmospheric pollutant emissions, with limited research on CO2 emissions (Jin et al., 2022; Wang and Zhang, 2008; Xie et al., 2024; Yin et al., 2019). Xie et al. (2024) used the GEOS-Chem model to investigate the impact of cropland fires on severe haze events in Heilongjiang Province. They reported high uncertainty in the existing Global Fire Emissions Database (GFED) version 4.1 emission inventory. Van der Werf et al. (2017) also noted substantial uncertainty in estimating wildfire emissions in existing emission inventories. Consequently, there is a critical need to quantify the long-term dynamics of wildfire CO2 emissions across diverse vegetation types.
Traditionally, wildfire emission inventories using population or cropland area weights to allocate total emissions to grid cells have high uncertainties (Streets et al., 2003; Zhang et al., 2013). With the advancement of remote sensing technology, recent studies have shifted to satellite-based estimation methods, using active fire detection or burned area datasets to improve spatial accuracy. Inventories such as GFED (Chen et al., 2023) and the NCAR Fire Inventory (FINN) (Wiedinmyer et al., 2011) rely on satellite-derived fire count data (e.g., active fire product MCD14 ML) or burned area products (e.g., MCD64A1) to infer the timing and location of fire emissions (Giglio et al., 2016, 2018). Although satellite remote sensing has greatly improved the spatial and temporal resolution of fire detection, several practical challenges remain. For example, cloud cover, satellite overpass intervals, fire intensity thresholds, and pixel resolution can result in the under-detection of short-duration or low-intensity fires. To mitigate these limitations, this study integrated multi-source satellite products to enhance the completeness of the fire signal. Additionally, many existing global inventories rely on globally aggregated vegetation data (such as global land cover and biomass), which further introduces errors, especially in transition zones between cropland and natural vegetation (e.g., forest-agricultural mosaics), where misclassification may lead to overestimation or underestimation of fire emissions.
To overcome these shortcomings, this study integrated China's regionally validated vegetation cover datasets (Xu et al., 2018), multi-source burned area satellite products, and regionally derived biomass data (Hu et al., 2006; Su et al., 2016; Yan et al., 2023) to develop a 500 m resolution wildfire CO2 emission inventory for China (2001–2022). Additionally, we used spatially weighted regression models to explore the drivers of emission variability and analyzed the impacts of national fire management policies on CO2 emissions. The findings provide insights into the role of governance in shaping fire emissions and offer useful references for future wildfire management strategies. This multi-year emission inventory can also be used in atmospheric transport models to support the development of effective global warming mitigation strategies.
2.1 Study area
China is located in the eastern part of the Eurasian continent on the west coast of the Pacific Ocean. It spans approximately 50° of latitude (3–53° N) from north to south and 60° of longitude (73–135° E) from east to west, with a land area of approximately 9.60 × 10⁶ km2. There are differences in the geographical distribution of cropland, grassland, shrubs, and forests in China. In this study, China was divided into seven subregions based on geographic and ecological characteristics: Northeast China (NE), North China (NC), Central-West China (CW), South China (SC), Southwest China (SW), Northwest China (NW), and the Tibetan Plateau (TP) (Fig. 1). Croplands are mainly located in the eastern plains and coastal areas, especially in NE (provinces such as Heilongjiang, Jilin, and Liaoning) and NC (provinces such as Hebei, Henan, Shandong, and Jiangsu), where the terrain is flat and suitable for agriculture. Grasslands are mainly distributed across the Inner Mongolia region (spanning NE and CW), the Xinjiang region of NW, and parts of SW. Forests and shrubs are primarily concentrated in NE (especially Heilongjiang), SW (provinces such as Yunnan, Guizhou, and Sichuan), and SC (provinces like Jiangxi and Hunan).
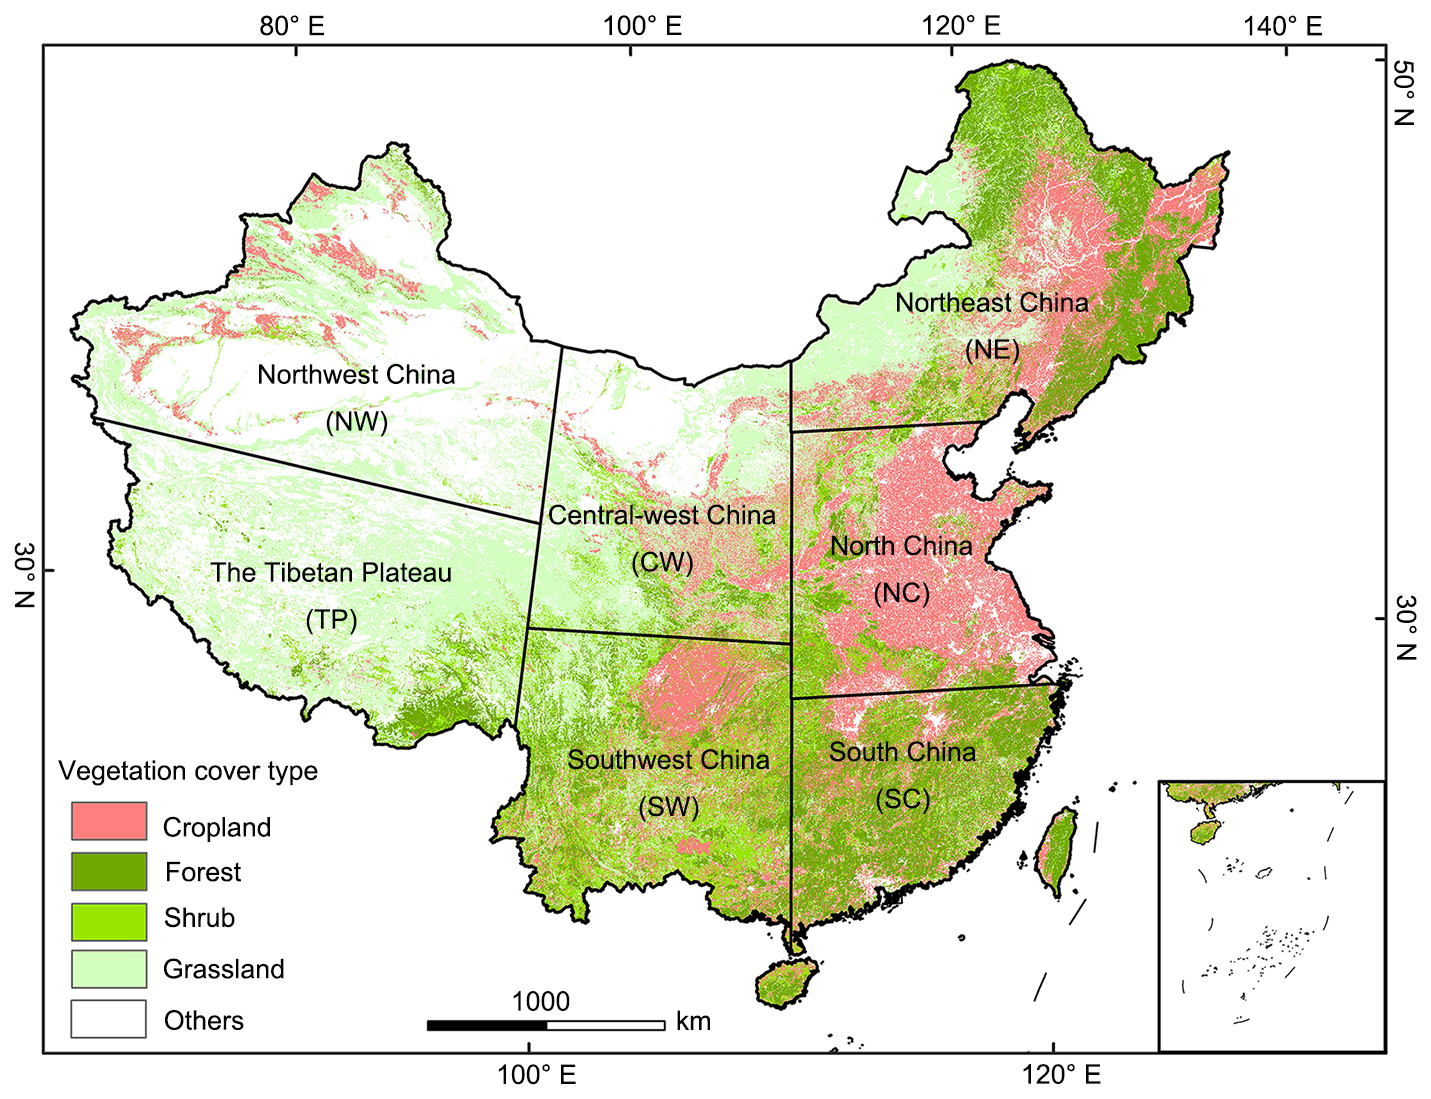
Figure 1Regional divisions and vegetation distribution in China. The seven regions include North China (NC): 109° E to eastern border, 30–41° N; South China (SC): 109° E to eastern border, southern border to 30° N; Southwest China (SW): 100–109° E, southern border to 32° N; Central-West China (CW): 100–109° E, 32° N to northern border; Northeast China (NE): 109° E to eastern border, 41° N to northern border; Northwest China (NW): western border to 100° E, 36° N to northern border; and the Tibetan Plateau (TP): western border to 100° E, southern border to 36° N.
2.2 CO2 emission estimation
In this study, we employed a bottom-up approach to develop an inventory of China's wildfire CO2 emissions. Wildfire CO2 emissions were calculated using the following formula:
where the subscripts x and i represent the grid cell and vegetation cover type (forest, shrub, grassland, and cropland), respectively. The vegetation cover data were sourced from the China Land Use Land Cover Remote Sensing Monitoring Dataset (CNLUCC) (Xu et al., 2018), and a 1 km harvesting area dataset for three staple crops (e.g., corn, wheat, and rice) in China from 2000 to 2019 was obtained from Luo et al. (2020a). Ei represents the CO2 emissions, BAx,i is the burned area (ha), AGBx,i is the aboveground biomass (t ha−1), and EFi is the emission factor. CEi is the combustion efficiency. All datasets were resampled to 500 m resolution to ensure spatial consistency.
2.2.1 Burned areas
BA for each vegetation cover type was primarily estimated using the MODIS-MCD64A1 product (Giglio et al., 2018), which provides global monthly burned area estimates. However, it is well acknowledged that MODIS-MCD64A1 tended to underestimate small and fragmented fires. To address this issue, we applied scaling factors (αi) to correct the MODIS-derived BA estimates. The scaling factors were derived from the comparison of MODIS-derived BA with two independent global burned area datasets, i.e., the FireCCI51 product (Lizundia-Loiola et al., 2020) released by ESA (http://cci.esa.int/data, last access: 3 September 2025) and a global GFED500 product (Van Wees et al., 2022), with their specific values provided in Table S1 in the Supplement. The corrected burned area for each vegetation cover type was obtained by multiplying the MODIS-derived BA values by the corresponding scaling factor. This correction accounts for the known systematic underestimation of small and fragmented fires by the MODIS MCD64A1 product.
Here, i denotes the vegetation type.
2.2.2 Emission factors
The emission factor refers to the gas released per unit mass of dry combustible material during combustion, typically in grams per kilogram (g kg−1). This is a crucial parameter for calculating gas emissions during biomass burning, such as CO2, methane (CH4), and carbon monoxide (CO). Emission factors are influenced by various factors, including the combustibility of tree species, differences in vegetation cover types, and the intensity of flame combustion (Andreae and Merlet, 2001; Lü et al., 2006). To ensure the accuracy of the wildfire emission inventory as much as possible, it is essential to choose appropriate emission factors. This study comprehensively analyzed many studies in the literature to summarize the emission factors of CO2 generated by wildfires under different vegetation cover types, as listed in Table S2. Finally, the average values from the literature were selected as the emission factors of the different vegetation cover types.
2.2.3 Aboveground biomass
Previous studies have mainly used the aboveground biomass data from Fang et al. (1996) for forests. Forest aboveground biomass data in recent years need to be updated. In this study, the aboveground biomass data of forests from 2001 to 2012 were obtained from Su et al. (2016). The data for 2013 to 2022 were obtained from Yan et al. (2023). For shrub, Chinese local biomass density data were collected in Table S3 (Hu et al., 2006). Grassland aboveground biomass was calculated using the exponential model by Gao et al. (2012):
where AGBgrass is the aboveground biomass of grassland (g m−2) based on the average normalized difference vegetation index (NDVI) value of the growing season. NDVI data were sourced from China's regional 250 m normalized difference vegetation index dataset (Gao et al., 2024b).
To determine the aboveground biomass of cropland, we gathered the crop-specific yield per unit area of different crops from the China Statistical Yearbook (NBSC, 2001–2022). The aboveground biomass burned in a field of cropland from major crops is calculated from the crop-specific yield per unit area, the straw production rates, and the dry matter content of each crop residue as follows:
where i represents the crop type (rice, corn, wheat, and other crops), AGBi is the aboveground biomass of cropland burned in the field (g m−2), Pi is the crop-specific yield per unit area (g m−2), Ri is the straw yield ratio for each crop type, and Di is the dry matter content of each crop residue. The other crops were defined as the average of rice, corn, and wheat. For each crop type, data for R and D were collected from published literature (Table S4).
2.2.4 Combustion efficiency
The combustion efficiency (CE) of biomass is a crucial factor determining the accuracy of wildfire CO2 emissions estimates. It is influenced by multiple factors, including fire intensity, wildfire type, moisture content and load of combustibles, and meteorological conditions. Hély et al. (2003) established an empirical relationship between combustion efficiency and vegetation cover fraction (FVC), which was applied in this study to calculate the CE for forests and grasslands. The FVC used in this study was sourced from China's regional 250 m fractional vegetation cover dataset (Gao et al., 2024a). For regions with an FVC exceeding 60 %, the CE values for forest and grassland were set at 0.3 and 0.9, respectively. When the FVC was below 40 %, the CE values for forest and grassland were 0 and 0.98, respectively. In areas where the vegetation cover ranged from 40 % to 60 %, the CE for forest cover was defined as 0.3. The CE for grassland was calculated using the following formula:
The CE of shrub was set at 0.7, based on a China-specific study and global biomass burning studies (Junpen et al., 2020; Mieville et al., 2010; Ping et al., 2021; van Leeuwen et al., 2014; Zhou et al., 2017). The CE of corn, wheat, and rice was obtained from He et al. (2015), with values of 0.92, 0.92, and 0.93, respectively. The CE of other crops was taken as the average value for corn, wheat, and rice (i.e., 0.923).
It is important to note that although the CE values for different vegetation types were carefully selected based on comprehensive literature reviews, CE is inherently variable and can differ significantly across various combustion phases. Because this study aimed to estimate emissions over extended periods (ranging from months to years), the adopted CE values represent average combustion conditions rather than instantaneous ones. This averaging approach may introduce uncertainties in the emission estimates, especially in scenarios where rapid changes in combustion efficiency occur.
2.3 Spatiotemporal analysis of wildfire CO2 emissions
2.3.1 Global spatial autocorrelation analysis
Global spatial autocorrelation is a fundamental concept in spatial statistics, used to assess the overall spatial dependence of a variable across a study region. The Anselin Moran's I index (Anselin, 1995; Moran, 1948) and the Getis–Ord Gi coefficient* (Getis and Ord, 1992) are commonly used to measure the degree of spatial clustering and heterogeneity. Moran's I is a global spatial autocorrelation statistic that quantifies the degree to which similar attribute values are clustered or dispersed in space. The Moran's I index is calculated as follows:
where I is the global Moran's I index, n is the total number of spatial elements, xi and xj are the observed values at spatial units i and j, respectively, is the mean of all observed values, wij is the weight matrix for the adjacency relationships between geographical units, and S0 is the sum of all spatial weights.
The Moran's I is between −1 and 1. A value of I>0 indicates positive spatial autocorrelation, i.e., similar values (high or low) tend to occur near each other, while I<0 indicates that dissimilar values are adjacent. I ≈ 0 suggests a random spatial pattern.
Statistical significance is assessed by comparing the observed Moran's I to a null distribution generated via random permutations. A z-score > 2.58 and p value < 0.01 indicate a statistically significant spatial clustering pattern at the 99 % confidence level. In the context of this study, significantly positive Moran's I values indicate that wildfire CO2 emissions are spatially clustered, meaning that regions with high emissions tend to be adjacent to other high-emission areas, and low-emission regions are likewise grouped. This justifies further localized analyses such as hot spot detection.
2.3.2 Hot spot analysis
While Moran's I provides a global measure of spatial autocorrelation, it does not explicitly identify localized clusters of high or low values. To address this limitation, the Getis–Ord statistic (Getis and Ord, 1992) is commonly used to identify statistically significant hot spots and cold spots within spatial datasets. Unlike Moran's I, which captures both positive and negative spatial autocorrelation, the statistic focuses on detecting concentration patterns of high or low values within the study area. The Getis–Ord statistic is defined as
where is the Getis–Ord statistic for location i, xj is the observed value at location j (e.g., CO2 emissions), is the global mean of the observed variable, wij is the spatial weight matrix, representing the spatial relationship between locations i and j, n is the total number of spatial units, and S is the standard deviation of the observed values.
The statistic is essentially a ratio that compares the local sum of a variable within a specified distance to the global sum, adjusted for the number of spatial units and their spatial relationships. High positive values indicate clusters of high values (hot spots), while low negative values indicate clusters of low values (cold spots). Locations with values near 0 indicate random spatial patterns without significant clustering. Statistical significance is assessed using Z-scores and corresponding p values. In this study, analysis was used to detect persistent high- and low-emission clusters of wildfire CO2 emissions across China from 2001 to 2022. The results provided spatially explicit insights into emission patterns.
2.3.3 Geographically and temporally weighted regression model
To capture the spatial and temporal variations of the drivers of wildfire CO2 emissions, the geographically and temporally weighted regression (GTWR) model was used (Huang et al., 2010). Unlike traditional global regression models, GTWR allows the coefficients of explanatory variables to vary across both space and time, providing a more precise estimation of the local influence of different driving factors. The GTWR model is defined as
where xi is the response variable (wildfire CO2 emissions), (uiviti) are the spatial coordinates and timestamp for location i, β0 is the intercept term, βk is the local coefficient for the kth explanatory variable, xik is the kth explanatory variable, and ϵi is the error term. The accuracy of the GTWR model depends significantly on the choice of bandwidth and kernel function, which control the spatial and temporal influence of neighboring observations. In this study, an adaptive bandwidth was used to ensure that each observation has a sufficient number of neighbors, while a tricube kernel was selected for its smooth distance decay function. The optimal bandwidth was determined using the corrected Akaike information criterion (AICc), a widely used criterion for model selection that balances model complexity and goodness of fit (Hurvich et al., 1998; Hurvich and Tsai, 1989). This approach enabled us to explore how the effects of climatic and socioeconomic variables on wildfire emissions vary across regions and over time.
3.1 Interannual variation in CO2 emissions
The total CO2 emissions from wildfires in China from 2001 to 2022 were 937.7 (522.6–1516.0 Tg) Tg, with an average annual value of 42.6 (23.8–68.9) Tg. CO2 emissions from wildfires in China were relatively low, decreasing slowly by 0.6 Tg per year (Fig. 2a). CO2 emissions from cropland and forest fires were relatively high, accounting for 45 % and 46 % of the total wildfire emissions in China, respectively, shrub fire emissions account for 8 % of the total wildfire emissions in China, and grassland fire emissions were the lowest, accounting for only 2 % of the total wildfire emissions in China (Fig. 2b).
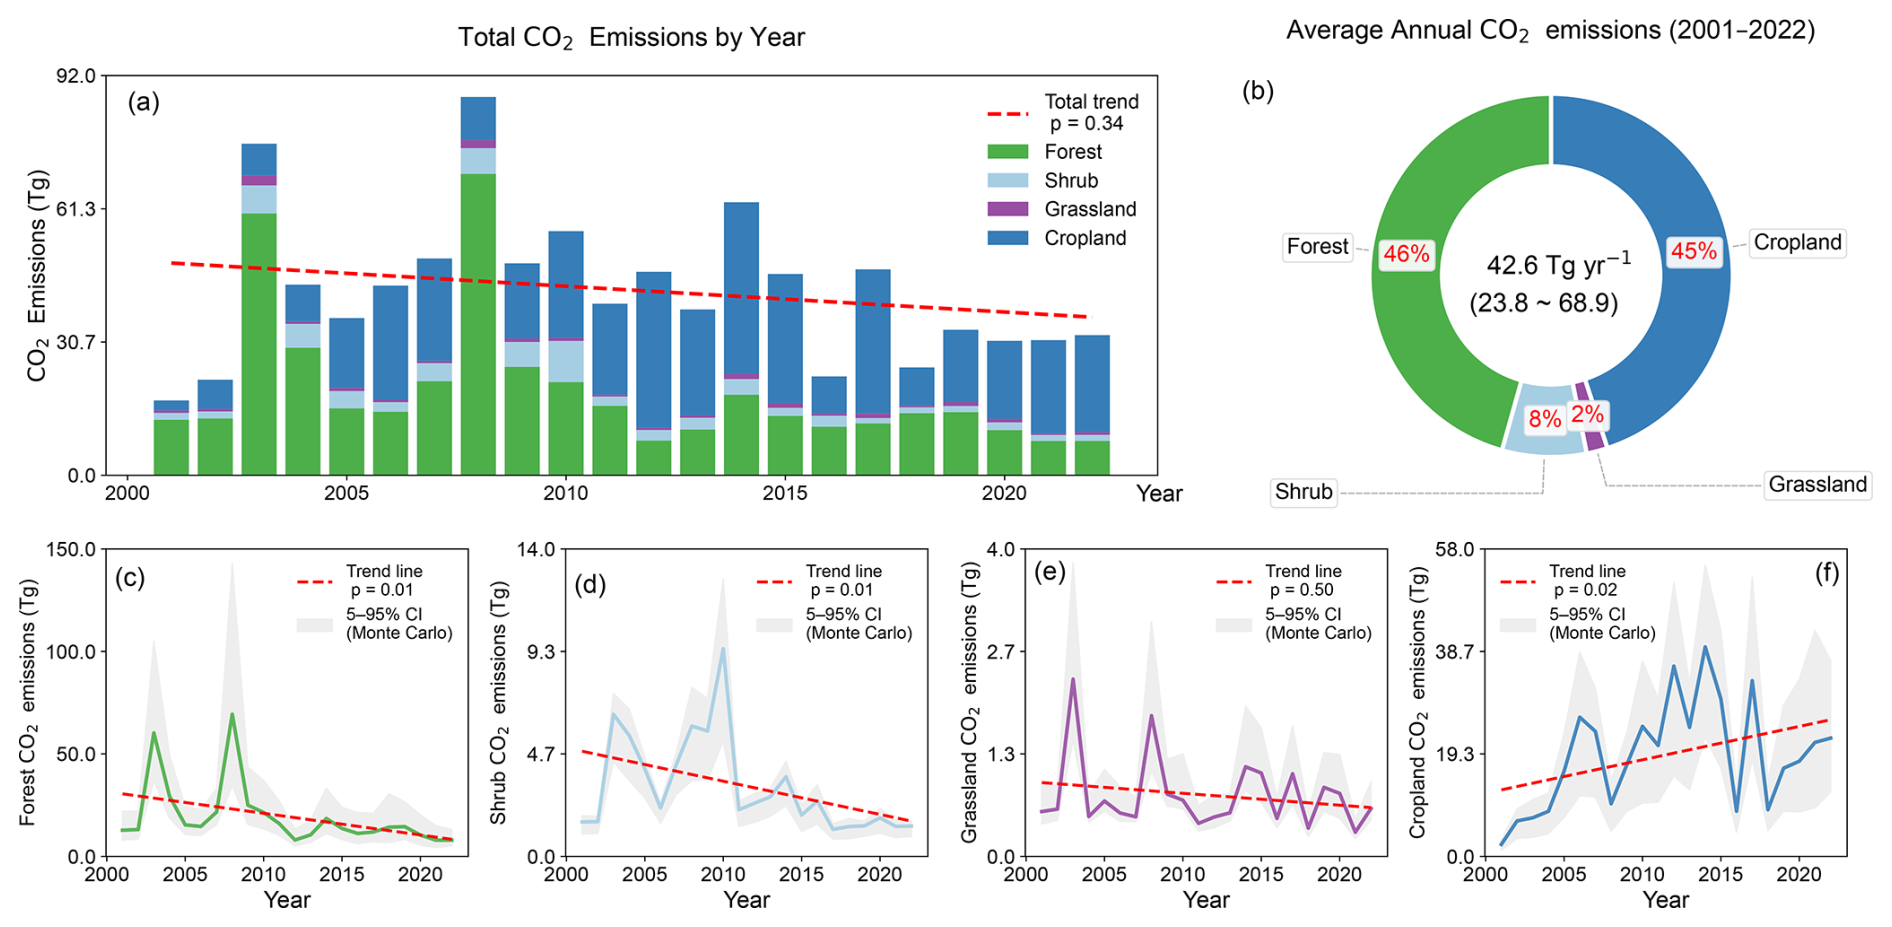
Figure 2(a) Annual CO2 emissions within specific vegetation cover types from 2001 to 2022 in China; (b) contribution of different vegetation cover types to the total CO2 emissions from 2001 to 2022 in China. (c–f) Time series of CO2 emissions for forest, shrub, grassland, and cropland, respectively. The red dashed line is the linear trend, and the gray shaded envelope represents the 5th–95th percentile confidence interval from Monte Carlo uncertainty analysis. The p values are derived from the Mann–Kendall trend test, a non-parametric statistical method used to assess the presence of a monotonic (increasing or decreasing) trend in a time series without assuming any specific data distribution. A p value < 0.05 indicates a statistically significant trend at the 95 % confidence level.
The annual CO2 emissions from different types of fires showed varying temporal trends. The downward trend for forest and shrub emissions was significant, with a decrease of 1.1 and 0.2 Tg per year, respectively (Fig. 2c and d). Such a decline may reflect effective forestry management strategies for forest and shrub fires (Fig. 12). In contrast, cropland emissions showed an upward trend, with an annual increase of 0.6 Tg (Fig. 2f). This may be attributed to the increased agricultural intensity and straw production in major grain-producing regions, particularly in northeastern China. Additionally, shifts in local open-field burning management strategies, such as the introduction of temporally concentrated burning windows, may have enhanced the detectability of agricultural fires via remote sensing. The emission trend for grassland was relatively stable (Fig. 2e), which might be influenced by a combination of ecological and anthropogenic factors.
3.2 Monthly variation in CO2 emissions
The CO2 emissions from different vegetation cover types showed significant seasonal fluctuations, with certain months showing higher emissions than others (Fig. 3a). Wildfires had lower CO2 emissions in July and August, which may correspond to the respective wet seasons (Fig. 3a). Forest, shrub, and grassland fire CO2 emissions had higher emissions in February, March, and April, possibly related to the dry weather and accumulation of combustible materials in spring, increasing the risk of fires (Fig. 3b–d). The extreme fire CO2 emissions observed in both 2003 and 2008 were associated with prolonged drought conditions during the spring season. Cropland fire CO2 emissions showed significant emission peaks in April, May, and June (Fig. 3e). This pattern may be related to specific agricultural activities (such as plowing, sowing, and harvesting) cycles, as cropland fires often occur after harvest when crop residues are burned to prepare for the next planting season. The spatial distribution of forest, shrub, and grassland fire emissions was relatively similar among the different months (Figs. S1–S3). In contrast, the spatial distribution of CO2 emissions from cropland fires varied significantly across different months and was likely influenced by policy management (Fig. 4). High emissions in March and April were concentrated in the NE region, while emissions in May and June were primarily associated with the NC region. The regional difference in peak emission months can be attributed to distinct cropping systems and climatic conditions. In the NE region (e.g., Heilongjiang and Jilin), cold winters and delayed spring thaw often push straw-burning activities into March–April, following the autumn harvest. In contrast, the NC region (e.g., Anhui, Henan, and Jiangsu) practices a double-cropping system of winter wheat and summer maize, where wheat is harvested in May–June, and burning of straw residues is typically observed during this transition period.
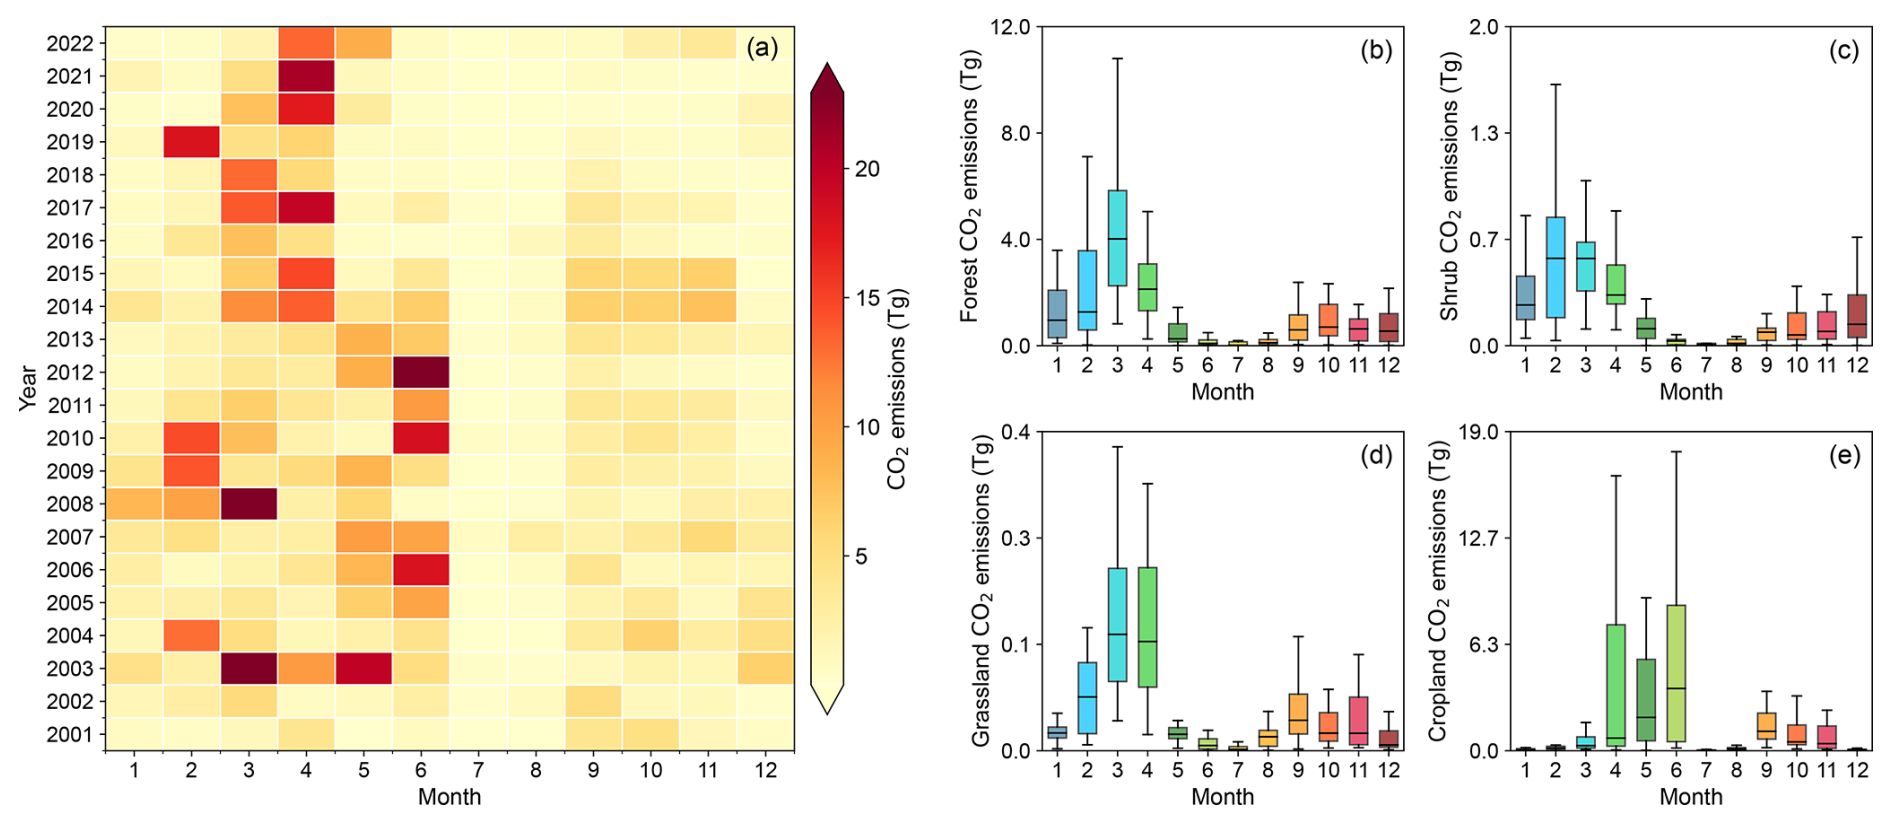
Figure 3(a) Heatmap of monthly total wildfire CO2 emissions in China from 2001 to 2022. (b–e) Box plots of CO2 emissions for specific vegetation cover types per month from 2001 to 2022 in China, showing the median (black line), mean (box), and range within 1.5 times the interquartile range (IQR): (b) forest, (c) shrub, (d) grassland, and (e) cropland.
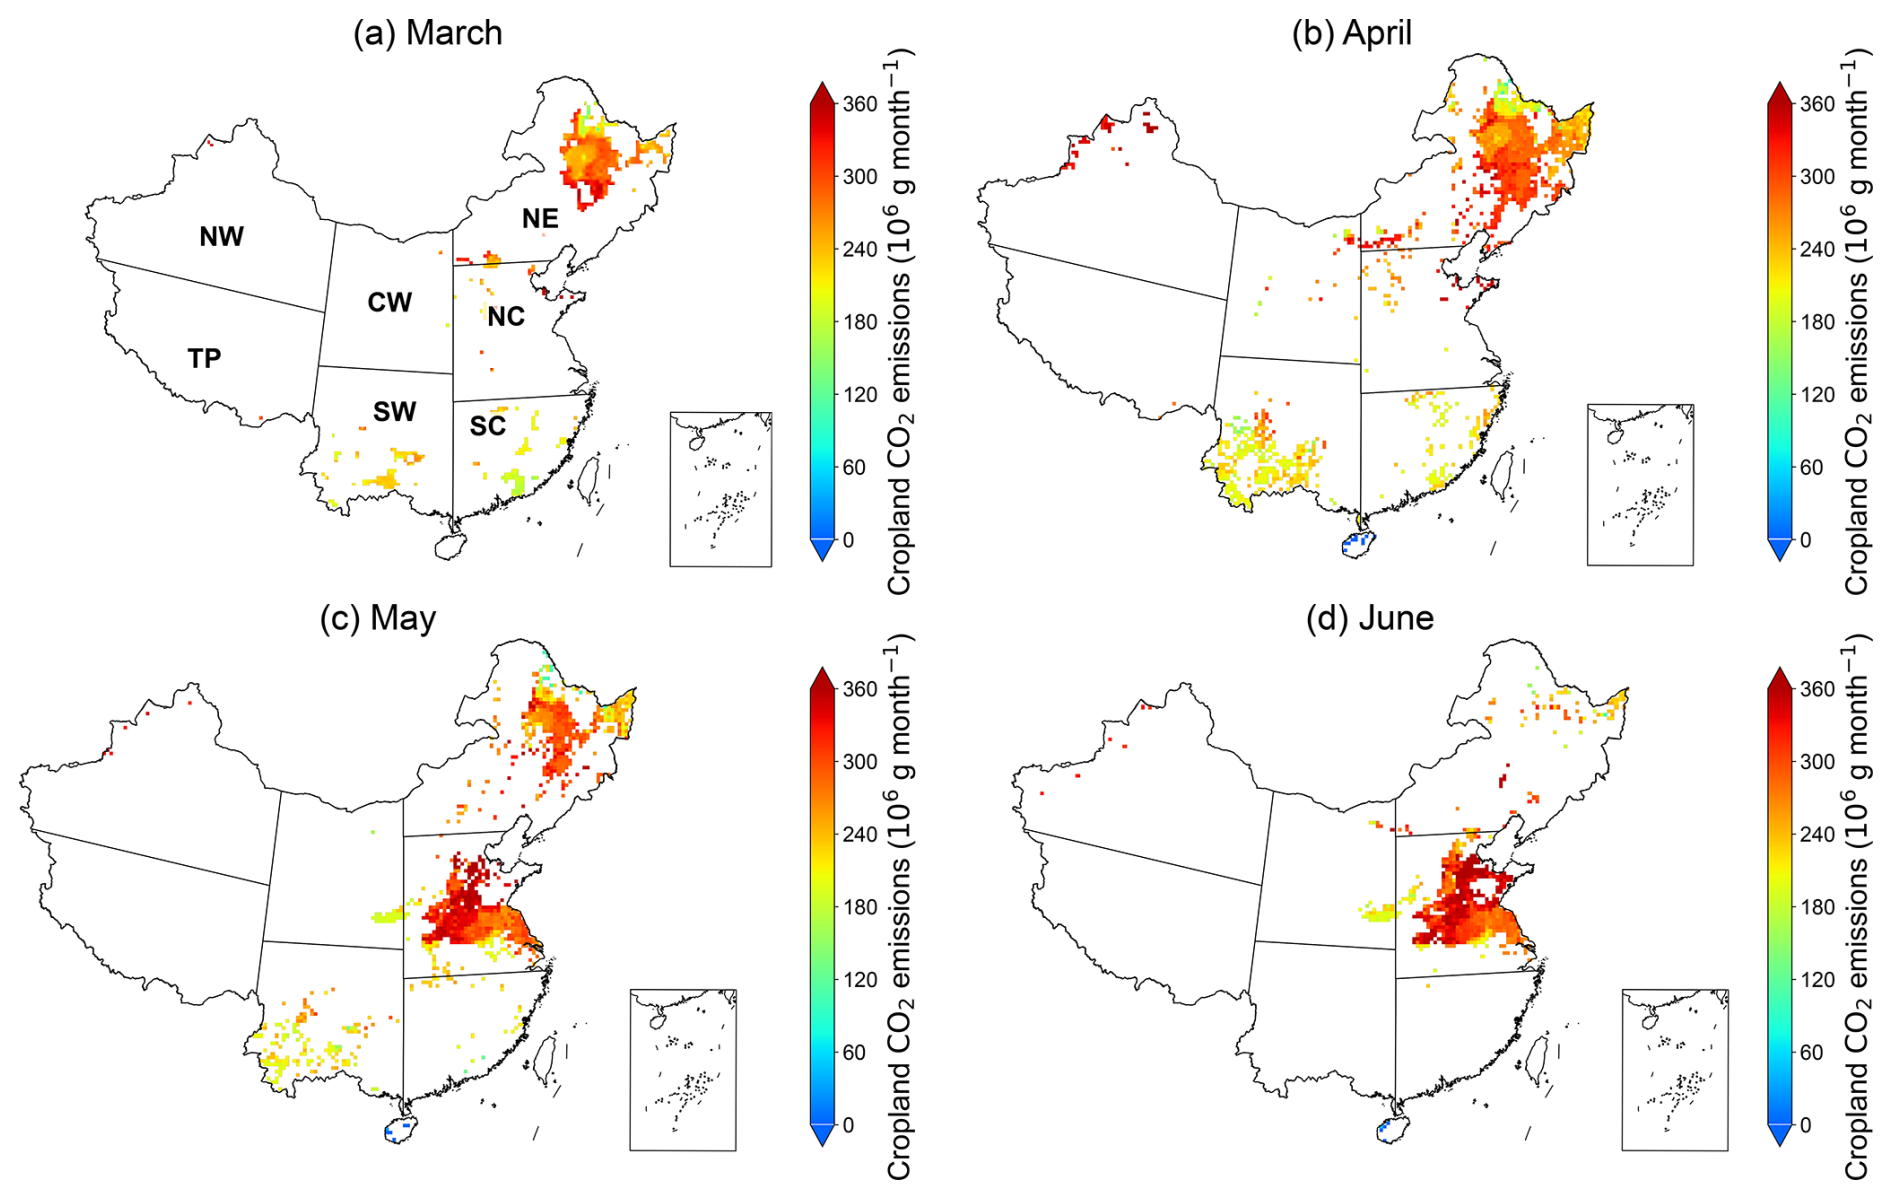
Figure 4Spatial distribution of monthly CO2 emissions within cropland fires from 2001 to 2022 in China: (a) March, (b) April, (c) May, and (d) June. The original emission data at 500 m resolution were resampled to a 0.25° grid to enhance visual clarity.
3.3 Spatiotemporal variations in CO2 emissions
Due to differences in geographical location, climate conditions, and population density, the spatiotemporal distribution of CO2 emissions in each region exhibits heterogeneity (Fig. 5). Emissions in the NW, CW, and TP regions were relatively low, accounting for only 3 % of China's annual average emissions from 2001 to 2022. In contrast, high emissions were mainly concentrated in the NE, NC, SC, and SW regions (Fig. 5a).
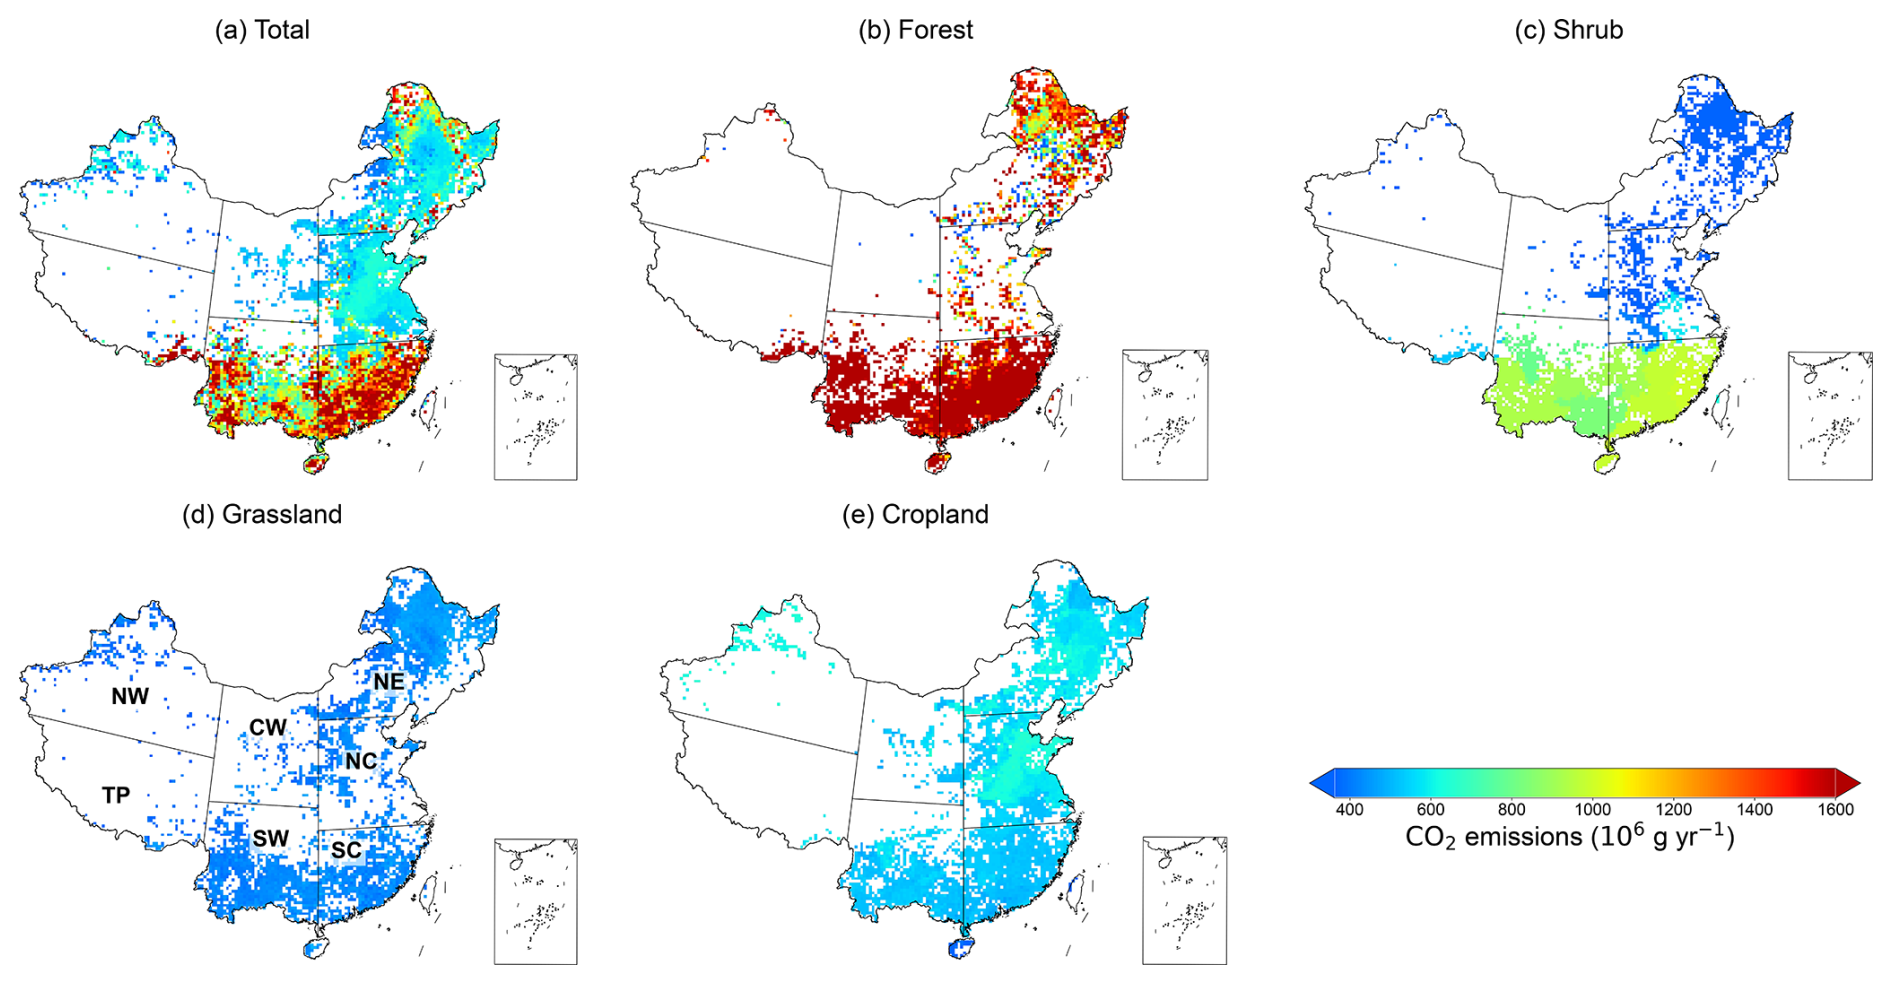
Figure 5Average annual spatial distribution of CO2 emissions in China from 2001 to 2022: (a) all fire types, (b) forest, (c) shrub, (d) grassland, and (e) cropland. The original emission data at 500 m resolution were resampled to a 0.25° grid to enhance visual clarity.
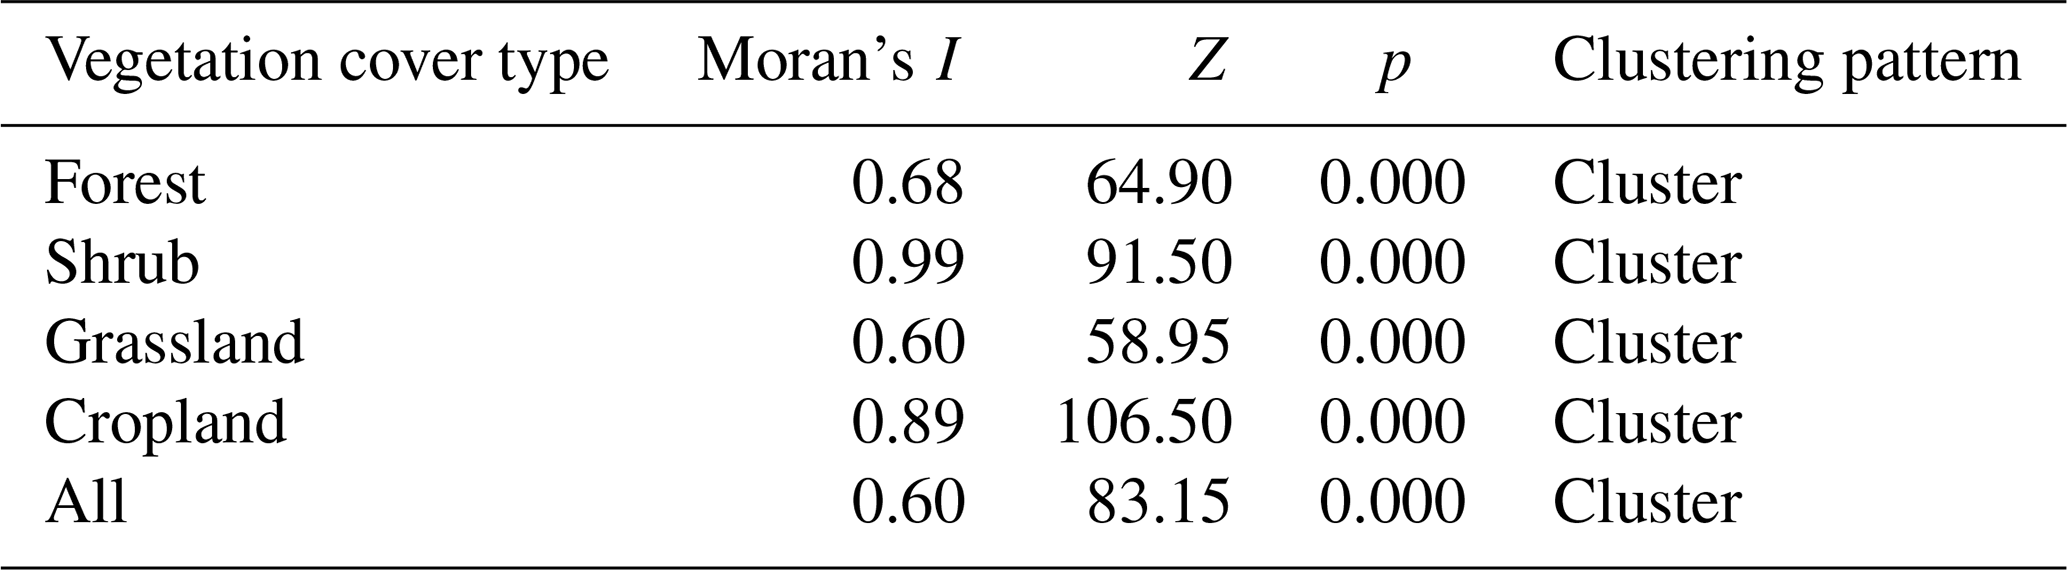
To assess whether wildfire CO2 emissions exhibit statistically significant spatial clustering patterns at the national scale, we first applied Moran's I. This step was crucial because it determined the necessity of subsequent local cluster analyses (such as hot spot analysis). The results (Table 1) showed significantly positive Moran's I values for fire emissions across all vegetation types (I > 0, p < 0.01; Z > 2.58), indicating non-random spatial distributions and strong global spatial autocorrelation. These findings supported the use of the Getis–Ord statistic to identify statistically significant hot spots and cold spots of wildfire emissions. Additionally, the presence of spatial autocorrelation implies the need for spatially explicit regression models (e.g., geographically and temporally weighted regression), as global models such as ordinary least squares (OLS) may not adequately capture the spatial heterogeneity in emission-driver relationships.
Table 1Global spatial autocorrelation statistics of CO2 emissions.
Based on the Getis–Ord analysis (Fig. 6), we identified clear spatial clusters of persistent high (hot spots) and low (cold spots) wildfire CO2 emissions (Fig. 6). Among the different vegetation types, CO2 emissions from forest fires are mainly distributed in the NE, SW, and SC regions, with the NE region accounting for 56 % of China's annual average emissions from 2001 to 2022 (Fig. 5b). The NE region (e.g., the Greater and Lesser Khingan Mountains) is a typical coniferous forest belt with abundant fuel accumulation and dry and windy spring conditions, which make it highly prone to intense but infrequent wildfires (Lian et al., 2024a). However, despite the high forest fire emissions in NE, no significant hot spots were detected by the Getis–Ord analysis (Fig. 6b), indicating that its high emissions mainly stem from sporadic extreme events rather than persistent clustering (Fig. 7a). For example, in 2003 and 2008, extreme wildfires in NE contributed 73 % and 56 % of the national forest fire CO2 emissions in 2003 and 2008, respectively (Fig. 7a). In contrast to NE, SW and SC exhibited significant spatial clustering in forest fire CO2 emissions. Forest fires in these regions are prone to occurring in late winter and early spring each year, with relatively small fire scales but high frequency (Qin et al., 2014; Zhang et al., 2023a).
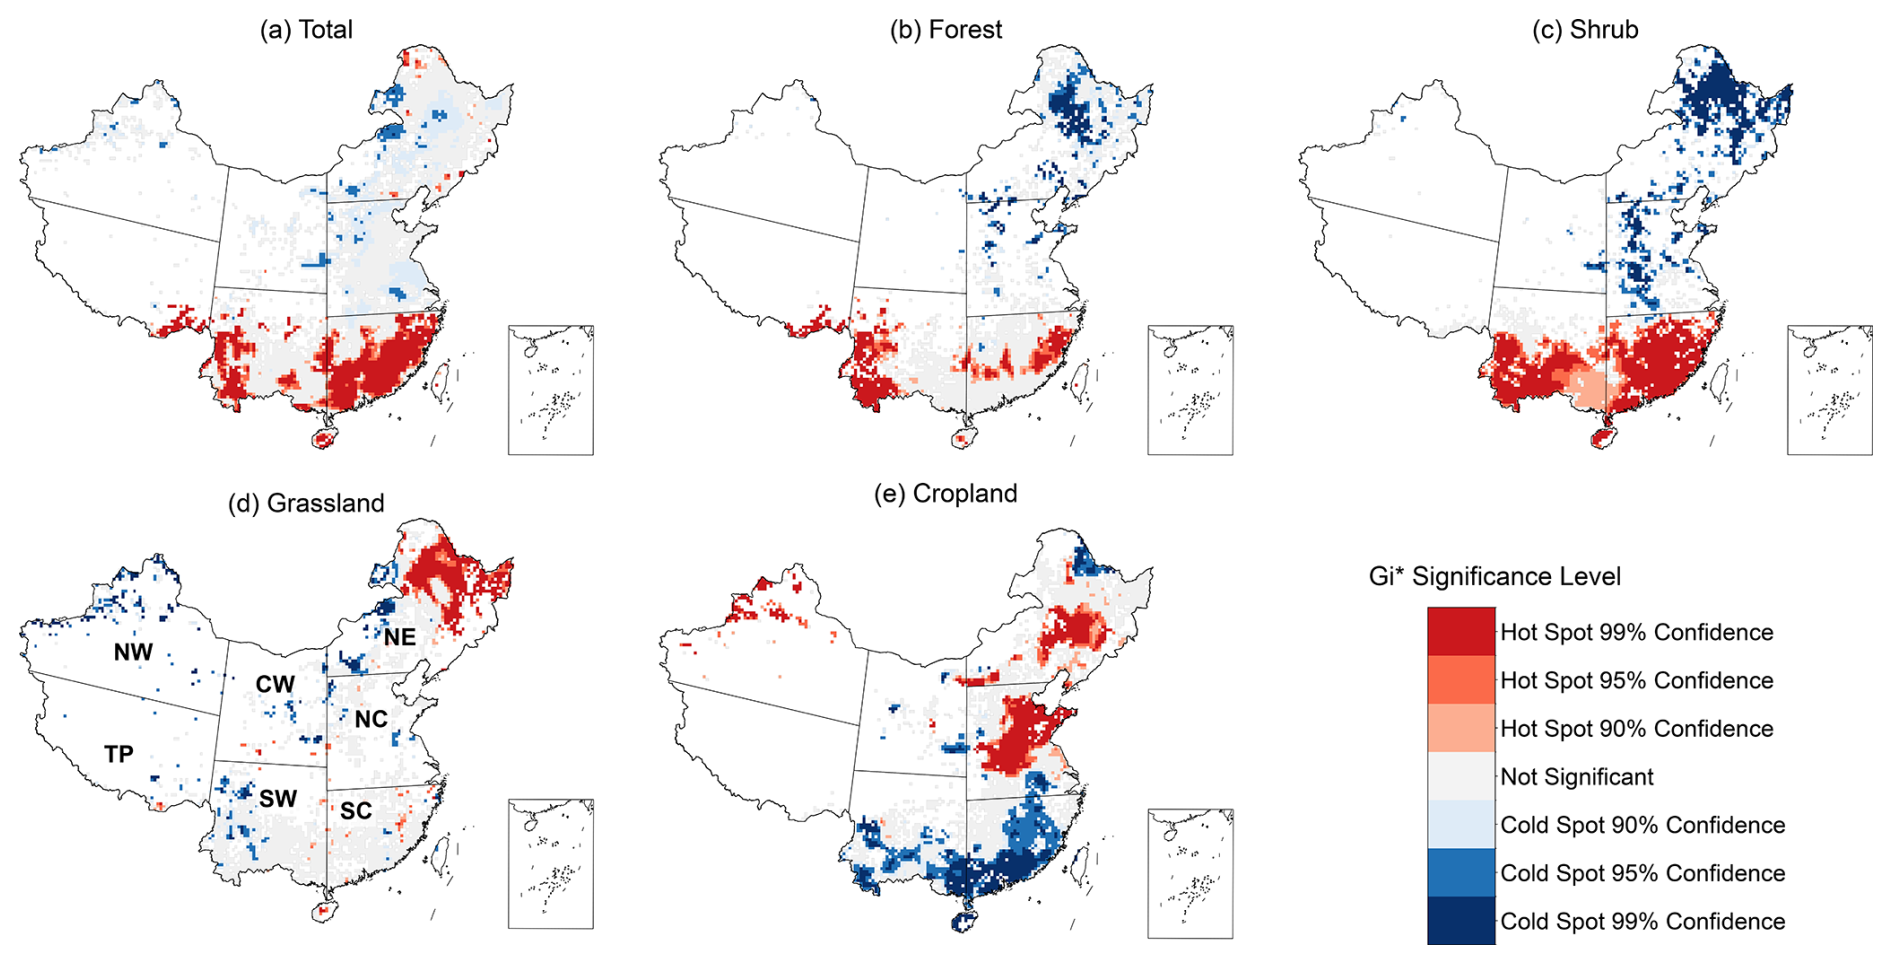
Figure 6Spatial clustering of CO2 emissions at 0.25° resolution in China ( hot spot analysis): (a) all fire types, (b) forest, (c) shrub, (d) grassland, and (e) cropland. Red areas represent statistically significant clusters of high emission values (hot spots), while blue areas indicate significant low-value clusters (cold spots), with confidence levels of 90 %, 95 %, and 99 %.
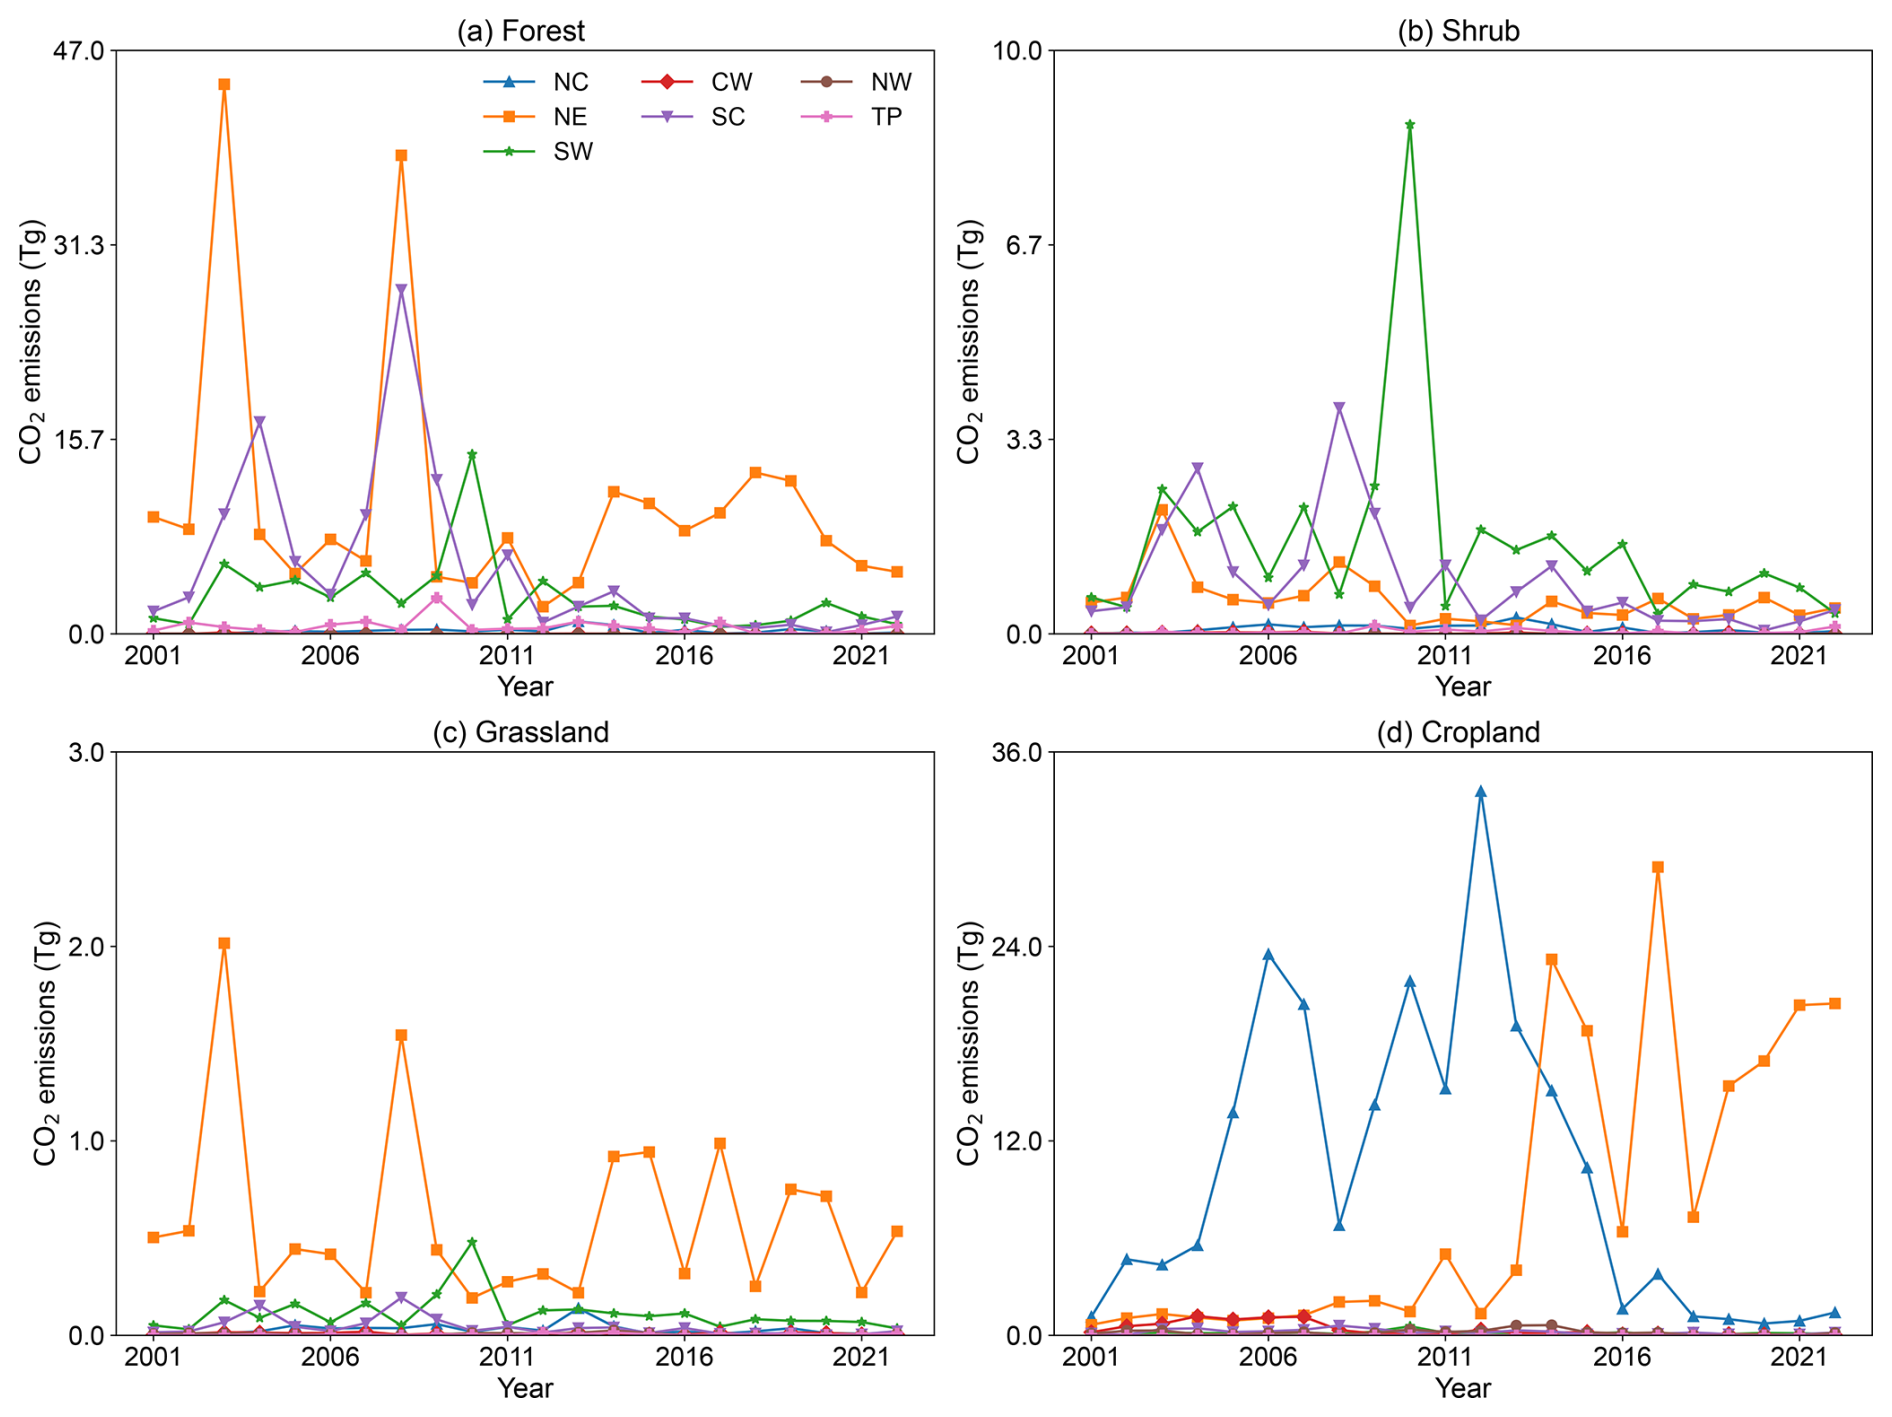
Figure 7Time series of CO2 emissions in regions under different vegetation cover types from 2001 to 2022 in China: (a) forest, (b) shrub, (c) grassland, and (d) cropland.
Shrub fire CO2 emissions were concentrated in the SW and SC regions, accounting for 47 % and 27 % of China's annual average emissions from 2001 to 2022, respectively (Fig. 5c). Secondary vegetation such as shrubs and bamboo forests are common in these areas, resulting from land-use changes (e.g., farmland abandonment and forest degradation), which facilitates the accumulation of combustibles (Han et al., 2018). Meanwhile, complex terrain and high biomass also amplify the risk of fire spread (He et al., 2024). Additionally, seasonal drought (low humidity) combined with human activities such as fuelwood collection and traditional burning practices (Ying et al., 2021) exacerbate fire occurrences, forming persistent spatial clustering that has been clearly identified as hot spot areas (Fig. 6c).
Grassland fire emissions were mainly concentrated in the NE region, accounting for 70 % of China's annual mean during 2001–2022 (Fig. 5d), with hot spot areas focusing on the grasslands of Inner Mongolia (e.g., Hulunbuir and Xilingol) (Fig. 6d). In this region, dry herbaceous vegetation, strong winds, and low humidity in spring make grassland fires extremely prone to ignition (Chang et al., 2023). Additionally, there is a close relationship between land use and grassland fire occurrence (Li et al., 2017). Li et al. (2017) explored the relationship between land use and the spatial distribution of grassland fires, and the results showed that land use has a significant impact on grassland fires.
High CO2 emissions from cropland fires were concentrated in the NC and NE regions, accounting for 51 % and 42 % of China's annual mean emissions, respectively, during 2001–2022 (Fig. 5e). Spatiotemporally, from 2003 to 2012, the main emission sources were agricultural provinces in NC (e.g., Hebei, Shandong, Henan, and Anhui), while after 2012, agricultural regions in NE (e.g., Heilongjiang, Jilin, and Liaoning) became the primary sources of emissions (Figs. 6e and 7d). These areas have high crop straw yields and long-standing traditional burning practices, making them typical hot spots of agricultural fires (Li et al., 2024a; Wu et al., 2018).
3.4 The impact of factors on wildfires in China
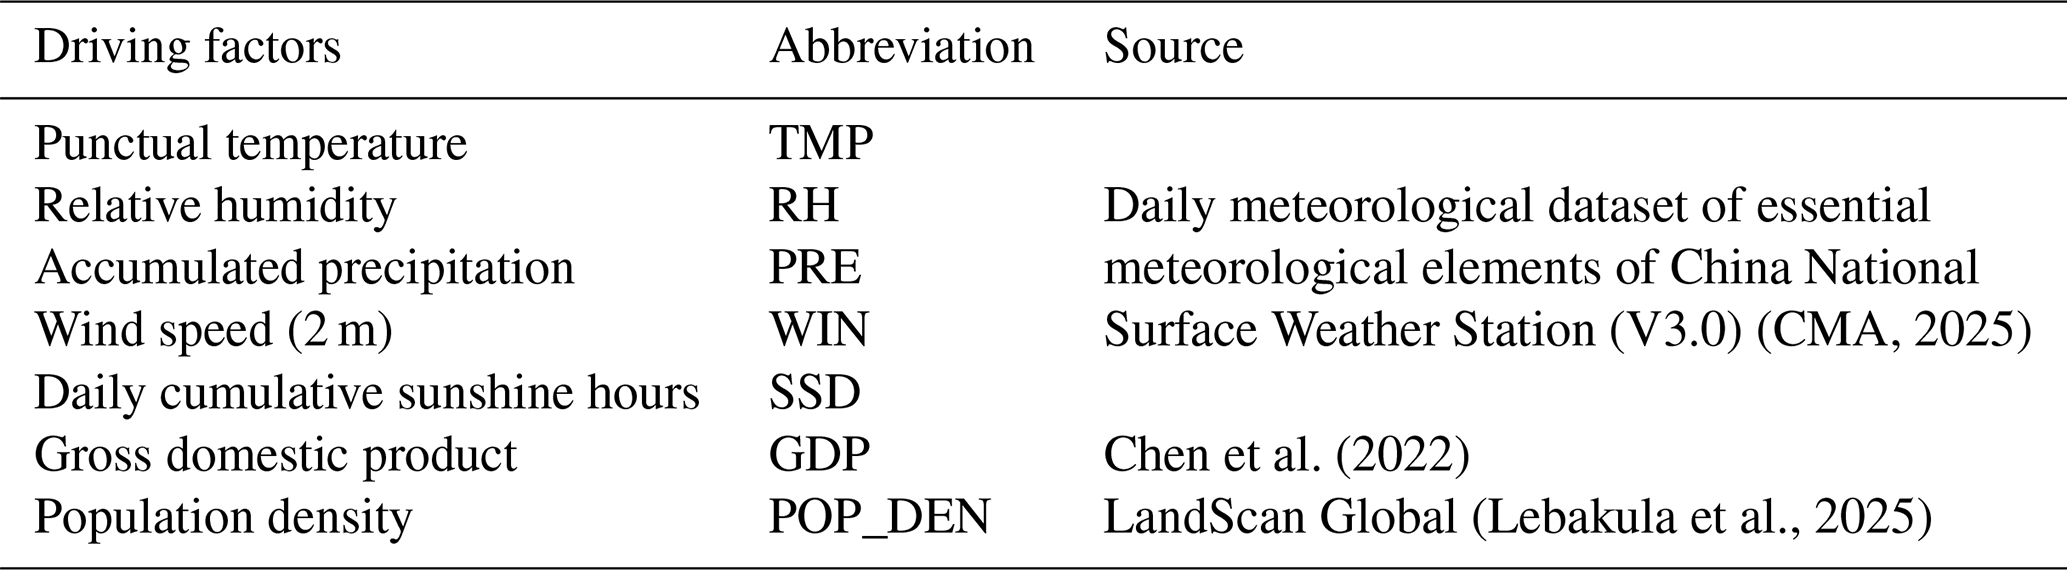
Wildfires in China exhibit distinct spatial clustering patterns. To investigate the climatic and socioeconomic drivers of wildfire CO2 emissions and to characterize their spatiotemporal heterogeneity, we applied three regression models – OLS, geographically weighted regression (GWR), and GTWR – to four types of fires (forest, shrub, grassland, and cropland). We compared model performance using R2 and the AICc. Explanatory variables were selected based on theoretical relevance and data availability for the period 2001–2019. As shown in Table 2, these variables include five climatic factors – punctual temperature (TMP, °C), accumulated precipitation (PRE, mm), relative humidity (RH, %), wind speed at 2 m (WIN, m s−1), and daily cumulative sunshine hours (SSD, h) – and two socioeconomic indicators – gross domestic product (GDP, millions km−2) and population density (POP_DEN, people grid−1). These factors are widely recognized as influencing wildfire emissions (Lan et al., 2021; Ma et al., 2020; Zeng et al., 2024). TMP and SSD affect fuel flammability and combustion efficiency, PRE and RH regulate fuel moisture, and WIN promotes fire spread. Socioeconomic factors reflected anthropogenic influences on fire ignition, suppression, and land use. To ensure model parsimony and statistical robustness, variables that were not statistically significant (p>0.05) in the global OLS model were excluded from subsequent GWR and GTWR analyses. All retained variables were normalized or Box–Cox transformed prior to modeling to ensure comparability.
Across all fire types, both GWR and GTWR models outperformed the global OLS model. For forest fires, GTWR achieved the best performance (R2= 0.58; AICc = 128 909), while OLS explained only 6 % of the variance, indicating strong spatiotemporal heterogeneity. For cropland fires, GTWR also performed well (R2= 0.52; AICc = 141 335), highlighting the influence of cropping cycles and regional factors. In shrub fires, the performances of the GWR and GTWR models were nearly identical (both with R2 = 0.87), and GTWR showed a slightly higher AICc (worse model fit), indicating that incorporating temporal weights did not lead to a substantial improvement. This finding suggests that shrub fire emissions are primarily driven by spatial heterogeneity, with limited temporal variability. For grassland fires, GTWR improved R2 from 0.27 to 0.31 compared to GWR, but the overall model fit remained low, indicating that other drivers – such as land-use change, grazing, or local policies – play a critical role in grassland ecosystems.
To explore the temporal dynamics of individual variables, Fig. 8 presents the annual average GTWR regression coefficients for 2001–2019, revealing significant differences in how climatic and socioeconomic drivers influenced wildfire CO2 emissions across vegetation cover types. Except for SSD, all other factors exhibited negative effects on forest fire CO2 emissions (Fig. 8a). Temporally, regression coefficients for key variables such as POP_DEN, TMP, and GDP showed weakened negative effects after 2012, suggesting reduced sensitivity of forest fire emissions to these drivers in recent years. This change likely reflects strengthened forest fire prevention policies and management measures implemented in China after 2012 (Fig. 12), which significantly reduced fire occurrences. Spatially, regression coefficients showed significant north-south disparities (Fig. 9). TMP and RH had a dual effect on forest fire emissions. In the NE and NC regions, TMP and RH positively correlated with forest fire emissions, indicating that warming and drying conditions may promote fire activity in temperate forests (Fang et al., 2021; Lian et al., 2024b) (Fig. 9a and b). In contrast, in the SW and SC regions, TMP and RH exhibited negative coefficients (Fig. 9a and b). This may occur because, while high temperatures can increase plant evapotranspiration and reduce fuel moisture content (Chuvieco et al., 2004), China's monsoon climate typically links high temperatures with high relative humidity, creating a threshold effect on forest fires (Ma et al., 2020). Additionally, during high-temperature periods, forest fire prevention authorities implement strict fire control measures, limiting fire occurrences (Abatzoglou et al., 2018; Hu and Zhou, 2014). GDP (Fig. 9e) showed positive effects in the NE region but negative effects in the SC and SW regions. POP_DEN (Fig. 9f) generally displayed negative effects, especially in the SW and SC regions, highlighting the role of human presence in fire suppression.
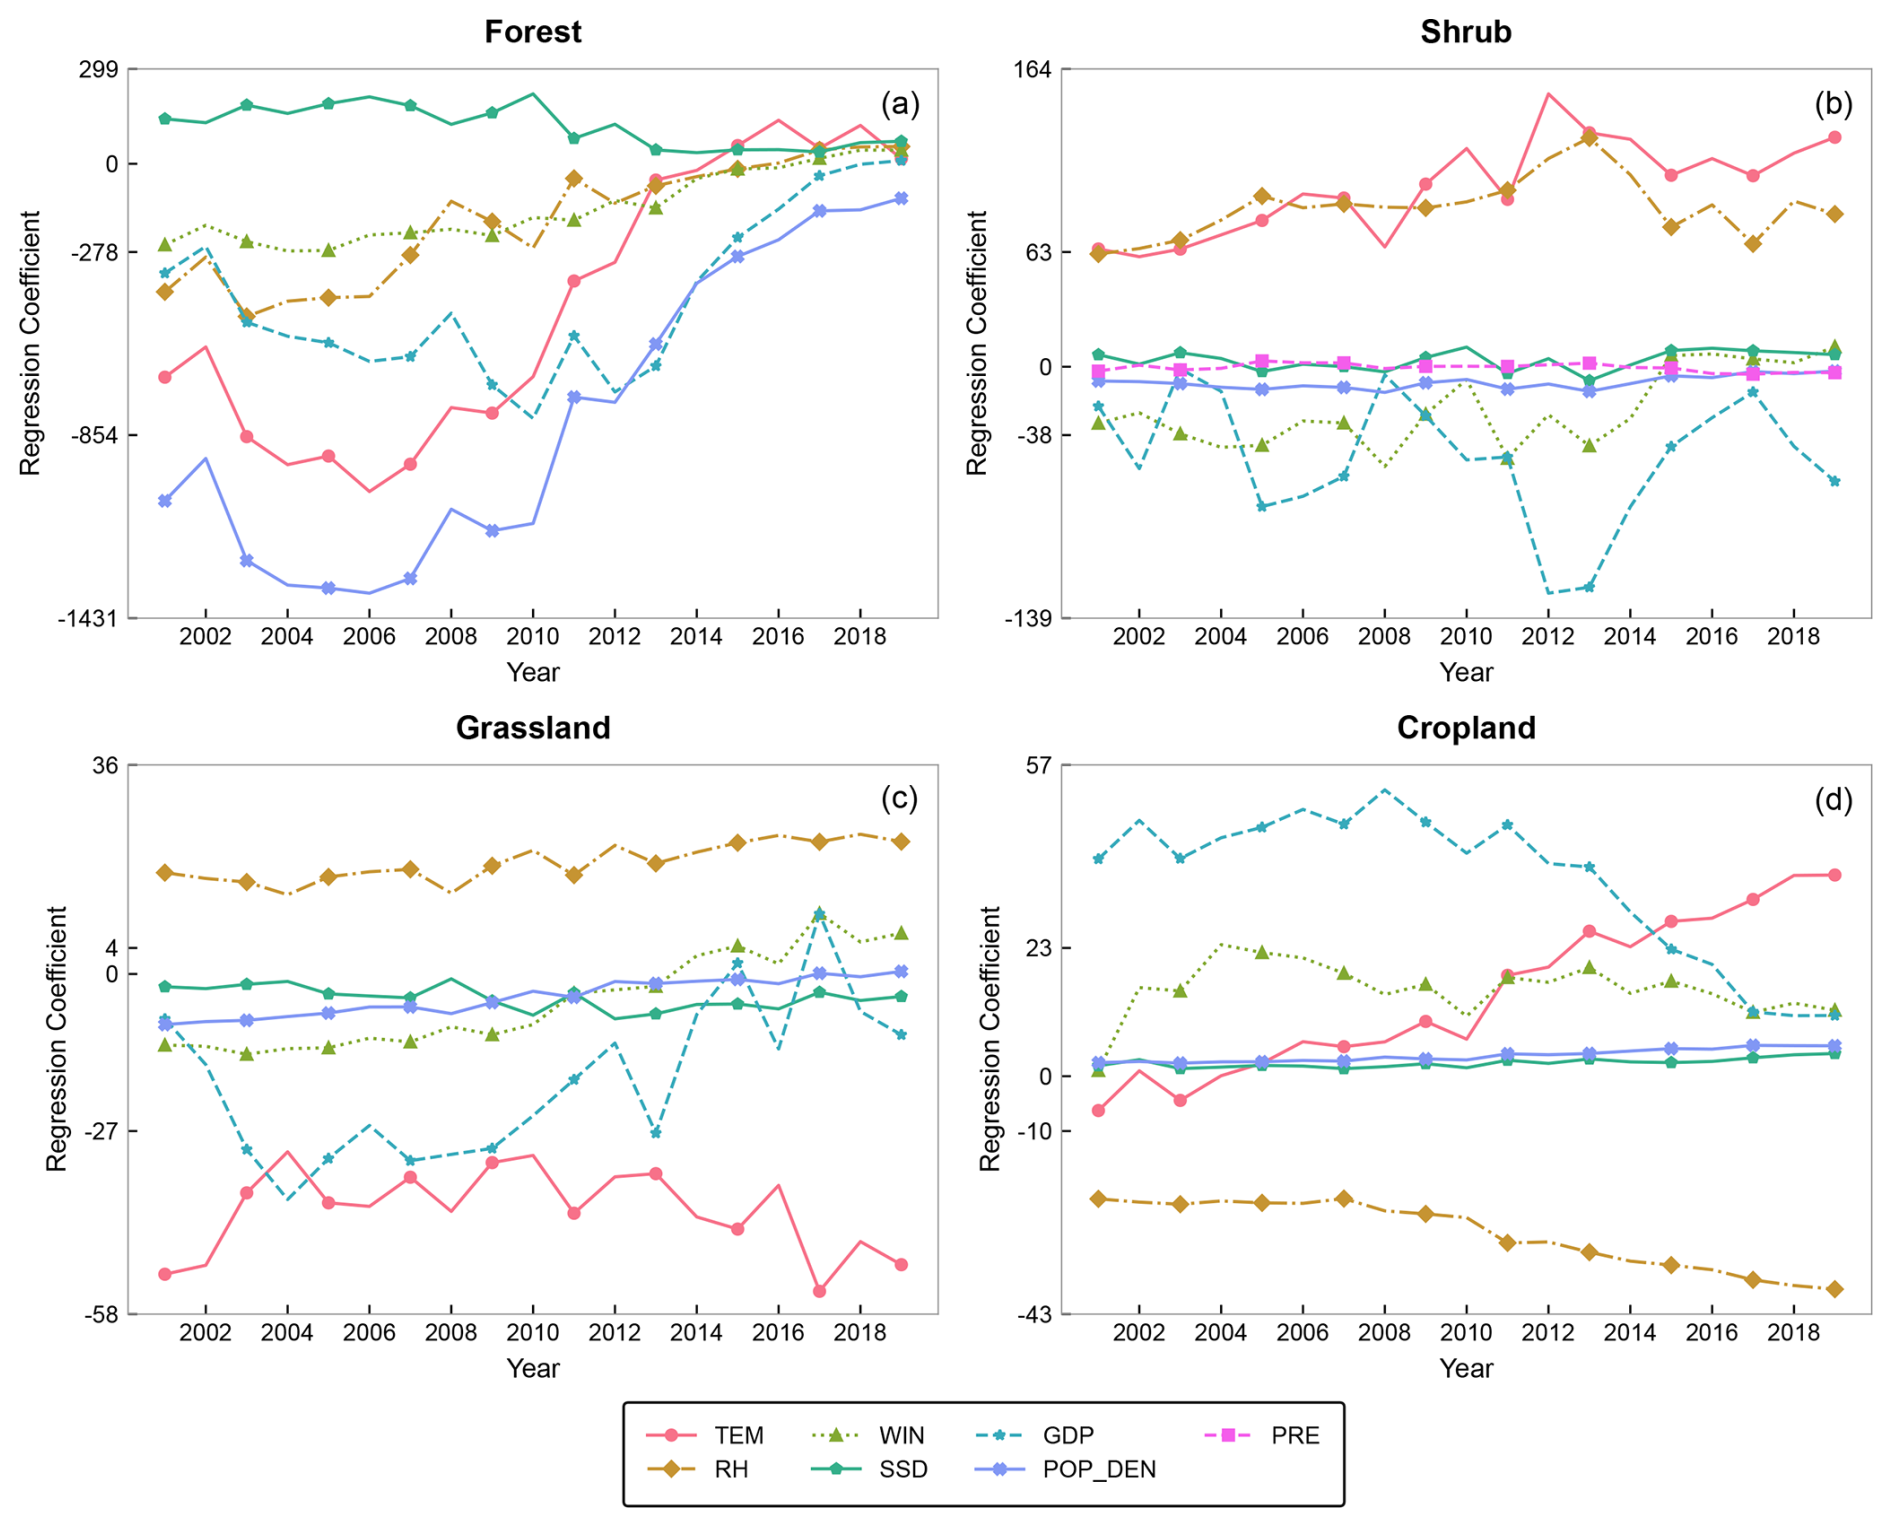
Figure 8Temporal evolution of GTWR regression coefficients for wildfire CO2 emissions across four vegetation cover types in China (2001–2019). Positive and negative values indicate the direction and magnitude of each variable's influence on CO2 emissions.
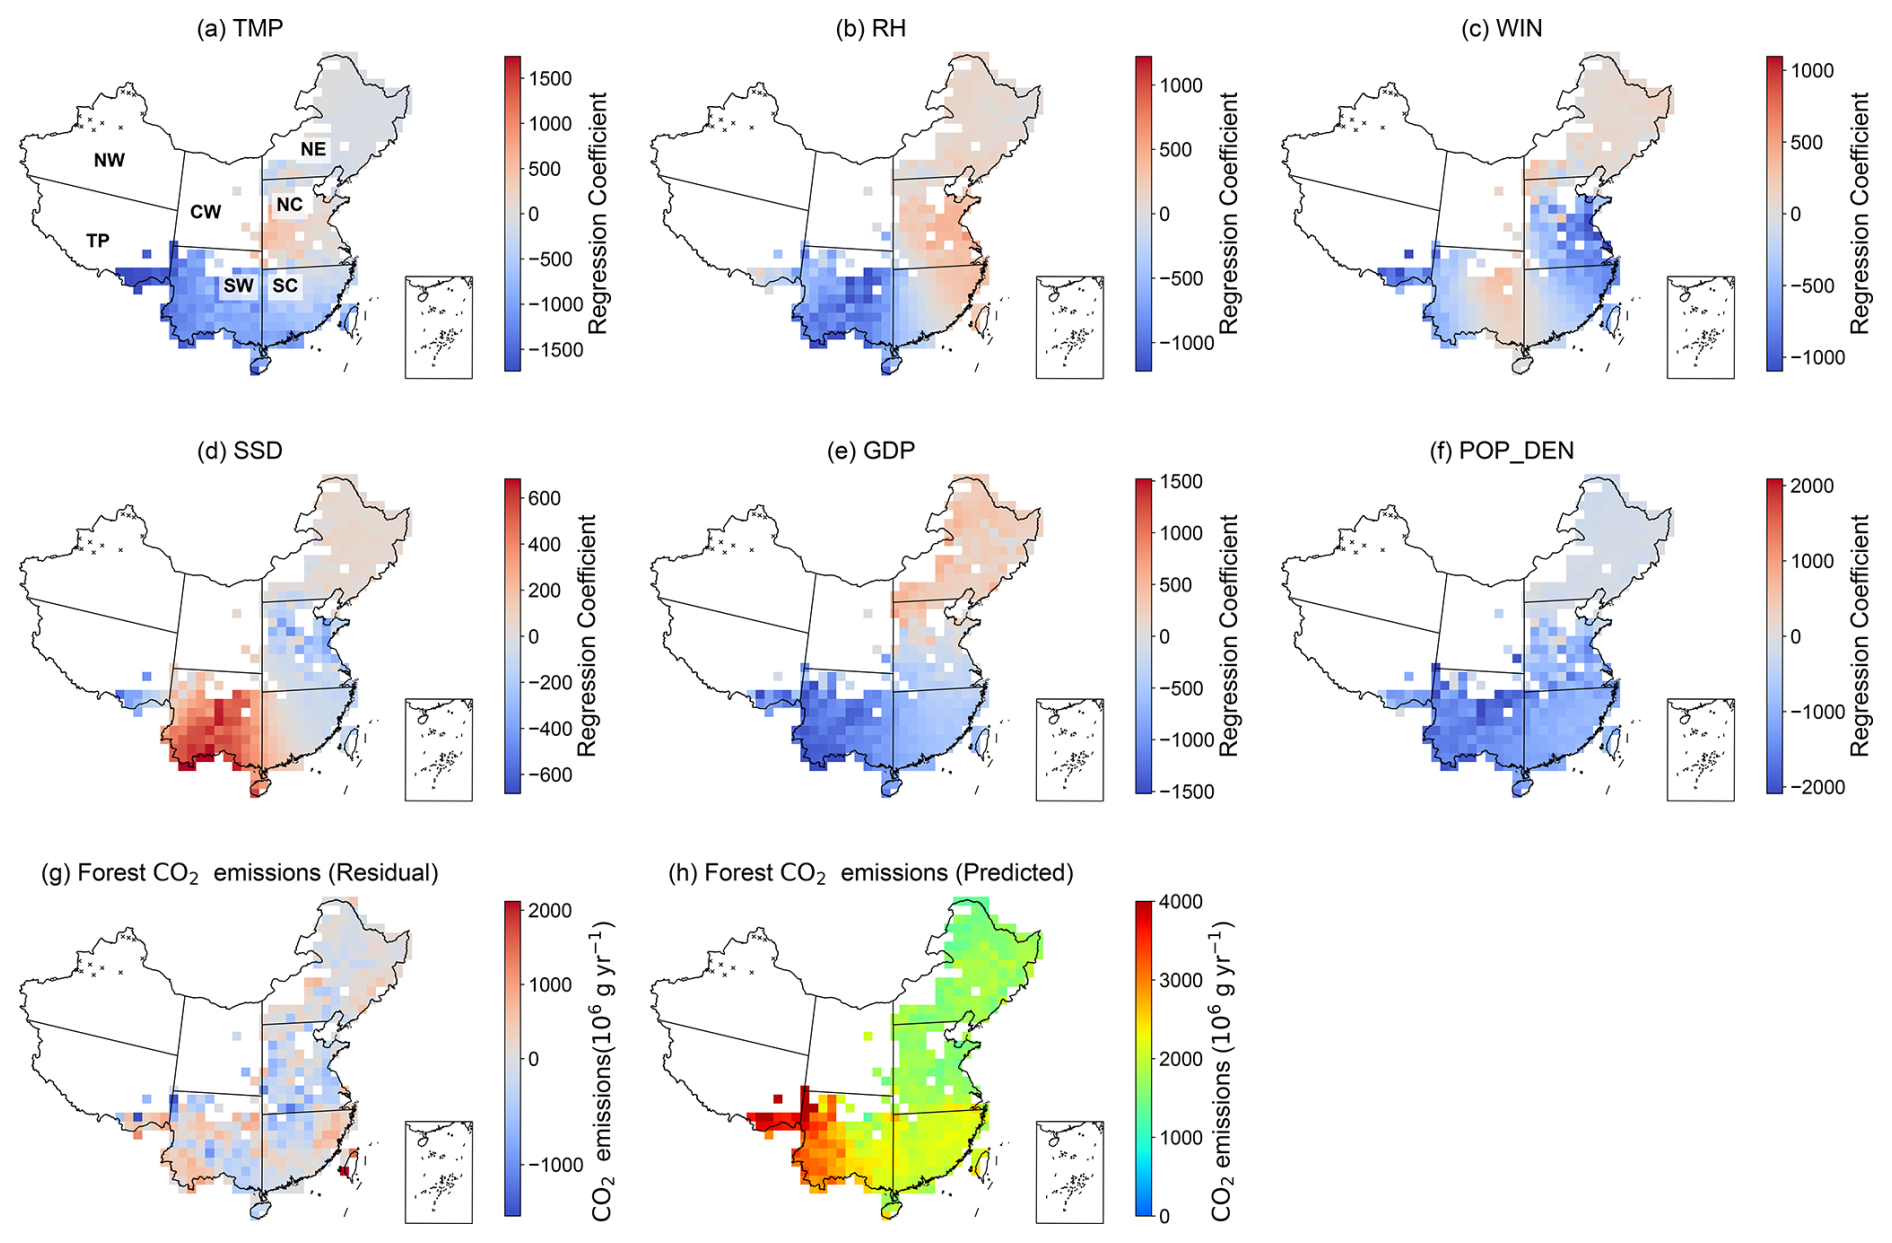
Figure 9Spatial distribution of GTWR regression coefficients for forest fire CO2 emissions and their driving factors across China. The maps illustrate GTWR coefficients of six environmental and socioeconomic variables: (a) temperature, (b) relative humidity, (c) wind speed, (d) daily cumulative sunshine hours, (e) gross domestic product (GDP), and (f) population density. Gray regions represent areas where the intercept was zero (i.e., no valid model fit), and black × symbols mark locations where the regression coefficients did not pass the significance test (p≥ 0.05). Figures (g) and (h) show the model residuals and predicted forest CO2 emissions.
Shrub fire CO2 emissions were well captured by GWR and GTWR, dominated by spatial heterogeneity with minimal temporal variation (Table 3). GTWR showed that TMP and RH were consistent positive drivers throughout the study period, while GDP and WIN had negative effects, with other variables exerting minor influences (Fig. 8b). Spatially, TMP showed a positive effect across most regions (Fig. 10a). RH showed significant positive local effects in the NC region, reflecting that humid climates promoted shrub growth and fuel accumulation (Fig. 10c) (Lian et al., 2024b; Liu et al., 2024). Once ignited by human activity or spring droughts, abundant fuel intensified fire severity and CO2 emissions. In contrast, WIN and GDP exerted strong negative effects in parts of NC, likely due to effective fire control practices (Fig. 10d and f). Notably, a considerable number of grid cells along the northeastern border failed significance tests for at least one explanatory variable (marked as black dots in Fig. 10a–g). This may be due to limited shrub coverage or mixed land types, leading to low fire frequency and weak emission signals (Lin et al., 2025; Yang and Jiang, 2022). Additionally, many of these non-significant grids are located near international borders, particularly adjacent to Russia. Because the GTWR model is limited to Chinese territory, it lacks information on cross-border fire activity, land use, and policy context (Li et al., 2024b; Lin et al., 2025; Quan et al., 2022). In northeastern China, transboundary fire spread is a known ignition source and may contribute to CO2 emissions that are not well explained within national data coverage.
Table 3Comparison of regression results for different fire types using the OLS, GWR, and GTWR models.
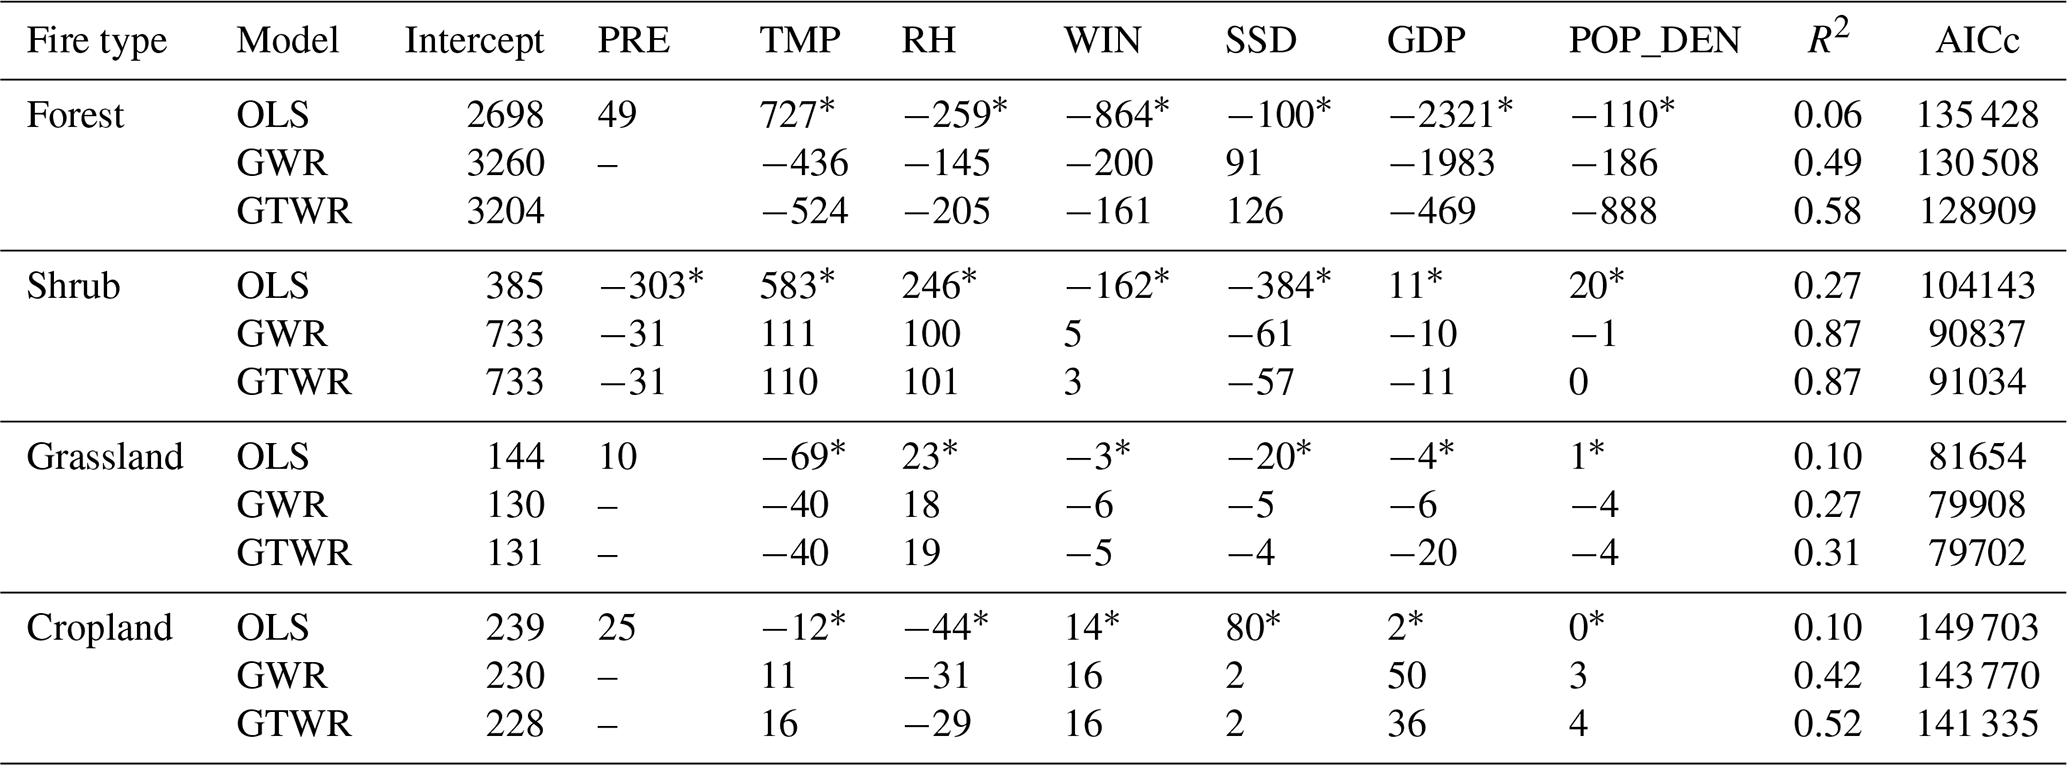
* An asterisk next to a number indicates a statistically significant p value (p < 0.01).
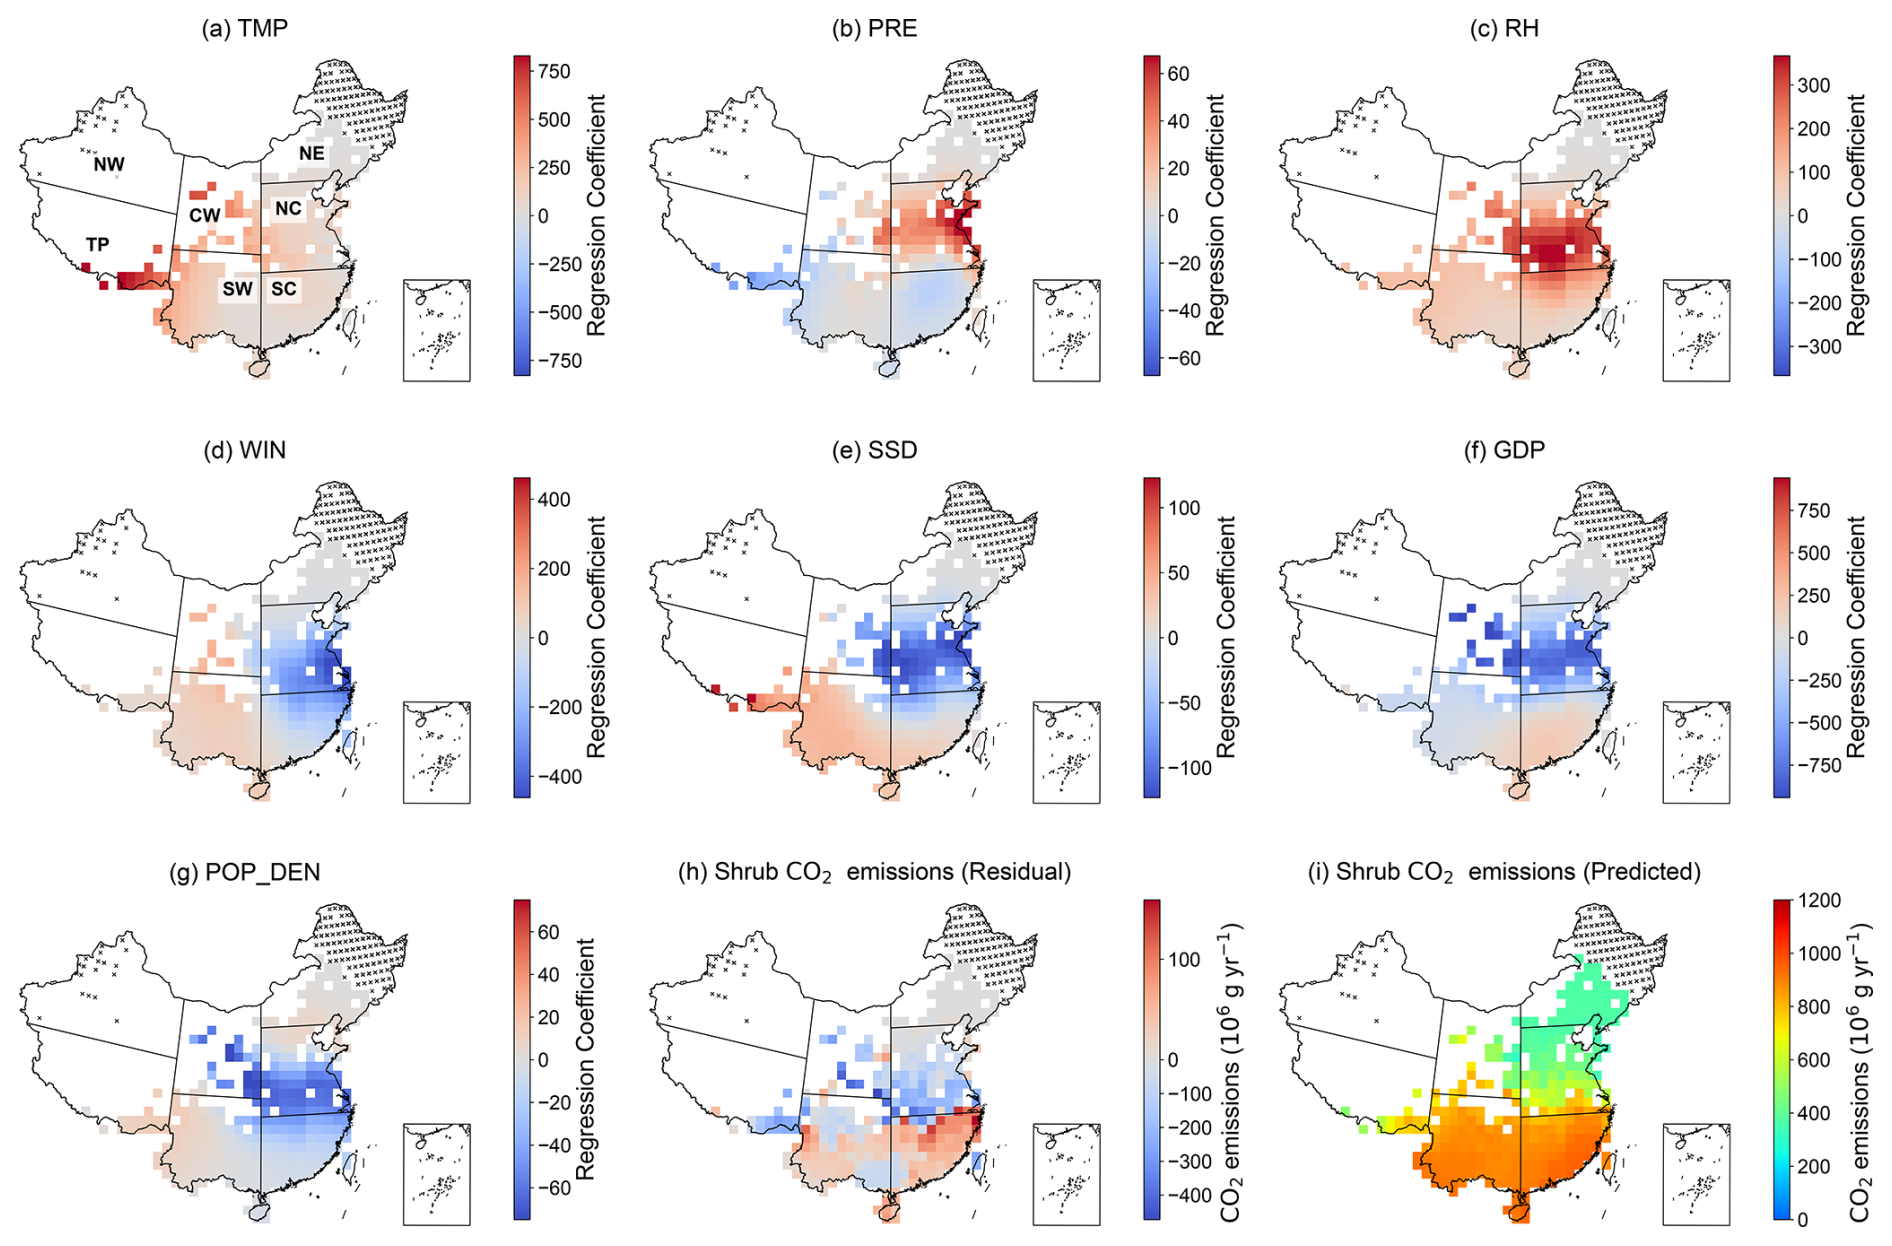
Figure 10Spatial distribution of GTWR regression coefficients for shrub fire CO2 emissions and their driving factors across China. The maps illustrate GTWR coefficients of seven environmental and socioeconomic variables: (a) temperature, (b) precipitation, (c) relative humidity, (d) wind speed, (e) daily cumulative sunshine hours, (f) gross domestic product (GDP), and (g) population density. Gray regions represent areas where the intercept was zero (i.e., no valid model fit), and black × symbols mark locations where the regression coefficients did not pass the significance test (p≥ 0.05). Figures (h) and (i) show the model residuals and predicted shrub CO2 emissions.
From a temporal perspective, the GTWR results for cropland fire CO2 emissions showed that RH had a negative effect, and this negative influence gradually strengthened (Fig. 8d). GDP primarily exhibited a positive effect, but its positive influence gradually weakened. The impact of TMP shifted from negative to positive, with its effect gradually increasing. WIN mainly exerted a positive effect, while other factors had weak influences. Spatially, TMP showed strong positive coefficients in eastern and central China (Fig. 11a). Straw-burning activities in these regions peaked in spring and autumn, a pattern closely linked to rising temperatures. In contrast, negative temperature coefficients in southern and southwestern China suggest that higher temperatures in these regions, often accompanied by high humidity or stricter fire regulations, may suppress fire activity. RH exhibited a significant negative effect across most parts of China, likely due to increased moisture content in agricultural residues, which hinders ignition and combustion (Fig. 11b). WIN showed a positive influence in the CW, NC, and SC regions, where expansive cropland areas may enable wind to accelerate fire spread during burning events (Fig. 11c). GDP mainly showed positive effects, but after 2010, this gradually weakened (Figs. 11e and 8d). This trend may be attributed to increased straw production driven by agricultural expansion in economically developed regions, where straw utilization infrastructure had not yet caught up, resulting in elevated emissions. Early GDP growth likely brought more crop yields and straw generation, thereby enhancing CO2 emissions (Ren et al., 2019). However, after 2012, this trend reversed as nationwide straw-burning bans were introduced. Regions with higher economic development began to demonstrate stronger emission control capacity, leading to a gradual weakening of GDP's positive effect on emissions (Zeng et al., 2024).
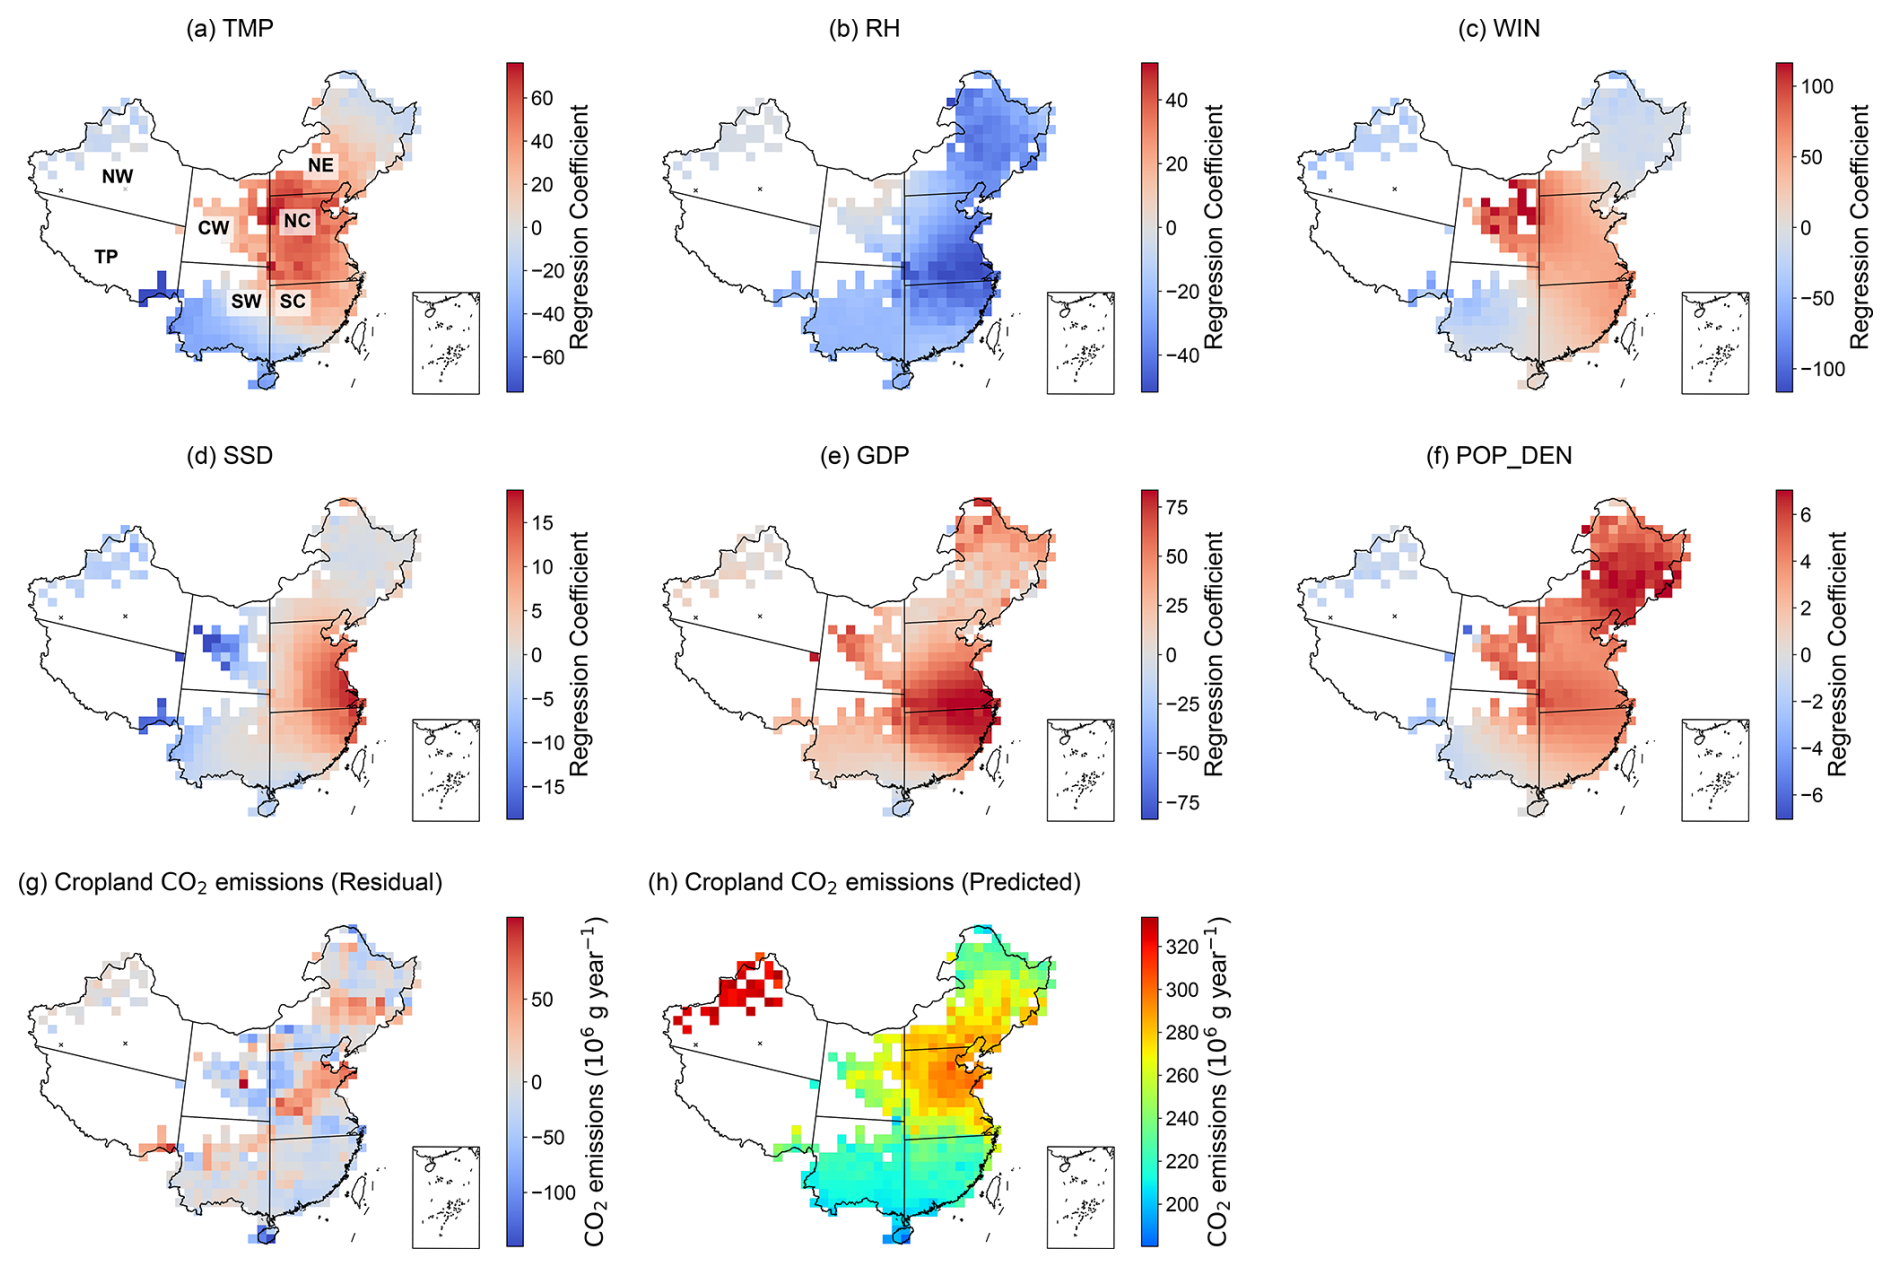
Figure 11Spatial distribution of GTWR regression coefficients for cropland fire CO2 emissions and their driving factors across China. The maps illustrate GTWR coefficients of six environmental and socioeconomic variables: (a) temperature, (b) relative humidity, (c) wind speed, (d) daily cumulative sunshine hours, (e) gross domestic product (GDP), and (f) population density. Gray regions represent areas where the intercept was zero (i.e., no valid model fit), and black × symbols mark locations where the regression coefficients did not pass the significance test (p≥ 0.05). Figures (g) and (h) show the model residuals and predicted cropland CO2 emissions.
Although the GTWR model indicated that climatic and socioeconomic variables such as TMP, RH, and GDP explained the spatial variation in wildfire CO2 emissions, the overall model performance remains moderate for forest and shrub fires, with particularly low explanatory ability for grassland fires (R2= 0.31). This gap suggests that, beyond natural and socioeconomic factors, other key drivers may have been omitted. Multiple studies (Gao et al., 2023; Kelly et al., 2013; Phillips et al., 2022; Xie et al., 2020) highlight the substantial impact of fire management policies on CO2 emissions. For instance, Phillips et al. (2022) showed that the marginal abatement cost of avoiding fire-related CO2 emissions through fire management is comparable to or even lower than that of many other climate mitigation strategies.
In China, the role of policy is particularly significant. Wu et al. (2018) reviewed 51 crop straw management regulations issued between 1965 and 2015, with 34 implemented after 2008. The timing of these intensive regulatory efforts closely aligns with key turning points in emission trends (Fig. 12). For cropland fires, annual CO2 emissions increased from 8.2 Tg yr−1 during 2001–2005 to 26.2 Tg yr−1 during 2010–2016 but began to decline following the revision of the Air Pollution Prevention and Control Law in 2015 and the launch of the Air Pollution Action Plan in 2013. Similarly, after the implementation of the National Forest Fire Prevention Plans in 2009 and 2016, CO2 emissions from forest, shrub, and grassland fires dropped from 38.1 Tg yr−1 (2006–2009) to 13.3 Tg yr−1 (2017–2022). Jin et al. (2022) further estimated that over 80 % of wildfire-related CO2 emissions could be avoided under effective fire management. These findings strongly indicate that policy management plays a critical role in wildfire CO2 emissions.
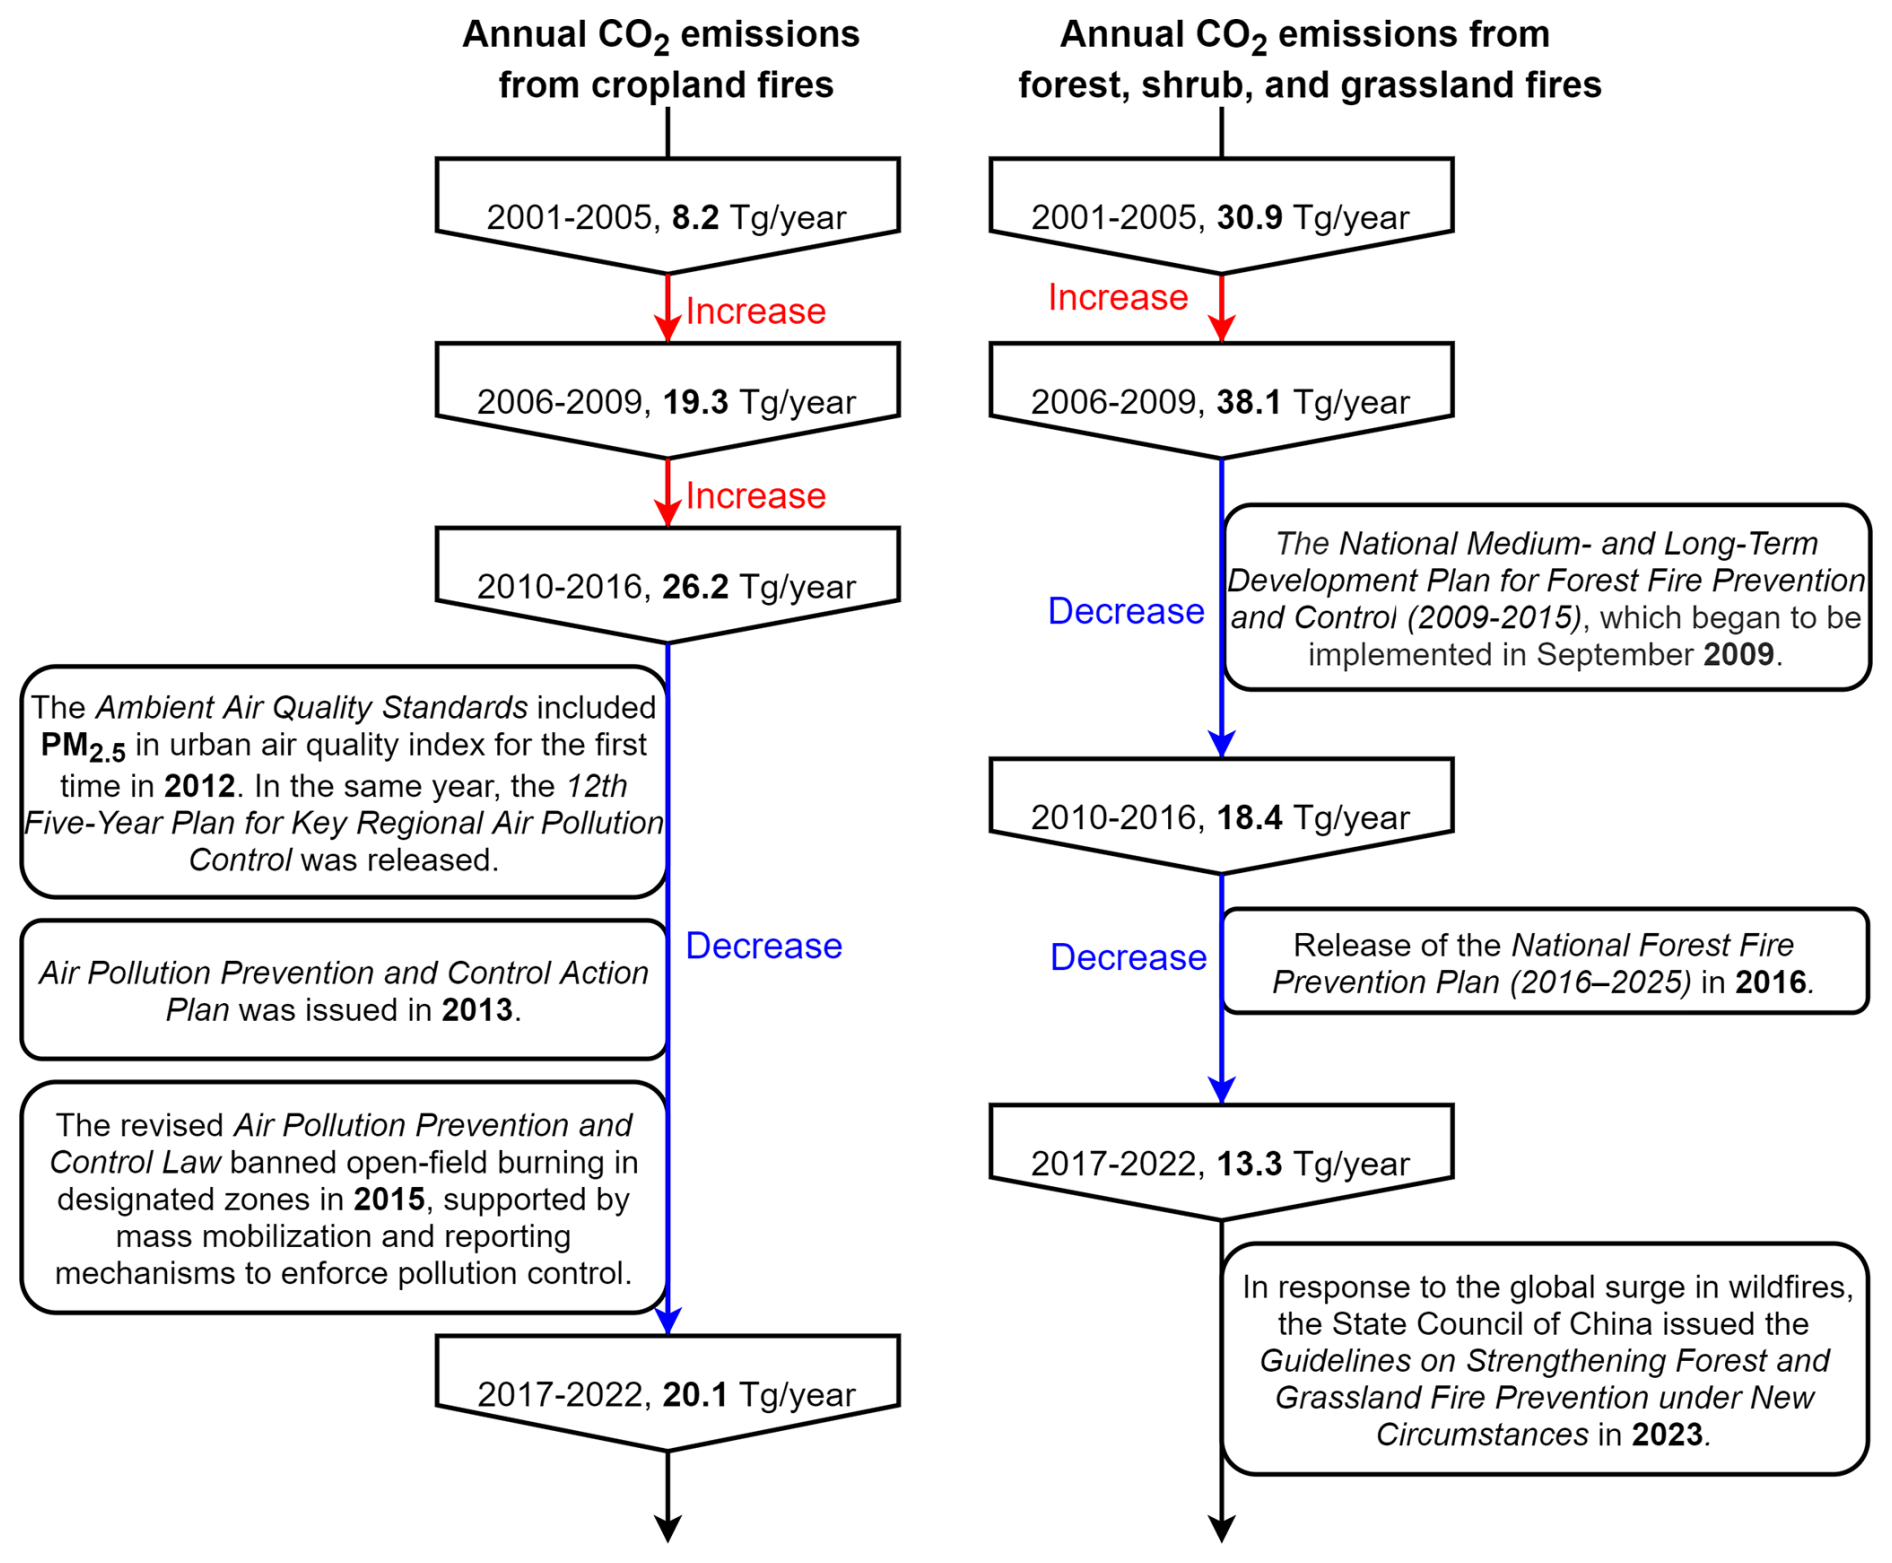
Figure 12Temporal trends in annual CO2 emissions from cropland burning and forest, shrub, and grassland fires in China (2001–2022), and key national policy milestones related to fire and air pollution control.
Notably, northeastern China is the only region where cropland burning has increased in recent years, highlighting the need for adaptive rather than restrictive policies. As one of China's major grain-producing regions, Northeast China generates large volumes of straw. Harsh winters and short windows for straw return or removal, combined with long-established farming practices, have made complete bans on straw burning particularly challenging. Prior to strict open-burning prohibitions, farmers often burned straw in a dispersed, low-intensity manner, making detection by satellite-based fire products difficult, potentially resulting in systematic underestimation of early emissions. After the implementation of strict bans, facing growing pressure from unprocessed straw accumulation, some local governments adopted more adaptive fire management policies, such as designating burning windows under favorable meteorological conditions. These “limited and concentrated burning periods” led to spatiotemporally clustered fire events that were more easily captured by remote sensing. In recent years, the Chinese government has also promoted the scientific incorporation of straw into soils, off-field collection, and the industrial utilization of crop residues in Northeast China. These efforts highlight the significant role of policy in shaping emission trends from agricultural burning, particularly in regions where environmental constraints and traditional farming practices pose unique challenges.
3.5 Uncertainty analysis
A Monte Carlo simulation (100 000 iterations) was conducted to assess the uncertainty in the estimated wildfire CO2 emissions. Monte Carlo simulation is a probabilistic method that generates a large number of possible outcomes based on random sampling from the input parameter distributions, thereby providing a comprehensive assessment of model uncertainty. The uncertainties in emission estimates in this study mainly originated from satellite-derived BA products, AGB, CE, and EF. All parameters, except CE, were assumed to follow normal distributions, as suggested by Zhao et al. (2011). CE values were assigned triangular distributions based on vegetation type, with parameter ranges derived from empirical data and literature sources (Junpen et al., 2020; Mieville et al., 2010; Ping et al., 2021; van Leeuwen et al., 2014; Zhou et al., 2017). For forest and grassland fires, CE was parameterized using the FVC-based empirical relationship proposed by Hély et al. (2003), while fixed CE values were applied to shrub and cropland fires. The coefficients of variation (CVs) of EF were estimated based on the mean and variability summarized from multiple published sources. Monte Carlo simulations showed that CE and EF contributed less to total emission variability compared to BA and AGB.
Among all parameters, BA emerged as the dominant source of uncertainty. However, the uncertainty in data retrieved from satellite products is difficult to quantify (Hoelzemann et al., 2004; Wu et al., 2018). The MCD64A1 product performs reliably in detecting large fires (Giglio et al., 2018), and its CV was adopted from Giglio et al. (2010). Meanwhile, we also recognize that the MODIS MCD64A1 product tends to underestimate small, fragmented, or low-intensity fires. To evaluate and adjust for this underestimation, we conducted a comprehensive comparison using FireCCI51 (250 m resolution), GFED (500 m resolution), the novel 30 m resolution Global Annual Burned Area Map (GABAM, 30 m resolution) (Long et al., 2019), and FINN datasets for the year 2015 (Table S5). The comparison showed that MODIS systematically underestimated burned areas. Despite its higher spatial resolution, GABAM reported smaller cropland fire areas, likely due to its limited temporal resolution. The FINN dataset differed significantly from all other products, with its burned areas generally higher than other data products. Based on these comparisons, we derived a scaling factor (αi) using the FireCCI51 and GFED datasets and applied them to MODIS burned area estimates. On average, this adjustment increased MODIS-based BA estimates by approximately 1.5 times. To further evaluate the representativeness of our correction method, we compared the standard FINN dataset with a revised version, FINN_VIIR, which incorporates VIIRS active fire detection data (375 m resolution). VIIRS is known to better capture small and short-duration fires often missed by MODIS. Our analysis showed that the burned area in FINN_VIIR was approximately 40 % higher than in the standard FINN dataset, which closely aligns with the scaling factor applied in our MODIS-based correction. This consistency provides further support for the effectiveness of our BA adjustment strategy.
AGB is another major contributor to emissions uncertainty. To reflect interannual changes in biomass, we employed the AGB dataset from Su et al. (2016) for the period 2001–2012 and that from Yan et al. (2023) for 2013–2022 to calculate forest fire CO2 emissions. The mean difference between the two datasets was approximately 7 % (100 t ha−1 vs. 107 t ha−1), well within the ±50 % uncertainty range reported by Yan et al. (2023), confirming their compatibility for long-term analysis. For shrub fire CO2 emissions, we employed localized biomass density values from Hu et al. (2006), enhancing the regional representativeness of AGB inputs. For grassland fire CO2 emissions, we used the index model based on the NDVI developed by Gao et al. (2012). We acknowledge that NDVI-based models may underestimate AGB in dense vegetation due to saturation. To address this, we compared the exponential model by Gao et al. (2012) with the saturation-corrected model by Hu et al. (2024) for alpine meadows in China. The mean AGB estimates were 210 g m−2 (Gao et al., 2012) and 214 g m−2 (Hu et al., 2024), with a small difference of 1.9 %, well within the reported uncertainty bounds of both models (±62.5 g m−2 for Gao et al., 2012; ±85 g m−2 for Hu et al., 2024). Given the broader applicability of Gao's model across diverse grassland types (e.g., arid steppe, wetlands, and meadow grasslands), we adopted it for national-scale grassland AGB estimation. For forest, shrub, and grassland fire CO2 emissions, the uncertainty in AGB was derived from values reported in the literature. For cropland fire CO2 emissions, AGB was derived from national statistical records, with CV set at 20 % (Zhou et al., 2017).
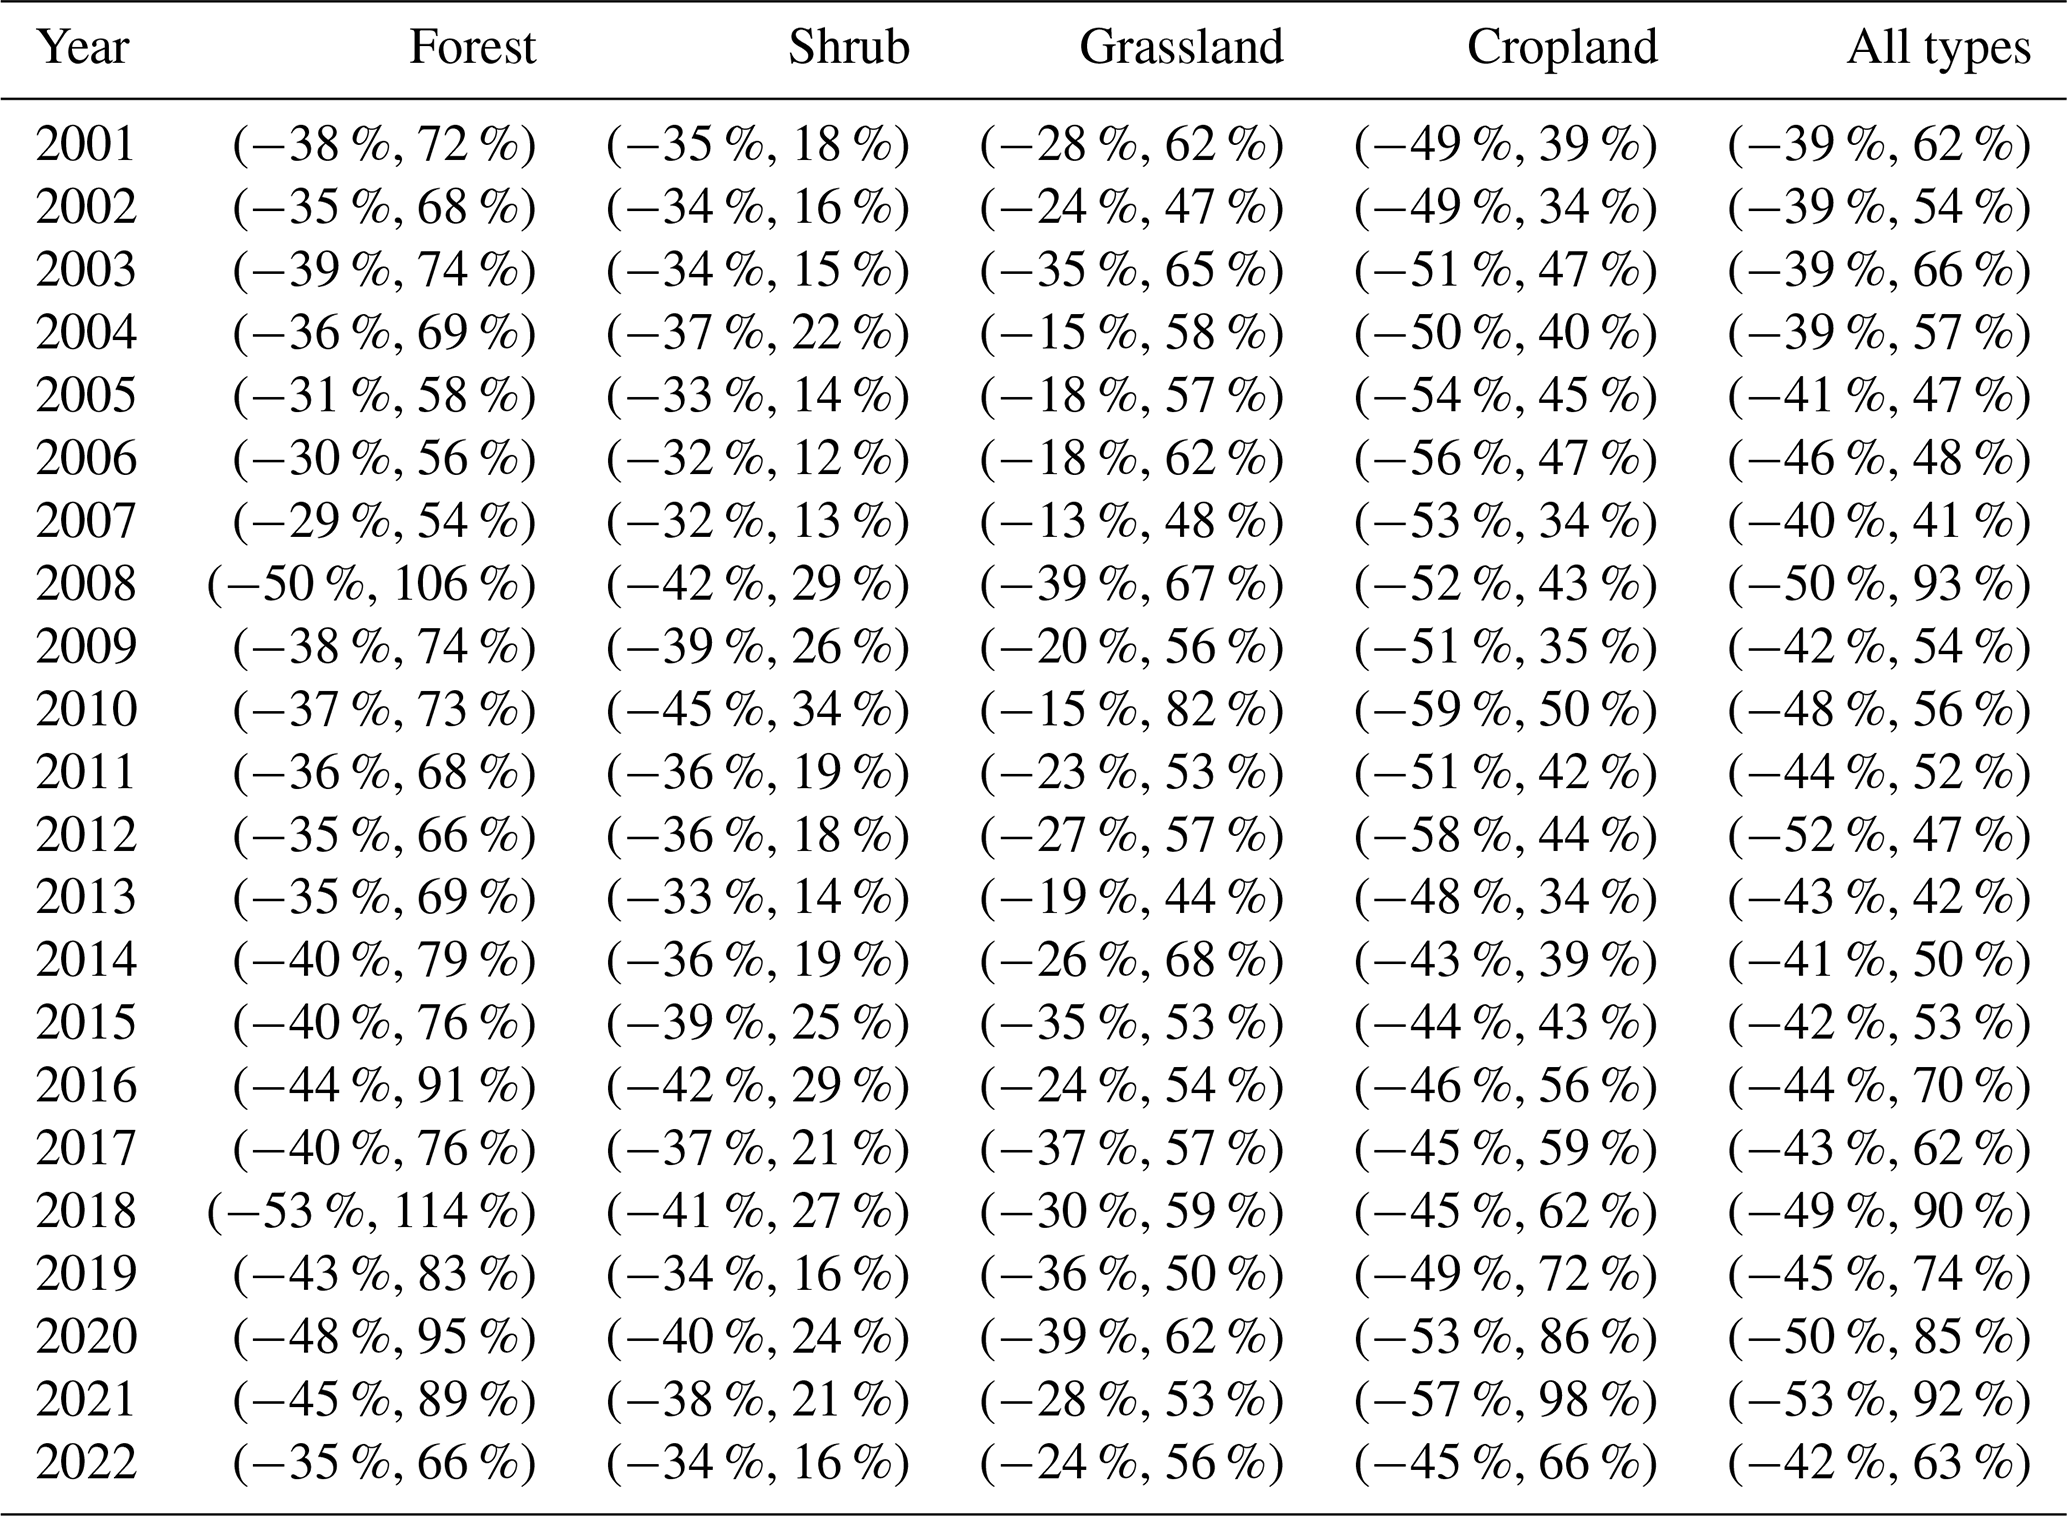
Table 4 presents the total wildfire CO2 emissions and their associated uncertainty ranges across different vegetation cover types. On average, the estimated uncertainties in CO2 emissions were (−39 %, +76 %) for forest fires, (−37 %, +20 %) for shrub fires, (−26 %, +58 %) for grassland fires, and (−50 %, +51 %) for cropland fires. The large uncertainties in forest, shrub, and grassland fire CO2 emissions were mainly due to uncertainties in the AGB and BA estimates. The uncertainty in cropland fire CO2 emissions uncertainty primarily reflected possible under-detection of BA. Despite these uncertainties, this study incorporated multiple BA datasets, multi-temporal vegetation cover datasets, regionally validated AGB estimates, and a comprehensive set of EF, resulting in a spatially representative characterization of wildfire CO2 emissions and their temporal evolution in China.
Table 4The uncertainty estimation of wildfire CO2 emissions from 2001 to 2022.
3.6 Comparison with other studies
We compared the wildfire CO2 emissions estimates in this study with several global biomass burning inventories, including the fire inventory from NCAR (FINN2.5, FINN_VIIRS2.5) (Wiedinmyer et al., 2023); GFED5 (van der Werf et al., 2017), the Global Fire Assimilation System (GFAS version 1.2) (Kaiser et al., 2012), and the Quick Fire Emissions Dataset (QFED version 2.5) (Koster et al., 2015), as shown in Fig. 13. While all inventories exhibited consistent interannual variability, the total emission magnitudes varied substantially. Our estimates were systematically lower than those from most global datasets and were closest to GFASv1.2. FINN2.5 reported the highest values among all inventories, likely due to its use of larger burned area inputs. By incorporating VIIRS active fire detections, FINN_VIIRS2.5 showed approximately 25 % higher emissions than FINN2.5. We applied GFED5 burned area data to adjust the MCD64A1 burned area estimates; however, our emissions remain lower than those from GFED, which may be attributed to differences in biomass assumptions. Biomass input remains a dominant source of uncertainty in fire emissions estimates. QFED2.5 adopted a top-down approach based on fire radiative energy (FRE) and typically yields higher emission estimates (Wiedinmyer et al., 2023; Yin et al., 2019).
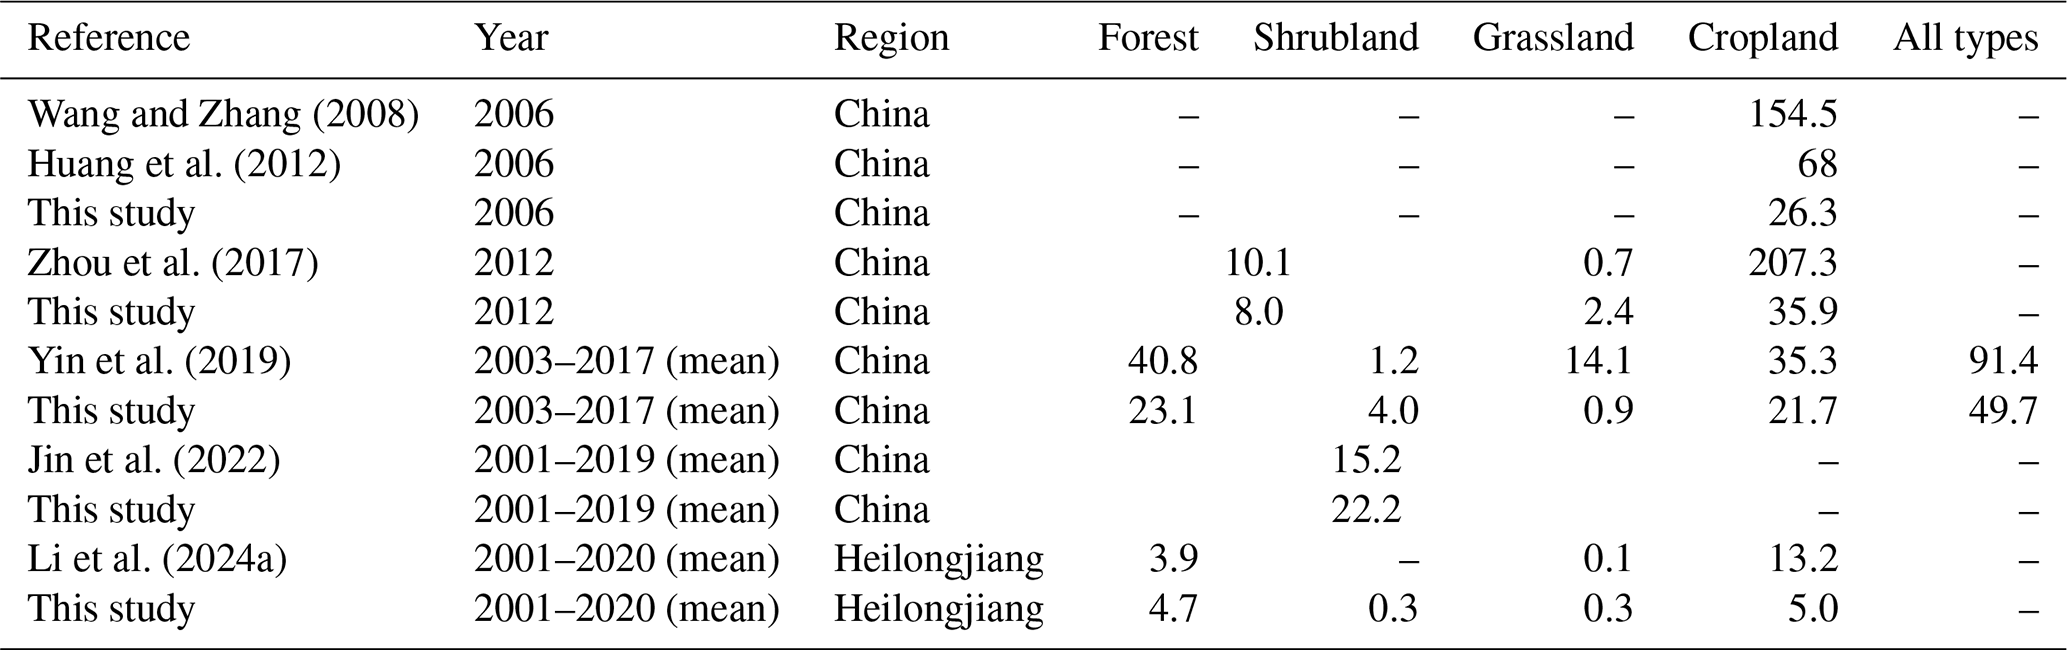
We further compared our estimates with other studies in China (Table 5). For forest, shrub, and grassland fires, our CO2 estimates were comparable to those reported by Zhou et al. (2017) and Li et al. (2024a), slightly higher than those of Jin et al. (2022), and lower than Yin et al. (2019). The lower values in Jin et al. (2022) may result from exclusive reliance on MODIS burned area data, whereas the higher values in Yin et al. (2019) stem from the use of the FRE-based method. Regarding cropland fires, remote sensing often fails to detect small-scale agricultural burning. Consequently, many studies have used statistical data to estimate emissions, based on assumed field residue burning percentages ranging from 10 % to 80 % (Gao et al., 2002; Huang et al., 2012; Li et al., 2024b; Wang and Zhang, 2008; Yan et al., 2006; Yang et al., 2008; Zhou et al., 2017). The cropland fire CO2 emissions estimated by the method based on burning proportion are generally higher than those calculated by the satellite remote sensing monitoring method adopted in this study.
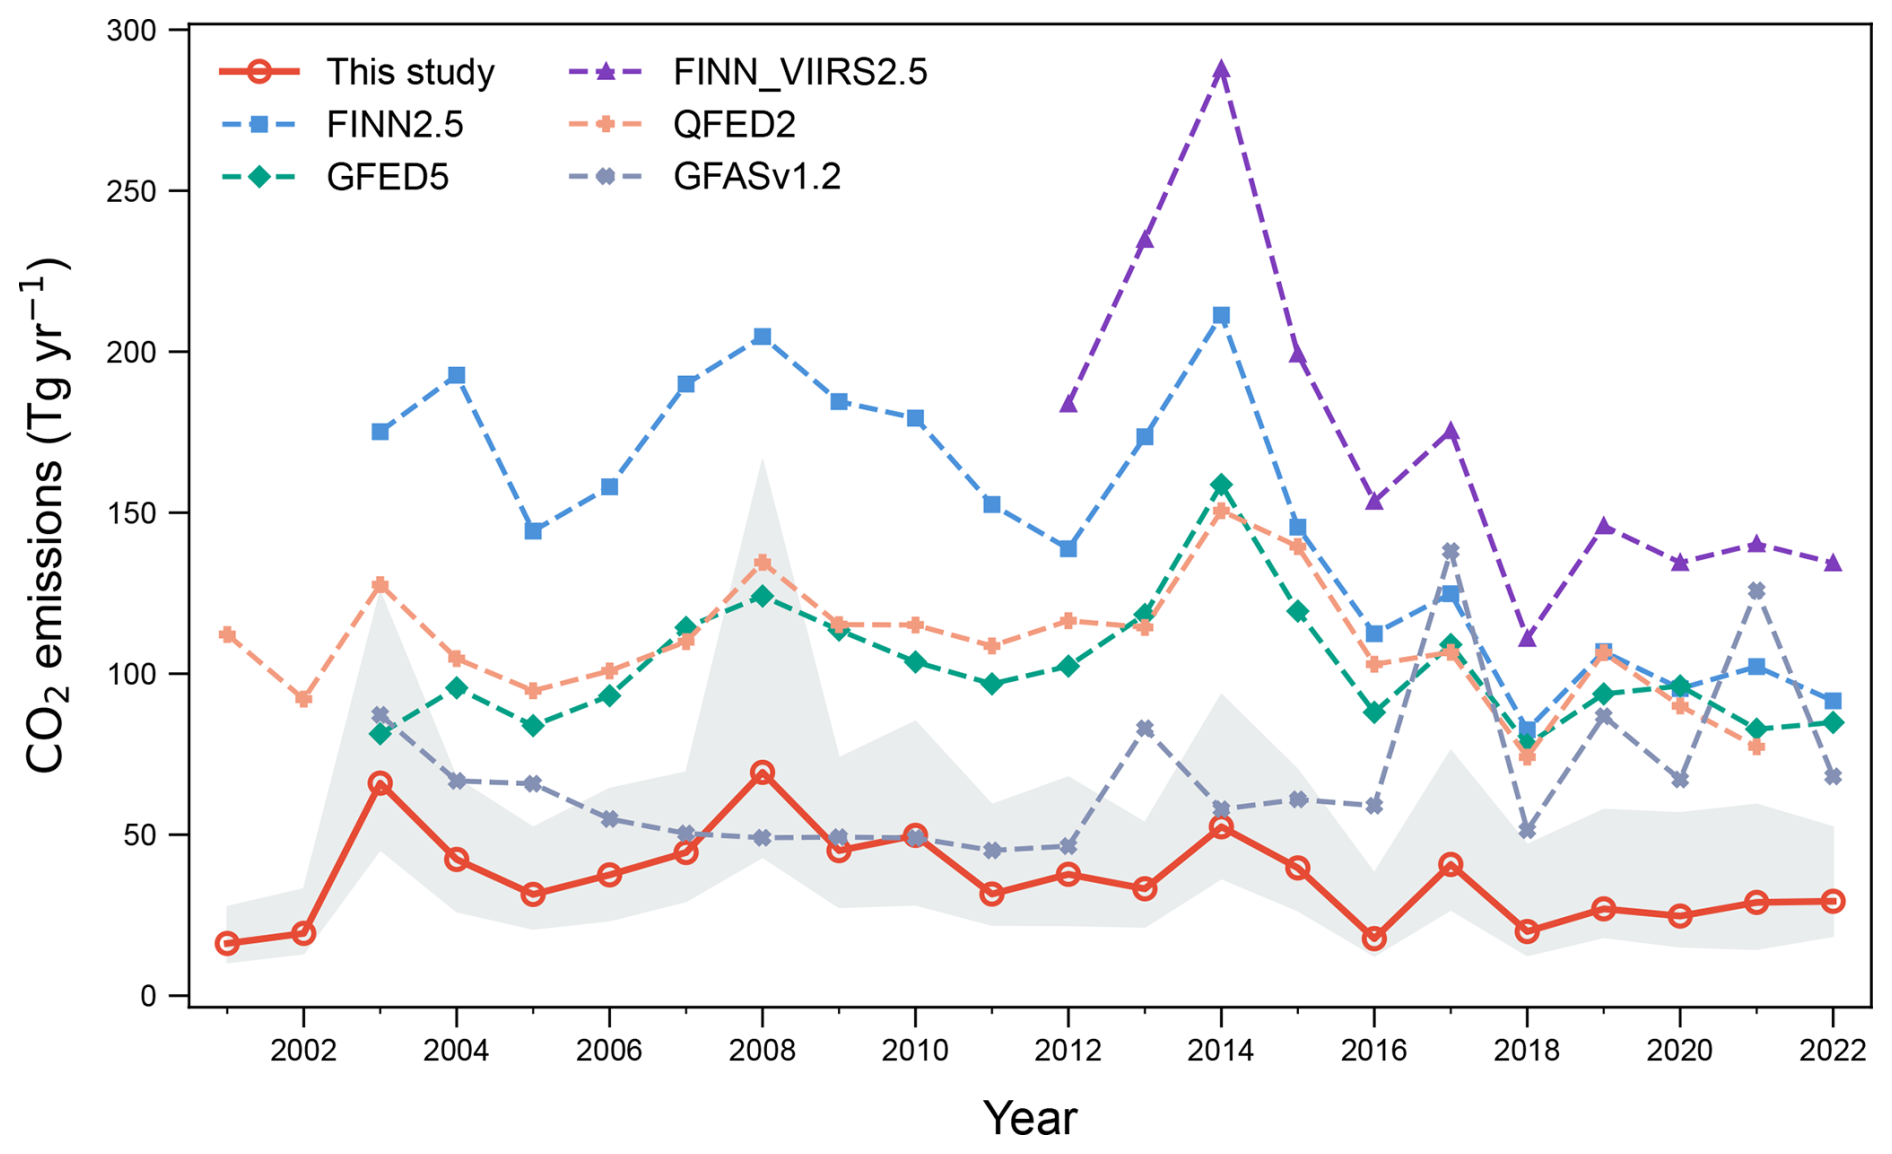
Figure 13Comparison of wildfire CO2 emissions in China from multiple global inventories (2001–2022).
Table 5Comparison of wildfire CO2 emissions estimates in China from previous studies (Tg).
This study developed a comprehensive inventory of wildfire CO2 emissions across China from 2001 to 2022, capturing significant spatiotemporal variations among different vegetation types. Results showed that cropland and forest fires were the primary contributors to national wildfire emissions. Forest and shrub fire CO2 emissions exhibited a declining trend, grassland fire CO2 emissions remained relatively stable, and cropland fire CO2 emissions showed an increasing trend. GTWR analysis revealed that shrub fire CO2 emissions exhibited the highest predictive performance (R2= 0.87), with climatic factors (particularly temperature and humidity) being the main influencing factors, and limited temporal variation. In contrast, forest and cropland fire CO2 emissions were significantly influenced by the spatiotemporal heterogeneity of both climatic and socioeconomic factors. Grassland fire CO2 emissions exhibited the lowest model explanatory power (R2= 0.31), suggesting that their emissions may largely depend on drivers not included in the current model.
Our findings underscore the critical role of policy interventions in shaping wildfire emissions in China. The observed declines in most regions aligned with the implementation of national fire control and air pollution reduction programs. However, northeastern China remained an exception, with cropland fire CO2 emissions continuing to increase in recent years. This trend highlighted the limitations of blanket burning bans and the necessity of adaptive fire management. Although forest fire CO2 emissions had been reduced through strengthened fire prevention measures, northeastern China remained vulnerable to extreme fire events triggered by drought or lightning. Shrub fire CO2 emissions, primarily driven by climatic factors, underscore the importance of strengthening early-warning systems.
Although wildfire emissions are classified as “natural disturbances” under IPCC guidelines for LULUCF and are often excluded from national emission inventories, the results demonstrated that these emissions were substantial and closely tied to policy and land management practices. The pronounced interannual variability and spatial heterogeneity suggested that future climate extremes, land-use changes, or fire policy adjustments could significantly alter regional carbon dynamics.
Compared with global emission inventories (GFED, FINN, QFED, and GFAS), the estimates in this study were generally lower. Although remote sensing data might underestimate some cropland fires, this study characterized wildfire CO2 emissions patterns in China by integrating multi-source burned area products, localized biomass data, and high-resolution land cover classifications. Future research should further refine burned area identification, optimize parameters such as emission factors and combustion efficiency, bridge observational gaps, and incorporate transboundary fire dynamics to ensure more comprehensive and accurate regional emission accounting.
All the data supporting the findings of this paper can be accessed via the provided links or by requesting them using the contact information provided within those links. The China Land Use Land Cover Remote Sensing Monitoring Dataset (CNLUCC) is sourced from the Resource and Environment Science Data Registration and Publishing System (https://www.resdc.cn/, last access: 25 May 2025). China's regional 250 m fractional vegetation cover dataset, China's regional 250 m normalized difference vegetation index dataset, and The Daily Meteorological Dataset of Essential Meteorological Elements of the China National Surface Weather Station (V3.0) are sourced from the National Tibetan Plateau/Third Pole Environment Data Center (https://data.tpdc.ac.cn/, last access: 25 May 2025). MODIS-MCD64A1 burned area data are publicly available at https://lpdaac.usgs.gov/products/mcd64a1v061 (last access: 25 May 2025). A 1 km harvesting area dataset is available at https://doi.org/10.17632/jbs44b2hrk.2 (Luo et al. 2020b). The FireCCI51 burned area product is publicly available from the European Space Agency Climate Change Initiative (ESA CCI) at http://cci.esa.int/data (last access: 25 May 2025). The GFED500 product can be accessed via the GFED website at https://www.globalfiredata.org/ (last access: 25 May 2025). The LandScan 2020 Global Population Database is available at https://landscan.ornl.gov/ (last access: 25 May 2025).
The supplement related to this article is available online at https://doi.org/10.5194/acp-25-10379-2025-supplement.
The article was written with contributions from all the authors. XG and YH designed this study; XG, ZL, JT, and QW collected and organized the data; and XG analyzed the data and wrote the original article with contributions from ZL, YH, GL, and ZA. ZL, JT, and QW assisted with the submission of the article. All the authors have given approval to the final version of the article.
The contact author has declared that none of the authors has any competing interests.
Publisher's note: Copernicus Publications remains neutral with regard to jurisdictional claims made in the text, published maps, institutional affiliations, or any other geographical representation in this paper. While Copernicus Publications makes every effort to include appropriate place names, the final responsibility lies with the authors. Regarding the maps used in this paper, please note that Figs. 1, 4–6, and 9–11 contain disputed territories.
This work was supported by the National Natural Science Foundation of China (grant nos. 42221003 and 41991250) and the Strategic Priority Research Program of the Chinese Academy of Sciences (grant no. XDB40000000).
This paper was edited by Christoph Gerbig and reviewed by five anonymous referees.
Abatzoglou, J. T., Williams, A. P., Boschetti, L., Zubkova, M., and Kolden, C. A.: Global patterns of interannual climate-fire relationships, Glob. Change Biol., 24, 5164–5175, https://doi.org/10.1111/gcb.14405, 2018.
Andreae, M. O. and Merlet, P.: Emission of trace gases and aerosols from biomass burning, Global Biogeochem. Cy., 15, 955–966, https://doi.org/10.1029/2000GB001382, 2001.
Anselin, L.: Local Indicators of Spatial Association – LISA, Geogr. Anal., 27, 93–115, https://doi.org/10.1111/j.1538-4632.1995.tb00338.x, 1995.
Cao, G., Zhang, X., Wang, D., and Zhang, F.: Inventory of atmospheric pollutants discharged from biomass burning in China continent, Chin. Environ. Sci., 25, 389–393, 2005 (in Chinese).
Chang, C., Chang, Y., Xiong, Z., Ping, X., Zhang, H., Guo, M., and Hu, Y.: Predicting Grassland Fire-Occurrence Probability in Inner Mongolia Autonomous Region, China, Remote Sens., 15, 2999, https://doi.org/10.3390/rs15122999, 2023.
Chen, J., Gao, M., Cheng, S., Hou, W., Song, M., Liu, X., and Liu, Y.: Global 1 km × 1 km gridded revised real gross domestic product and electricity consumption during 1992–2019 based on calibrated nighttime light data, Sci. Data, 9, 202, https://doi.org/10.1038/s41597-022-01322-5, 2022.
Chen, Y., Hall, J., van Wees, D., Andela, N., Hantson, S., Giglio, L., van der Werf, G. R., Morton, D. C., and Randerson, J. T.: Multi-decadal trends and variability in burned area from the fifth version of the Global Fire Emissions Database (GFED5), Earth Syst. Sci. Data, 15, 5227–5259, https://doi.org/10.5194/essd-15-5227-2023, 2023.
Chuvieco, E., Cocero, D., Riaño, D., Martin, P., Martıìnez-Vega, J., De La Riva, J., and Pérez, F.: Combining NDVI and surface temperature for the estimation of live fuel moisture content in forest fire danger rating, Remote Sens. Environ., 92, 322–331, https://doi.org/10.1016/j.rse.2004.01.019, 2004.
Chuvieco, E., Mouillot, F., van der Werf, G. R., San Miguel, J., Tanase, M., Koutsias, N., García, M., Yebra, M., Padilla, M., Gitas, I., Heil, A., Hawbaker, T. J., and Giglio, L.: Historical background and current developments for mapping burned area from satellite Earth observation, Remote Sens. Environ., 225, 45–64, https://doi.org/10.1016/j.rse.2019.02.013, 2019.
CMA (China Meteorological Administration): Daily Meteorological Dataset of Essential Meteorological Elements of China National Surface Weather Station (V3.0), China Meteorological Data Service Center, Beijing, China, [data set], http://data.cma.cn, last access: 25 May 2025.
Fang, J., Liu, G., and Xu, S.: Biomass and net production of forest vegetation in China, Acta. Eco. Sin., 16, 497–508, 1996 (in Chinese).
Fang, K., Yao, Q., Guo, Z., Zheng, B., Du, J., Qi, F., Yan, P., Li, J., Ou, T., Liu, J., He, M., and Trouet, V.: ENSO modulates wildfire activity in China, Nat. Commun., 12, 1764, https://doi.org/10.1038/s41467-021-21988-6, 2021.
Gao, J., Chen, Y., Lü, S., Feng, C., Chang, X., Ye, S., and Liu, J.: A ground spectral model for estimating biomass at the peak of the growing season in Hulunbeier grassland, Inner Mongolia, China, Int. J. Remote Sens., 33, 4029–4043, https://doi.org/10.1080/01431161.2011.639401, 2012.
Gao, J., Yang, Y., Wang, H., Wang, P., Li, B., Li, J., Wei, J., Gao, M., and Liao, H.: Climate responses in China to domestic and foreign aerosol changes due to clean air actions during 2013–2019, npj Clim. Atmos. Sci., 6, 160, https://doi.org/10.1038/s41612-023-00488-y, 2023.
Gao, J., Zhang, H., Zhang, W., Chen, X., Shen, W., Xiao, T., Zhang, Y., and Shi, Y.: China regional 250 m fractional vegetation cover data set (2000–2023), TPDC [data set], https://doi.org/10.11888/Terre.tpdc.300330, 2024a.
Gao, J., Zhang, H., Zhang, W., Chen, X., Shen, W., Xiao, T., Zhang, Y., and Shi, Y.: China regional 250m normalized difference vegetation index data set (2000–2023), TPDC [data set], https://doi.org/10.11888/Terre.tpdc.300328, 2024b.
Gao, X., Ma, W., Ma, C., Zhang, F., and Wang, Y.: Analysis on the Current Status of Utilization of Crop Straw in China, J. Huazhong Agric. Univ., 21, 242–247, https://doi.org/10.13300/j.cnki.hnlkxb.2002.03.012, 2002.
Getis, A. and Ord, J. K.: The Analysis of Spatial Association by Use of Distance Statistics, Geogr. Anal., 24, 189–206, https://doi.org/10.1111/j.1538-4632.1992.tb00261.x, 1992.
Giglio, L., Randerson, J. T., van der Werf, G. R., Kasibhatla, P. S., Collatz, G. J., Morton, D. C., and DeFries, R. S.: Assessing variability and long-term trends in burned area by merging multiple satellite fire products, Biogeosciences, 7, 1171–1186, https://doi.org/10.5194/bg-7-1171-2010, 2010.
Giglio, L., Schroeder, W., and Justice, C. O.: The collection 6 MODIS active fire detection algorithm and fire products, Remote Sens. Environ., 178, 31–41, https://doi.org/10.1016/j.rse.2016.02.054, 2016.
Giglio, L., Boschetti, L., Roy, D. P., Humber, M. L., and Justice, C. O.: The Collection 6 MODIS burned area mapping algorithm and product, Remote Sens. Environ., 217, 72–85, https://doi.org/10.1016/j.rse.2018.08.005, 2018.
Han, J., Shen, Z., Li, Y., Luo, C., Xu, Q., Yang, K., and Zhang, Z.: Beta Diversity Patterns of Post-fire Forests in Central Yunnan Plateau, Southwest China: Disturbances Intensify the Priority Effect in the Community Assembly, Front. Plant Sci., 9, 1000, https://doi.org/10.3389/fpls.2018.01000, 2018.
He, M., Wang, X., Han, L., Feng, X., and Mao, X.: Emission Inventory of Crop £Òesidues Field Burning and Its Temporal and Spatial Distribution in Sichuan Province, Environm. Sci., 36, 1208–1215, 2015 (in Chinese).
He, X., Huang, Q., Yang, D., Yang, Y., Xie, G., Yang, S., Liang, C., and Qin, Z.: Spatiotemporal Analysis of Open Biomass Burning in Guangxi Province, China, from 2012 to 2023 Based on VIIRS, Fire, 7, 370, https://doi.org/10.3390/fire7100370, 2024.
Hély, C., Caylor, K., Alleaume, S., Swap, R. J., and Shugart, H. H.: Release of gaseous and particulate carbonaceous compounds from biomass burning during the SAFARI 2000 dry season field campaign, J. Geophys. Res., 108, 8470, https://doi.org/10.1029/2002JD002482, 2003.
Hoelzemann, J. J., Schultz, M. G., Brasseur, G. P., Granier, C., and Simon, M.: Global Wildland Fire Emission Model (GWEM): Evaluating the use of global area burnt satellite data, J. Geophys. Res., 109, 2003JD003666, https://doi.org/10.1029/2003JD003666, 2004.
Hu, H. F., Zhi Heng, W., Guo Hua, L., and Bo Jie, F.: Vegetation carbon storage of major shrublands in China, Chin. J. Plant Ecol., 30, 539–544, https://doi.org/10.17521/cjpe.2006.0071, 2006.
Hu, R., Chen, X., Chen, J., Zhang, S., Kuang, Y., Yu, H., Ji, H., Zhao, X., Yi, S., Meng, B., and Li, M.: MODIS NDVI saturation assessment of alpine meadow grassland biomass estimation using remote sensing: a case study in the eastern edge of the Qinghai-Tibet Plateau, Acta. Eco. Sin., 44, 6357–6372, https://doi.org/10.20103/j.stxb.202310172262, 2024.
Hu, T. and Zhou, G.: Drivers of lightning- and human-caused fire regimes in the Great Xing'an Mountains, Forest Ecol. Manag., 329, 49–58, https://doi.org/10.1016/j.foreco.2014.05.047, 2014.
Huang, B., Wu, B., and Barry, M.: Geographically and temporally weighted regression for modeling spatio-temporal variation in house prices, Int. J. Geogr. Inf. Sci., 24, 383–401, https://doi.org/10.1080/13658810802672469, 2010.
Huang, X., Li, M., Li, J., and Song, Y.: A high-resolution emission inventory of crop burning in fields in China based on MODIS Thermal Anomalies/Fire products, Atmos. Environ., 50, 9–15, https://doi.org/10.1016/j.atmosenv.2012.01.017, 2012.
Hurvich, C. M. and Tsai, C.-L.: Regression and time series model selection in small samples, Biometrika, 76, 297–307, 1989.
Hurvich, C. M., Simonoff, J. S., and Tsai, C.-L.: Smoothing Parameter Selection in Nonparametric Regression Using an Improved Akaike Information Criterion, J. R. Stat. Soc. B., 60, 271–293, https://doi.org/10.1111/1467-9868.00125, 1998.
IPCC: 2019 Refinement to the 2006 IPCC Guidelines for National Greenhouse Gas Inventories. Volume 4: Agriculture, Forestry and Other Land Use, Chapter 2 and Chapter 6, Intergovernmental Panel on Climate Change, https://www.ipcc-nggip.iges.or.jp/public/2019rf/index.html (last access: 21 May 2025), 2019.
Jin, Q., Wang, W., Zheng, W., Innes, J. L., Wang, G., and Guo, F.: Dynamics of pollutant emissions from wildfires in Mainland China, J. Environ. Manage., 318, 115499, https://doi.org/10.1016/j.jenvman.2022.115499, 2022.
Junpen, A., Roemmontri, J., Boonman, A., Cheewaphongphan, P., Thao, P. T. B., and Garivait, S.: Spatial and Temporal Distribution of Biomass Open Burning Emissions in the Greater Mekong Subregion, Climate, 8, 90, https://doi.org/10.3390/cli8080090, 2020.
Kaiser, J. W., Heil, A., Andreae, M. O., Benedetti, A., Chubarova, N., Jones, L., Morcrette, J.-J., Razinger, M., Schultz, M. G., Suttie, M., and van der Werf, G. R.: Biomass burning emissions estimated with a global fire assimilation system based on observed fire radiative power, Biogeosciences, 9, 527–554, https://doi.org/10.5194/bg-9-527-2012, 2012.
Kasischke, E. S., Christensen, N. L., and Stocks, B. J.: Fire, Global Warming, and the Carbon Balance of Boreal Forests, Ecol. Appl., 5, 437–451, https://doi.org/10.2307/1942034, 1995.
Kelly, R., Chipman, M. L., Higuera, P. E., Stefanova, I., Brubaker, L. B., and Hu, F. S.: Recent burning of boreal forests exceeds fire regime limits of the past 10 000 years, P. Natl. Acad. Sci. USA., 110, 13055–13060, https://doi.org/10.1073/pnas.1305069110, 2013.
Koster, R. D., Darmenov, A. S., and da Silva, A. M.: The Quick Fire Emissions Dataset (QFED): Documentation of Versions 2.1, 2.2 and 2.4, NASA/TM–2015–104606, NASA, 38, https://ntrs.nasa.gov/citations/20180005253 (last access: 3 September 2025), 2015.
Lan, Z., Su, Z., Guo, M., C. Alvarado, E., Guo, F., Hu, H., and Wang, G.: Are Climate Factors Driving the Contemporary Wildfire Occurrence in China?, Forests, 12, 392, https://doi.org/10.3390/f12040392, 2021.
Langenfelds, R. L., Francey, R. J., Pak, B. C., Steele, L. P., Lloyd, J., Trudinger, C. M., and Allison, C. E.: Interannual growth rate variations of atmospheric CO2 and its δ13C, H2, CH4, and CO between 1992 and 1999 linked to biomass burning, Global Biogeochem. Cy., 16, https://doi.org/10.1029/2001GB001466, 2002.
Lasslop, G., Hantson, S., Harrison, S. P., Bachelet, D., Burton, C., Forkel, M., Forrest, M., Li, F., Melton, J. R., Yue, C., Archibald, S., Scheiter, S., Arneth, A., Hickler, T., and Sitch, S.: Global ecosystems and fire: Multi-model assessment of fire-induced tree-cover and carbon storage reduction, Glob. Change Biol., 26, 5027–5041, https://doi.org/10.1111/gcb.15160, 2020.
Lebakula, V., Sims, K., Reith, A., Rose, A., McKee, J., Coleman, P., Kaufman, J., Urban, M., Jochem, C., Whitlock, C., Ogden, M., Pyle, J., Roddy, D., Epting, J., and Bright, E.: LandScan Global 30 Arcsecond Annual Global Gridded Population Datasets from 2000 to 2022, Sci Data, 12, 495, https://doi.org/10.1038/s41597-025-04817-z, 2025.
Li, B., Xu, Z., Liu, B., Zhang, Z., Qiu, W., and Wang, W.: Development of a finer-resolution multi-year emission inventory for open biomass burning in Heilongjiang Province, China, Sci. Rep., 14, 29969, https://doi.org/10.1038/s41598-024-81092-9, 2024a.
Li, M., Wu, Y., Liu, Y., Zhang, Y., and Yu, Q.: Study on the Driving Factors of the Spatiotemporal Pattern in Forest Lightning Fires and 3D Fire Simulation Based on Cellular Automata, Forests, 15, 1857, https://doi.org/10.3390/f15111857, 2024b.
Li, Y., Zhao, J., Guo, X., Zhang, Z., Tan, G., and Yang, J.: The Influence of Land Use on the Grassland Fire Occurrence in the Northeastern Inner Mongolia Autonomous Region, China, Sensors, 17, 437, https://doi.org/10.3390/s17030437, 2017.
Lian, C., Xiao, C., Feng, Z., and Ma, Q.: Accelerating decline of wildfires in China in the 21st century, Front. For. Glob. Change, 6, 1252587, https://doi.org/10.3389/ffgc.2023.1252587, 2024a.
Lian, C., Feng, Z., Gu, H., and Gao, B.: Disentangling the Roles of Climate Variables in Forest Fire Occurrences in China, Remote Sens., 17, 88, https://doi.org/10.3390/rs17010088, 2024b.
Lin, Z., Huang, L., Tian, H., Chen, A., and Wang, X.: China Wildfire Emission Dataset (ChinaWED v1) for the period 2012–2022, Geosci. Model Dev., 18, 2509–2520, https://doi.org/10.5194/gmd-18-2509-2025, 2025.
Liu, Y., Chen, J., Shi, Y., Zheng, W., Shan, T., and Wang, G.: Global Emissions Inventory from Open Biomass Burning (GEIOBB): utilizing Fengyun-3D global fire spot monitoring data, Earth Syst. Sci. Data, 16, 3495–3515, https://doi.org/10.5194/essd-16-3495-2024, 2024.
Lizundia-Loiola, J., Otón, G., Ramo, R., and Chuvieco, E.: A spatio-temporal active-fire clustering approach for global burned area mapping at 250 m from MODIS data, Remote Sens. Environ., 236, 111493, https://doi.org/10.1016/j.rse.2019.111493, 2020.
Long, T., Zhang, Z., He, G., Jiao, W., Tang, C., Wu, B., Zhang, X., Wang, G., and Yin, R.: 30 m Resolution Global Annual Burned Area Mapping Based on Landsat Images and Google Earth Engine, Remote Sens., 11, 489, https://doi.org/10.3390/rs11050489, 2019.
Lü, A., Tian, H., Liu, M., Liu, J., and Melillo, J. M.: Spatial and temporal patterns of carbon emissions from forest fires in China from 1950 to 2000, J. Geophys. Res., 111, D05313, https://doi.org/10.1029/2005JD006198, 2006.
Luo, Y., Zhang, Z., Li, Z., Chen, Y., Zhang, L., Cao, J., and Tao, F.: Identifying the spatiotemporal changes of annual harvesting areas for three staple crops in China by integrating multi-data sources, Environ. Res. Lett., 15, 074003, https://doi.org/10.1088/1748-9326/ab80f0, 2020a.
Luo, Y., Zhang, Z., Li, Z., Chen, Y., Zhang, L., Cao, J., and Tao, F.: Data for: Identifying the spatiotemporal changes of annual harvesting areas for three staple crops in China by integrating multi-data sources, V2, Mendeley Data [data set], https://doi.org/10.17632/jbs44b2hrk.2, 2020b.
Ma, W., Feng, Z., Cheng, Z., Chen, S., and Wang, F.: Identifying Forest Fire Driving Factors and Related Impacts in China Using Random Forest Algorithm, Forests, 11, 507, https://doi.org/10.3390/f11050507, 2020.
McGuire, A. D., Sitch, S., Clein, J. S., Dargaville, R., Esser, G., Foley, J., Heimann, M., Joos, F., Kaplan, J., Kicklighter, D. W., Meier, R. A., Melillo, J. M., Moore, B., Prentice, I. C., Ramankutty, N., Reichenau, T., Schloss, A., Tian, H., Williams, L. J., and Wittenberg, U.: Carbon balance of the terrestrial biosphere in the Twentieth Century: Analyses of CO2, climate, and land use effects with four process-based ecosystem models, Global Biogeochem. Cy., 15, 183–206, https://doi.org/10.1029/2000GB001298, 2001.
Mieville, A., Granier, C., Liousse, C., Guillaume, B., Mouillot, F., Lamarque, J.-F., Grégoire, J.-M., and Pétron, G.: Emissions of gases and particles from biomass burning during the 20th century using satellite data and an historical reconstruction, Atmos. Environ., 44, 1469–1477, https://doi.org/10.1016/j.atmosenv.2010.01.011, 2010.
Moran, P. A. P.: The Interpretation of Statistical Maps, J. Roy. Stat. Soc. B Met., 10, 243–251, https://doi.org/10.1111/j.2517-6161.1948.tb00012.x, 1948.
NBSC (National Bureau of Statistics of China): China Statistical Yearbook 2001–2022, China Statistics Press, Beijing, https://www.stats.gov.cn/sj/ndsj/ (last access: 21 May 2025), 2001–2022 (in Chinese).
Our World in Data: CO2 emissions from wildfires, Our World in Data, https://ourworldindata.org/wildfires, last access: 21 May 2025.
Phillips, C. A., Rogers, B. M., Elder, M., Cooperdock, S., Moubarak, M., Randerson, J. T., and Frumhoff, P. C.: Escalating carbon emissions from North American boreal forest wildfires and the climate mitigation potential of fire management, Sci. Adv., 8, eabl7161, https://doi.org/10.1126/sciadv.abl7161, 2022.
Ping, X., Chang, Y., Liu, M., Hu, Y., Yuan, Z., Shi, S., Jia, Y., Li, D., and Yu, L.: Fuel burning efficiency under various fire severities of a boreal forest landscape in north-east China, Int. J. Wildland Fire, 30, 691–701, https://doi.org/10.1071/WF20143, 2021.
Qin, X., Yan, H., Zhan, Z., and Li, Z.: Characterising vegetative biomass burning in China using MODIS data, Int. J. Wildland Fire, 23, 69, https://doi.org/10.1071/WF12163, 2014.
Qiu, X., Duan, L., Chai, F., Wang, S., Yu, Q., and Wang, S.: Deriving High-Resolution Emission Inventory of Open Biomass Burning in China based on Satellite Observations, Environ. Sci. Technol., 50, 11779–11786, https://doi.org/10.1021/acs.est.6b02705, 2016.
Quan, D., Quan, H., Zhu, W., Lin, Z., and Jin, R.: A Comparative Study on the Drivers of Forest Fires in Different Countries in the Cross-Border Area between China, North Korea and Russia, Forests, 13, 1939, https://doi.org/10.3390/f13111939, 2022.
Ren, J., Yu, P., and Xu, X.: Straw Utilization in China-Status and Recommendations, Sustainability, 11, 1762, https://doi.org/10.3390/su11061762, 2019.
Rogelj, J., Popp, A., Calvin, K. V., Luderer, G., Emmerling, J., Gernaat, D., Fujimori, S., Strefler, J., Hasegawa, T., Marangoni, G., Krey, V., Kriegler, E., Riahi, K., Van Vuuren, D. P., Doelman, J., Drouet, L., Edmonds, J., Fricko, O., Harmsen, M., Havlík, P., Humpenöder, F., Stehfest, E., and Tavoni, M.: Scenarios towards limiting global mean temperature increase below 1.5 °C, Nat. Clim. Change, 8, 325–332, https://doi.org/10.1038/s41558-018-0091-3, 2018.
Shiraishi, T., Hirata, R., and Hirano, T.: New Inventories of Global Carbon Dioxide Emissions through Biomass Burning in 2001–2020, Remote Sensing, 13, 1914, https://doi.org/10.3390/rs13101914, 2021.
Streets, D. G., Yarber, K. F., Woo, J.-H., and Carmichael, G. R.: Biomass burning in Asia: Annual and seasonal estimates and atmospheric emissions, Global Biogeochem. Cy., 17, 1099, https://doi.org/10.1029/2003GB002040, 2003.
Su, Y., Guo, Q., Xue, B., Hu, T., Alvarez, O., Tao, S., and Fang, J.: Spatial distribution of forest aboveground biomass in China: Estimation through combination of spaceborne lidar, optical imagery, and forest inventory data, Remote Sens. Environ., 173, 187–199, https://doi.org/10.1016/j.rse.2015.12.002, 2016.
Tian, H., Zhao, D., and Wang, Y.: Emission inventories of atmospheric pollutants discharged from biomass burning in China, Acta Sci. Circumst., 31, 349–357, 2011 (in Chinese).
van der Werf, G. R., Randerson, J. T., Collatz, G. J., Giglio, L., Kasibhatla, P. S., Arellano, A. F., Olsen, S. C., and Kasischke, E. S.: Continental-Scale Partitioning of Fire Emissions During the 1997 to 2001 El Niño/La Niña Period, Science, 303, 73–76, https://doi.org/10.1126/science.1090753, 2004.
van der Werf, G. R., Randerson, J. T., Giglio, L., van Leeuwen, T. T., Chen, Y., Rogers, B. M., Mu, M., van Marle, M. J. E., Morton, D. C., Collatz, G. J., Yokelson, R. J., and Kasibhatla, P. S.: Global fire emissions estimates during 1997–2016, Earth Syst. Sci. Data, 9, 697–720, https://doi.org/10.5194/essd-9-697-2017, 2017.
van Leeuwen, T. T., van der Werf, G. R., Hoffmann, A. A., Detmers, R. G., Rücker, G., French, N. H. F., Archibald, S., Carvalho Jr., J. A., Cook, G. D., de Groot, W. J., Hély, C., Kasischke, E. S., Kloster, S., McCarty, J. L., Pettinari, M. L., Savadogo, P., Alvarado, E. C., Boschetti, L., Manuri, S., Meyer, C. P., Siegert, F., Trollope, L. A., and Trollope, W. S. W.: Biomass burning fuel consumption rates: a field measurement database, Biogeosciences, 11, 7305–7329, https://doi.org/10.5194/bg-11-7305-2014, 2014.
Van Wees, D., van der Werf, G. R., Randerson, J. T., Andela, N., Chen, Y., and Morton, D. C.: The role of fire in global forest loss dynamics, Glob. Change Biol., 27, 2377–2391, https://doi.org/10.1111/gcb.15591, 2021.
Van Wees, D., van der Werf, G. R., Randerson, J. T., Rogers, B. M., Chen, Y., Veraverbeke, S., Giglio, L., and Morton, D. C.: Global biomass burning fuel consumption and emissions at 500 m spatial resolution based on the Global Fire Emissions Database (GFED), Geosci. Model Dev., 15, 8411–8437, https://doi.org/10.5194/gmd-15-8411-2022, 2022.
Wang, S. X. and Zhang, C. Y.: Spatial and Temporal Distribution of Air Pollutant Emissions from Open Burning of Crop Residues in China, Sciencepaper Online, 3, 329–333, 2008 (in Chinese).
Wang, Z., Wang, Z., Zou, Z., Chen, X., Wu, H., Wang, W., Su, H., Li, F., Xu, W., Liu, Z., and Zhu, J.: Severe Global Environmental Issues Caused by Canada's Record-Breaking Wildfires in 2023, Adv. Atmos. Sci., 41, 565–571, https://doi.org/10.1007/s00376-023-3241-0, 2023.
Wiedinmyer, C., Akagi, S. K., Yokelson, R. J., Emmons, L. K., Al-Saadi, J. A., Orlando, J. J., and Soja, A. J.: The Fire INventory from NCAR (FINN): a high resolution global model to estimate the emissions from open burning, Geosci. Model Dev., 4, 625–641, https://doi.org/10.5194/gmd-4-625-2011, 2011.
Wiedinmyer, C., Kimura, Y., McDonald-Buller, E. C., Emmons, L. K., Buchholz, R. R., Tang, W., Seto, K., Joseph, M. B., Barsanti, K. C., Carlton, A. G., and Yokelson, R.: The Fire Inventory from NCAR version 2.5: an updated global fire emissions model for climate and chemistry applications, Geosci. Model Dev., 16, 3873–3891, https://doi.org/10.5194/gmd-16-3873-2023, 2023.
Wotawa, G. and Trainer, M.: The Influence of Canadian Forest Fires on Pollutant Concentrations in the United States, Science, 288, 324–328, https://doi.org/10.1126/science.288.5464.324, 2000.
Wu, J., Kong, S., Wu, F., Cheng, Y., Zheng, S., Yan, Q., Zheng, H., Yang, G., Zheng, M., Liu, D., Zhao, D., and Qi, S.: Estimating the open biomass burning emissions in central and eastern China from 2003 to 2015 based on satellite observation, Atmos. Chem. Phys., 18, 11623–11646, https://doi.org/10.5194/acp-18-11623-2018, 2018.
Xie, B., Jia, X., Qin, Z., Zhao, C., and Shao, M.: Comparison of interpolation methods for soil moisture prediction on China's Loess Plateau, Vadose Zone J., 19, e20025, https://doi.org/10.1002/vzj2.20025, 2020.
Xie, X., Zhang, Y., Liang, R., Chen, W., Zhang, P., Wang, X., Zhou, Y., Cheng, Y., and Liu, J.: Wintertime Heavy Haze Episodes in Northeast China Driven by Agricultural Fire Emissions, Environ. Sci. Tech. Let., 11, 150–157, https://doi.org/10.1021/acs.estlett.3c00940, 2024.
Xu, X., Liu, J., Zhang, S., Li, R., Yan, C., and Wu, S.: China's multi-period land use land cover remote sensing monitoring dataset (CNLUCC), Data Registration and Publishing System of the Resource and Environm., Sci. Data Center of the Chinese Academy of Sciences [data set], https://doi.org/10.12078/2018070201, 2018.
Yan, S., He G., and Zhang X.: Forest aboveground biomass products in China, 2013–2021 [DS/OL]. V1, Science Data Bank [data set], https://cstr.cn/31253.11.sciencedb.07122 (last access: 3 September 2025), 2023.
Yan, X., Ohara, T., and Akimoto, H.: Bottom-up estimate of biomass burning in mainland China, Atmos. Environ., 40, 5262–5273, https://doi.org/10.1016/j.atmosenv.2006.04.040, 2006.
Yang, S., He, H., Lu, S., Chen, D., and Zhu, J.: Quantification of crop residue burning in the field and its influence on ambient air quality in Suqian, China, Atmos. Environ., 42, 1961–1969, https://doi.org/10.1016/j.atmosenv.2007.12.007, 2008.
Yang, W. and Jiang, X.: High-resolution estimation of air pollutant emissions from vegetation burning in China (2000-2018), Front. Environ. Sci., 10, 896373, https://doi.org/10.3389/fenvs.2022.896373, 2022.
Yin, L., Du, P., Zhang, M., Liu, M., Xu, T., and Song, Y.: Estimation of emissions from biomass burning in China (2003–2017) based on MODIS fire radiative energy data, Biogeosciences, 16, 1629–1640, https://doi.org/10.5194/bg-16-1629-2019, 2019.
Ying, L., Cheng, H., Shen, Z., Guan, P., Luo, C., and Peng, X.: Relative humidity and agricultural activities dominate wildfire ignitions in Yunnan, Southwest China: Patterns, thresholds, and implications, Agr. Forest Meteorol., 307, 108540, https://doi.org/10.1016/j.agrformet.2021.108540, 2021.
Zeng, Y., Liu, S., Huang, S., Patil, S. D., Gao, W., and Li, H.: Exploring Spatiotemporal Characteristics and Driving Forces of Straw Burning in Hunan Province, China, from 2010 to 2020, Remote Sens., 16, 1438, https://doi.org/10.3390/rs16081438, 2024.
Zhang, W., Yang, Y., Hu, C., Zhang, L., Hou, B., Wang, W., Li, Q., and Li, Y.: NPP and Carbon Emissions under Forest Fire Disturbance in Southwest and Northeast China from 2001 to 2020, Forests, 14, 999, https://doi.org/10.3390/f14050999, 2023a.
Zhang, W., Shao, H., Sun, H., Zhang, W., and Yan, Q.: Optimizing Carbon Sequestration in Forest Management Plans Using Advanced Algorithms: A Case Study of Greater Khingan Mountains, Forests, 14, 1785, https://doi.org/10.3390/f14091785, 2023b.
Zhang, Y., Shao, M., Lin, Y., Luan, S., Mao, N., Chen, W., and Wang, M.: Emission inventory of carbonaceous pollutants from biomass burning in the Pearl River Delta Region, China, Atmos. Environ., 76, 189–199, https://doi.org/10.1016/j.atmosenv.2012.05.055, 2013.
Zhao, Y., Nielsen, C. P., Lei, Y., McElroy, M. B., and Hao, J.: Quantifying the uncertainties of a bottom-up emission inventory of anthropogenic atmospheric pollutants in China, Atmos. Chem. Phys., 11, 2295–2308, https://doi.org/10.5194/acp-11-2295-2011, 2011.
Zhou, Y., Xing, X., Lang, J., Chen, D., Cheng, S., Wei, L., Wei, X., and Liu, C.: A comprehensive biomass burning emission inventory with high spatial and temporal resolution in China, Atmos. Chem. Phys., 17, 2839–2864, https://doi.org/10.5194/acp-17-2839-2017, 2017.