the Creative Commons Attribution 4.0 License.
the Creative Commons Attribution 4.0 License.
 | 09 Sep 2025
Effects of enhancing nitrogen use efficiency in cropland and livestock systems on agricultural ammonia emissions and particulate matter air quality in China
Biao Luo
Lei Liu
David H. Y. Yung
Tiangang Yuan
Jingwei Zhang
Leo T. H. Ng
Chinese agriculture has long been characterized by low nitrogen use efficiency (NUE) associated with substantial ammonia (NH3) loss, which contributes significantly to fine particulate matter (PM2.5) pollution. However, the knowledge gaps in the spatiotemporal patterns of NH3 emissions and the states of nitrogen management of agricultural systems render it challenging to evaluate the effectiveness of different mitigation strategies and policies. Here, we explore the NH3 mitigation potential of various agricultural NUE-improving scenarios and their subsequent effects on PM2.5 pollution in China. We developed and used a combination of bottom-up emission models and a nitrogen mass flow model to evaluate the NUE of different crop and livestock types at the provincial scale in China. We generated gridded NH3 emission input to drive a chemical transport model to provide an integrated assessment of the air quality impacts of four improved nitrogen management scenarios. The total agricultural NH3 emission of China was estimated to be 11.2 Tg NH3 in 2017, of which 46.2 % and 53.8 % are attributable to fertilizer use and livestock animal waste, respectively. Our results show that grain crops have higher NUE than fruits and vegetables, while high livestock NUE can be found in pork and poultry. We also found that by implementing different mitigation scenarios, agricultural NH3 emissions can be effectively reduced by 11.6 %–39.3 %. Consequently, annual population-weighted PM2.5 reductions were estimated to be 1.3–4.1 µg m−3. Our results provide decision support for policymaking concerning agricultural NH3 emissions and their public health impacts.
- Article
(8294 KB) - Full-text XML
-
Supplement
(3273 KB) - BibTeX
- EndNote


High nitrogen (N) input in croplands is the key to meeting the increasing food demand in China, but it also simultaneously poses severe burdens to the environment, damaging ecosystem and human health (Guo et al., 2020). China's grain production nearly doubled from 1980 to 2017, while N synthetic fertilizer use more than tripled during the same period (NBSC, 2023). Large N surplus in croplands, which cannot be stored in soil or absorbed by the crops in a timely manner, inevitably causes massive reactive N leakage to the environment. The situation regarding livestock production is also concerning. Population growth and dietary changes have led to a substantial increase in meat consumption in China, rising from 13.4 Mt in 1980 to 77.3 Mt in 2010 (Liu et al., 2021a), which has expanded China's livestock population accompanied by substantial amounts of excretion and animal waste with rich N content. Improper manure handling and poor management result in only 30 % of N excretion being recycled to farmlands, with the rest being released to the environment (Zhang et al., 2023).
Among these reactive N losses, ammonia (NH3) emissions have become an increasing concern for the Chinese government in recent years. NH3, primarily emitted from agricultural activities, plays essential roles in ecosystems, atmosphere chemistry and climate (Li et al., 2021; Zhang et al., 2018). It can react with sulfuric acid (H2SO4) and nitric acid (HNO3) produced from the oxidation of sulfur dioxide (SO2) and nitrogen oxides (NOx ≡ NO + NO2), respectively, and contribute to the formation of sulfate–nitrate–ammonium (SNA) aerosols (Behera et al., 2013). Ammonium aerosols exhibit well-documented effects on climate, with their ability to scatter sunlight and act as cloud condensation nuclei to promote cloud formation (Abbatt et al., 2006; Henze et al., 2012). Additionally, it can increase fine particulate matter (PM2.5, i.e., particulate matter with a diameter of 2.5 µm or smaller) pollution, a severe public health concern worldwide. China is a global hotspot of NH3 emissions, accounting for 25 % of global emissions (Liu et al., 2022a). Agricultural NH3 emissions, driven by low nitrogen use efficiency (NUE) in Chinese agriculture, account for over 80 % of NH3 emissions in China, contributing to around 16 % of the PM2.5 mass burden in China (Han et al., 2020).
Due to China's aggressive clean air actions in recent years, SO2 and NOx emissions have been reduced significantly. NH3 was not initially listed in the clean air actions. However, there is growing evidence of the importance of NH3 for PM2.5 control in China. Fu et al. (2017) indicated that the rise in NH3 concentrations has undermined the benefits of reducing SNA concentrations (especially for nitrate) via emissions control of SO2 and NOx. Comparing air pollution in China before and after the COVID-19 lockdown, Xu et al. (2022) observed that while there was a sharp reduction in SO2 and NOx emissions during the lockdown, the concurrent increase in NH3 concentrations may have contributed to the persistent high levels of PM2.5 pollution. Therefore, the Chinese government has recently recognized the significance of NH3 emissions in controlling PM2.5 pollution and included them in the list of regulated atmospheric pollutants.
With improving technology and management of agricultural production, some abatement pathways are available for controlling NH3 emissions. For fertilizer-related NH3, deep placement of fertilizer, optimization of fertilizer schedules, enhanced-efficiency fertilizers (e.g., controlled-release fertilizer), and adding nitrification and urease inhibitors are all effective options, with mitigation efficiency ranging between 14 % and 87 % (Fu et al., 2020; Huang et al., 2016; Liu et al., 2021a; Ren et al., 2022). As for NH3 loss from livestock waste, one may improve feed management (e.g., low crude protein feeding) and utilize manure treatment technology such as rapid manure drying, solid–liquid separation, and composting during housing and storage stages, and the reported mitigation efficiency is 10 %–55 % (Bai et al., 2016; Hou et al., 2015; Zhang et al., 2020). In addition, the recycling of manure nutrients to farmlands as a substitute for synthetic fertilizers is an important approach to decrease emissions. Undoubtedly, these efforts can enhance NUE of Chinese agricultural systems. To link the above measures with mitigation potential analysis, the emission reduction efficiencies of various control options derived from meta-analysis have been applied to regional and national scales to explore the emission mitigation potential (Fu et al., 2020; Guo et al., 2020). This, however, assumes that regions have the same status of nitrogen use, and the various technologies will deliver the expected outcomes. Moreover, some studies have attempted to evaluate the current agricultural NUE and identify the emission reduction potential by closing the gap between the current and optimal NUE (Bai et al., 2016; Zhang et al., 2020). Such studies, however, usually focused only on national and entire crop or livestock systems, making it challenging to identify specific recommendations for different crops in different regions.
An accurate and detailed NH3 emission inventory is the basis for mitigation potential evaluation. A high-resolution gridded agricultural NH3 emission inventory can not only quantify the contribution of different sectors but also show the precise spatiotemporal patterns of emissions, which can further serve as input of air quality models to investigate their impacts on air quality and human health. Bottom-up estimation is the primary approach to establishing NH3 emission inventories (Battye et al., 2003; Huang et al., 2012; Meng et al., 2017). Many studies have generated regional and global agricultural NH3 emission inventories via this approach, such as EDGAR, REAS, CEDS, PKU-NH3 and the MEIC (Crippa et al., 2020; Kurokawa and Ohara, 2020; McDuffie et al., 2020; Kang et al., 2016; Li et al., 2017). The common way to produce a gridded inventory has two steps: (1) estimating the total NH3 emission in the administrative unit (e.g., country, province and county scale) via activity data (mainly from census records) and emission factors (EFs) and (2) allocating emissions to grid cells based on different base maps (e.g., population density, crop and livestock distribution). The spatial accuracy of an inventory is decided by the resolution of the base maps. High-resolution inventories (e.g., ∼ 1 km) are usually gridded based on land use and population density maps (∼ 1 km), without any crop or livestock spatial information (Huang et al., 2012; Kang et al., 2016). On the other hand, inventories at a coarser resolution (e.g., ∼ 10 km) consider livestock and crop distribution but are constrained by the spatial resolution of available crop and livestock data (Yang et al., 2023; Zhang et al., 2018).
This study aims to evaluate the NUE and NH3 emissions of the agricultural systems of China in 2017 and further investigate the various potentials of reducing NH3 emissions and their subsequent effects on PM2.5 pollution. The objectives are to (1) develop a high-resolution agricultural NH3 inventory (1 km), including 16 crop types and 6 livestock types, based on a newly available crop and livestock distribution map; (2) evaluate the NUE of six crop subsystems and four livestock subsystems; (3) design four prospective mitigation scenarios, consisting of enhancing NUE of crops and livestock, improving organic fertilizer use ratio, and combined measures; and (4) calculate NH3 emission reductions and benefits in terms of air quality enhancements under these mitigation scenarios based on a chemical transport model. This study provides useful insights into how further decreasing NH3 emissions toward cleaner air goals can be achieved by improving the NUE of agricultural systems in China.
2.1 Bottom-up estimates of agricultural emissions
In this study, we estimated agricultural NH3 emissions as a function of agricultural activity data and EFs, which is an approach widely applied in previous bottom-up estimation (Zhan et al., 2021; Bouwman et al., 2002; Paulot et al., 2014). We chose 2017 as the baseline for our study. The rationale was that the African swine fever in China significantly impacted pork production between 2018 and 2021, resulting in the death of over a million pigs (Liu and Zheng, 2024), and the COVID-19 pandemic also influenced agriculture substantially between 2019 and 2022. Therefore, after excluding these impacts, 2017 is the closest “present-day” representative year with complete data. The NH3 emission (Ei, kg NH3) from a given source i is calculated as
where Ai is activity data of source i, such as the total synthetic fertilizer use for crops and the livestock population, and EFi is the emission factor of source i, which could be derived from functions of environmental conditions, management and source types.
2.1.1 Fertilizer-related NH3 emissions
The total fertilizer application is determined by the crop planting structure and fertilizer application rates, which have significant spatiotemporal variability. Because of uncertainties in the timing of fertilizer application, we employed the Gaussian distribution function (Eq. 2) to quantify variations in fertilizer application (Gyldenkærne et al., 2005; Paulot et al., 2014).
where c stands for different crops; t represents month; Fct (kg) is the total fertilizer use of crop c at month t; Rc (kg ha−1) is the fertilizer application rate of crop c; μc is the fertilizer application time of crop c; δc is the deviation from the mean planting date of crop c (Sacks et al., 2010); and PAc (ha) is the crop planting area of crop c.
The fertilization of vegetables and fruits is assumed to be the same for every month. Functions of soil properties, fertilizer application and crop planting information are used to calculate the baseline EF (Eq. 3):
where f is a function that accounts for the effect of soil pH, cation exchange capacity (CEC), fertilizer type and application mode on the EF of fertilizer application. The functions were obtained from previous results for China (Huang et al., 2012; Kang et al., 2016; Zhang et al., 2018), which are summarized in the Supplement (Tables S1 and S2). The gridded soil pH and CEC data (1 km × 1 km) were obtained from the Harmonized World Soil Database (https://www.fao.org/land-water/databases-and-software/hwsd/en/, last accessed: 18 October 2023) (Fig. S1 in the Supplement).
The baseline EF is further corrected by monthly meteorological factors (Eq. 4) (Paulot et al., 2014):
where m represents months, and T (°C) and u (m s−1) are air temperature and wind speed at 2 m height, whereby their gridded values (1 km × 1 km) are from Peng et al. (2019) and National Earth System Science Data Center (http://www.geodata.cn/, last accessed: 18 October 2023), respectively. The high-resolution climate data were produced by spatially downscaling the 30 min Climatic Research Unit (CRU) time series dataset with WorldClim climatology using the delta downscaling method.
2.1.2 NH3 emissions from livestock manure
NH3 emissions from livestock are closely related to livestock excretion and how manure is managed (Hou et al., 2015). There are three typical types of livestock raising patterns in China – intensive, free-range and grazing – and their manure management approaches are different (Huang et al., 2012). Following Huang et al. (2012) and Kang et al. (2016), we adopted a mass flow approach by considering N flows in different stages. Total ammoniacal nitrogen (TAN) from livestock waste is estimated first, and then it flows into the manure management stages. The NH3 escape rate from manure varies in slurry vs. solid forms (housing, storage and spread). The livestock excretion rates and EFs are obtained from Huang et al. (2012) and are shown in Tables S3 and S4. The livestock EFs were first calculated for each livestock type across livestock manure management stages. Same as Zhang et al. (2018), these EFs are further modulated by the effect of temperature and wind speed following Eq. (4).
2.1.3 Gridded emissions
Following the approach described above, we first calculated NH3 emissions from fertilizer and livestock waste at the province scale. Here we estimated 16 crops of China in 2017, and the planting area and fertilizer application rates of each crop in each province were obtained from the National Bureau of Statistics of China (NBSC) (http://www.stats.gov.cn/tjsj/, last accessed: 18 October 2023). Six livestock types, including cattle, other big animals (e.g., horses, donkeys and camels), goats, sheep, pork and poultry, were considered. The livestock numbers at the end of the year and slaughter numbers for each province were also from national statistics (http://www.stats.gov.cn/tjsj/, last accessed: 18 October 2023). The provincial statistical data can be found in Tables S5 and S8. According to the above methods (Sect. 2.1.1 and 2.1.2), the crop- and livestock-specific NH3 emissions of each province were estimated. Then, we gathered the spatial distribution of crop planting area, livestock population and cropland area. Due to a lack of high-resolution data of crop planting area, only rice, wheat and maize gridded data at 1 km resolution could be obtained from Luo et al. (2020) (Fig. S2). These three crops account for nearly 60 % of China's total planting area, ensuring that we can reproduce most of the spatial patterns of fertilizer-related NH3 emissions. It is assumed that all other crops are distributed uniformly throughout the croplands of each province. The spatial distribution of cropland area was provided by the Data Center for Resources and Environmental Sciences, Chinese Academy of Sciences (RESDC) (http://www.resdc.cn, last accessed: 18 October 2023) (Fig. S2). The gridded livestock population map at 1 km, including cattle, sheep, goats, pork and poultry, was obtained from Cheng et al. (2023) (Fig. S3). The livestock map consolidates data from various sources, encompassing provincial, municipal and county statistics, alongside agricultural census records and intensive farm registration data. Intensive livestock populations, constituting ∼ 60% of the total livestock count, are assigned to 1 km grid cells according to the positions and breeding scales of intensive livestock farms. Meanwhile, extensive livestock populations, primarily comprised of backyard farms involving smallholders, are allocated based on the spatial distribution of rural inhabitants. This dataset offers heightened precision compared to existing livestock distribution maps by leveraging detailed livestock survey data, particularly in delineating livestock presence across urban, peri-urban and rural regions (Cheng et al., 2023).
The maps of EFs were created for each grid cell using Eqs. (3) and (4) by calculating the baseline EFs first and further modulating them by meteorological conditions. We then combined the spatial distribution of crop planting area, cropland area and livestock population with the EF maps to produce gridded NH3 emission maps. Finally, the NH3 emissions of each province were used to correct gridded NH3 emission maps so that when estimates in grid cells are summed over a province the total would match the provincial total:
where Ej (kg) is the emission flux in pixel j, (kg) represents the emission in pixel j without correction, Ep (kg) is the total emission of province p, and stands for the sum of emissions over all pixels in province p. Compared to previous emission inventories, these high-resolution gridded datasets of crop planting area and livestock population allow us to develop a high-resolution crop- and livestock-specific NH3 emission inventory.
2.2 Atmospheric chemical transport model
The GEOS-Chem atmospheric chemistry model (https://geoschem.github.io/, last accessed: 4 November 2024), initially described by Bey et al. (2001), serves as an open-source global 3-D atmospheric chemical transport model encompassing detailed ozone–NOx–VOC–aerosol–halogen chemistry. It can conduct offline simulations driven by assimilated meteorological data from the Goddard Earth Observing System (GEOS) of the NASA Global Modeling and Assimilation Office (GMAO) (http://acmg.seas.harvard.edu/geos/, last accessed: 4 November 2024). For this study, we utilized the Modern-Era Retrospective Analysis for Research and Applications, version 2 (MERRA-2) meteorological data (Gelaro et al., 2017) for 1979–present at a horizontal resolution of 0.5° × 0.625° and 72 vertical levels. Our investigation employed the GEOS-Chem High Performance model (GCHP) version 13.2.1. The flexibility and scalability of high-resolution simulations in the GEOS-Chem Classic model (GCC) were limited, as it relies on shared-memory parallelization and a rectilinear longitude–latitude grid (Martin et al., 2022). GCHP, leveraging an identical GCC code base, offers enhanced atmospheric chemical simulation capabilities, having evolved into a distributed-memory, modeling and analysis prediction layer (MAPL)-based rendition of GCC. By integrating a more efficient cubed-sphere grid and the finite-volume cubed-sphere dynamical core (FV3) advection, GCHP version 13 can operate on a stretched cubed-sphere grid to amplify grid resolution in a customized region with smooth, gradual resolution transitions (Eastham et al., 2018).
To improve simulation performance in China, Tsinghua University has developed localized emission inventories (MEIC), including SO2, NOx, NH3, carbon monoxide (CO), non-methane volatile organic compounds (NMVOCs), black carbon (BC) and organic carbon (OC), for China at 0.25° × 0.25° spatial resolution (http://meicmodel.org/, last accessed: 18 October 2023) (Li et al., 2017). The MEIC inventory has been widely used in Chinese studies and serves as the common input of GCHP for the China domain. However, the NH3 emission inventory in the MEIC lacks crop- and livestock-specific emissions, and the coarser resolution constrains our understanding of the impact of NH3 on PM2.5. Therefore, in this study we developed a high-resolution crop- and livestock-specific NH3 emission inventory as described above, which replaced the original MEIC NH3 inventory in our simulations. Finally, we conducted PM2.5 simulations for the year 2017 at 0.5° × 0.5° resolution (stretch factor = 4.0, target latitude = 33° N and target longitude = 109.4° E). Finally, the population-weighted PM2.5 (PM2.5, p, µg m−3) is utilized to evaluate the air quality benefits of NH3 reductions, which can be calculated as
where Popi and PM2.5,i (µg m−3) are the population and PM2.5 concentration for grid cell i, respectively.
The accuracy of our newly developed agricultural NH3 emission inventory was evaluated against available surface concentrations and other existing inventories. The Infrared Atmospheric Sounding Interferometer (IASI) instrument detects NH3 by measuring the absorption of infrared radiation emitted from the Earth's surface and atmosphere, and the measured NH3 is provided in the form of total column density. Liu et al. (2022b) used IASI NH3 columns and NH3 vertical profiles simulated by GEOS-Chem to derive surface NH3 concentrations, showing high consistency with ground observations in China. Specifically, they first simulated the NH3 concentrations in 72 vertical layers via GEOS-Chem. The cumulative concentrations from these layers were aggregated to represent the column concentration. Next, they calculated the proportion of surface concentration to the total column concentration based on the simulated NH3 vertical profiles. Finally, this ratio was applied to derive the surface NH3 concentration from IASI NH3 columns. The surface NH3 concentrations simulated using our inventory and the MEIC NH3 were compared and further validated using their IASI-derived data. Moreover, PM2.5 concentrations served as an additional metric to evaluate the performance of our inventory against the MEIC NH3 inventory. The PM2.5 data in 2017 were collected from the Chinese Ministry of Ecology and Environment (MEE) (https://quotsoft.net/air/, last accessed: 20 October 2023).
2.3 Nitrogen use efficiency
NUE is defined in this study as the ratio of the N input that can be transferred to the N contained in the product, calculated as the total N content in the product divided by the total N input (Gu et al., 2017). The N input of crop systems includes N content in fertilizer application, manure used as fertilizer, atmospheric deposition, irrigation and biological fixation. The output N of crop systems is the N content in the harvested crops. For livestock systems, the N input mainly refers to feed N (e.g., forage, grain and straw feed), and output N is N contained in animal products (e.g., meat and leather). NUE for crop and livestock systems can be expressed as
The Coupled Human And Natural Systems (CHANS) nitrogen cycling model, a mass balance model for N budget, was employed to evaluate NUE in different crop and livestock subsystems. This model allows us to assess the N budget based on mass flows in seven compartments: industry, cropland, livestock, human, atmosphere, hydrosphere and others (Gu et al., 2015). It incorporates socioeconomic data, land use patterns and human behaviors to capture the human-driven processes affecting N inputs, such as fertilizer use and livestock production. The CHANS model was downloaded from https://person.zju.edu.cn/bjgu (last accessed: 11 March 2024), and the required input datasets were updated in 2017 by the National Bureau of Statistics of China. Due to data limitations, we evaluated N budgets in six cropland subsystems (rice, wheat, maize, orchard, vegetables and other crops) and four livestock subsystems (cattle, sheep and goats, pork and poultry) at the provincial scale.
2.4 Scenario analysis
With the help of the CHANS model, four abatement pathways were designed to identify the NH3 mitigation potential. These scenarios are expected to improve NUE and reduce nitrogen losses in agricultural systems. The performance of abatement scenarios was examined by their mitigation efficiency, represented by the ratio of NH3 emission reduction to baseline NH3 emission. The available measures to achieve these scenarios with mitigation efficiency in China are shown in Tables S9 and S10. The abatement scenarios include the following.
- i.
NUE-C scenario: improving the NUE of cropland systems. The excessive use of anthropogenic N application in croplands has been proven to be a problem in China. Several measures can be taken to enhance NUE to address this issue, such as adopting machine injection, optimal fertilizer application rate and 4R principles (the right time, right amount, right form and right method). According to farm surveys in China, the top 20 % of farmers in terms of crop NUE perform well in the nutrient management of farmlands. Specifically, the NUEs of rice, wheat, maize, fruits, vegetables and other crops are 0.66, 0.66, 0.66, 0.38, 0.70 and 0.68, respectively, for the top 20 % of farmers in China (Wang et al., 2022). Here, we set the crop NUE of the top 20 % of farmers in China as the targeted NUE under this scenario.
- ii.
OUR scenario: improving organic fertilizer use ratio for crops. Livestock N excretion increases inevitably with increasing livestock population. Poor excretion N recycling rate attributable to a low organic fertilizer use ratio results in massive NH3 escape. In addition to substituting synthetic fertilizer, optimal organic fertilizer use could enhance the quality of soil and crop products. Studies in Europe and China all suggested that 50 % would be the optimal organic fertilizer use ratio (Sutton et al., 2022; Zhang, 2021). Therefore, under this scenario, the organic fertilizer use ratio is increased to 50 %.
- iii.
NUE-L scenario: improving the NUE of livestock systems. The key to improving the NUE of livestock systems is to increase the nutrient retention rate. Effective measures can be conducted during the feeding stage, including low crude protein feeding and dietary additives (Zhang et al., 2020), which can help reduce livestock N excretion. Other efforts to advance herd management are also needed to reduce livestock mortality. Under this scenario, we assumed that the NUE of livestock in China could be improved to the European level by adopting advanced farming practices. The livestock-specific targets are boosting the NUE of cattle, sheep and goats, pork, and poultry to 0.26, 0.26, 0.35 and 0.55, respectively (Zhao et al., 2016; Groenestein et al., 2019).
- iv.
COMB scenario: combined measures. NH3 emission reduction should not be limited to individual systems since collaborative efforts can lead to more impactful outcomes. Under the combined scenario, targets in NUE-C, OUR and NUE-L are all expected to be realized.
We followed the bottom-up estimation methods in Sect. 2.1 to generate new agricultural NH3 emission estimates for these abatement scenarios accordingly. Specifically, the improvements of crop NUE and organic fertilizer use ratio result in lower synthetic fertilizer use, consequently mitigating the fertilizer-related NH3 emissions. Meanwhile, the improvement of livestock NUE reduces the EFs of livestock, hereby contributing to a decrease in livestock-related NH3 emissions. These revised agricultural NH3 emission estimates were then used to drive GCHP to simulate corresponding changes in PM2.5 levels from the non-abatement control scenario.
3.1 NH3 emission of China in 2017
3.1.1 Specific sources of agricultural NH3 emissions
The fertilizer NH3 emissions in China in 2017 are estimated to have been 5.17 Tg NH3, while NH3 volatilization from livestock manure was 6.01 Tg NH3. Considering the 2.01 Tg NH3 of non-agricultural emissions provided by the MEIC inventory, the total NH3 emissions amount to 13.2 Tg NH3. Agriculture is the primary source of NH3 emissions, accounting for 84.8 % of total emissions. Figure 1 presents the specific sources of agricultural NH3 emissions. Among the fertilizer-related NH3 emissions, maize cultivation makes the largest contribution (23.1 %), followed by rice (18.7 %) and wheat (16.5 %). Notable NH3 emissions can also be found in vegetables (15.1 %) and fruits (9.4 %). Regarding NH3 emissions from livestock manure, the largest contributor is cattle, accounting for 32 %, followed by pork (26.6 %), sheep and goats (20.4 %), and poultry (17.6 %). Moreover, we compared our agricultural NH3 emissions with precious estimates (Table 1). Discrepancies in estimating NH3 emissions stemming from livestock waste across various studies are generally minor, mostly concentrated in the range of 5–6 Tg NH3 yr−1. However, there are notable discrepancies in fertilizer-related NH3 emissions, varying from 2.8–7 Tg NH3 yr−1. These uncertainties primarily arise from differences in the use of EFs, such as EDGAR and CEDS not using localized EFs in China, whereas we employed localized EFs in China.
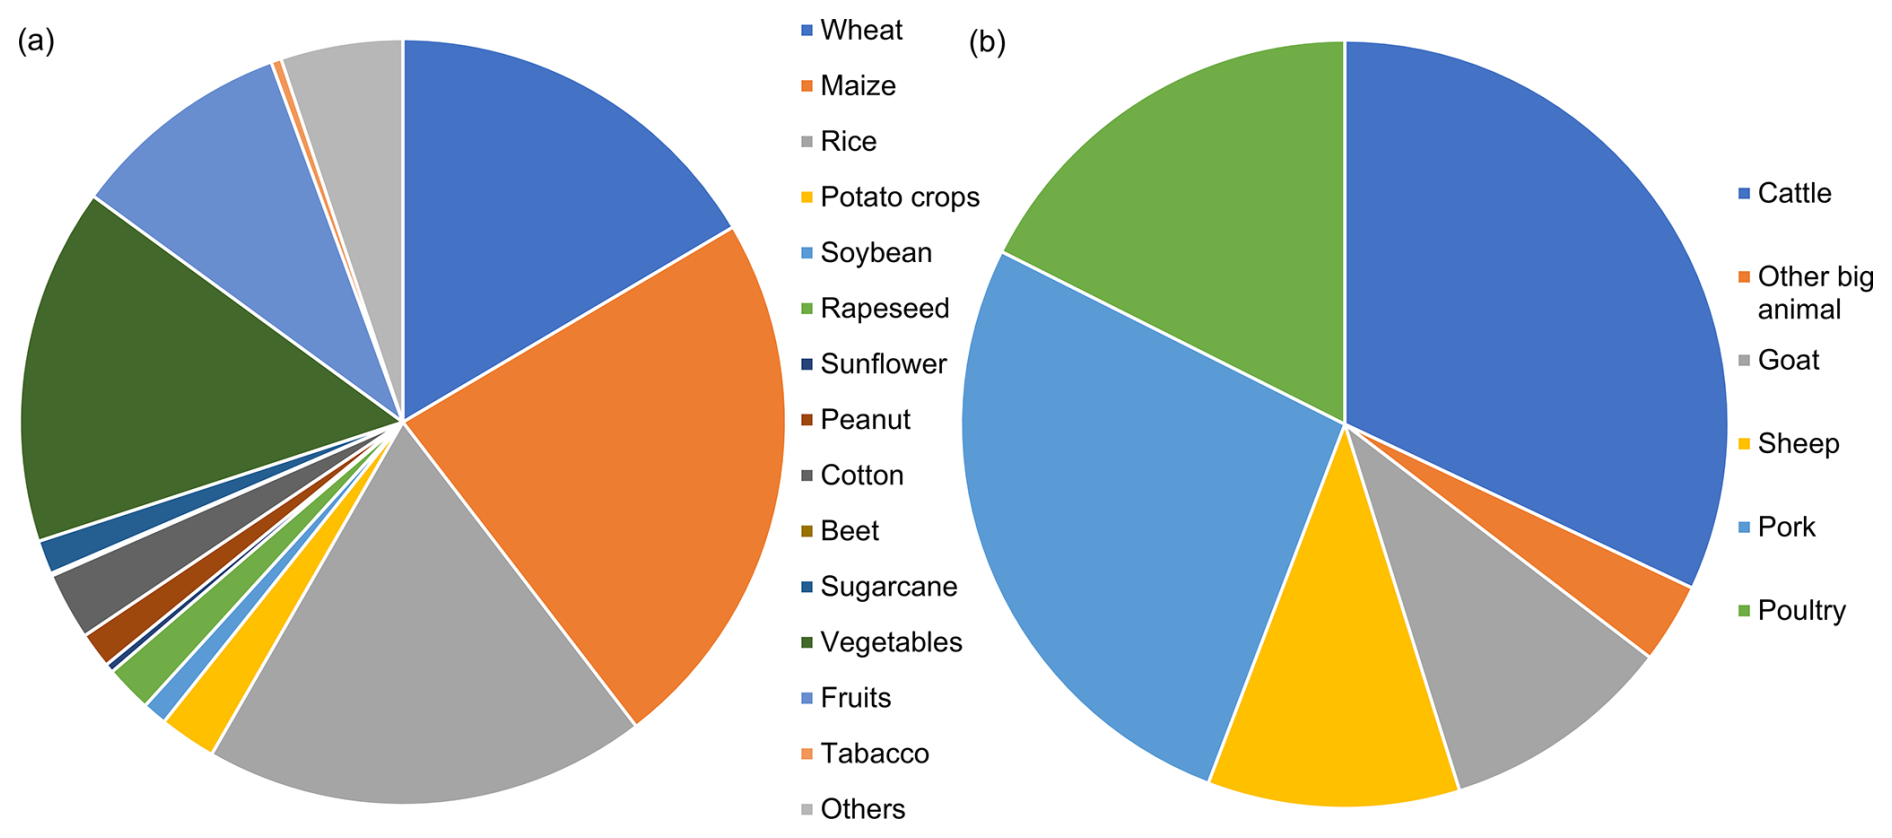
Figure 1Different NH3 emission sources associated with (a) fertilizer application and (b) livestock manure.
Table 1Comparison of agricultural NH3 emissions with precious estimates in China (Tg NH3 yr−1).
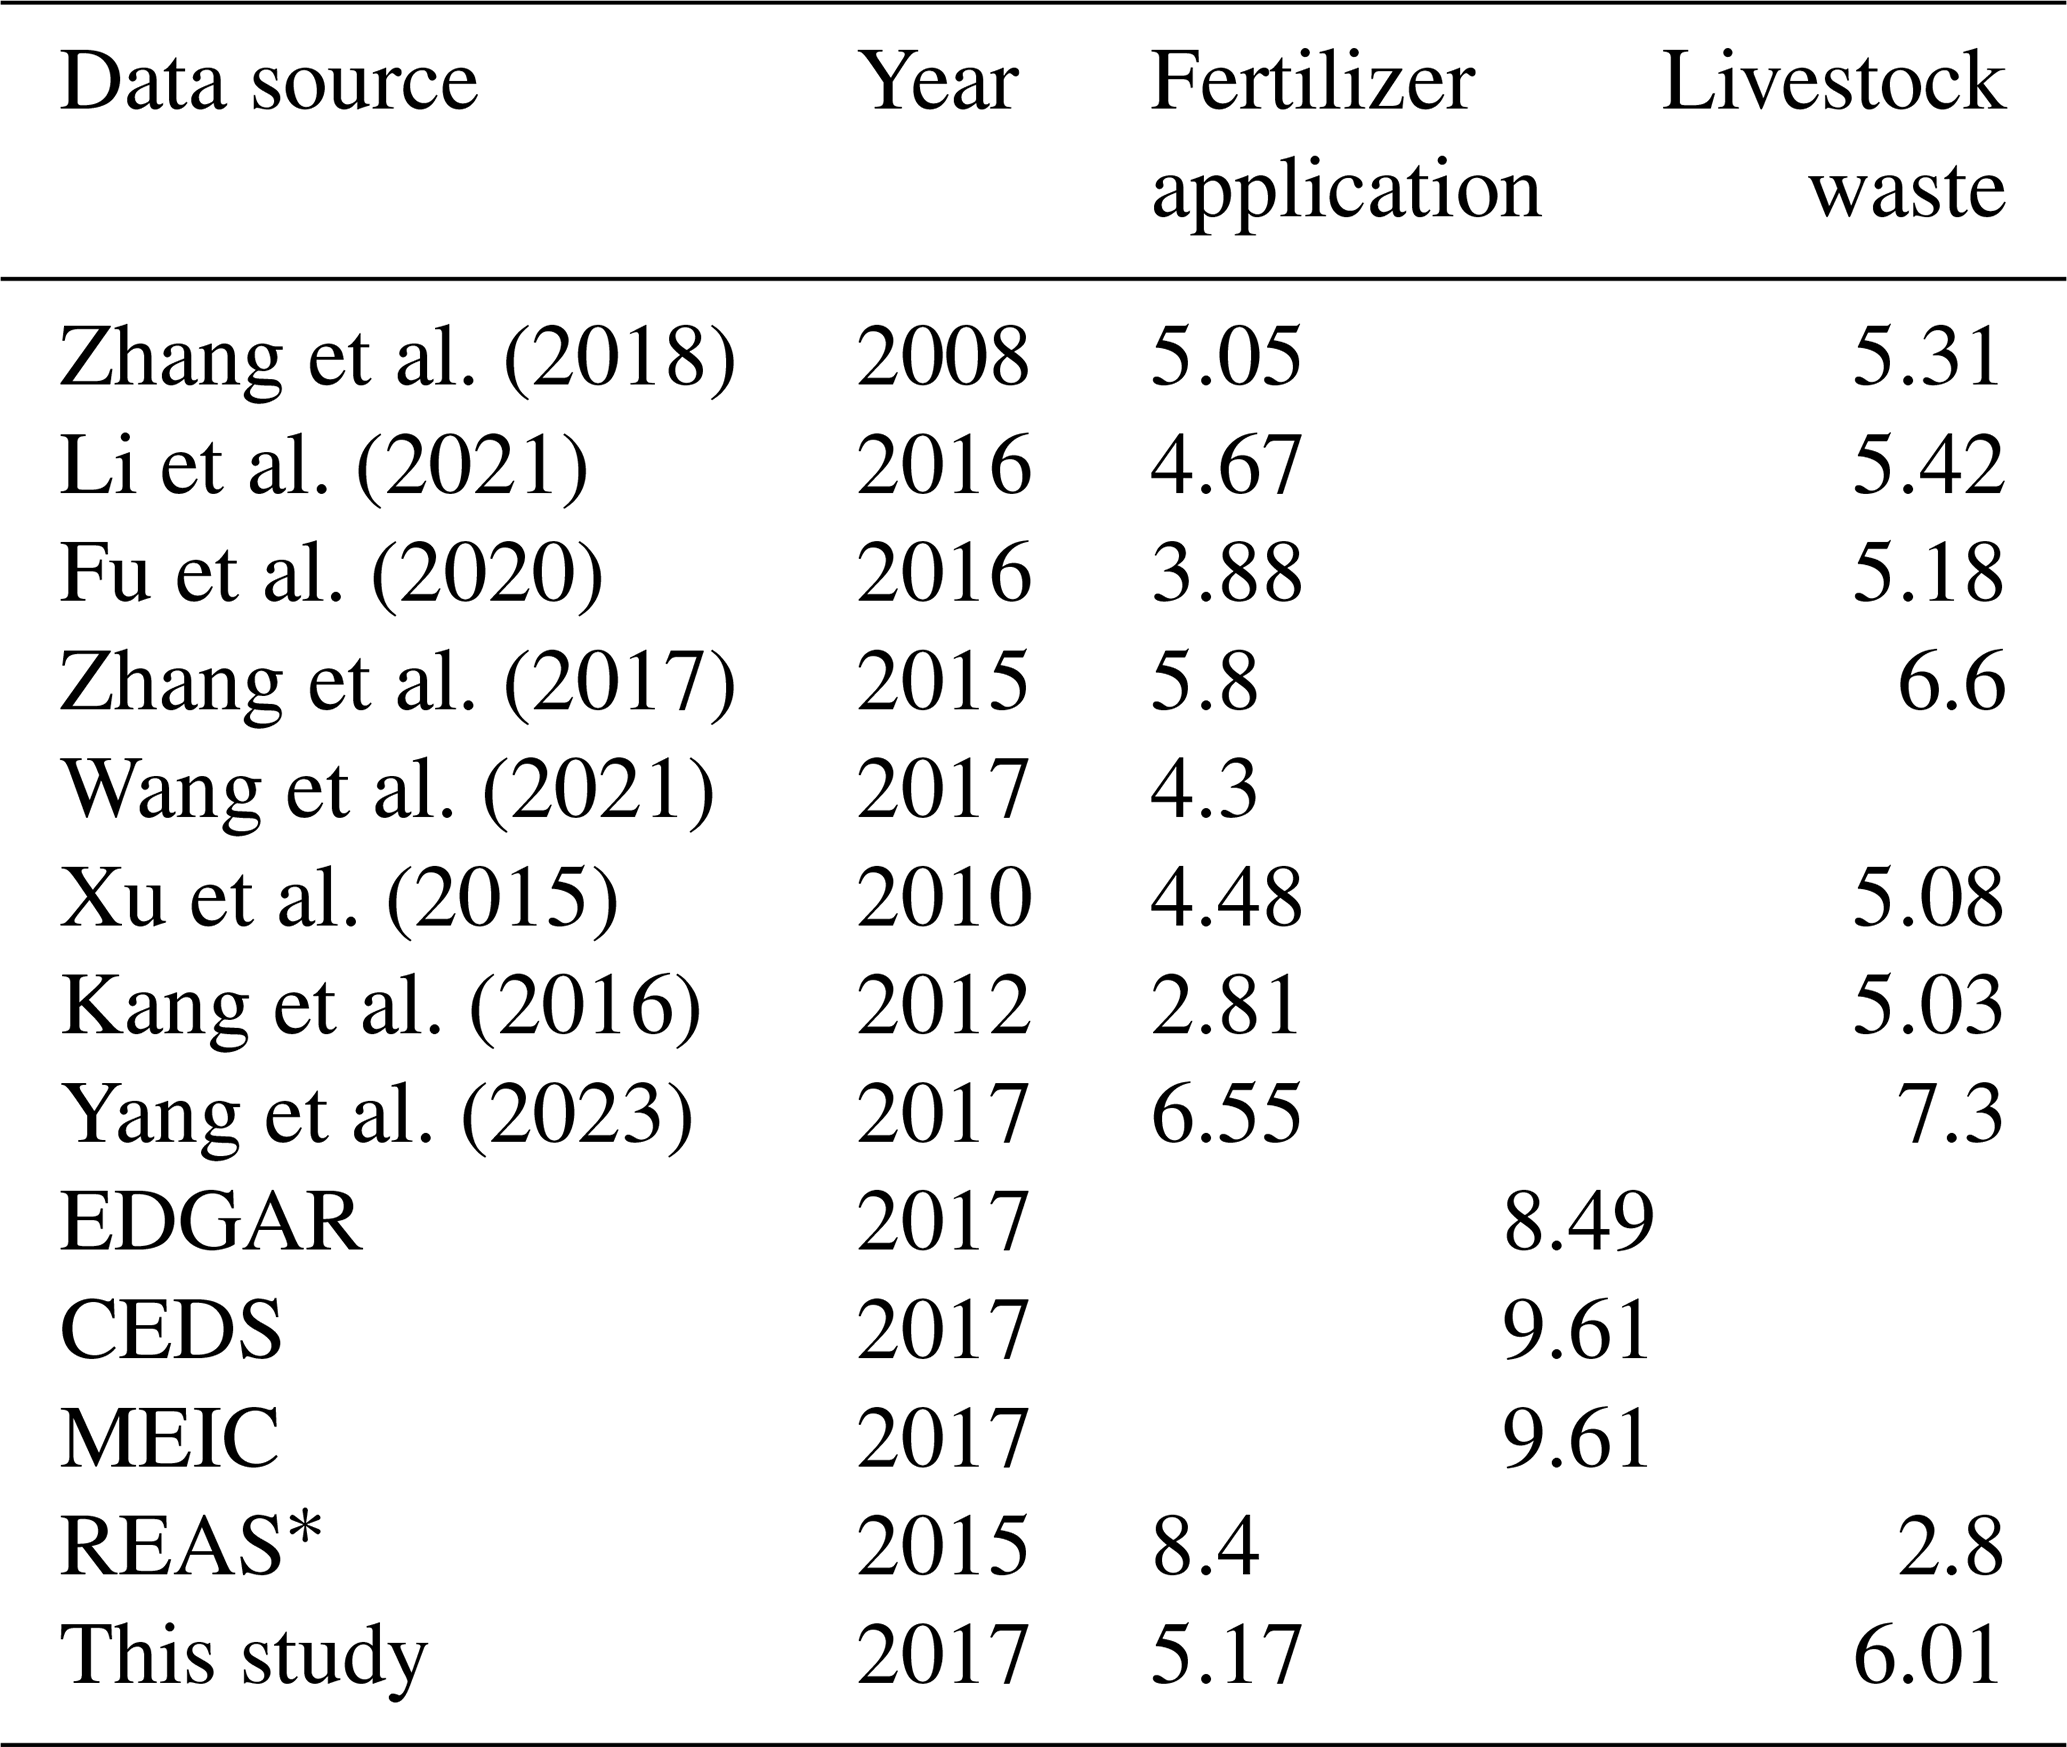
* Manure-related NH3 emissions in REAS do not include the manure applied as fertilizer to croplands, which contributes to fertilizer-related NH3 emissions instead.
Cereal crops, such as wheat, maize and rice, are extensively cultivated in China, encompassing 58.9 % of the total planted area (NBSC, 2023). With a high N fertilizer application rate (170–223 kg N ha−1), the cultivation of cereal crops results in 3.01 Tg of NH3 emissions in 2017. Additionally, vegetable and orchard areas, accounting for 20 % of the total planted area, receive 30 % of synthetic fertilizers applied in China (Wang et al., 2022). Nitrogen management should be prioritized for the five crop types mentioned above, which accounted for over 80 % of fertilizer-related NH3 emissions. Remarkably, the overuse of synthetic fertilizers in vegetables and fruits is more severe than in cereal crops but has not received widespread attention (Wang et al., 2022). A 2–5-fold-higher N fertilizer application rate in orchards and vegetables compared to cereal crops has been observed in China (Yu et al., 2022). Therefore, more effort is required to improve fertilization management in vegetables and orchards. Cattle holds a dominant position in NH3 emissions from livestock waste, both in China and globally, due to their large population and high N excretion. However, unlike other countries, pork contributes significantly to NH3 emissions in China. As the largest pork producer and consumer globally, China bears a high environmental cost of pork production (Bai et al., 2019). The contribution of pork to ambient NH3 concentration is well documented, with national average NH3 concentrations recorded to be 3 % lower than historical levels during the African swine fever period (July to December 2018) (Liu et al., 2021c). Meat consumption is projected to continue rising with population and income growth, further exacerbating such environmental burdens (Whitnall and Pitts, 2019). Therefore, it is crucial to improve livestock manure management to mitigate NH3 emissions.
3.1.2 Spatiotemporal distribution of NH3 emissions
Consistent with ground-based observations (Pan et al., 2018), NH3 emissions are the highest in summer, followed by spring, with weaker emissions in autumn and winter (Fig. 2). Rice and maize are responsible for high fertilizer-related NH3 emissions in summer. Meanwhile, winter wheat is the primary source of fertilizer-related NH3 emissions in autumn. On the other hand, NH3 emissions associated with livestock waste exhibit weak monthly variations, which are only induced by meteorological variations (Fig. 2b). Due to high temperatures, the strongest NH3 emissions from livestock waste happen in summer, a pattern that is also evident in satellite observations of the NH3 emissions from livestock farms (Liu et al., 2022c).
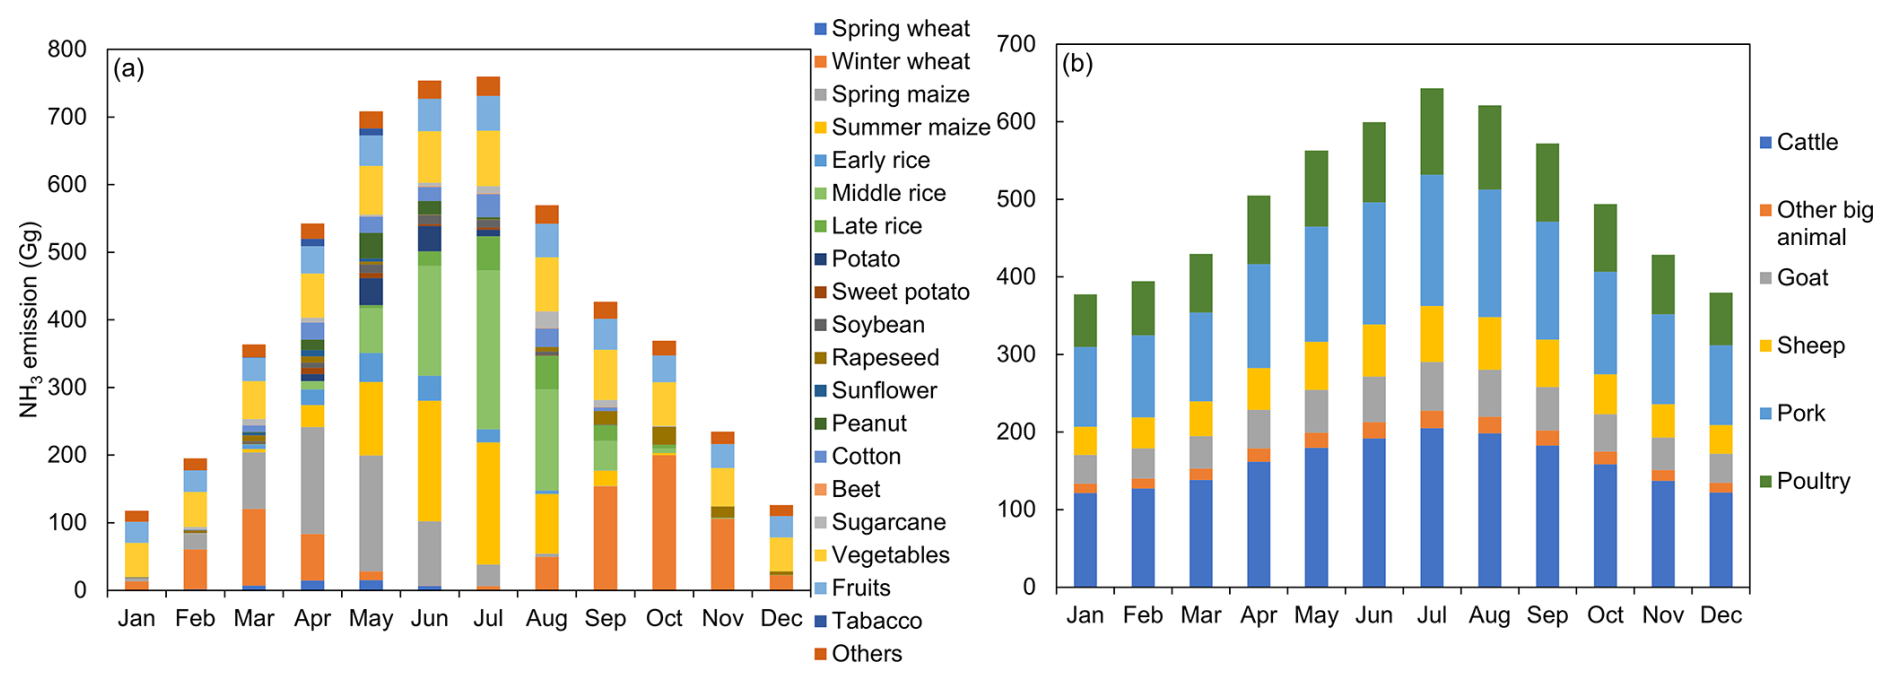
Figure 3 provides detailed NH3 emission spatial patterns with a high resolution at 1 km. NH3 emissions are highly spatially heterogeneous, with the highest emissions in Southwest China and the North China Plain, where agricultural activities are intensive. The provinces with the highest NH3 emission intensities are Henan (67.2 kg NH3 ha−1), Shandong (63.6 kg NH3 ha−1) and Jiangsu (58.6 kg NH3 ha−1), with emissions much higher than the national average (13.7 kg NH3 ha−1). The NH3 emission intensities attributable to fertilizer are also high in these provinces, with Jiangsu having the highest intensity (37.6 kg NH3 ha−1), followed by Henan (36.2 kg NH3 ha−1) and Shandong (25.2 kg NH3 ha−1) (Fig. 3b). The distributions of agricultural sub-regions and provinces can be found in Fig. 3d and Table S11. The Huang–Huai–Hai (HHH) region is a major food production base in China, where approximately 30 % of total agricultural products are produced (Li et al., 2021). Henan Province in this region has the largest fertilizer-related NH3 emissions (604 Gg). In comparison, Heilongjiang Province, another major grain-producing province with a similar yield to Henan, has only 190 Gg of fertilizer-related NH3 loss. This could be explained by the better nutrient management of croplands, which is discussed in Sect. 3.2, and the lower temperature in Heilongjiang. Notably, the Sichuan Basin and Guanzhong Plain also experience substantial NH3 volatilization. Sichuan and Shaanxi, despite having lower agricultural products than Heilongjiang (NBSC, 2023), have greater NH3 emissions (Sichuan: 217 Gg; Shaanxi: 229 Gg). In addition, Hubei and Hunan exhibit high emissions due to the extensive rice cultivation and hot weather. The NH3 hotspots in Guangdong are mostly due to tropical vegetables and fruits.
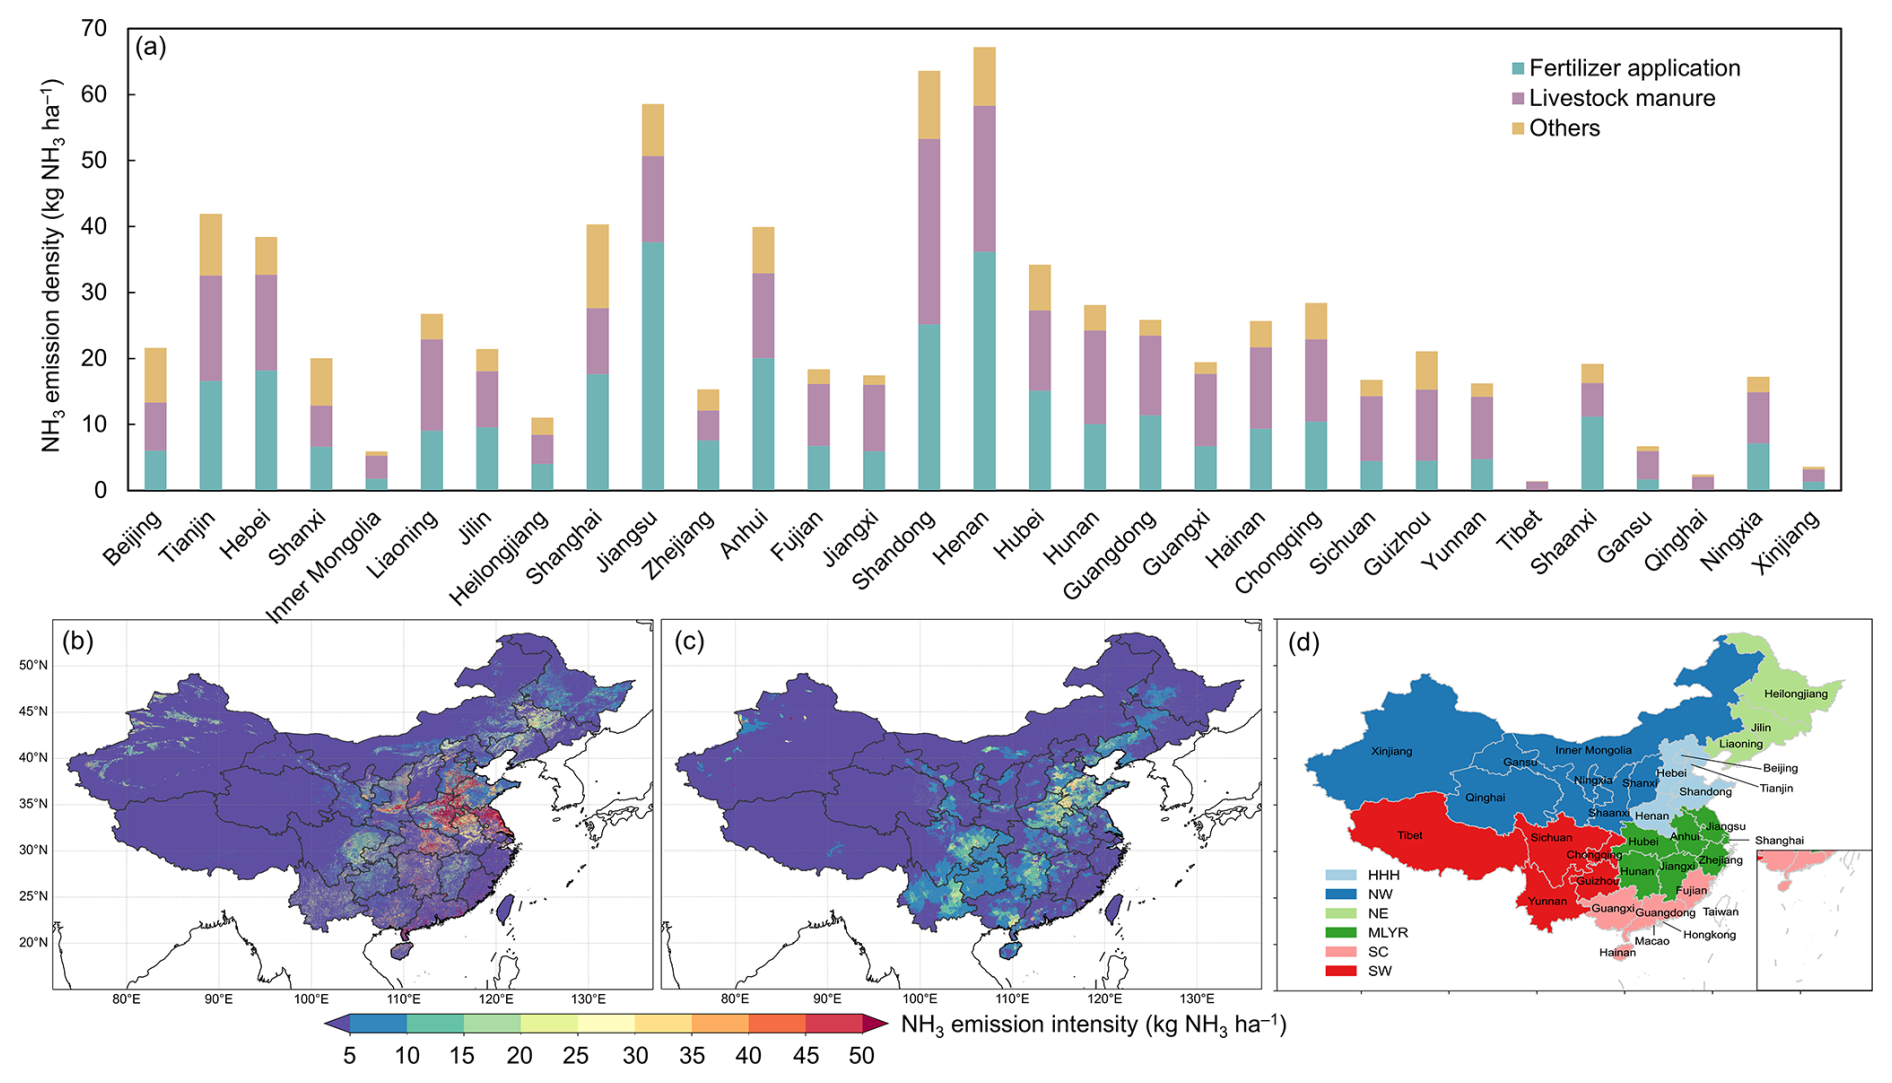
Figure 3(a) Provincial total NH3 emissions and the spatial distribution of NH3 emissions from (b) fertilizer application and (c) livestock waste. (d) Agricultural sub-region and province distribution in China. Agricultural sub-regions include the Huang–Huai–Hai region (HHH), the middle and lower Yangtze River region (MLYR), the northwest region (NW), the northeast region (NE), the southwest region (SW), and the southern China region (SC).
As for NH3 emissions from livestock waste, Shandong (28.1 kg NH3 ha−1) and Henan (22.1 kg NH3 ha−1) have high emission intensities (Fig. 3c) due to the presence of numerous intensive livestock farms. Unlike previous spatial patterns found for livestock waste-related NH3 emissions, our results reveal large amounts of NH3 emitted in many point sources. Emission hotspots exist in HHH, the Sichuan Basin, and the Hubei and Hunan provinces. The highest emissions are found in Sichuan (477 Gg), primarily due to cattle (163 Gg) and pork (157 Gg). Similarly, in Hunan, the large magnitude of pork production leads to 142 Gg of NH3 emissions. Notable NH3 emissions also occur in Shandong (442 Gg), dominated by pork (117 Gg) and poultry (147 Gg). In Northwest China, the largest contributors are cattle, sheep and goats. The different major contributors of livestock waste-related NH3 emissions highlight the significant regional variations in dietary habits across China, necessitating different approaches for NH3 control actions. We acknowledge the disparities in estimating livestock waste-related NH3 emissions. For example, our poultry NH3 estimates differ from those reported by Xu et al. (2015) and Gao et al. (2013), likely reflecting uncertainties in raising days and livestock numbers.
The seasonal cycle of NH3 emissions from fertilizer is closely linked to crop cultivation and fertilizer application calendars (Li et al., 2021). The main growth stages for maize and rice are between May and July, during which a large amount of fertilizer is applied. Promoted by the warm weather, the highest NH3 emissions occur during these 3 months (Fig. 2a). The numbers of animals kept in different months in China are unavailable, which may obscure the monthly differences in livestock waste-related NH3 emissions. Even though the dynamics between livestock stock numbers and slaughter numbers are unknown, the total annual numbers are recorded so that the estimates of total livestock waste-related emissions are mostly reliable. As for spatial distribution, high fertilizer-related NH3 emissions reflect high N fertilizer application rate, extensive planted area and cropland intensity (ratio of total sown area of crops to cropland area). For example, in Jiangsu (the province with the highest fertilizer-related emissions), the N fertilizer application rates of rice, wheat and maize are 1.91, 1.54 and 2.04 times higher than the national average, respectively (NBSC, 2023). Moreover, the cropland intensity of Jiangsu in 2017 was 1.65, exceeding the national average (1.23). Compared to fertilizer-related NH3 emissions, Southwest and Central China exhibit high livestock waste-related NH3 emissions, especially in Sichuan Province. The meat consumption per capita in Sichuan is the highest in China, with a value of 39.3 kg yr−1 in 2015 (Song et al., 2019). Subsequently, the strong demand has expanded local pork production, threatening local air and water quality.
3.1.3 Evaluation of NH3 emission inventory
Figure 4 shows the annual mean ground-level atmospheric concentrations of NH3 and PM2.5 simulated by GCHP based on our new inventory and the MEIC inventory in 2017. The IASI-derived NH3 concentrations and observed PM2.5 concentrations were utilized to assess model performance. The surface NH3 concentrations exhibit similar spatial patterns to NH3 emissions, and the simulated NH3 concentrations from both inventories align well with satellite-derived observations. The simulated NH3 concentration driven by our inventory shows better spatial correlation with satellite observations (R = 0.90), with a lower root mean square error (RMSE) of 1.93 µg N m−3. In comparison, the performance of the MEIC is relatively lower (R = 0.84), with an RMSE of 2.59 µg N m−3. High-concentration regions, identified at the junctions of the Hebei, Shandong and Henan provinces through satellite monitoring (Fig. 4a), are successfully reproduced by our inventory (Fig. 4c). In contrast, the MEIC only generates the high-concentration cluster in central Henan (Fig. 4e). Furthermore, compared to the average IASI-derived NH3 of HHH (14.5 µg N m−3), the modeled NH3 concentration is relatively lower, i.e., 10.5 µg N m−3 with our inventory and 7.73 µg N m−3 with the MEIC. It is noteworthy that the total NH3 emissions for China in 2017 were estimated to be 10.3 Tg NH3 by the MEIC, which may be an underestimation. Additionally, we examined the seasonality of NH3 concentrations for sub-regions in Table S6 and conducted seasonal comparison between simulation and observations in Table S7. The temporal correlation between IASI-derived NH3 and NH3 modeled by our inventory is better than that for the MEIC. Our inventory demonstrates superior accuracy in modeling surface NH3 concentrations compared to the MEIC in all seasons, particularly during summer. Regarding PM2.5, simulations with our inventory exhibit a stronger spatial correlation with observations than with the MEIC, although concentrations are slightly overestimated. In HHH, a hotspot of NH3 emissions, our inventory excels in capturing monthly variations in surface NH3 concentrations, displaying a temporal correlation of 0.57 with IASI-derived NH3 concentrations that surpasses the correlation of 0.15 for the MEIC.
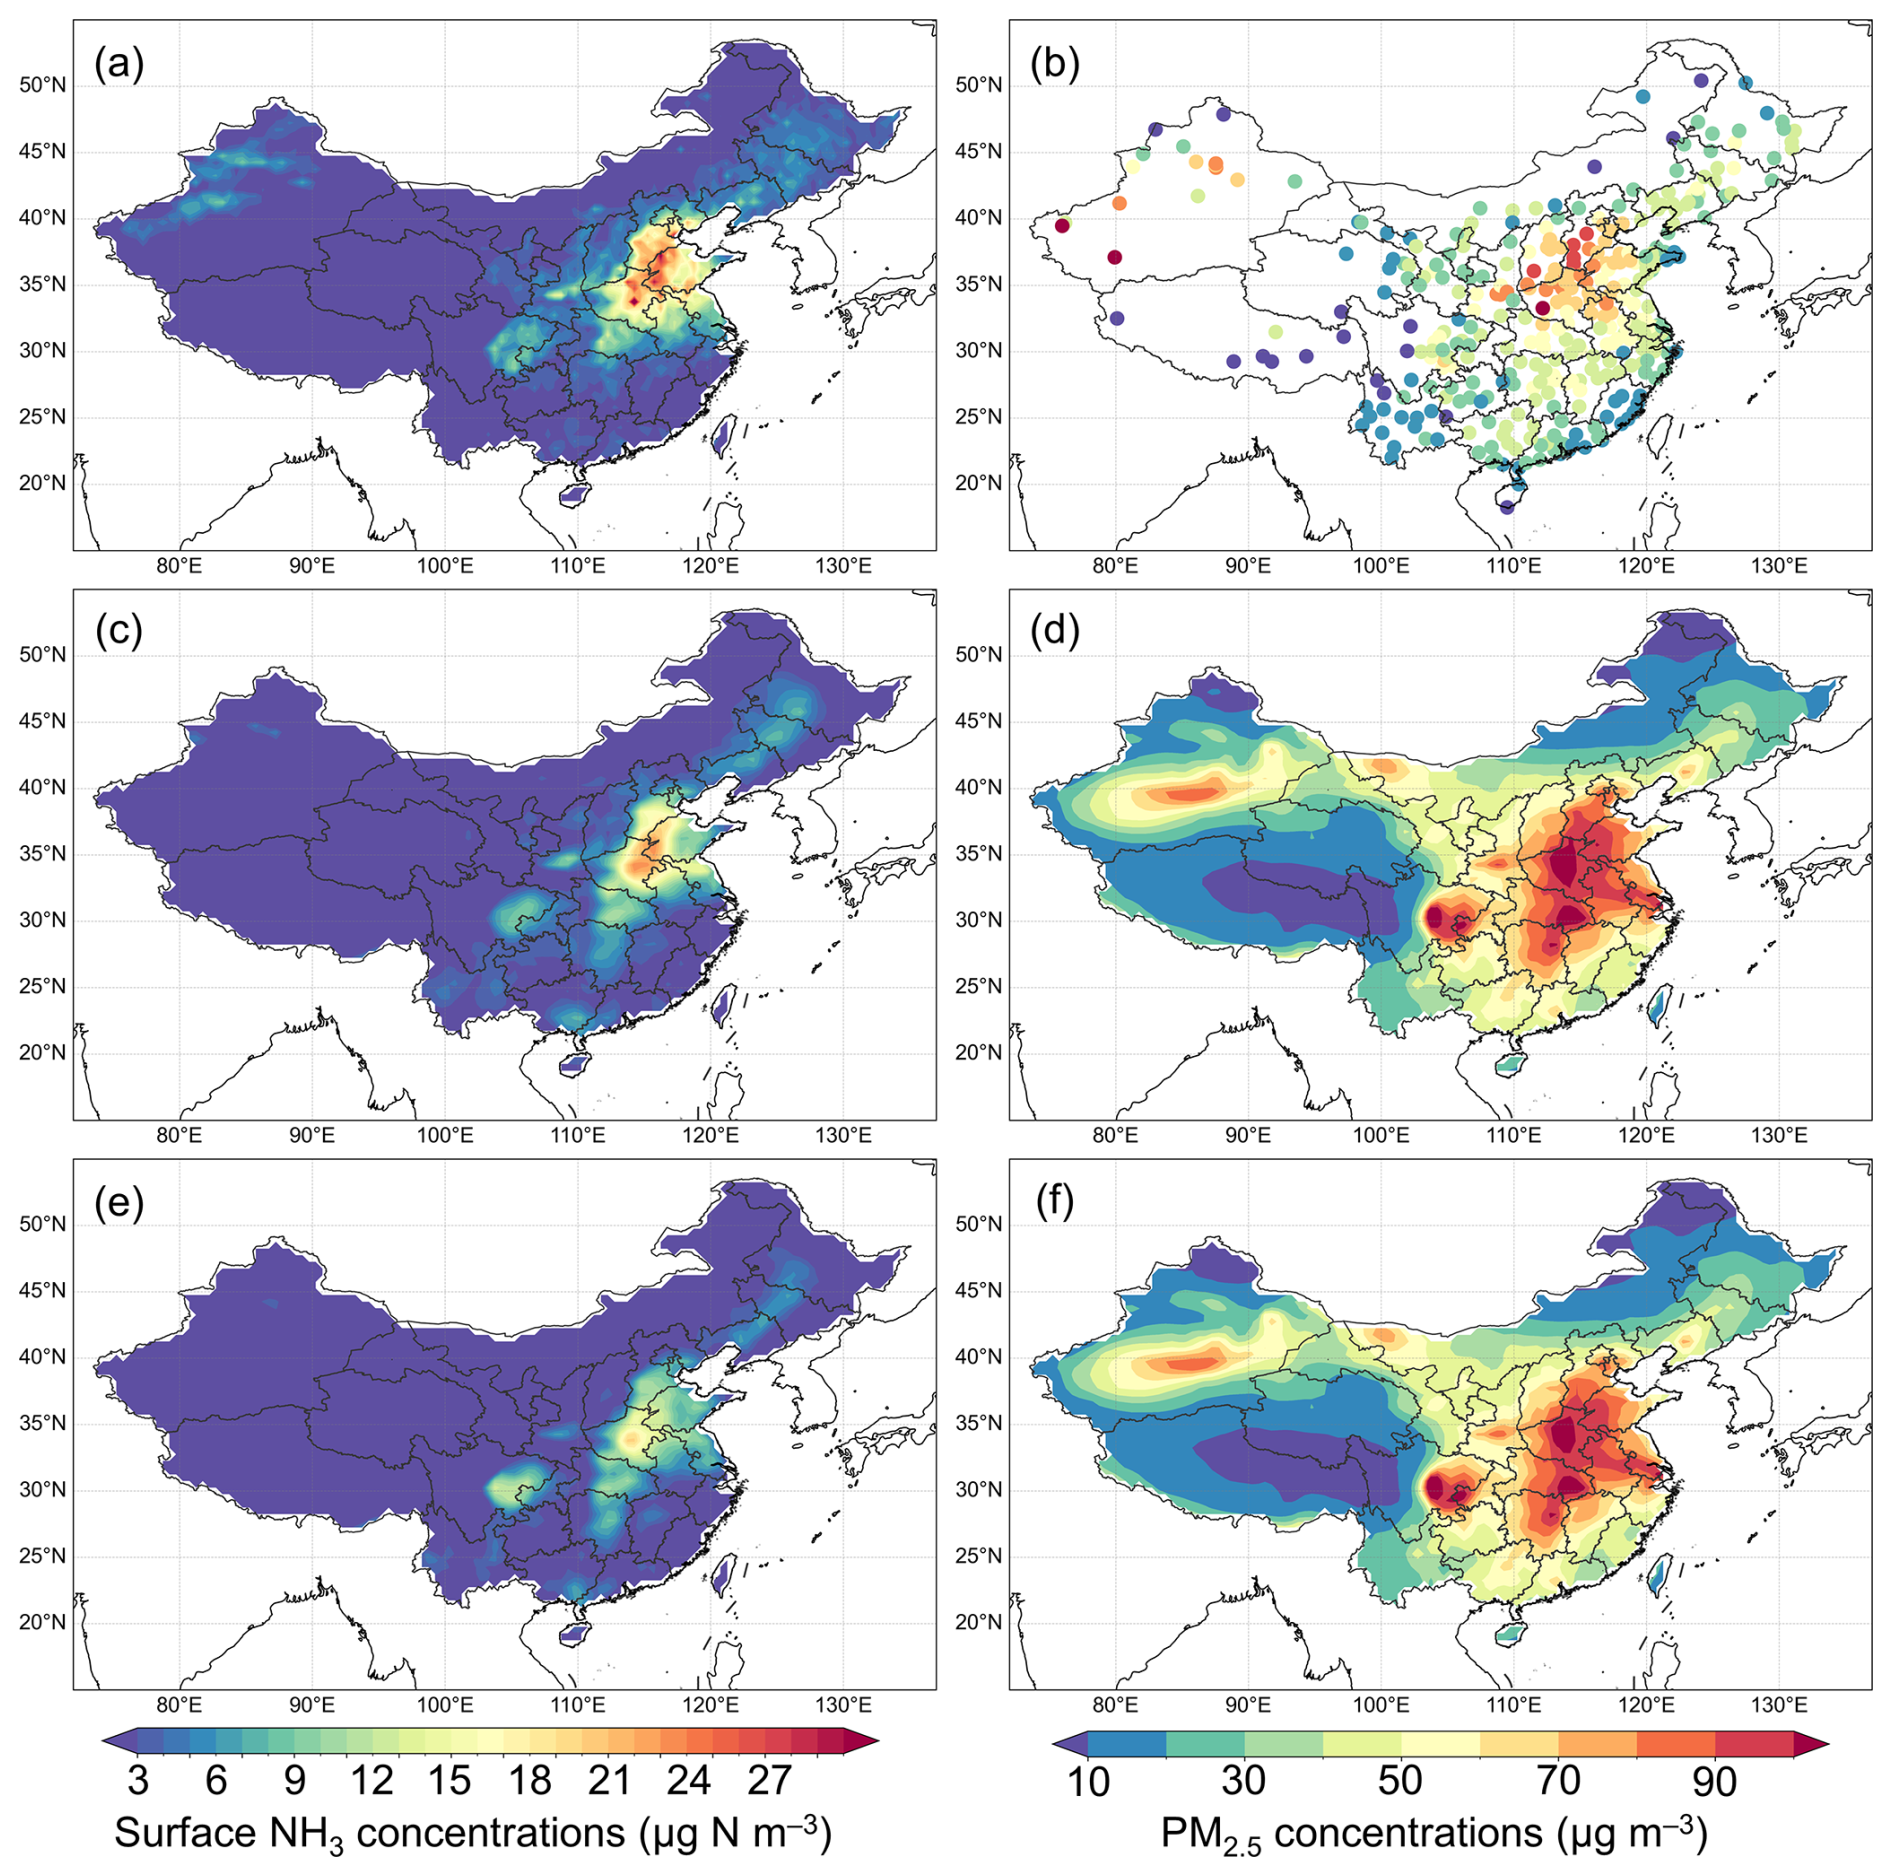
Figure 4(a) IASI-derived surface NH3 concentrations and (b) observed PM2.5 concentrations. The annual mean surface NH3 concentration in 2017 simulated by (c) our inventory and (e) the MEIC. The annual mean ground-level PM2.5 concentration in 2017 simulated by (d) our inventory and (f) the MEIC.
The PM2.5 simulation errors in GCHP driven by our inventory and the MEIC are similar across China. The spatial correlation between simulations and field measurements (n = 363) is slightly improved with our inventory (R = 0.66) over the MEIC (R = 0.64). The improvement is observed in HHH, where the spatial correlation has increased from 0.46 (MEIC) to 0.53 (our inventory). In terms of annual mean bias, the RMSE of our inventory is 26.6 µg m−3, slightly higher than the 26.2 µg m−3 of the MEIC. However, it should be noted that GCHP tends to overestimate PM2.5 concentrations, particularly in the Sichuan Basin and the Hubei and Hunan provinces, which aligns with previous research findings (Xie and Liao, 2022; Zhai et al., 2021). The NH3 emissions in this study are higher than in the MEIC, while the emissions of all other air pollutant emissions are from the MEIC. As a result, the simulated PM2.5 concentrations driven by our inventory (annual mean = 37.2 µg m−3) are slightly higher than those of the MEIC (annual mean = 36.3 µg m−3).
The overestimation of PM2.5 concentrations in GEOS-Chem is a well-known issue in China. Several studies, including Xie and Liao (2022) and Zhai et al. (2021), reported that the model consistently overestimates PM2.5 levels. Specifically, the modeled PM2.5 concentrations in 2017 were 15.1 % higher than the observed values, and summer PM2.5 concentrations in North China were overestimated by up to 33 % in 2016. The overestimation is primarily attributed to the overestimation of nitrate in the model, especially during nighttime periods (Zhai et al., 2021; Miao et al., 2020; Chen et al., 2019). The simulation performance for ammonium in GEOS-Chem is found to be superior to that of nitrate, with only a 6 % deviation from measured values (Miao et al., 2020). The overestimation of nitrate may arise from uncertainties in emission data, meteorological conditions and modeled chemical mechanisms. Improving the representation of chemical processes is crucial for addressing this issue (Miao et al., 2020). A better understanding of the atmospheric reactive nitrogen budget, particularly the role of photolysis of particle-phase nitrate, is necessary. Furthermore, model investigation can benefit from simultaneous measurements of major reactive nitrogen species, which can provide critical datasets for refining and evaluating the performance of GEOS-Chem.
3.2 Nitrogen use efficiency of agricultural systems
Figure 5 illustrates the NUE of crops in China at the provincial level in 2017. The NUE of cereal crops is around 0.5, higher than that of economic crops. Orchards, on the other hand, tend to have the lowest NUE, which is consistent with previous reports (Zhang, 2021). Notably, Heilongjiang demonstrates the highest NUE values across various crops, including rice (0.82), wheat (0.83), maize (0.77), fruits (0.71) and the whole crop system (0.70). This is also the reason why the NH3 losses in Heilongjiang are low. To better understand the spatial patterns of NUE, we divided mainland China into six agricultural sub-regions (definitions and distribution can be found in Fig. 3d and Table S11). The NUE of these sub-regions is shown in Fig. S4. In terms of rice, NE demonstrates the highest NUE, with a value of 0.71, followed by SW (0.57) and MLYR (0.51). Rice-producing regions such as Jiangxi, Hunan, Hubei and Sichuan have NUE values higher than the national average. In contrast, Jiangsu and Anhui, also major rice-producing areas, have lower NUE values of 0.44 and 0.43, respectively. Regarding the NUE of wheat, NE leads with a value of 0.78, followed by HHH (0.56) and MLYR (0.51), while SC is only 0.22. Henan, Shandong and Anhui, the top three wheat-growing provinces, exhibit commendable nitrogen utilization, with NUE values of 0.59, 0.60 and 0.61, respectively. However, with extensive wheat planting, Jiangsu and Hebei show lower NUE values of 0.45 and 0.47, respectively. For the NUE of maize, NE and HHH perform well, with NUE values of 0.67 and 0.55, respectively. Shaanxi and Yunnan, provinces with over 1000 thousand hectares of maize cultivation, exhibit notably low NUE values of 0.26 and 0.33.
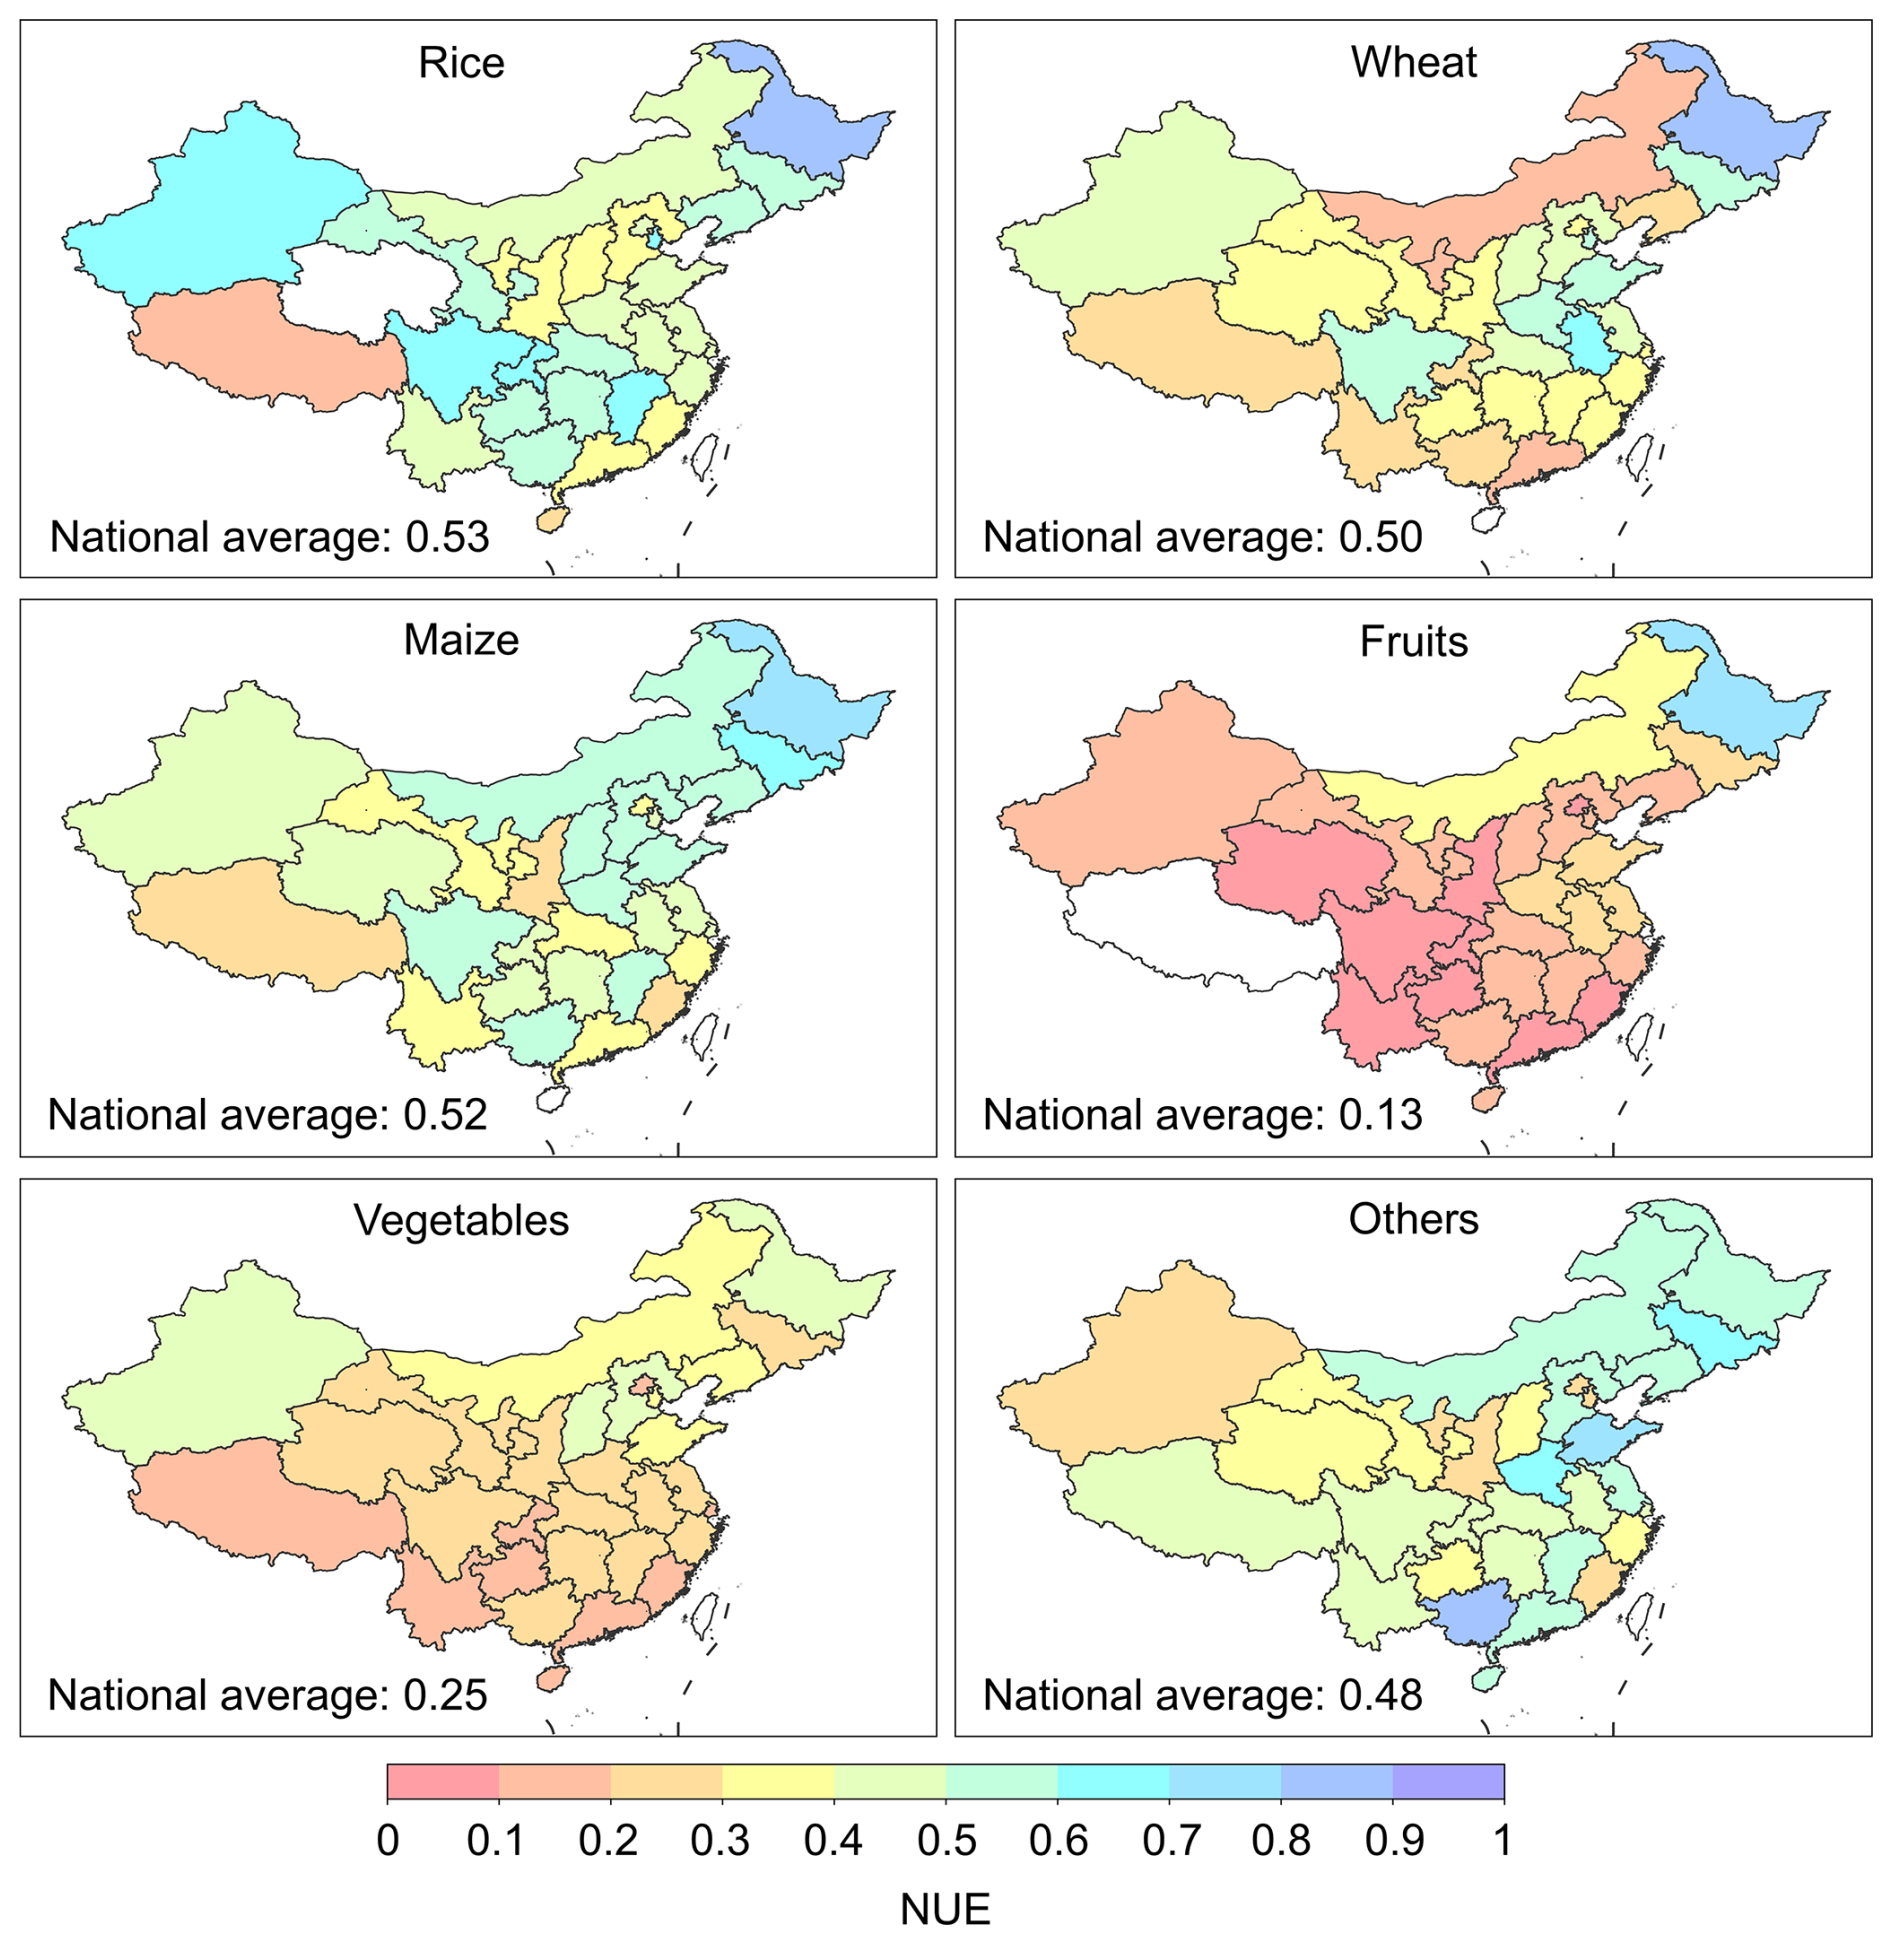
Figure 5Nitrogen use efficiency of six crop types in China in 2017. The inserted values are the national average NUE for each crop type.
The N management in orchard areas is better in HHH (NUE: 0.21) and MLYR (NUE: 0.16). However, in nine provinces, primarily in SW and SC, the NUE of fruits is below 0.1, with the lowest NUE recorded in Qinghai at 0.03. For vegetables, NUE is higher in northern China than in the south. Higher values could be identified in NE (0.36), HHH (0.34) and NW (0.31). The poor N management in fruits and vegetables highlights the potential for NH3 emissions. In addition to these major crops, we assessed the NUE of other crops (e.g., beans, potatoes, cotton, peanuts, rapeseed, sunflower, sugarcane, sugar beet, tobacco and tea). SC (0.69), HHH (0.65) and NE (0.56) display higher NUE than the national average. The estimated NUE patterns in the whole crop system, as depicted in Figs. S4a and S5a, show that the NUE follows a similar trend to previous results (Zhang, 2021), with the NE having the highest NUE, followed by the HHH, MLYR, SW, SC and NW regions.
Figure 6 presents the NUE of four livestock types in China. Similar to Bai et al. (2016), ruminants, including cattle, sheep and goats, have notably lower NUE compared to other animals. Specifically, the national average NUE of these ruminants is below 0.1. The type of livestock farm and its management level influence the NUE of whole livestock systems. In China, a west-to-east trend of increasing NUE of livestock systems is observed, as shown in Fig. S6b. Similar NUE values and spatial patterns have been reported in another localized nitrogen budget model (NUFER) (Jin et al., 2021; Bai et al., 2018). Based on this model, the NUEs of ruminants and monogastric animals are ∼ 0.05 and ∼ 0.25, respectively. For cattle, the NUE is significantly higher in northern China (e.g., NE, HHH and NW) than in the south (Fig. S5b). The highest NUE can be observed in Shanghai at 0.36, followed by Beijing (0.27) and Tianjin (0.23). These megacities have stricter environmental regulations and more welling to improve the management of livestock farms. In the case of sheep and goats, NUE for all provinces remains at a low level, ranging from 0.03 to 0.1, indicating poor N management. The national average NUE of pork is 0.272, below the European level of 0.35. Higher NUE is found in NE, MLYR and HHH. SW, having approximately a quarter of the nation's pork farms, is leading the way in N losses. Regarding the NUE of poultry, northern China also performs better than the south. The highest NUE (0.4) is observed in Inner Mongolia, which may be attributable to lower temperatures, and better N management also occurs in the Beijing–Tianjin–Hebei region. However, the NUE values for all provinces in China are lower than the European level of 0.55.
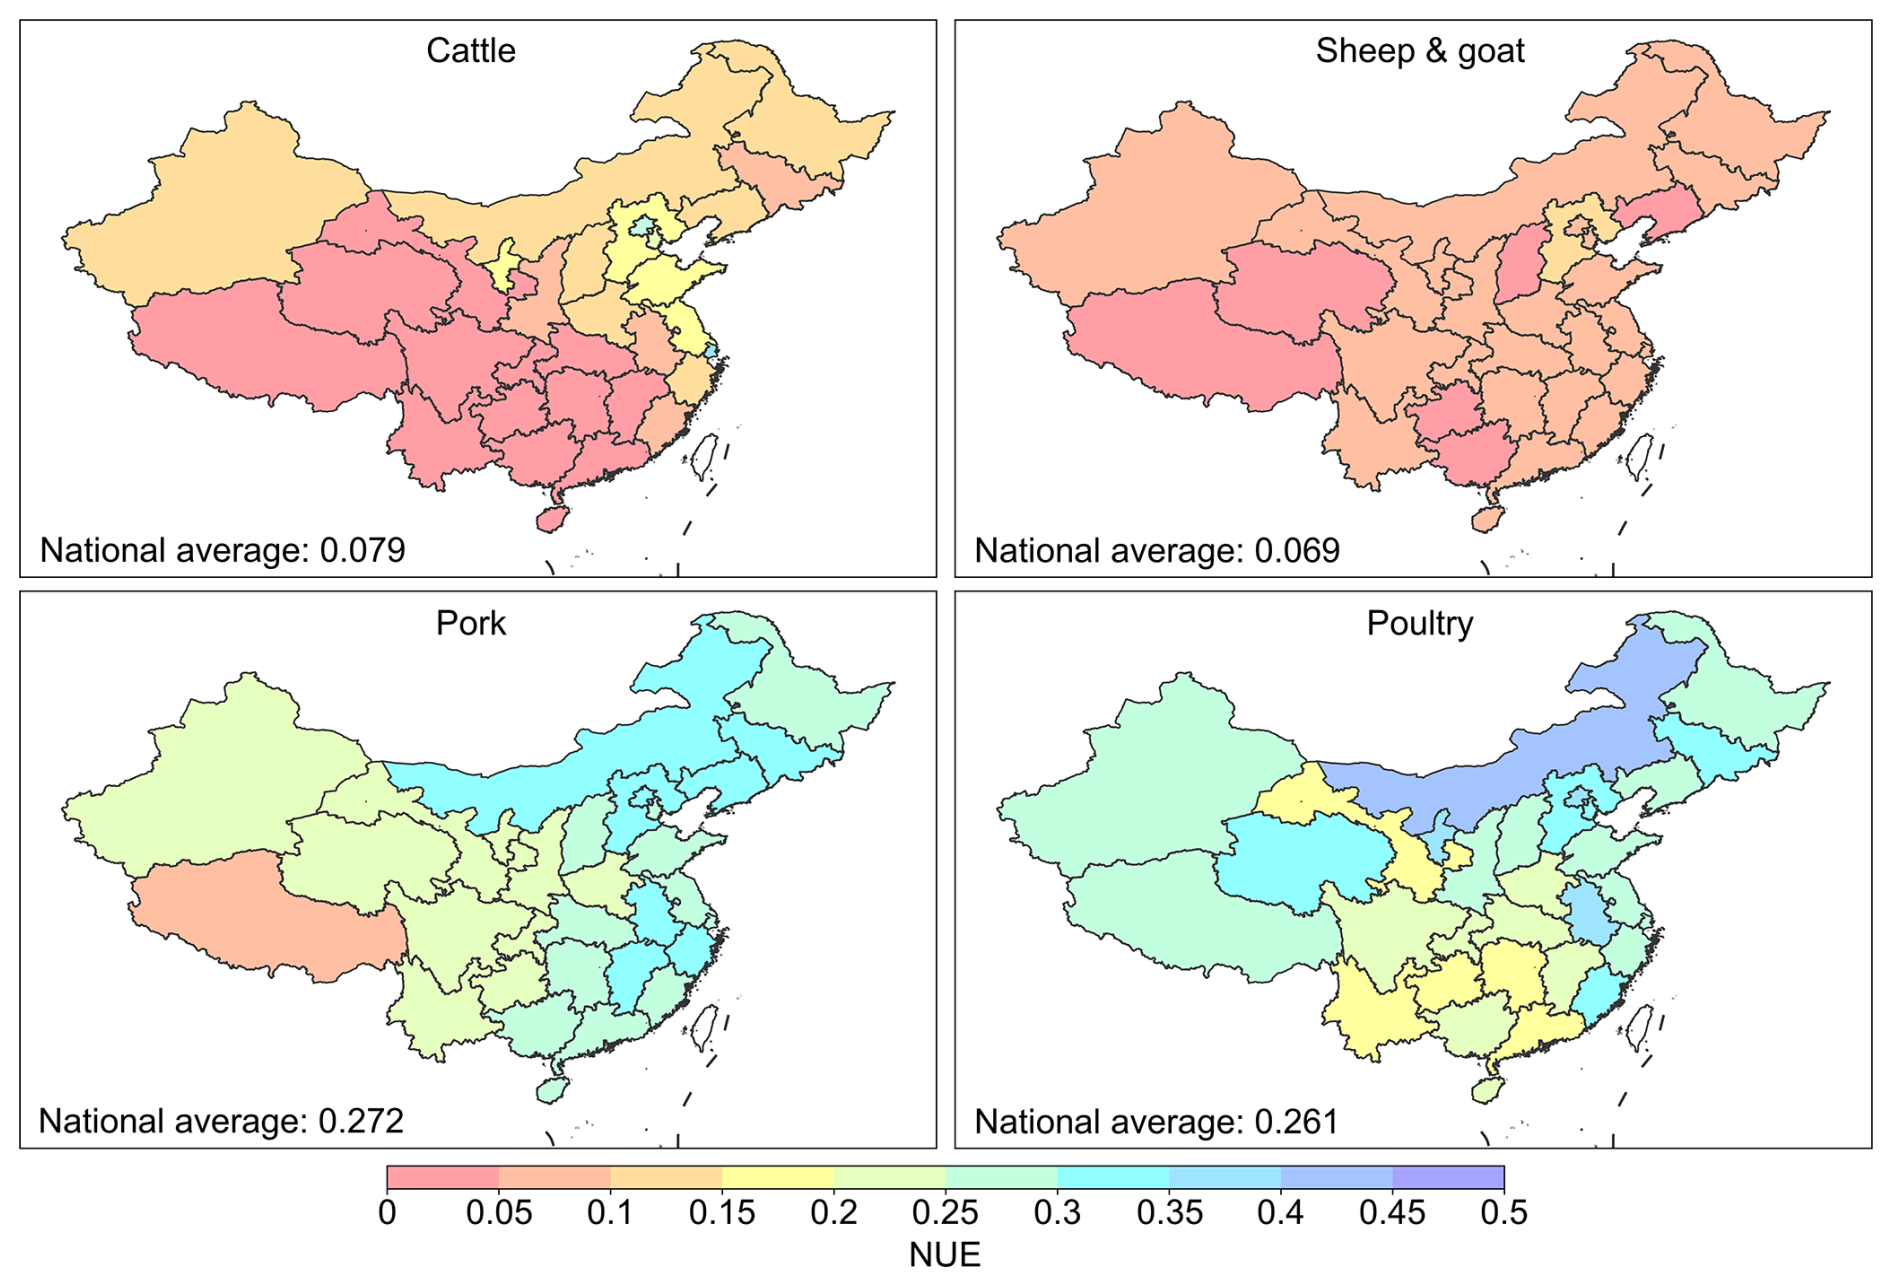
Figure 6Nitrogen use efficiency of four livestock types in China in 2017. The inserted values are the national average NUE for each livestock type.
Organic fertilizer is also an important N source for crops. Due to the lack of precise data on organic fertilizer application rates for different crops, we estimated the quantity of organic fertilizer used in each province based on previous studies and available information (Fig. 7) (Gu et al., 2015; Zhang et al., 2023). In 2017, 8.43 Tg N of organic nitrogen fertilizer was applied to croplands, representing only 22.2% of the total anthropogenic N inputs, including organic and chemical sources. Among these inputs, livestock manure contributes 4.27 Tg N, while human excretion accounts for 1.81 Tg N, and 2.35 Tg N originates from crop straw recycling to the croplands. The CHANS model estimates a substantial N content of 14 Tg N yr−1 in livestock excretion, indicating a sizable synthetic fertilizer substitution potential through manure. However, these manure resources are spatially mismatched with croplands, which may increase the environmental risks induced by manure. For example, livestock manure N exceeds crop harvest N in Tibet, Beijing, Yunnan, Qinghai and Gansu. Furthermore, we examined the organic fertilizer use ratio (Fig. 7a). Organic fertilizer use was significantly higher in western China, for example 47.8 % in Gansu and 32.2 % in Ningxia, compared to eastern China, for example Jiangsu (13.6 %) and Guangdong (15.5 %).
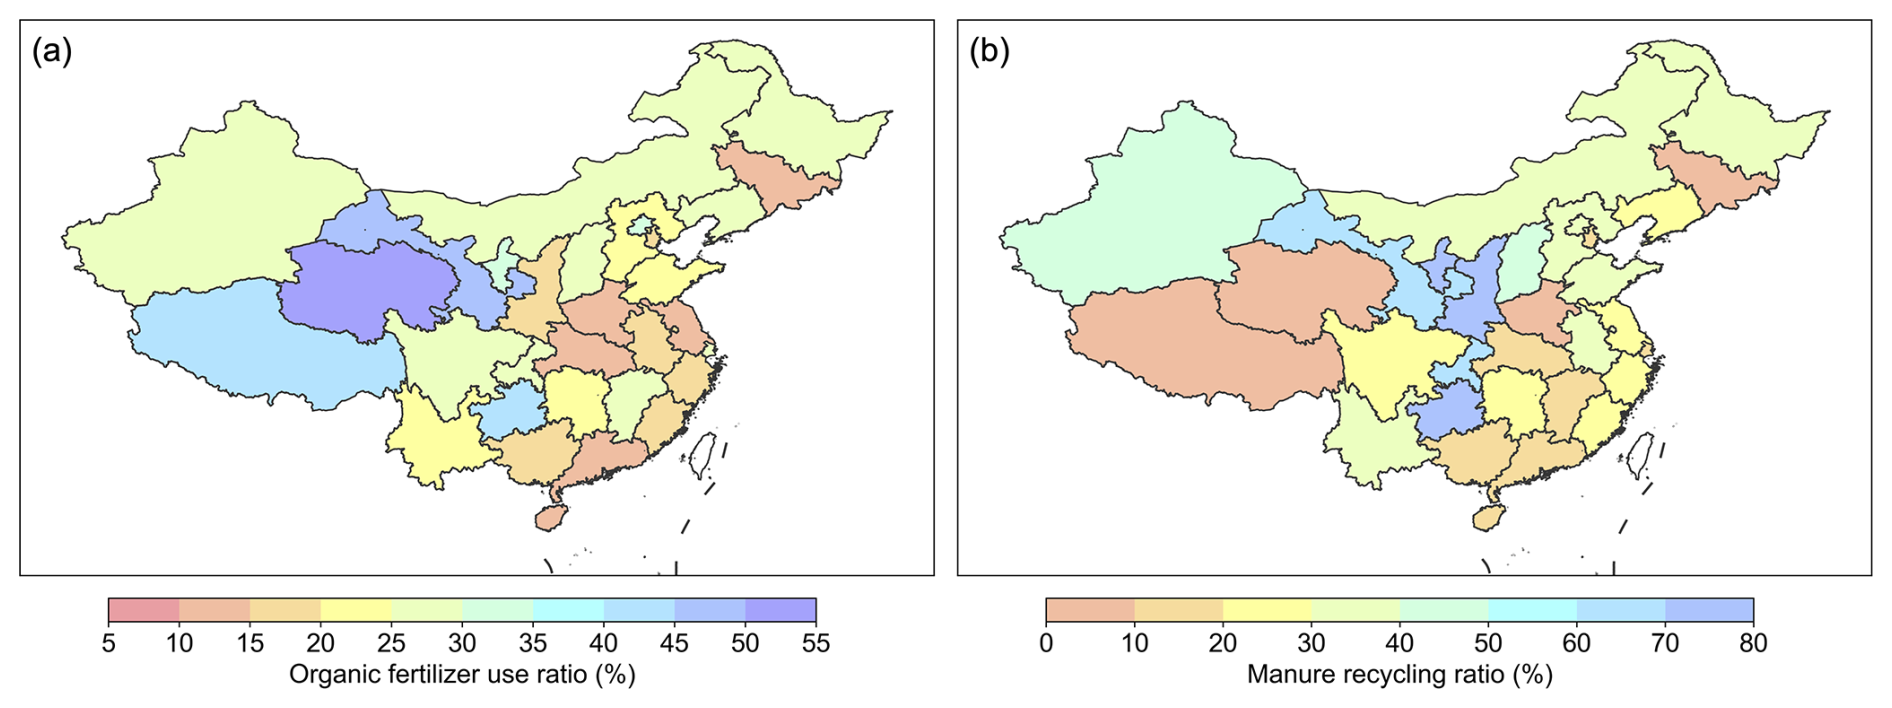
Figure 7(a) Organic fertilizer use ratio and (b) manure recycling ratio to cropland derived from Zhang et al. (2023).
It is observed that NE performs better in managing the N of crop systems, especially in Heilongjiang, which benefits from favorable natural conditions and high agricultural mechanization. As a result, despite substantial agricultural production, Heilongjiang experiences minimal NH3 losses. Recently, Liu et al. (2023) reported a noticeable improvement in the NUE of grain crops in China via regulated fertilizer use. Controlling fertilizer use to improve efficiency can also improve NUE. In addition, due to the inability to accurately know the planting area of specific fruits and vegetables, this study only collectively evaluated nitrogen management levels for all fruits and vegetables. It is important to recognize that different fruit or vegetable types require varied N management practices, which can significantly affect NUE. For instance, in Shaanxi, where apple cultivation accounts for half of the orchard area, excessive fertilizer use is a serious issue, resulting in a low NUE of 0.09 for the orchard (Zhang, 2021). Vegetables and fruits have lower NUE than grain crops, emphasizing the importance of improved N management practices for vegetable and fruit cultivation to reduce NH3.
Regarding ruminants, NUE is notably higher in the northern regions, including Ningxia, Hebei and Inner Mongolia, where pastoral areas exhibit low nitrogen losses from grazing systems. Moreover, provinces with a prominent presence of industrial livestock farms, such as Beijing, Tianjin and Shanghai, demonstrate NUE levels surpassing the national average. Considering all livestock systems, NUE is significantly higher in the economically developed and livestock-intensive eastern regions compared to the western regions. Industrial livestock systems tend to have better herd management with lower NH3 emissions at the housing and storage stages of manure management. In the western regions, smallholders often adopt an integrated farming system, which enables timely manure recycling to croplands. In the eastern regions, more industrial livestock farms exacerbate the decoupling of crops and livestock, preventing manure from being used in the fields, which may increase NH3 emissions from livestock waste. Therefore, despite the better management and production efficiency of industrial farms, if their large amounts of livestock manure are not treated promptly, NH3 emissions from the entire agricultural systems would increase.
3.3 Scenario analysis
3.3.1 Agricultural NH3 emission reductions
Mitigation efficiencies were calculated based on the targets and baseline conditions of different scenarios, as shown in Fig. 8. The NUE-C scenario can reduce agricultural NH3 emissions by 2.05 Tg NH3 via a reduction in synthetic fertilizer use, with a mitigation efficiency of 18.3 %. In the major grain-producing regions, such as Heilongjiang, Jilin, Henan and Inner Mongolia, the mitigation potential of improving NUE-C is limited (below 15 %). In contrast, Jiangsu, also a major grain-producing province, still has a significant potential for emission reduction, with a mitigation efficiency of 39.9 %. Shaanxi and Zhejiang also exhibit high abatement efficiency, surpassing 40 %. Another practical approach for reducing synthetic fertilizer use is increasing organic fertilizer use, which can help reduce 1.86 Tg of NH3 emissions. Compared to the NUE-C scenario, the OUR scenario is more effective in NE and HHH, while both options yield similar effects for Jiangsu, Shaanxi and Guangdong. Improving the NUE of the livestock systems, similar to previous findings (Zhang et al., 2020), results in lower benefits compared to the NUE-C scenario. Only 1.25 Tg of NH3 emissions from livestock can be mitigated under the NUE-L scenario. Several provinces with large livestock populations, such as Henan, Hebei and Hubei, show mitigation efficiencies of less than 10 %. Integrating the three pathways mentioned above could decrease 4.41 Tg of NH3 emissions, including 3.16 Tg of fertilizer-related reductions and 1.25 Tg of livestock waste-related reductions. Provinces in SC and MLYR exhibit mitigation efficiencies exceeding 40 %, with the highest observed efficiency of 52.9 % in Shaanxi.
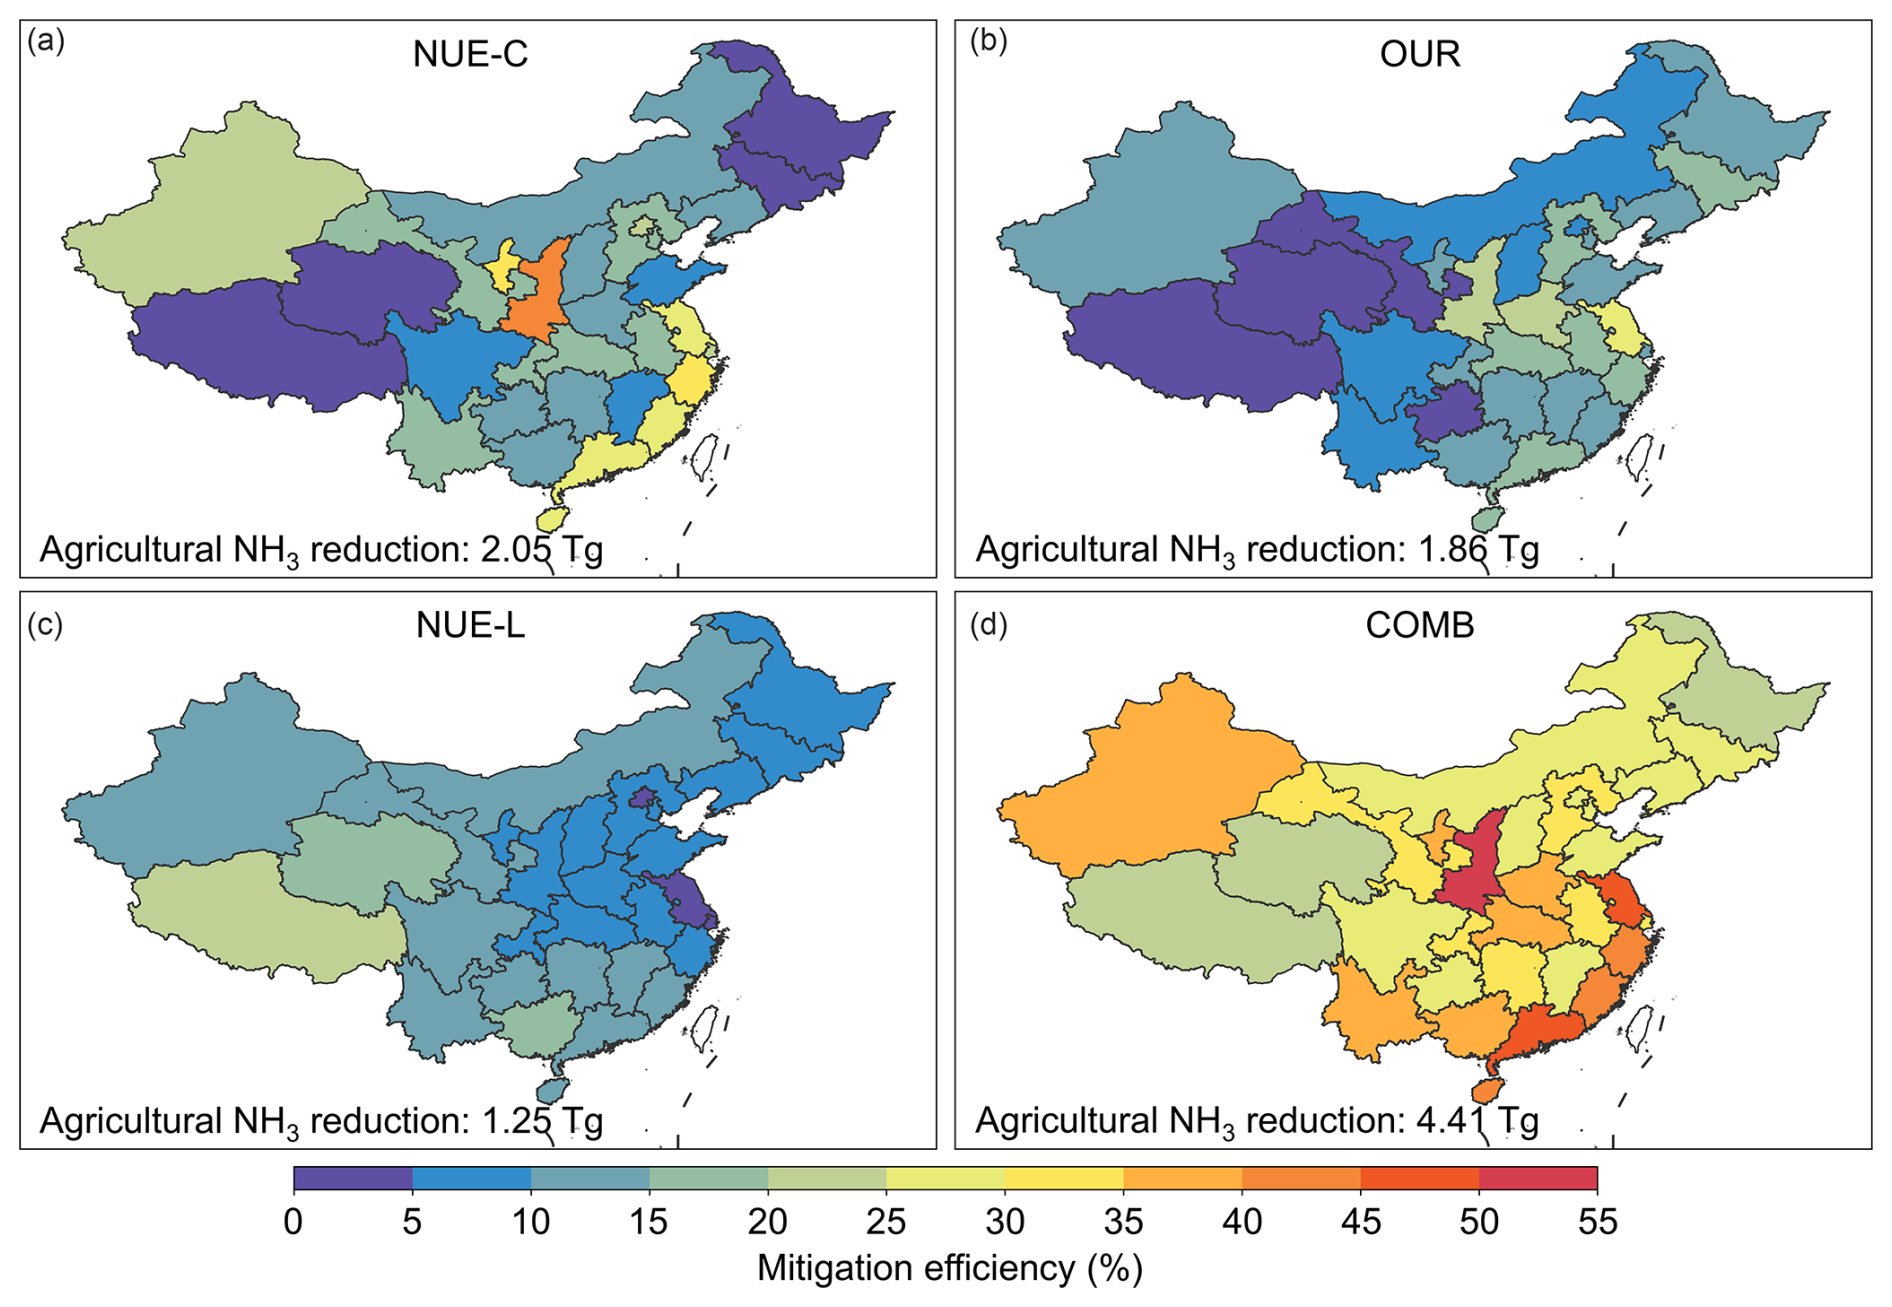
Figure 8Mitigation efficiencies of (a) NUE-C, (b) OUR, (c) NUE-L and (d) COMB scenarios. Mitigation efficiency is the ratio of NH3 emission reduction to baseline NH3 emission.
We further examined the contribution of different crop and livestock types to emission reduction, which can help us identify areas where urgent efforts are needed (Fig. 9). Under the NUE-C scenario, synergic efforts with all crops are needed across China, with vegetables making the largest contribution at 25.6 %. Vegetables also hold a dominant position in HHH (31.8 %), MLYR (32.7 %), SW (33.9 %) and SC (37.9 %), reflecting the urgency to enhance N management of vegetables. Fruits also contribute significantly, particularly in SC (31.2 %). When comparing the NUE-C scenario to OUR + NUE-C, the importance of grain crops in grain-producing regions such as NE, HHH and MLYR becomes more prominent with the improvement of organic fertilizer use (OUR). As for livestock, more efforts can be made for cattle, sheep and goats for SW and NW, as well as for poultry and pork for SC, HHH and MLYR. Overall, across all provinces except Sichuan, the reduction in NH3 emissions is primarily achieved through improvements in cropland systems (Table S9).
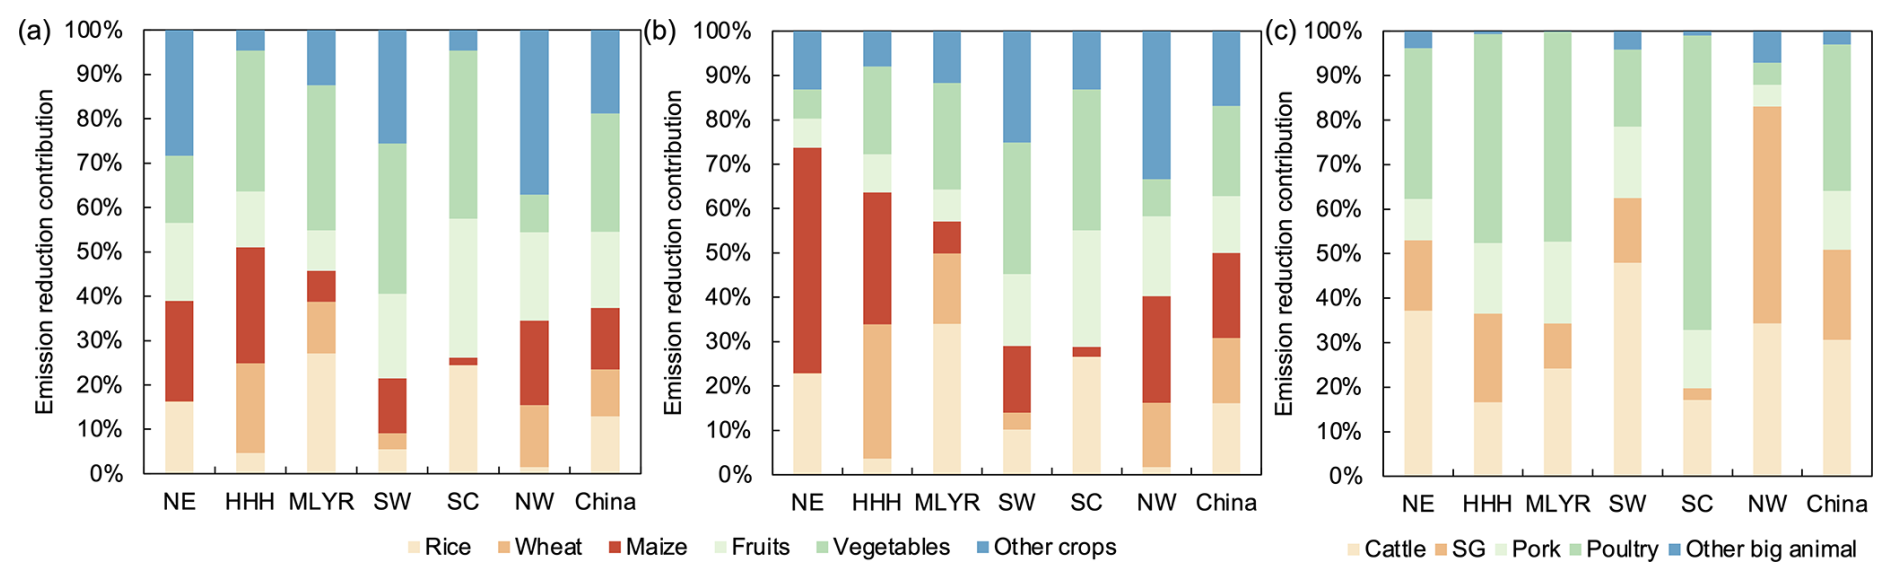
Figure 9Contribution of different crop or livestock to emissions reductions under (a) NUE-C, (b) OUR + NUE-C and (c) NUE-L scenarios.
3.3.2 PM2.5 reductions
Figure 10 shows the benefits of different mitigation scenarios for PM2.5 concentrations. The reductions are the most profound in central, eastern and southern China. Under the NUE-C scenario, a 15.5 % reduction in NH3 emissions leads to a 2.2 % decrease (0.83 µg m−3) in the annual average PM2.5 concentration for China. Notably, significant improvements could be found in Zhejiang, with a 6.8 % reduction (4.1 µg m−3) in annual PM2.5. Shaanxi also demonstrates considerable reductions, with a 4.7 % decrease (2.8 µg m−3) in PM2.5. Under the OUR scenario, a 14.1 % reduction in NH3 emissions results in a 1.9 % mitigation of the annual national average PM2.5 (0.7 µg m−3). Hotspots of PM2.5 reductions are observed in Henan (2.8 µg m−3); Hubei (2.7 µg m−3); and the junction of Anhui, Jiangsu and Zhejiang (2.8–2.9 µg m−3). For NUE-L, the removal effects of PM2.5 are relatively lower, with hotspots in the south. A reduction of 9.4 % in NH3 emissions has resulted in a 1.3 % decrease in annual PM2.5 concentration (0.5 µg m−3) over China. Notable PM2.5 reductions are found in Sichuan, Hunan, Guangdong and Guangxi. For example, a 10.7 % NH3 reduction leads to a 2.4 % PM2.5 reduction (1.9 µg m−3) in Hunan. The national annual average PM2.5 concentration experiences a decrease of up to 2.0 µg m−3 via the integration of three measures. Regions such as Zhejiang, Hubei and Hunan experience even more significant reductions, reaching nearly 7.0 µg m−3. The enhancement in air quality resulting from the decrease in NH3 emissions per unit will escalate with the amplification of NH3 emission reductions, indicating a nonlinear PM2.5 response to NH3 (Ye et al., 2019).
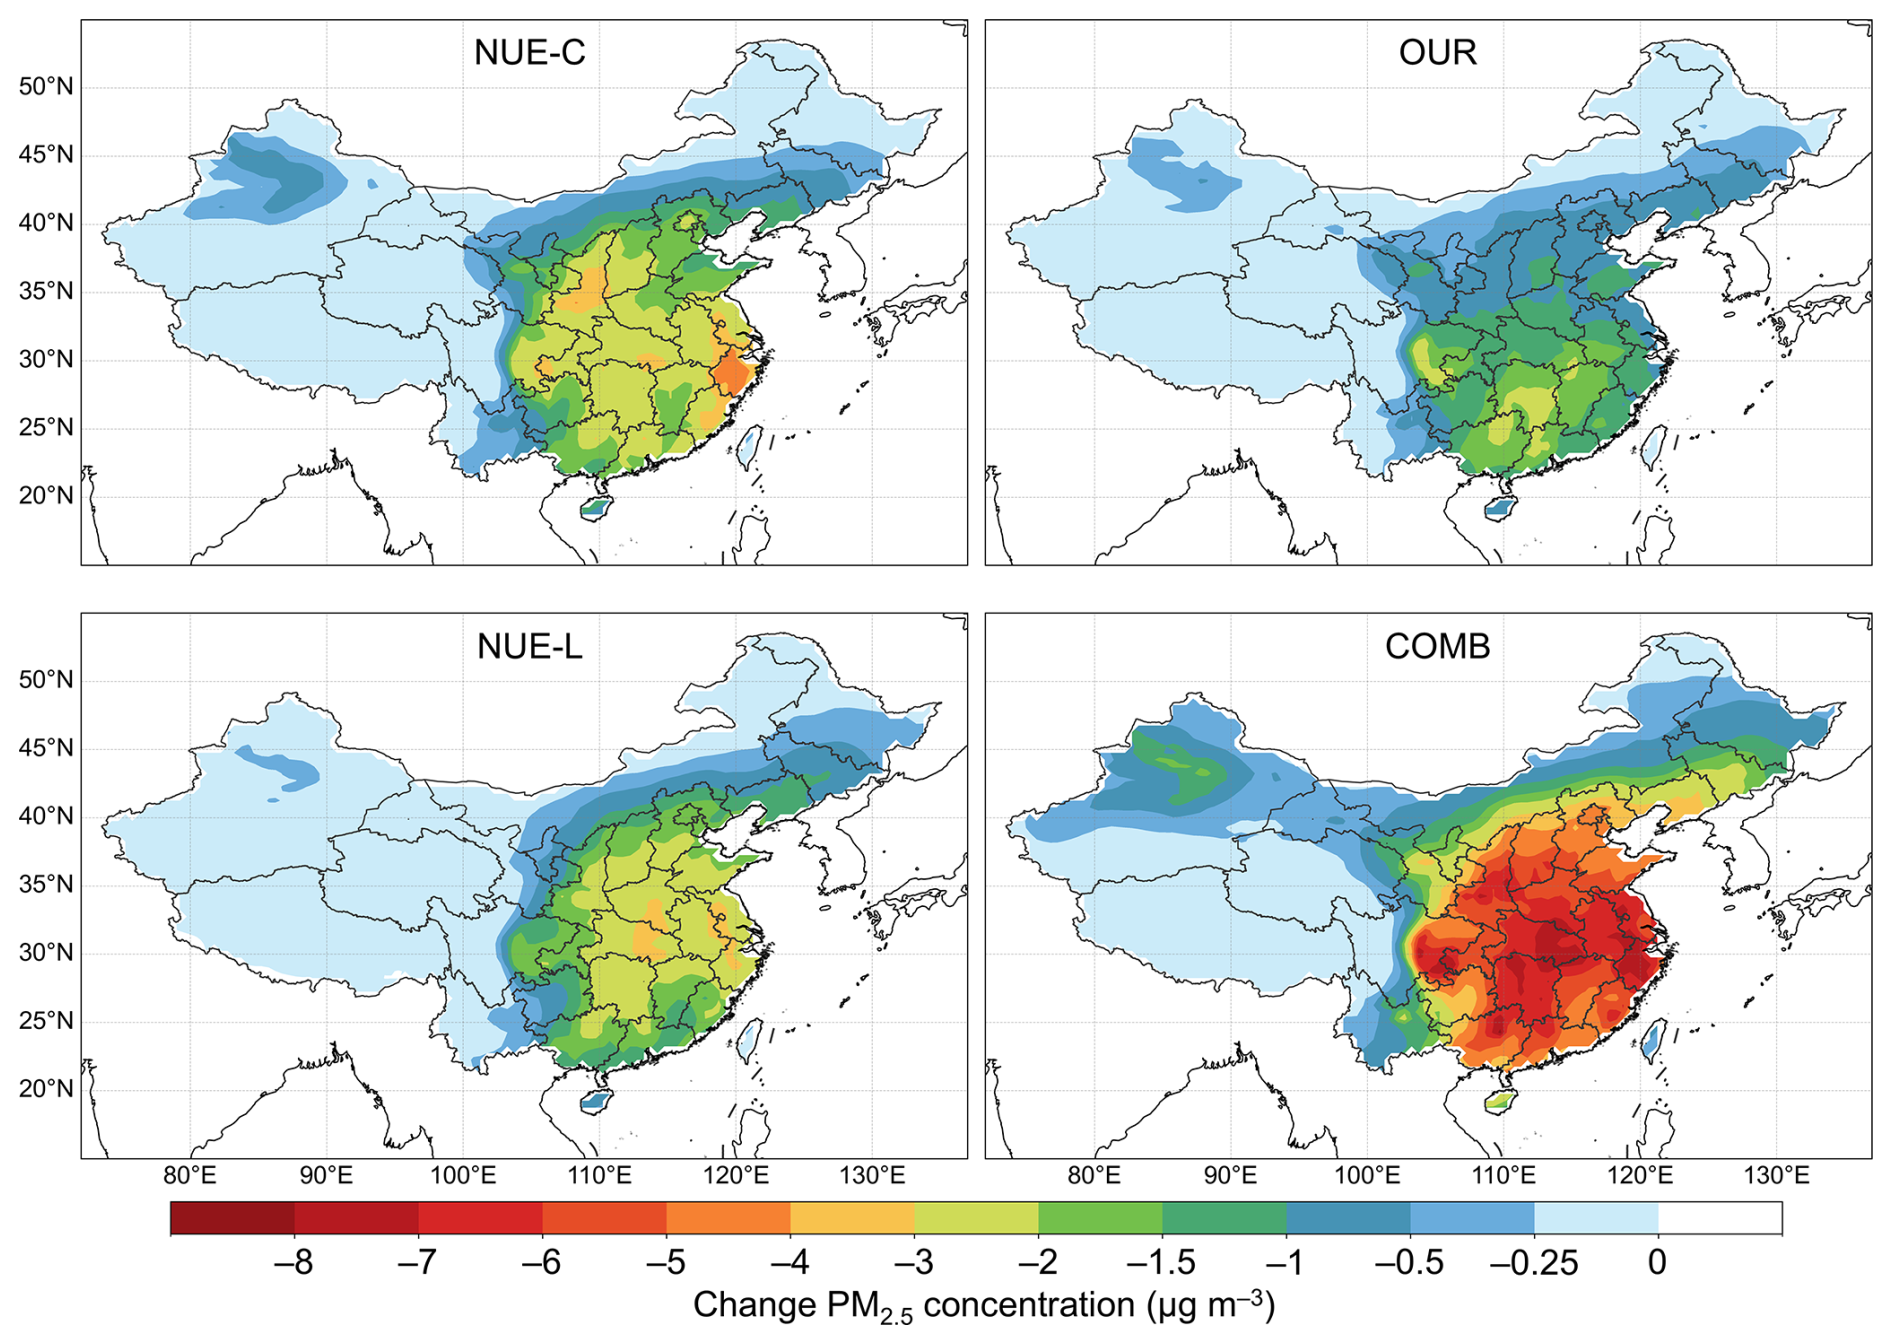
Figure 10Changes in ground-level PM2.5 concentration of different mitigation scenarios.
To better understand the public health benefits resulting from NH3 abatements, we calculated population-weighted PM2.5 (PM2.5,p) concentrations. It provides insights into the mitigation of human exposure in different regions during different seasons (Fig. 11). In 2017, the seasonal pattern of PM2.5,p followed the order winter > autumn > spring > summer. The annual PM2.5,p declines by 1.8, 1.6, 1.3 and 4.1 µg m−3 under the NUE-C, OUR, NUE-L and COMB scenarios, respectively. Compared to PM2.5, a larger decrease is observed in PM2.5,p, indicating that greater health benefits could be obtained from NH3 mitigation-related air quality improvements. The fertilizer-related control scenarios (NUE-C and OUR) demonstrate more significant benefits in summer and spring due to high fertilizer-related emissions during these seasons. Conversely, the livestock-related control scenarios (NUE-L) show greater benefits in winter. With high population density and NH3 abatement efficiencies, MLYR and HHH exhibit higher health benefits. In the case of NUE-L, SW shows the highest outcomes, slightly surpassing SC and MLYR. On the other hand, NE consistently shows the lowest effects across all scenarios.
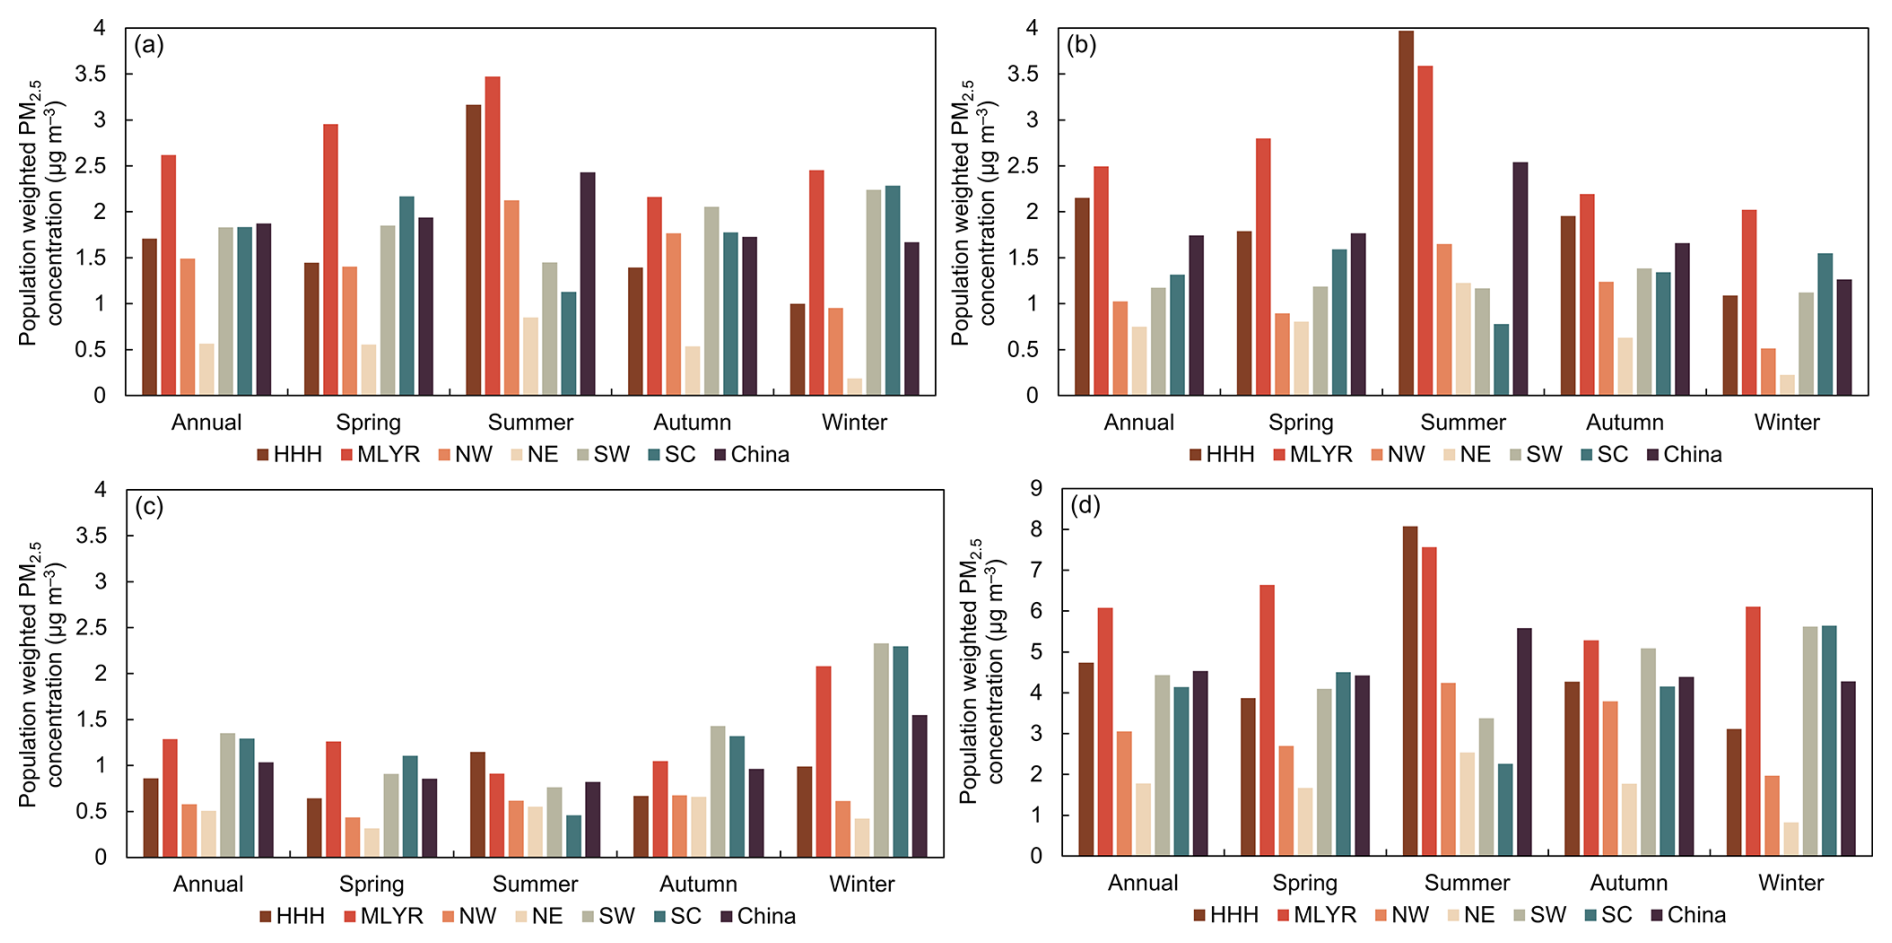
Figure 11Seasonal population-weighted PM2.5 concentration reductions under (a) NUE-C, (b) OUR, (c) NUE-L and (d) COMB.
This study aims to explore the relationships between agricultural NUE and air pollution and further provides tailored recommendations (crop-, livestock- and region-specific) for NH3 control in agriculture. To achieve this, we integrated a new NH3 emission inventory, a nitrogen flow model and an air quality model for a comprehensive analysis. First, we estimated China's agricultural NH3 emissions in 2017 based on the total use of synthetic fertilizers in croplands, livestock population and their corresponding localized emission factors, accounting for the impacts of meteorological, soil and management factors. Leveraging detailed spatial data on crop cultivation areas and livestock distribution, we utilized a bottom-up estimation method to develop a crop- and livestock-specific NH3 emission inventory at 1 km. Subsequently, the newly developed NH3 emission inventory was incorporated into the GCHP model to simulate surface atmospheric NH3 and PM2.5 concentrations, with validation against observations. Finally, we employed the nitrogen flow model (CHANS) to explore the potential for agricultural NH3 reduction under scenarios of increasing crop NUE, livestock NUE and organic fertilizer usage. By establishing NH3 emission inventories under such mitigation scenarios using the bottom-up estimation method, we then utilized the GCHP model to evaluate the air quality improvements resulting from NH3 emission reductions.
Our findings reveal that improving NUE is crucial for reducing NH3 emissions and mitigating air pollution. Furthermore, we provide more insights into which areas should be prioritized and what optimal outcomes can be realized for different regions. Specifically, efforts in cropland systems (i.e., improving NUE and organic fertilizer use) are more effective than in livestock systems (i.e., enhancing NUE). Spatial disparities also exist in the effects of mitigation options. For example, improving organic fertilizer use is projected to be an effective way to control NH3 in grain-producing regions (e.g., HHH and NE). On the other hand, improving crop NUE is profitable in southern coastal China and Shaanxi Province. In terms of livestock systems, improving NUE can yield more significant benefits in the southern regions compared to the northern regions. Regarding specific species, although grain crops are responsible for substantial NH3 losses from cropland systems, the NH3 control of vegetables and fruits is much needed due to their severe overuse of synthetic fertilizers. It is noteworthy that the Chinese government launched the “Fertilizer Use Zero-Growth Action Plan by 2020” policy to control fertilizer use in 2015, which has dramatically reduced anthropogenic N inputs to croplands (Yu et al., 2022). This policy successfully reduces the N fertilizer use of grain crops, but limited progress has been observed in vegetables and fruits, highlighting the need for further actions. Furthermore, though not specifically examined in this study, intervention measures on the food demand side can also be effective in reducing NH3 emissions, such as reducing food loss and waste or adopting healthier, less meat-intensive diets to help reduce demand for agricultural products (Liu et al., 2021a).
Since the initiation of China's Air Clean Action Strategy in 2013, there have been significant reductions in SO2 and NOx emissions, notably alleviating PM2.5 pollution. However, effective control measures for NH3 emissions are lacking, potentially limiting further air quality improvements. It is noteworthy that the effectiveness of PM2.5 control through NH3 reduction will likely diminish as SO2 and NOx levels decrease further (Liu et al., 2021c) because in NH3-rich environments, there may be a scarcity of adequate acidic gases to neutralize the NH3, thereby constraining ammonium formation. Nevertheless, the significance of NH3 control via NUE improvement remains. From a cost perspective, the expense of NH3 abatement is only ∼ 10 % of that associated with NOx abatement (Gu et al., 2021). As China intensifies its efforts to reduce NOx emissions, the abatement costs are anticipated to rise. Furthermore, enhancing NUE not only curbs NH3 emissions but also lowers N2O emissions, nitrogen leaching to water, nitrogen deposition and fertilizer expenses, thus offering climatic, ecological and socioeconomic co-benefits.
Our research has various limitations. Due to a lack of data, this study only considers the spatial distribution of grain crops. Although grain crops account for nearly 60 % of the cultivated area in China, the spatial distribution of other crops still influences the spatial pattern of NH3 emissions. For livestock, although the year-end numbers are known, the monthly variations in the number of livestock are unavailable, which limits our understanding of the monthly changes in livestock-related NH3 emissions. In addition, the lack of region-specific EFs poses a challenge to accurately reproducing the spatial pattern of NH3 emissions. About 20 % of agricultural NH3 emissions were evenly distributed using simplifying assumptions, which may have led to uncertainties in gridded allocation. Such uncertainties may induce biases in NH3 and PM2.5 mitigation assessment. We utilized the CHANS model to calculate NUE for crop and livestock systems; however, nitrogen budget models like this suffer from uncertainties stemming from simplifications of the intricate nitrogen cycle and data deficiencies (Zhang et al., 2021a, b). The estimation uncertainty in nitrogen inputs was noted at ∼ 10%, whereas nitrogen output uncertainty could soar to ∼ 30%, primarily due to challenges in accurately predicting nitrogen levels in individual agricultural products (Zhang et al., 2021b). As for the improved NUE scenarios, while a range of specific actionable strategies can be implemented (Tables S9 and S10), it is crucial to acknowledge the challenges associated with executing these measures across different levels, considering the costs and anticipated outcomes. Moreover, our assumption of a simultaneous decrease in all nitrogen losses may not fully account for scenarios where certain measures prioritize NH3 control over other forms of nitrogen loss mitigation. In future work, more data on agricultural practices need to be collected to help us refine our analysis and policy recommendations.
Sustainable agriculture is farming in such a way as to satisfy human food needs, protect the environment, enhance the livelihoods of farmers, promote a more equitable society and make the most efficient use of resources. It should be environmentally friendly, economically viable and socially equitable, which is essential to help society achieve multiple sustainable development goals (SDGs). More sustainable agriculture is directly linked to SDG2 “zero hunger” for providing enough food for humans and should also help address SDG1 “no poverty” for ensuring farmers' livelihoods, SDG3 “good health and well-being” for more nutritious food and less agricultural pollution, SDG13 “climate action” for reducing greenhouse gas emissions, and various others more indirectly. It should be noted that these SDGs need to be achieved in synchrony. For example, controlling synthetic fertilizer use at an optimal rate can simultaneously increase net profits, reduce NH3 emissions and ensure crop yields, thereby benefiting air quality. Our study provides a solid analysis and support for such a pathway. Despite the crucial role of the agricultural sector in emissions, emission reduction targets for this sector lag those set for the energy, industrial and transportation sectors. Currently, only the European Union (EU) has set NH3 control targets, aiming to reduce NH3 emissions by 19% by 2030 compared to 2005 levels (EU, 2016). In 2023, China announced new “clean air actions”, which include NH3 as a target for the first time (https://www.gov.cn/zhengce/content/202312/content_6919000.htm, last accessed: 7 December 2024). However, specific targets have been assigned only to the Beijing–Tianjin–Hebei region, with a goal of a 5 % reduction by 2025 compared to 2020 levels. Our findings demonstrate that this target is attainable in the Beijing–Tianjin–Hebei region. We believe that our results can serve as an important reference for the government to develop specific targets and plans to help better control agricultural NH3 emissions toward clean air in the larger context of sustainable development.
The NH3 emission inventory is available on figshare at https://doi.org/10.6084/m9.figshare.28082276.v2 (Luo and Tai, 2024).
The supplement related to this article is available online at https://doi.org/10.5194/acp-25-10089-2025-supplement.
APKT conceived the study and supervised the writing of the paper. BL designed the study, conducted model simulations, analyzed the results and wrote the draft. LL provided surface NH3 datasets. DHYY, LTHN, JWZ and TGY assisted in GEOS-Chem simulations and the interpretation of the results. All authors contributed to the discussion and improvement of the paper.
At least one of the (co-)authors is a member of the editorial board of Atmospheric Chemistry and Physics. The peer-review process was guided by an independent editor, and the authors also have no other competing interests to declare.
Publisher’s note: Copernicus Publications remains neutral with regard to jurisdictional claims made in the text, published maps, institutional affiliations, or any other geographical representation in this paper. While Copernicus Publications makes every effort to include appropriate place names, the final responsibility lies with the authors. Regarding the maps used in this paper, please note that Figs. 3–8 and 10 contain disputed territories.
Amos P. K. Tai acknowledges the financial support of the Hong Kong Research Grants Council.
Amos P. K. Tai has been supported by the Hong Kong Research Grants Council (General Research Fund grant no. 14307722). Lei Liu has been supported by the National Natural Science Foundation of China (T2522038 and 42371324) and Gansu Province Outstanding Youth Fund Project (25JRRA629).
This paper was edited by Jeffrey Geddes and reviewed by two anonymous referees.
Abbatt, J. P. D., Benz, S., Czkzo, D. J., Kanji, Z., Lohmann, U., and Möhler, O.: Solid ammonium sulfate aerosols as ice nuclei: A pathway for cirrus cloud formation, Science, 313, 1770–1773, https://doi.org/10.1126/science.1129726, 2006.
Bai, Z., Ma, L., Jin, S., Ma, W., Velthof, G. L., Oenema, O., Liu, L., Chadwick, D., and Zhang, F.: Nitrogen, phosphorus, and potassium flows through the manure management chain in China, Environ. Sci. Technol., 50, 13409–13418, https://doi.org/10.1021/acs.est.6b03348, 2016.
Bai, Z., Ma, W., Ma, L., Velthof, G. L., Wei, Z., Havlík, P., Oenema, O., Lee, M. R. F., and Zhang, F.: China's livestock transition: Driving forces, impacts, and consequences, Sci. Adv., 4, eaar8534, https://doi.org/10.1126/sciadv.aar8534, 2018.
Bai, Z., Jin, S., Wu, Y., Ermgassen, E. zu, Oenema, O., Chadwick, D., Lassaletta, L., Velthof, G., Zhao, J., and Ma, L.: China's pig relocation in balance, Nat. Sustain., 2, 888–888, https://doi.org/10.1038/s41893-019-0391-2, 2019.
Battye, W., Aneja, V. P., and Roelle, P. A.: Evaluation and improvement of ammonia emissions inventories, Atmos. Environ., 37, 3873–3883, https://doi.org/10.1016/S1352-2310(03)00343-1, 2003.
Behera, S. N., Sharma, M., Aneja, V. P., and Balasubramanian, R.: Ammonia in the atmosphere: A review on emission sources, atmospheric chemistry and deposition on terrestrial bodies, Environ. Sci. Pollut. Res., 20, 8092–8131, https://doi.org/10.1007/s11356-013-2051-9, 2013.
Bey, I., Jacob, D. J., Yantosca, R. M., Logan, J. A., Field, B. D., Fiore, A. M., Li, Q., Liu, H. Y., Mickley, L. J., and Schultz, M. G.: Global modeling of tropospheric chemistry with assimilated meteorology: Model description and evaluation, J. Geophys. Res.-Atmos., 106, 23073–23095, https://doi.org/10.1029/2001JD000807, 2001.
Bouwman, A. F., Boumans, L. J. M., and Batjes, N. H.: Estimation of global NH3 volatilization loss from synthetic fertilizers and animal manure applied to arable lands and grasslands, Global Biogeochem. Cy., 16, 8-1–8-14, https://doi.org/10.1029/2000gb001389, 2002.
Chen, L., Gao, Y., Zhang, M., Fu, J. S., Zhu, J., Liao, H., Li, J., Huang, K., Ge, B., Wang, X., Lam, Y. F., Lin, C.-Y., Itahashi, S., Nagashima, T., Kajino, M., Yamaji, K., Wang, Z., and Kurokawa, J.: MICS-Asia III: multi-model comparison and evaluation of aerosol over East Asia, Atmos. Chem. Phys., 19, 11911–11937, https://doi.org/10.5194/acp-19-11911-2019, 2019.
Cheng, M., Quan, J., Yin, J., Liu, X., Yuan, Z., and Ma, L.: High-resolution maps of intensive and extensive livestock production in China, Resour. Environ. Sustain., 12, 100104, https://doi.org/10.1016/j.resenv.2022.100104, 2023.
Crippa, M., Solazzo, E., Huang, G., Guizzardi, D., Koffi, E., Muntean, M., Schieberle, C., Friedrich, R., and Janssens-Maenhout, G.: High resolution temporal profiles in the Emissions Database for Global Atmospheric Research, Sci. Data, 7, 121, https://doi.org/10.1038/s41597-020-0462-2, 2020.
Eastham, S. D., Long, M. S., Keller, C. A., Lundgren, E., Yantosca, R. M., Zhuang, J., Li, C., Lee, C. J., Yannetti, M., Auer, B. M., Clune, T. L., Kouatchou, J., Putman, W. M., Thompson, M. A., Trayanov, A. L., Molod, A. M., Martin, R. V., and Jacob, D. J.: GEOS-Chem High Performance (GCHP v11-02c): a next-generation implementation of the GEOS-Chem chemical transport model for massively parallel applications, Geosci. Model Dev., 11, 2941–2953, https://doi.org/10.5194/gmd-11-2941-2018, 2018.
EU: DIRECTIVE (EU) 2016/2284 OF THE EUROPEAN PARLIAMENT AND OF THE COUNCIL of 14 December 2016 on the reduction of national emissions of certain atmospheric pollutants, amending Directive 2003/35/EC and repealing Directive 2001/81/EC, Off. J. Eur. Union, L 344, 1–31, https://eur-lex.europa.eu/legal-content/EN/TXT/HTML/?uri=CELEX:32016L2284 (last access: 2 September 2025), 2016.
Fu, H., Luo, Z., and Hu, S.: A temporal-spatial analysis and future trends of ammonia emissions in China, Sci. Total Environ., 731, 138897, https://doi.org/10.1016/j.scitotenv.2020.138897, 2020.
Fu, X., Wang, S., Xing, J., Zhang, X., Wang, T., and Hao, J.: Increasing Ammonia Concentrations Reduce the Effectiveness of Particle Pollution Control Achieved via SO2 and NOX Emissions Reduction in East China, Environ. Sci. Tech. Let., 4, 221–227, https://doi.org/10.1021/acs.estlett.7b00143, 2017.
Gao, Z., Ma, W., Zhu, G., and Roelcke, M.: Estimating farm-gate ammonia emissions from major animal production systems in China, Atmos. Environ., 79, 20–28, https://doi.org/10.1016/j.atmosenv.2013.06.025, 2013.
Gelaro, R., McCarty, W., Suárez, M. J., Todling, R., Molod, A., Takacs, L., Randles, C. A., Darmenov, A., Bosilovich, M. G., Reichle, R., Wargan, K., Coy, L., Cullather, R., Draper, C., Akella, S., Buchard, V., Conaty, A., da Silva, A. M., Gu, W., Kim, G. K., Koster, R., Lucchesi, R., Merkova, D., Nielsen, J. E., Partyka, G., Pawson, S., Putman, W., Rienecker, M., Schubert, S. D., Sienkiewicz, M., and Zhao, B.: The modern-era retrospective analysis for research and applications, version 2 (MERRA-2), J. Climate, 30, 5419–5454, https://doi.org/10.1175/JCLI-D-16-0758.1, 2017.
Groenestein, C. M., Hutchings, N. J., Haenel, H. D., Amon, B., Menzi, H., Mikkelsen, M. H., Misselbrook, T. H., van Bruggen, C., Kupper, T., and Webb, J.: Comparison of ammonia emissions related to nitrogen use efficiency of livestock production in Europe, J. Clean. Prod., 211, 1162–1170, https://doi.org/10.1016/j.jclepro.2018.11.143, 2019.
Gu, B., Ju, X., Chang, J., Ge, Y., and Vitousek, P. M.: Integrated reactive nitrogen budgets and future trends in China, P. Natl. Acad. Sci. USA, 112, 8792–8797, https://doi.org/10.1073/pnas.1510211112, 2015.
Gu, B., Ju, X., Chang, S. X., Ge, Y., and Chang, J.: Nitrogen use efficiencies in Chinese agricultural systems and implications for food security and environmental protection, Reg. Environ. Change, 17, 1217–1227, https://doi.org/10.1007/s10113-016-1101-5, 2017.
Gu, B., Zhang, L., Dingenen, R. Van, Vieno, M., Grinsven, H. J. Van, Zhang, X., Zhang, S., Chen, Y., Wang, S., Ren, C., Rao, S., Holland, M., Winiwarter, W., Chen, D., Xu, J., and Sutton, M. A.: Abating ammonia is more cost-effective than nitrogen oxides for mitigating PM2.5 air pollution, Science, 374, 758–762, https://doi.org/10.1126/science.abf8623, 2021.
Guo, Y., Chen, Y., Searchinger, T. D., Zhou, M., Pan, D., Yang, J., Wu, L., Cui, Z., Zhang, W., Zhang, F., Ma, L., Sun, Y., Zondlo, M. A., Zhang, L., and Mauzerall, D. L.: Air quality, nitrogen use efficiency and food security in China are improved by cost-effective agricultural nitrogen management, Nat. Food, 1, 648–658, https://doi.org/10.1038/s43016-020-00162-z, 2020.
Gyldenkærne, S., Skjøth, C. A., Hertel, O., and Ellermann, T.: A dynamical ammonia emission parameterization for use in air pollution models, J. Geophys. Res.-Atmos., 110, 1–14, https://doi.org/10.1029/2004JD005459, 2005.
Han, X., Zhu, L., Liu, M., Song, Y., and Zhang, M.: Numerical analysis of agricultural emissions impacts on PM2.5 in China using a high-resolution ammonia emission inventory, Atmos. Chem. Phys., 20, 9979–9996, https://doi.org/10.5194/acp-20-9979-2020, 2020.
Henze, D. K., Shindell, D. T., Akhtar, F., Spurr, R. J. D., Pinder, R. W., Loughlin, D., Kopacz, M., Singh, K., and Shim, C.: Spatially refined aerosol direct radiative forcing efficiencies, Environ. Sci. Technol., 46, 9511–9518, https://doi.org/10.1021/es301993s, 2012.
Hou, Y., Velthof, G. L., and Oenema, O.: Mitigation of ammonia, nitrous oxide and methane emissions from manure management chains: A meta-analysis and integrated assessment, Glob. Change Biol., 21, 1293–1312, https://doi.org/10.1111/gcb.12767, 2015.
Huang, S., Lv, W., Bloszies, S., Shi, Q., Pan, X., and Zeng, Y.: Effects of fertilizer management practices on yield-scaled ammonia emissions from croplands in China: A meta-analysis, Field Crop. Res., 192, 118–125, https://doi.org/10.1016/j.fcr.2016.04.023, 2016.
Huang, X., Song, Y., Li, M., Li, J., Huo, Q., Cai, X., Zhu, T., Hu, M., and Zhang, H.: A high-resolution ammonia emission inventory in China, Global Biogeochem. Cy., 26, 1–14, https://doi.org/10.1029/2011GB004161, 2012.
Jin, X., Zhang, N., Zhao, Z., Bai, Z., and Ma, L.: Nitrogen budgets of contrasting crop-livestock systems in China, Environ. Pollut., 288, 117633, https://doi.org/10.1016/j.envpol.2021.117633, 2021.
Kang, Y., Liu, M., Song, Y., Huang, X., Yao, H., Cai, X., Zhang, H., Kang, L., Liu, X., Yan, X., He, H., Zhang, Q., Shao, M., and Zhu, T.: High-resolution ammonia emissions inventories in China from 1980 to 2012, Atmos. Chem. Phys., 16, 2043–2058, https://doi.org/10.5194/acp-16-2043-2016, 2016.
Kurokawa, J. and Ohara, T.: Long-term historical trends in air pollutant emissions in Asia: Regional Emission inventory in ASia (REAS) version 3, Atmos. Chem. Phys., 20, 12761–12793, https://doi.org/10.5194/acp-20-12761-2020, 2020.
Li, B., Chen, L., Shen, W., Jin, J., Wang, T., Wang, P., Yang, Y., and Liao, H.: Improved gridded ammonia emission inventory in China, Atmos. Chem. Phys., 21, 15883–15900, https://doi.org/10.5194/acp-21-15883-2021, 2021.
Li, M., Liu, H., Geng, G., Hong, C., Liu, F., Song, Y., Tong, D., Zheng, B., Cui, H., Man, H., Zhang, Q., and He, K.: Anthropogenic emission inventories in China: a review, Natl. Sci. Rev., 4, 834–866, https://doi.org/10.1093/nsr/nwx150, 2017.
Luo, B. and Tai, A. P. K.: The ammonia emission inventory for China in 2017, figshare [dataset], https://doi.org/10.6084/m9.figshare.28082276.v2, 2024.
Liu, H. and Zheng, K.: Analysis of the Chinese government's subsidy programs to restore the pork supply chain: The case of African swine fever, Omega (United Kingdom), 124, 102995, https://doi.org/10.1016/j.omega.2023.102995, 2024.
Liu, L., Xu, W., Lu, X., Zhong, B., Guo, Y., Lu, X., Zhao, Y., He, W., Wang, S., Zhang, X., Liu, X., and Vitousek, P.: Exploring global changes in agricultural ammonia emissions and their contribution to nitrogen deposition since 1980, P. Natl. Acad. Sci. USA, 119, e2121998119, https://doi.org/10.1073/pnas.2121998119, 2022a.
Liu, P., Ding, J., Liu, L., Xu, W., and Liu, X.: Estimation of surface ammonia concentrations and emissions in China from the polar-orbiting Infrared Atmospheric Sounding Interferometer and the FY-4A Geostationary Interferometric Infrared Sounder, Atmos. Chem. Phys., 22, 9099–9110, https://doi.org/10.5194/acp-22-9099-2022, 2022b.
Liu, P., Ding, J., Ji, Y., Xu, H., Liu, S., Xiao, B., Jin, H., Zhong, X., Guo, Z., Wang, H., and Liu, L.: Satellite Support to Estimate Livestock Ammonia Emissions: A Case Study in Hebei, China, Atmosphere (Basel), 13, 1552, https://doi.org/10.3390/atmos13101552, 2022c.
Liu, X., Sha, Z., Song, Y., Dong, H., Pan, Y., Gao, Z., Li, Y., Ma, L., Dong, W., Hu, C., Wang, W., Wang, Y., Geng, H., Zheng, Y., and Gu, M.: China's Atmospheric Ammonia Emission Characteristics, Mitigation Options and Policy Recommendations, Res. Environ. Sci., 34, 149–157, 2021a.
Liu, X., Tai, A. P. K., Chen, Y., Zhang, L., Shaddick, G., Yan, X., and Lam, H. M.: Dietary shifts can reduce premature deaths related to particulate matter pollution in China, Nat. Food, 2, 997–1004, https://doi.org/10.1038/s43016-021-00430-6, 2021b.
Liu, X., Zhang, D., Wu, H., Elser, J. J., and Yuan, Z.: Uncovering the spatio-temporal dynamics of crop-specific nutrient budgets in China, J. Environ. Manage., 340, 117904, https://doi.org/10.1016/j.jenvman.2023.117904, 2023.
Liu, Z., Zhou, M., Chen, Y., Chen, D., Pan, Y., Song, T., Ji, D., Chen, Q., and Zhang, L.: The nonlinear response of fine particulate matter pollution to ammonia emission reductions in North China, Environ. Res. Lett., 16, 034014, https://doi.org/10.1088/1748-9326/abdf86, 2021c.
Luo, Y., Zhang, Z., Li, Z., Chen, Y., Zhang, L., Cao, J., and Tao, F.: Identifying the spatiotemporal changes of annual harvesting areas for three staple crops in China by integrating multi-data sources, Environ. Res. Lett., 15, 074003, https://doi.org/10.1088/1748-9326/ab80f0, 2020.
Martin, R. V., Eastham, S. D., Bindle, L., Lundgren, E. W., Clune, T. L., Keller, C. A., Downs, W., Zhang, D., Lucchesi, R. A., Sulprizio, M. P., Yantosca, R. M., Li, Y., Estrada, L., Putman, W. M., Auer, B. M., Trayanov, A. L., Pawson, S., and Jacob, D. J.: Improved advection, resolution, performance, and community access in the new generation (version 13) of the high-performance GEOS-Chem global atmospheric chemistry model (GCHP), Geosci. Model Dev., 15, 8731–8748, https://doi.org/10.5194/gmd-15-8731-2022, 2022.
McDuffie, E. E., Smith, S. J., O'Rourke, P., Tibrewal, K., Venkataraman, C., Marais, E. A., Zheng, B., Crippa, M., Brauer, M., and Martin, R. V.: A global anthropogenic emission inventory of atmospheric pollutants from sector- and fuel-specific sources (1970–2017): an application of the Community Emissions Data System (CEDS), Earth Syst. Sci. Data, 12, 3413–3442, https://doi.org/10.5194/essd-12-3413-2020, 2020.
Meng, W., Zhong, Q., Yun, X., Zhu, X., Huang, T., Shen, H., Chen, Y., Chen, H., Zhou, F., Liu, J., Wang, X., Zeng, E. Y., and Tao, S.: Improvement of a Global High-Resolution Ammonia Emission Inventory for Combustion and Industrial Sources with New Data from the Residential and Transportation Sectors, Environ. Sci. Technol., 51, 2821–2829, https://doi.org/10.1021/acs.est.6b03694, 2017.
Miao, R., Chen, Q., Zheng, Y., Cheng, X., Sun, Y., Palmer, P. I., Shrivastava, M., Guo, J., Zhang, Q., Liu, Y., Tan, Z., Ma, X., Chen, S., Zeng, L., Lu, K., and Zhang, Y.: Model bias in simulating major chemical components of PM2.5 in China, Atmos. Chem. Phys., 20, 12265–12284, https://doi.org/10.5194/acp-20-12265-2020, 2020.
NBSC (National Bureau of Statistics of China): http://www.stats.gov.cn/english/, last access: 24 December 2023.
Pan, Y., Tian, S., Zhao, Y., Zhang, L., Zhu, X., Gao, J., Huang, W., Zhou, Y., Song, Y., Zhang, Q., and Wang, Y.: Identifying Ammonia Hotspots in China Using a National Observation Network, Environ. Sci. Technol., 52, 3926–3934, https://doi.org/10.1021/acs.est.7b05235, 2018.
Paulot, F., Jacob, D. J., Pinder, R. W., Bash, J. O., Travis, K., and Henze, D. K.: Ammonia emissions in the United States, european union, and China derived by high-resolution inversion of ammonium wet deposition data: Interpretation with a new agricultural emissions inventory (MASAGE_NH3), J. Geophys. Res., 119, 4343–4364, https://doi.org/10.1002/2013JD021130, 2014.
Peng, S., Ding, Y., Liu, W., and Li, Z.: 1 km monthly temperature and precipitation dataset for China from 1901 to 2017, Earth Syst. Sci. Data, 11, 1931–1946, https://doi.org/10.5194/essd-11-1931-2019, 2019.
Ren, K., Xu, M., Li, R., Zheng, L., Liu, S., Reis, S., Wang, H., Lu, C., Zhang, W., Gao, H., Duan, Y., and Gu, B.: Optimizing nitrogen fertilizer use for more grain and less pollution, J. Clean. Prod., 360, 132180, https://doi.org/10.1016/j.jclepro.2022.132180, 2022.
Sacks, W. J., Deryng, D., Foley, J. A., and Ramankutty, N.: Crop planting dates: An analysis of global patterns, Global Ecol. Biogeogr., 19, 607–620, https://doi.org/10.1111/j.1466-8238.2010.00551.x, 2010.
Song, Q., Chen, Y., Zhao, L., Ouyang, H., and Song, J.: Monitoring of sausage products sold in Sichuan Province, China: a first comprehensive report on meat species' authenticity determination, Sci. Rep., 9, 19074, https://doi.org/10.1038/s41598-019-55612-x, 2019.
Sutton, M. A., Howard, C. M., Mason, K. E., Brownlie, W. J., Cordovil, C. M. d. S.: Nitrogen opportunities for agriculture, food & environment, UNECE guidance document on integrated sustainable nitrogen management, Edinburgh, UK Centre for Ecology & Hydrology, 157pp. (INMS Report 2022/02) ISBN 9781906698782, 2022.
Wang, C., Cheng, K., Ren, C., Liu, H., Sun, J., Reis, S., Yin, S., Xu, J., and Gu, B.: An empirical model to estimate ammonia emission from cropland fertilization in China, Environ. Pollut., 288, 117982, https://doi.org/10.1016/j.envpol.2021.117982, 2021.
Wang, X., Bai, X., Zhu, Z. C., Zhou, P., Miao, P., Hen, and Zhou, J.: Nitrogen Use and Management in Orchards and Vegetable Fields in China: Challenges and Solutions, Front. Agric. Sci. Eng., 9, 386–395, https://doi.org/10.15302/J-FASE-2022443, 2022.
Wang, Z., Yin, Y., Wang, Y., Tian, X., Ying, H., Zhang, Q., Xue, Y., Oenema, O., Li, S., Zhou, F., Du, M., Ma, L., Batchelor, W. D., Zhang, F., and Cui, Z.: Integrating crop redistribution and improved management towards meeting China's food demand with lower environmental costs, Nat. Food, 3, 1031–1039, https://doi.org/10.1038/s43016-022-00646-0, 2022.
Whitnall, T., & Pitts, N.: Global trends in meat consumption, Agricultural Commodities, 9, 96–99, ISNN 18395627, https://search.informit.org/doi/10.3316/informit.309517990386547, 2019.
Xie, P. and Liao, H.: The Impacts of Changes in Anthropogenic Emissions Over China on PM2.5 Concentrations in South Korea and Japan During 2013–2017, Front. Environ. Sci., 10, 841285, https://doi.org/10.3389/fenvs.2022.841285, 2022.
Xu, P., Zhang, Y., Gong, W., Hou, X., Kroeze, C., Gao, W., and Luan, S.: An inventory of the emission of ammonia from agricultural fertilizer application in China for 2010 and its high-resolution spatial distribution, Atmos. Environ., 115, 141–148, https://doi.org/10.1016/j.atmosenv.2015.05.020, 2015.
Xu, W., Zhao, Y., Wen, Z., Chang, Y., Pan, Y., Sun, Y., Ma, X., Sha, Z., Li, Z., Kang, J., Liu, L., Tang, A., Wang, K., Zhang, Y., Guo, Y., Zhang, L., Sheng, L., Zhang, X., Gu, B., Song, Y., Van Damme, M., Clarisse, L., Coheur, P.-F., Collett, J. L., Goulding, K., Zhang, F., He, K., and Liu, X.: Increasing importance of ammonia emission abatement in PM2.5 pollution control, Sci. Bull., 67, 1745–1749, https://doi.org/10.1016/j.scib.2022.07.021, 2022.
Yang, Y., Liu, L., Liu, P., Ding, J., Xu, H., and Liu, S.: Improved global agricultural crop- and animal-specific ammonia emissions during 1961–2018, Agr. Ecosyst. Environ., 344, 108289, https://doi.org/10.1016/j.agee.2022.108289, 2023.
Ye, Z., Guo, X., Cheng, L., Cheng, S., Chen, D., Wang, W., and Liu, B.: Reducing PM2.5 and secondary inorganic aerosols by agricultural ammonia emission mitigation within the Beijing-Tianjin-Hebei region, China, Atmos. Environ., 219, 116989, https://doi.org/10.1016/j.atmosenv.2019.116989, 2019.
Yu, Z., Liu, J., and Kattel, G.: Historical nitrogen fertilizer use in China from 1952 to 2018, Earth Syst. Sci. Data, 14, 5179–5194, https://doi.org/10.5194/essd-14-5179-2022, 2022.
Zhai, S., Jacob, D. J., Brewer, J. F., Li, K., Moch, J. M., Kim, J., Lee, S., Lim, H., Lee, H. C., Kuk, S. K., Park, R. J., Jeong, J. I., Wang, X., Liu, P., Luo, G., Yu, F., Meng, J., Martin, R. V., Travis, K. R., Hair, J. W., Anderson, B. E., Dibb, J. E., Jimenez, J. L., Campuzano-Jost, P., Nault, B. A., Woo, J.-H., Kim, Y., Zhang, Q., and Liao, H.: Relating geostationary satellite measurements of aerosol optical depth (AOD) over East Asia to fine particulate matter (PM2.5): insights from the KORUS-AQ aircraft campaign and GEOS-Chem model simulations, Atmos. Chem. Phys., 21, 16775–16791, https://doi.org/10.5194/acp-21-16775-2021, 2021.
Zhan, X., Adalibieke, W., Cui, X., Winiwarter, W., Reis, S., Zhang, L., Bai, Z., Wang, Q., Huang, W., and Zhou, F.: Improved Estimates of Ammonia Emissions from Global Croplands, Environ. Sci. Technol., 55, 1329–1338, https://doi.org/10.1021/acs.est.0c05149, 2021.
Zhang, L., Chen, Y., Zhao, Y., Henze, D. K., Zhu, L., Song, Y., Paulot, F., Liu, X., Pan, Y., Lin, Y., and Huang, B.: Agricultural ammonia emissions in China: reconciling bottom-up and top-down estimates, Atmos. Chem. Phys., 18, 339–355, https://doi.org/10.5194/acp-18-339-2018, 2018.
Zhang, Q., Chu, Y., Yin, Y., Ying, H., Zhang, F., and Cui, Z.: Comprehensive assessment of the utilization of manure in China's croplands based on national farmer survey data, Sci. Data, 10, 223, https://doi.org/10.1038/s41597-023-02154-7, 2023.
Zhang, X., Wu, Y., Liu, X., Reis, S., Jin, J., Dragosits, U., Van Damme, M., Clarisse, L., Whitburn, S., Coheur, P.-F., and Gu, B.: Ammonia Emissions May Be Substantially Underestimated in China, Environ. Sci. Technol., 51, 12089–12096, https://doi.org/10.1021/acs.est.7b02171, 2017.
Zhang, X., Gu, B., van Grinsven, H., Lam, S. K., Liang, X., Bai, M., and Chen, D.: Societal benefits of halving agricultural ammonia emissions in China far exceed the abatement costs, Nat. Commun., 11, 4357, https://doi.org/10.1038/s41467-020-18196-z, 2020.
Zhang, X., Zou, T., Lassaletta, L., Mueller, N. D., Tubiello, F. N., Lisk, M. D., Lu, C., Conant, R. T., Dorich, C. D., Gerber, J., Tian, H., Bruulsema, T., Maaz, T. M. C., Nishina, K., Bodirsky, B. L., Popp, A., Bouwman, L., Beusen, A., Chang, J., Havlík, P., Leclère, D., Canadell, J. G., Jackson, R. B., Heffer, P., Wanner, N., Zhang, W., and Davidson, E. A.: Quantification of global and national nitrogen budgets for crop production, Nat. Food, 2, 529–540, https://doi.org/10.1038/s43016-021-00318-5, 2021a.
Zhang, X., Ren, C., Gu, B., and Chen, D.: Uncertainty of nitrogen budget in China, Environ. Pollut., 286, 117216, https://doi.org/10.1016/j.envpol.2021.117216, 2021b.
Zhao, Y. G., Gordon, A. W., O'Connell, N. E., and Yan, T.: Nitrogen utilization efficiency and prediction of nitrogen excretion in sheep offered fresh perennial ryegrass (Lolium perenne), J. Anim. Sci., 94, 5321–5331, https://doi.org/10.2527/jas.2016-0541, 2016.