the Creative Commons Attribution 4.0 License.
the Creative Commons Attribution 4.0 License.
 | 06 Sep 2024
Exploring the sources of light-absorbing carbonaceous aerosols by integrating observational and modeling results: insights from Northeast China
Yuan Cheng
Xu-bing Cao
Sheng-qiang Zhu
Zhi-qing Zhang
Hong-liang Zhang
Qiang Zhang
Ke-bin He
Light-absorbing carbonaceous aerosols are important contributors to both air pollution and radiative forcing. However, their abundances and sources remain poorly constrained, as can be seen from the frequently identified discrepancies between the observed and modeled results. In this study, we focused on elemental carbon (EC; as a measure of black carbon) and light-absorbing organic carbon (i.e., BrC) in Northeast China, a new targeted region of the latest clean-air actions in China. Three campaigns were conducted during 2018–2021 in Harbin, covering distinct meteorological conditions and emission features. Various analytical methods were first evaluated, and the mass concentrations of both BrC and EC were validated. The validated BrC and EC measurement results were then used for source apportionment, together with other species including tracers (e.g., levoglucosan). The observation-based results suggested that despite the frigid winter in Harbin, the formation of secondary organic carbon (SOC) was enhanced at high levels of relative humidity (RH). This enhancement could also be captured by an air quality model incorporating heterogeneous chemistry. However, the model failed to reproduce the observed abundances of SOC, with significant underestimations regardless of RH levels. In addition, agricultural fires effectively increased the observation-based primary organic carbon (POC) concentrations and POC to EC ratios. Such roles of agricultural fires were not captured by the model, pointing to substantial underestimation of open burning emissions by the inventory. This problem merits particular attention for Northeast China, given its massive agricultural sector.
- Article
(3311 KB) - Full-text XML
-
Supplement
(2097 KB) - BibTeX
- EndNote


Black carbon (BC) and light-absorbing organic carbon, i.e., brown carbon (BrC), are important contributors to not only haze pollution but also positive radiative forcing (Bond et al., 2013; Laskin et al., 2015). While their environmental effects are usually predicted by chemical transport and radiative transfer models, field observational results are necessary to constrain their simulated spatial distributions and temporal variations (Koch et al., 2009; Samset et al., 2014; Stohl et al., 2015; Wang et al., 2018; Gao et al., 2022). For example, several studies have suggested that to improve the agreement between simulated and observed BC concentrations, the BC lifetime should be on the lower end of that assumed in current models (e.g., Samset et al., 2014). However, the observational data on both BC and BrC are still subject to considerable uncertainties, largely due to the lack of reference material and method for both species (Baumgardner, et al., 2012; Petzold et al., 2013; Lack et al., 2014).
The measurement techniques for BC mass typically fall into four categories, i.e., thermal–optical (Chow et al., 2007; Cavalli et al., 2010), light absorption (Petzold et al., 2005), laser-induced incandescence (LII; Schwarz et al., 2006), and aerosol mass spectrometric methods (Onasch et al., 2012). These approaches are based on different measurement principles, depending on the targeted properties of BC (Petzold et al., 2013). For example, in the thermal–optical method, a particle-laden filter is heated in an inert (i.e., He) and oxidizing (i.e., He/O2) atmosphere sequentially to volatilize and combust the deposited carbonaceous components. BC typically evolves after organic matter due to its higher thermal stability. In addition, BC is strongly light absorbing, and thus its evolution could lead to a rapid increase in the filter transmittance signal, which is typically monitored in the spectral range of red light. Then based on the evolution patterns of the carbon and transmittance signals, BC mass could be determined as the amount of carbon evolving during a specific segment of thermal–optical analysis (Cavalli et al., 2010). In addition to the thermal–optical method, BC mass could also be determined based on the aerosol light absorption coefficient (in Mm−1; Moosmüller et al., 2009); carbon ion signals in a mass spectrum measured by a soot particle aerosol mass spectrometer (SP-AMS; Onasch et al., 2012); or the incandescent radiation emitted during fast heating, boiling, and evaporation of BC in an LII instrument (Moteki and Kondo, 2010). The multitude of measurement principles causes considerable discrepancies in BC results among different methods, and interestingly, the discrepancies are usually not constant even for the same study (Buffaloe et al., 2014; Sharma et al., 2017; Corbin et al., 2019; Li et al., 2019; Pileci et al., 2021; Tinorua et al., 2024). For example, results from the LII and thermal–optical methods were found to show BC ratios varying between 0.5 and 1.2 for several background sites in Europe, with unclear reasons for the variability in discrepancies (Pileci et al., 2021).
Similar to BC, different methods coexist for the measurement of BrC. For example, BrC's light absorption coefficient is usually determined based on the extract of a filter sample (Hecobian et al., 2010) or total aerosol absorption (Yang et al., 2009). Different relationships have been identified between the results from these two approaches, e.g., strong correlation and close agreement (Zeng et al., 2022), moderate to strong correlations with considerable differences in the absolute values (Kumar et al., 2018; Z. Z. Cheng et al., 2021), and little correlation (Chen et al., 2022). However, factors responsible for the inconsistent relationships remain poorly understood. In addition, the measurement of BrC mass is also challenging. This is particularly the case for studies using organic solvents (e.g., methanol) to extract or isolate BrC. A major difficulty is that the amount of BrC dissolved in organic solvents could not be directly measured, whereas the indirect approaches are still under debate regarding the possible artifacts (Yan et al., 2020). For example, when determining BrC mass as the difference in total carbon concentration between untreated and extracted filters, the result could be biased high due to the loss of insoluble BC during extraction.
Nonetheless, the measurement methods of BC and BrC require further refinements to provide more robust constraints on the modeling results. Such efforts are especially necessary for China, given its more complex emission sources compared to North America and Europe. Here we focus on Harbin, a representative megacity in Northeast China. With the improvement of air quality in other regions such as the North China Plain (Xiao et al., 2021; Y. T. Wang et al., 2023), Northeast China was targeted by the national-level clean-air policy for the first time in 2021 (State Council, 2021). This policy, i.e., the circular on further promoting the pollution prevention and control battle, proposed an ambitious goal of eliminating heavy or severe air pollution events in Northeast China and other key regions. In addition, Harbin will be hosting the 9th Asia Winter Games in February of 2025, which posed another motivation for cleaning the air in Northeast China. However, the roadmap for air quality improvement was, to some extent, unclear for Harbin and other cities in Northeast China, given that the sources and formation mechanisms of haze pollution were far from being well understood due to limited studies (e.g., Zhang et al., 2020; Wu et al., 2020; Ning et al., 2022).
This study aimed at understanding the sources of light-absorbing carbon in Harbin, based on a synthesis of field observation and air quality modeling. We started with the coordinated determination of BrC and BC masses in filter samples, followed by source apportionment using the validated observational results. Then we used the observation-based BrC and BC source attributions to constrain the predictions by an air quality model, with the focuses on the model vs. observation discrepancies and the drivers at play. This study provided implications for further efforts to understand haze pollution in Northeast China, with respect to both the measurement and the simulation of carbonaceous aerosols.
Table 1Summary of PM2.5 samples included in this study. N indicates the number of samples from each campaign. For each sample, both the untreated and the extracted punches were used for thermal–optical analysis. NPIMPROVE-A indicates the number of punch pairs analyzed by the IMPROVE-A temperature protocol. NPNIOSH was defined similarly. The split of OC and EC was based on the transmittance charring correction for both protocols.
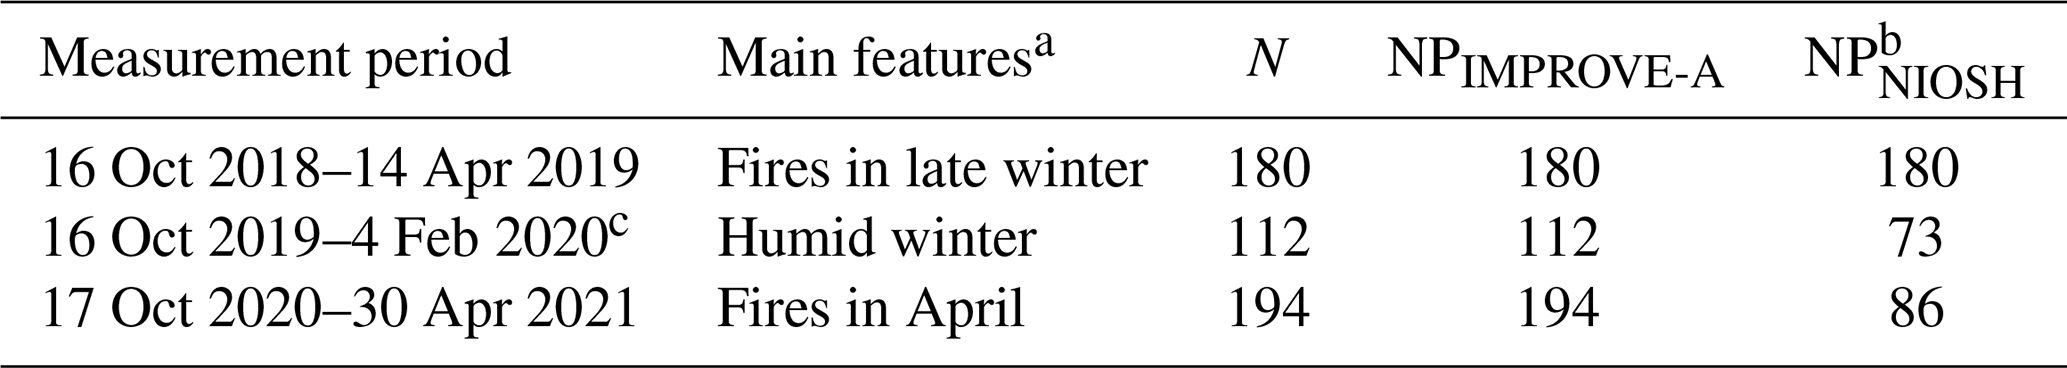
a The main features of the campaigns were presented briefly in Fig. S1 and described in detail in Y. Cheng et al. (2021, 2022). b The selection of samples analyzed by both protocols is explained in detail in Sect. 3.2. c The 2019–2020 campaign covered a relatively short period due to the lockdown policy associated with the outbreak of COVID-19.
2.1 Field observation
A total of 486 fine particulate matter (PM2.5) samples were collected on a daily basis at an urban site in Harbin during three recent campaigns (Table 1). The sampling was performed on the campus of the Harbin Institute of Technology, using a portable sampler (MiniVol; Air Metrics, OR, USA) operated at a flow rate of 5 L min−1 with quartz-fiber filters (Pall Corporation, NY, USA). For each sample, half of the filter was measured for water-soluble inorganic ions and levoglucosan, using a Dionex ion chromatography system (ICS-5000+; Thermo Fisher Scientific Inc., MA, USA). The other half was cut into two punches for the determination of organic carbon (OC) and elemental carbon (EC; as a measure of BC mass), using a thermal–optical carbon analyzer (DRI-2001; Atmoslytic Inc., CA, USA). The first punch was measured directly, while the second punch was immersed in methanol (Fisher Scientific Company LLC, NJ, USA) for an hour without stirring or sonication, dried in air for another hour, and then analyzed. All the pairs of untreated and extracted punches were measured deploying the IMPROVE-A temperature protocol, with selected pairs also analyzed using NIOSH (Table 1). In addition, wavelength-resolved light absorption coefficients (babs) of the methanol extracts were quantified using a spectrophotometer (Ocean Optics Inc., FL, USA) coupled with a 2.5 m long liquid waveguide capillary cell (LWCC; World Precision Instruments, FL, USA). Samples strongly impacted by firework emissions (N = 2, 3, and 6 for the three campaigns, respectively) during the Chinese New Year periods were not further investigated in this study. More details of the field observations are presented in Y. Cheng et al. (2021, 2022).
2.2 Air quality modeling
A revised Community Multiscale Air Quality (CMAQ) model was used to simulate OC and EC in Harbin. Compared to the original version (5.0.1), a major update of the revised model was the addition of new pathways for secondary organic aerosol (SOA) production, i.e., photochemical and heterogeneous oxidation of isoprene epoxydiols, methacrylic acid epoxide, glyoxal, and methylglyoxal (Ying et al., 2015). Previous studies have suggested that the revised CMAQ could generally reproduce the observed meteorological conditions and PM2.5 concentrations on a national scale in China (J. L. Hu et al., 2016; Wang et al., 2020). However, the model performance remained inconclusive for PM2.5 compositions in specific regions. In this study, the modeling was performed over East China with a horizontal resolution of 36 km × 36 km for the 2020–2021 measurement period. The simulation results were extracted for the grid cell where the sampling site is located and then compared with the observational results.
3.1 Validation of BrC measurement results
Extracting filter samples by methanol was a common approach to measure brown carbon. While the light absorption by BrC could be readily determined using the methanol extracts, it remains challenging to quantify the mass concentration of BrC, i.e., methanol-soluble OC (MSOC). Unlike water-soluble OC (WSOC), MSOC could not be directly measured using a total organic carbon analyzer and instead required indirect methods. For example, a four-step procedure was developed by Chen et al. (2017), including drying the methanol extract in a nitrogen flow, re-dissolving the residues in a small amount of methanol (100 µL), spiking a pre-baked filter punch (prepared for a thermal–optical carbon analyzer) with a known volume of the new extract (20 µL), and measuring the total carbon (TC) in the spiked filter after drying as MSOC. A simpler approach was to determine MSOC as the difference in TC (or OC) concentrations between the untreated and extracted filter punches. This method was initially developed by Chen and Bond (2010), with a substantial concern being the loss of insoluble carbon (e.g., EC) during extraction. However, this artifact was difficult to evaluate, largely due to the lack of reference method for the measurement of EC mass (Petzold et al., 2013).
In addition to EC mass, optical attenuation (ATN) retrieved from the carbon analyzer could be an alternative criterion for estimating the extraction-induced loss of insoluble carbon. ATN was calculated as , where Iinitial and Ifinal indicate the filter transmittance signals (I) measured at the beginning and end of thermal–optical analysis, respectively. Iinitial was lower than Ifinal, mainly due to the absorption by light-absorbing aerosols (e.g., EC and BrC) and scattering or, more specifically, backward scattering (Petzold et al., 2005) by the deposited particles (e.g., inorganic ions and non-absorbing OC). Given that I was monitored at a wavelength of 632 nm, only strongly absorbing BrC could influence Iinitial and thus ATN through absorption, while SOA could be considered almost non-absorbing (Lambe et al., 2013; Liu et al., 2015; J. Liu et al., 2016). Thus we suggest that (i) a decrease in ATN after extraction, if it occurred, could mainly be attributed to three possible factors, including loss of EC, removal of strongly absorbing BrC, and removal of scattering compounds such as SOA and nitrate, and (ii) if ATN values measured by the untreated and extracted filters (i.e., ATNuntreated and ATNextracted) were largely unchanged, loss of EC should be negligible. In the following discussions, ΔATN, which is defined as ATNextracted − ATNuntreated, is introduced to quantify the extraction-induced changes in ATN.
In the 2018–2019 campaign, ΔATN was close to 0 for some of the samples, whereas for the remaining ones, ATN typically decreased to varying degrees after the extraction (Fig. 1a). Here we noticed two distinct samples when exploring the ΔATN results (circled in Fig. 1a). One of them showed the most significant decrease in ATN after extraction (with a ΔATN of −0.32) during the 2018–2019 measurement period, whereas ΔATN was also considerable for the other sample (−0.25). The two distinct samples were collected successively during 12–14 January 2019. In this period, relative humidity (RH) stayed above 85 %, and both the sulfur oxidation ratio (SOR) and the nitrogen oxidation ratio (NOR) exceeded 0.2, with record high concentrations of sulfate (∼ 30 µg m−3) and nitrate (∼ 40 µg m−3) for the 2018–2019 winter. Given the enhanced production of secondary inorganic aerosols, removal of nitrate by the extraction was a likely cause for the negative ΔATN of the two distinct samples. Sulfate was not considered here, since it is insoluble in methanol. As another component that could result in negative ΔATN, SOA could not be directly measured, whereas the indirect estimation approaches such as the EC-tracer method typically required EC concentration. We did not predict SOA at this stage, since the EC measurement uncertainties (e.g., the loss of EC during extraction) had not been comprehensively evaluated. However, similar to SOA, formation of sulfate and nitrate was influenced by both heterogeneous and gas-phase reactions (Liu et al., 2021; H. C. Wang et al., 2023), indicating that it should be acceptable to reflect the production of secondary aerosols (including SOA) based on a synthesis of SOR and NOR. In other words, it was very likely that the atmospheric conditions with elevated SOR and NOR (e.g., 12–14 January 2019) were also favorable for SOA formation (this inference would be validated in Sect. 3.3). For the two distinct samples, therefore, the removal of scattering components, including not only nitrate but also SOA, was inferred to be highly responsible for the considerable extraction-induced decreases in ATN.
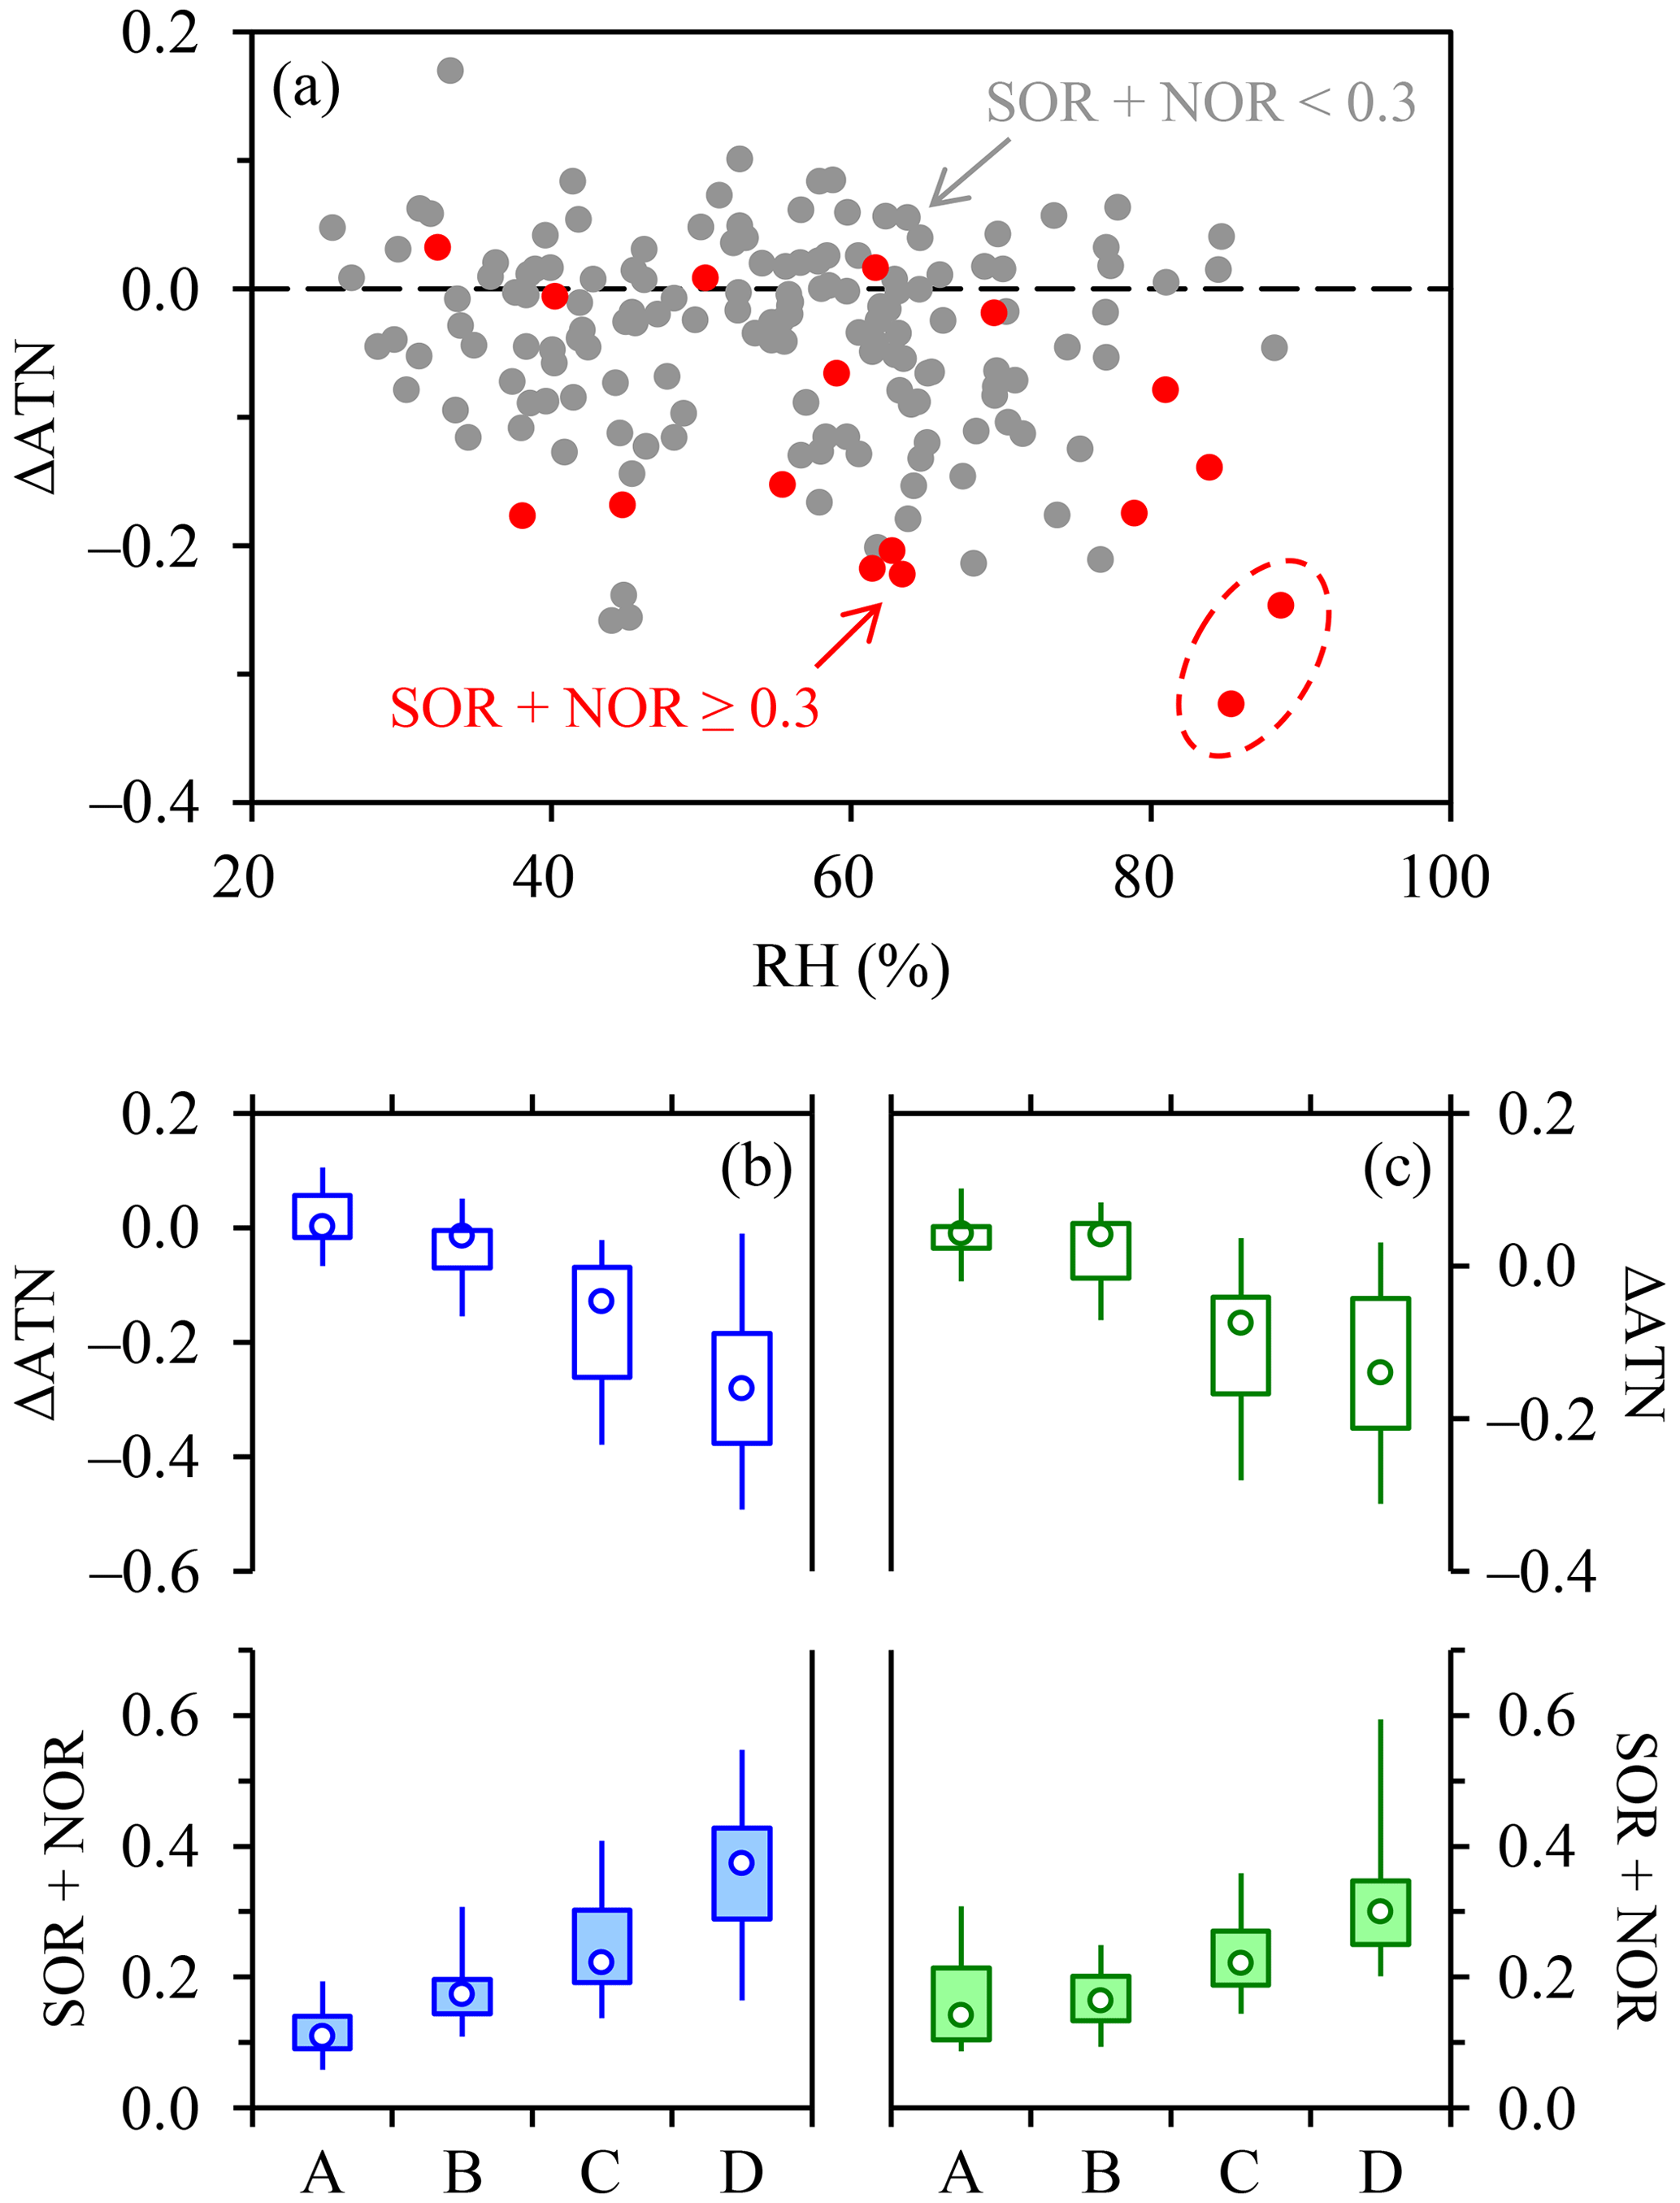
Figure 1(a) Dependence of ΔATN, i.e., ATNextracted − ATNuntreated, on RH during the 2018–2019 campaign, with results in different SOR + NOR ranges distinguished. The dashed line indicates a ΔATN of 0. The dashed oval highlights two samples characterized by high RH levels, enhanced formation of secondary aerosols, and considerable decreases in ATN after extraction. (b) Comparisons of ΔATN (upper panel) and SOR + NOR (lower panel) across different RH ranges (i.e., below 60 %, 60 %–70 %, 70 %–80 %, and above 80 % as indicated by A–D, respectively) during the 2019–2020 campaign. To isolate the role of RH, only the samples with minimal influence from agricultural fires were included in the comparison. In each panel, lower- and upper-box bounds indicate the 25th and 75th percentiles, the whiskers below and above the box indicate the 5th and 95th percentiles, and the open circle within the box marks the median (the same hereinafter). (c) The same as (b) but for 2020–2021.
Regarding the entire 2018–2019 campaign, humid events were actually uncommon, and most samples with negative ΔATN values concentrated in the conditions with relatively low RH levels of below 80 % (Fig. 1a). Thus, in addition to the enhanced secondary aerosol production at high RH, there must exist other influencing factors responsible for the change in ATN for the 2018–2019 samples. We then investigated the role of biomass burning, which could emit strongly absorbing BrC with mass absorption efficiencies comparable to black carbon (Alexander et al., 2008; Hoffer et al., 2016; McClure et al., 2020). The 2018–2019 campaign was characterized by frequent occurrences of agricultural fires (Fig. S1 in the Supplement), mainly in winter due to a one-off policy which crudely approved a 3-month-long period (early December 2018 to early March 2019) for legitimate open burning. In our previous studies (Y. Cheng et al., 2021), the fire episodes were identified by the measured levoglucosan to organic carbon ratios (, where OC∗ indicates the untreated OC based on IMPROVE-A) together with the satellite-based fire hotspots, and the 2018–2019 samples were classified into three groups with increasing impacts of open burning. In this study, we revisited the classifications using the levoglucosan to TC ratios (), as the TC measurement was independent of thermal–optical protocol. The classifications made by Y. Cheng et al. (2021) were found to still hold true, as correlated strongly with (r = 0.998; Fig. S2). As shown in Fig. 2a, ΔATN levels were close to 0 (with a median value of 0.00) under little impact from open burning. However, ΔATN turned negative when the fire impacts were non-negligible, and the negative ΔATN values became more considerable as the fire impacts increased. For the 2018–2019 campaign, therefore, the occurrences of negative ΔATN were strongly associated with agricultural fires, e.g., through the removal of BrC by extraction. In addition, both nitrate and NOR were found to increase with stronger influences of agricultural fires (Fig. S3), presumably due to the enhancement of nitrate production by open burning emissions (Akagi et al., 2012; Collier et al., 2016; X. X. Liu et al., 2016). Thus, although the nitrate concentrations (Fig. S3) were the lowest for 2018–2019 among the three campaigns, the removal of nitrate by extraction could also be partially responsible for the association between ΔATN and agricultural fires.
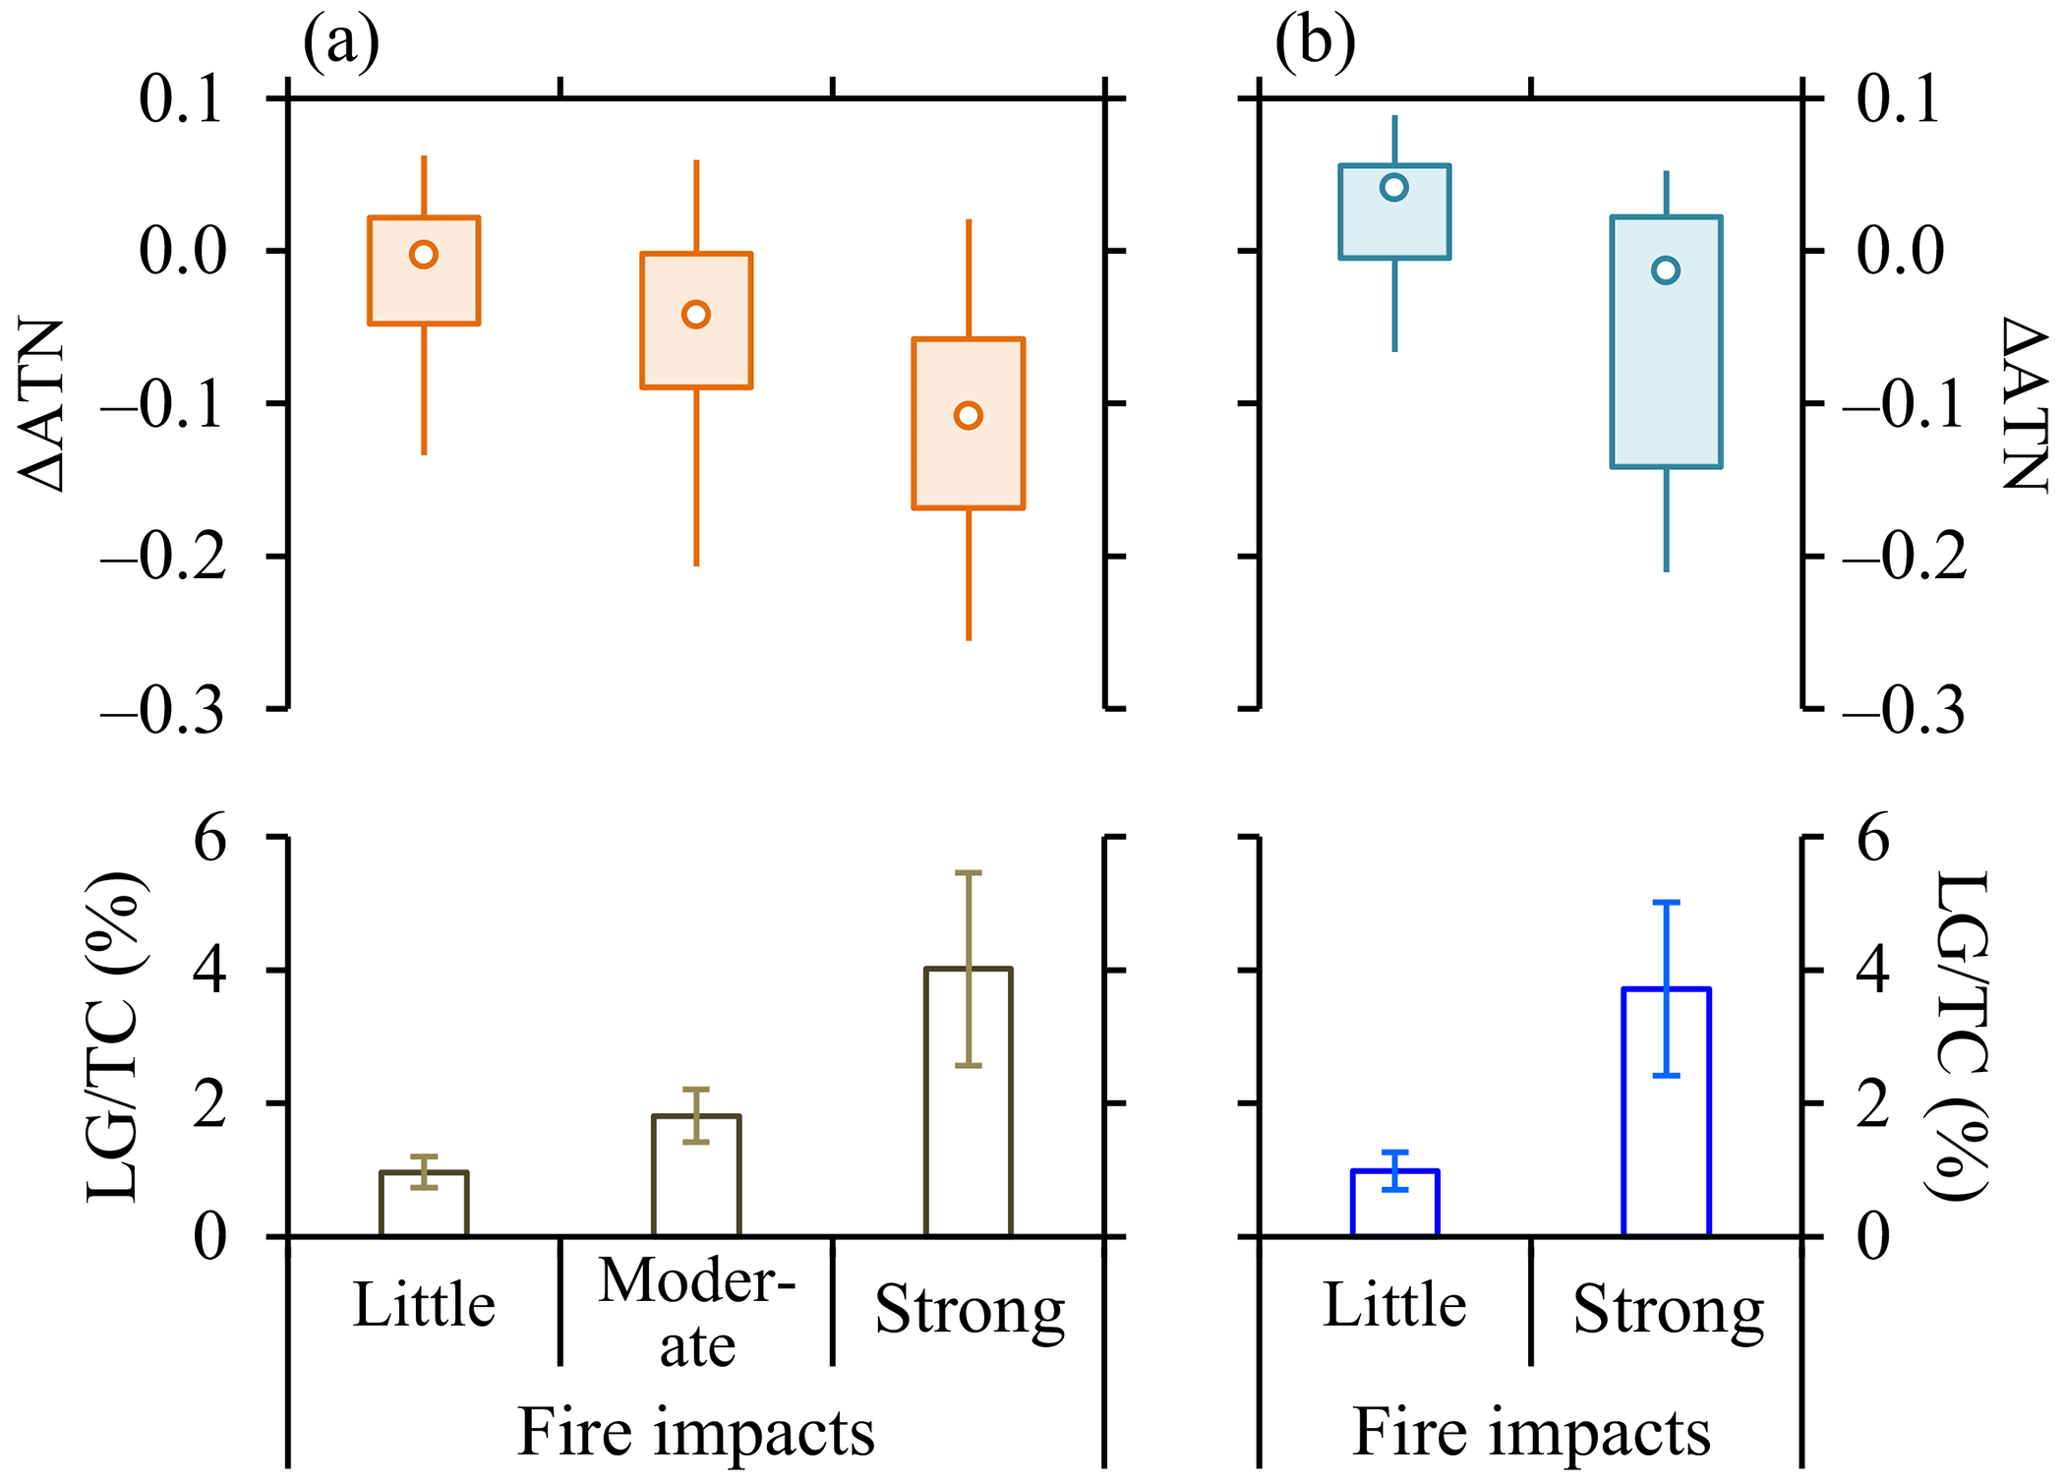
Figure 2(a) Comparisons of ΔATN (upper panel) and (on a basis of carbon mass; lower panel) across three cases with increasing impacts of agricultural fires during the 2018–2019 campaign. To highlight the role of fires, the two distinct samples showing apparent influences of RH (as circled in Fig. 1a) were not included in the comparisons. (b) Comparisons of ΔATN (upper panel) and (lower panel) between two cases with little and strong impacts of agricultural fires during the 2020–2021 campaign. Only the samples with RH levels below 70 % were included because (i) the influence of RH was insignificant for this RH range, and (ii) the majority of the 2020–2021 samples with strong fire impacts (24 out of 27) fell within this RH range. The “moderate” case was not identified for 2020–2021. This is mainly because in response to different policies on open burning, the agricultural fires spanned a relatively long period (more than 2 months) during 2018–2019 but concentrated in April during 2020–2021 (Cheng et al., 2022).
Figures 1a and 2a suggest that ATN indeed decreased after the extraction for some of the 2018–2019 samples. However, the negative ΔATN was typically found to be associated with agricultural fires and occasionally with high-RH conditions. The underlying mechanisms could primarily be attributed to the removal of BrC and scattering components (including SOA and nitrate), respectively. Importantly, ΔATN was negligible after excluding these two distinct cases (Fig. 2a), suggesting that the loss of insoluble carbon (e.g., EC) should be minimal during our extraction procedures.
In addition to the two distinct samples shown in Fig. 1a, the connections between ΔATN and RH could be further confirmed by the 2019–2020 campaign, which experienced much more high-RH events (mainly in winter) compared to 2018–2019 (Fig. S4). As shown in Fig. 1b for the 2019–2020 samples with little impact from agricultural fires, the high-RH samples were characterized by elevated SOR and NOR, pointing to enhanced formation of secondary aerosols (presumably including SOA). A clear association was also observed between ΔATN and RH. ΔATN was typically negligible when RH stayed below 70 %, showing median ΔATN values of 0.00 and −0.01 for the RH ranges below 60 % and 60 %–70 %, respectively. However, ΔATN deviated more significantly from 0 when RH further increased, e.g., with a median ΔATN value of −0.28 for the RH range above 80 %. Although some primary organic compounds could also be non-absorbing at 632 nm, it is unlikely that the abundances or emissions of such species would depend on RH. Thus, the most probable explanation for the negative ΔATN observed at relatively high RH levels is the removal of secondary components (including SOA and nitrate) by extraction.
The 2019–2020 campaign covered a shorter period (Table 1) and encountered much fewer fire episodes (N=2) compared to 2018–2019 and 2019–2020 (N=21 and 27, respectively). The two 2019–2020 samples with strong fire impacts had similar RH levels of ∼ 50 %, and only one of them exhibited considerable ΔATN (−0.26; Fig. S5), which could be attributed to the removal of BrC by extraction. For the 2019–2020 campaign, therefore, the extraction-induced decreases in ATN were caused primarily by the removal of scattering components. In addition, as shown in Fig. 1b, the ΔATN values close to 0 observed at the relatively low RH levels (e.g., with a median ΔATN of 0.00 for the RH range below 60 %) further supported the inference on negligible loss of insoluble carbon during extraction.
The 2020–2021 campaign experienced more high-RH events compared to 2018–2019 and more agricultural fire episodes than 2019–2020 (Fig. S1). Correspondingly, the extraction-induced changes in ATN could be attributed to the removal of either scattering components (Fig. 1c) or BrC (Fig. 2b). Similar to results from the other two campaigns, ΔATN was close to 0 for the 2020–2021 periods with low RH levels and little impact from open burning (Fig. 1c), again demonstrating that the extraction-induced loss of insoluble carbon was negligible.
The discussions above suggested that it was acceptable to attribute the reduced TC concentrations in the extracted punches to the dissolving of organic compounds. This in turn supported the determination of MSOC as the difference in TC between the untreated and extracted punches, i.e., TCuntreated − TCextracted. TC was used here since it was independent of analytical method, i.e., not influenced by the uncertainties in the split of OC and EC. In addition, both TCuntreated and TCextracted had been corrected by blanks before being used to calculate MSOC. A total of 53 filters were kept as blanks for the three campaigns. The blank TC decreased slightly after the extraction (from 0.61 ± 0.23 to 0.44 ± 0.21 µg C cm−3), with no EC detected for either the untreated or the extracted filters. A possible explanation for the decrease was the dissolving of organic compounds, which constituted the TC of the untreated blank filters, into the solvent. Importantly, the absence of extraction-induced increase in blank TC indicated that the methanol retained by the filters after the extraction could be completely volatilized during the drying process and consequently would not influence the split of OC and EC for the extracted samples.
3.2 Evaluation of EC from different methods
As mentioned in Sect. 2.1, all the pairs of untreated and extracted punches were measured by IMPROVE-A, with selected pairs also analyzed by NIOSH. A major purpose of including NIOSH was to uncover the EC discrepancies between different protocols, an important indicator for the EC measurement uncertainties. The 2018–2019 campaign was characterized by intensive agricultural fires in winter (Fig. S1), providing an opportunity to evaluate the effects of open burning emissions on EC determination. In addition, considering this campaign was the first one to investigate EC measurement uncertainties in Northeast China, all the 2018–2019 samples were analyzed by NIOSH (Table 1). The 2019–2020 campaign was characterized by unusually high levels of RH in winter (Fig. S1), which were expected to favor heterogeneous chemistry. To investigate the influences of secondary aerosols on EC determination, NIOSH was applied to all the samples collected in December 2019 and January 2020. The 2020–2021 campaign showed mixed features of the other two campaigns, i.e., high-RH events and agricultural fire episodes in January and April of 2021, respectively (Fig. S1). Thus all the samples from these 2 months were analyzed by NIOSH. For the other periods of 2019–2020 and 2020–2021, NIOSH was used every five samples. As shown in Table 1, a total of 339 pairs of untreated and extracted punches were analyzed by NIOSH in addition to IMPROVE-A. Then for the majority of the Harbin samples (339 out of 486), there were four sets of EC and OC results. Two sets were derived from the untreated punch, using the IMPROVE-A and NIOSH protocols, respectively. For the third set, EC was measured by the extracted punch based on IMPROVE-A (ECextracted, IMPROVE-A), while OC was calculated as the difference between TCuntreated and ECextracted, IMPROVE-A. OC and EC of the fourth set were defined similarly based on NIOSH. The following patterns were observed when comparing the EC and OC results across different methods.
First, only the OC to EC ratios determined by the untreated samples using IMPROVE-A, i.e., , could properly reflect secondary aerosol formation. For a typical urban site, anthropogenic emissions, such as those from coal combustion and vehicles, were usually considered relatively stable during a given period, e.g., a specific season. Then the temporal variations in could be used to track SOA formation (e.g., as done by the EC-tracer method), after excluding the episodes impacted by irregular emissions such as open burning and fireworks. Since firework events were not included in this study, here we focused on three periods with all four sets of OC and EC results and without significant influence from agricultural fires, i.e., a 4-week-long period in the 2018–2019 winter (28 December 2018–25 January 2019), December 2019 to January 2020, and January 2021. In the first case, three samples collected during 12–15 January 2019 exhibited persistently high levels of RH, SOR, and NOR (Fig. 3), pointing to enhanced formation of secondary species possibly through heterogeneous chemistry. This humid period was supposed to favor SOA production as well, since field observational results from the North China Plain repeatedly showed concurrent increases in secondary inorganic and organic components under high-RH conditions in winter (W. W. Hu et al., 2016; Liu et al., 2020; Sun et al., 2020). Similar to SOR and NOR, also increased substantially for the humid period during 12–15 January 2019 (averaging 12.09 ± 0.97) compared to results from the other samples (averaging 5.39 ± 1.04; Fig. 3). However, unlike , OC to EC ratios determined in other approaches (namely -I, -II, and -III) were less accurate or failed to track the RH-dependent enhancement of SOA formation (Fig. S6). This conclusion also held true for the other winters. Briefly, increased concurrently with SOR and NOR at high RH levels for the winters of both 2019–2020 (Fig. 4) and 2020–2021 (Fig. S7), whereas the alternative ratios did not.
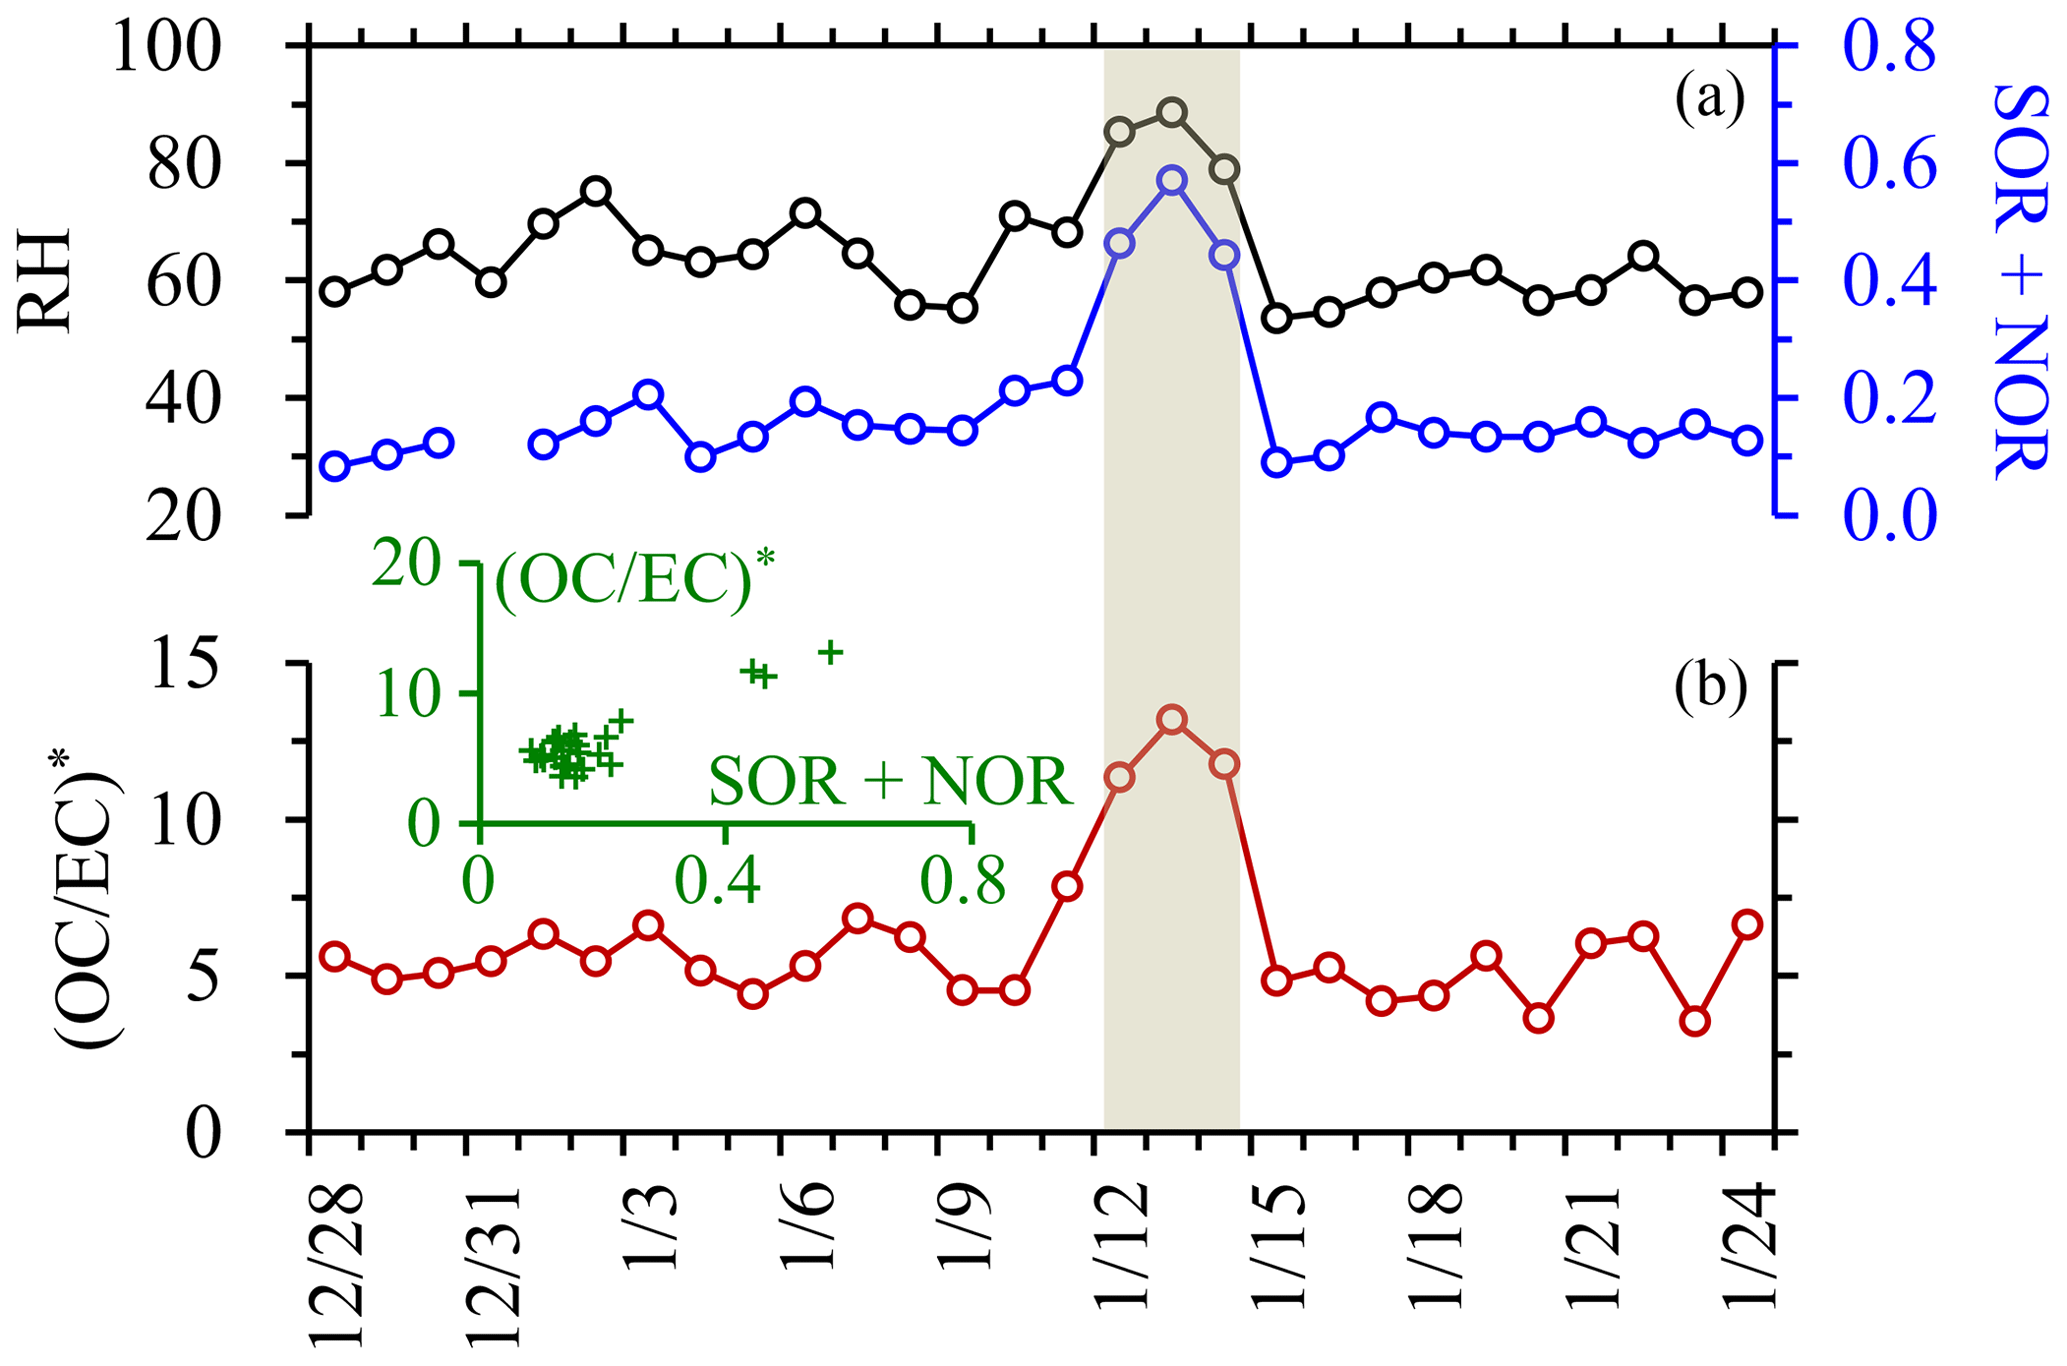
Figure 3Temporal variations in (a) RH, SOR + NOR, and (b) during the 2018–2019 winter period with insignificant impact from agricultural fires. The shadowed area highlights three distinct samples characterized by high RH and enhanced formation of secondary aerosols. The inner scatterplot shows the positive dependence of on SOR + NOR (r = 0.89).
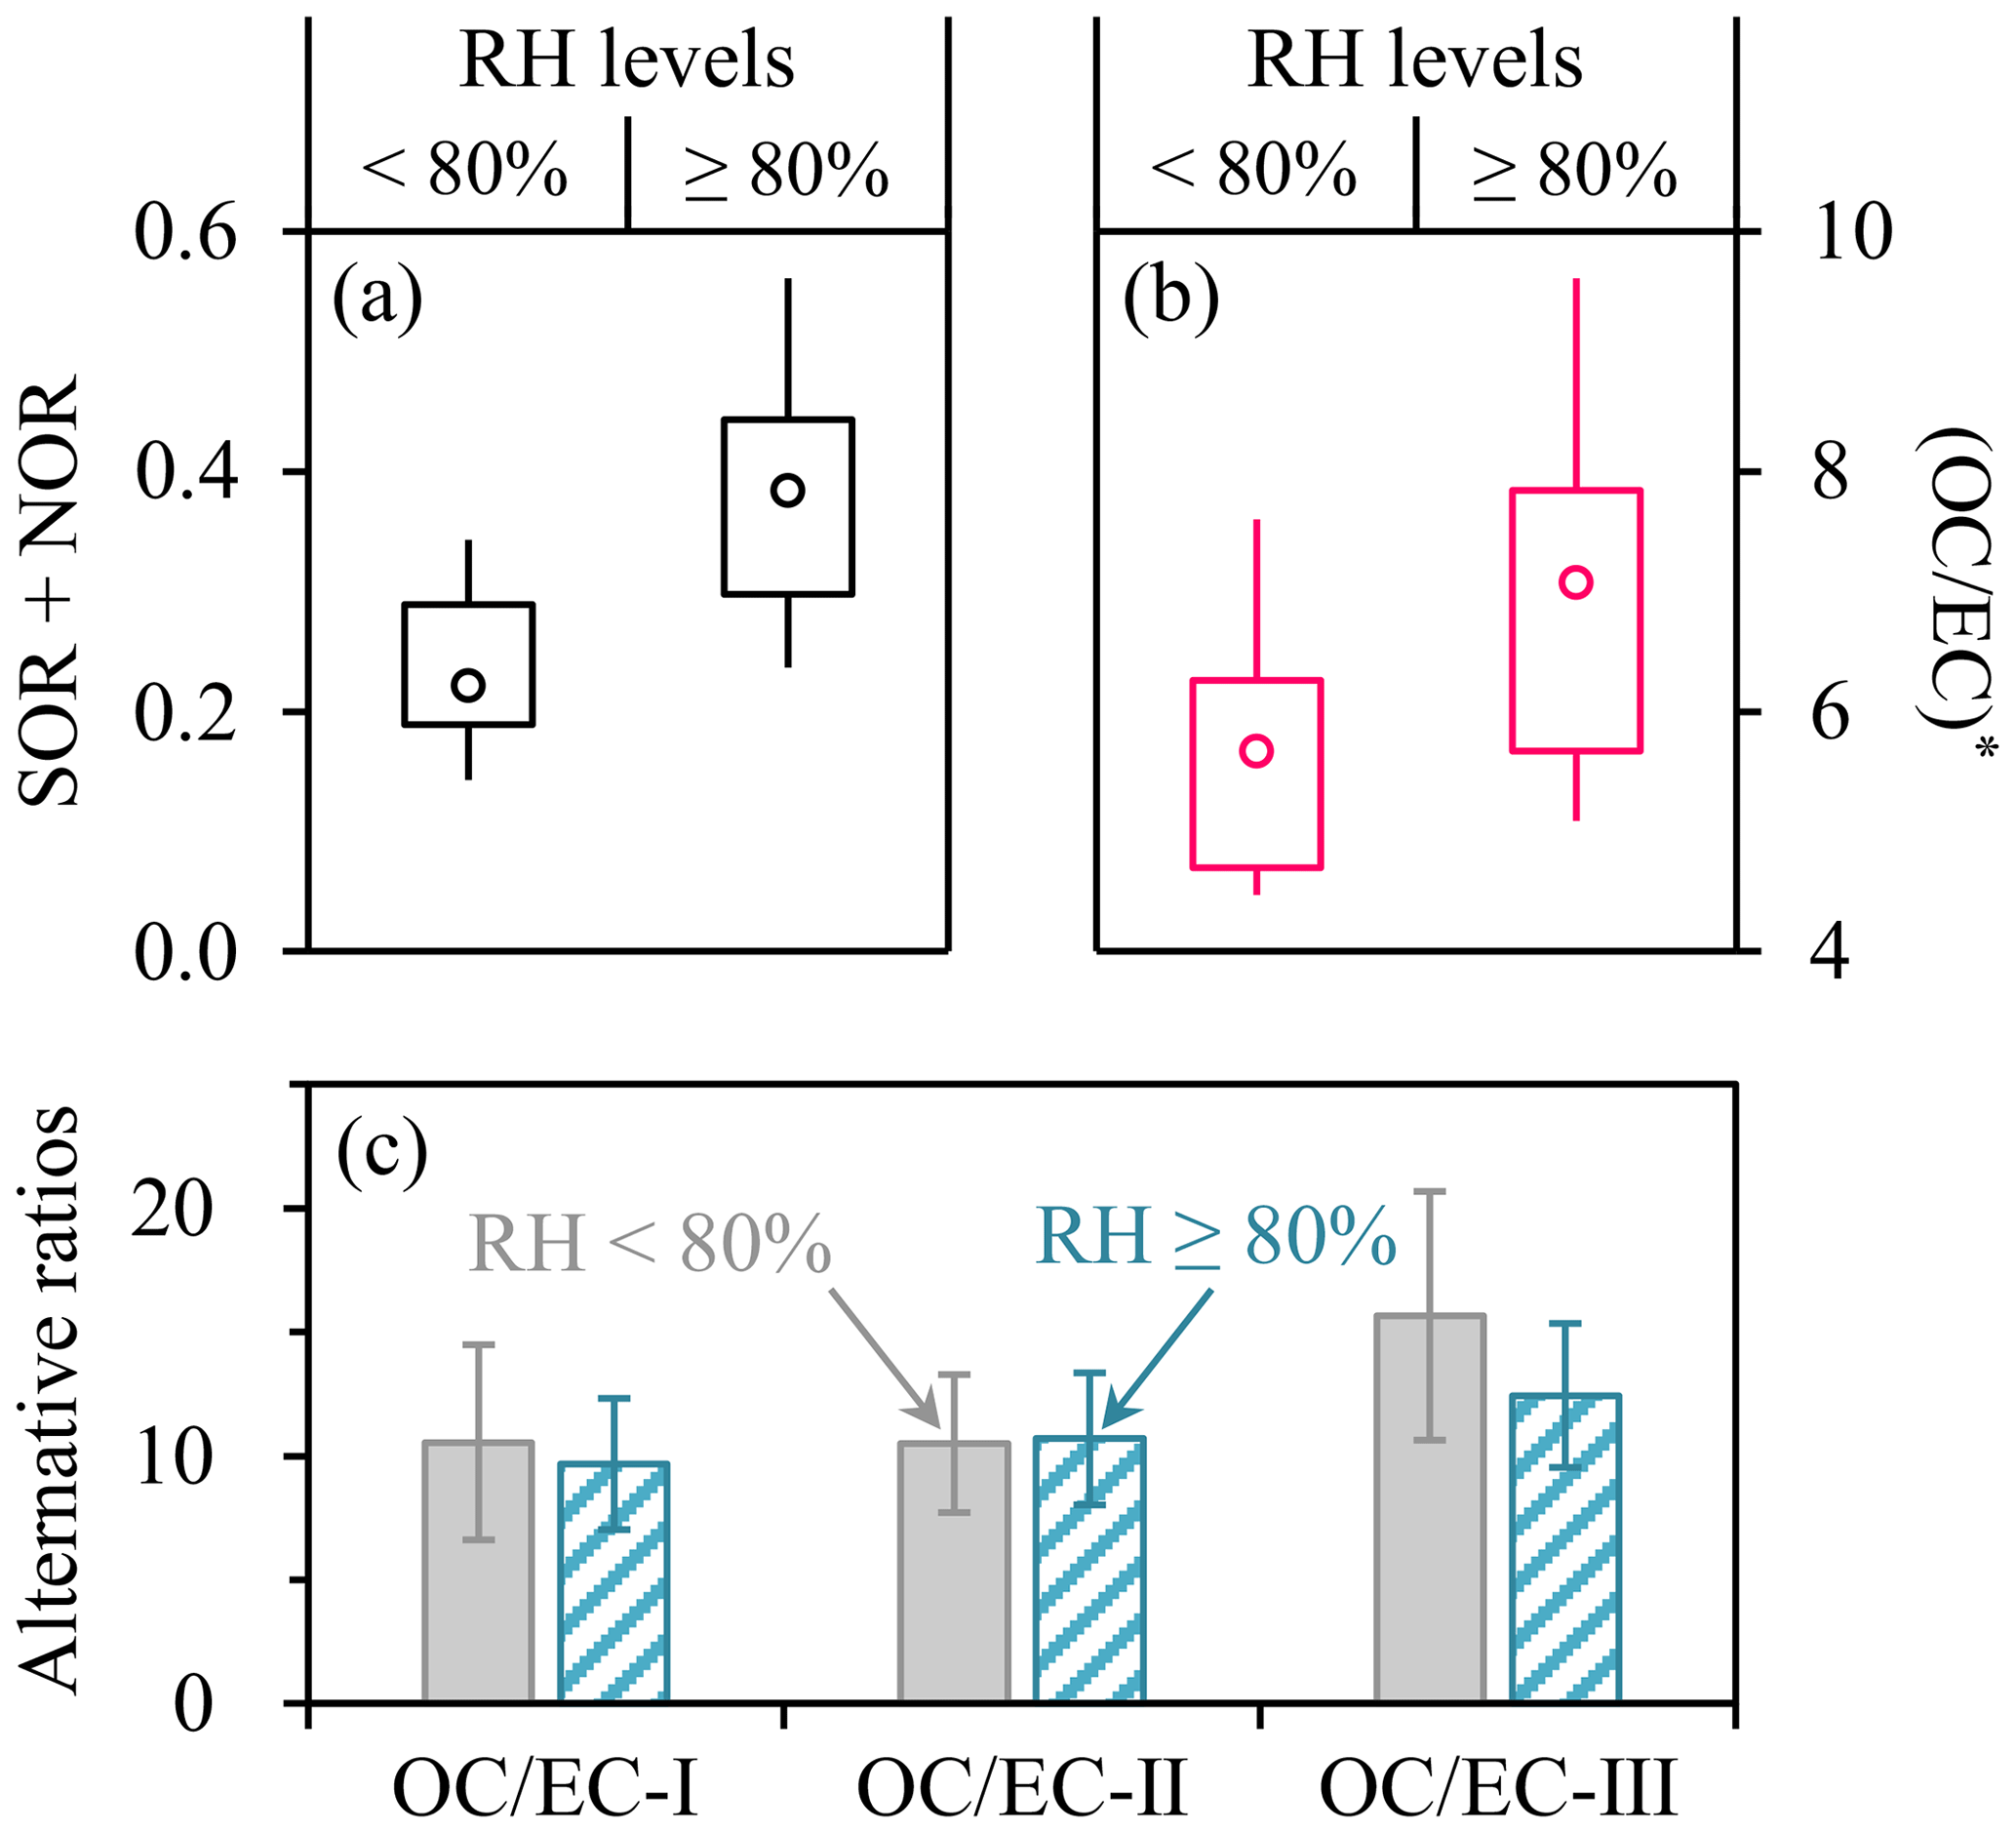
Figure 4Comparisons of (a) SOR + NOR, (b) , and (c) alternative ratios between RH ranges below and above 80 %, based on results from December 2019–January 2020. In (c), -I was derived from OC and EC measured by the untreated sample using NIOSH. -II was calculated by ECextracted, IMPROVE-A and the corresponding OC (i.e., TCuntreated − ECextracted, IMPROVE-A). -III was determined similarly based on NIOSH.
Second, EC concentrations measured by the extracted filters (ECextracted) were typically lower than results from the untreated ones (ECuntreated), especially for IMPROVE-A. This pattern could primarily be attributed to EC measurement uncertainties rather than EC loss during the extraction, as the latter had been demonstrated to be negligible in Sect. 3.1. Two influencing factors were identified for the ECextracted to ECuntreated ratios based on IMPROVE-A (defined as RIMPV). The first one was the relative abundance of sulfate on the extracted filter, which could be estimated by the sulfate to TCextracted ratio (). For the samples with little impact from open burning, RIMPV tended to decrease as became higher, with generally consistent relationships for the three campaigns (Fig. 5a). The median RIMPV was 0.86 when the ratios were below 1 and decreased to 0.62 for the range above 4 (Fig. S8). We proposed the following hypotheses for the negative dependence of RIMPV on . We first simplified the remaining particles on the extracted filters as a mixture of EC and sulfate, as nitrate and the vast majority of OC were soluble in methanol. Then a key assumption was that sulfate could promote the transmission of laser light through the extracted filters (e.g., by forward scattering; Petzold et al., 2005), indicating that the volatilization of sulfate during the inert mode of thermal–optical analysis could lead to a decrease in the transmittance signal (I). Thus in the oxidizing mode, a fraction of EC would be consumed to compensate for this decrease (i.e., make I return to its initial value), and consequently, elemental carbon mass would be underestimated by ECextracted.
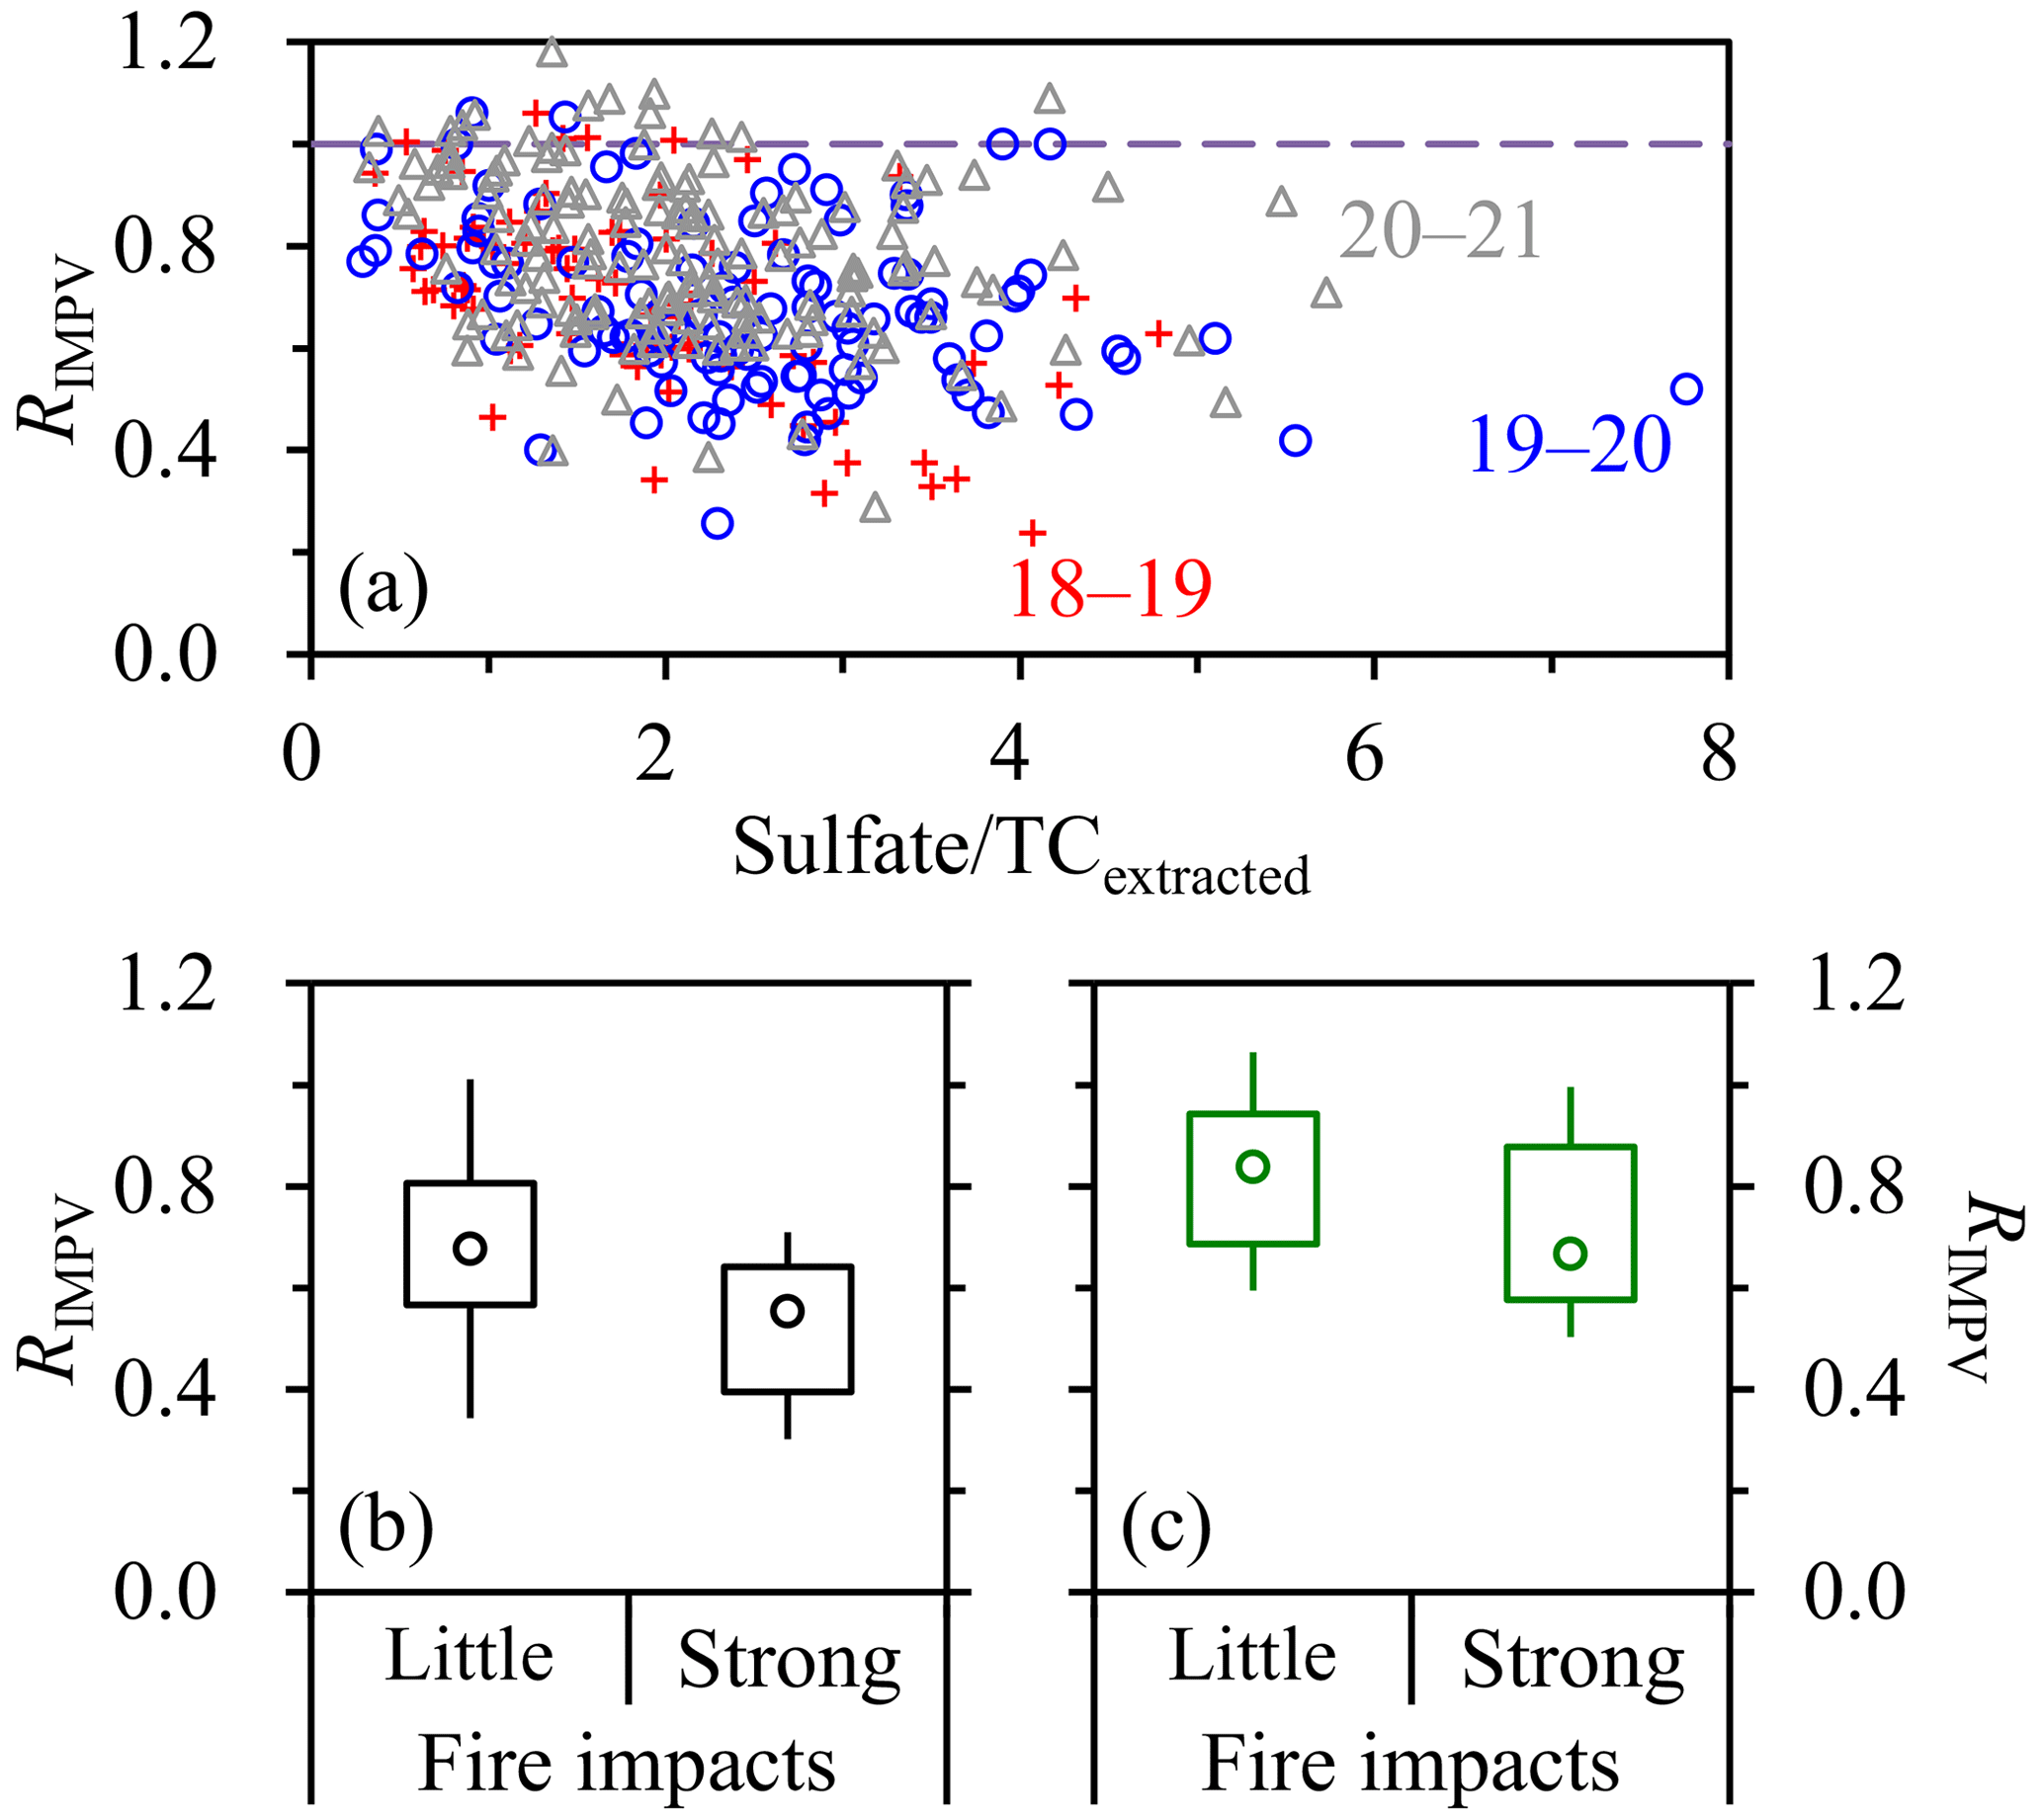
Figure 5(a) Dependence of RIMPV (i.e., the ECextracted to ECuntreated ratio based on IMPROVE-A) on , with results from different campaigns shown separately. Only the samples with little influence from open burning were included. (b) Comparison of RIMPV between the 2018–2019 samples with strong impacts from agricultural fires (as indicated by “strong”) and those with the same range but with little fire impact (as indicated by “little”). (c) The same as (b) but for 2020–2021.
In addition to , another influencing factor for RIMPV was open burning. RIMPV values determined for the agricultural fire episodes were lower compared to results from the periods with the same range but with little impact from open burning (Fig. 5b and c). As discussed in Sect. 3.1, agricultural fires could be a source of strongly absorbing BrC. For the untreated filters, such BrC could be difficult to properly distinguish from EC by the carbon analyzer used in this study. Thus, a possible explanation for the reduced RIMPV under strong impacts from agricultural fires was that open burning emissions could result in overestimation of elemental carbon mass by ECuntreated (i.e., the positive artifact). Under this assumption, the fire-induced decreases in RIMPV could be translated into positive artifacts of ∼ 25 % (based on the median RIMPV determined under little and strong fire impacts) for the open burning episodes of 2018–2019 and 2020–2021.
Similar to RIMPV, the ECextracted to ECuntreated ratios based on NIOSH (RNIOSH) also tended to decrease with increasing , e.g., with the median RNIOSH decreasing from 1.00 to 0.78 as became higher (Fig. S8). Thus, the inference on the underestimation of elemental carbon mass by ECextracted should be valid for NIOSH as well. The RNIOSH close to 1 but lower RIMPV (0.86) determined for the same range below 1 (Fig. S8) suggested that the extraction led to comparable ECuntreated and ECextracted when using NIOSH but resulted in relatively low ECextracted when using IMPROVE-A. This prohibited the use of an ECuntreated vs. ECextracted relationship for the assessment of EC loss during extraction and highlighted the significance of the ΔATN-based evaluation results in Sect. 3.1. It is also noteworthy that for NIOSH, ∼ 40 % of the samples showed RNIOSH values above 1, indicating that their ECuntreated results were even lower than ECextracted. A possible explanation was that when using NIOSH, ECuntreated frequently underestimated the elemental carbon mass, and the underestimation could be more significant than that by ECextracted. In addition, no evidence of apparent influence of open burning on RNIOSH was observed (Fig. S9). It appeared that the determination of ECuntreated was less significantly affected by agricultural fires when using NIOSH compared to IMPROVE-A.
The third pattern derived from the comparison of EC results across different methods was that for the untreated samples, the IMPROVE-A protocol led to higher EC values than NIOSH (Fig. 6). This pattern was in line with results from other regions (e.g., Chow et al., 2004; Piazzalunga et al., 2011; Giannoni et al., 2016) and was consistent with the previous inference on the uncertainty of the NIOSH-based ECuntreated. In addition, the discrepancies between ECuntreated measured by the two protocols became larger with increasing impacts from agricultural fires (Fig. 6). This trend could be attributed to the open-burning-induced overestimation of elemental carbon mass by ECuntreated (i.e., the positive artifact), which was considerable for IMPROVE-A (Fig. 5b and c) but appeared insignificant when using NIOSH (Fig. S9). Another noteworthy feature in Fig. 6 was that compared to the open burning episodes of 2020–2021, the 2018–2019 fire events showed more significant inter-protocol differences in ECuntreated. The contrast appeared to indicate that the 2018–2019 fires, which were inferred to have lower combustion efficiencies (Cheng et al., 2022), could result in more significant positive artifacts for IMPROVE-A.
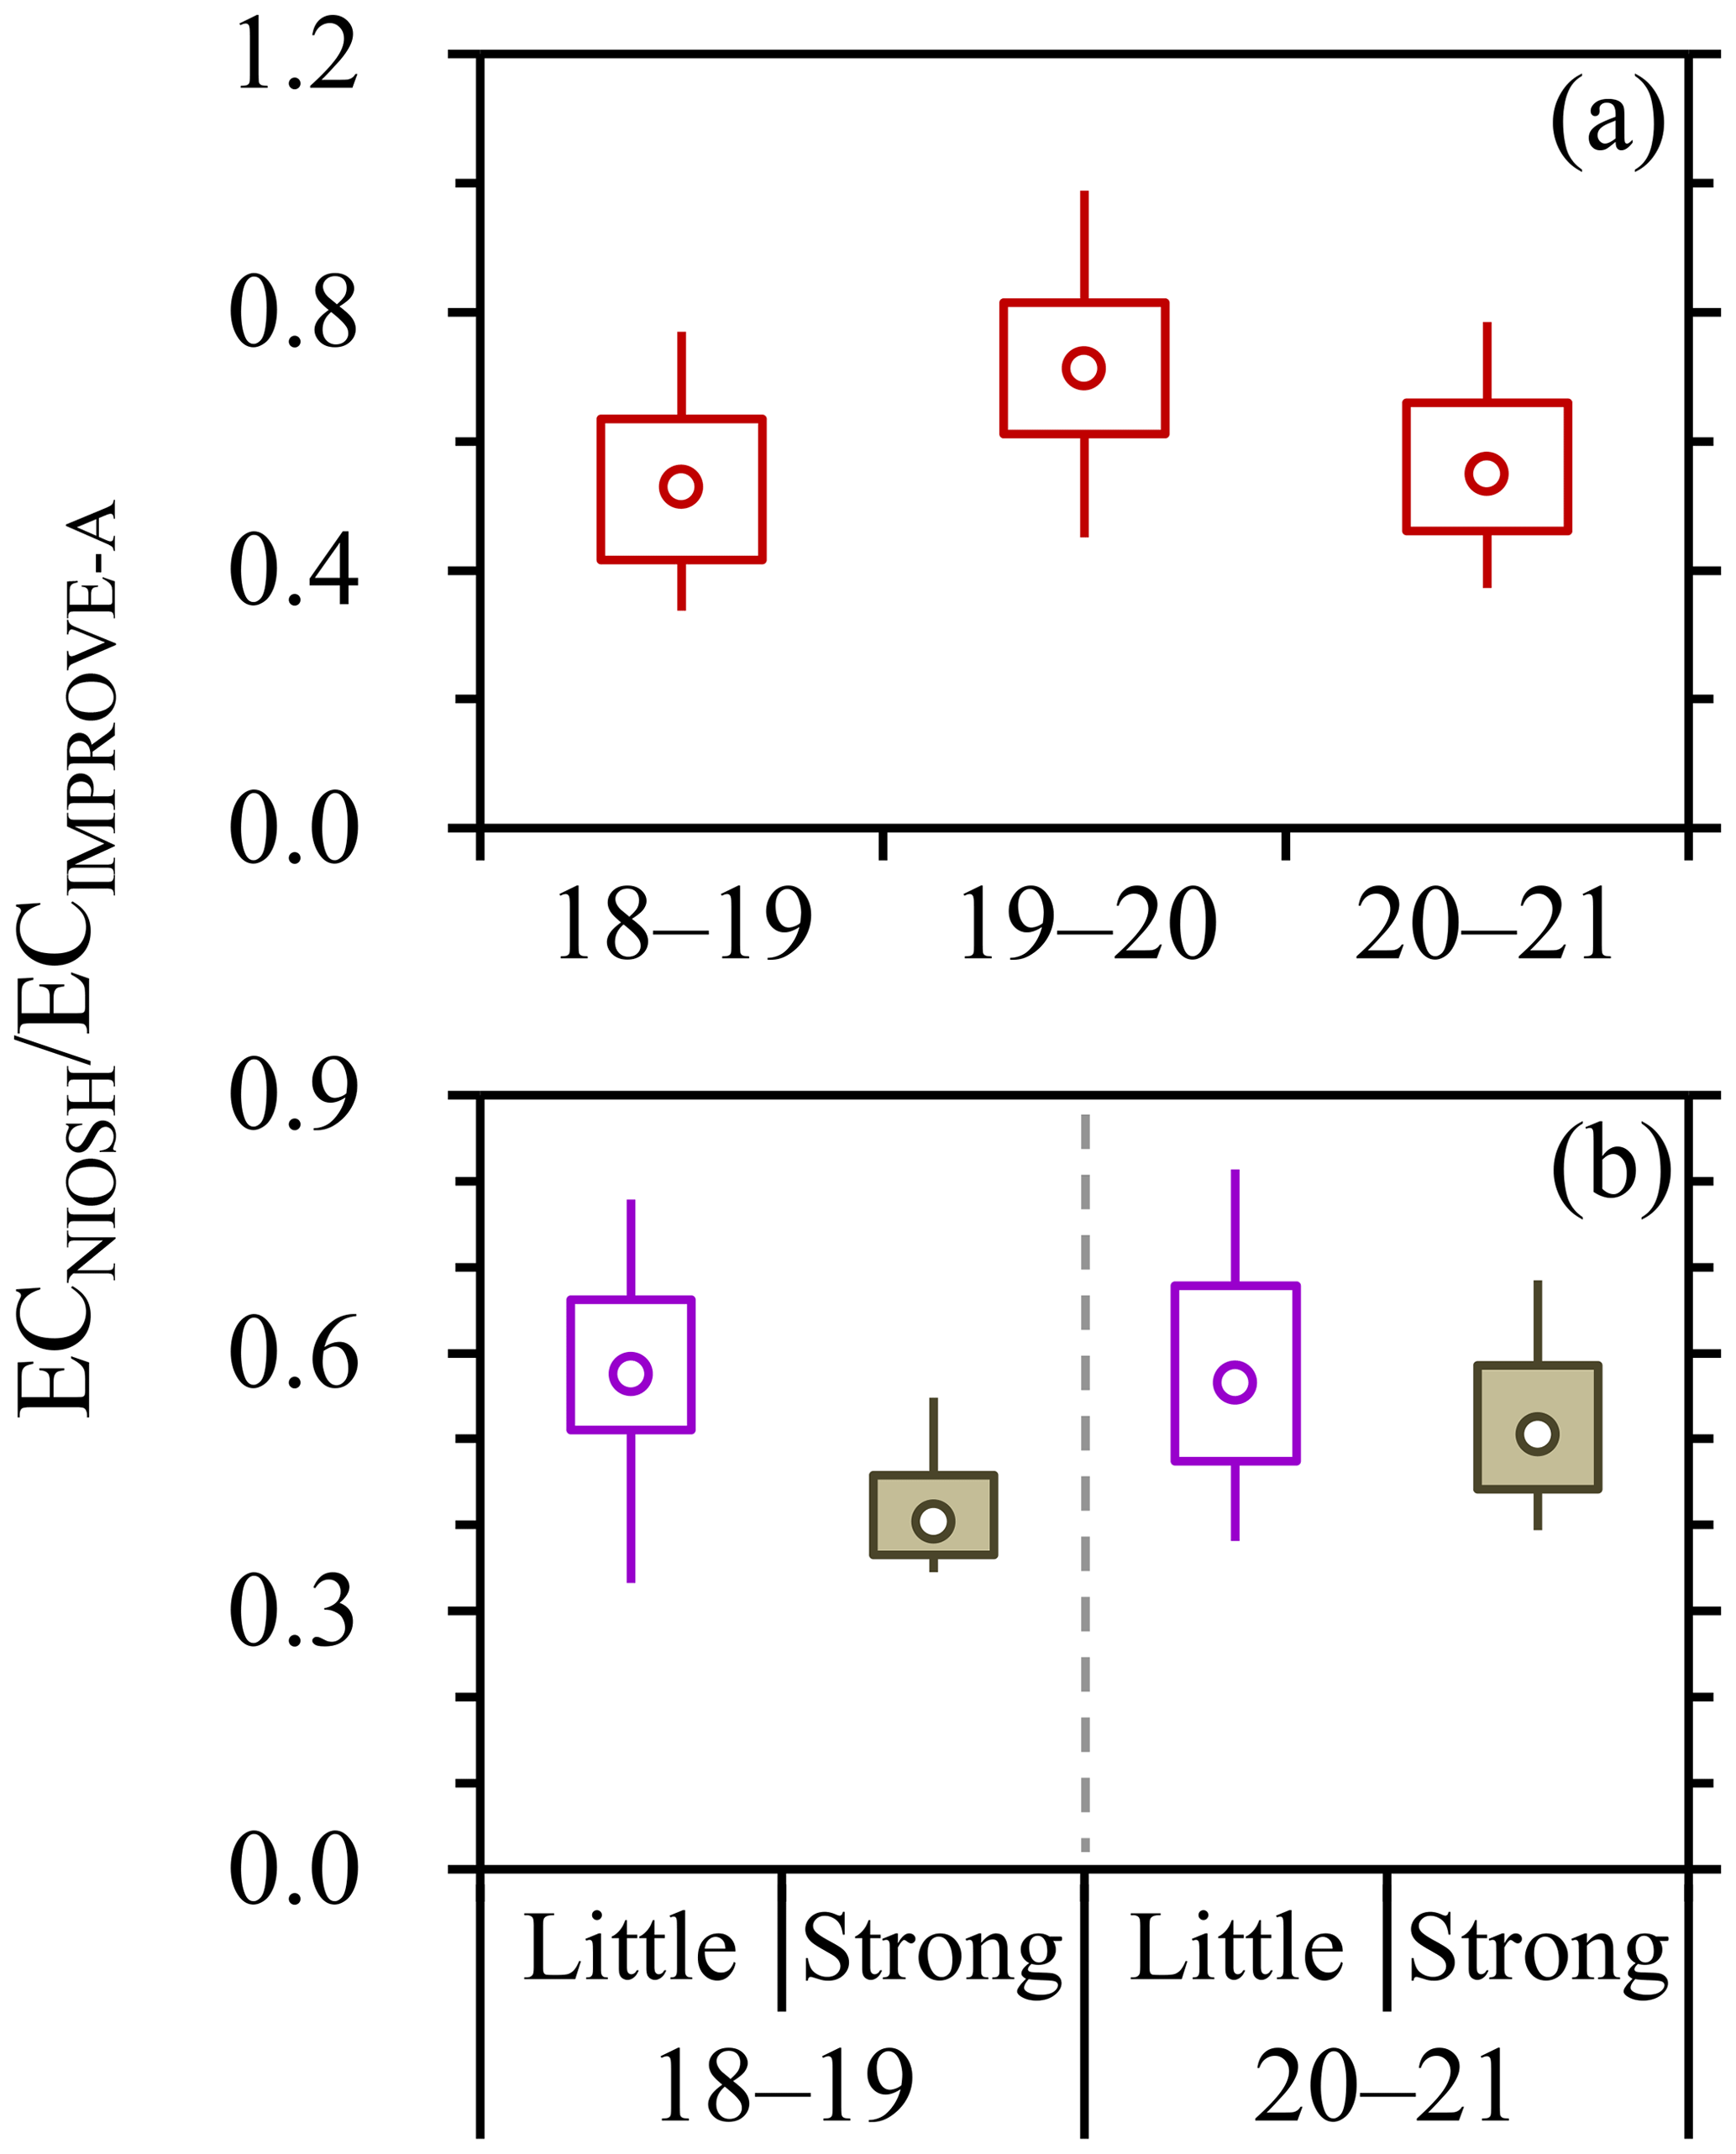
Figure 6Ratios between EC measured by different protocols using the untreated samples, i.e., ECNIOSH/ECIMPROVE-A. Panel (a) compares the ratios across campaigns. Panel (b) compares the ratios between the samples with little and strong impacts from agricultural fires, with results from 2018–2019 and 2020–2021 shown separately.
As reflected by the discussions above, all the EC results had uncertainties, regardless of the pretreatment approaches (with or without methanol extraction) and temperature protocols (IMPROVE-A or NIOSH). For the untreated samples, the IMPROVE-A protocol led to ratios in reasonable accordance with secondary aerosol formation, whereas NIOSH did not. However, it must be acknowledged that for IMPROVE-A, the elemental carbon mass was likely overestimated by ECuntreated under strong impacts from agricultural fires (by ∼ 25 %), presumably due to the interference of BrC. Although this positive artifact could in principle be reduced or minimized by methanol extraction, a new issue arose: the elemental carbon mass was underestimated by ECextracted (i.e., the negative artifact), which was inferred to be associated with the volatilization of sulfate from the extracted samples during the inert mode of thermal–optical analysis. The significance of the negative artifact could be reflected by decreases in EC after extraction, which were as high as ∼ 15 %–40 % for IMPROVE-A (Fig. S8). Importantly, the negative artifact was not limited to the open-burning-impacted samples; i.e., it also biased the measurement of samples with little influence from agricultural fires. Thus, although the methanol extraction could reduce the positive artifacts of ECuntreated for the fire episodes, it in turn caused more significant negative artifacts of ECextracted for all the Harbin samples. Consequently, the methanol extraction was not considered an effective approach to improve the measurement of elemental carbon mass in this study. In the following discussions, the ECuntreated results based on IMPROVE-A, i.e., EC∗, are used for exploring the sources of light-absorbing carbon in Harbin.
3.3 Sources of light-absorbing carbon
Based on the observational results, EPA's positive matrix factorization (PMF) model (version 5.0) was used to elucidate the sources of light-absorbing carbonaceous aerosols. Here we focus on the 2020–2021 campaign, which experienced coexisted features of 2018–2019 and 2019–2020 (i.e., strong impacts of agricultural fires and high-RH conditions, respectively). A six-factor solution was resolved by PMF (Fig. S10), using time series of EC∗, BrC mass concentration (i.e., MSOC), the light absorption coefficient of BrC at 365 nm (i.e., (babs)365), levoglucosan, chloride, sulfate, nitrate, and ammonium as inputs. Briefly, two factors were considered secondary due to their dominant contributions to secondary inorganic ions; two factors were attributed to primary emissions from biomass burning (BB), as they explained the vast majority of levoglucosan; and the last two factors were important contributors to EC and chloride but had little levoglucosan or secondary species, pointing to primary emissions from non-BB sources (e.g., coal combustion and vehicles). MSOC concentrations apportioned into these three source categories were termed sec-MSOC, pri-MSOCBB, and pri-MSOCnon-BB, respectively. Source-resolved BrC light absorption results were defined similarly, as sec-BrC, pri-BrCBB, and pri-BrCnon-BB. EC∗ concentrations emitted by the BB and non-BB sources were referred to as ECBB and ECnon-BB, respectively. Figure 7 presents an overview of the source apportionment results. The temporal variations in the MSOC and (babs)365 source attributions were characterized by considerable increases in the BB contribution in April, the season with the most frequent occurrences of agricultural fires. It was also noticed that secondary formation was an important source of MSOC (especially in winter) but contributed less significantly to (babs)365. This pattern could be attributed to the fact that secondary BrC was typically less absorbing than primary BrC (Kumar et al., 2018; Cappa et al., 2020). For the sources of EC∗, a noteworthy feature was that the BB contributions reached similarly high levels in the months of April and January, with the former being heavily impacted by agricultural fires and the latter being the coldest month with little influence from open burning.
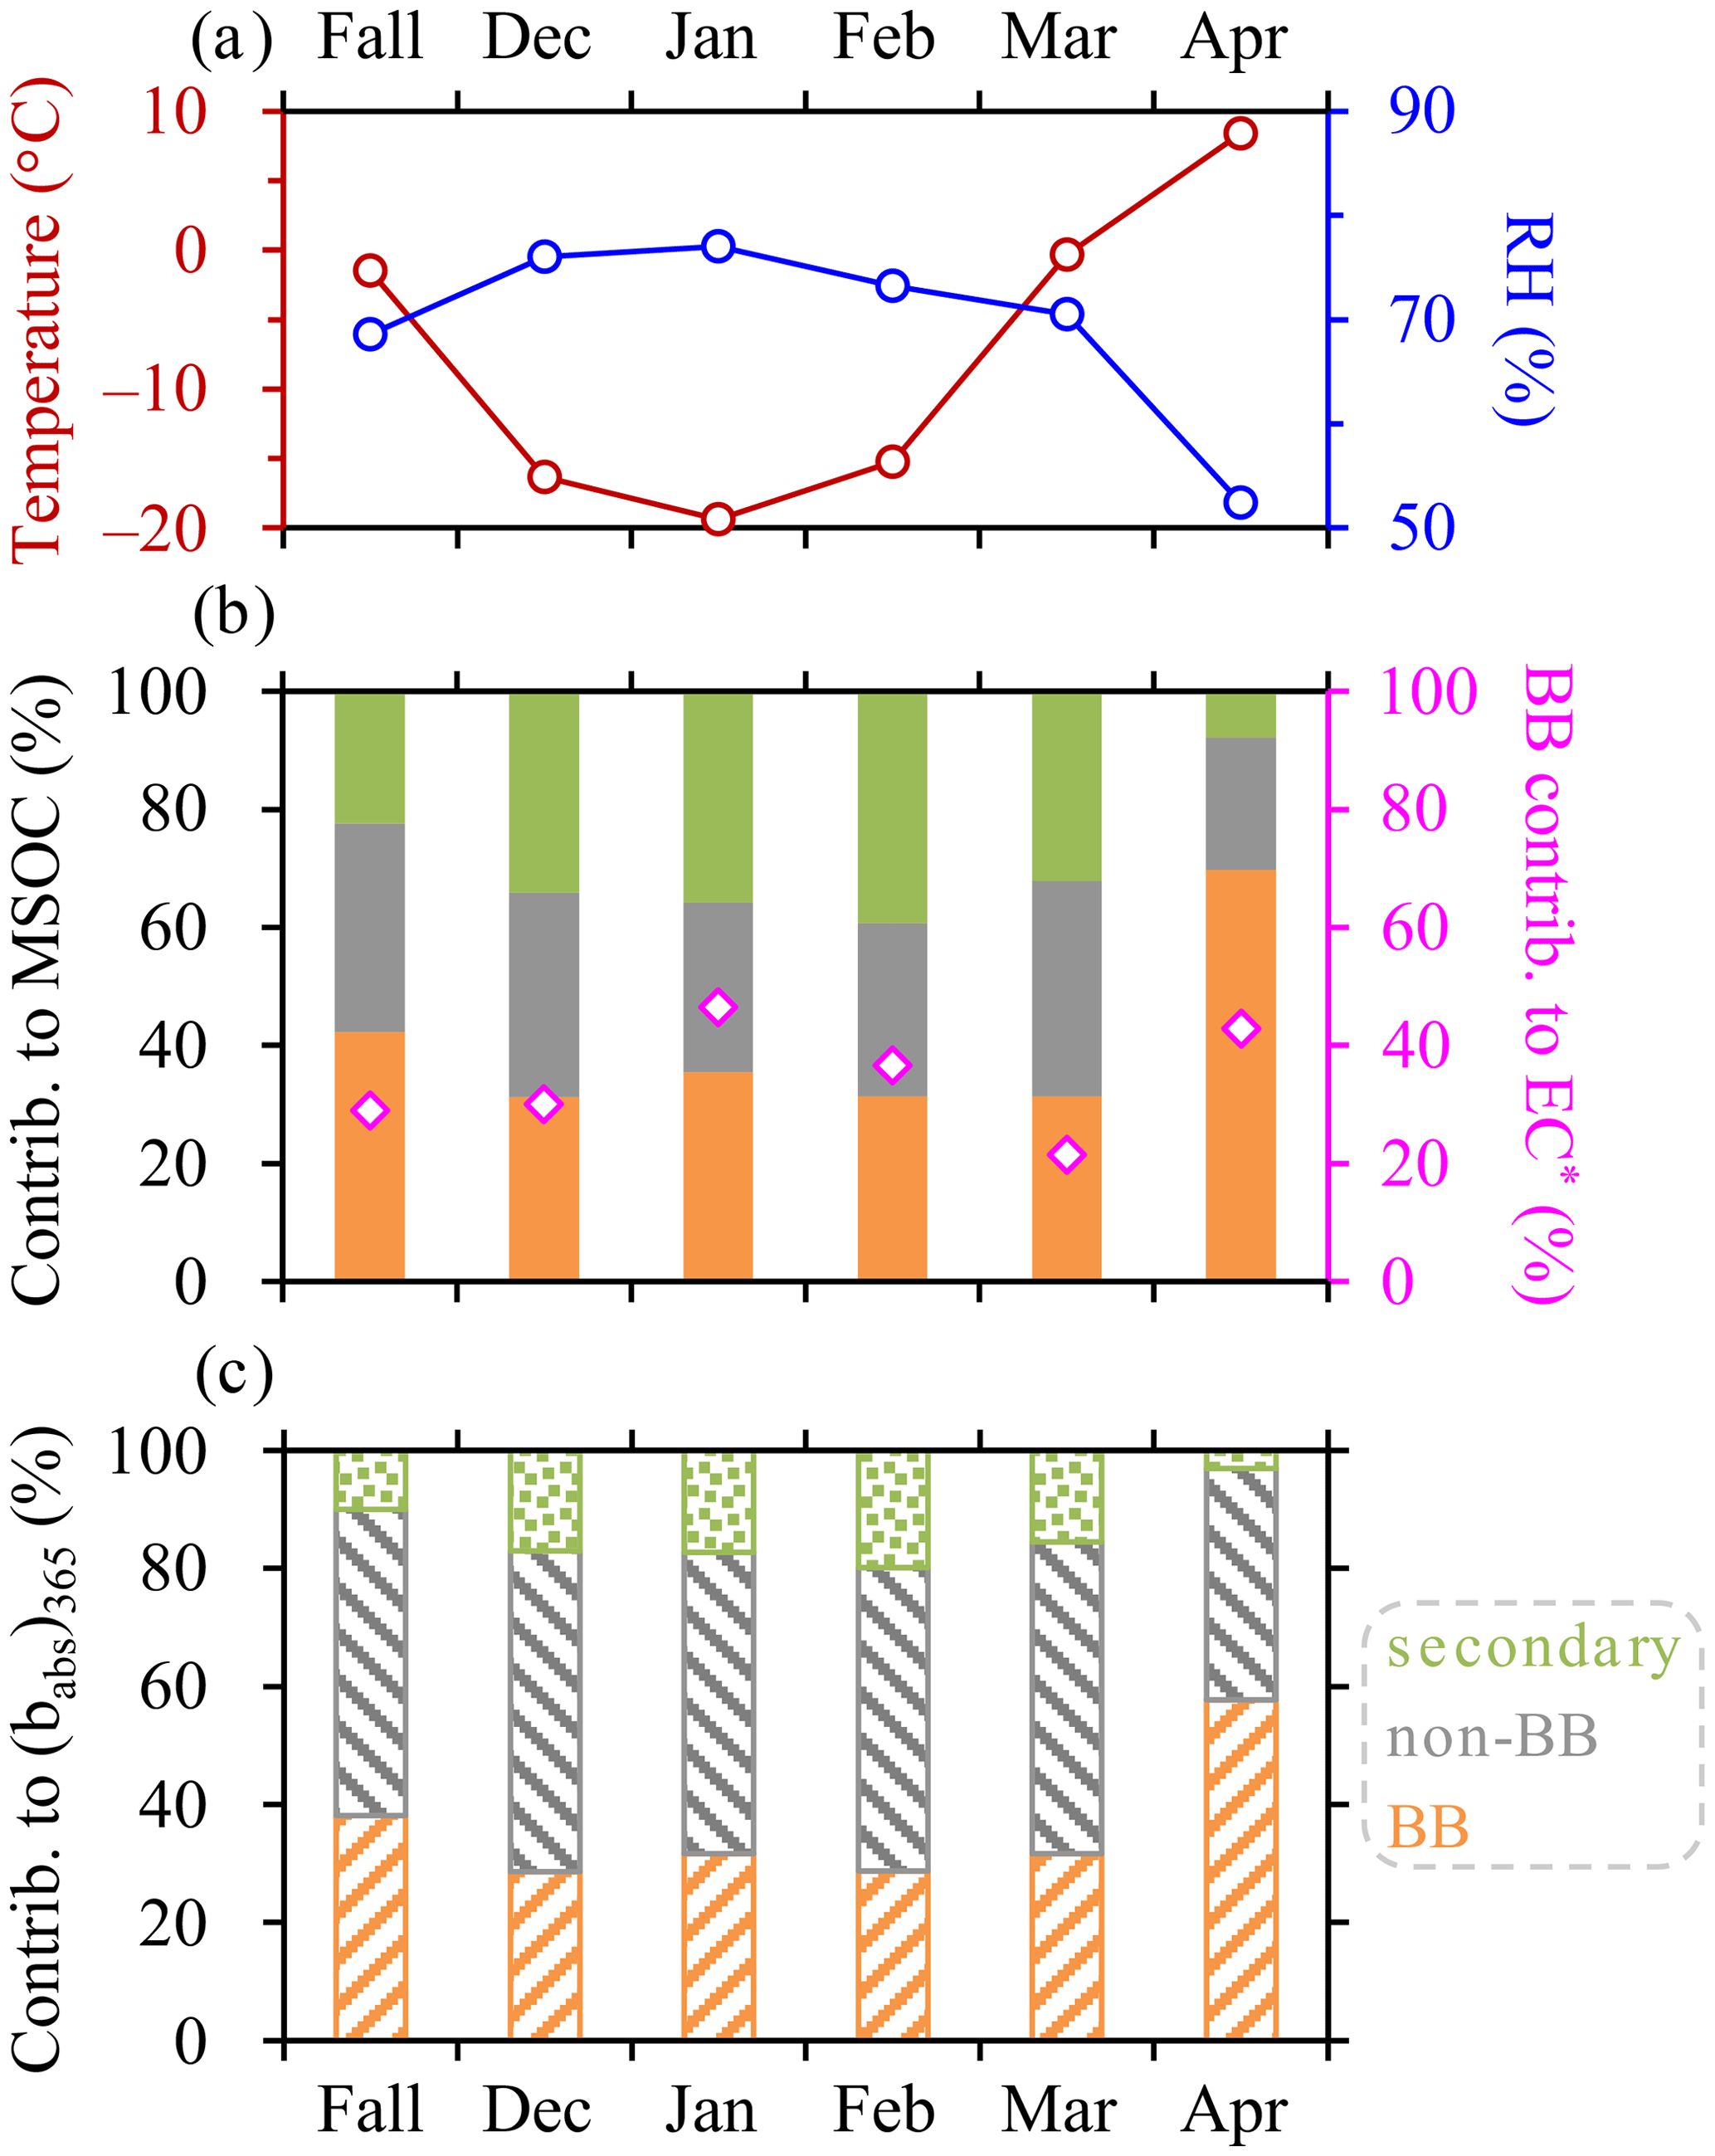
Figure 7Monthly-averaged temperatures and RH (a), as well as source apportionment results of MSOC, EC (b), and (babs)365 (c) for the 2020–2021 campaign. Fall indicates mid-October to November. In (b) and (c), sources of MSOC and (babs)365 were classified into three categories distinguished by different colors in the bar charts, i.e., primary BB emissions in orange, primary non-BB emissions in grey, and secondary emissions in green. Sources of EC∗ were separated into BB and non-BB emissions, with the BB contributions shown by the diamonds in the middle panel.
The revised CMAQ predicted the concentrations of organic and elemental carbon (i.e., OCmod and ECmod), with the primary and secondary OC (i.e., POCmod and SOCmod) results available as well. Given that MSOC approximately equaled OC∗ (Fig. S11), it should be acceptable to perform direct comparisons between these two terms from various sources, i.e., between SOCmod and sec-MSOC and between POCmod and primary MSOC (pri-MSOC; calculated as the sum of pri-MSOCBB and pri-MSOCnon-BB). For the samples with little influence from agricultural fires, the revised CMAQ reproduced the observation-based pri-MSOC and EC∗ generally well (Fig. 8a), with mean biases of −1.94 µg C m−3 (POCmod − pri-MSOC) and −0.43 µg C m−3 (ECmod − EC∗), respectively. In this case, the POCmod to ECmod ratios also coincided with the measurement results, i.e., the pri-MSOC to EC∗ ratios. For example, the two ratios agreed with respect to both the absolute values and the seasonal variations (Fig. 8b). These consistencies to some extent supported the reliability of the source apportionment results from PMF.
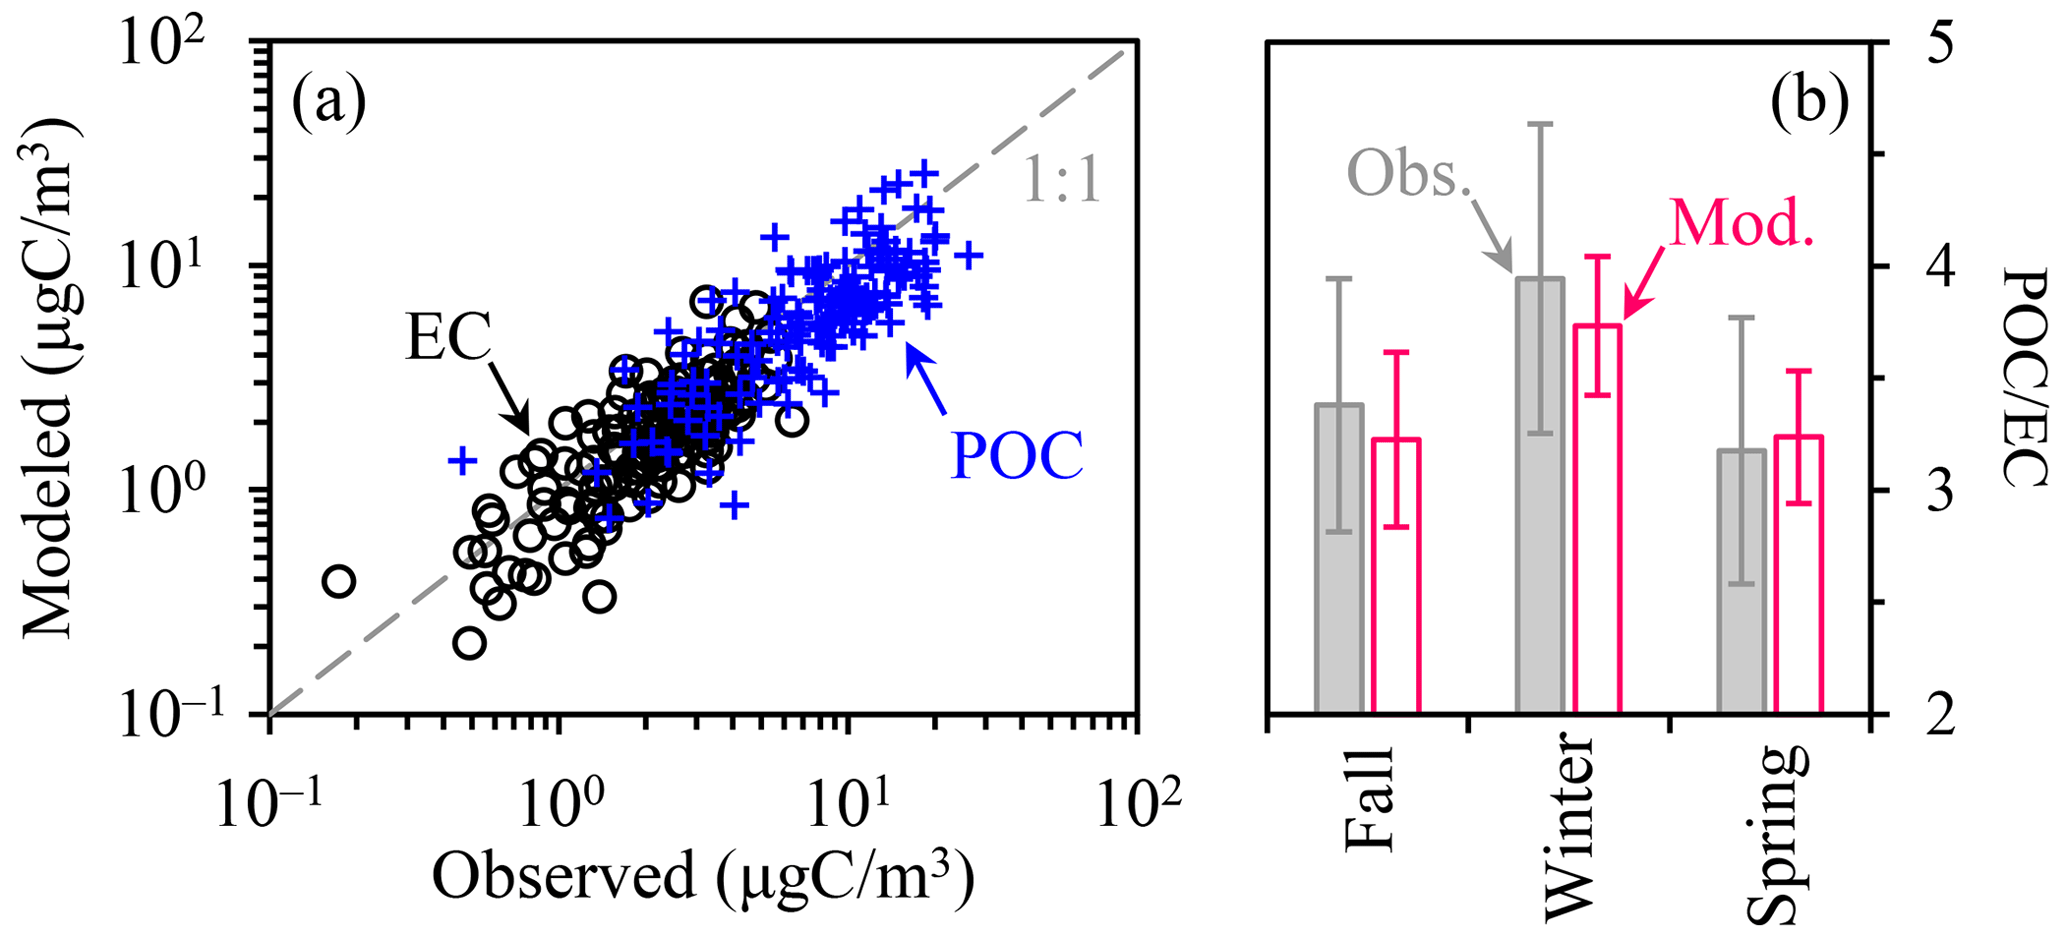
Figure 8Comparisons of the modeled and observed (a) POC and EC concentrations and (b) seasonal POC to EC ratios for the 2020–2021 campaign. Only the samples with little fire impact were included. The 1:1 line is also shown in (a).
The high-RH conditions were concentrated in the winter, i.e., December 2020 to February 2021. Such conditions were believed to favor SOA production, as indicated by the RH-dependent increases in SOR and NOR (Fig. 1b and c). This inference was further confirmed by the PMF results, as both the sec-MSOC and sec- were considerably enhanced after RH exceeding 80 % (Fig. 9). The PMF results also confirmed the link between and SOA formation, given the agreement between sec-MSOC and results from the EC-tracer method (r = 0.91; Fig. S12). The revised CMAQ predicted the RH-dependent enhancement of SOC formation as well. However, it failed to reproduce the observed SOC concentrations and SOC to EC ratios, with significant underestimations. For example, the modeling results only explained 18 % and 22 % of the observed SOC concentrations (corresponding to 19 % and 26 % of the observed SOC to EC ratios) for the RH ranges below and above 80 %, respectively. The results suggested that the SOA module of the revised CMAQ, including the newly added heterogeneous mechanisms, still required substantial improvements. In addition, aerosol water could remain supercooled at the typical temperatures during winter in Harbin, which were down to about −25 °C in terms of daily average (Rosenfeld and Woodley, 2000). For the frigid atmosphere in Northeast China, therefore, heterogeneous reactions in aerosol water were expected to prevail as long as RH reached sufficiently high levels. The mechanisms of low-temperature chemistry, which may differ from those in the relatively warm regions (e.g., Beijing), merit further investigations.
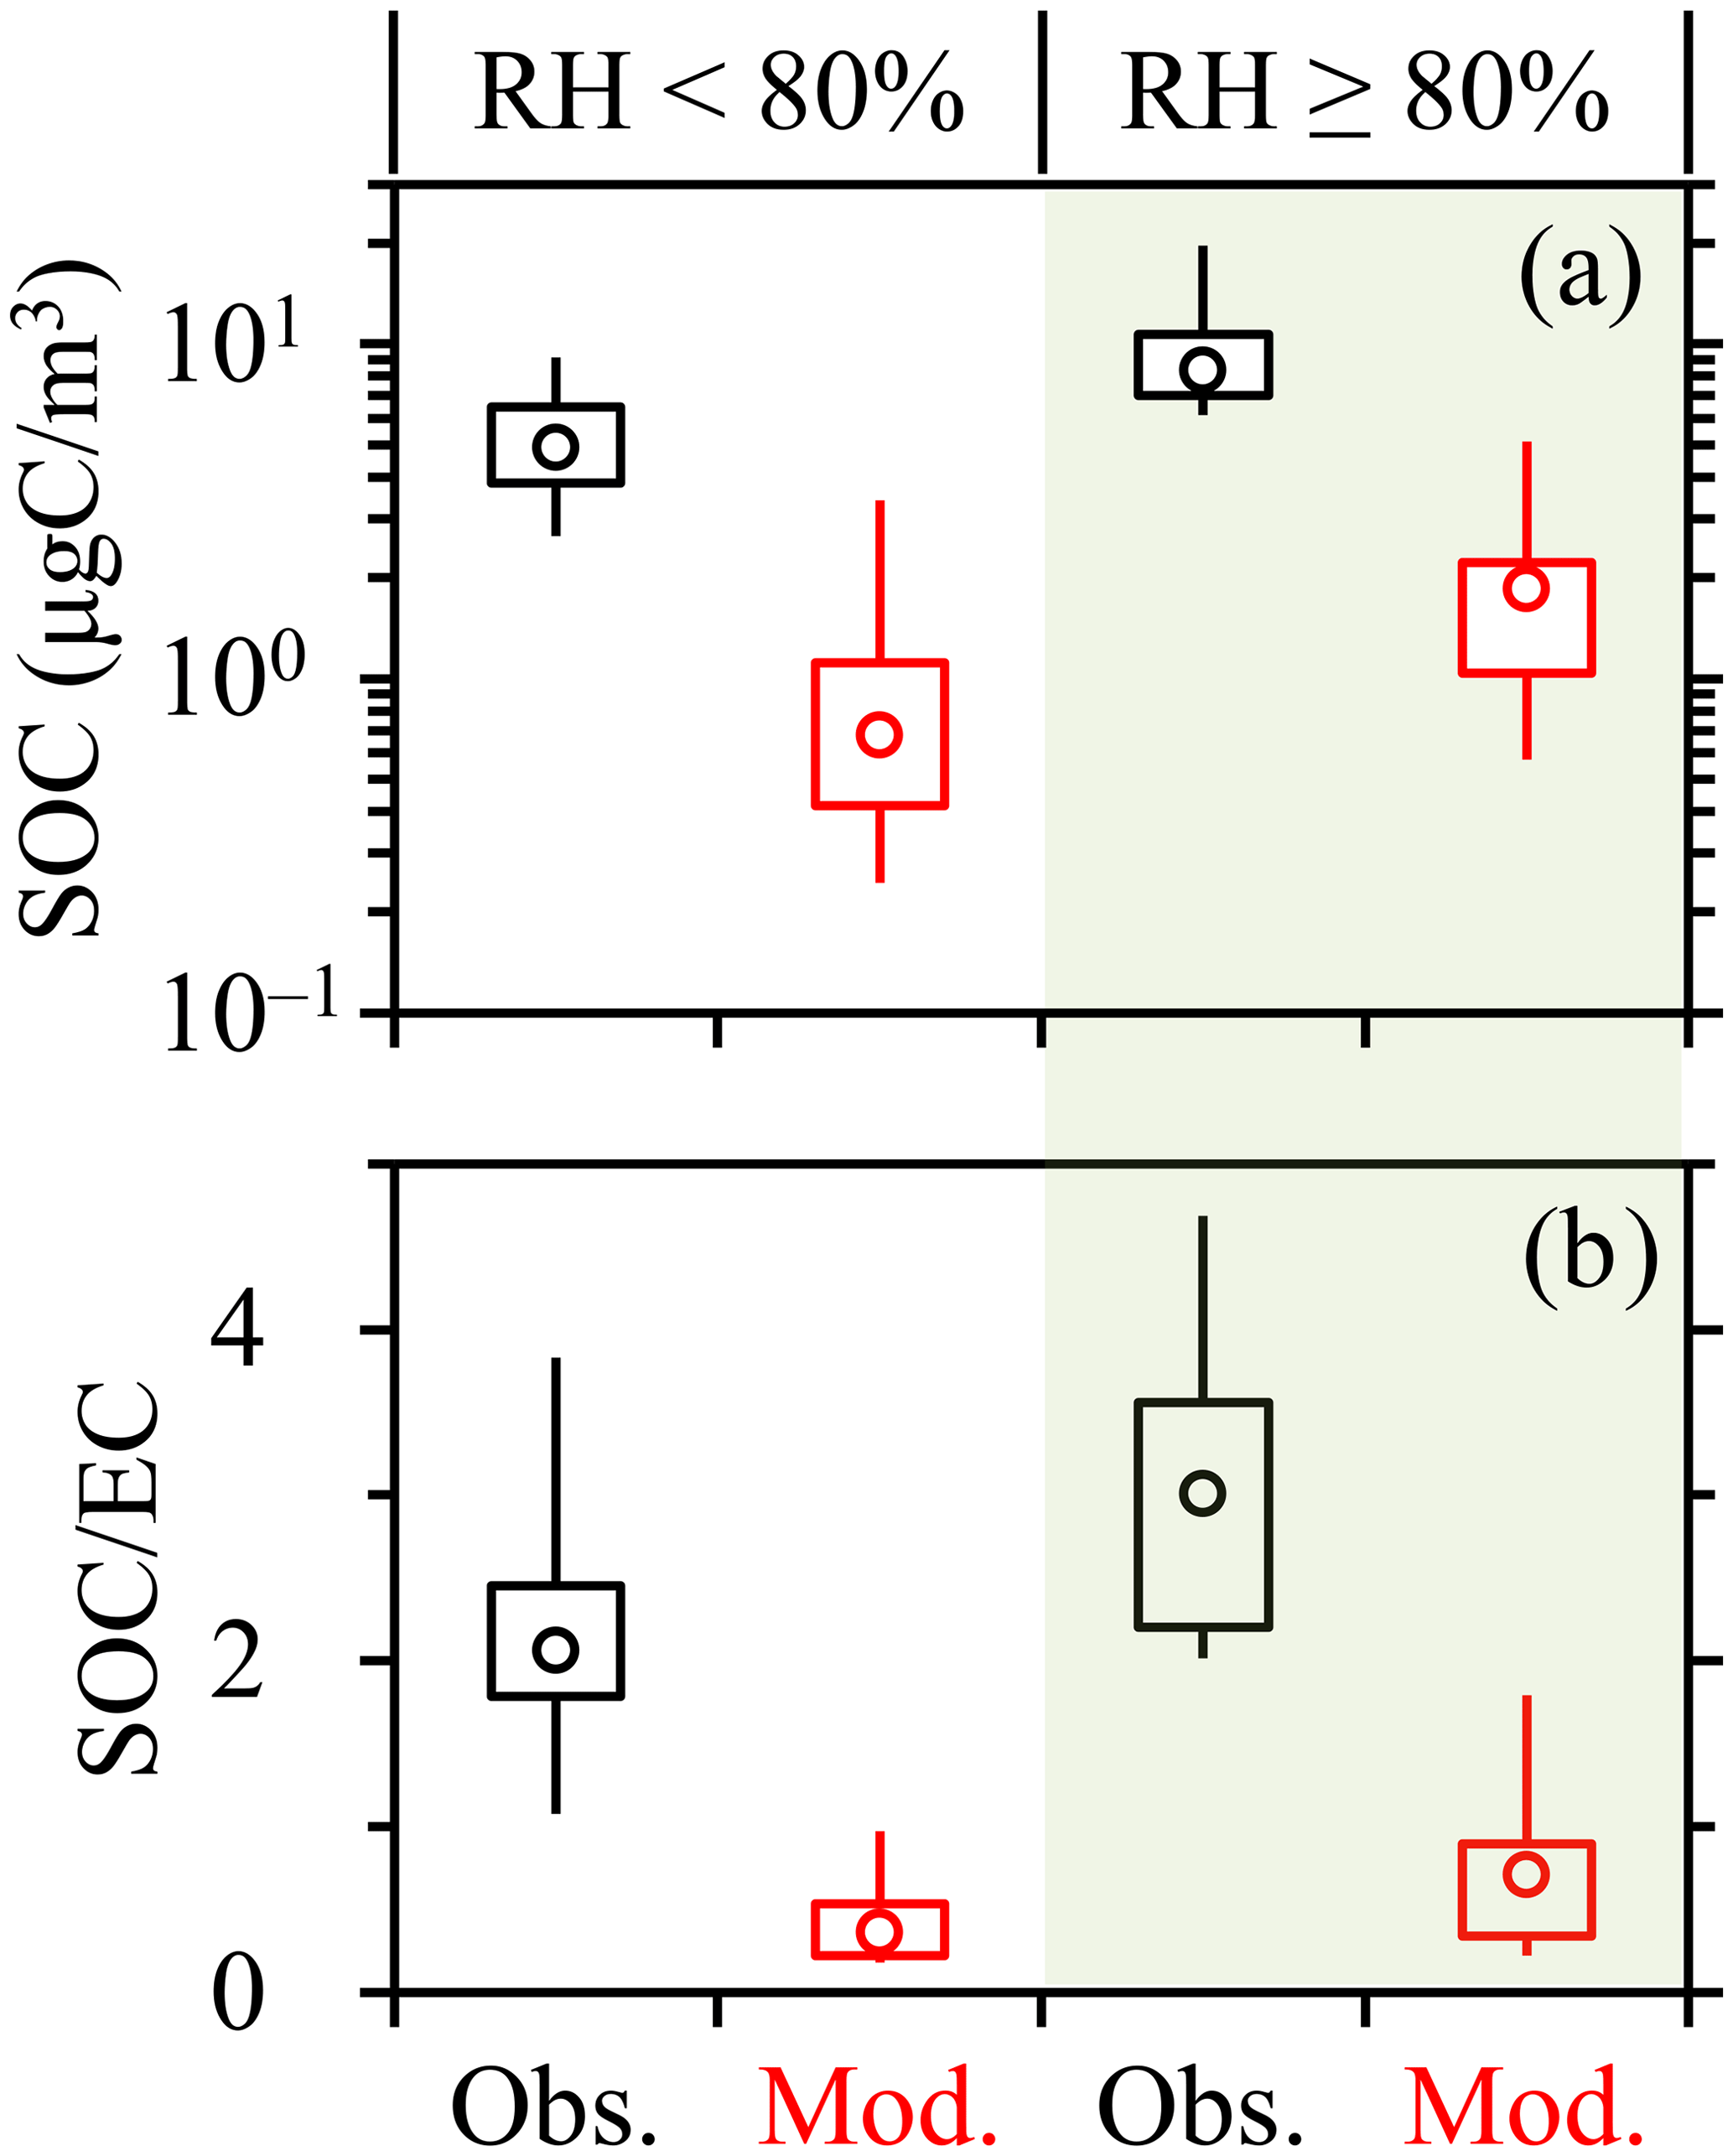
Figure 9Comparisons of the modeled and observed (a) SOC concentrations and (b) SOC to EC ratios for the 2020–2021 winter. The comparisons were performed for the RH ranges below and above 80 % separately. Open burning impact was negligible for this period.
The agricultural fire episodes mainly occurred in April during the 2020–2021 measurement period. PMF results suggested that the BB contributions to MSOC and EC∗ increased significantly for the fire episodes (reaching 72 % and 44 %, respectively) compared to other periods in spring (33 % and 25 %, respectively). The fire emissions also significantly increased the observation-based POC concentrations (i.e., pri-MSOC) and POC to EC ratios (i.e., pri-MSOC/EC∗; Fig. 10). This is within expectation, since organic compounds were frequently found to constitute the vast majority of the particulate emissions from open burning emissions (Hodgson et al., 2018; Garofalo et al., 2019). Since the revised CMAQ did not predict biomass burning OC separately, comparison of the modeling and observational results could only be made based on the bulk primary OC. As shown in Fig. 10, the model could not track the influences of agricultural fires on primary OC, e.g., as indicated by the largely comparable POCmod to ECmod ratios between the fire episodes and other periods in spring. It appeared that the fire emissions, which were derived from the FINN inventory, were underestimated for the model simulation. In FINN, the open burning emissions were retrieved using burned areas detected by the Terra and Aqua polar-orbiting satellites (Wiedinmyer et al., 2011). A limitation of this approach was the missing of fires due to satellite overpass timing (Uranishi et al., 2019), which was also the case for the Global Fire Emissions Database (GFED), another commonly used open burning inventory based on burned areas (Konovalov et al., 2018; Chen et al., 2023). Previous studies have suggested that the underestimation of open burning emissions by FINN or GFED could be considerable, e.g., by a factor of as high as above 20 (Xie et al., 2024). Given the massive agricultural sector in Harbin and surrounding areas (e.g., the Harbin–Changchun metropolitan area), we suggest that the uncertainties in open burning inventories merit particular attention for the modeling studies in this region.
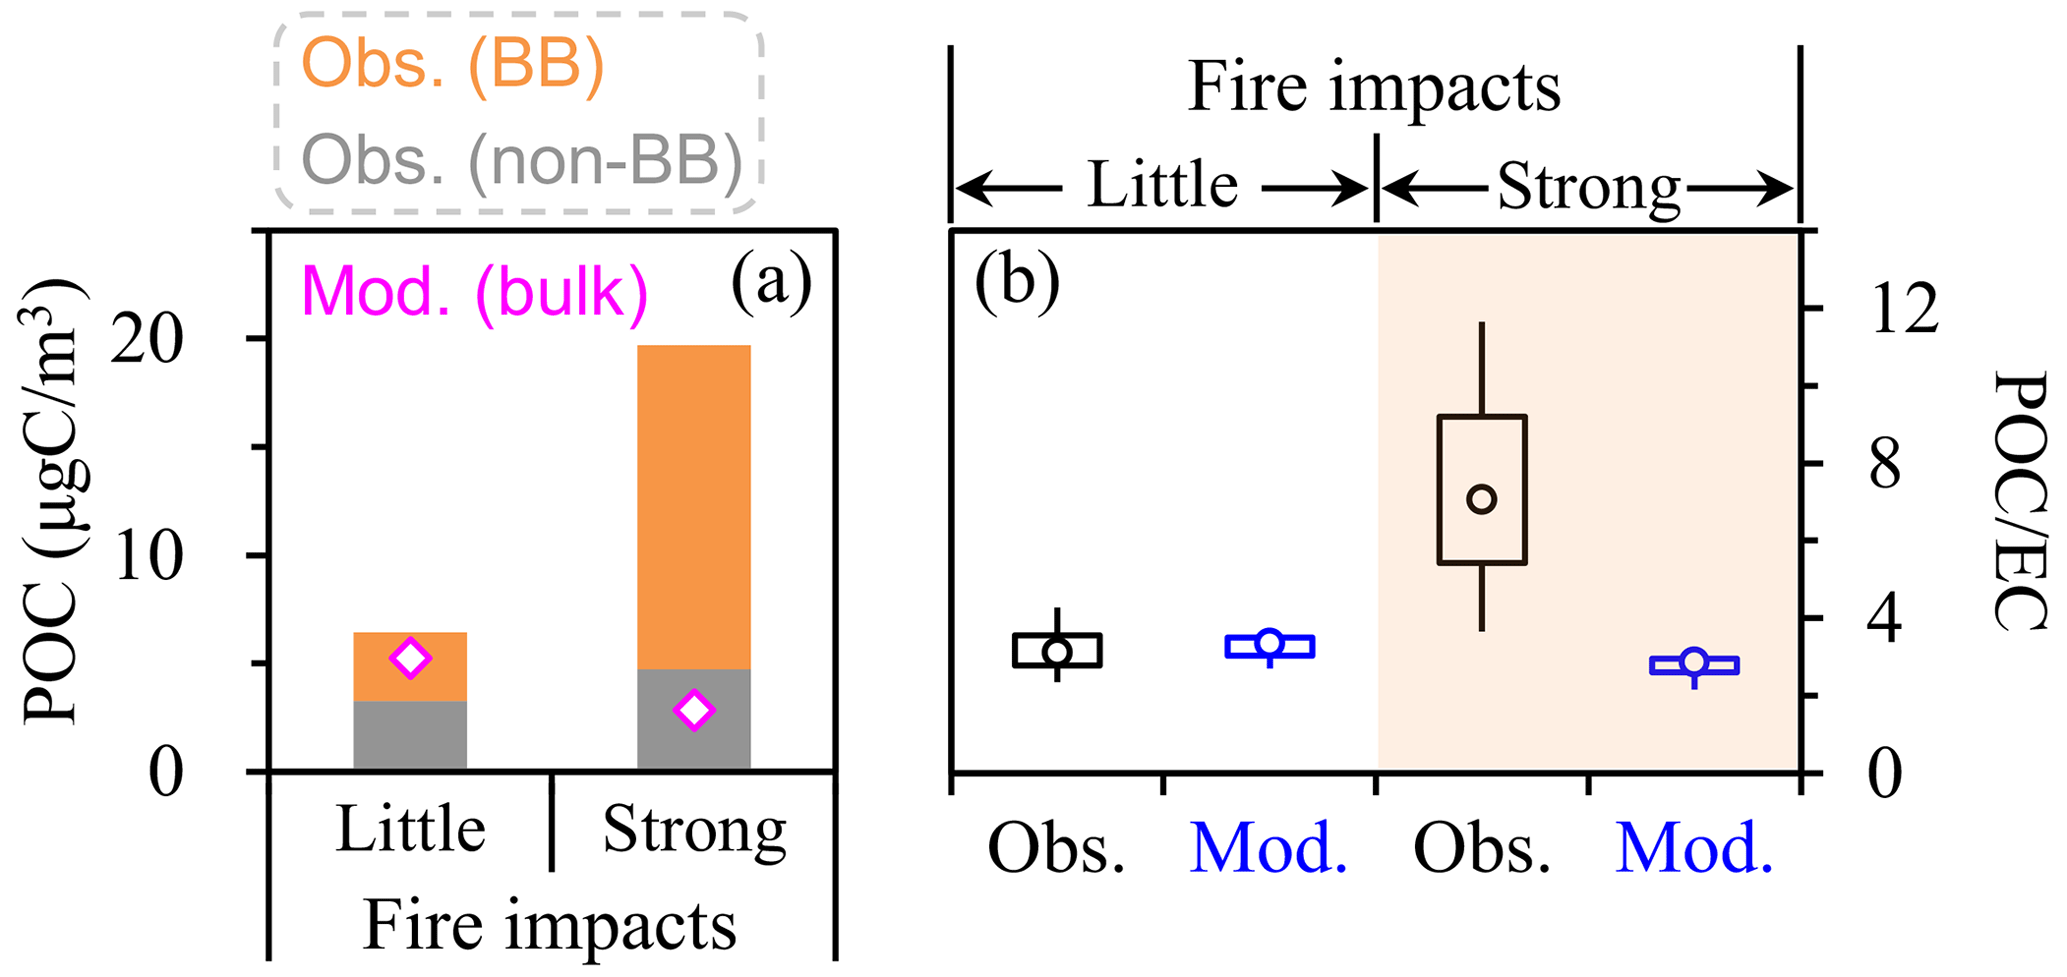
Figure 10Comparisons of the modeled and observed (a) POC concentrations and (b) POC to EC ratios between the samples with little and strong fire impacts in the spring of 2021. In (a), the observation-based results are shown by the bars (as the sum of BB and non-BB emissions), while the modeling results are indicated by the diamonds.
It was also noticed that the mean bias in elemental carbon (ECmod – EC∗) was more significant for the fire episodes (−1.26 µg C m−3) compared to other periods in spring (−0.44 µg C m−3). This pattern could be attributed to two factors, including the underestimation of open burning emissions by the inventory and the fire-associated overestimation of elemental carbon mass by EC∗. In other words, both ECmod and EC∗ were subject to larger uncertainties for the fire episodes, resulting in more significant model vs. observation discrepancies in elemental carbon concentration.
Light-absorbing carbonaceous aerosols were investigated for Northeast China based on three campaigns conducted during 2018–2021 in Harbin. BrC masses were determined based on methanol extraction of filter samples, as the difference between TC concentrations of the untreated and extracted punches. A long-standing concern about this method was the loss of EC during extraction. This artifact was evaluated indirectly based on the extraction-induced changes in ATN, due to the lack of reference method for EC measurement. For different campaigns, it was repeatedly observed that ATN was largely unchanged after extraction, as long as the RH levels were unfavorable for secondary aerosol formation and the impacts of agricultural fires were negligible. This pointed to negligible loss of EC during extraction and consequently supported the robustness of the observational data on BrC mass. In addition, EC and OC concentrations were determined by four methods differing with respect to pretreatment approaches (with and without extraction of the filter samples) and thermal–optical protocols (IMPROVE-A and NIOSH). Results from the untreated samples using IMPROVE-A were found to provide OC to EC ratios in reasonable accordance with secondary aerosol formation. Thus EC determined by this method (EC∗) was used for the source apportionment of light-absorbing carbon, together with other input species such as BrC mass (i.e., MSOC), BrC absorption coefficient, and levoglucosan. In addition, the corresponding OC (OC∗) approximately equaled MSOC, the determination of which was laborious. This equivalence supported the simplification of MSOC as OC∗ for further studies.
The observation-based source apportionment results showed increased contributions of secondary formation to BrC in winter, when the high-RH conditions concentrated. It was also noticed that secondary formation contributed more significantly to BrC mass than BrC absorption, in line with the consensus that secondary BrC was typically less absorbing than primary BrC. In addition, agricultural fires were found to effectively enhance the BB contributions to BrC (in terms of either mass concentration or absorption coefficient) and EC.
The abundances and sources of OC and EC were also predicted by an air quality model with newly added heterogeneous reactions. The general equivalence of BrC and OC masses supported direct comparisons of the observational and modeling results. The model properly reproduced POC and EC (in terms of both absolute concentration and POC to EC ratio) for the periods with little impact from agricultural fires. The model also predicted the existence of RH-dependent enhancement of SOC production in winter but significantly underestimated the observed SOC concentrations. Another problem identified for the modeling results was the substantial underprediction of POC for the agricultural fire events, presumably due to underestimation of open burning emissions by the FINN inventory.
An agreement between observed and simulated results (e.g., with respect to aerosol abundances and sources) is essential for the development of efficient air pollution control strategies. In this study, we constrained the modeling results of carbonaceous aerosols by field observation, based on validated measurement results of BrC and EC. Two challenges were identified for the simulation of carbonaceous aerosols in Northeast China, i.e., significant underprediction of SOC and agricultural fire emissions. Our results suggest that the commonly used CMAQ model requires substantial improvements for application in Northeast China.
Data are available from the corresponding author upon request (jiumengliu@hit.edu.cn).
The supplement related to this article is available online at: https://doi.org/10.5194/acp-24-9869-2024-supplement.
YC and JL designed the study and prepared the paper, with inputs from all co-authors. XC and ZZ carried out the experiments. SZ and HZ performed the simulations. QZ and KH validated the results and supervised the study.
At least one of the (co-)authors is a member of the editorial board of Atmospheric Chemistry and Physics. The peer-review process was guided by an independent editor, and the authors also have no other competing interests to declare.
Publisher's note: Copernicus Publications remains neutral with regard to jurisdictional claims made in the text, published maps, institutional affiliations, or any other geographical representation in this paper. While Copernicus Publications makes every effort to include appropriate place names, the final responsibility lies with the authors.
The authors thank Zhen-yu Du at the National Research Center for Environmental Analysis and Measurement and Lin-lin Liang at the Chinese Academy of Meteorological Sciences for their help in sample analysis.
This research has been supported by the National Natural Science Foundation of China (grant no. 42222706) and the Fundamental Research Funds for the Central Universities.
This paper was edited by Zhibin Wang and reviewed by two anonymous referees.
Akagi, S. K., Craven, J. S., Taylor, J. W., McMeeking, G. R., Yokelson, R. J., Burling, I. R., Urbanski, S. P., Wold, C. E., Seinfeld, J. H., Coe, H., Alvarado, M. J., and Weise, D. R.: Evolution of trace gases and particles emitted by a chaparral fire in California, Atmos. Chem. Phys., 12, 1397–1421, https://doi.org/10.5194/acp-12-1397-2012, 2012.
Alexander, D. T. L., Crozier, P. A., and Anderson, J. R.: Brown carbon spheres in East Asian outflow and their optical properties, Science, 321, 833–836, https://doi.org/10.1126/science.1155296, 2008.
Baumgardner, D., Popovicheva, O., Allan, J., Bernardoni, V., Cao, J., Cavalli, F., Cozic, J., Diapouli, E., Eleftheriadis, K., Genberg, P. J., Gonzalez, C., Gysel, M., John, A., Kirchstetter, T. W., Kuhlbusch, T. A. J., Laborde, M., Lack, D., Müller, T., Niessner, R., Petzold, A., Piazzalunga, A., Putaud, J. P., Schwarz, J., Sheridan, P., Subramanian, R., Swietlicki, E., Valli, G., Vecchi, R., and Viana, M.: Soot reference materials for instrument calibration and intercomparisons: a workshop summary with recommendations, Atmos. Meas. Tech., 5, 1869–1887, https://doi.org/10.5194/amt-5-1869-2012, 2012.
Bond, T. C., Doherty, S. J., Fahey, D. W., Forster, P. M., Berntsen, T., DeAngelo, B. J., Flanner, M. G., Ghan, S., Kärcher, B., Koch, D., Kinne, S., Kondo, Y., Quinn, P. K., Sarofim, M. C., Schultz, M. G., Schulz, M., Venkataraman, C., Zhang, H., Zhang, S., Bellouin, N., Guttikunda, S. K., Hopke, P. K., Jacobson, M. Z., Kaiser, J. W., Klimont, Z., Lohmann, U., Schwarz, J. P., Shindell, D., Storelvmo, T., Warren, S. G., and Zender, C. S.: Bounding the role of black carbon in the climate system: a scientific assessment, J. Geophys. Res., 118, 5380–5552, https://doi.org/10.1002/jgrd.50171, 2013.
Buffaloe, G. M., Lack, D. A., Williams, E. J., Coffman, D., Hayden, K. L., Lerner, B. M., Li, S.-M., Nuaaman, I., Massoli, P., Onasch, T. B., Quinn, P. K., and Cappa, C. D.: Black carbon emissions from in-use ships: a California regional assessment, Atmos. Chem. Phys., 14, 1881–1896, https://doi.org/10.5194/acp-14-1881-2014, 2014.
Cappa, C. D., Lim, C. Y., Hagan, D. H., Coggon, M., Koss, A., Sekimoto, K., de Gouw, J., Onasch, T. B., Warneke, C., and Kroll, J. H.: Biomass-burning-derived particles from a wide variety of fuels – Part 2: Effects of photochemical aging on particle optical and chemical properties, Atmos. Chem. Phys., 20, 8511–8532, https://doi.org/10.5194/acp-20-8511-2020, 2020.
Cavalli, F., Viana, M., Yttri, K. E., Genberg, J., and Putaud, J.-P.: Toward a standardised thermal-optical protocol for measuring atmospheric organic and elemental carbon: the EUSAAR protocol, Atmos. Meas. Tech., 3, 79–89, https://doi.org/10.5194/amt-3-79-2010, 2010.
Chen, K. P., Raeofy, N., Lum, M., Mayorga, R., Woods, M., Bahreini, R., Zhang, H. F., and Lin, Y. H.: Solvent effects on chemical composition and optical properties of extracted secondary brown carbon constituents, Aerosol Sci. Tech., 56, 917–930, https://doi.org/10.1080/02786826.2022.2100734, 2022.
Chen, L. J., Gao, Y., Ma, M. C., Wang, L. L., Wang, Q. L., Guan, S. H., Yao, X. H., and Gao, H. W.: Striking impacts of biomass burning on PM2.5 concentrations in Northeast China through the emission inventory improvement, Environ. Pollut., 318, 120835, https://doi.org/10.1016/j.envpol.2022.120835, 2023.
Chen, Q., Ikemori, F., Nakamura, Y., Vodicka, P., Kawamura, K., and Mochida, M.: Structural and light-absorption characteristics of complex water-insoluble organic mixtures in urban submicrometer aerosols, Environ. Sci. Technol., 51, 8293–8303, https://doi.org/10.1021/acs.est.7b01630, 2017.
Chen, Y. and Bond, T. C.: Light absorption by organic carbon from wood combustion, Atmos. Chem. Phys., 10, 1773–1787, https://doi.org/10.5194/acp-10-1773-2010, 2010.
Cheng, Y., Yu, Q., Liu, J., Cao, X., Zhong, Y., Du, Z., Liang, L., Geng, G., Ma, W., Qi, H., Zhang, Q., and He, K.: Dramatic changes in Harbin aerosol during 2018–2020: the roles of open burning policy and secondary aerosol formation, Atmos. Chem. Phys., 21, 15199–15211, https://doi.org/10.5194/acp-21-15199-2021, 2021.
Cheng, Y., Cao, X. B., Liu, J. M., Yu, Q. Q., Zhong, Y. J., Geng, G. N., Zhang, Q., and He, K. B.: New open burning policy reshaped the aerosol characteristics of agricultural fire episodes in Northeast China, Sci. Total Environ., 810, 52272, https://doi.org/10.1016/j.scitotenv.2021.152272, 2022.
Cheng, Z. Z., Atwi, K., El Hajj, O., Ijeli, I., Al Fischer, D., Smith, G., and Saleh, R.: Discrepancies between brown carbon light-absorption properties retrieved from online and offline measurements, Aerosol Sci. Tech., 55, 92–103, https://doi.org/10.1080/02786826.2020.1820940, 2021.
Chow, J. C., Watson, J. G., Chen, L. W. A., Arnott, W. P., and Moosmüller, H.: Equivalence of elemental carbon by thermal/optical reflectance and transmittance with different temperature protocols, Environ. Sci. Technol., 38, 4414–4422, https://doi.org/10.1021/es034936u, 2004.
Chow, J. C., Watson, J. G., Chen, L. W. A., Chang, M. O., Robinson, N. F., Trimble, D., and Kohl, S.: The IMPROVE-A temperature protocol for thermal/optical carbon analysis: maintaining consistency with a long-term database, J. Air Waste Manage., 57, 1014–1023, https://doi.org/10.3155/1047-3289.57.9.1014, 2007.
Collier, S., Zhou, S., Onasch, T. B., Jaffe, D. A., Kleinman, L., Sedlacek, A. J., Briggs, N. L., Hee, J., Fortner, E., Shilling, J. E., Worsnop, D., Yokelson, R. J., Parworth, C., Ge, X. L., Xu, J. Z., Butterfield, Z., Chand, D., Dubey, M. K., Pekour, M. S., Springston, S., and Zhang, Q.: Regional influence of aerosol emissions from wildfires driven by combustion efficiency: insights from the BBOP campaign, Environ. Sci. Technol., 50, 8613–8622, https://doi.org/10.1021/acs.est.6b01617, 2016.
Corbin, J. C., Czech, H., Massabò, D., de Mongeot, F. B., Jakobi, G., Liu, F., Lobo, P., Mennucci, C., Mensah, A. A., Orasche, J., Pieber, S. M., Prévôt, A. S. H., Stengel, B., Tay, L. L., Zanatta, M., Zimmermann, R., El Haddad, I., and Gysel, M.: Infrared-absorbing carbonaceous tar can dominate light absorption by marine-engine exhaust, npj Clim. Atmos. Sci., 2, 12, https://doi.org/10.1038/s41612-019-0069-5, 2019.
Gao, C. Y., Heald, C. L., Katich, J. M., Luo, G., and Yu, F. Q.: Remote aerosol simulated during the Atmospheric Tomography (ATom) campaign and implications for aerosol lifetime, J. Geophys. Res.-Atmos., 127, e2022JD036524, https://doi.org/10.1029/2022JD036524, 2022.
Garofalo, L. A., Pothier, M. A., Levin, E. J. T., Campos, T., Kreidenweis, S. M., and Farmer, D. K.: Emission and evolution of submicron organic aerosol in smoke from wildfires in the Western United States, ACS Earth Space Chem., 3, 1237–1247, https://doi.org/10.1021/acsearthspacechem.9b00125, 2019.
Giannoni, M., Calzolai, G., Chiari, M., Cincinelli, A., Lucarelli, F., Martellini, T., and Nava, S.: A comparison between thermal–optical transmittance elemental carbon measured by different protocols in PM2.5 samples, Sci. Total Environ., 571, 195–205, https://doi.org/10.1016/j.scitotenv.2016.07.128, 2016.
Hecobian, A., Zhang, X., Zheng, M., Frank, N., Edgerton, E. S., and Weber, R. J.: Water-Soluble Organic Aerosol material and the light-absorption characteristics of aqueous extracts measured over the Southeastern United States, Atmos. Chem. Phys., 10, 5965–5977, https://doi.org/10.5194/acp-10-5965-2010, 2010.
Hodgson, A. K., Morgan, W. T., O'Shea, S., Bauguitte, S., Allan, J. D., Darbyshire, E., Flynn, M. J., Liu, D., Lee, J., Johnson, B., Haywood, J. M., Longo, K. M., Artaxo, P. E., and Coe, H.: Near-field emission profiling of tropical forest and Cerrado fires in Brazil during SAMBBA 2012, Atmos. Chem. Phys., 18, 5619–5638, https://doi.org/10.5194/acp-18-5619-2018, 2018.
Hoffer, A., Tóth, A., Nyirő-Kósa, I., Pósfai, M., and Gelencsér, A.: Light absorption properties of laboratory-generated tar ball particles, Atmos. Chem. Phys., 16, 239–246, https://doi.org/10.5194/acp-16-239-2016, 2016.
Hu, J., Chen, J., Ying, Q., and Zhang, H.: One-year simulation of ozone and particulate matter in China using WRF/CMAQ modeling system, Atmos. Chem. Phys., 16, 10333–10350, https://doi.org/10.5194/acp-16-10333-2016, 2016.
Hu, W. W., Hu, M., Hu, W., Jimenez, J. L., Yuan, B., Chen, W. T., Wang, M., Wu, Y. S., Chen, C., Wang, Z. B., Peng, J. F., Zeng, L. M., and Shao, M.: Chemical composition, sources, and aging process of submicron aerosols in Beijing: contrast between summer and winter, J. Geophys. Res.-Atmos., 121, 1955–1977, https://doi.org/10.1002/2015JD024020, 2016.
Koch, D., Schulz, M., Kinne, S., McNaughton, C., Spackman, J. R., Balkanski, Y., Bauer, S., Berntsen, T., Bond, T. C., Boucher, O., Chin, M., Clarke, A., De Luca, N., Dentener, F., Diehl, T., Dubovik, O., Easter, R., Fahey, D. W., Feichter, J., Fillmore, D., Freitag, S., Ghan, S., Ginoux, P., Gong, S., Horowitz, L., Iversen, T., Kirkevåg, A., Klimont, Z., Kondo, Y., Krol, M., Liu, X., Miller, R., Montanaro, V., Moteki, N., Myhre, G., Penner, J. E., Perlwitz, J., Pitari, G., Reddy, S., Sahu, L., Sakamoto, H., Schuster, G., Schwarz, J. P., Seland, Ø., Stier, P., Takegawa, N., Takemura, T., Textor, C., van Aardenne, J. A., and Zhao, Y.: Evaluation of black carbon estimations in global aerosol models, Atmos. Chem. Phys., 9, 9001–9026, https://doi.org/10.5194/acp-9-9001-2009, 2009.
Konovalov, I. B., Lvova, D. A., Beekmann, M., Jethva, H., Mikhailov, E. F., Paris, J.-D., Belan, B. D., Kozlov, V. S., Ciais, P., and Andreae, M. O.: Estimation of black carbon emissions from Siberian fires using satellite observations of absorption and extinction optical depths, Atmos. Chem. Phys., 18, 14889–14924, https://doi.org/10.5194/acp-18-14889-2018, 2018.
Kumar, N. K., Corbin, J. C., Bruns, E. A., Massabó, D., Slowik, J. G., Drinovec, L., Močnik, G., Prati, P., Vlachou, A., Baltensperger, U., Gysel, M., El-Haddad, I., and Prévôt, A. S. H.: Production of particulate brown carbon during atmospheric aging of residential wood-burning emissions, Atmos. Chem. Phys., 18, 17843–17861, https://doi.org/10.5194/acp-18-17843-2018, 2018.
Lack, D. A., Moosmüller, H., McMeeking, G. R., Chakrabarty, R. K., and Baumgardner, D.: Characterizing elemental, equivalent black, and refractory black carbon aerosol particles: a review of techniques, their limitations and uncertainties, Anal. Bioanal. Chem., 406, 99–122, https://doi.org/10.1007/s00216-013-7402-3, 2014.
Lambe, A. T., Cappa, C. D., Massoli, P., Onasch, T. B., Forestieri, S. D., Martin, A. T., Cummings, M. J., Croasdale, D. R., Brune, W. H., Worsnop, D. R., and Davidovits, P.: Relationship between oxidation level and optical properties of secondary organic aerosol, Environ. Sci. Technol., 47, 6349–6357, https://doi.org/10.1021/es401043j, 2013.
Laskin, A., Laskin, J., and Nizkorodov, S. A.: Chemistry of atmospheric brown carbon, Chem. Rev., 115, 4335–4382, https://doi.org/10.1021/cr5006167, 2015.
Li, H. Y., Lamb, K. D., Schwarz, J. P., Selimovic, V., Yokelson, R. J., McMeeking, G. R., and May, A. A.: Inter-comparison of black carbon measurement methods for simulated open biomass burning emissions, Atmos. Environ., 206, 156–169, https://doi.org/10.1016/j.atmosenv.2019.03.010, 2019.
Liu, J., Lin, P., Laskin, A., Laskin, J., Kathmann, S. M., Wise, M., Caylor, R., Imholt, F., Selimovic, V., and Shilling, J. E.: Optical properties and aging of light-absorbing secondary organic aerosol, Atmos. Chem. Phys., 16, 12815–12827, https://doi.org/10.5194/acp-16-12815-2016, 2016.
Liu, J. M., Wang, P. F., Zhang, H. L., Du, Z. Y., Zheng, B., Yu, Q. Q., Zheng, G. J., Ma, Y. L., Zheng, M., Cheng, Y., Zhang, Q., and He, K. B.: Integration of field observation and air quality modeling to characterize Beijing aerosol in different seasons, Chemosphere, 242, 125195, https://doi.org/10.1016/j.chemosphere.2019.125195, 2020.
Liu, P. F., Abdelmalki, N., Hung, H.-M., Wang, Y., Brune, W. H., and Martin, S. T.: Ultraviolet and visible complex refractive indices of secondary organic material produced by photooxidation of the aromatic compounds toluene and m-xylene, Atmos. Chem. Phys., 15, 1435–1446, https://doi.org/10.5194/acp-15-1435-2015, 2015.
Liu, T. Y., Chan, A. W. H., and Abbatt, J. P. D.: Multiphase oxidation of sulfur dioxide in aerosol particles: implications for sulfate formation in polluted environments, Environ. Sci. Technol., 8, 4227–4242, https://doi.org/10.1021/acs.est.0c06496, 2021.
Liu, X. X., Zhang, Y., Huey, L. G., Yokelson, R. J., Wang, Y., Jimenez, J. L., Campuzano-Jost, P., Beyersdorf, A. J., Blake, D. R., Choi, Y., St Clair, J. M., Crounse, J. D., Day, D. A., Diskin, G. S., Fried, A., Hall, S. R., Hanisco, T. F., King, L. E., Meinardi, S., Mikoviny, T., Palm, B. B., Peischl, J., Perring, A. E., Pollack, I. B., Ryerson, T. B., Sachse, G., Schwarz, J. P., Simpson, I. J., Tanner, D. J., Thornhill, K. L., Ullmann, K., Weber, R. J., Wennberg, P. O., Wisthaler, A., Wolfe, G. M., and Ziemba, L. D.: Agricultural fires in the southeastern U. S. during SEAC4RS: emissions of trace gases and particles and evolution of ozone, reactive nitrogen, and organic aerosol, J. Geophys. Res.-Atmos., 121, 7383–7414, https://doi.org/10.1002/2016JD025040, 2016.
McClure, C. D., Lim, C. Y., Hagan, D. H., Kroll, J. H., and Cappa, C. D.: Biomass-burning-derived particles from a wide variety of fuels – Part 1: Properties of primary particles, Atmos. Chem. Phys., 20, 1531–1547, https://doi.org/10.5194/acp-20-1531-2020, 2020.
Moosmüller, H., Chakrabarty, R. K., and Arnott, W. P.: Aerosol light absorption and its measurement: a review, J. Quant. Spectrosc. Rad., 110, 844–878, https://doi.org/10.1016/j.jqsrt.2009.02.035, 2009.
Moteki, N. and Kondo, Y.: Dependence of laser-induced incandescence on physical properties of black carbon aerosols: measurements and theoretical interpretation, Aerosol Sci. Tech., 44, 663–675, https://doi.org/10.1080/02786826.2010.484450, 2010.
Ning, C. P., Gao, Y., Yu, H. R., Zhang, H. J., Geng, N. B., Cao, R., and Chen, J. P.: FT-ICR mass spectrometry for molecular characterization of water-insoluble organic compounds in winter atmospheric fine particulate matters, J. Environ. Sci., 111, 51–60, https://doi.org/10.1016/j.jes.2020.12.017, 2022.
Onasch, T. B., Trimborn, A., Fortner, E. C., Jayne, J. T., Kok, G. L., Williams, L. R., Davidovits, P., and Worsnop, D. R.: Soot particle aerosol mass spectrometer: development, validation, and initial application, Aerosol Sci. Tech., 46, 804–817, https://doi.org/10.1080/02786826.2012.663948, 2012.
Petzold, A., Schloesser, H., Sheridan, P. J., Arnott, W. P., Ogren, J. A., and Virkkula, A.: Evaluation of multiangle absorption photometry for measuring aerosol light absorption, Aerosol Sci. Tech., 39, 40–51, https://doi.org/10.1080/027868290901945, 2005.
Petzold, A., Ogren, J. A., Fiebig, M., Laj, P., Li, S.-M., Baltensperger, U., Holzer-Popp, T., Kinne, S., Pappalardo, G., Sugimoto, N., Wehrli, C., Wiedensohler, A., and Zhang, X.-Y.: Recommendations for reporting “black carbon” measurements, Atmos. Chem. Phys., 13, 8365–8379, https://doi.org/10.5194/acp-13-8365-2013, 2013.
Piazzalunga, A., Bernardoni, V., Fermo, P., Valli, G., and Vecchi, R.: Technical Note: On the effect of water-soluble compounds removal on EC quantification by TOT analysis in urban aerosol samples, Atmos. Chem. Phys., 11, 10193–10203, https://doi.org/10.5194/acp-11-10193-2011, 2011.
Pileci, R. E., Modini, R. L., Bertò, M., Yuan, J., Corbin, J. C., Marinoni, A., Henzing, B., Moerman, M. M., Putaud, J. P., Spindler, G., Wehner, B., Müller, T., Tuch, T., Trentini, A., Zanatta, M., Baltensperger, U., and Gysel-Beer, M.: Comparison of co-located refractory black carbon (rBC) and elemental carbon (EC) mass concentration measurements during field campaigns at several European sites, Atmos. Meas. Tech., 14, 1379–1403, https://doi.org/10.5194/amt-14-1379-2021, 2021.
Rosenfeld, D. and Woodley, W. L.: Deep convective clouds with sustained supercooled liquid water down to −37.5 °C, Nature, 405, 440–442, https://doi.org/10.1038/35013030, 2000.
Samset, B. H., Myhre, G., Herber, A., Kondo, Y., Li, S.-M., Moteki, N., Koike, M., Oshima, N., Schwarz, J. P., Balkanski, Y., Bauer, S. E., Bellouin, N., Berntsen, T. K., Bian, H., Chin, M., Diehl, T., Easter, R. C., Ghan, S. J., Iversen, T., Kirkevåg, A., Lamarque, J.-F., Lin, G., Liu, X., Penner, J. E., Schulz, M., Seland, Ø., Skeie, R. B., Stier, P., Takemura, T., Tsigaridis, K., and Zhang, K.: Modelled black carbon radiative forcing and atmospheric lifetime in AeroCom Phase II constrained by aircraft observations, Atmos. Chem. Phys., 14, 12465–12477, https://doi.org/10.5194/acp-14-12465-2014, 2014.
Schwarz, J. P., Gao, R. S., Fahey, D. W., Thomson, D. S., Watts, L. A., Wilson, J. C., Reeves, J. M., Darbeheshti, M., Baumgardner, D. G., Kok, G. L., Chung, S. H., Schulz, M., Hendricks, J., Lauer, A., Karcher, B., Slowik, J. G., Rosenlof, K. H., Thompson, T. L., Langford, A. O., Loewenstein, M., and Aikin, K. C.: Single-particle measurements of midlatitude black carbon and light-scattering aerosols from the boundary layer to the lower stratosphere, J. Geophys. Res., 111, D16207, https://doi.org/10.1029/2006JD007076, 2006.
Sharma, S., Leaitch, W. R., Huang, L., Veber, D., Kolonjari, F., Zhang, W., Hanna, S. J., Bertram, A. K., and Ogren, J. A.: An evaluation of three methods for measuring black carbon in Alert, Canada, Atmos. Chem. Phys., 17, 15225–15243, https://doi.org/10.5194/acp-17-15225-2017, 2017.
State Council:Circular on Further Promoting the Pollution Prevention and Control Battle, https://www.gov.cn/zhengce/2021-11/07/content_5649656.htm (last access: 1 September 2024), 2021.
Stohl, A., Aamaas, B., Amann, M., Baker, L. H., Bellouin, N., Berntsen, T. K., Boucher, O., Cherian, R., Collins, W., Daskalakis, N., Dusinska, M., Eckhardt, S., Fuglestvedt, J. S., Harju, M., Heyes, C., Hodnebrog, Ø., Hao, J., Im, U., Kanakidou, M., Klimont, Z., Kupiainen, K., Law, K. S., Lund, M. T., Maas, R., MacIntosh, C. R., Myhre, G., Myriokefalitakis, S., Olivié, D., Quaas, J., Quennehen, B., Raut, J.-C., Rumbold, S. T., Samset, B. H., Schulz, M., Seland, Ø., Shine, K. P., Skeie, R. B., Wang, S., Yttri, K. E., and Zhu, T.: Evaluating the climate and air quality impacts of short-lived pollutants, Atmos. Chem. Phys., 15, 10529–10566, https://doi.org/10.5194/acp-15-10529-2015, 2015.
Sun, Y. L., He, Y., Kuang, Y., Xu, W. Y., Song, S. J., Ma, N., Tao, J. C., Cheng, P., Wu, C., Su, H., Cheng, Y. F., Xie, C. H., Chen, C., Lei, L., Qiu, Y. M., Fu, P. Q., Croteau, P., and Worsnop, D. R.: Chemical differences between PM1 and PM2.5 in highly polluted environment and implications in air pollution studies, Geophys. Res. Lett., 47, e2019GL086288, https://doi.org/10.1029/2019GL086288, 2020.
Tinorua, S., Denjean, C., Nabat, P., Pont, V., Arnaud, M., Bourrianne, T., Dias Alves, M., and Gardrat, E.: Two-year intercomparison of three methods for measuring black carbon concentration at a high-altitude research station in Europe, EGUsphere [preprint], https://doi.org/10.5194/egusphere-2024-47, 2024.
Uranishi, K., Ikemori, F., Shimadera, H., Kondo, A., and Sugata, S.: Impact of field biomass burning on local pollution and long-range transport of PM2.5 in Northeast Asia, Environ. Pollut., 244, 414–422, https://doi.org/10.1016/j.envpol.2018.09.061, 2019.
Wang, H. C., Lu, K. D., Tan, Z. F., Chen, X. R., Liu, Y. H., and Zhang, Y. H.: Formation mechanism and control strategy for particulate nitrate in China, J. Environ. Sci., 123, 476–486, https://doi.org/10.1016/j.jes.2022.09.019, 2023.
Wang, P. F., Chen, K. Y., Zhu, S. Q., Wang, P., and Zhang, H. L.: Severe air pollution events not avoided by reduced anthropogenic activities during COVID-19 outbreak, Resour. Conserv. Recy., 158, 104814, https://doi.org/10.1016/j.resconrec.2020.104814, 2020.
Wang, X., Heald, C. L., Liu, J., Weber, R. J., Campuzano-Jost, P., Jimenez, J. L., Schwarz, J. P., and Perring, A. E.: Exploring the observational constraints on the simulation of brown carbon, Atmos. Chem. Phys., 18, 635–653, https://doi.org/10.5194/acp-18-635-2018, 2018.
Wang, Y. T., Zhao, Y., Liu, Y. M., Jiang, Y. Q., Zheng, B., Xing, J., Liu, Y., Wang, S., and Nielsen, C. P.: Sustained emission reductions have restrained the ozone pollution over China, Nat. Geosci., 16, 967–974, https://doi.org/10.1038/s41561-023-01284-2, 2023.
Wiedinmyer, C., Akagi, S. K., Yokelson, R. J., Emmons, L. K., Al-Saadi, J. A., Orlando, J. J., and Soja, A. J.: The Fire INventory from NCAR (FINN): a high resolution global model to estimate the emissions from open burning, Geosci. Model Dev., 4, 625–641, https://doi.org/10.5194/gmd-4-625-2011, 2011.
Wu, X., Cao, F., Haque, M., Fan, M. Y., Zhang, S. C., and Zhang, Y. L.: Molecular composition and source apportionment of fine organic aerosols in Northeast China, Atmos. Environ., 239, 117722, https://doi.org/10.1016/j.atmosenv.2020.117722, 2020.
Xiao, Q., Zheng, Y., Geng, G., Chen, C., Huang, X., Che, H., Zhang, X., He, K., and Zhang, Q.: Separating emission and meteorological contributions to long-term PM2.5 trends over eastern China during 2000–2018, Atmos. Chem. Phys., 21, 9475–9496, https://doi.org/10.5194/acp-21-9475-2021, 2021.
Xie, X. C., Zhang, Y. Z., Liang, R. S., Chen, W., Zhang, P. X., Wang, X., Zhou, Y., Cheng, Y., and Liu, J. M.: Wintertime heavy haze episodes in Northeast China driven by agricultural fire emissions, Environ. Sci. Tech. Let., 11, 150–157, https://doi.org/10.1021/acs.estlett.3c00940, 2024.
Yan, F. P., Kang, S. C., Sillanpää, M., Hu, Z. F., Gao, S. P., Chen, P. F., Gautam, S., Reinikainen, S. P., and Li, C. L.: A new method for extraction of methanol-soluble brown carbon: implications for investigation of its light absorption ability, Environ. Pollut., 262, 114300, https://doi.org/10.1016/j.envpol.2020.114300, 2020.
Yang, M., Howell, S. G., Zhuang, J., and Huebert, B. J.: Attribution of aerosol light absorption to black carbon, brown carbon, and dust in China – interpretations of atmospheric measurements during EAST-AIRE, Atmos. Chem. Phys., 9, 2035–2050, https://doi.org/10.5194/acp-9-2035-2009, 2009.
Ying, Q, Li, J. Y, and Kota, S. H.: Significant contributions of isoprene to summertime secondary organic aerosol in eastern United States, Environ. Sci. Technol., 49, 7834–7842, https://doi.org/10.1021/acs.est.5b02514, 2015.
Zeng, L., Dibb, J., Scheuer, E., Katich, J. M., Schwarz, J. P., Bourgeois, I., Peischl, J., Ryerson, T., Warneke, C., Perring, A. E., Diskin, G. S., DiGangi, J. P., Nowak, J. B., Moore, R. H., Wiggins, E. B., Pagonis, D., Guo, H., Campuzano-Jost, P., Jimenez, J. L., Xu, L., and Weber, R. J.: Characteristics and evolution of brown carbon in western United States wildfires, Atmos. Chem. Phys., 22, 8009–8036, https://doi.org/10.5194/acp-22-8009-2022, 2022.
Zhang, J., Liu, L., Xu, L., Lin, Q., Zhao, H., Wang, Z., Guo, S., Hu, M., Liu, D., Shi, Z., Huang, D., and Li, W.: Exploring wintertime regional haze in northeast China: role of coal and biomass burning, Atmos. Chem. Phys., 20, 5355–5372, https://doi.org/10.5194/acp-20-5355-2020, 2020.