the Creative Commons Attribution 4.0 License.
the Creative Commons Attribution 4.0 License.
 | 29 Aug 2024
Using observed urban NOx sinks to constrain VOC reactivity and the ozone and radical budget in the Seoul Metropolitan Area
Benjamin A. Nault
Katherine R. Travis
James H. Crawford
Donald R. Blake
Pedro Campuzano-Jost
Ronald C. Cohen
Joshua P. DiGangi
Glenn S. Diskin
Samuel R. Hall
L. Gregory Huey
Jose L. Jimenez
Kyung-Eun Min
Young Ro Lee
Isobel J. Simpson
Kirk Ullmann
Armin Wisthaler
Ozone (O3) is an important secondary pollutant that impacts air quality and human health. Eastern Asia has high regional O3 background due to the numerous sources and increasing and rapid industrial growth, which also impacts the Seoul Metropolitan Area (SMA). However, the SMA has also been experiencing increasing O3 driven by decreasing NOx emissions, highlighting the role of the local in situ O3 production on the SMA. Here, comprehensive gas-phase measurements collected on the NASA DC-8 during the National Institute of Environmental Research (NIER)/NASA Korea–United States Air Quality (KORUS-AQ) study are used to constrain the instantaneous O3 production rate over the SMA. The observed NOx oxidized products support the importance of non-measured peroxy nitrates (PNs) in the O3 chemistry in the SMA, as they accounted for ∼49 % of the total PNs. Using the total measured PNs (ΣPNs) and alkyl and multifunctional nitrates (ΣANs), unmeasured volatile organic compound (VOC) reactivity (R(VOC)) is constrained and found to range from 1.4–2.1 s−1. Combining the observationally constrained R(VOC) with the other measurements on the DC-8, the instantaneous net O3 production rate, which is as high as ∼10 ppbv h−1, along with the important sinks of O3 and radical chemistry, is constrained. This analysis shows that ΣPNs play an important role in both the sinks of O3 and radical chemistry. Since ΣPNs are assumed to be in a steady state, the results here highlight the role that ΣPNs play in urban environments in altering the net O3 production, but ΣPNs can potentially lead to increased net O3 production downwind due to their short lifetime (∼1 h). The results provide guidance for future measurements to identify the missing R(VOCs) and ΣPN production.
-
Please read the editorial note first before accessing the article.
-
Article
(908 KB)
- Companion paper
-
Supplement
(1305 KB)
-
Please read the editorial note first before accessing the article.
- Article
(908 KB) - Full-text XML
- Companion paper
-
Supplement
(1305 KB) - BibTeX
- EndNote


Representing global and urban tropospheric ozone (O3) in chemical transport models (CTMs) is still challenging due to the uncertainty in physical and chemical processes that control the O3 budget (Archibald et al., 2020). One area of uncertainty is underestimated urban volatile organic compound (VOC) emissions (von Schneidemesser et al., 2023) which arise from a large number of sources, including some that are very hard to quantify (e.g., cooking and chemical products) (e.g., McDonald et al., 2018; Simpson et al., 2020). Intensive research is also ongoing as to why O3 has been increasing in recent years in urban areas, even with reductions in combustion emissions (e.g. Colombi et al., 2023; Lyu et al., 2017). This O3 impacts the large populations in urban areas with harmful health effects, including premature mortality (e.g., Cohen et al., 2017).
Tropospheric O3 production is driven by the catalytic cycling of nitrogen oxides () fueled by the photooxidation of VOCs, both of which can come from anthropogenic emissions. The chemistry producing O3 is described in Reactions (R1)–(R6) in Table 1. During daylight hours, VOCs are oxidized by OH (or undergo photolysis) to form an organic peroxy radical (RO2•) in Reaction (R1a) (Reaction R1b). If the RO2• then proceeds through Reaction (R2a), at least two O3 molecules are produced. The first O3 molecule is formed by the photolysis of NO2 and the reaction of O(3P) with oxygen (Reactions R3 and R4). The second O3 molecule is formed through the reaction of the alkoxy radical (RO•) with oxygen to form the hydroperoxyl radical (HO2) (Reaction R5), which goes on to react with NO to produce NO2 (Reaction R6) and the subsequent reactions described above (Reactions R3 and R4). However, some fraction of the time, depending on the number of carbons and functional group (e.g., Espada and Shepson, 2005; Perring et al., 2013; Yeh and Ziemann, 2014), alkyl or multifunctional nitrates (ANs≡RONO2) are formed (Reaction R2b). The fraction of reactions forming ANs is described by the branching ratio, α. Reaction (R2b) has been shown to impact O3 production, depending on the types of VOCs emitted, by reducing the fraction of NO2 that photolyzes to form O3 in source regions (Reactions R3 and R4) (Farmer et al., 2011). As α is a function of the individual VOC's carbon backbone and functional group (e.g., Perring et al., 2013), any uncertainty related to primary VOC emissions and secondary chemistry will directly impact the ability to describe urban O3 production.
Table 1Reactions described in the text, along with associated rate constants and references for those rate constants.
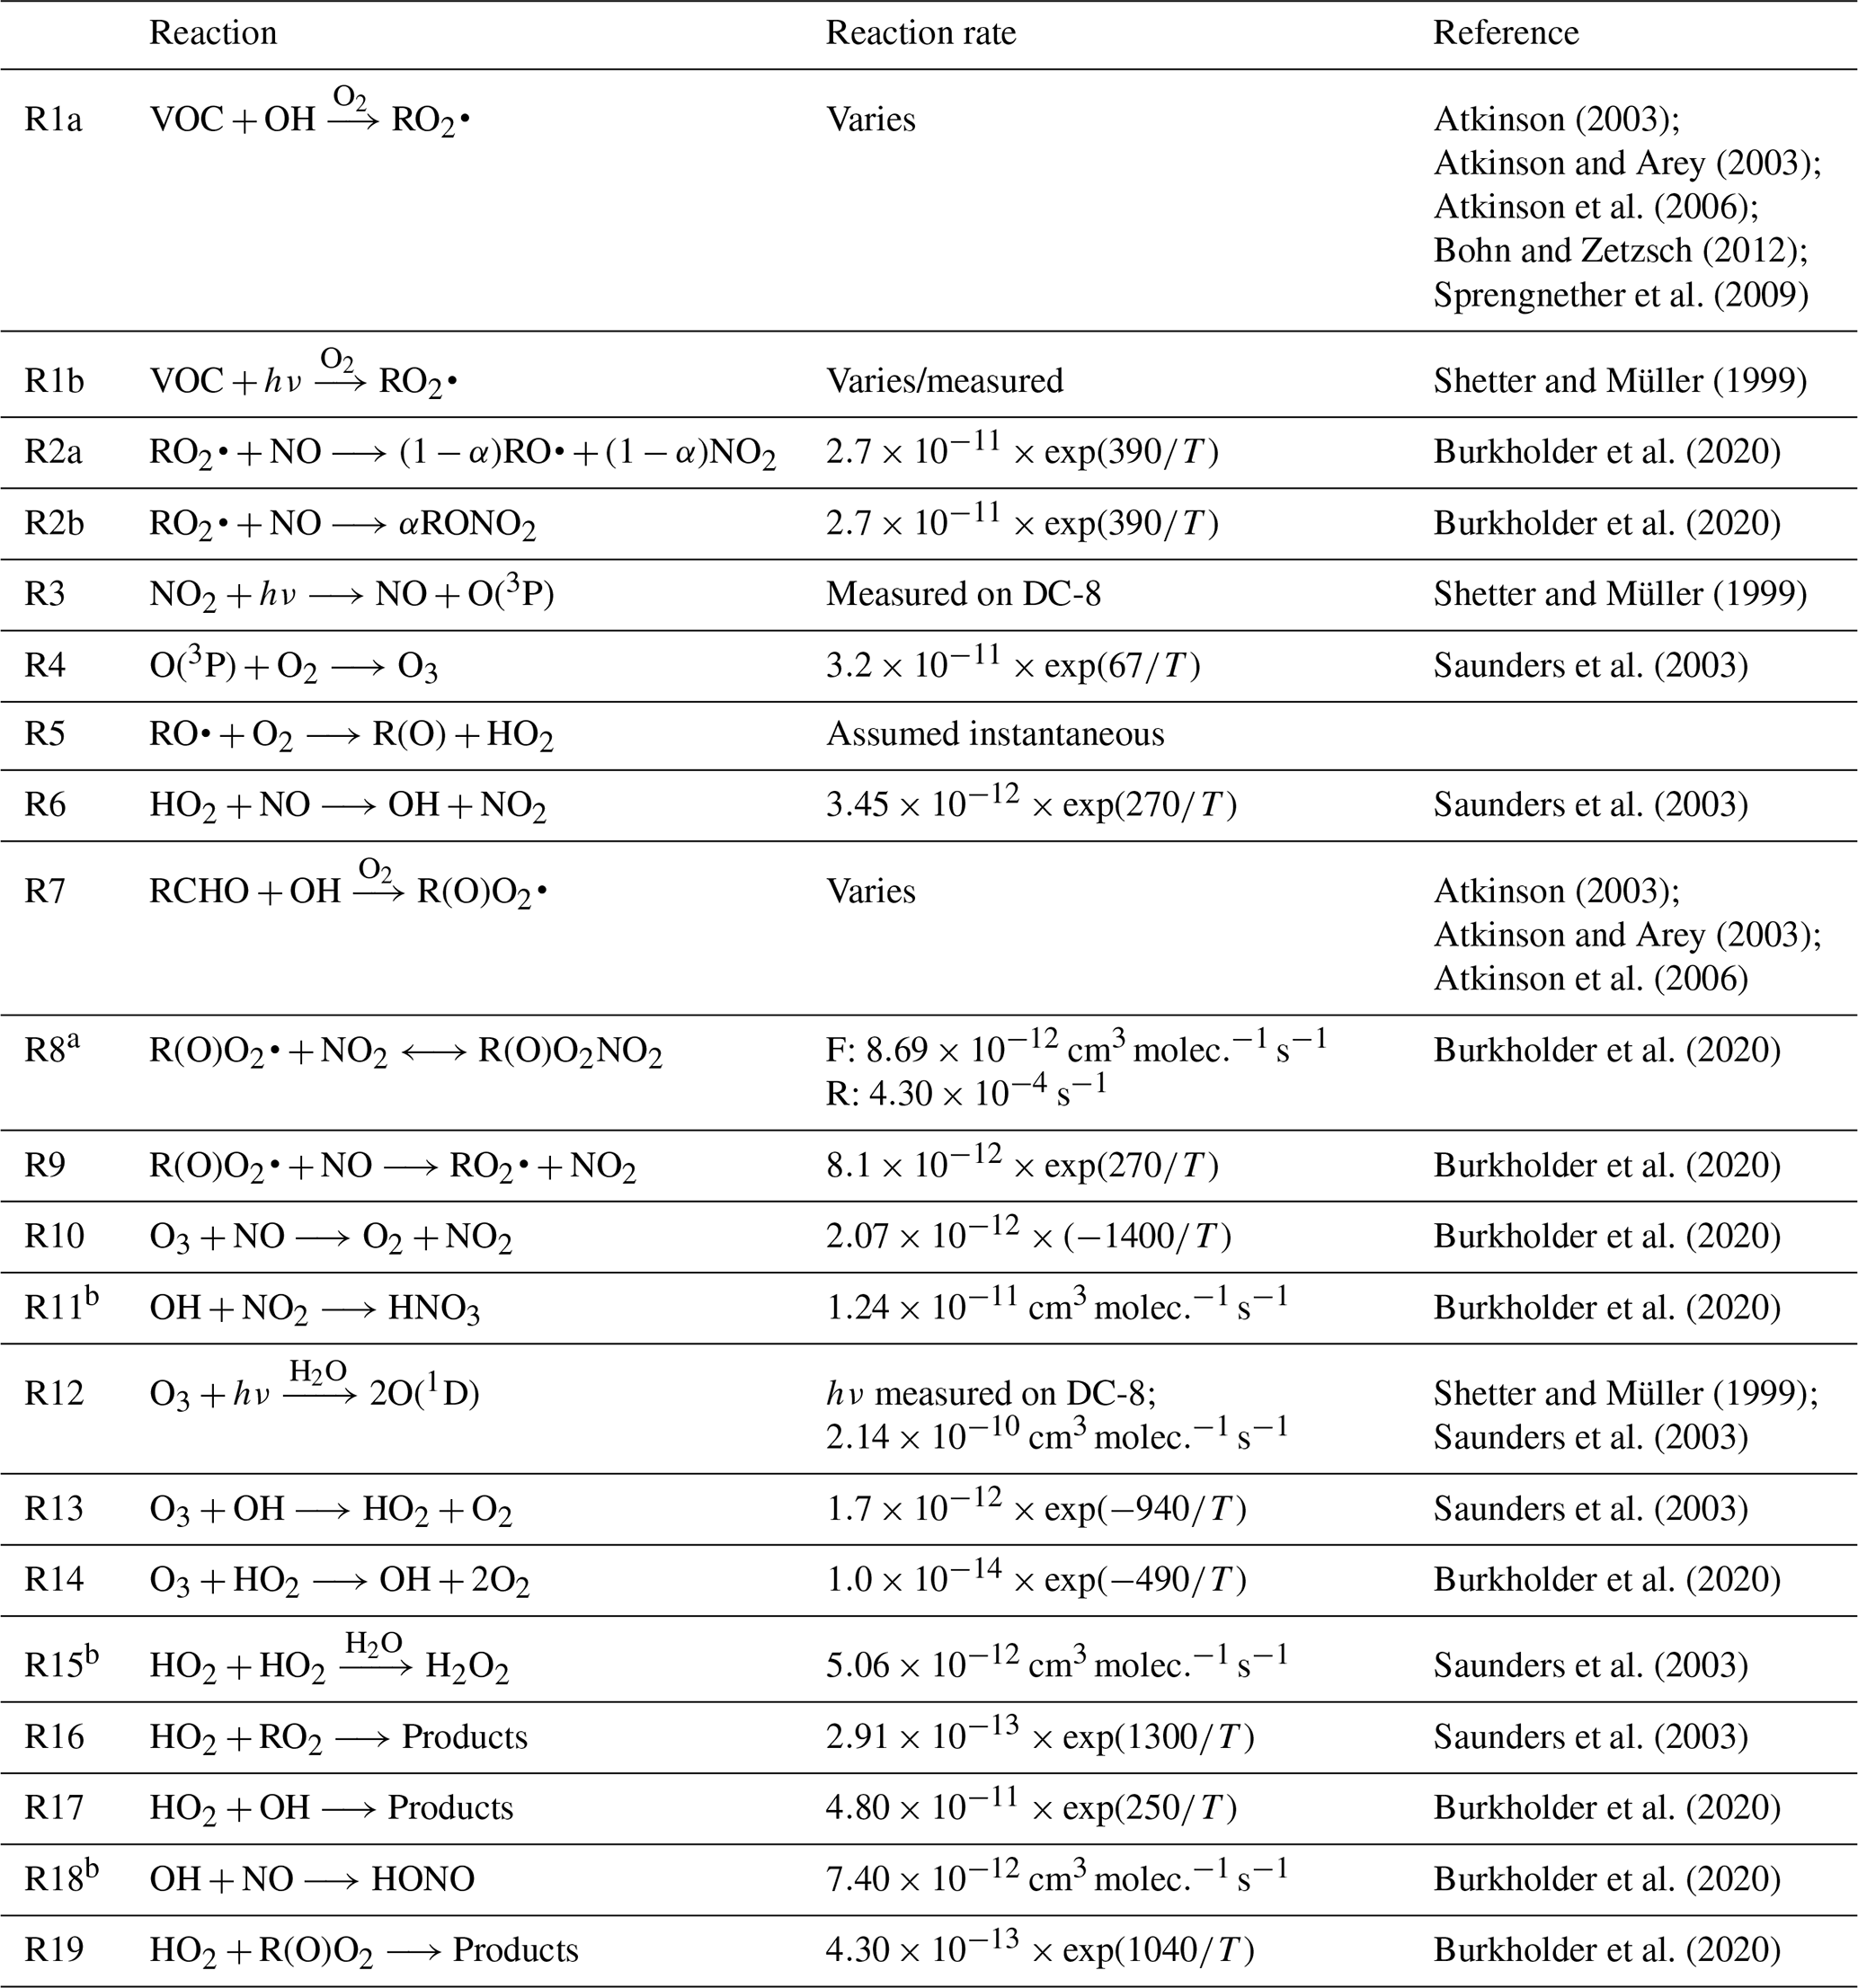
a Only showing forward (F) and reverse (R) rate constants at 298 K and 1013 hPa and being a termolecular reaction. b Termolecular reaction that only shows the rates at 298 K and 1013 hPa.
One important subclass of VOCs is aldehydes (RCHO), which can either be directly emitted or produced via photooxidation of VOCs (de Gouw et al., 2018; Mellouki et al., 2015; Wang et al., 2022; Yuan et al., 2012). The photooxidation of the aldehyde (Reaction R7) in the presence of NOx can either form acyl peroxy nitrates (Reaction R8; PNs = R(O)O2NO2) or an organic peroxy radical (RO2•) (Reaction R9). The competition between Reaction (R8) to form PNs versus Reaction (R9) to form RO2• depends on the NO NO2 ratio (Nihill et al., 2021). Furthermore, Reaction (R8) is in thermodynamic equilibrium due to the weak bond strength between the acyl peroxy radical (R(O)O2•) and NO2. Thus, the formation of PNs poses only a temporary loss of NO2. Finally, it has been observed that aldehydes with longer carbon backbones (e.g., C8s and C9s) from various anthropogenic activities, such as cooking (Coggon et al., 2024; Rao et al., 2010), may have mixing ratios as high as aldehydes typically quantified in field experiments (acetaldehyde and propionaldehyde). However, there is larger uncertainty associated with these higher aldehydes in their ability to produce both PNs and ANs (e.g., Hurst Bowman et al., 2003). Missing both of these emissions and the subsequent chemistry would impact estimates of urban O3 chemistry.
The fraction of RO2• forming ANs in Reaction (R2b) and the fraction of R(O)O2• forming PNs in Reaction (R8) alter the instantaneous O3 production (P(O3)) by removing NO2 and/or the radical species. This is further shown in Fig. S1 in the Supplement, where an analytical equation to describe Reactions (R1)–(R6) (Farmer et al., 2011) is used to explore how changes in the VOC reactivity (R(VOC)), radical production (P(HOx)), and AN production and branching ratio, α (Reaction R2b), impact the instantaneous P(O3) (see Sect. S1 in the Supplement for the analytical equation and description). Any changes in P(HOx), R(VOC), and/or α will impact both the instantaneous P(O3) and the NOx mixing ratio corresponding to the maximum P(O3). As these parameters are generally interconnected, investigating all three is important to understand the sources and control of instantaneous P(O3). Furthermore, Reactions (R7)–(R9) are not included in this traditional description of the analytical equation, as it is assumed that PNs are in a steady state (Farmer et al., 2011). Thus, if PNs are not in a steady state, then their role in altering P(O3) may be underestimated.
Increasing surface O3 is a concern throughout East Asia, including South Korea (Colombi et al., 2023; Gaudel et al., 2018; Kim et al., 2021; Yeo and Kim, 2021). The emissions associated with industry and other anthropogenic activities and the associated photochemistry have impacted regional air quality, leading to high O3 backgrounds that can impact a country's ability to achieve reduced O3 exposure for new air quality standards (e.g., Colombi et al., 2023). However, local emissions and photochemistry still play an important role. For example, during the Korea–United States Air Quality (KORUS-AQ) campaign, it was observed between morning and afternoon in the Seoul Metropolitan Area (SMA) that O3 increased by ∼20 parts per billion by volume (ppbv) over a background concentration of over 75 ppbv (Crawford et al., 2021). Thus, an understanding of the variables highlighted in Fig. S1 are necessary to control both local and regional P(O3).
One tool typically used to understand the role of regional O3 and transported O3 on local O3 and impacts of local emission controls on O3 is CTMs. As shown in Park et al. (2021), for the SMA, CTMs typically underestimate the observed O3 and formaldehyde. While the low O3 could be partially related to the underestimated transport (e.g., Seo et al., 2018) or resolution of the CTM (e.g., Jo et al., 2023; Park et al., 2021), the low bias also observed for modeled formaldehyde indicates that there are, overall, (a) too few VOCs and thus R(VOC) that is too low (Brune et al., 2022; H. Kim et al., 2022); (b) missing photochemical products from missing VOCs, including oxygenated VOCs (OVOCs) that contribute to P(HOx) (Brune et al., 2022; H. Kim et al., 2022; Lee et al., 2022; Wang et al., 2022); and (c) likely missing PNs and ANs from the underestimated VOCs related to the underestimated R(VOC) (Lee et al., 2022; Park et al., 2021). Missing points (a)–(c) will bias the instantaneous P(O3) (Fig. S1), impacting the ability to investigate which policies should be implemented to reduce O3.
To better understand what controls the instantaneous P(O3) over the SMA, observations collected on the NASA DC-8 during KORUS-AQ are used to constrain the three variables highlighted in Fig. S1 – R(VOC), HOx production and loss, and AN and PN production. Observational constraints on these three parameters provide a means to investigate the instantaneous P(O3) over the SMA and the major classes of contributors to O3 and HOx production and loss. These results are discussed and placed into the context of improving our knowledge about O3 production in an urban environment. These observational results are used as constraints to investigate the chemistry and emissions controlling O3 in GEOS-Chem in the Travis et al. (2024) companion paper.
2.1 KORUS-AQ and DC-8 descriptions
The KORUS-AQ campaign was a multi-national project that was conducted in May and June 2016 and led by South Korea's National Institute of Environmental Research (NIER) and the United States' National Aeronautics and Space Administration (NASA). The project was conducted in South Korea and the surrounding seas with numerous airborne platforms, research vessels, and ground sites (Crawford et al., 2021). The study here focuses on the observations collected on the NASA DC-8.
The instrument payload, flights, and observations have been described in other studies (Brune et al., 2022; Crawford et al., 2021; Lee et al., 2022; Schroeder et al., 2020). Briefly, the DC-8 was stationed at Osan Air Base, Pyeongtaek, South Korea, which is approximately 60 km south of Seoul. A total of 20 research flights was conducted with the DC-8. Part of each research flight included a stereo route in the SMA in the morning (∼ 09:00 LT), midday (∼ 12:00 LT), and afternoon (∼ 15:00 LT), which included a missed approach over Seoul Air Base (<15 km from Seoul city center) and a flyover of the Olympic Park and Taehwa Forest Research sites (Fig. 1). A total of 55 descents over Olympic Park and 53 spirals over Taehwa Forest Research site was conducted (Crawford et al., 2021). Only observations from the DC-8 after 11:00 LT are used here to ensure that the boundary layer has grown and stabilized and to minimize any influence from residual layer mixing into the boundary layer and/or titration of O3 by NO (Reaction R10). We analyze data collected below 2 km and between 37.22–37.69° N and 127.10–127.67° E to focus on the boundary layer in the SMA without any influence from industrial emissions along the western South Korean coast (Crawford et al., 2021).
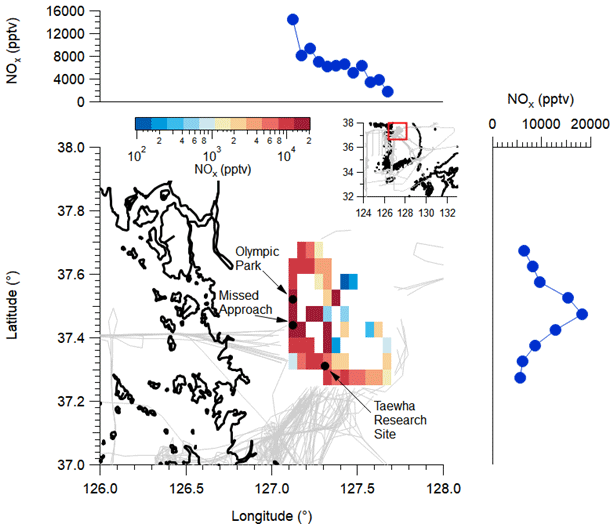
Figure 1Binned NOx mixing ratios observed on the NASA DC-8 during the KORUS-AQ campaign. Note that the color bar scale is logarithmic. The binning is along the flight paths of the NASA DC-8 for any observations collected below 2.0 km and after 11:00 LT. The rest of the NASA DC-8 flight paths not included in the analysis are shown in grey. Three key areas from KORUS-AQ are highlighted – the Olympic Park ground site, the airfield where the NASA DC-8 conducted routine missed approaches, and the Taehwa Research ground site. The histograms above and to the left are the distribution of the NOx mixing ratios longitudinally and latitudinally, respectively.
During KORUS-AQ, four different meteorological periods, as described by Peterson et al. (2019), impacted the region. These periods included a dynamic period from 1–16 May, where there were a series of frontal passages; a Stagnant period from 17–22 May, where it was dry, clear, and stagnant; a transport/haze period from 25–31 May, where long-range transport and hazy conditions with high humidity and cloud cover prevailed; and a blocking period from 1–7 June, where a high-pressure ridge is located at an area north of the lower pressure, which can preclude significant changes in synoptic meteorology and results in occasional stagnant conditions and minimal pollution transport (Peterson et al., 2019). However, as discussed in Sect. 3.2, conditions did not impact the general trends and chemistry, and thus, the whole campaign has been analyzed together.
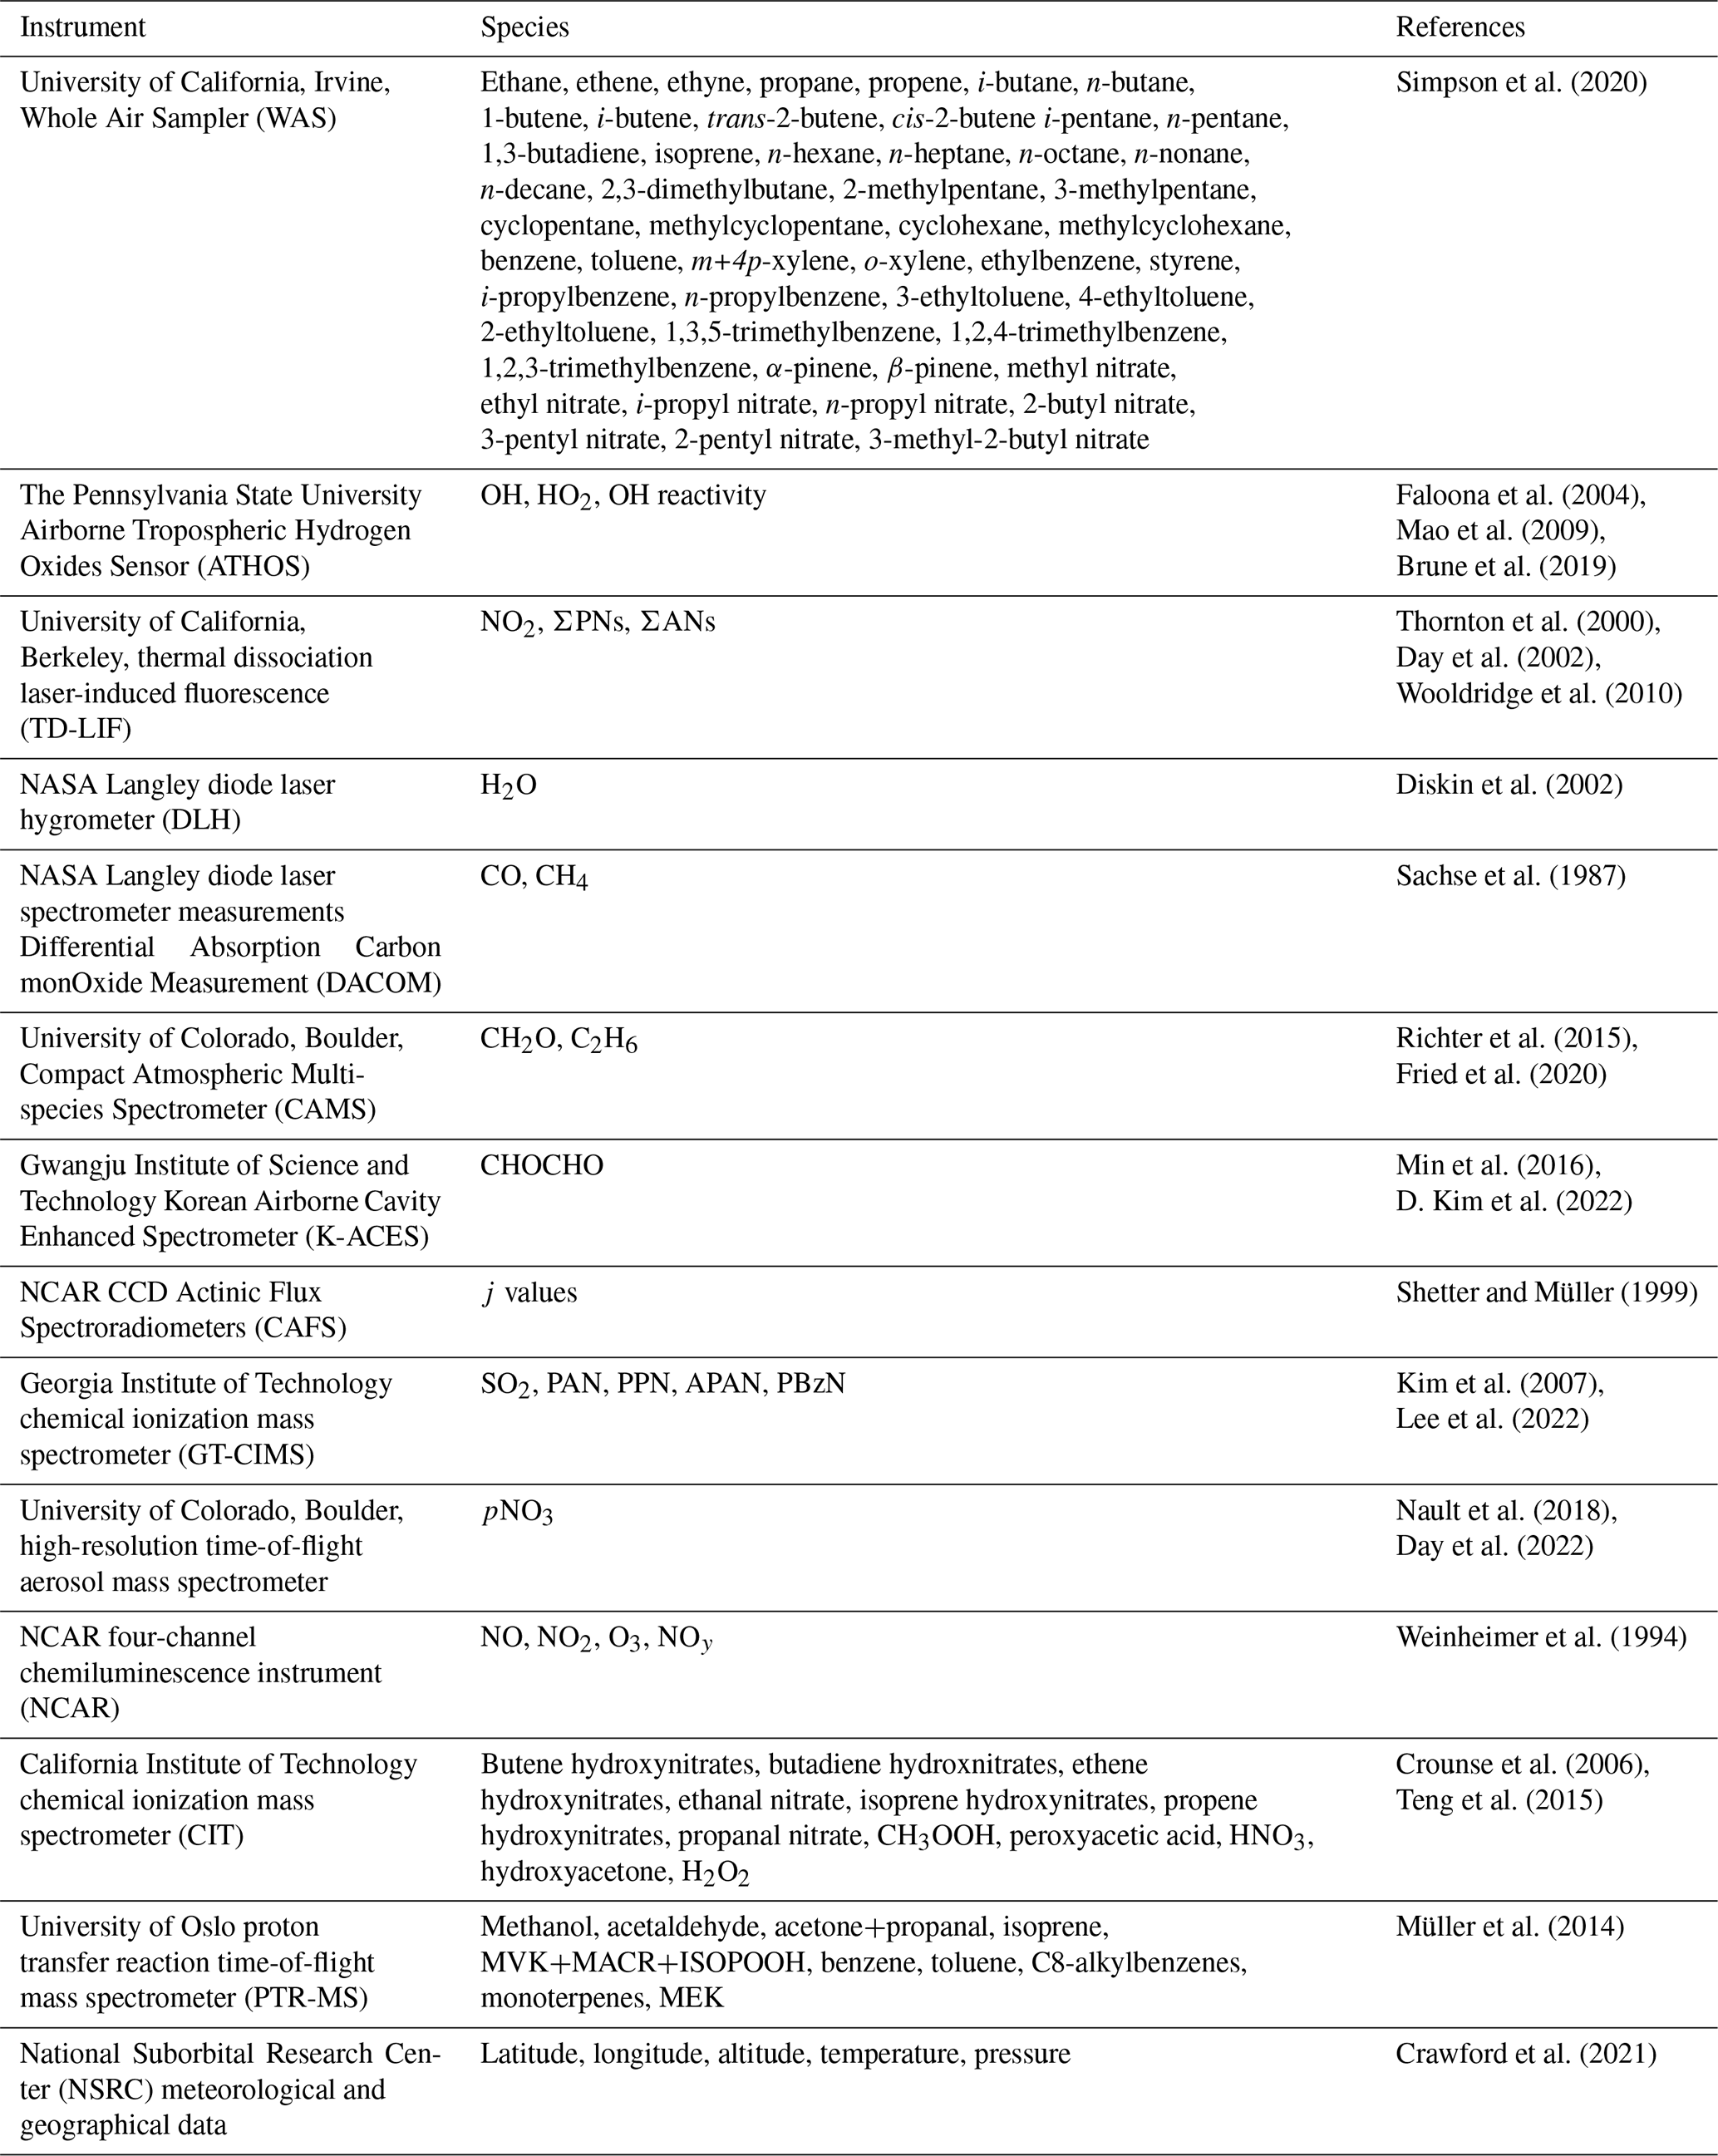
The observations used for the analysis are shown in Table 2, along with the associated references. The 1 min merged data from the DC-8 are used here (KORUS-AQ Science Team, 2023). For data missing due to the frequency of measurements (e.g., VOCs from WAS), data were filled using a similar approach to that of Schroeder et al. (2020), so that VOCs with missing data were filled by the linear relationship of that VOC with VOCs measured more frequently. This step was necessary for the observations used in the diel steady-state calculations described in Sect. 2.2. Note that thermal dissociation laser-induced fluorescence (TD-LIF) NO2 (see Table 2) was used throughout this study and discussed in Sect. S2 and Figs. S2–S4 as it generally agreed better with steady-state calculated NO2 NO ratios and steady-state NO2 than the chemiluminescence NO2. Furthermore, though PBzN (peroxy benzoyl nitrate) was measured by the Georgia Institute of Technology chemical ionization mass spectrometer (GT-CIMS) (Table 2), it is not compared with calculated PBzN from Framework for 0-D Atmospheric Modeling (F0AM) (Sect. 2.2) as it may be underestimated due to possible inlet losses, as discussed in Zheng et al. (2011).
Table 2List of instruments, compounds measured, accuracy/precision, and associated references used in this study.
2.2 F0AM box model diel steady-state calculations for missing reactivity and peroxynitrate budget analysis
We use the F0AM box model (Wolfe et al., 2016) with chemistry from the MCMv3.3.1 (Jenkin et al., 2015) to simulate production of PNs and formaldehyde using 1 min merged data, as described in Sect. 2.1. As in Schroeder et al. (2020), we simulate each 1 min merged aircraft observation through the full diurnal solar cycle (i.e., diel steady state) until the diurnal cycle for each unconstrained species reaches convergence within 1 %. These unconstrained species, such as formaldehyde, NO2, and OH, are then evaluated to ensure consistency between the F0AM model and aircraft observations. We constrain concentrations of NO, O3, H2O2, HNO3, CO, CH4, H2, PAN (peroxy acetyl nitrate), PPN (peroxypropionyl nitrate), and all measured or estimated VOCs given in Tables 2 and S1 in the Supplement to calculate HO2, all organic peroxy and acyl peroxy radicals, and unmeasured PNs. To calculate the PAN and PN budget, we allow the model to freely calculate NO2, formaldehyde, acetaldehyde, and all PNs, including PAN and PPN. We use a dilution constant of 12 h, according to Brune et al. (2022). Model evaluation is discussed in Sect. 3.4. The contribution of individual VOCs to PAN was calculated by reducing precursor VOCs by 20 % and multiplying the resulting impact on the peroxy acetyl radical (CH3C(O)O2•) by 5. Other acyl peroxy nitrates (higher PNs) are lumped into categories based on their primary precursor species from Table S2, species currently typically measured (e.g., PPN), or species contributing a large fraction of the total higher PN budget (greater than >2 %; e.g., PHAN (peroxyhydroxyacetic nitric anhydride) and MPAN (methacryloyl peroxy nitrate)).
Note that the reason PAN and PPN were constrained was due to uncertainties in the thermal lifetime, temperature history, and dilution rate used in F0AM, which had larger impacts on the CH3C(O)O2• and PAN than on other unconstrained compounds (e.g., OH and formaldehyde and not shown; Brune et al., 2022). Part of this larger impact is due to the CH3C(O)O2• being one of the most abundant radicals and one of the final radical products in the oxidation of numerous compounds (e.g., Jenkin et al., 2015). We do not expect these uncertainties to impact the higher PNs as (a) there are fewer precursors to form them compared to PAN, and (b) they are expected to have higher thermal stability compared to PAN due to longer carbon backbone (Kabir et al., 2014).
2.3 Calculation of instantaneous ozone and HOx production and loss
An experimental budget for the production and loss of Ox () and HOx () is described here. NO2 and O3 are combined to reduce any potential impact from titration via O3 reaction with NO (Reaction R10). The budget analysis includes field-measured quantities (mixing ratios and photolysis rates; Table 2), results from F0AM (Sect. 2.2), estimated missing R(VOC) (Sect. 3.2), and published kinetic rate constants (see Table 1 for references). The rate of production or destruction is calculated with the following equations (Eqs. 1–7) below. Note that these equations differ from Schroeder et al. (2020) in that (a) AN and PN chemistry is explicitly included, and (b) the reaction of O3 with alkenes is excluded, as this reaction contributed a minor loss to O3 (<1 %).
Here, k is the rate constant for the compound, i, with the associated compound listed; αeff is the effective branching ratio for Reactions (R2a) and (R2b) for the observations (Sect. 3.2); f is the fraction that O1D that reacts with water to form OH versus reacting with a third body molecule to form O3P; β is the fraction of the R(O)O2• that reacts with NO2 versus NO; and j is the measured photolysis frequency (Table 2). In Eq. (5), only values directly measured on the DC-8 during KORUS-AQ are included. As discussed in Wang et al. (2022) and Sect. 4.3, this is most likely an underestimation of P(HOx). Note that the R(O)O2• is not included in Eq. (7) as (a) it is assumed the initial production of R(O)O2• is captured with the reaction of OH with VOC and (b) R(O)O2• accounts for a small fraction of the total RO2 (<10 %). Not including the R(O)O2• in Eq. (7) may lead to a small underestimation of the total RO2•. Finally, HO2 calculated from F0AM, rather than aircraft measurements (Crawford et al., 2021), is used in the equations to determine the Ox and HOx budget (see Sect. S3 and Fig. S6).
In Sect. 3.1, the detailed observations from the DC-8 during KORUS-AQ provided measurements that allow us to test our understanding of NOx oxidation into total NOz (NOz equals higher NOx oxides, including ΣPNs, ΣANs, HNO3, and particulate nitrate, pNO3), which is needed for the remainder of the analysis. Section 3.2–3.4 will focus on the organic NOz chemistry. This is due to the chemistry and dynamics impacting the total inorganic nitrate chemistry that has been discussed recently (Jordan et al., 2020; Travis et al., 2022).
3.1 NOx and its oxidation products
The average NOx mixing ratios observed by the NASA DC-8 in the SMA below 2 km after 11:00 LT are shown in Fig. 1. As NOx is mainly emitted from anthropogenic activities, such as combustion emissions, in an urban environment, the largest NOx mixing ratios are observed between Olympic Park and the missed approach, as this area included downtown SMA. The missed approach included low-level sampling at a military airport, which may have contributed to the NOx mixing ratios, along with the activities throughout the SMA. As the DC-8 flies from the missed approach towards the Taehwa Research Site, the NOx mixing ratios decrease. The combination of reduced emissions, chemical reactions, and dilution and mixing reduces the NOx mixing ratios away from the city. An understanding of these processes is important for urban P(Ox).
On the DC-8, there were multiple measurements of various speciated and total family contributions towards NOz (Table 2). The comparison of the speciated and measured NOz is investigated in Fig. 2 for observations over the SMA. When only speciated PNs (GT) and ANs (CIT + WAS) and gas-phase nitrate (HNO3) are compared to the NOz (NOy (National Center for Atmospheric Research, NCAR)) − (NO (NCAR) + NO2 (TD-LIF)), only 46 % of the NOz can be explained. This is not completely unexpected, as multiple studies have indicated that the speciated AN measurements are typically lower than the total AN measurements (Fisher et al., 2016; Perring et al., 2010). Furthermore, pNO3 has been found to be important for the total nitrate budget in the SMA (e.g., Travis et al., 2022). Chemiluminescence measurements of gas-phase NOy have been found to efficiently measure pNO3, depending on the sensitivity to pNO3 enhancements or exclusions (Bourgeois et al., 2022); thus, it is expected that missing ANs and pNO3 are necessary to close the NOz budget. When adding the measured pNO3 to the speciated PNs (GT) and ANs (CIT + WAS) and gas-phase nitric acid, 81 % of NOz can be explained. This barely overlaps the combined uncertainty in the measurements (∼26 %). Total PNs and ANs, measured by TD-LIF, are needed to close off the total NOz budget.
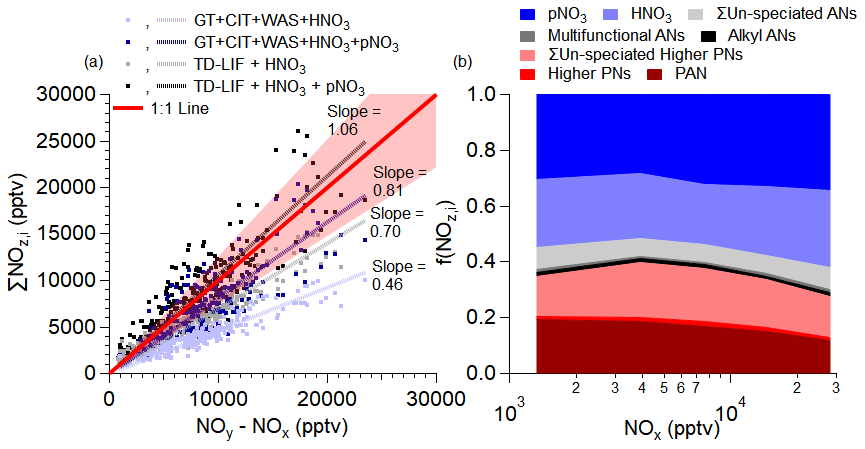
Figure 2(a) Scatter plot of the summation of individual NOz (NOz is higher-oxide NOx products) measured by GT, CIT, WAS, TD-LIF, and aerosol mass spectrometry (AMS) versus NOz measured by the difference between NOy and NOx (see Table 2 for compounds measured by each instrument). NOx is NO measured by NCAR and NO2 measured by LIF. The observations are for when the DC-8 was over the SMA. (b) Average contribution of measured speciated NOz over the SMA during KORUS-AQ versus NOx. Higher PNs are PPN + APAN + PBzN. ΣUn-speciated PNs are total peroxynitrates from TD-LIF minus the total measurement from GT. Alkyl RONO2 is the total of small alkyl nitrate measurements from WAS. Multifunctional RONO2 is the total number of measurements from CIT. ΣUn-speciated ANs are the total number of alkyl nitrates from TD-LIF minus the total RONO2 from CIT and WAS.
The breakdown of the NOz budget over the SMA as the air masses photochemically age (decreasing NOx contribution to the total NOy) is shown in Fig. 2b. During KORUS-AQ, ∼56 % of NOz was inorganic (gas- and particle-phase nitrate), ranging from 52 % to 62 %; the remaining NOz was organic (PNs and ANs). Approximately 74 % of the total ANs were not speciated (range from 73 % to 76 %). Speciated PN species, such as PAN (peroxy acetyl nitrate), account for a mean 51 % of the total PNs (range from 47 % to 59 %), much lower than typically observed in prior studies (e.g., Wooldridge et al., 2010). In these prior studies, the speciated PN species (typically PAN + PPN) accounted for 90 %–100 % of the ΣPNs, except for some select cases attributed to poor inlet design (Wooldridge et al., 2010). PAN accounted for the majority of the speciated PNs, with the remaining speciated PNs (PPN + PBzN + APAN (peroxyacryloyl nitrate)) accounting for ∼1 %. However, during KORUS-AQ, Lee et al. (2022) observed that PAN contributed only 60 % of calculated total PNs in industrial plumes near the SMA. Thus, the VOC emissions in and near the SMA potentially lead to PNs typically not being directly measured; this is explored more in Sect. 3.4.
As NOx decreases from ∼30 to 4 ppbv, the contribution of organic NOz increases (Fig. 2b). At about 4 ppbv, the contribution of organic NOz starts to decrease. Furthermore, the contribution of the different organic NOz species changes. For example, from ∼30 to 4 ppbv, the un-speciated ΣPNs contribute the majority of the organic NOz budget (∼39 %). Below ∼4 ppbv, the contribution of un-speciated ΣPNs decreases, and the PAN contribution increases. The change in the contribution of PNs is due to changes in the PN precursors (e.g., a combination of short-lived precursors oxidizing to CH3C(O)O2• and the thermal decomposition of the higher PNs (higher PNs = ΣPNs − PAN)). On the other hand, the contribution of un-speciated ΣANs remains relatively constant with NOx (∼6 % of total NOz). However, the type of AN is most likely changing with NOx due to the lifetime of the AN precursors and/or the lifetime of ANs. Less is known about the lifetime of ANs derived from anthropogenically emitted VOCs compared to those from biogenic VOCs (González-Sánchez et al., 2023; Picquet-Varrault et al., 2020; Zare et al., 2018). On average, unknown ANs and PNs account for ∼24 % of the observed NOz. The differences in the binned mean value for each species is greater than the uncertainty associated with its measurements (maximum uncertainty 30 %) and greater than the standard error in the mean, indicating that all of the percent differences shown here are real.
3.2 Meteorological impact on NOx oxidation
As discussed in Sect. 2.1 and in various prior studies, four different meteorological conditions impacted the observations during KORUS-AQ (Peterson et al., 2019). The impact of the meteorological conditions on NOx oxidation was investigated by plotting two metrics of NOx oxidation – Ox versus ΣANs and ΣPNs versus formaldehyde (Fig. 3). The implications of both plots are further discussed in Sect. 3.3 and 3.4, respectively. Briefly, Ox versus ΣANs and ΣPNs versus formaldehyde are competitive products from the reaction of RO2• or R(O)O2• with NOx (Reaction R2a versus Reaction R2b or Reaction R8 versus Reaction R9). The different meteorological periods corresponded to differences in temperatures and the amount of photolysis due to cloud cover (Peterson et al., 2019). Thus, these different periods may impact gas-phase chemistry and/or VOC emissions. However, as demonstrated in Fig. 3, there are minimal systematic differences in the trends observed for the two NOx oxidation products as there is no systematic shift in the trends or scatter observed in Fig. 3. This suggests that the data do not have to be separated by meteorological conditions.
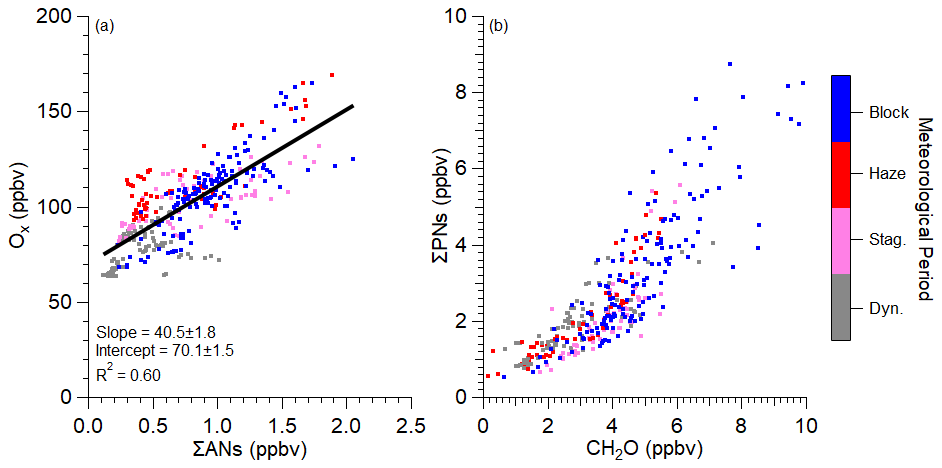
Figure 3Scatter plot of (a) Ox versus ΣANs and (b) ΣPNs versus formaldehyde (CH2O) over the SMA (see Fig. 1 for the area studied). Data are colored by meteorological periods discussed in Peterson et al. (2019). Data plotted here are after 11:00 LT to minimize the impact of the growing boundary layer and nocturnal residual layer mixing. The curvature in panel (b) is further explored in Fig. S9. Equations (8), (9), and (11) is used to convert the slope in panel (a) into αeff. The units of the slope are in ppbv ppbv−1.
3.3 Production of ANs to constrain R(VOC)
Observations of un-speciated ANs and PNs imply missing VOCs that impact O3 chemistry. The relationship of ANs to Ox can provide a method to investigate this source. This relationship provides an estimate of the effective branching ratio, α, for the observed VOC mix (Perring et al., 2013, and references therein). The value of this relationship stems from the reactions discussed above (Reactions R1–R6) in that upon the oxidation of VOCs, some fraction of the time, RO2• reacts with NO to form an AN molecule, and the remainder of the time the reaction goes on to form O3. This is expressed with the following equations:
Here, α is the effective branching ratio in the reaction of RO2• with NO to form ANs versus RO• (Reaction R2); k is the OH rate constant with VOC, i; and γ is the number of O3 molecules formed per oxidation of VOC, i. The reactivity-weighted γ is calculated for the observed and calculated F0AM species with Eq. (10), where γ for each compound is taken from Master Chemical Mechanism (MCM) (Jenkin et al., 2015) and accounts for the potential difference in the number of O3 molecules produced per channel per oxidation (e.g., xylene produces two O3 molecules 60 % of the time and one O3 molecule 40 % of the time). All terms are defined for Eqs. (8) and (9).
The reactivity-weighted γ is found to be, on average, 1.53, which is lower than the value of 2 typically assumed in prior studies (e.g., Perring et al., 2013). This lower reactivity-weighted γ is due to the role of CO (γ=1) and CH2O (γ=1) in the total reactivity. After the boundary layer height has stabilized (e.g., after 11:00 LT used here) and is near enough (e.g., shorter than 1 d aging) to the VOC source to ignore deposition and entrainment, Eqs. (8) and (9) can be combined to approximate the change in Ox per molecule ΣAN formed:
For this equation to be valid, α needs to be relatively small (α≪1), which is true for VOCs, as the maximum α value for the conditions of KORUS-AQ is expected to be 0.35 (Orlando and Tyndall, 2012; Perring et al., 2013; Yeh and Ziemann, 2014). Note that although Eq. (11) can be used at short photochemical ages due to the minimal impact from physical loss processes, chemical loss processes may impact the assumptions in Eq. (11), and these are discussed in more detail below.
Over the SMA during KORUS-AQ, the slope between Ox and ΣANs was observed to be 40.5 ± 1.8 (Fig. 3a), with an R2=0.60. Using Eq. (11), this translates to an effective branching ratio (αeff) of 0.036. For other urban locations around the world, this slope has ranged from 13–47 (Farmer et al., 2011; Kenagy et al., 2020; Perring et al., 2010; Rosen et al., 2004), leading to an effective α between 0.04 and 0.15, assuming a γ of 2 instead of the calculated γ used here. Thus, the αeff observed over the SMA during KORUS-AQ is similar to other urban locations (Houston = 0.05, Rosen et al., 2004; South Korea = 0.05, Kenagy et al., 2021) but much lower than observed for Mexico City at 0.07–0.12 (Farmer et al., 2011; Perring et al., 2010) and Denver at 0.16 (Kenagy et al., 2020). This suggests that VOCs with low α values dominate the total R(VOC) and production of ANs in the SMA. The VOCs in the SMA that dominate R(VOCs), including OVOCs, alkenes, and aromatics (Schroeder et al., 2020; Simpson et al., 2020), generally have lower α values (Orlando and Tyndall, 2012; Perring et al., 2013, and references therein).
We use the observed VOCs (Table 2) and estimated secondary products from F0AM to calculate αeff from this mixture to compare to the calculated αeff of 0.036 derived from the slope of Ox versus ΣANs in Fig. 3a, as shown in Fig. 4. To derive αeff, Eq. (12) was used, where all the terms are the same as Eqs. (8) and (9).
The R(VOC) calculated from the observed VOCs and from the intermediates produced by the F0AM model, described in Sect. 2.2, are shown in Fig. 4a, and the reactivity-weighted α values for the observations are shown in Fig. 4b. As has been observed in other urban environments (e.g., Hansen et al., 2021; Whalley et al., 2016, 2021; Yang et al., 2022), measured OVOCs contribute the most to the calculated R(VOC) for all NOx mixing ratios (32 %–48 %). The unmeasured OVOCs (F0AM species) contributed 17 %–28 % of the calculated reactivity. The F0AM species reactivity ranged from 0.45–1.78 s−1, which is a similar increase in the total OH reactivity observed by Brune et al. (2022) over South Korea. At higher NOx mixing ratios, primary, more reactive VOCs (e.g., alkanes, alkenes, and aromatics) contribute an important fraction (>25 %) of the R(VOC). As there are interferences in the total OH reactivity measurement at high NOx (Brune et al., 2022), we are unable to determine the extent to which the observed and modeled reactivity captures the total OH reactivity in the SMA above a NOx value of approximately 4 ppbv. At lower NOx mixing ratios, ∼33 % of the R(VOC) is missing (calculated R(VOC), including F0AM species, at ∼3.0 s−1 and measured R(VOC) from Penn State – see Table 2 – at 4.5 s−1).
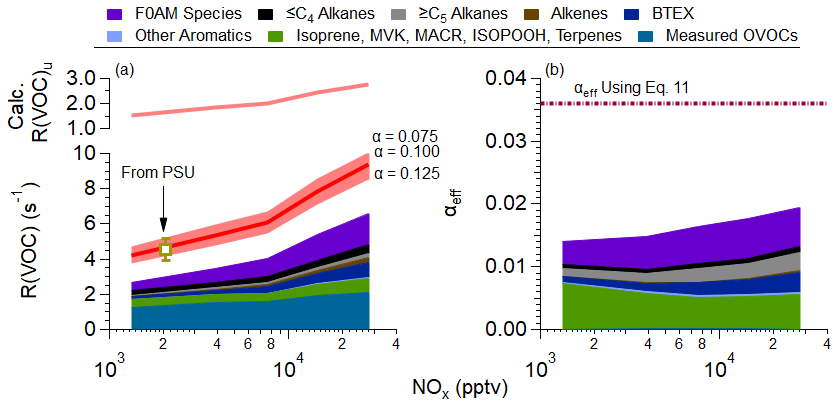
Figure 4(a) The upper panel is the binned calculated (calc.) unmeasured VOC reactivity (R(VOC)u). Note that the term unmeasured is for any species not measured on DC-8 or constrained by F0AM and calculated using Eq. (13). The lower panel is the binned VOC reactivity versus NOx observed over the SMA during KORUS-AQ (see Fig. 1 for the area studied). The measured observed R(VOC), labeled “From PSU”, where PSU is Pennsylvania State University, is the VOC reactivity calculated from the measured total OH reactivity with the inorganic OH reactivity removed. As discussed in Brune et al. (2022), the OH reactivity has interferences at high NOx mixing ratios. The error bar is the uncertainty in the OH reactivity measurement (Brune et al., 2022). The red line represents the calculated unmeasured R(VOC), using Eq. (11), with an assumed α=0.10. The shaded area represents different calculated unmeasured R(VOC), assuming different α values for the unmeasured R(VOC) (see Eq. 11). (b) The calculated effective α value from observations versus NOx. The dashed purple line is the effective α value estimated from Eq. (11), using the slope from Fig. 3a. For both panels (a) and (b), the colored and stacked data are the calculated VOC reactivity (a) and the weighted effective α (b). The values from panel (b) are calculated using Eq. (11). Finally, for both panels (a) and (b), F0AM species is the reactivity for compounds not measured on the DC-8 predicted by F0AM with an estimated α=0.05. The associated uncertainty in using different α for the F0AM-predicted reactivity is explored in Fig. S5.
Numerous other urban studies have observed unmeasured OH reactivity, which is assumed to be unmeasured R(VOC), as the inorganic OH reactivity is typically well covered by measurements. Here, we are defining unmeasured R(VOC) as the reactivity not represented by measurements on the DC-8 or by F0AM-predicted species and reactivity. This unmeasured R(VOC) has ranged from ∼3 to ∼10 s−1 (e.g., Brune et al., 2022; Hansen et al., 2021; Kim et al., 2016; Ma et al., 2022; Tan et al., 2019; Whalley et al., 2016, 2021). Over the SMA, the difference between measured and calculated R(VOC) was ∼1.5 s−1 at low NOx and unknown at high NOx mixing ratios. The lower difference may be related to the comparison occurring for observations at low NOx when the very reactive material has reacted into compounds measured on the DC-8 (formaldehyde, acetaldehyde, etc.), has diluted to low-enough concentrations to be negligible for R(VOC), or has undergone deposition or partitioning to the particle phase.
At higher NOx mixing ratios, which are more representative of fresh emissions, these more reactive compounds typically not measured are expected to lead to a higher difference between the calculated and observed R(VOC). Prior studies with more comprehensive measurements found that these more reactive compounds and their secondary products contributed an important fraction towards the R(VOC) (e.g., Whalley et al., 2016). Thus, to determine if these unmeasured VOCs potentially contribute to the R(VOC), and thus P(Ox), in the SMA, another means to constrain their contributions is necessary. One potential means to constrain the total R(VOC) is using the observed ΣANs and Ox and assuming that the observations are from the instantaneous production of both species (e.g., the assumption used for Fig. 3a).
To estimate the unmeasured R(VOC), Eq. (13) is used without canceling out terms and is expanded into the measured and unmeasured R(VOC) and α values:
Here, is the slope from Fig. 3a; γ is the number of O3 molecules formed per oxidation of VOC, which is 1.53 for this study; R(VOC) is the VOC reactivity, which is its OH oxidation rate constant and its concentration (k×[VOC]) (in s−1); α is the branching ratio for Reaction (R2) (Table 1); and m and u correspond to “measured” (measured VOCs on DC-8 along with secondary species predicted by F0AM) and “unmeasured” (unmeasured VOCs that are not represented by DC-8 observations and not predicted by F0AM) R(VOC) and α. The rate constants for the measured VOCs are listed in Table 1, the reactivity for F0AM is taken directly from F0AM, and α is either from MCM (Jenkin et al., 2015) or Perring et al. (2013) for observations or assumed to be 0.05 for F0AM secondary products. The equation is rearranged and solved for RVOCu, using different values of αu (e.g., 0.00–0.30, values typical of α).
As discussed in Sect. S3, there are numerous assumptions and potential sources of uncertainty in the simplified version of Eq. (13). A thorough analysis and discussion of these assumptions are provided in Sect. S3. The potentially most important assumption is that chemical loss is negligible in solving Eq. (13). However, due to the expected relatively short lifetime of ∑ANs, the chemical loss of both Ox and ANs nearly cancels each other out, leading to similar results in considering or neglecting these loss terms in Eq. (13). Furthermore, as ∑AN chemical loss has uncertainty, especially for ANs produced from anthropogenic VOC oxidation, the use of Eq. (13) reduces some of these uncertainties in comparison to Eq. (S9) in the Supplement. Thus, for the remainder of the paper, the values calculated from Eq. (13) will be used. Another limitation in this study is assuming a constant α and γ across all NOx mixing ratios to estimate the unmeasured R(VOC). At higher NOx mixing ratios, where the VOC mixing ratios would be highest due to being closer to emissions, it would be expected that both α and γ would change. However, the direction in which these values would change is uncertain as both α and γ depend on the structure of the VOC, which is currently unknown.
For the range of missing α assumed, an α=0.10 for the unmeasured R(VOC) provides the best agreement with the observed R(VOC) (“From PSU” is the Pennsylvania State University OH reactivity with inorganic reactivity subtracted out) for all observations where NOx<4 ppbv. Furthermore, it is found that α ranging from 0.075–0.125 encompasses the associated uncertainty with the observed R(VOC) (±0.64 s−1; Brune et al., 2019). This leads to an average unmeasured R(VOC) of .
The associated total missing R(VOC) for the assumed α of 0.10 ranges from 1.5 to 2.8 s−1 (Fig. 4a; upper panel). Assuming typical rate constants for emitted VOCs, and assuming that it is comparable to semi- and intermediate VOCs and their associated secondary products (∼1– , Ma et al., 2017; Zhao et al., 2014), the total missing reactivity would be equivalent to ∼1–8 ppbv. Zhao et al. (2014) observed ∼12 µg m−3 of semi- and intermediate VOCs near Los Angeles, CA, during the California Nexus (CalNex) study. Depending on the molecular weight assumed, this translates to ∼1 to 2 ppbv. Nault et al. (2018) found that ∼5–8 ppbv of VOCs were needed to explain the observed secondary organic aerosol production over the SMA, depending on the molecular weight assumed for the VOC. Furthermore, Kenagy et al. (2021) also found that known chemistry could only account for ∼33 % of the observed ANs, and missing sources of lower-volatility VOCs to produce anthropogenically derived ANs were necessary. Finally, Whalley et al. (2016) found that the addition of unassigned VOCs and their associated oxidation products led to a reactivity of ∼1.6 s−1, leading to ∼1–6 ppbv missing R(VOC). Thus, the reactivity and equivalent mixing ratios estimated here appear plausible and warrant future measurements to understand this unmeasured reactivity sources.
One important aspect of this unmeasured R(VOC) is that it should not be considered to be one or a couple of VOCs emitted and contributing 1–8 ppbv of VOC in the atmosphere. Instead, it will be the emitted VOCs and their oxidation products summed together to form the 1–8 ppbv of unmeasured VOCs in the atmosphere.
One possible group of missing VOCs is the long-chain aldehydes from cooking and vegetative emissions, including nonanal (Hurst Bowman et al., 2003; Rao et al., 2010; Sai et al., 2012; Schauer et al., 2002). Kim et al. (2018) observed cooking organic aerosols at a ground site in the SMA, indicating that there should be associated gas-phase emissions from cooking. Higher carbon aldehydes (or cycloalkanes) have recently been suggested to be a potential interference compound with isoprene measurements on a proton transfer reaction time-of-flight mass spectrometer (PTR-MS) (Coggon et al., 2024; Wargocki et al., 2023). Comparisons of isoprene measured by the PTR-MS and Whole Air Sampler (WAS) during KORUS-AQ (Fig. S7) shows, at increasing NOx mixing ratios (closer to emission sources), the difference between the PTR-MS and WAS isoprene mixing ratio increases. This suggests that there are potential unmeasured OVOCs and/or other C5H8 alkenes at high NOx ratios that cannot be easily determined by the difference between the PTR-MS and WAS. Continuing to use nonanal as a surrogate for this unmeasured OVOC, nonanal has a rate constant consistent with the values used above for the missing R(VOC) ( ; Hurst Bowman et al., 2003). Furthermore, nonanal has an estimated high α of ∼0.2 (Hurst Bowman et al., 2003). As typical nonanal mixing ratios have been observed or estimated to be <500 pptv (parts per trillion by volume), this suggests that nonanal or similar OVOCs may contribute to some of the missing reactivity (<0.45 s−1). Finally, nonanal and other long-chain aldehydes may be an important higher PN precursor (see Sect. 3.4 for more discussion about un-speciated higher PNs).
OVOC emissions from multiple sources, including solvent evaporation and other non-transportation emissions, are generally considered to be an important fraction of R(VOC) for urban emissions but may not be measurable by PTR or GC (gas chromatography), such as glycols (de Gouw et al., 2018; Gkatzelis et al., 2021; McDonald et al., 2018; Ma et al., 2022; Simpson et al., 2020; Wang et al., 2022; Yang et al., 2022). However, the α for OVOC is potentially smaller than alkanes, though it is highly unconstrained (Orlando and Tyndall, 2012). Note that higher OVOCs have been understudied and thus may have higher α values (e.g., nonanal). Thus, if the missing reactivity is mainly OVOCs, and it is assumed their α is low, compounds with α>0.15 will be needed for the budget closure shown here. Likely compounds with high α include alkanes, cycloalkenes/alkenes, and aromatics, although the latter is also highly uncertain. Alkanes have typically been a small source for the R(VOC) in urban environments (e.g., McDonald et al., 2018; Simpson et al., 2020; Whalley et al., 2016). Though aromatics contribute a significant fraction of R(VOC) in different Asian urban environments (Brune et al., 2022; Schroeder et al., 2020; Simpson et al., 2020; Whalley et al., 2021), the majority of the aromatic R(VOC) is considered to be measured by WAS over the SMA during KORUS-AQ (e.g., measured aromatics account for ∼81 % of aromatic reactivity in McDonald et al. (2018) and 98 % of aromatic reactivity in Whalley et al. (2016), where both studies had more complete VOC measurements). Finally, the cycloalkenes/alkenes originate from numerous anthropogenic sources (e.g., McDonald et al., 2018; Simpson et al., 2020). One subclass of cycloalkenes includes monoterpenes. Similar to the comparison of isoprene between PTR-MS and WAS, the difference in monoterpenes between these two measurements increases with increasing NOx (Fig. S8). As to the interfering compound(s) measured by the PTR-MS and whether it is (they are) oxygenated or not is not known; only the WAS monoterpenes are used in this analysis of calculating R(VOC). Assuming the limonene rate constant, the difference between the PTR-MS and WAS monoterpenes raises the terpene reactivity by 0.05–0.30 s−1. Though this does not include any associated photochemical products from the oxidation of monoterpenes and can improve the closure, it does not explain the total missing reactivity (1.4–2.1 s−1). Thus, the missing R(VOC) is most likely a combination of OVOCs and cycloalkenes/alkenes.
3.4 Sources of PNs over the SMA
As shown in Fig. 2, ΣPNs account for a larger fraction of the total NOz budget than ΣANs. ΣPNs are known to be a temporary sink of NOx and radicals (R(O)O2•) due to their short thermal lifetime (∼1 h). Thus, the NOx emitted in the SMA is being transported regionally, impacting the P(Ox).
In Fig. 3b, ΣPNs show some correlation with formaldehyde. Both are secondary products from the photooxidation of VOCs and have short lifetimes, leading to the correlation. However, above 4 ppbv formaldehyde, the correlation shifts as ΣPNs increase more rapidly than formaldehyde. As shown in Fig. S9, this change in the relationship between ΣPNs versus formaldehyde is due to changes in the competition in the reaction of the acyl peroxy radical (R(O)O2•) between NO2 and NO. At low NO NO2 ratios, Reaction (R8) is more favorable, as the R(O)O2• is more likely to react with NO2 compared to NO, leading to more efficient production over formaldehyde. As the NO NO2 ratios increase (NO becomes comparable to NO2, leading to more equal probability in R(O)O2• reacting to NO and NO2, leading to production of alkoxy radicals that can form formaldehyde), Reaction (R9) becomes more dominant, leading to lower production of PNs.
To further explore the sources of both PAN and the higher ΣPNs, the F0AM model (Wolfe et al., 2016) was used to predict both unmeasured ΣPNs constrained by the observed VOC precursors, PAN, and PPN (Table 2) and the budget of all ΣPNs, where PAN and PPN were not constrained. F0AM shows minimal bias in the predicted formaldehyde, NO2, and OH (Fig. S10) when PAN and PPN were constrained. As discussed in Sect. 3.3, though, R(VOC) of s−1 is missing. A sensitivity analysis in adding this missing reactivity to F0AM on predicted OH and formaldehyde was conducted (Sect. S4 and Figs. S11 and S12). Both OH and formaldehyde are found to be buffered with the addition of this low amount of R(VOC). Thus, although there is a good agreement in these intermediate products between the observation and F0AM, this analysis for the sources of PAN and higher ΣPNs is expected to be a lower limit. This missing R(VOC) is further observed in the F0AM-predicted higher PNs (ΣPNs without PAN or ΣPNs–PAN for short) versus formaldehyde, as a general underestimation in the total higher PNs compared to observations is observed (Fig. 5a). (Schroeder et al., 2020)
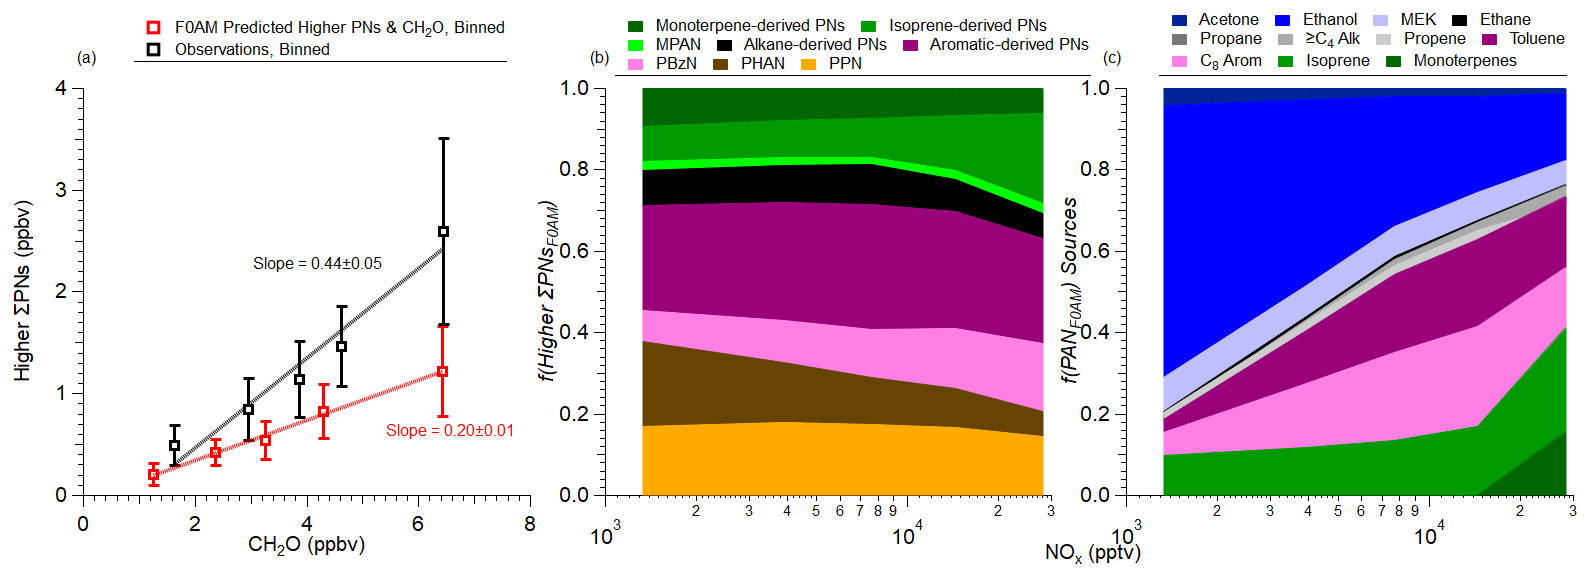
Figure 5(a) Scatter plot of binned higher ΣPNs calculated using F0AM (red) or binned higher ΣPNs from observations (black) versus formaldehyde (CH2O). Slopes shown are orthogonal distance regression (ODR) fits to the binned data. PPN and PAN were constrained by observations for F0AM, while all the other higher PNs were not constrained. (b) Fractional contribution of the higher PNs predicted from F0AM versus NOx. (c) Fractional contribution of different precursors to PAN, predicted by F0AM versus NOx. For both panels (b) and (c), Alk is all alkanes, Arom is all aromatics, and ≥C4 Alk is all alkanes with four or more carbons. See Fig. S10 for a comparison of F0AM.
The classes of compounds producing higher PNs in F0AM are shown in Fig. 5b. The classes of compounds were selected from the parent VOC which was oxidized into the higher PN (Table S2). Individual PNs with high contributions and/or are typically measured (PPN, PBzN, and MPAN) or are a large fraction of PNs but have yet to be measured in ambient conditions (PHAN) are shown without any connection to the parent VOC. Furthermore, both PHAN and PPN have numerous precursors, while many of the other higher PNs modeled by F0AM are generally associated with one precursor. At high NOx mixing ratios, the more reactive VOCs (aromatics and terpenes) contribute a large fraction of the higher PNs (>35 % for NOx>4 ppbv). As the air moves away from the SMA (lower NOx mixing ratios), contributions of higher PNs from longer-lived compounds (e.g., alkanes) and later-generation oxidation products start dominating.
An interesting trend is observed for PPN and PHAN. Both peroxy acyl radicals for PPN and PHAN (C2H5C(O)O2• and CH2(OH)C(O)O2•, respectively) are products from the photooxidation of many VOCs, including aromatics, alkanes, and methyl ethyl ketone (MEK). However, the fractional contribution of PPN to higher PNs remains constant with decreasing NOx, while the fractional contribution of PHAN increases with decreasing NOx (Fig. 5b). This stems from the sources of C2H5C(O)O2• versus CH2(OH)C(O)O2•. The MCM mechanism, which is used for F0AM, produces C2H5C(O)O2• from the photooxidation from both short- and long-lived species (isoprene, C8 aromatics, toluene, ethanol, MEK, propane, and C4 alkanes), while CH2(OH)C(O)O2• is produced from the photooxidation of isoprene and ethene. For CH2(OH)C(O)O2•, the production is through minor channels in the photooxidation of isoprene (∼3 % yield directly from isoprene and ∼20 % as a secondary product; Galloway et al., 2011). Ethene is relatively long-lived, with a lifetime of ∼7 h ( ), leading to the delay in the production of PHAN. Note that PHAN formation in MCM/F0AM may be overestimated, as Butkovskaya et al. (2006) found that the radical formed from the photooxidation of glycolaldehyde decomposes to form formaldehyde and CO2, potentially competing with the pathway to form PHAN. Other studies also found that PNs were not observed by the photooxidation of glycoaldehyde (Magneron et al., 2005).
The results here generally indicate that more speciated measurements of higher PNs are needed. However, as highlighted in Fig. 5, improved detection or measurements of PBzN, PHAN, and MPAN would allow for furthering our knowledge of PN chemistry in urban environments and their role in controlling Ox production.
A qualitative investigation of the precursors of PAN predicted by F0AM are shown in Fig. 5c. This provides a basis for further investigation of the sources over the SMA region for PAN as (a) F0AM over-predicts PAN, as noted above; (b) ethanol is currently estimated, similar to Schroeder et al. (2020); and (c) R(VOC) in F0AM is low due to missing precursors. Like the higher PNs, highly reactive R(VOC) contributes a large portion of the PAN budget at high NOx. The short-lived compounds contribute ∼80 % of PAN over the SMA at the highest NOx mixing ratios. At lower NOx mixing ratios, moving away from the SMA, longer-lived compounds, such as ethanol, contribute the most towards PAN production (∼70 %).
One of the interesting contributions not typically observed for PAN is MEK, which also contributes to PPN and PHAN. In prior studies, MEK mixing ratios were typically 0.5 to 2.0 ppbv (Bon et al., 2011; de Gouw et al., 2018; Liu et al., 2015). Over the SMA, 1.5 ppbv of MEK was observed on average with values as high as 8.3 ppbv. Due to the long lifetime of MEK (∼30 h for the average photolysis rate measured and ), the high mixing ratios of MEK are most likely due to direct emissions (e.g., de Gouw et al., 2005; Liu et al., 2015). Thus, there are potentially large sources of MEK in the SMA that need to be considered to properly represent PAN chemistry.
Another potentially important compound for PAN production is ethanol. However, this compound was not measured during KORUS-AQ; instead, it was estimated based on previous ground-based observations, similar to Schroeder et al. (2020). Ethanol is considered to mainly come from both vehicle emissions (e.g., Millet et al., 2012) and non-transportation emissions, including cleaning agents and solvents (e.g., McDonald et al., 2018). As ethanol use is predicted to increase in the future (e.g., de Gouw et al., 2012), and cleaning agents and other volatile chemical products appear to scale with population (Gkatzelis et al., 2021), ethanol and MEK may continue contributing towards the PAN budget in the SMA in the future.
As a note, two other compounds potentially important for PAN production that were not measured on the DC-8 during KORUS-AQ include methylglyoxal and biacetyl (LaFranchi et al., 2009). In a forested environment that was partially impacted by urban outflow, these two components contributed on average 25 % of the PAN budget (LaFranchi et al., 2009). In urban environments, methylglyoxal is believed to mainly originate from aromatic oxidation (Ling et al., 2020), whereas biacetyl is believed to come from anthropogenic emissions (Xu et al., 2023). Furthermore, as discussed in Sect. 4.3, these two compounds may potentially be missing important HOx sources as well. Thus, measurements of these two compounds, along with ethanol, are necessary to better understand PAN chemistry.
As highlighted in Fig. S1, the three factors impacting instantaneous P(Ox) are R(VOC), P(HOx), and NOx loss processes. In Sect. 3, the NOx loss processes were investigated and provided a constraint for R(VOC) to improve the investigation of P(Ox). With R(VOC) constrained, the RO2• concentration can be estimated, providing a means to calculate the net P(Ox) and to investigate the major reactions leading to Ox loss and total HOx () loss. With the latter, this allows for an investigation of the major P(HOx) reactions, assuming L(HOx) equals P(HOx) (see Eqs. 1–7 in Sect. 2.3).
4.1 Net Ox production and sources of Ox loss
Using the total R(VOC) from Sect. 3.3 (Fig. 4a), the net P(Ox) (Eqs. 1 and 2) over the SMA during KORUS-AQ has been determined (Fig. 6a). The net P(Ox) peaked at 9.3 ppbv h−1 at ∼8 ppbv NOx. If only the measured and estimated R(VOC) from F0AM secondary products is used to calculate net P(Ox), the value decreases to 7.6 ppbv h−1 but at the same NOx mixing ratio. This value is similar to values observed in other urban locations around the world (∼2–20 ppbv h−1), showing that many urban areas are still impacted by high P(Ox) values (Brune et al., 2022; Griffith et al., 2016; Ma et al., 2022; Ren et al., 2013; Schroeder et al., 2020; Whalley et al., 2016, 2018).
The NOx distribution over the SMA (Fig. 1) shows a large area (∼127.53 to 127.18° E or ∼39 km), which corresponds to the NOx mixing ratio that results in maximum P(Ox), as shown in Fig. 6a. Thus, a large portion of the SMA will have high instantaneous P(Ox) of ∼9 ppbv h−1. As the median wind speed over the SMA during KORUS-AQ was ∼5 m s−1, an air parcel would remain at the highest P(Ox) for ∼2 h, leading to ∼18 ppbv O3 being produced (not including dilution). This agrees with the ∼20 ppbv increase in O3 observed over the Taehwa Research Forest supersite between midday and afternoon overpasses by the DC-8 during KORUS-AQ (Crawford et al., 2021). Thus, although there is a substantial O3 background observed over the SMA (Colombi et al., 2023; Crawford et al., 2021), a large contribution of the O3 is due to photochemical production.
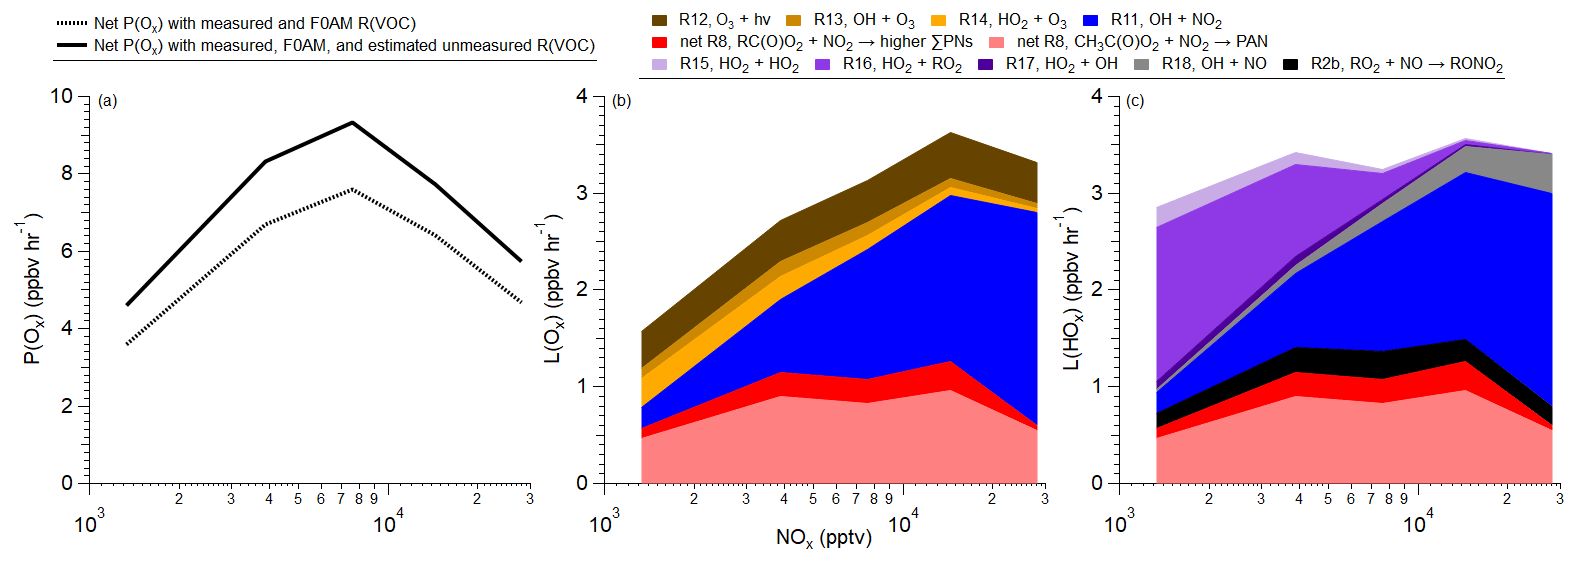
Figure 6(a) Net Ox (O3+NO2) production (see Eqs. 1 and 2) predicted for the SMA using measured and F0AM R(VOC) (dashed) or total R(VOC) (solid) (from Fig. 4a) versus NOx. (b) Contribution of different reactions to the total Ox loss versus NOx. (c) Contribution of different reactions to total HOx () loss versus NOx. The predicted RO2 comes from the total VOC reactivity calculated in Fig. 4a, assuming steady state (Eq. 7), and HO2 acyl peroxy radicals are from F0AM results. Note that for both panels (b) and (c), net RC(O)O2+NO2 and net CH3C(O)O2+NO2 are described in Eq. (3). Radical reactions contributing <1 % to the L(Ox) or L(HOx) are not included. Also note that F0AM HO2, CH3C(O)O2•, R(O)O2•, and F0AM secondary products are used here, along with observations.
The major reactions leading to Ox loss (L(Ox)) are shown in Fig. 6b. The two major reactions that lead to Ox loss are net Reaction (R8) (light and dark red), or the net production of PNs (which includes losses), and Reaction (R11), which is the reaction of NO2 with OH (blue) (see Table 1). Note that, as discussed in Sect. 2.2, for the budget analysis conducted here, PAN and PPN were constrained to observations. At high NOx (near emissions; ∼30 ppbv), Reaction (R11) (NO2+OH) dominates the L(Ox) budget (>60 %), with the net Reaction (R8) (net PAN, dark red; higher PNs, light red) contributing ∼25 %, and Reactions (R12)–(R14) accounting for the remaining 15 % of the Ox loss. As NOx mixing ratios decrease (moving away from emissions), the net (R8) reaction, producing both PAN and higher PNs, starts contributing to larger total L(Ox), ranging from 30 %–40 %. Furthermore, the net (R8) reaction contribution towards L(Ox) remains relatively constant with NOx mixing ratios as the contribution from Reaction (R11) (OH+NO2) decreases. At NOx mixing ratios of <3 ppbv, non-NOx reactions (R12–R14) contribute more than 30 % of the L(Ox) budget. Thus, the proper representation of PAN and higher PNs, both in precursors and speciation, is important to properly understand the Ox budget in the SMA.
4.2 HOx loss over the SMA
Similar to L(Ox), the major reactions leading to L(HOx) over the SMA during KORUS-AQ were the reactions of NOx with HOx, specifically NO2 with OH (Reaction R11) and net PAN (dark red) and higher PN (light red) production (Reaction R8) (Fig. 6c). Reaction (R11) is most important for NOx mixing ratios greater than 15 ppbv (50 %–65 %). Between 5 and 15 ppbv, Reaction (R11) is comparable to the net PN production (Reaction R8), where Reaction (R11) comprises 35 %–50 % of L(HOx), while net Reaction (R8) (sum of higher ∑PNs and PAN) comprises 30 %–40 % of L(HOx). At lower NOx mixing ratios, Reaction (R11) is always smaller for L(HOx) than net Reaction (R8), where Reaction (R11) is about a factor of 2 lower than net Reaction (R8). Production of ΣANs played a minor role due to the low αeff.
The self-reaction of HOx species (Reactions R15 and R16) contributes minimally to L(HOx) (less than 10 %) for NOx mixing ratios greater than 8 ppbv. At lower NOx mixing ratios, Reaction (R16) starts dominating the L(HOx) budget, increasing from 8 % at 8 ppbv to 50 % of L(HOx) at NOx mixing ratios less than 2 ppbv. Reaction (R15) remains relatively small for the L(HOx) budget, only reaching 7 % of the L(HOx) budget at NOx mixing ratios <2 ppbv.
4.3 Sources of HOx over the SMA
The analysis conducted leads to the ability to constrain HOx losses over the SMA during KORUS-AQ. This is important as not all typical HOx sources were measured on the DC-8 during the project (e.g., nitrous acid or HONO), and HOx production rates directly impact P(Ox) (Fig. S1). Prior studies (e.g., Griffith et al., 2016; Tan et al., 2019; Whalley et al., 2018) have demonstrated that in urban environments, sources of HOx include the photolysis of O3 and the subsequent reaction with water vapor, formaldehyde photolysis, and HONO photolysis. Furthermore, recent studies have highlighted the potential importance of typically non-measured OVOCs in their contribution to P(HOx) and subsequent P(Ox) in an urban environment (Wang et al., 2022). To constrain the P(HOx) over the SMA during KORUS-AQ, the P(HOx) was assumed to be equal to the observationally constrained L(HOx). Then, P(HOx) was calculated for the measurements on the DC-8, including the photolysis of O3, formaldehyde, H2O2, and other measured OVOCs (Table 2).
Comparing the calculated P(HOx) and L(HOx), ∼1.5 ppbv h−1 P(HOx) (range 1.3–1.8 ppbv h−1) is not accounted for, leading to ∼45 % of the necessary L(HOx) to maintain a steady state (Fig. 7). For the calculated P(HOx) budget, O3 and formaldehyde photolysis contributed ∼50 % and 40 % of the budget, respectively, with the remainder coming from the photolysis of H2O2 and other measured OVOCs. Accounting for the unobserved P(HOx), O3 and formaldehyde photolysis contributed ∼25 % and ∼20 %, respectively.
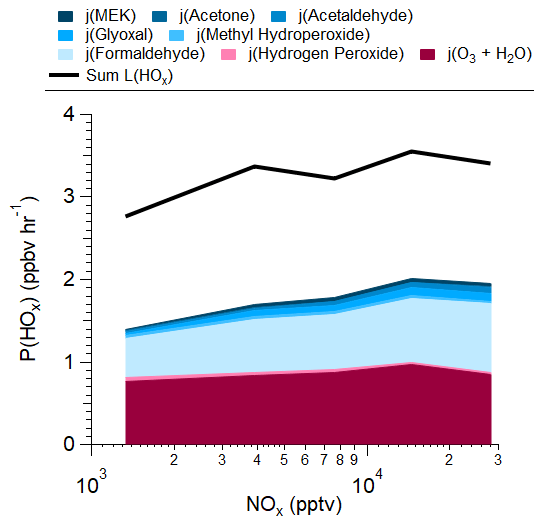
Figure 7Calculated HOx production from observations (colored stack) compared with the calculated HOx loss from Fig. 6c over the SMA during KORUS-AQ.
Potential missing sources of P(HOx) are briefly speculated here. First, one potential source is the photolysis of methylglyoxal. Using the F0AM-predicted methylglyoxal, as it was not measured on the DC-8, methylglyoxal would contribute ∼0.24 ppbv h−1 P(HOx) or ∼16 % of the unobserved P(HOx). Another OVOC not measured on the DC-8 and expected to originate from anthropogenic emissions and not from chemistry is 2,3-butanedione or biacetyl (de Gouw et al., 2018; Grosjean et al., 2002; Schauer et al., 2002; Xu et al., 2023; Zhou et al., 2020). Prior studies observed 20–400 pptv of biacetyl (de Gouw et al., 2018; Xu et al., 2023), corresponding to 0.04–0.74 ppbv h−1 or 3 %–49 % of the unobserved P(HOx). Thus, between these two OVOCs, 19 %–66 % of the unobserved P(HOx) could be explained. Other unmeasured OVOCs could potentially contribute to the observed P(HOx) (e.g., Wang et al., 2022); however, there are fewer constraints both on the speciation and photolysis rates for these OVOCs (e.g., Mellouki et al., 2015). Finally, HONO could contribute to this observed P(HOx). Up to 700 pptv of HONO was observed in the SMA during KORUS-AQ (Gil et al., 2021), although this would quickly photolyze at the altitudes that the DC-8 flew over the SMA (Tuite et al., 2021). Even at 50–100 pptv HONO, the photolysis of HONO would lead to 0.2–0.4 ppbv h−1 P(HOx) or 13 %–27 % of the unobserved P(HOx). Thus, between methylglyoxal, biacetyl, and HONO, a range between 32 %–92 % of the unobserved P(HOx) could be accounted for. This analysis highlights the importance of measuring these HOx sources to better understand and constrain Ox chemistry in the SMA and other urban environments.
A comparison of HOx sources from F0AM is shown in Fig. S14. As it has more complete OVOCs than the observations, the contributions are different to those shown in Fig. 7. Both the observations and F0AM agree that the photolysis of O3, and the subsequent reaction with water (Reaction R12), and the photolysis of formaldehyde are the two largest sources of HOx. F0AM also shows that methylglyoxal is an important source of HOx, which is not shown in Fig. 7 as methylglyoxal was not measured. However, the total F0AM P(HOx) was ∼2.4 ppbv h−1, which was lower than the observationally constrained value. This further supports either the potential unmeasured OVOCs coming from both emissions and chemistry and/or the uncertainty in the photolysis rate constants for these OVOCs (e.g., Wang et al., 2022).
One note about this analysis is that particulate matter collected onto the downwelling CAFS optics during KORUS-AQ (see Sect. S5, Table S3, and Fig. S13). Corrections of up to 20 % were determined, and the associated uncertainties were also increased by 20 % due to the corrections. Thus, the exact amount of unmeasured P(HOx) is potentially smaller than discussed.
In the Seoul Metropolitan Area (SMA), the ozone (O3) mixing ratio often exceeds current standards and is increasing. Many processes can impact the O3 mixing ratios and exceedances. Here, the processes that impact instantaneous O3 production (P(Ox), where Ox is O3+NO2 to account for possible O3 titration) were investigated for observations collected on the NASA DC-8 during the 2016 NIER/NASA Korea–United States Air Quality (KORUS-AQ) study. The observations indicate missing oxidized NOx products (NOz) that include both the short-lived peroxy nitrates (ΣPNs) and alkyl and multi-functional nitrates (ΣANs). ΣPNs contributed the most for the organic NOz species. Only ∼50 % of the ΣPNs were speciated over the SMA, which is atypical, as prior studies typically show the closure between the speciated and total PN measurements.
The un-speciated ΣPNs and ΣANs were used to constrain the missing volatile organic compound (VOC) reactivity (R(VOC)), as R(VOC) is important in constraining the instantaneous P(O3). The missing R(VOC) was found to be 1.4 to 2.1 s−1. The F0AM box model further supports the role of unmeasured ΣPNs as an important temporary NOx and radical sink over the SMA. F0AM predicts ∼50 % of the higher ΣPNs (higher ), indicating that missing R(VOCs) may explain the other 50 %. Constraints from both the ΣPNs and ΣANs suggest that this missing R(VOC) would include oxygenated VOCs (OVOCs), including aldehydes such as octanal and nonanal from cooking, and alkenes from anthropogenic emissions.
With the constraints on the R(VOC), the net instantaneous P(Ox) was determined for the SMA. It was found to peak at ∼10 ppbv h−1 at ∼8 ppbv NOx. A large fraction of the SMA area was, on average, at this mixing ratio of NOx, indicating high local P(Ox). This supports the increase of ∼20 ppbv in the O3 observed in a downwind site (Taehwa Research Forest supersite) from midday to afternoon during KORUS-AQ.
With the comprehensive measurements on board the DC-8, the F0AM model results, and the observationally constrained R(VOC), a budget analysis on the sinks of O3 (L(Ox)) and HOx (L(HOx), where ) was performed. Due to the high R(VOC), type of VOC, and the NO2 NO ratio, the net ΣPN production is a surprisingly large and important sink of Ox and HOx over the SMA (∼25 %–40 % and 15 %–40 % for L(Ox) and L(HOx), respectively), with the production of HNO3 and radical self-reactions accounting for the other L(Ox) and L(HOx) losses. Net ΣPN production as an important L(Ox) and L(HOx) term is significant, as ΣPN is a temporary reservoir of both NO2 and R(O)O2• but has not traditionally been included in these calculations. Downwind locations separated from the local NOx and VOC emissions of the SMA will experience increased P(Ox) due to the release of NO2 and R(O)O2•. With the constraint of L(HOx), P(HOx) was investigated, assuming a steady state, and unmeasured HONO plus unmeasured OVOCs were found to be necessary to explain the missing HOx sources. Both sources of HOx are either missing or highly uncertain in chemical transport models.
Though the high regional background and foreign sources of O3 and its precursors elevate the O3 levels in the SMA and potentially already cause the SMA to be in exceedance for O3 concentrations, this study highlights the importance of local and in situ P(Ox) to the SMA area, which can further exacerbate the O3 concentrations for the SMA and the surrounding region. The results support the observations of increasing O3 with decreasing NOx that have been observed for the SMA in prior studies. Furthermore, the study highlights the important role of unmeasured VOCs and OVOCs and the necessity to understand their sources and role in NOx and O3 chemistry. Furthermore, the study demonstrates the interplay of direct emissions or secondary production of PN precursors and its role in net P(Ox). Attempts at specifically reducing the sources of PN may adversely impact net P(Ox), as lower net PN chemistry may increase O3 due to more NO2 being available.
Version R6 1 min merged data used in this analysis are available at https://doi.org/10.5067/Suborbital/KORUSAQ/DATA01 (KORUS-AQ Science Team, 2023). The F0AM setup file, input file, and output files are all available at https://doi.org/10.5281/zenodo.10723227 (Travis, 2024).
The supplement related to this article is available online at: https://doi.org/10.5194/acp-24-9573-2024-supplement.
BAN, KRT, and JHC designed the experiment and wrote the paper. BAN and KRT analyzed the data. KRT ran the F0AM model, and KRT and BAN analyzed the model output. BAN, DRB, PCJ, RCC, JPD, GSD, SRH, LGH, JLJ, KEM, YRL, IJS, KU, and AW collected and quality-assured and quality-controlled the data during KORUS-AQ. All authors contributed to the writing and editing of the paper.
At least one of the (co-)authors is a member of the editorial board of Atmospheric Chemistry and Physics. The peer-review process was guided by an independent editor, and the authors also have no other competing interests to declare.
Publisher's note: Copernicus Publications remains neutral with regard to jurisdictional claims made in the text, published maps, institutional affiliations, or any other geographical representation in this paper. While Copernicus Publications makes every effort to include appropriate place names, the final responsibility lies with the authors.
The authors acknowledge Michelle Kim, Alex Teng, John Crounse, and Paul O. Wennberg for their measurements with CIT-CIMS (HNO3, multifunctional alkyl nitrates, and OVOCs); William H. Brune for his measurements with ATHOS (OH and OH reactivity); Alan Fried for his measurements with CAMS (CH2O and C2H6); Paul Romer-Present for his contribution to collecting data with TD-LIF; Sally Pusede for her contributions to collecting data with DACOM and DLH; and Andrew J. Weinheimer for his measurements of NO, O3, and NOy. The PTR-MS instrument team (Philipp Eichler, Lisa Kaser, Tomas Mikoviny, Markus Müller) are acknowledged for their support.
Benjamin A. Nault and Katherine R. Travis received funding from NASA (grant no. 80NSSC22K0283). L. Gregory Huey and Young Ro Lee received funding from NASA (grant no. NNX15AT90G) for the PAN measurements. Samuel R. Hall and Kirk Ullmann have been supported by NASA (grant no. NNX15AT99G) for photolysis measurements. Armin Wisthaler received support from the Austrian Federal Ministry for Transport, Innovation, and Technology (grant no. bmvit-FFG-ASA) for the PTR-MAS measurements. Pedro Campuzano-Jost and Jose L. Jimenez have been supported by NASA (grant nos. 80NSSC21K1451 and 80NSSC23K0828).
This paper was edited by Joshua Fu and reviewed by two anonymous referees.
Archibald, A. T., Neu, J. L., Elshorbany, Y. F., Cooper, O. R., Young, P. J., Akiyoshi, H., Cox, R. A., Coyle, M., Derwent, R. G., Deushi, M., Finco, A., Frost, G. J., Galbally, I. E., Gerosa, G., Granier, C., Griffiths, P. T., Hossaini, R., Hu, L., Jöckel, P., Josse, B., Lin, M. Y., Mertens, M., Morgenstern, O., Naja, M., Naik, V., Oltmans, S., Plummer, D. A., Revell, L. E., Saiz-Lopez, A., Saxena, P., Shin, Y. M., Shahid, I., Shallcross, D., Tilmes, S., Trickl, T., Wallington, T. J., Wang, T., Worden, H. M., and Zeng, G.: Tropospheric ozone assessment report: A critical review of changes in the tropospheric ozone burden and budget from 1850 to 2100, Elementa, 8, 034, https://doi.org/10.1525/elementa.2020.034, 2020.
Atkinson, R.: Kinetics of the gas-phase reactions of OH radicals with alkanes and cycloalkanes, Atmos. Chem. Phys., 3, 2233–2307, https://doi.org/10.5194/acp-3-2233-2003, 2003.
Atkinson, R. and Arey, J.: Atmospheric Degradation of Volatile Organic Compounds, Chem. Rev., 103, 4605–4638, https://doi.org/10.1021/CR0206420, 2003.
Atkinson, R., Baulch, D. L., Cox, R. A., Crowley, J. N., Hampson, R. F., Hynes, R. G., Jenkin, M. E., Rossi, M. J., Troe, J., and IUPAC Subcommittee: Evaluated kinetic and photochemical data for atmospheric chemistry: Volume II – gas phase reactions of organic species, Atmos. Chem. Phys., 6, 3625–4055, https://doi.org/10.5194/acp-6-3625-2006, 2006.
Bohn, B. and Zetzsch, C.: Kinetics and mechanism of the reaction of OH with the trimethylbenzenes – experimental evidence for the formation of adduct isomers, Phys. Chem. Chem. Phys., 14, 13933, https://doi.org/10.1039/c2cp42434g, 2012.
Bon, D. M., Ulbrich, I. M., de Gouw, J. A., Warneke, C., Kuster, W. C., Alexander, M. L., Baker, A., Beyersdorf, A. J., Blake, D., Fall, R., Jimenez, J. L., Herndon, S. C., Huey, L. G., Knighton, W. B., Ortega, J., Springston, S., and Vargas, O.: Measurements of volatile organic compounds at a suburban ground site (T1) in Mexico City during the MILAGRO 2006 campaign: measurement comparison, emission ratios, and source attribution, Atmos. Chem. Phys., 11, 2399–2421, https://doi.org/10.5194/acp-11-2399-2011, 2011.
Bourgeois, I., Peischl, J., Neuman, J. A., Brown, S. S., Allen, H. M., Campuzano-Jost, P., Coggon, M. M., DiGangi, J. P., Diskin, G. S., Gilman, J. B., Gkatzelis, G. I., Guo, H., Halliday, H. A., Hanisco, T. F., Holmes, C. D., Huey, L. G., Jimenez, J. L., Lamplugh, A. D., Lee, Y. R., Lindaas, J., Moore, R. H., Nault, B. A., Nowak, J. B., Pagonis, D., Rickly, P. S., Robinson, M. A., Rollins, A. W., Selimovic, V., St. Clair, J. M., Tanner, D., Vasquez, K. T., Veres, P. R., Warneke, C., Wennberg, P. O., Washenfelder, R. A., Wiggins, E. B., Womack, C. C., Xu, L., Zarzana, K. J., and Ryerson, T. B.: Comparison of airborne measurements of NO, NO2, HONO, NOy, and CO during FIREX-AQ, Atmos. Meas. Tech., 15, 4901–4930, https://doi.org/10.5194/amt-15-4901-2022, 2022.
Brune, W. H., Miller, D. O., Thames, A. B., Allen, H. M., Apel, E. C., Blake, D. R., and Bui, T. P.: Exploring Oxidation in the Remote Free Troposphere: Insights From Atmospheric Tomography (ATom), J. Geophys. Res.-Atmos., 125, c2019JD031685, https://doi.org/10.1029/2019JD031685, 2019.
Brune, W. H., Miller, D. O., Thames, A. B., Brosius, A. L., Barletta, B., Blake, D. R., Blake, N. J., Chen, G., Choi, Y., Crawford, J. H., Digangi, J. P., Diskin, G., Fried, A., Hall, S. R., Hanisco, T. F., Huey, G. L., Hughes, S. C., Kim, M., Meinardi, S., Montzka, D. D., Pusede, S. E., Schroeder, J. R., Teng, A., Tanner, D. J., Ullmann, K., Walega, J., Weinheimer, A., Wisthaler, A., and Wennberg, P. O.: Observations of atmospheric oxidation and ozone production in South Korea, Atmos. Environ., 269, 118854, https://doi.org/10.1016/j.atmosenv.2021.118854, 2022.
Burkholder, J. B., Sander, S. P., Abbatt, J. P. D., Barker, J. R., Cappa, C. D., Crounse, J. D., Dibble, T. S., Huie, R. E., Kolb, C. E., Kurylo, M. J., Orkin, V. L., Percival, C. J., Wilmouth, D. M., and Wine, P. H.: Chemical Kinetics and Photochemical Data for Use in Atmospheric Studies, Evaluation No. 19, Pasadena, CA, USA, 2020.
Butkovskaya, N. I., Pouvesle, N., Kukui, A., and Le Bras, G.: Mechanism of the OH-Initiated Oxidation of Glycolaldehyde over the Temperature Range 233–296 K, J. Phys. Chem. A, 110, 13492–13499, https://doi.org/10.1021/jp064993k, 2006.
Coggon, M. M., Stockwell, C. E., Claflin, M. S., Pfannerstill, E. Y., Xu, L., Gilman, J. B., Marcantonio, J., Cao, C., Bates, K., Gkatzelis, G. I., Lamplugh, A., Katz, E. F., Arata, C., Apel, E. C., Hornbrook, R. S., Piel, F., Majluf, F., Blake, D. R., Wisthaler, A., Canagaratna, M., Lerner, B. M., Goldstein, A. H., Mak, J. E., and Warneke, C.: Identifying and correcting interferences to PTR-ToF-MS measurements of isoprene and other urban volatile organic compounds, Atmos. Meas. Tech., 17, 801–825, https://doi.org/10.5194/amt-17-801-2024, 2024.
Cohen, A. J., Brauer, M., Burnett, R., Anderson, H. R., Frostad, J., Estep, K., Balakrishnan, K., Brunekreef, B., Dandona, L., Dandona, R., Feigin, V., Freedman, G., Hubbell, B., Jobling, A., Kan, H., Knibbs, L., Liu, Y., Martin, R., Morawska, L., Pope, C. A., Shin, H., Straif, K., Shaddick, G., Thomas, M., van Dingenen, R., van Donkelaar, A., Vos, T., Murray, C. J. L., and Forouzanfar, M. H.: Estimates and 25 year trends of the global burden of disease attributable to ambient air pollution: an analysis of data from the Global Burden of Diseases Study 2015, Lancet, 389, 1907–1918, https://doi.org/10.1016/S0140-6736(17)30505-6, 2017.
Colombi, N. K., Jacob, D. J., Yang, L. H., Zhai, S., Shah, V., Grange, S. K., Yantosca, R. M., Kim, S., and Liao, H.: Why is ozone in South Korea and the Seoul metropolitan area so high and increasing?, Atmos. Chem. Phys., 23, 4031–4044, https://doi.org/10.5194/acp-23-4031-2023, 2023.
Crawford, J. H., Ahn, J. Y., Al-Saadi, J., Chang, L., Emmons, L. K., Kim, J., Lee, G., Park, J. H., Park, R. J., Woo, J. H., Song, C. K., Hong, J. H., Hong, Y. D., Lefer, B. L., Lee, M., Lee, T., Kim, S., Min, K. E., Yum, S. S., Shin, H. J., Kim, Y. W., Choi, J. S., Park, J. S., Szykman, J. J., Long, R. W., Jordan, C. E., Simpson, I. J., Fried, A., Dibb, J. E., Cho, S. Y., and Kim, Y. P.: The Korea-United States air quality (KORUS-AQ) field study, Elementa, 9, 1–27, https://doi.org/10.1525/elementa.2020.00163, 2021.
Crounse, J., McKinney, K. A., Kwan, A. J., and Wennberg, P. O.: Measurement of gas-phase hydroperoxides by chemical ionization mass spectrometry, Anal. Chem., 78, 6726–6732, https://doi.org/10.1021/ac0604235, 2006.
Day, D. A., Wooldridge, P. J., Dillon, M. B., Thornton, J. A., and Cohen, R. C.: A thermal dissociation laser-induced fluorescence instrument for in situ detection of NO2, peroxy nitrates, alkyl nitrates, and HNO3, J. Geophys. Res.-Atmos., 107, 4046, https://doi.org/10.1029/2001JD000779, 2002.
Day, D. A., Campuzano-Jost, P., Nault, B. A., Palm, B. B., Hu, W., Guo, H., Wooldridge, P. J., Cohen, R. C., Docherty, K. S., Huffman, J. A., de Sá, S. S., Martin, S. T., and Jimenez, J. L.: A systematic re-evaluation of methods for quantification of bulk particle-phase organic nitrates using real-time aerosol mass spectrometry, Atmos. Meas. Tech., 15, 459–483, https://doi.org/10.5194/amt-15-459-2022, 2022.
de Gouw, J. A., Middlebrook, A. M., Warneke, C., Goldan, P. D., Kuster, W. C., Roberts, J. M., Fehsenfeld, F. C., Worsnop, D. R., Canagaratna, M. R., Pszenny, A. A. P., Keene, W. C., Marchewka, M. L., Bertman, S. B., and Bates, T. S.: Budget of organic carbon in a polluted atmosphere: Results from the New England Air Quality Study in 2002, J. Geophys. Res.-Atmos., 110, D16305, https://doi.org/10.1029/2004JD005623, 2005.
de Gouw, J. A., Gilman, J. B., Borbon, A., Warneke, C., Kuster, W. C., Goldan, P. D., Holloway, J. S., Peischl, J., Ryerson, T. B., Parrish, D. D., Gentner, D. R., Goldstein, A. H., and Harley, R. A.: Increasing atmospheric burden of ethanol in the United States, Geophys. Res. Lett., 39, L15803, https://doi.org/10.1029/2012GL052109, 2012.
de Gouw, J. A., Gilman, J. B., Kim, S.-W., Alvarez, S. L., Dusanter, S., Graus, M., Griffith, S. M., Isaacman-VanWertz, G., Kuster, W. C., Lefer, B. L., Lerner, B. M., McDonald, B. C., Rappenglück, B., Roberts, J. M., Stevens, P. S., Stutz, J., Thalman, R., Veres, P. R., Volkamer, R., Warneke, C., Washenfelder, R. A., and Young, C. J.: Chemistry of Volatile Organic Compounds in the Los Angeles Basin: Formation of Oxygenated Compounds and Determination of Emission Ratios, J. Geophys. Res.-Atmos., 123, 2298–2319, https://doi.org/10.1002/2017JD027976, 2018.
Diskin, G. S., Podolske, J. R., Sachse, G. W., and Slate, T. A.: Open-path airborne tunable diode laser hygrometer, Proc. SPIE, 4817, 196–204, https://doi.org/10.1117/12.453736, 2002.
Espada, C. and Shepson, P. B.: The production of organic nitrates from atmospheric oxidation of ethers and glycol ethers, Int. J. Chem. Kinet., 37, 686–699, https://doi.org/10.1002/kin.20121, 2005.
Faloona, I. C., Tan, D., Lesher, R. L., Hazen, N. L., Frame, C. L., Simpas, J. B., Harder, H., Martinez, M., Di Carlo, P., Ren, X., and Brune, W. H.: A Laser-induced Fluorescence Instrument for Detecting Tropospheric OH and HO2: Characteristics and Calibration, J. Atmos. Chem., 47, 139–167, https://doi.org/10.1023/B:JOCH.0000021036.53185.0e, 2004.
Farmer, D. K., Perring, A. E., Wooldridge, P. J., Blake, D. R., Baker, A., Meinardi, S., Huey, L. G., Tanner, D., Vargas, O., and Cohen, R. C.: Impact of organic nitrates on urban ozone production, Atmos. Chem. Phys., 11, 4085–4094, https://doi.org/10.5194/acp-11-4085-2011, 2011.
Fisher, J. A., Jacob, D. J., Travis, K. R., Kim, P. S., Marais, E. A., Chan Miller, C., Yu, K., Zhu, L., Yantosca, R. M., Sulprizio, M. P., Mao, J., Wennberg, P. O., Crounse, J. D., Teng, A. P., Nguyen, T. B., St. Clair, J. M., Cohen, R. C., Romer, P., Nault, B. A., Wooldridge, P. J., Jimenez, J. L., Campuzano-Jost, P., Day, D. A., Hu, W., Shepson, P. B., Xiong, F., Blake, D. R., Goldstein, A. H., Misztal, P. K., Hanisco, T. F., Wolfe, G. M., Ryerson, T. B., Wisthaler, A., and Mikoviny, T.: Organic nitrate chemistry and its implications for nitrogen budgets in an isoprene- and monoterpene-rich atmosphere: constraints from aircraft (SEAC4RS) and ground-based (SOAS) observations in the Southeast US, Atmos. Chem. Phys., 16, 5969–5991, https://doi.org/10.5194/acp-16-5969-2016, 2016.
Fried, A., Walega, J., Weibring, P., Richter, D., Simpson, I. J., Blake, D. R., Blake, N. J., Meinardi, S., Barletta, B., Hughes, S. C., Crawford, J. H., Diskin, G., Barrick, J., Hair, J., Fenn, M., Wisthaler, A., Mikoviny, T., Woo, J., Park, M., Kim, J., Min, K., Jeong, S., Wennberg, P. O., Kim, M. J., Crounse, J. D., Teng, A. P., Bennett, R., Yang-Martin, M., Shook, M. A., Huey, G., Tanner, D., Knote, C., and Kim, J.: Airborne formaldehyde and volatile organic compound measurements over the Daesan petrochemical complex on Korea's northwest coast during the Korea-United States Air Quality study: Estimation of emission fluxes and effects on air quality, Elementa: Science of the Anthropocene, 8, 1, https://doi.org/10.1525/elementa.2020.121, 2020.
Galloway, M. M., Huisman, A. J., Yee, L. D., Chan, A. W. H., Loza, C. L., Seinfeld, J. H., and Keutsch, F. N.: Yields of oxidized volatile organic compounds during the OH radical initiated oxidation of isoprene, methyl vinyl ketone, and methacrolein under high-NOx conditions, Atmos. Chem. Phys., 11, 10779–10790, https://doi.org/10.5194/acp-11-10779-2011, 2011.
Gaudel, A., Cooper, O. R., Ancellet, G., Barret, B., Boynard, A., Burrows, J. P., Clerbaux, C., Coheur, P. F., Cuesta, J., Cuevas, E., Doniki, S., Dufour, G., Ebojie, F., Foret, G., Garcia, O., Granados-Muñoz, M. J., Hannigan, J. W., Hase, F., Hassler, B., Huang, G., Hurtmans, D., Jaffe, D., Jones, N., Kalabokas, P., Kerridge, B., Kulawik, S., Latter, B., Leblanc, T., Le Flochmoën, E., Lin, W., Liu, J., Liu, X., Mahieu, E., McClure-Begley, A., Neu, J. L., Osman, M., Palm, M., Petetin, H., Petropavlovskikh, I., Querel, R., Rahpoe, N., Rozanov, A., Schultz, M. G., Schwab, J., Siddans, R., Smale, D., Steinbacher, M., Tanimoto, H., Tarasick, D. W., Thouret, V., Thompson, A. M., Trickl, T., Weatherhead, E., Wespes, C., Worden, H. M., Vigouroux, C., Xu, X., Zeng, G., and Ziemke, J.: Tropospheric Ozone Assessment Report: Present-day distribution and trends of tropospheric ozone relevant to climate and global atmospheric chemistry model evaluation, Elementa, 6, 39, https://doi.org/10.1525/elementa.291, 2018.
Gil, J., Kim, J., Lee, M., Lee, G., Ahn, J., Soo, D., Jung, J., Cho, S., Whitehill, A., Szykman, J., and Lee, J.: Characteristics of HONO and its impact on O3 formation in the Seoul Metropolitan Area during the Korea-US Air Quality study, Atmos. Environ., 247, 118182, https://doi.org/10.1016/j.atmosenv.2020.118182, 2021.
Gkatzelis, G. I., Coggon, M. M., Mcdonald, B. C., Peischl, J., Aikin, K. C., Gilman, J. B., Trainer, M., and Warneke, C.: Identifying Volatile Chemical Product Tracer Compounds in U. S. Cities, Environ. Sci. Technol., 55, 188–199, https://doi.org/10.1021/acs.est.0c05467, 2021.
González-Sánchez, J. M., Brun, N., Wu, J., Ravier, S., Clément, J.-L., and Monod, A.: On the importance of multiphase photolysis of organic nitrates on their global atmospheric removal, Atmos. Chem. Phys., 23, 5851–5866, https://doi.org/10.5194/acp-23-5851-2023, 2023.
Griffith, S. M., Hansen, R. F., Dusanter, S., Michoud, V., Gilman, J. B., Kuster, W. C., Veres, P. R., Graus, M., de Gouw, J. A., Roberts, J., Young, C., Washenfelder, R., Brown, S. S., Thalman, R., Waxman, E., Volkamer, R., Tsai, C., Stutz, J., Flynn, J. H., Grossberg, N., Lefer, B., Alvarez, S. L., Rappenglueck, B., Mielke, L. H., Osthoff, H. D., and Stevens, P. S.: Measurements of hydroxyl and hydroperoxy radicals during CalNex-LA: Model comparisons and radical budgets, J. Geophys. Res.-Atmos., 121, 4211–4232, https://doi.org/10.1002/2015JD024358, 2016.
Grosjean, D., Grosjean, E., and Gertler, A. W.: On-Road Emissions of Carbonyls from Light-Duty and Heavy-Duty Vehicles, Environ. Sci. Technol., 35, 45–53, https://doi.org/10.1021/es001326a, 2002.
Hansen, R. F., Griffith, S. M., Dusanter, S., Gilman, J. B., Graus, M., Kuster, W. C., Veres, P. R., de Gouw, J. A., Warneke, C., Washenfelder, R. A., Young, C. J., Brown, S. S., Alvarez, S. L., Flynn, J. H., Grossberg, N. E., Lefer, B., Rappenglueck, B., and Stevens, P. S.: Measurements of Total OH Reactivity During CalNex-LA, J. Geophys. Res.-Atmos., 126, e2020JD032988, https://doi.org/10.1029/2020JD032988, 2021.
Hurst Bowman, J., Barket, D. J., and Shepson, P. B.: Atmospheric chemistry of nonanal, Environ. Sci. Technol., 37, 2218–2225, 2003.
Jenkin, M. E., Young, J. C., and Rickard, A. R.: The MCM v3.3.1 degradation scheme for isoprene, Atmos. Chem. Phys., 15, 11433–11459, https://doi.org/10.5194/acp-15-11433-2015, 2015.
Jo, D. S., Emmons, L. K., Callaghan, P., Tilmes, S., and Woo, J.: Comparison of Urban Air Quality Simulations During the KORUS-AQ Campaign With Regionally Refined Versus Global Uniform Grids in the Multi-Scale Infrastructure for Chemistry and Aerosols (MUSICA) Version 0, J. Adv. Model. Earth Sy., 15, e2022MS003458, https://doi.org/10.1029/2022MS003458, 2023.
Jordan, C. E., Crawford, J. H., Beyersdorf, A. J., Eck, T. F., Halliday, H. S., Nault, B. A., Chang, L. S., Park, J. S., Park, R., Lee, G., Kim, H., Ahn, J. Y., Cho, S., Shin, H. J., Lee, J. H., Jung, J., Kim, D. S., Lee, M., Lee, T., Whitehill, A., Szykman, J., Schueneman, M. K., Campuzano-Jost, P., Jimenez, J. L., DiGangi, J. P., Diskin, G. S., Anderson, B. E., Moore, R. H., Ziemba, L. D., Fenn, M. A., Hair, J. W., Kuehn, R. E., Holz, R. E., Chen, G., Travis, K., Shook, M., Peterson, D. A., Lamb, K. D., and Schwarz, J. P.: Investigation of factors controlling PM2.5 variability across the South Korean Peninsula during KORUS-AQ, Elementa, 8, 28, https://doi.org/10.1525/elementa.424, 2020.
Kabir, M., Jagiella, S., and Zabel, F.: Thermal Stability of n-Acyl Peroxynitrates, Int. J. Chem. Kinet., 46, 462–469, https://doi.org/10.1002/kin.20862, 2014.
Kenagy, H. S., Sparks, T. L., Ryerson, T. B., Blake, D. R., and Cohen, R. C.: Evidence of Nighttime Production of Organic Nitrates During SEAC4RS, FRAPPE, and KORUS-AQ, Geophys. Res. Lett., 47, e2020GL087860, https://doi.org/10.1029/2020GL087860, 2020.
Kenagy, H. S., Romer Present, P. S., Wooldridge, P. J., Nault, B. A., Campuzano-Jost, P., Day, D. A., Jimenez, J. L., Zare, A., Pye, H. O. T., Yu, J., Song, C. H., Blake, D. R., Woo, J. H., Kim, Y., and Cohen, R. C.: Contribution of Organic Nitrates to Organic Aerosol over South Korea during KORUS-AQ, Environ. Sci. Technol., 55, 16326–16338, https://doi.org/10.1021/acs.est.1c05521, 2021.
Kim, D., Cho, C., Jeong, S., Lee, S., Nault, B. A., Campuzano-Jost, P., Day, D. A., Schroder, J. C., Jimenez, J. L., Volkamer, R., Blake, D. R., Wisthaler, A., Fried, A., DiGangi, J. P., Diskin, G. S., Pusede, S. E., Hall, S. R., Ullmann, K., Huey, L. G., Tanner, D. J., Dibb, J., Knote, C. J., and Min, K.-E.: Field observational constraints on the controllers in glyoxal (CHOCHO) reactive uptake to aerosol, Atmos. Chem. Phys., 22, 805–821, https://doi.org/10.5194/acp-22-805-2022, 2022.
Kim, H., Zhang, Q., and Heo, J.: Influence of intense secondary aerosol formation and long-range transport on aerosol chemistry and properties in the Seoul Metropolitan Area during spring time: results from KORUS-AQ, Atmos. Chem. Phys., 18, 7149–7168, https://doi.org/10.5194/acp-18-7149-2018, 2018.
Kim, H., Park, R. J., Kim, S., Brune, W. H., Diskin, G. S., Fried, A., Hall, S. R., Weinheimer, A. J., Wennberg, P., Wisthaler, A., Blake, D. R., and Ullmann, K.: Observed versus simulated OH reactivity during KORUS-AQ campaign: Implications for emission inventory and chemical environment in East Asia, Elementa, 10, 1–26, 2022.
Kim, J., Lee, J., Han, J., Choi, J., Kim, D.-G., Park, J., and Lee, G.: Long-term Assessment of Ozone Nonattainment Changes in South Korea Compared to US, and EU Ozone Guidelines, Asian Journal of Atmospheric Environment, 15, 20–32, https://doi.org/10.5572/ajae.2021.098, 2021.
Kim, S., Huey, L. G., Stickel, R. E., Tanner, D. J., Crawford, J. H., Olson, J. R., Chen, G., Brune, W. H., Ren, X., Lesher, R., Wooldridge, P. J., Bertram, T. H., Perring, A., Cohen, R. C., Lefer, B. L., Shetter, R. E., Avery, M., Diskin, G., and Sokolik, I.: Measurement of HO2NO2 in the free troposphere during the Intercontinental Chemical Transport Experiment – North America 2004, J. Geophys. Res.-Atmos., 112, D12S01, https://doi.org/10.1029/2006JD007676, 2007.
Kim, S., Sanchez, D., Wang, M., et al.: OH reactivity in urban and suburban regions in Seoul, South Korea – an East Asian megacity in a rapid transition, Faraday Discuss., 189, 231–251, https://doi.org/10.1039/C5FD00230C, 2016.
KORUS-AQ Science Team: KORUS-AQ DC-8 1 min merged data, NASA Langley Research Center [data set], https://doi.org/10.5067/Suborbital/KORUSAQ/DATA01, 2023.
LaFranchi, B. W., Wolfe, G. M., Thornton, J. A., Harrold, S. A., Browne, E. C., Min, K. E., Wooldridge, P. J., Gilman, J. B., Kuster, W. C., Goldan, P. D., de Gouw, J. A., McKay, M., Goldstein, A. H., Ren, X., Mao, J., and Cohen, R. C.: Closing the peroxy acetyl nitrate budget: observations of acyl peroxy nitrates (PAN, PPN, and MPAN) during BEARPEX 2007, Atmos. Chem. Phys., 9, 7623–7641, https://doi.org/10.5194/acp-9-7623-2009, 2009.
Lee, Y. R., Huey, L. G., Tanner, D. J., Takeuchi, M., Qu, H., Liu, X., Ng, N. L., Crawford, J. H., Fried, A., Richter, D., Simpson, I. J., Blake, D. R., Blake, N. J., Meinardi, S., Kim, S., Diskin, G. S., Digangi, J. P., Choi, Y., Pusede, S. E., Wennberg, P. O., Kim, M. J., Crounse, J. D., Teng, A. P., Cohen, R. C., Romer, P. S., Brune, W., Wisthaler, A., Mikoviny, T., Jimenez, J. L., Campuzano-Jost, P., Nault, B. A., Weinheimer, A., Hall, S. R., and Ullmann, K.: An investigation of petrochemical emissions during KORUS-AQ: Ozone production, reactive nitrogen evolution, and aerosol production, Elementa, 10, 1–24, https://doi.org/10.1525/elementa.2022.00079, 2022.
Ling, Z., Xie, Q., Shao, M., Wang, Z., Wang, T., Guo, H., and Wang, X.: Formation and sink of glyoxal and methylglyoxal in a polluted subtropical environment: observation-based photochemical analysis and impact evaluation, Atmos. Chem. Phys., 20, 11451–11467, https://doi.org/10.5194/acp-20-11451-2020, 2020.
Liu, Y., Yuan, B., Li, X., Shao, M., Lu, S., Li, Y., Chang, C.-C., Wang, Z., Hu, W., Huang, X., He, L., Zeng, L., Hu, M., and Zhu, T.: Impact of pollution controls in Beijing on atmospheric oxygenated volatile organic compounds (OVOCs) during the 2008 Olympic Games: observation and modeling implications, Atmos. Chem. Phys., 15, 3045–3062, https://doi.org/10.5194/acp-15-3045-2015, 2015.
Lyu, X. P., Zeng, L. W., Guo, H., Simpson, I. J., Ling, Z. H., Wang, Y., Murray, F., Louie, P. K. K., Saunders, S. M., Lam, S. H. M., and Blake, D. R.: Evaluation of the effectiveness of air pollution control measures in Hong Kong, Environ. Pollut., 220, 87–94, https://doi.org/10.1016/j.envpol.2016.09.025, 2017.
Ma, P. K., Zhao, Y., Robinson, A. L., Worton, D. R., Goldstein, A. H., Ortega, A. M., Jimenez, J. L., Zotter, P., Prévôt, A. S. H., Szidat, S., and Hayes, P. L.: Evaluating the impact of new observational constraints on P-S/IVOC emissions, multi-generation oxidation, and chamber wall losses on SOA modeling for Los Angeles, CA, Atmos. Chem. Phys., 17, 9237–9259, https://doi.org/10.5194/acp-17-9237-2017, 2017.
Ma, X., Tan, Z., Lu, K., Yang, X., Chen, X., Wang, H., Chen, S., Fang, X., Li, S., Li, X., Liu, J., Liu, Y., Lou, S., Qiu, W., Wang, H., Zeng, L., and Zhang, Y.: OH and HO2 radical chemistry at a suburban site during the EXPLORE-YRD campaign in 2018, Atmos. Chem. Phys., 22, 7005–7028, https://doi.org/10.5194/acp-22-7005-2022, 2022.
Magneron, I., Mellouki, A., Le Bras, G., Moortgat, G. K., Horowitz, A., and Wirtz, K.: Photolysis and OH-Initiated Oxidation of Glycolaldehyde under Atmospheric Conditions, J. Phys. Chem. A, 109, 4552–4561, https://doi.org/10.1021/jp044346y, 2005.
Mao, J., Ren, X., Brune, W. H., Olson, J. R., Crawford, J. H., Fried, A., Huey, L. G., Cohen, R. C., Heikes, B., Singh, H. B., Blake, D. R., Sachse, G. W., Diskin, G. S., Hall, S. R., and Shetter, R. E.: Airborne measurement of OH reactivity during INTEX-B, Atmos. Chem. Phys., 9, 163–173, https://doi.org/10.5194/acp-9-163-2009, 2009.
McDonald, B. C., de Gouw, J. A., Gilman, J. B., Jathar, S. H., Akherati, A., Cappa, C. D., Jimenez, J. L., Lee-Taylor, J., Hayes, P. L., McKeen, S. A., Cui, Y. Y., Kim, S.-W., Gentner, D. R., Isaacman-VanWertz, G., Goldstein, A. H., Harley, R. A., Frost, G. J., Roberts, J. M., Ryerson, T. B., and Trainer, M.: Volatile chemical products emerging as largest petrochemical source of urban organic emissions, Science, 359, 760–764, https://doi.org/10.1126/science.aaq0524, 2018.
Mellouki, A., Wallington, T. J., and Chen, J.: Atmospheric chemistry of oxygenated volatile organic compounds: Impacts on air quality and climate, Chem. Rev., 115, 3984–4014, https://doi.org/10.1021/cr500549n, 2015.
Millet, D. B., Apel, E., Henze, D. K., Hill, J., Marshall, J. D., Singh, H. B., and Tessum, C. W.: Natural and Anthropogenic Ethanol Sources in North America and Potential Atmospheric Impacts of Ethanol Fuel Use, Environ. Sci. Technol., 46, 8484–8492, 2012.
Min, K.-E., Washenfelder, R. A., Dubé, W. P., Langford, A. O., Edwards, P. M., Zarzana, K. J., Stutz, J., Lu, K., Rohrer, F., Zhang, Y., and Brown, S. S.: A broadband cavity enhanced absorption spectrometer for aircraft measurements of glyoxal, methylglyoxal, nitrous acid, nitrogen dioxide, and water vapor, Atmos. Meas. Tech., 9, 423–440, https://doi.org/10.5194/amt-9-423-2016, 2016.
Müller, M., Mikoviny, T., Feil, S., Haidacher, S., Hanel, G., Hartungen, E., Jordan, A., Märk, L., Mutschlechner, P., Schottkowsky, R., Sulzer, P., Crawford, J. H., and Wisthaler, A.: A compact PTR-ToF-MS instrument for airborne measurements of volatile organic compounds at high spatiotemporal resolution, Atmos. Meas. Tech., 7, 3763–3772, https://doi.org/10.5194/amt-7-3763-2014, 2014.
Nault, B. A., Campuzano-Jost, P., Day, D. A., Schroder, J. C., Anderson, B., Beyersdorf, A. J., Blake, D. R., Brune, W. H., Choi, Y., Corr, C. A., de Gouw, J. A., Dibb, J., DiGangi, J. P., Diskin, G. S., Fried, A., Huey, L. G., Kim, M. J., Knote, C. J., Lamb, K. D., Lee, T., Park, T., Pusede, S. E., Scheuer, E., Thornhill, K. L., Woo, J.-H., and Jimenez, J. L.: Secondary organic aerosol production from local emissions dominates the organic aerosol budget over Seoul, South Korea, during KORUS-AQ, Atmos. Chem. Phys., 18, 17769–17800, https://doi.org/10.5194/acp-18-17769-2018, 2018.
Nihill, K. J., Ye, Q., Majluf, F., Krechmer, J. E., Canagaratna, M. R., and Kroll, J. H.: Influence of the Ratio on Oxidation Product Distributions under High-NO Conditions, Environ. Sci. Technol., 55, 6594–6601, https://doi.org/10.1021/acs.est.0c07621, 2021.
Orlando, J. J. and Tyndall, G. S.: Laboratory studies of organic peroxy radical chemistry: an overview with emphasis on recent issues of atmospheric significance, Chem. Soc. Rev., 41, 6294–6317, https://doi.org/10.1039/c2cs35166h, 2012.
Park, R. J., Oak, Y. J., Emmons, L. K., Kim, C. H., Pfister, G. G., Carmichael, G. R., Saide, P. E., Cho, S. Y., Kim, S., Woo, J. H., Crawford, J. H., Gaubert, B., Lee, H. J., Park, S. Y., Jo, Y. J., Gao, M., Tang, B., Stanier, C. O., Shin, S. S., Park, H. Y., Bae, C., and Kim, E.: Multi-model intercomparisons of air quality simulations for the KORUS-AQ campaign, Elementa, 9, 1–29, https://doi.org/10.1525/elementa.2021.00139, 2021.
Perring, A. E., Bertram, T. H., Farmer, D. K., Wooldridge, P. J., Dibb, J., Blake, N. J., Blake, D. R., Singh, H. B., Fuelberg, H., Diskin, G., Sachse, G., and Cohen, R. C.: The production and persistence of ΣRONO2 in the Mexico City plume, Atmos. Chem. Phys., 10, 7215–7229, https://doi.org/10.5194/acp-10-7215-2010, 2010.
Perring, A. E., Pusede, S. E., and Cohen, R. C.: An observational perspective on the atmospheric impacts of alkyl and multifunctional nitrates on ozone and secondary organic aerosol, Chem. Rev., 113, 5848–5870, https://doi.org/10.1021/cr300520x, 2013.
Peterson, D. A., Hyer, E. J., Han, S. O., Crawford, J. H., Park, R. J., Holz, R., Kuehn, R. E., Eloranta, E., Knote, C., Jordan, C. E., and Lefer, B. L.: Meteorology influencing springtime air quality, pollution transport, and visibility in Korea, Elementa, 7, 57, https://doi.org/10.1525/elementa.395, 2019.
Picquet-Varrault, B., Suarez-Bertoa, R., Duncianu, M., Cazaunau, M., Pangui, E., David, M., and Doussin, J.-F.: Photolysis and oxidation by OH radicals of two carbonyl nitrates: 4-nitrooxy-2-butanone and 5-nitrooxy-2-pentanone, Atmos. Chem. Phys., 20, 487–498, https://doi.org/10.5194/acp-20-487-2020, 2020.
Rao, H., Fullana, A., Sidhu, S., and Carbonell-Barrachina, Á. A.: Emissions of volatile aldehydes from heated cooking oils, Food Chem., 120, 59–65, https://doi.org/10.1016/j.foodchem.2009.09.070, 2010.
Ren, X., Duin, D. Van, Cazorla, M., Chen, S., Mao, J., Zhang, L., Brune, W. H., Flynn, J. H., Grossberg, N., Lefer, B. L., Rappenglück, B., Wong, K. W., Tsai, C., Stutz, J., Dibb, J. E., Jobson, B. T., Luke, W. T., and Kelley, P.: Atmospheric oxidation chemistry and ozone production: Results from SHARP 2009 in Houston, Texas, J. Geophys. Res.-Atmos., 118, 5770–5780, https://doi.org/10.1002/jgrd.50342, 2013.
Richter, D., Weibring, P., Walega, J. G., Fried, A., Spuler, S. M., and Taubman, M. S.: Compact highly sensitive multi-species airborne mid-IR spectrometer, Appl. Phys. B, 119, 119–131, https://doi.org/10.1007/s00340-015-6038-8, 2015.
Rosen, R. S., Wood, E. C., Wooldridge, P. J., Thornton, J. A., Day, D. A., Kuster, W., Williams, E. J., Jobson, B. T., and Cohen, R. C.: Observations of total alkyl nitrates during Texas Air Quality Study 2000: Implications for O3 and alkyl nitrate photochemistry, J. Geophys. Res., 109, D07303, https://doi.org/10.1029/2003JD004227, 2004.
Sachse, G. W., Hill, G. F., Wade, L. O., and Perry, M. G.: Fast-Response, High-Precision Carbon Monoxide Sensor using a Tunable Diode Laser Absorption Technique, J. Geophys. Res.-Atmos., 92, 2071–2081, https://doi.org/10.1029/JD092iD02p02071, 1987.
Sai, S., Ho, H., Yu, J. Z., Chu, K. W., Yeung, L. L., Sai, S., Ho, H., Yu, J. Z., Chu, K. W., and Yeung, L. L.: Carbonyl Emissions from Commercial Cooking Sources in Hong Kong Carbonyl Emissions from Commercial Cooking Sources in Hong Kong, J. Air Waste Manage., 56, 1091–1098, https://doi.org/10.1080/10473289.2006.10464532, 2012.
Saunders, S. M., Jenkin, M. E., Derwent, R. G., and Pilling, M. J.: Protocol for the development of the Master Chemical Mechanism, MCM v3 (Part A): tropospheric degradation of non-aromatic volatile organic compounds, Atmos. Chem. Phys., 3, 161–180, https://doi.org/10.5194/acp-3-161-2003, 2003.
Schauer, J. J., Kleeman, M. J., Cass, G. R., and Simoneit, B. R. T.: Measurement of Emissions from Air Organic Compounds from Cooking with Seed Oils, Environ. Sci. Technol., 36, 567–575, https://doi.org/10.1021/es002053m, 2002.
Schroeder, J. R., Crawford, J. H., Ahn, J. Y., Chang, L., Fried, A., Walega, J., Weinheimer, A., Montzka, D. D., Hall, S. R., Ullmann, K., Wisthaler, A., Mikoviny, T., Chen, G., Blake, D. R., Blake, N. J., Hughes, S. C., Meinardi, S., Diskin, G., Digangi, J. P., Choi, Y., Pusede, S. E., Huey, G. L., Tanner, D. J., Kim, M., and Wennberg, P.: Observation-based modeling of ozone chemistry in the Seoul metropolitan area during the Korea-United States Air Quality Study (KORUS-AQ), Elementa, 8, 3, https://doi.org/10.1525/elementa.400, 2020.
Seo, J., Park, D.-S. R., Kim, J. Y., Youn, D., Lim, Y. B., and Kim, Y.: Effects of meteorology and emissions on urban air quality: a quantitative statistical approach to long-term records (1999–2016) in Seoul, South Korea, Atmos. Chem. Phys., 18, 16121–16137, https://doi.org/10.5194/acp-18-16121-2018, 2018.
Shetter, R. E. and Müller, M.: Photolysis frequency measurements using actinic flux spectroradiometry during the PEM-Tropics mission: Instrumentation description and some results, J. Geophys. Res.-Atmos., 104, 5647–5661, https://doi.org/10.1029/98JD01381, 1999.
Simpson, I. J., Blake, D. R., Blake, N. J., Meinardi, S., Barletta, B., Hughes, S. C., Fleming, L. T., Crawford, J. H., Diskin, G. S., Emmons, L. K., Fried, A., Guo, H., Peterson, D. A., Wisthaler, A., Woo, J., Barré, J., Gaubert, B., Kim, J., Kim, M. J., Kim, Y., Knote, C., Mikoviny, T., Sally, E., Schroeder, J. R., Wang, Y., Wennberg, P. O., and Zeng, L.: Characterization, sources and reactivity of volatile organic compounds (VOCs) in Seoul and surrounding regions during KORUS-AQ, Elementa: Science of the Anthropocene, 8, 37, https://doi.org/10.1525/elementa.434, 2020.
Sprengnether, M. M., Demerjian, K. L., Dransfield, T. J., Clarke, J. S., Anderson, J. G., and Donahue, N. M.: Rate Constants of Nine C6–C9 Alkanes with OH from 230 to 379 K: Chemical Tracers for [OH], J. Phys. Chem. A, 113, 5030–5038, https://doi.org/10.1021/jp810412m, 2009.
Tan, Z., Lu, K., Hofzumahaus, A., Fuchs, H., Bohn, B., Holland, F., Liu, Y., Rohrer, F., Shao, M., Sun, K., Wu, Y., Zeng, L., Zhang, Y., Zou, Q., Kiendler-Scharr, A., Wahner, A., and Zhang, Y.: Experimental budgets of OH, HO2, and RO2 radicals and implications for ozone formation in the Pearl River Delta in China 2014, Atmos. Chem. Phys., 19, 7129–7150, https://doi.org/10.5194/acp-19-7129-2019, 2019.
Teng, A. P., Crounse, J. D., Lee, L., St. Clair, J. M., Cohen, R. C., and Wennberg, P. O.: Hydroxy nitrate production in the OH-initiated oxidation of alkenes, Atmos. Chem. Phys., 15, 4297–4316, https://doi.org/10.5194/acp-15-4297-2015, 2015.
Thornton, J. A., Wooldridge, P. J., and Cohen, R. C.: Atmospheric NO2: In-situ laser-induced fluorescence detection at parts per trillion mixing ratios, Anal. Chem., 72, 528–539, https://doi.org/10.1021/ac9908905, 2000.
Travis, K.: F0AM Model setup for Nault et al., 2024 (egusphere-2024-596), Zenodo [code], https://doi.org/10.5281/zenodo.10723227, 2024.
Travis, K. R., Crawford, J. H., Chen, G., Jordan, C. E., Nault, B. A., Kim, H., Jimenez, J. L., Campuzano-Jost, P., Dibb, J. E., Woo, J.-H., Kim, Y., Zhai, S., Wang, X., McDuffie, E. E., Luo, G., Yu, F., Kim, S., Simpson, I. J., Blake, D. R., Chang, L., and Kim, M. J.: Limitations in representation of physical processes prevent successful simulation of PM2.5 during KORUS-AQ, Atmos. Chem. Phys., 22, 7933–7958, https://doi.org/10.5194/acp-22-7933-2022, 2022.
Travis, K. R., Nault, B. A., Crawford, J. H., Bates, K. H., Blake, D. R., Cohen, R. C., Fried, A., Hall, S. R., Huey, L. G., Lee, Y. R., Meinardi, S., Min, K.-E., Simpson, I. J., and Ullman, K.: Impact of improved representation of volatile organic compound emissions and production of NOx reservoirs on modeled urban ozone production, Atmos. Chem. Phys., 24, 9555–9572, https://doi.org/10.5194/acp-24-9555-2024, 2024.
Tuite, K., Thomas, J. L., Veres, P. R., and Roberts, J. M.: Quantifying Nitrous Acid Formation Mechanisms Using Measured Vertical Profiles During the CalNex 2010 Campaign and 1D Column Modeling, J. Geophys. Res.-Atmos., 126, e2021JD034689, https://doi.org/10.1029/2021JD034689, 2021.
von Schneidemesser, E., McDonald, B. C., Denier van der Gon, H., Crippa, M., Guizzardi, D., Borbon, A., Dominutti, P., Huang, G., Jansens-Maenhout, G., Li, M., Ou-Yang, C. F., Tisinai, S., and Wang, J. L.: Comparing Urban Anthropogenic NMVOC Measurements With Representation in Emission Inventories – A Global Perspective, J. Geophys. Res.-Atmos., 128, e2022JD037906, https://doi.org/10.1029/2022JD037906, 2023.
Wang, W., Yuan, B., Peng, Y., Su, H., Cheng, Y., Yang, S., Wu, C., Qi, J., Bao, F., Huangfu, Y., Wang, C., Ye, C., Wang, Z., Wang, B., Wang, X., Song, W., Hu, W., Cheng, P., Zhu, M., Zheng, J., and Shao, M.: Direct observations indicate photodegradable oxygenated volatile organic compounds (OVOCs) as larger contributors to radicals and ozone production in the atmosphere, Atmos. Chem. Phys., 22, 4117–4128, https://doi.org/10.5194/acp-22-4117-2022, 2022.
Wargocki, P., Weschler, J., and Williams, J.: Assessment of aldehyde contributions to PTR-MS 69.07 in indoor air measurements, Environmental Science: Atmospheres, Advance Ar, 3, 1286–1295, https://doi.org/10.1039/d3ea00055a, 2023.
Weinheimer, A. J., Walega, J. G., Ridley, B. A., Gary, B. L., Blake, D. R., Blake, N. J., Rowland, F. S., Sachse, G. W., Anderson, B. E., and Collins, J. E.: Meridional distributions of NOx, NOy, and other species in the lower stratosphere and upper troposphere during AASE II, Geophys. Res. Lett., 21, 2583–2586, https://doi.org/10.1029/94GL01897, 1994.
Whalley, L. K., Stone, D., Bandy, B., Dunmore, R., Hamilton, J. F., Hopkins, J., Lee, J. D., Lewis, A. C., and Heard, D. E.: Atmospheric OH reactivity in central London: observations, model predictions and estimates of in situ ozone production, Atmos. Chem. Phys., 16, 2109–2122, https://doi.org/10.5194/acp-16-2109-2016, 2016.
Whalley, L. K., Stone, D., Dunmore, R., Hamilton, J., Hopkins, J. R., Lee, J. D., Lewis, A. C., Williams, P., Kleffmann, J., Laufs, S., Woodward-Massey, R., and Heard, D. E.: Understanding in situ ozone production in the summertime through radical observations and modelling studies during the Clean air for London project (ClearfLo), Atmos. Chem. Phys., 18, 2547–2571, https://doi.org/10.5194/acp-18-2547-2018, 2018.
Whalley, L. K., Slater, E. J., Woodward-Massey, R., Ye, C., Lee, J. D., Squires, F., Hopkins, J. R., Dunmore, R. E., Shaw, M., Hamilton, J. F., Lewis, A. C., Mehra, A., Worrall, S. D., Bacak, A., Bannan, T. J., Coe, H., Percival, C. J., Ouyang, B., Jones, R. L., Crilley, L. R., Kramer, L. J., Bloss, W. J., Vu, T., Kotthaus, S., Grimmond, S., Sun, Y., Xu, W., Yue, S., Ren, L., Acton, W. J. F., Hewitt, C. N., Wang, X., Fu, P., and Heard, D. E.: Evaluating the sensitivity of radical chemistry and ozone formation to ambient VOCs and NOx in Beijing, Atmos. Chem. Phys., 21, 2125–2147, https://doi.org/10.5194/acp-21-2125-2021, 2021.
Wolfe, G. M., Marvin, M. R., Roberts, S. J., Travis, K. R., and Liao, J.: The Framework for 0-D Atmospheric Modeling (F0AM) v3.1, Geosci. Model Dev., 9, 3309–3319, https://doi.org/10.5194/gmd-9-3309-2016, 2016.
Wooldridge, P. J., Perring, A. E., Bertram, T. H., Flocke, F. M., Roberts, J. M., Singh, H. B., Huey, L. G., Thornton, J. A., Wolfe, G. M., Murphy, J. G., Fry, J. L., Rollins, A. W., LaFranchi, B. W., and Cohen, R. C.: Total Peroxy Nitrates (ΣPNs) in the atmosphere: the Thermal Dissociation-Laser Induced Fluorescence (TD-LIF) technique and comparisons to speciated PAN measurements, Atmos. Meas. Tech., 3, 593–607, https://doi.org/10.5194/amt-3-593-2010, 2010.
Xu, Y., Feng, X., Chen, Y., Zheng, P., Hui, L., Chen, Y., Yu, J. Z., and Wang, Z.: Development of an enhanced method for atmospheric carbonyls and characterizing their roles in photochemistry in subtropical Hong Kong, Sci. Total Environ., 896, 165135, https://doi.org/10.1016/j.scitotenv.2023.165135, 2023.
Yang, G., Huo, J., Wang, L., Wang, Y., Wu, S., Yao, L., Fu, Q., and Wang, L.: Total OH Reactivity Measurements in a Suburban Site of Shanghai J, J. Geophys. Res.-Atmos., 127, 1–20, https://doi.org/10.1029/2021JD035981, 2022.
Yeh, G. K. and Ziemann, P. J.: Alkyl nitrate formation from reactions of C8–C14 n-alkanes with OH radicals in the presence of NOx: Measured yields with essential corrections for gas-wall partitioning, J. Phys. Chem. A, 118, 8147–8157, https://doi.org/10.1021/jp500631v, 2014.
Yeo, M. J. and Kim, Y. P.: Long-term trends of surface ozone in Korea, J. Clean. Prod., 294, 125352, https://doi.org/10.1016/j.jclepro.2020.125352, 2021.
Yuan, B., Shao, M., de Gouw, J., Parrish, D. D., Lu, S., Wang, M., Zeng, L., Zhang, Q., Song, Y., Zhang, J., and Hu, M.: Volatile organic compounds (VOCs) in urban air: How chemistry affects the interpretation of positive matrix factorization (PMF) analysis, J. Geophys. Res.-Atmos., 117, D24302, https://doi.org/10.1029/2012JD018236, 2012.
Zare, A., Romer, P. S., Nguyen, T., Keutsch, F. N., Skog, K., and Cohen, R. C.: A comprehensive organic nitrate chemistry: insights into the lifetime of atmospheric organic nitrates, Atmos. Chem. Phys., 18, 15419–15436, https://doi.org/10.5194/acp-18-15419-2018, 2018.
Zhao, Y., Hennigan, C. J., May, A. A., Tkacik, D. S., De Gouw, J. A., Gilman, J. B., Kuster, W. C., Borbon, A., and Robinson, A. L.: Intermediate-volatility organic compounds: A large source of secondary organic aerosol, Environ. Sci. Technol., 48, 13743–13750, https://doi.org/10.1021/es5035188, 2014.
Zheng, W., Flocke, F. M., Tyndall, G. S., Swanson, A., Orlando, J. J., Roberts, J. M., Huey, L. G., and Tanner, D. J.: Characterization of a thermal decomposition chemical ionization mass spectrometer for the measurement of peroxy acyl nitrates (PANs) in the atmosphere, Atmos. Chem. Phys., 11, 6529–6547, https://doi.org/10.5194/acp-11-6529-2011, 2011.
Zhou, Z., Tan, Q., Deng, Y., Song, D., Wu, K., Zhou, X., Huang, F., Zeng, W., and Lu, C.: Compilation of emission inventory and source profile database for volatile organic compounds: A case study for Sichuan, China, Atmos. Pollut. Res., 11, 105–116, https://doi.org/10.1016/j.apr.2019.09.020, 2020.
- Abstract
- Introduction
- Method and data description
- Observational constraints on NOx organic oxidation chemistry
- Observational constraints of the HOx and Ox budget over the SMA
- Conclusions and implications
- Code and data availability
- Author contributions
- Competing interests
- Disclaimer
- Acknowledgements
- Financial support
- Review statement
- References
- Supplement
Please read the editorial note first before accessing the article.
- Article
(908 KB) - Full-text XML
- Companion paper
-
Supplement
(1305 KB) - BibTeX
- EndNote
- Abstract
- Introduction
- Method and data description
- Observational constraints on NOx organic oxidation chemistry
- Observational constraints of the HOx and Ox budget over the SMA
- Conclusions and implications
- Code and data availability
- Author contributions
- Competing interests
- Disclaimer
- Acknowledgements
- Financial support
- Review statement
- References
- Supplement