the Creative Commons Attribution 4.0 License.
the Creative Commons Attribution 4.0 License.
 | 29 Aug 2024
Impact of improved representation of volatile organic compound emissions and production of NOx reservoirs on modeled urban ozone production
Katherine R. Travis
Benjamin A. Nault
James H. Crawford
Kelvin H. Bates
Donald R. Blake
Ronald C. Cohen
Alan Fried
Samuel R. Hall
L. Gregory Huey
Young Ro Lee
Simone Meinardi
Kyung-Eun Min
Isobel J. Simpson
Kirk Ullman
The fraction of urban volatile organic compound (VOC) emissions attributable to fossil fuel combustion has been declining in many parts of the world, resulting in a need to better constrain other anthropogenic sources of these emissions. During the National Institute of Environmental Research (NIER) and National Aeronautics and Space Administration (NASA) Korea-United States Air Quality (KORUS-AQ) field study in Seoul, South Korea, during May–June 2016, air quality models underestimated ozone, formaldehyde, and peroxyacetyl nitrate (PAN), indicating an underestimate of VOCs in the emissions inventory. Here, we use aircraft observations interpreted with the GEOS-Chem chemical transport model (version 13.4.0) to assess the need for increases in VOC emissions and for a revised chemical mechanism to improve treatment of VOC speciation and chemistry. We find that the largest needed VOC emissions increases are attributable to compounds associated with volatile chemical products, liquefied petroleum gas (LPG) and natural gas emissions, and long-range transport. Revising model chemistry to better match observed VOC speciation together with increasing model emissions of underestimated VOC species increased calculated OH reactivity by +2 s−1 and ozone production by +2 ppb h−1. Ozone increased by +6 ppb below 2 km and +9 ppb at the surface, and formaldehyde and acetaldehyde increased by +30 % and +120 % aloft, respectively, all in better agreement with observations. The larger increase in acetaldehyde was attributed to ethanol emissions, which we found to be as important for ozone production as isoprene or alkenes. The increased acetaldehyde significantly reduced the model PAN bias. The need for additional unmeasured VOCs, however, was indicated by a remaining model bias of −0.8 ppb in formaldehyde and a −57 % and −52 % underestimate in higher peroxynitrates (PNs) and alkyl nitrates (ANs), respectively. We added additional chemistry to the model to represent an additional six PNs from observed VOCs but were unable to account for the majority of missing PNs. However, four of these PNs were modeled at concentrations similar to other commonly measured PNs (> 2 % of PAN) indicating that these should be measured in future campaigns and considered from other VOC emission sources (e.g., fires). We hypothesize that emissions of oxygenated VOCs (OVOCs) such as ≥ C5 aldehydes from cooking and/or alkenes associated with volatile chemical products could produce both PNs and ANs and improve remaining model biases. Emerging research on the emissions and chemistry of these species will soon allow for modeling of their impact on local and regional photochemistry.
- Article
(3697 KB) - Full-text XML
- Companion paper
-
Supplement
(1646 KB) - BibTeX
- EndNote


Ozone pollution in urban areas may be limited by availability of nitrogen oxides (NOx) or volatile organic compounds (VOCs). Emissions inventories of VOCs are more difficult to estimate than for NOx due to the large number of compounds that must be included and the lack of measurements of many of these species. In general, VOC emission inventories have been shown to perform poorly around the globe against observations (von Schneidemesser et al., 2023; Rowlinson et al., 2023). Non-combustion sources such as volatile chemical product (VCP) emissions are becoming a larger fraction of urban VOC emissions in many cities and have only recently become a focus of emissions inventory development (McDonald et al., 2018; Coggon et al., 2021). In some cities, non-combustion anthropogenic emissions of VOCs from diverse products and processes may be equivalent to or greater than motor vehicle emissions (Khare and Gentner, 2018; McDonald et al., 2018; Simpson et al., 2020). This has implications for simulating ozone production in cities where ozone production is VOC-limited, including several US cities (Koplitz et al., 2021) and across much of East Asia (Lee et al., 2021).
The joint National Institute of Environmental Research (NIER) and National Aeronautics and Space Administration (NASA) Korea-United States Air Quality (KORUS-AQ) field study in May–June 2016 (Crawford et al., 2021) presented an opportunity to better constrain VOC emissions and VOC-limited ozone chemistry in East Asia, with a focus on South Korea and eastern China. Observations included airborne measurements using the NASA DC-8 aircraft and ground-based measurements at the Olympic Park supersite in Seoul. The suite of models run for this campaign generally underestimated ozone and formaldehyde, a common oxidation product of VOCs, suggesting underestimation of VOCs in the emissions inventory (Park et al., 2021). Models also underestimated peroxyacetyl nitrate (PAN), a product of VOC oxidation in the presence of NOx and a reservoir for ozone precursors that can be transported long distances from source regions (Wolfe et al., 2007; Bertram et al., 2013). This has implications for the ability of models to attribute the relative impact of upwind vs. local emissions on downwind pollution.
Several studies have discussed model biases in ozone and formaldehyde concentrations in East Asia. Kim et al. (2022) showed that modeled VOCs significantly underestimated the overall OH reactivity during KORUS-AQ, indicating that modeled ozone production was underestimated. Gaubert et al. (2020) found that persistent underestimates in modeled carbon monoxide (CO) in both South Korea and China were partially responsible for the modeled ozone underestimate in both locations. Miyazaki et al. (2019) assimilated multiple species observed from satellite observations including CO and PAN into a model, which improved performance for ozone but not formaldehyde, indicating that the assimilation was missing a correction for underestimated VOCs. Choi et al. (2022) used satellite formaldehyde observations to improve modeled VOCs and ozone, but biases still remained, likely due to remaining errors in CO emissions and VOC emission speciation. Using airborne remote sensing formaldehyde data, Kwon et al. (2021) found differences in the KORUS-AQ anthropogenic VOC emissions inventory of up to a factor of 6.9, although they were limited by their sparse observational dataset. Kim et al. (2024) also discussed the importance of detailed VOC observations to constraining ozone precursors, as errors in biogenic emissions in urban areas can result in better agreement with ozone observations for the wrong reasons. This study also found that modeled CO was underestimated over both China and South Korea, and large increases were needed in both CO and VOCs to improve model simulations.
Studies have paid less attention to model underestimates of specific VOCs, errors in model VOC speciation, and the underestimate of PAN. For example, ethanol, a major PAN precursor (Fischer et al., 2014), was not included in the KORUS-AQ emissions inventory but has been measured at high concentrations in East Asia (Kim et al., 2016; Wu et al., 2020). Yang et al. (2023) performed modeling of South Korea with an inventory for volatile chemical products and found that this source greatly increased simulated ethanol, methanol, and acetone. However, this study's scope did not include a detailed comparison against observations or their oxidation products such as acetaldehyde or PAN. In addition to missing PAN precursors, models generally simulate few other peroxynitrate (PN) species. Lee et al. (2022) used a box model of observed VOCs during KORUS-AQ to estimate that PNs other than PAN and peroxypropionyl nitrate (PPN) could be up to 40 % of total peroxy acyl nitrates (∑PNs), in contrast to previous findings that this fraction is less than 20 % (Wooldridge et al., 2010). In a study of a petrochemical region of Korea, the major PNs identified by Lee et al. (2022) were produced from oxidation of 1,3-butadiene and glycolaldehyde, but this chemistry is not included in most atmospheric chemistry models. Alkyl nitrates (ANs) are another reservoir of NOx produced during VOC oxidation that competes with ozone production in urban regions and can serve as an ozone source downwind (Perring et al., 2010; Farmer et al., 2011). Total ANs (∑ANs) were underestimated by −50 % in models during KORUS-AQ (Park et al., 2021).
Nault et al. (2024) showed that in the Seoul Metropolitan Area (SMA) ∑PNs accounted for 33 % of observed NOz ( + ∑ANs + HNO3 + aerosol nitrate), where only 50 % of ∑PNs was PAN. ∑ANs were 10 % of observed NOz with only ∼ 20 % of ∑ANs accounted for by speciated observations. This is similar to the finding of Kenagy et al. (2021) that their model could only account for 30 % of ∑ANs across all data (not just the SMA) collected during KORUS-AQ. Nault et al. (2024) found that between 20 % and 70 % of the PAN precursor budget was attributable to ethanol, depending on proximity to the emissions source. Additional higher peroxy acyl nitrates (PNs) were shown to be produced by observed VOCs including glycolaldehyde, aromatics, monoterpenes, 1,3-butadiene, and methyl ethyl ketone (MEK). Here, we use the KORUS-AQ aircraft observations of ozone–NOx–VOC chemistry interpreted with the GEOS-Chem chemical transport model to assess underestimated modeled VOCs on a species-by-species basis, and determine the impact on model biases in ozone, formaldehyde, ∑PNs, and ∑ANs. We build on the findings of Nault et al. (2024) to add additional chemistry to the model to form higher PNs from observed VOCs and assess indicators of additional missing sources of VOCs to close remaining biases in ozone, formaldehyde, ∑PNs, and ∑ANs.
The KORUS-AQ campaign took place from 1 May to 10 June 2016 in Seoul, South Korea (Crawford et al., 2021). KORUS-AQ was a joint field campaign organized by South Korea's National Institute of Environmental Research (NIER) and the United States National Aeronautics and Space Administration (NASA). The campaign included 20 flights using the NASA DC-8 aircraft, which performed 55 missed approaches at multiple times per day over the heavily instrumented Olympic Park supersite in Seoul. Ground-based ozone and NO2 observations were available from the NIER's AirKorea monitoring network including locations near Olympic Park. Crawford et al. (2021) provide a full listing of all observations made during KORUS-AQ. Table 1 describes the aircraft and ground observations used in this work.
Table 1Description of the ground site and aircraft observations used in this work1 NA stands for not available.
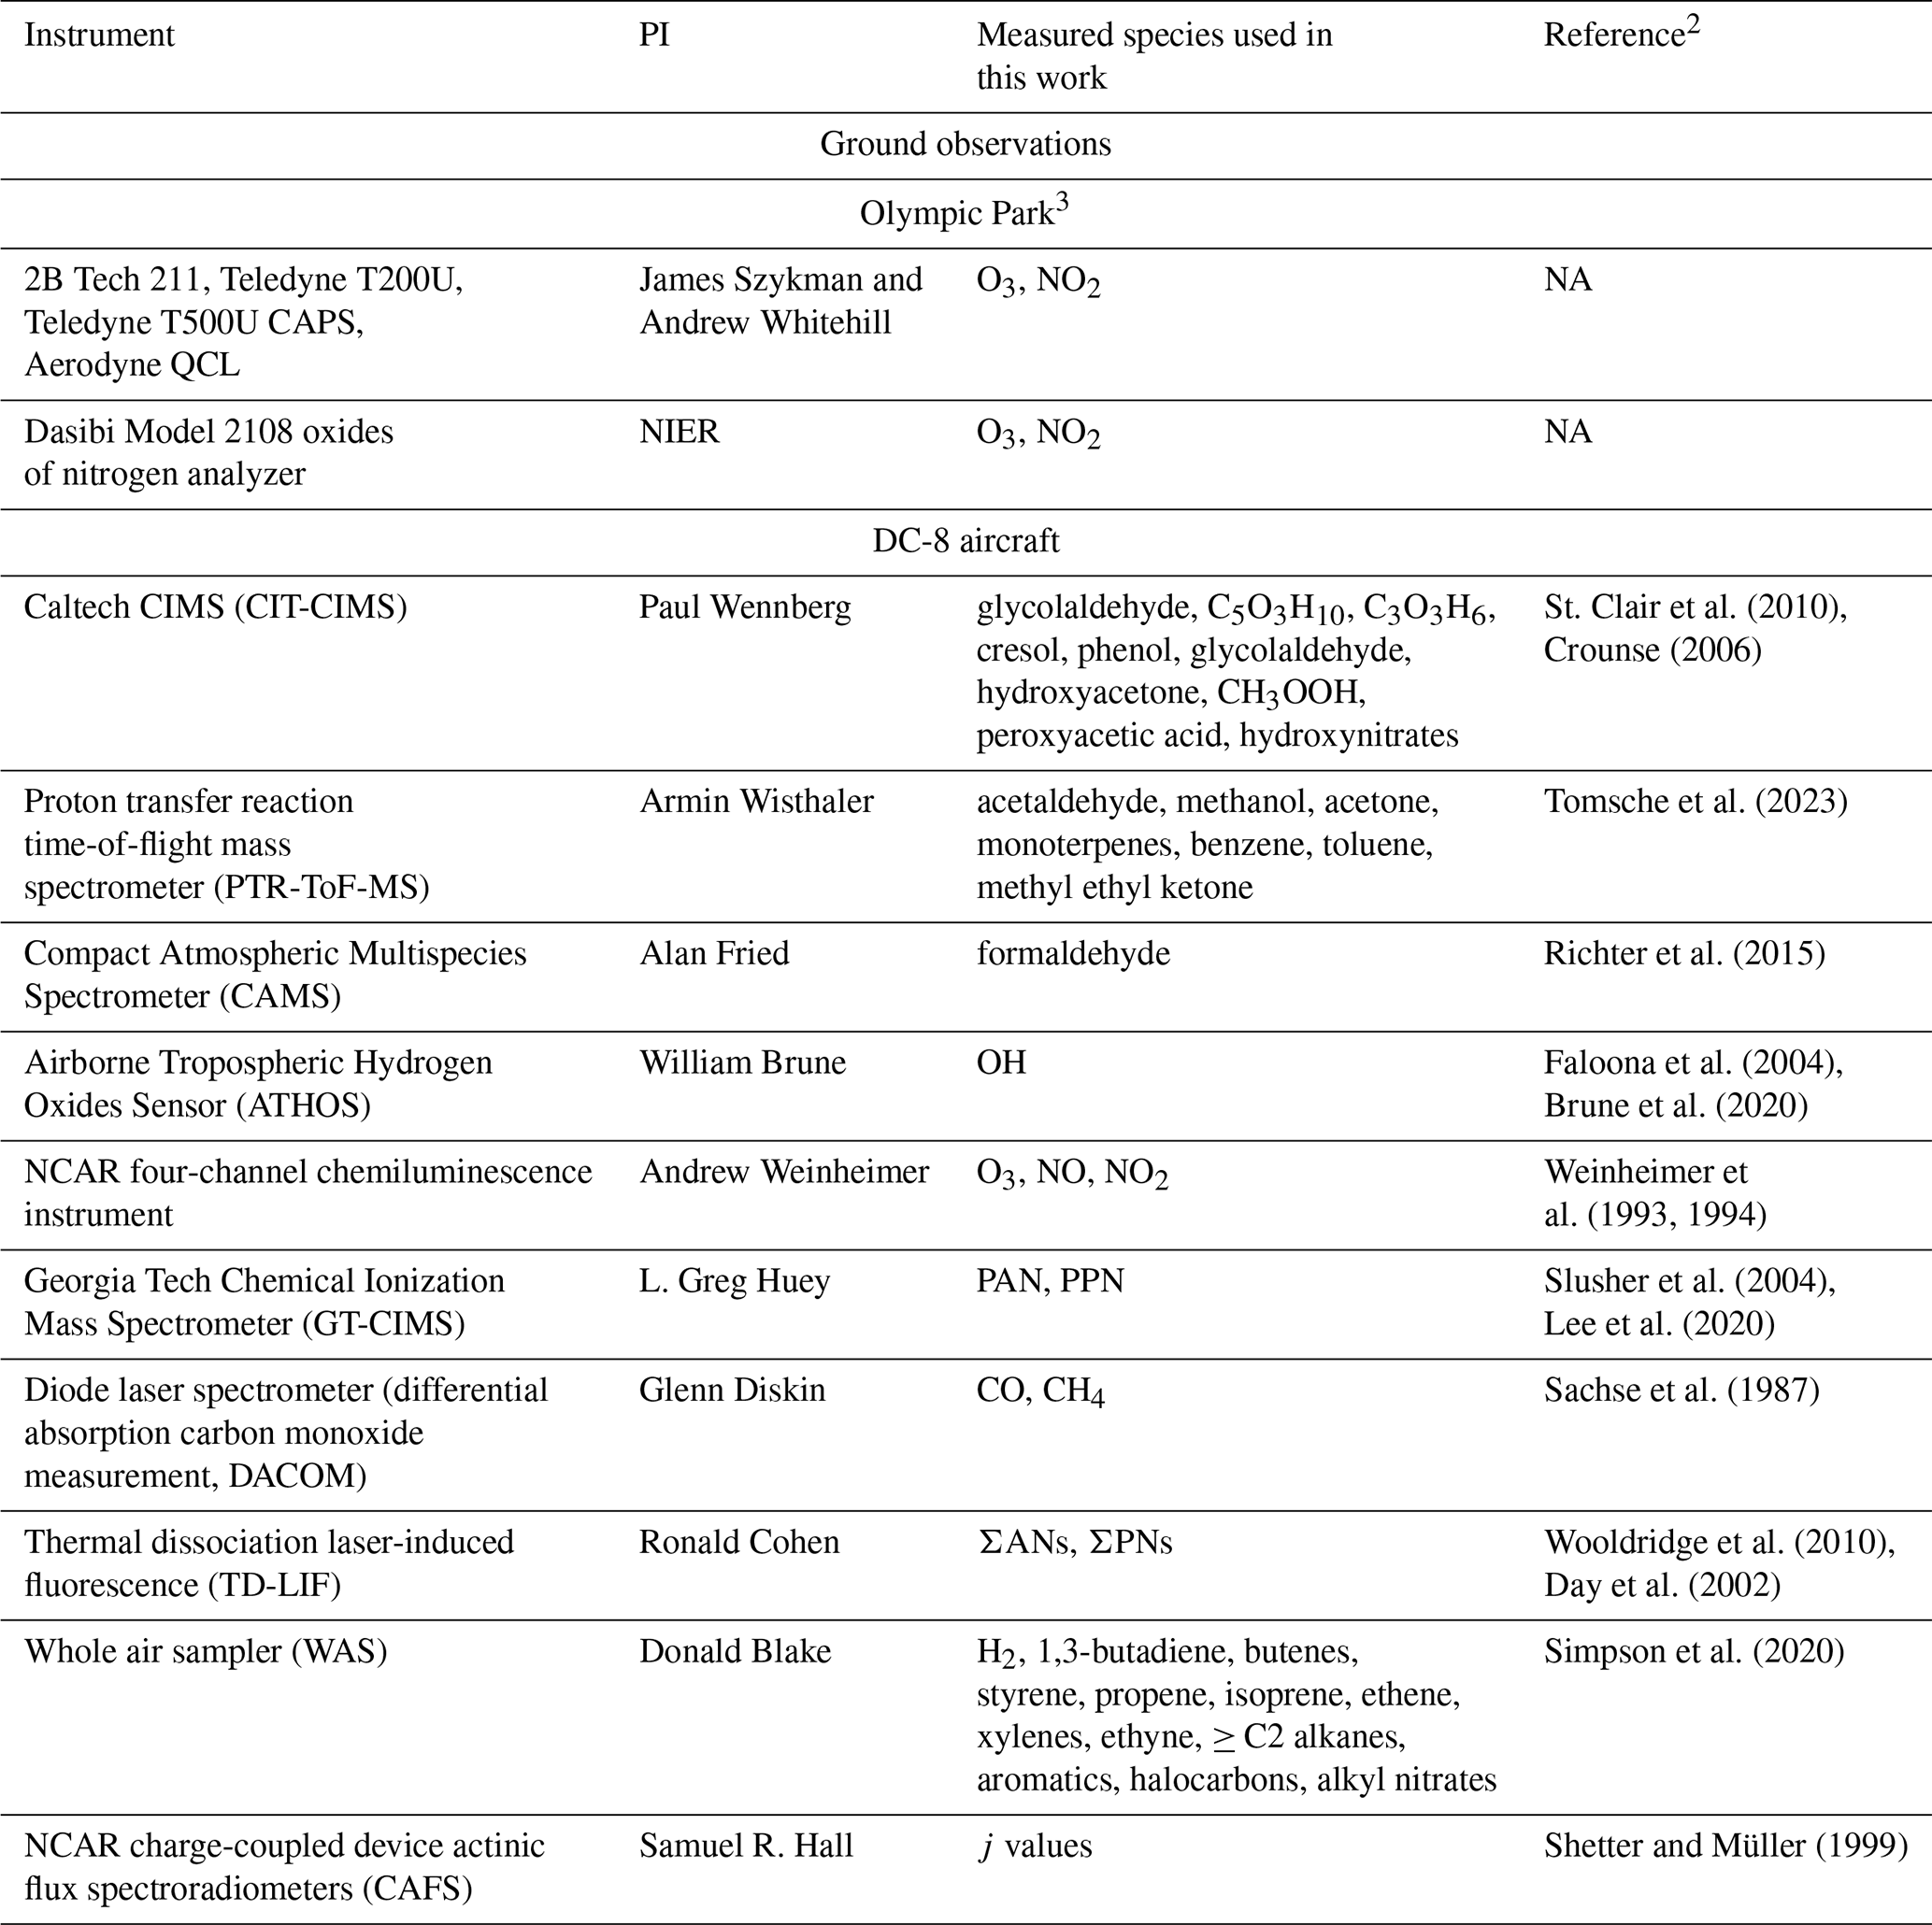
1 For a full description of all KORUS-AQ observations, see Crawford et al. (2021).
2 For specific measurement descriptions including uncertainty information, see the KORUS-AQ data archive (https://doi.org/10.5067/Suborbital/KORUSAQ/DATA01, Chen, 2018).
3 Olympic Park site in Seoul (37.522° N, 127.124° E).
KORUS-AQ did not measure ethanol concentrations either from aircraft or ground-based instruments. During the MAPS-Seoul campaign in May–June 2015, Kim et al. (2016) measured concentrations at Olympic Park of methanol and ethanol of 11.1 and 3.9 ppb, respectively. Wu et al. (2020) measured methanol at 11.4 ppb and ethanol at 5.6 ppb at Guangzhou in China in September–November 2018. We used these observations to estimate that ethanol was equivalent to methanol 2.5 as was done in Schroeder et al. (2020). In the US, similar ratios were observed in the northeast (Sommariva et al., 2011), and even higher levels of ethanol than methanol have been observed in California (de Gouw et al., 2018).
We used the GEOS-Chem chemical transport model version 13.4.0 (https://doi.org/10.5281/zenodo.6511970, The International GEOS-Chem User Community, 2022) described in Travis et al. (2022) with modifications described below to VOC speciation and chemistry. Kim et al. (2022) showed that the model had errors in OH reactivity during KORUS-AQ of ∼ 34 % for ≥ C4 alkanes (ALK4) due to lumping. Alkanes with larger carbon numbers (e.g., n-hexane) are more reactive than ALK4, which is parameterized in the model as a butane/pentane mixture (Lurmann et al., 1986). We added a new lumped species for ≥ C6 alkanes, ALK6, with associated chemistry including the formation of a lumped alkyl nitrate species according to Lurmann et al. (1986).
GEOS-Chem includes chemistry for the aromatic species benzene, toluene, and xylenes. Significant effort was made during KORUS-AQ to improve emissions estimates of these species, particularly toluene, which was determined to be a major contributor to chemistry in the SMA (Schroeder et al., 2020; Simpson et al., 2020). However, emissions improvements did not take into consideration the fraction of ethylbenzene (EBZ) or trimethylbenzene (TMB) in modeled aromatic emissions, both of which are more reactive than benzene or toluene. Similarly, the styrene (STYR) fraction of emitted olefines (alkenes) was not considered. KORUS-AQ measurements included observations of EBZ, TMB, and STYR (Simpson et al., 2020). Emitted olefins also include a fraction of 1,3-butadiene (C4H6), especially from petrochemical facilities in western Korea, which were identified by Lee et al. (2022) as a source of PNs through production of peroxyacrylic nitric anhydride (APAN). The 1,3-butadiene mixing ratios were over 3 ppb near the petrochemical facilities although the maximum levels in Seoul were much lower at < 200 pptv (Simpson et al., 2020). We added chemistry for STYR, EBZ, and TMB from Bates et al. (2021) and for C4H6 from the MCMv3.3.1 (Jenkin et al., 1997; Saunders et al., 2003). Finally, we included updated monoterpene chemistry that is a condensation of the mechanism from the MCMv3.3.1 (Saunders et al., 2003), including production of aldehydes that could form PNs such as pinonaldehyde. Tables S1 and S2 in the Supplement provide the new model chemistry implementation.
Table 2 shows the VOC emission species in the KORUSv5 inventory, which was developed by Konkuk University for the campaign, speciated according to the SAPRC99 mechanism. We translated this mechanism to the GEOS-Chem model for the base chemistry, and updated chemistry, according to Carter (1999) with the exception of ARO1, which was speciated based on observations as discussed in Travis et al. (2022). We specifically re-speciated base model emissions for ALK4 into ALK4 and ALK6; emissions for PRPE into PRPE, C4H6, and STYR; emissions for benzene and toluene into benzene, toluene, and EBZ; and emissions of xylenes into xylenes and TMB. The KORUSv5 inventory does not include ethanol emissions, which we took from the Community Emissions Data System (CEDS) inventory described in (McDuffie et al., 2020).
Table 2Speciation of SAPRC991 for GEOS-Chem2.
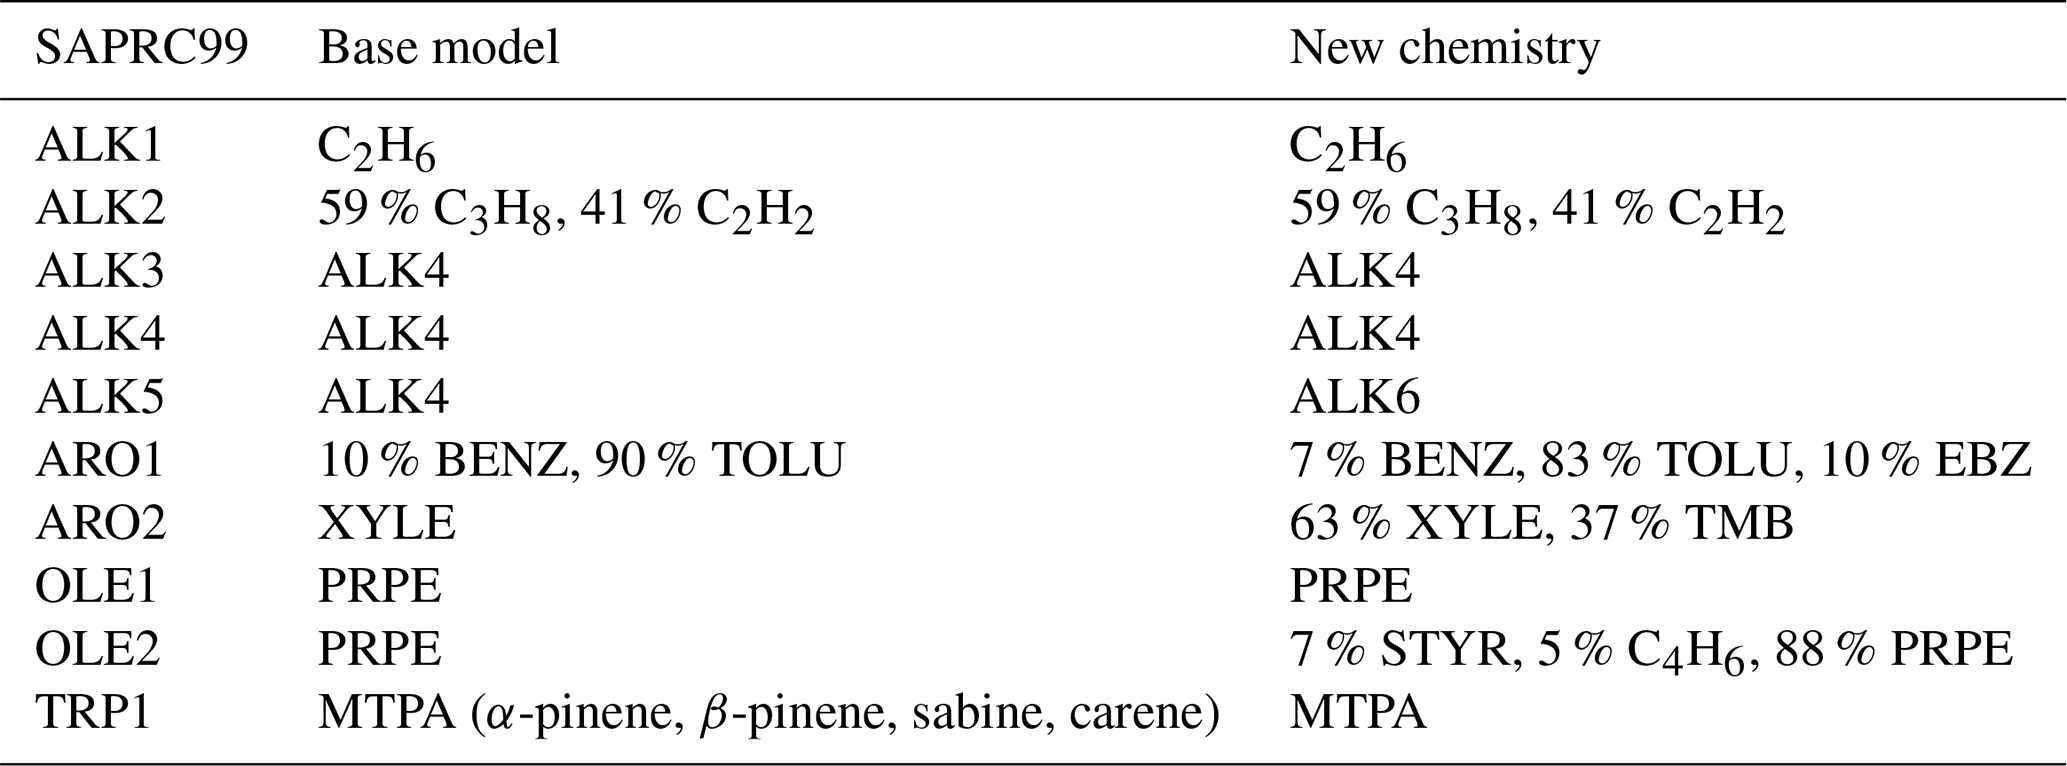
1 Definitions of SAPRC99 species are given in Carter (1999).
2 Definitions of GEOS-Chem species are given in species_database.yml in The International GEOS-Chem User Community (2022), with some details in Tables 3 and S1.
Figure S1 in the Supplement shows model and observed mean vertical profiles in the SMA for the key species identified by Schroeder et al. (2020) for ozone production (C7+ aromatics, isoprene, alkenes, methanol), additional species identified by Nault et al. (2024) for PAN and PN production (ethanol, monoterpenes, methyl ethyl ketone (MEK)), and CO, identified as an additional source of model errors in ozone chemistry during the campaign (Gaubert et al., 2020). Fried et al. (2020) found that emissions of the top producers of formaldehyde, particularly propene and ethene, were underestimated by the KORUSv5 emissions inventory over the industrial area to the southwest of Seoul. We did not find these species to be underestimated in the SMA. Figure S1 shows that model underestimates in CO and VOCs range from more than −70 % (methanol, ethanol, propane, MEK, monoterpenes) to −30 % to −50 % (acetone, ALK4, benzene, CO, acetylene, ethylbenzene, toluene, xylenes). We applied scaling factors to the individual KORUSv5 VOC emissions over South Korea until modeled concentrations matched average observations below 2 km within 30 % or better (Table S3). The one exception is trimethylbenzenes, where we improved the model bias from +93 % to only −43 %, but the absolute bias was < 10 ppt. Ethanol was scaled from the emissions in the CEDS inventory. For species with lifetimes long enough to be transported from upwind (e.g., acetone, CO) some of the model bias may be due to underestimated emissions from other countries. Here, we only scaled South Korean emissions given the lack of constraints on emissions upwind. Table 3 provides the applied scale factor for each species. Figure S1 shows the model with applied scaling factors for each scaled species, which shows significantly improved comparison with observations. Given the difficulty of achieving perfect scaling factors to achieve model agreement across this large suite of VOCs and the likelihood that some scale factors are needed for upwind emissions, we present these scale factors not as exact values that need to be implemented in emissions inventories but rather strong indicators of missing sources that need further study.
Table 3Scale factors for modeled anthropogenic VOC and CO emissions.
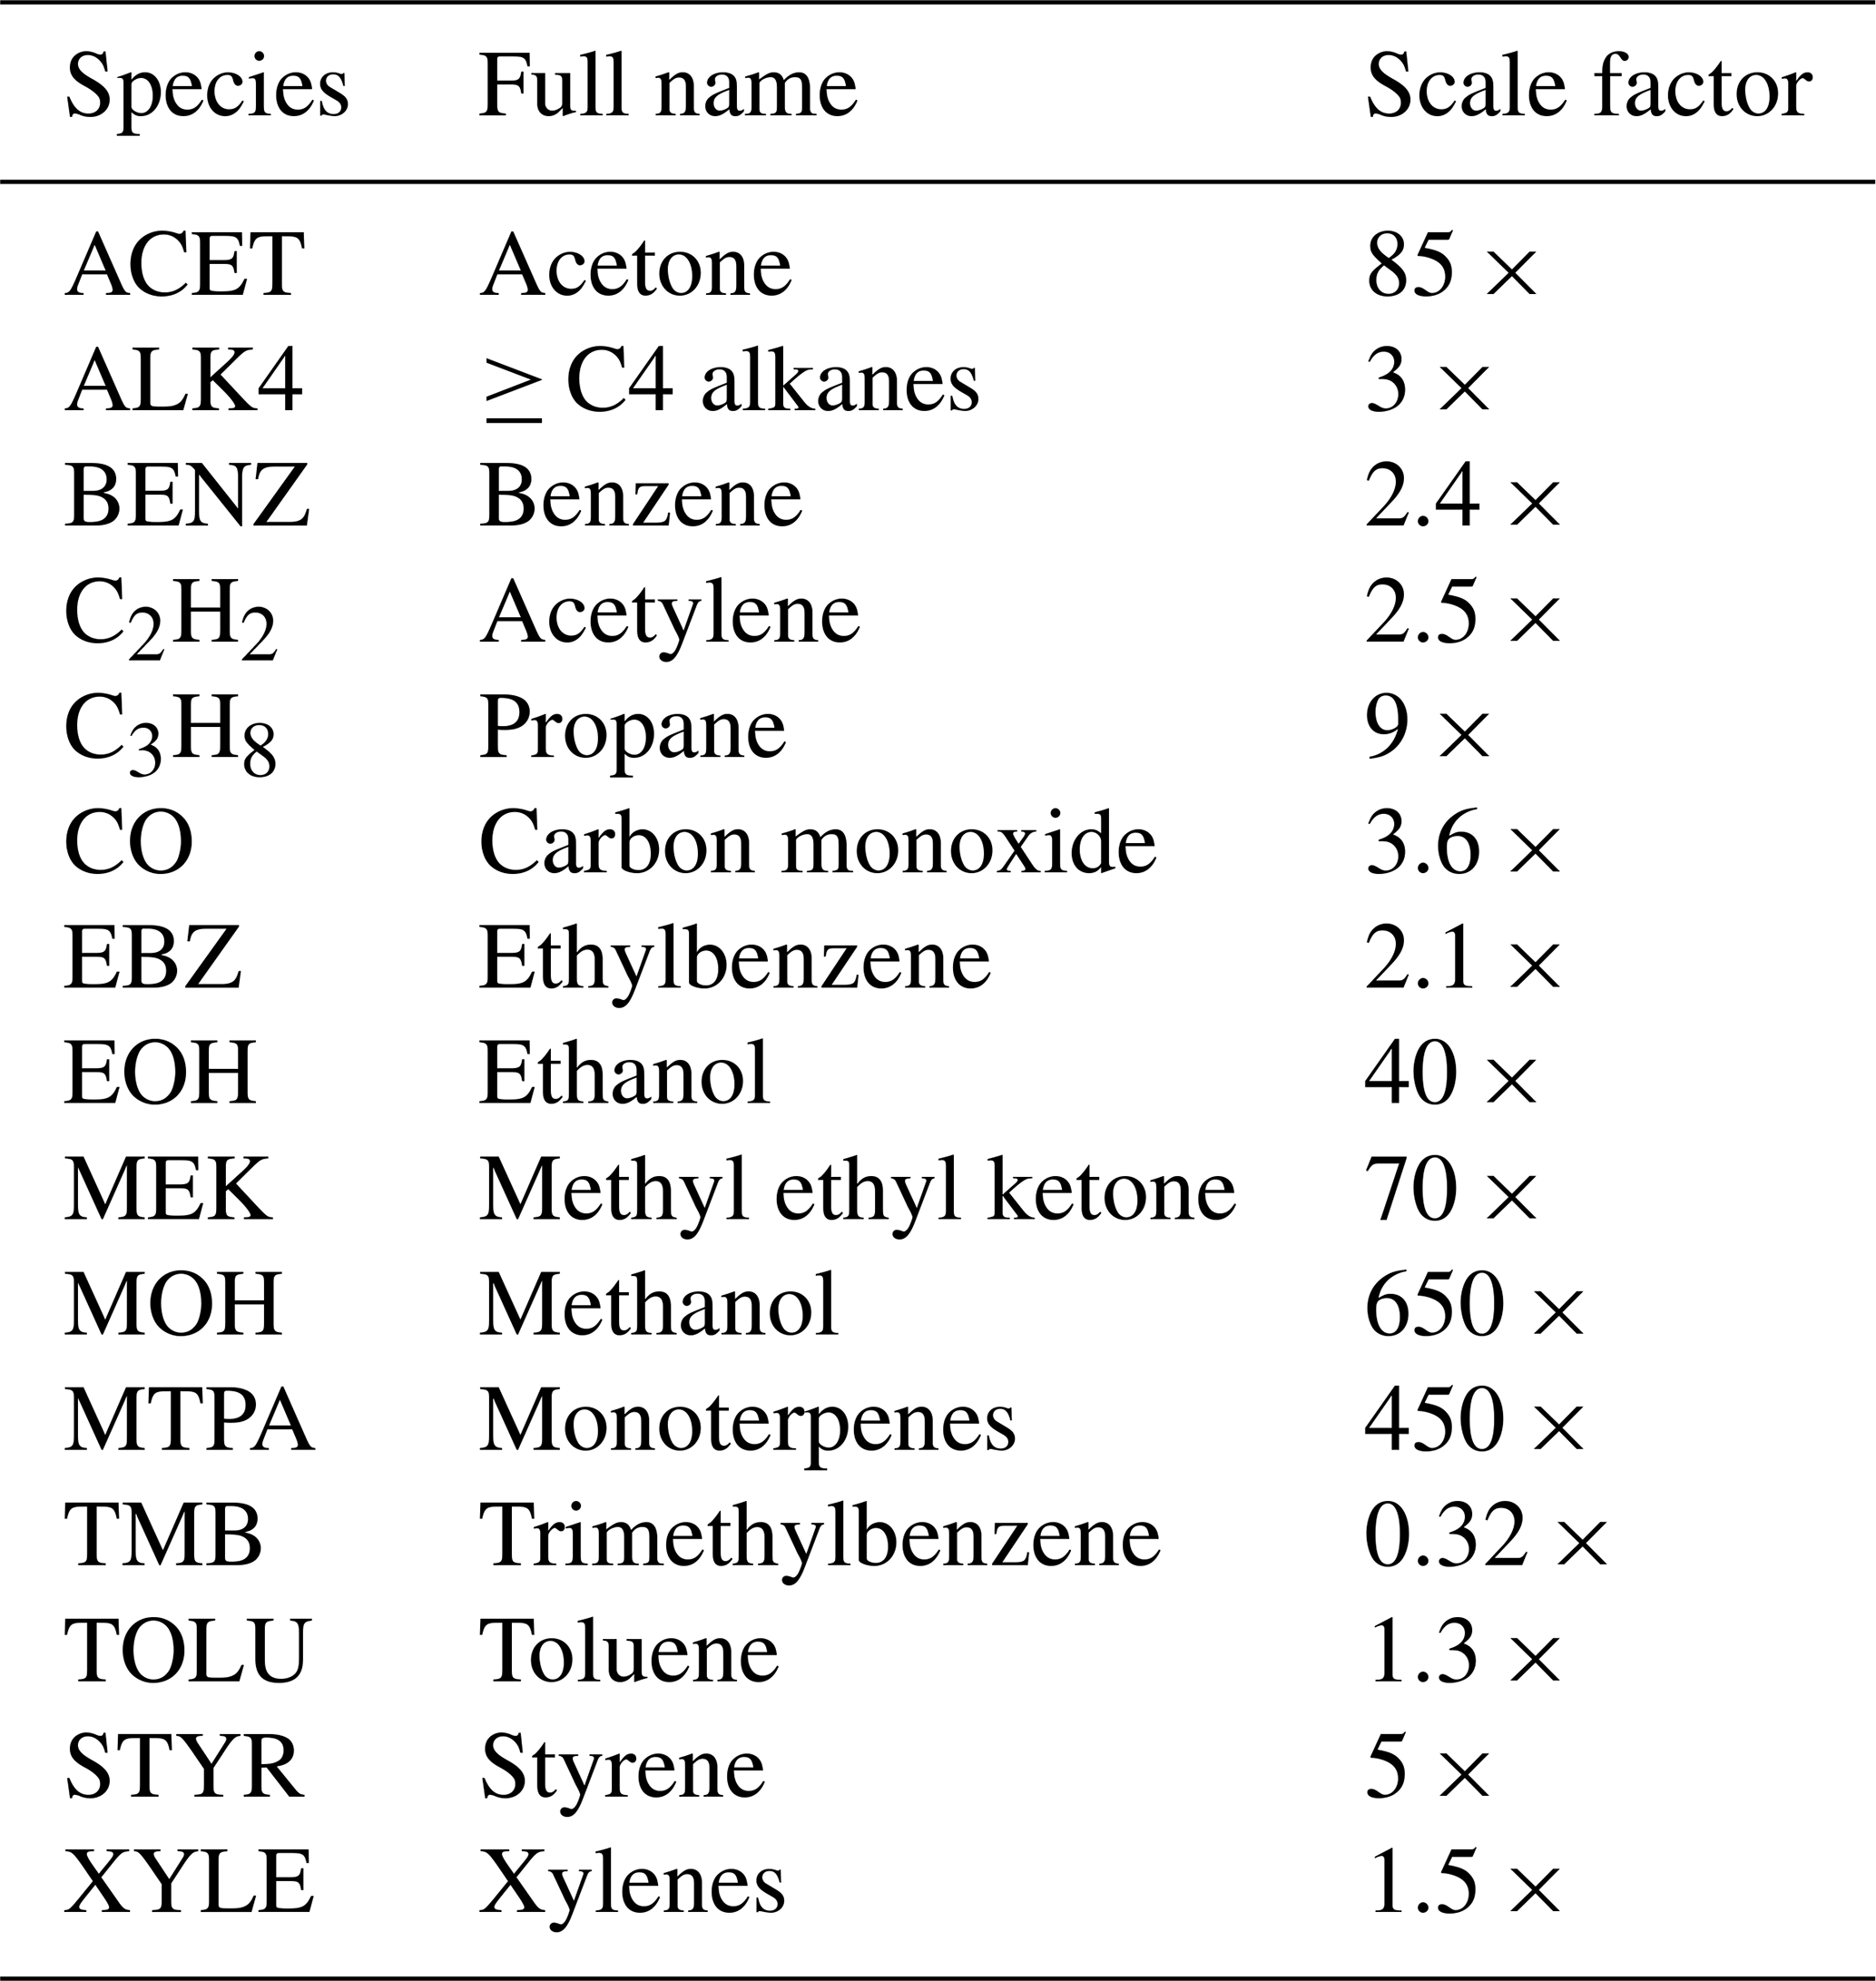
The largest scaling factor (650 ×) was required for methanol (Table 3), which averaged 20 ppb in the observations but only 2 ppb in the base model. Given the relatively long lifetime of methanol (∼ 5 d), we expect that this very large anthropogenic scaling factor is needed to account for underestimated emissions both upwind in China and in South Korea and for the contribution of biogenic methanol to model concentrations. According to Simpson et al. (2020), methanol in the SMA correlated well with ethylbenzene, suggesting that the missing anthropogenic source is from solvent emissions. Underestimated solvent emissions may also be the reason for underestimated model xylenes and ethylbenzene (Simpson et al., 2020). The second largest scaling factor was for monoterpenes (450 ×), which averaged 50 ppt in the observations but 15 ppt in the base model. This large scaling factor is needed to account for the minimal anthropogenic emissions in the model as the base model concentration is driven almost entirely by biogenic emissions. Monoterpenes, particularly limonene, have been shown to have a large source from fragranced VCPs in some urban areas (Coggon et al., 2021; Peng et al., 2022; Wernis et al., 2022). Large scaling factors were also required for acetone (85 ×), MEK (70 ×), and ethanol (40 ×). Acetone is a common ingredient in paint thinners. Ethanol is an ingredient in many VCPs (pesticides, personal care products, cleaning, coatings, adhesives, inks; Gkatzelis et al., 2021; McDonald et al., 2018) and cooking (Arata et al., 2021). Ethanol and monoterpenes were also large sources of missing model VOC reactivity and ozone production in a study in Los Angeles and Las Vegas (Zhu et al., 2023), suggesting that inventories generally have difficulty capturing VCP emission levels. MEK is also a common VCP marker (McDonald et al., 2018). Underestimated model propane and C3 C4 alkanes (ALK4) may be attributable to underestimated liquified petroleum gas (LPG) or natural gas emissions, which is used for residential heating and cooking and some vehicles in South Korea (Simpson et al., 2020). The modeled underestimate of the long-lived combustion tracers carbon monoxide (CO), ethyne (C2H2), and benzene (Simpson et al., 2020) is expected given the general underestimate in CO identified in East Asia by Gaubert et al. (2020) and the expectation that underestimated emissions in South Korea likely reflect underestimated emissions across East Asia. Overall, we find that the KORUSv5 emissions inventory appears to underestimate VCP and LPG emissions likely both in South Korea and upwind in East Asia.
Increasing model VOCs to better match observations resulted in improved representation of calculated OH reactivity (cOHR). We determined cOHR for the suite of observed VOCs, CH4, and CO (Table 1), and we included the non-measured VOC oxidation products calculated from the F0AM box-modeling results of the SMA from Nault et al. (2024). Figure 1a compares this cOHR (observed CO + CH4 + VOCs + F0AM oxidation products) to modeled cOHR as a function of altitude below 2 km for the SMA. Figure 1 includes a calculation of the estimated missing reactivity (dashed gray line), which is discussed further in Sect. 6. Data are restricted to after 11:00 LT (local time) according to Nault et al. (2024) to ensure that the aircraft data are minimally affected by rapid changes in boundary layer growth, the nighttime residual layer, and titration of O3 by NO. The base model cOHR was only 4.7 s−1 in the lowest altitude bin (∼ 0.2 km) compared to 8.8 s−1 in the observations. Unmeasured VOC oxidation products (calculated by F0AM) made up 19 % of the cOHR, while in GEOS-Chem this was only 11 %. Increasing modeled emissions of CO and VOCs (called “scaled VOCs” hereafter) in South Korea as described in Sect. 2 increased modeled cOHR by 2.3 to 7.0 s−1 and significantly reduced this bias.
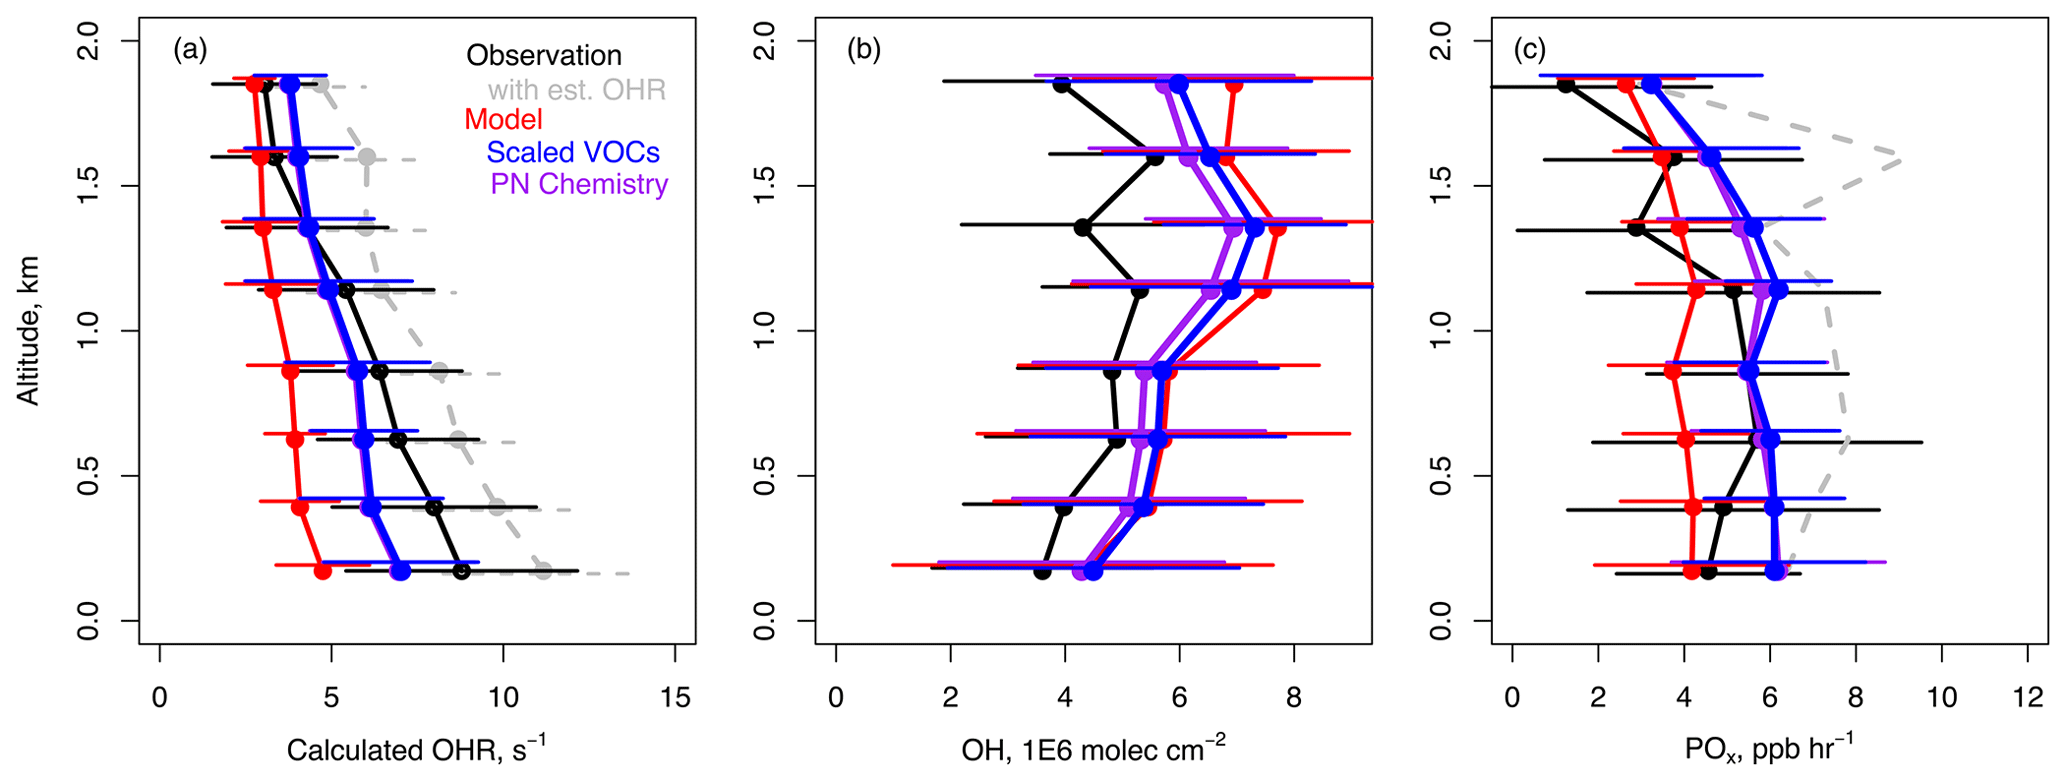
Figure 1Mean vertical profile and standard deviation in the Seoul Metropolitan Area (SMA) (37.2 to 37.7° N, 127.1 to 127.7° E) from 1 May to 10 June 2016 for data collected after 11:00 LT for (a) calculated OH reactivity (OHR) for VOCs + CO (Table 1), (b) OH, and (c) net production of Ox (POx = O3 + NO2). Data are averaged into eight bins of approximately 240 m for the observations (black), the base model (red), the model with scaled VOCs (blue), and improved peroxynitrate (PN) chemistry (purple). Calculation of OHR, the inclusion of estimated missing OHR (est. OHR) and net POx, and descriptions of model simulations are given in Sects. 3 and 4.
The increase in model cOHR had a significant impact on ozone production. On average, modeled OH (Fig. 1b) was largely unchanged, but ozone production increased by +2 ppb h−1 (Fig. 1c). This implies that the increased OH sink from VOCs was balanced by increased OH production from recycling (HO2 + NO) and/or photolysis of VOC oxidation products (e.g., formaldehyde). The average model overestimate of ∼ 30 % in OH below 2 km (after scaling VOCs) is partially attributed to insufficient model resolution and dilution of NOx given that increasing resolution to ∼ 7 km largely resolved the model bias in OH in Jo et al. (2023). The modeled average net production of ozone + NO2 (POx) was overestimated compared to observationally constrained POx (Fig. 1c) which was calculated as described in Nault et al. (2024) using steady-state assumptions and observed VOC concentrations, which we also attribute to insufficient model resolution and the modeled OH overestimate.
Figure 2 shows the same observations as in Fig. 1 but as a function of NOx concentration instead of altitude. The modeled OHR is closer to the observations at lower NOx concentrations in part due to the smaller influence of VOC oxidation products that are underestimated against the F0AM box modeling results. Below ∼ 8 ppb NOx, increasing VOCs reduced OH by up to −1 ×10⁶ molec. cm−3 while at higher NOx OH increased by as much as +0.3 ×10⁶ molec. cm−3 (Fig. 2b). The larger absolute reduction in OH at lower NOx is consistent with the main sinks being HO2 + RO2 to form organic peroxides and HO2 + HO2 to form hydrogen peroxide (Nault et al., 2024). Modeled POx increased by up to 2.7 ppb h−1 at higher NOx under VOC-limited conditions. The model does not fully capture the behavior of POx in the observations, which clearly show a shift from increasing to decreasing POx with increasing NOx at approximately 6 ppb NOx. Presenting only average conditions for the SMA in Fig. 1 masks the two differing chemical regimes present in the observations. We hypothesize that model difficulty in capturing the behavior of POx and the separation of these two regimes is also due to insufficient model resolution.
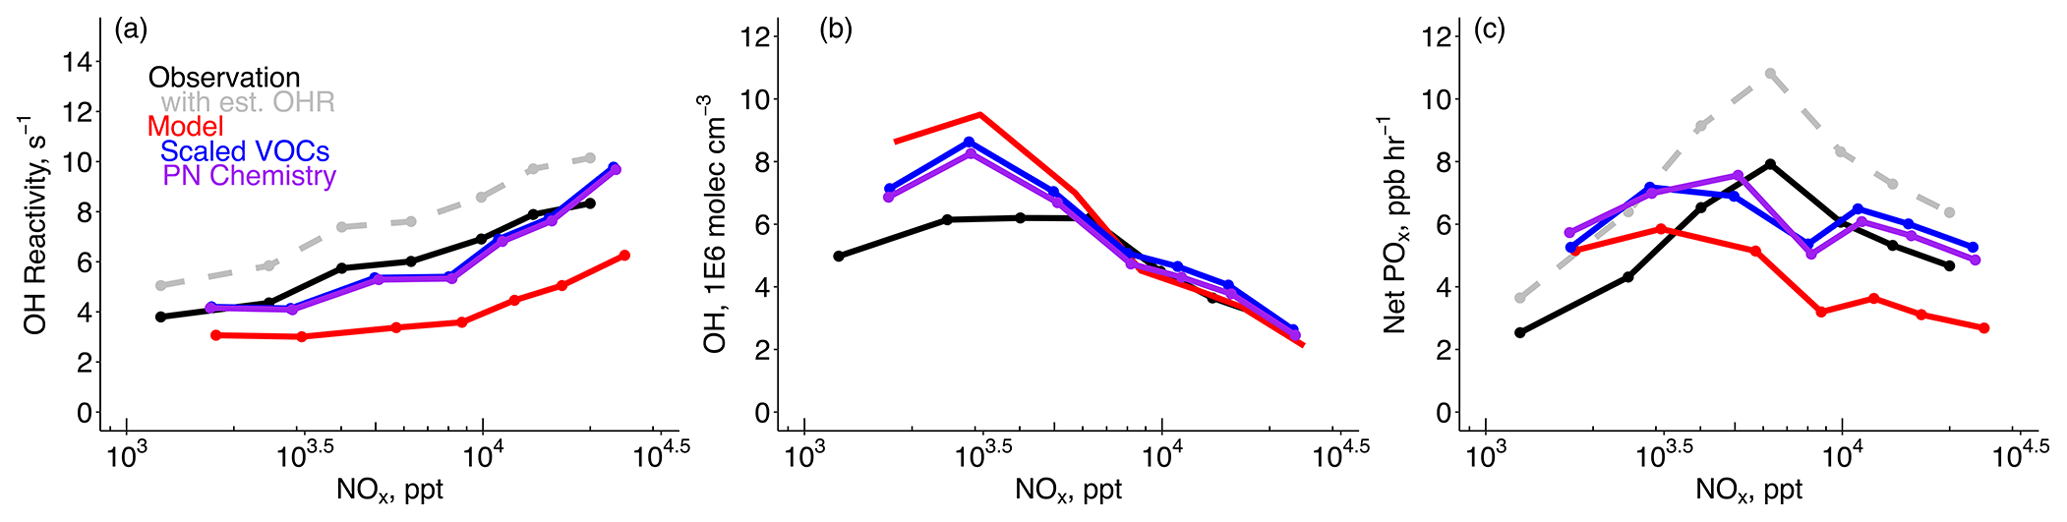
Figure 2Same as Fig. 1 but for (a) calculated OH reactivity for VOCs + CO (Table 1), (b) OH, and (c) net production of Ox (POx = O3 + NO2) plotted against NOx concentrations.
Scaled VOC emissions as described in Sect. 2 increased VOC oxidation products such as formaldehyde and acetaldehyde in addition to ozone production. Figure 3 shows that formaldehyde and acetaldehyde were biased by −47 % and −67 %, respectively, in the base model and increased by 30 % and 120 % after increasing the VOC emissions. The larger impact of increased VOC emissions on acetaldehyde is attributable to the significant increase in modeled ethanol (Table 3), a key precursor. Unlike in the F0AM box-modeling work in Nault et al. (2024), we were unable to fully reproduce observed formaldehyde in GEOS-Chem after scaling VOCs and CO. Section S1 in the Supplement describes a sensitivity test in F0AM where we reduced the VOCs and CO in F0AM by the base model bias (Table S3). This test illustrated that important impacts of insufficient VOCs and CO in Seoul are (1) underestimated loss of OH by reaction with VOCs and CO, (2) missing production of ozone from VOCs and CO through HO2 RO2 + NO, and (3) underestimated conversion of NO to NO2 by ozone that results in underestimated loss of OH by reaction with NO2. These impacts help explain the consequences of underestimated model VOCs and CO on successfully simulating overall ozone photochemistry. We explain the remaining formaldehyde low bias in GEOS-Chem by the fact that (1) the model underestimates reactivity of intermediate species which provide additional HCHO production and conversion of NO to NO2 by HO2 and RO2; (2) we are not able to achieve perfect agreement with VOC observations, which is possible with F0AM; and (3) model ozone remains underestimated, leading to underestimated NO2 and thus insufficient loss of OH and a HCHO lifetime against OH that is too short. This NO2 underestimate is made worse by insufficient model resolution.
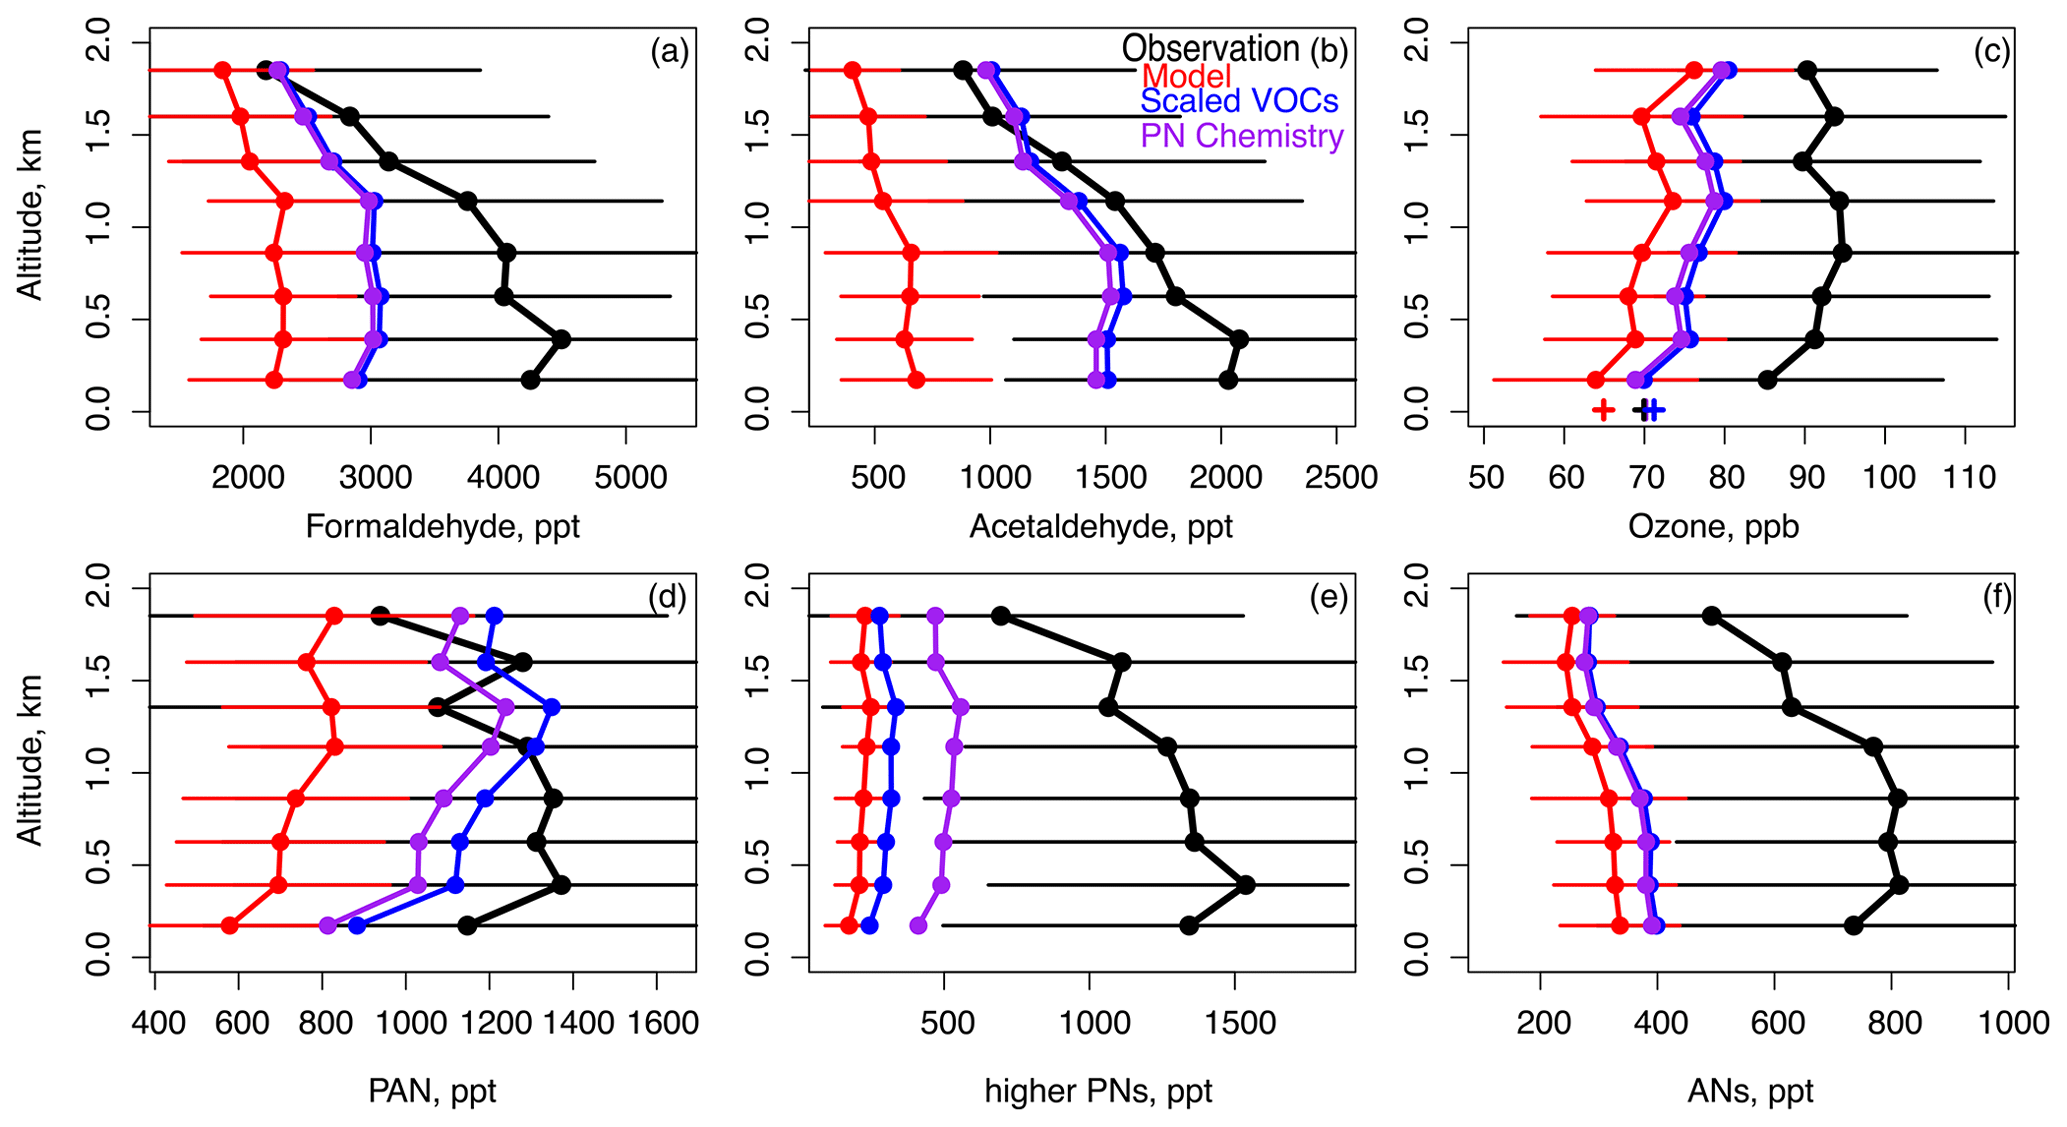
Figure 3The same domain and model simulations as Fig. 1 but for (a) formaldehyde, (b) acetaldehyde, (c) ozone, (d) PAN, (e) higher PNs, and (f) ANs. Surface ozone at Olympic Park between 11:00 and 16:00 LT during flight days is also plotted in panel (c) (+ symbols).
Despite the model shortcomings listed above, after scaling VOCs and CO, model ozone increased by +6 ppb, reducing the model underestimate from −21 to −15 ppb (Fig. 3c). Previous work attributed underestimated modeled ozone to underestimated influx of stratospheric ozone (Park et al., 2021) or photolysis of particulate nitrate (Colombi et al., 2023; Yang et al., 2023), although this latter mechanism is uncertain (Shi et al., 2021; Gen et al., 2022; Sommariva et al., 2023). Model resolution is unlikely the primary factor, as a similar ozone bias was found in a recent study with a range of resolutions in simulating KORUS-AQ ozone observations in the SMA (Jo et al., 2023). Here, we found that a significant fraction of this underestimate is due to underestimated VOCs. Additional bias could be attributable to underestimated ozone production upwind, as here we only increased VOC emissions in South Korea. Future work should assess how much underestimated VOCs in the rest of East Asia (e.g., China) could contribute to underestimated free tropospheric and surface ozone in models over South Korea. Finally, as formaldehyde is still underestimated in the model by −1 ppb, additional unmeasured VOCs could be present, and this possibility is further discussed in Sect. 5. We do not anticipate that the formaldehyde bias is entirely caused by the modeled OH overestimate as increased resolution and improved OH did not resolve the model bias in Jo et al. (2023), implying that underestimated VOC emissions may be the root cause.
Schroeder al. (2020) identified C7+ aromatics (toluene, xylenes, ethylbenzene) as being the largest driver of ozone production (32 %) in the SMA followed by isoprene and alkenes (14 %–15 %), but a sensitivity test for the impact of ethanol was not included in their calculations. We performed two simulations, one removing ethanol and the other removing C7+ aromatics, over South Korea. Figure S2b shows that reducing ethanol resulted in a 50 % reduction in acetaldehyde, while removing C7+ aromatics only reduced acetaldehyde by ∼ 10 %. C7+ aromatics had a larger impact than ethanol on formaldehyde (8 % vs. 6 %, Fig. S2a). Removing C7+ aromatics reduced ozone by −3.4 ppb while removing ethanol reduced ozone by −1.7 ppb (Fig. S2c). This result implies that ethanol was similar in importance during the campaign to isoprene or alkenes, which produced ozone at approximately half the rate as C7+ aromatics in Schroeder et al. (2020). Both ethanol and C7+ aromatics had a similar impact on PAN (15 %–20 %, Fig. S2f). Ethanol produces PAN through production of acetaldehyde. C7+ aromatics produce PAN from methylglyoxal and have a larger impact on the NO to NO2 ratio (Fig. S2d). Removing ethanol had minimal impact on OH as the reduced loss from both ethanol and acetaldehyde appeared to be balanced by decreased recycling from HO2 + NO (not shown), while reducing C7+ aromatics decreased OH by −10 % from reduced recycling.
Figure 4a shows the diurnal cycle of surface ozone at the Olympic Park supersite where scaled VOCs increased modeled ozone by +9 ppb, largely reducing the midday bias. However, the model overestimated the average ozone in the 15 AirKorea sites contained within the model grid box (shown in Fig. 1b; Travis et al., 2022). This is likely attributable to the model's inability to resolve the NO2 levels in the grid box (Fig. 4b) due to insufficient model resolution (e.g, Jo et al., 2023), which were on average higher than at Olympic Park, resulting in suppressed ozone production. Nighttime model overestimates in NO2 are likely attributable to an overly shallow nighttime mixed-layer height, which results in excessive ozone titration (Travis et al., 2022). There was a large gradient of 16 ppb between the observed ozone from aircraft (Fig. 3c) and the daytime (11:00–16:00 LT) average surface ozone from the EPA monitor on flight days (Fig. 4a). This gradient would be even larger compared to the grid box average ozone value, which is lower, as discussed above. The model shows no gradient. Park et al. (2021) attributed the strong ozone gradient observed in the boundary layer to suppressed HOx at high NOx and increased ozone destruction by NO and VOCs. Insufficient model resolution here (∼ 25 km) may be the cause of the lack of model gradient below 1 km, as Jo et al. (2023) showed a decreasing gradient in the lowest 1 km at high resolution (< 14 km) compared to an increasing gradient at low resolution (> 56 km).
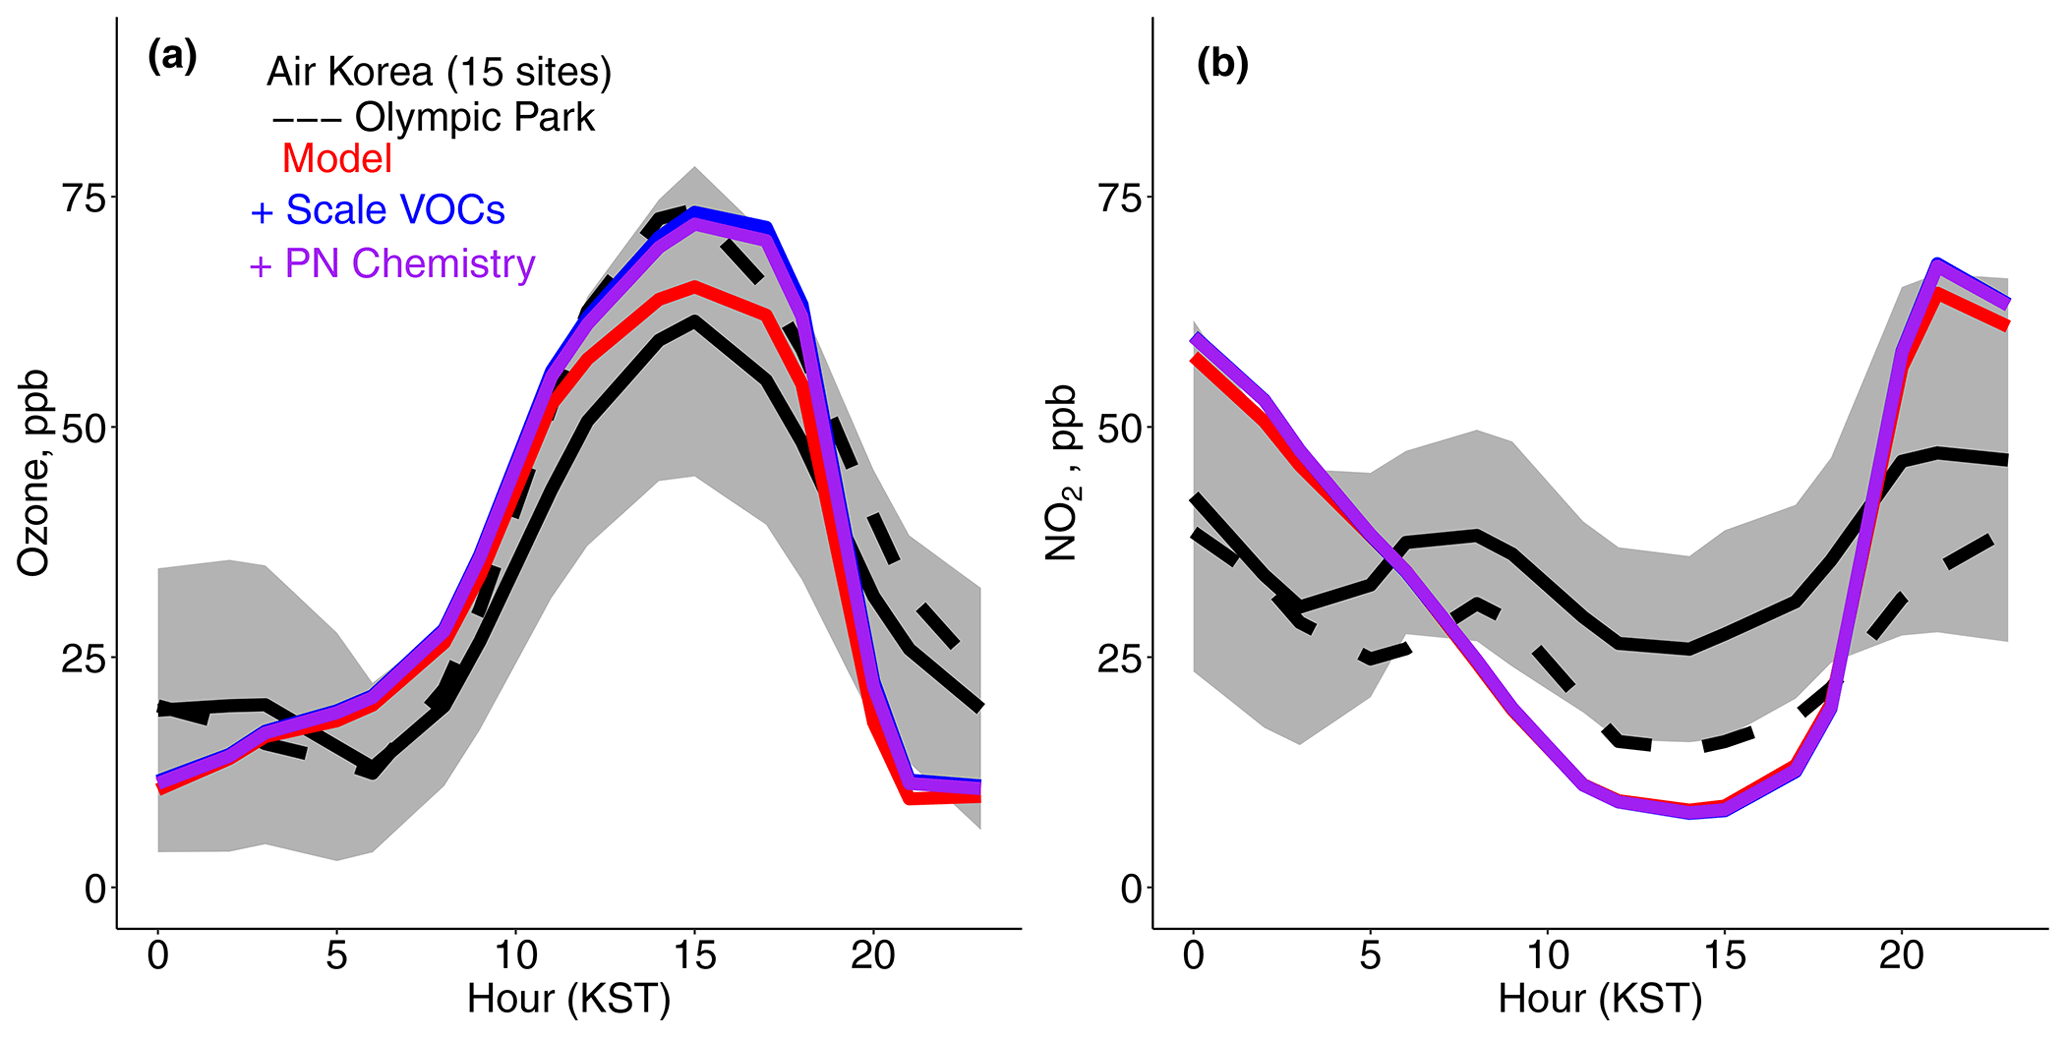
Figure 4Mean diurnal cycle for (a) ozone and (b) NO2 for the AirKorea sites within the GEOS-Chem grid box at Olympic Park. The dashed line represents the EPA monitor at Olympic Park (Table 1). The gray shading represents the standard deviation across the AirKorea sites (see Fig. 1b, Travis et al., 2022). KST is Korean standard time (UTC+9).
Figure 5a shows model maps of maximum daily 8 h average (MDA8) surface ozone for the campaign (1 May–10 June 2016). Suppressed ozone production in VOC-limited conditions is evident in the model in the SMA and to a lesser extent in Busan on the southeastern coast where MDA8 ozone is significantly lower than the surrounding areas. MDA8 ozone over both areas increased by as much as +10 ppb (Fig. 5b) due to scaled VOCs over South Korea.
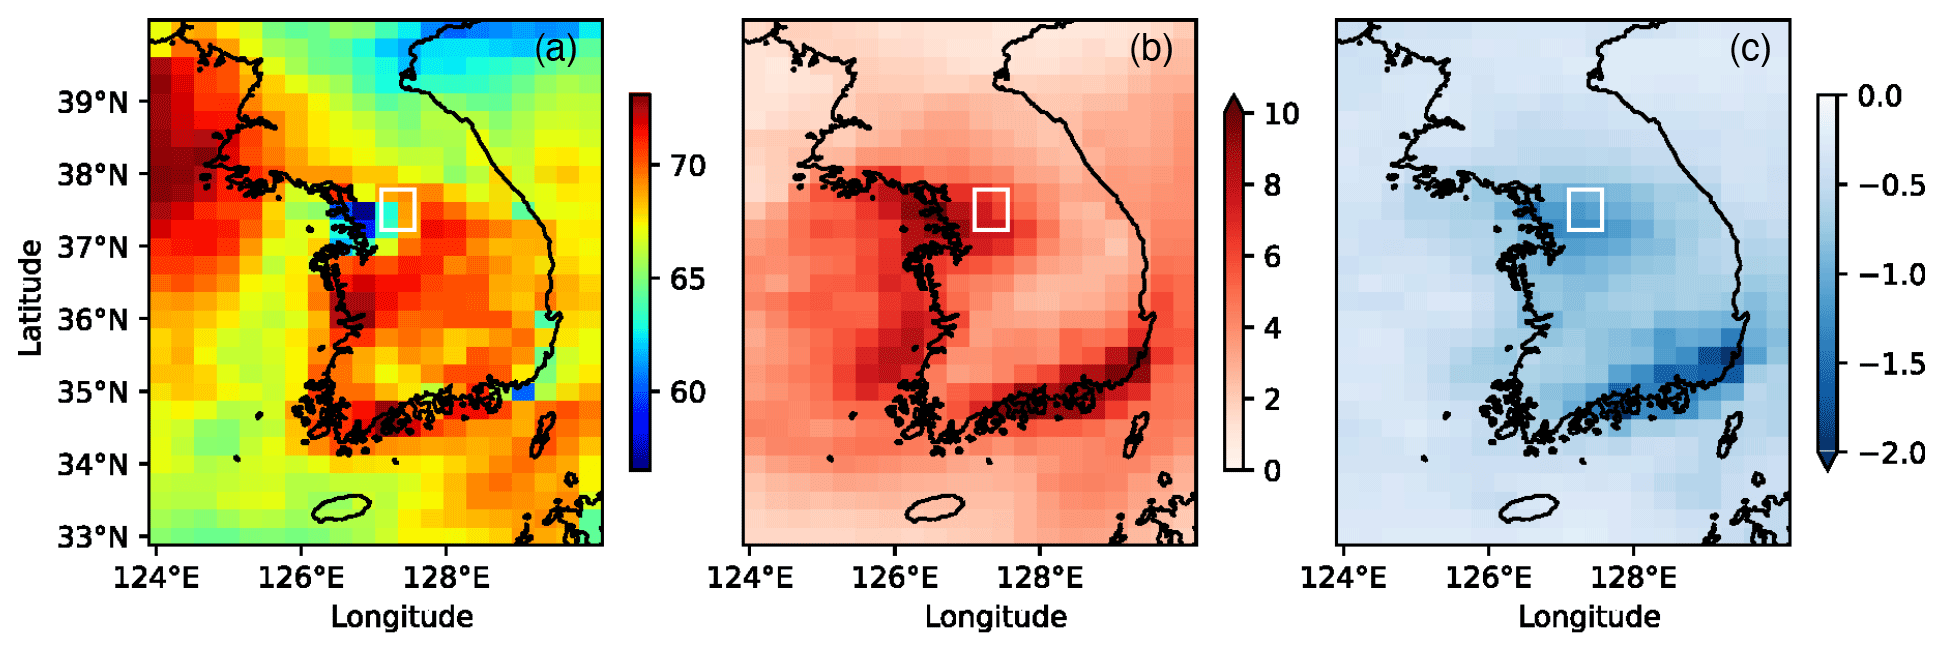
Figure 5(a) Maximum daily 8 h average (MDA8) ozone (ppb) from 1 May to 10 June 2016, the impact from (b) scaled VOCs as described in Sect. 2, and (c) adding peroxynitrate (PN) chemistry to the simulation in panel (b) described in Sect. 5. The white box designates the Seoul Metropolitan Area (SMA).
Peroxyacetyl nitrate (PAN) is the simplest and most abundant peroxy acyl nitrate (PN). It is produced in the SMA largely from ethanol, isoprene, C8 aromatics, toluene, and MEK oxidation (Nault et al., 2024). As discussed in Sect. 3, all these species except for isoprene were increased to better match observations during KORUS-AQ (Fig. S1, Table 3). Figure 3d shows that this scaling reduced the modeled PAN underestimate from −50 % to −23 %. PAN formation is sensitive to the ratio of (Nihill et al., 2021). The modeled ratio below 0.2 km decreased from 0.27 to 0.25 when the VOC scaling was applied due to increased conversion of NO to NO2 (Fig. S3c) but was still overestimated compared to the observed ratio (0.20), likely contributing to the remaining model bias. This may be due to the model's inability to resolve higher levels of NO2 as well as the need for further radical sources to increase NO to NO2 conversion.
Observed PAN averaged 1.1 ppb below 2 km (Fig. 3d) and made up only approximately 50 % of ∑PNs, which averaged 2.5 ppb (Fig. 3d and e). Peroxypropionyl nitrate (PPN) averaged 80 ppt, or 7 % of PAN. Together, PAN and PPN are generally expected to account for 75 %–90 % of observed ∑PNs (Wooldridge et al., 2010) but here only account for 50 % (Nault et al., 2024; Fig. 3e). Table 4 lists the PN species in the observations and the base model along with their main precursor and fraction relative to PAN. Figure 6a and b shows the speciation of ∑PNs in the base model and with increased VOCs. The base model included two other higher PNs: MPAN formed from methacrolein, and BZPAN formed from benzaldehyde. Each were 2 % or less of model PAN (Table 4). Figure 6a illustrates that the base model therefore had no ability to represent the larger fraction of higher PNs compared to ∑PNs in the observations. Alkyl nitrates (ANs), another product of VOC oxidation in the presence of NOx, also showed a large missing speciated fraction where individual measurements were only able to account for approximately a quarter of total observed ∑ANs (Fig. S4a). More ANs were modeled than were measured, but model ∑ANs values were still underestimated by 50 % in the base model below 2 km (Fig. 3f). Speciated model ANs for the model (with scaled VOCs and added PN chemistry discussed below) are given in Fig. S4b. The finding here of missing model ∑ANs is similar to the 50 % underestimate in Fisher et al. (2016) in the US and the 70 % underestimate in Kenagy et al. (2021) during KORUS-AQ attributed to missing precursors and/or chemistry from non-biogenic precursors such as S/IVOCs (semi-volatile and intermediate-volatility organic compounds). Here we simulate more ANs than in Kenagy et al. (2021) partially due to our addition of the ALK6 alkylnitrate (R6N2, Table S1) described in Sect. 3 that had an average concentration of ∼ 60 ppt below 2 km (Fig. S4b).
Table 4Model PN species descriptions, precursor, and observed and modeled PAN fraction.
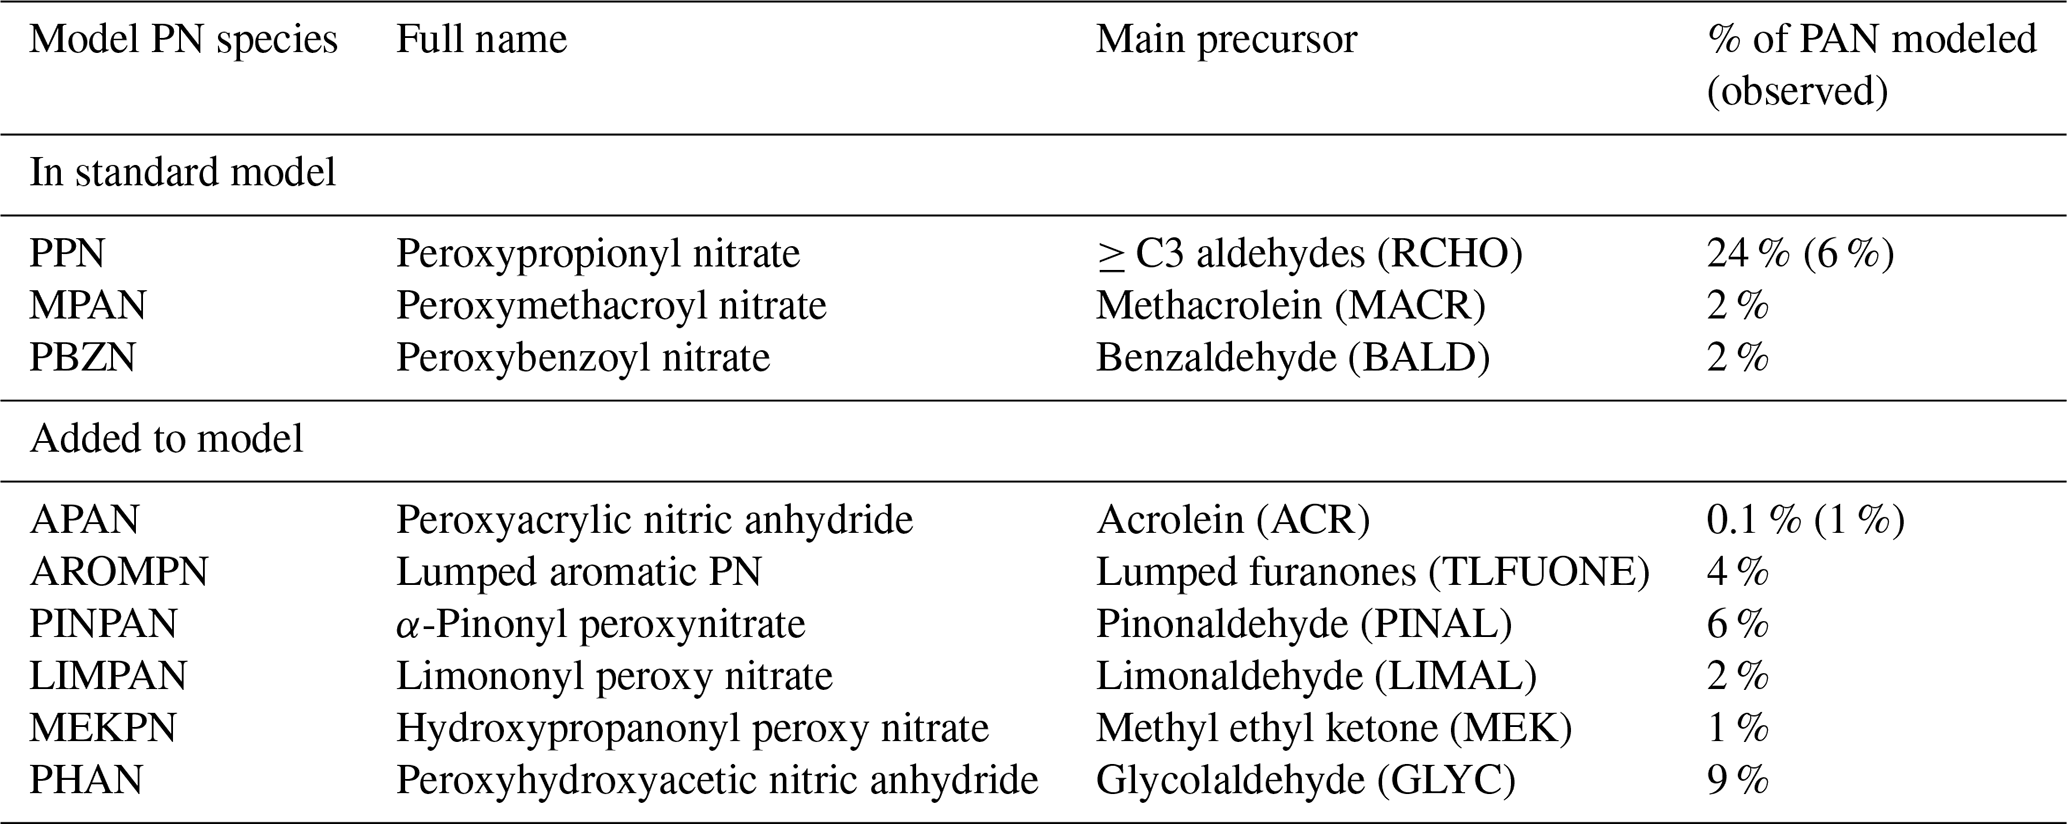
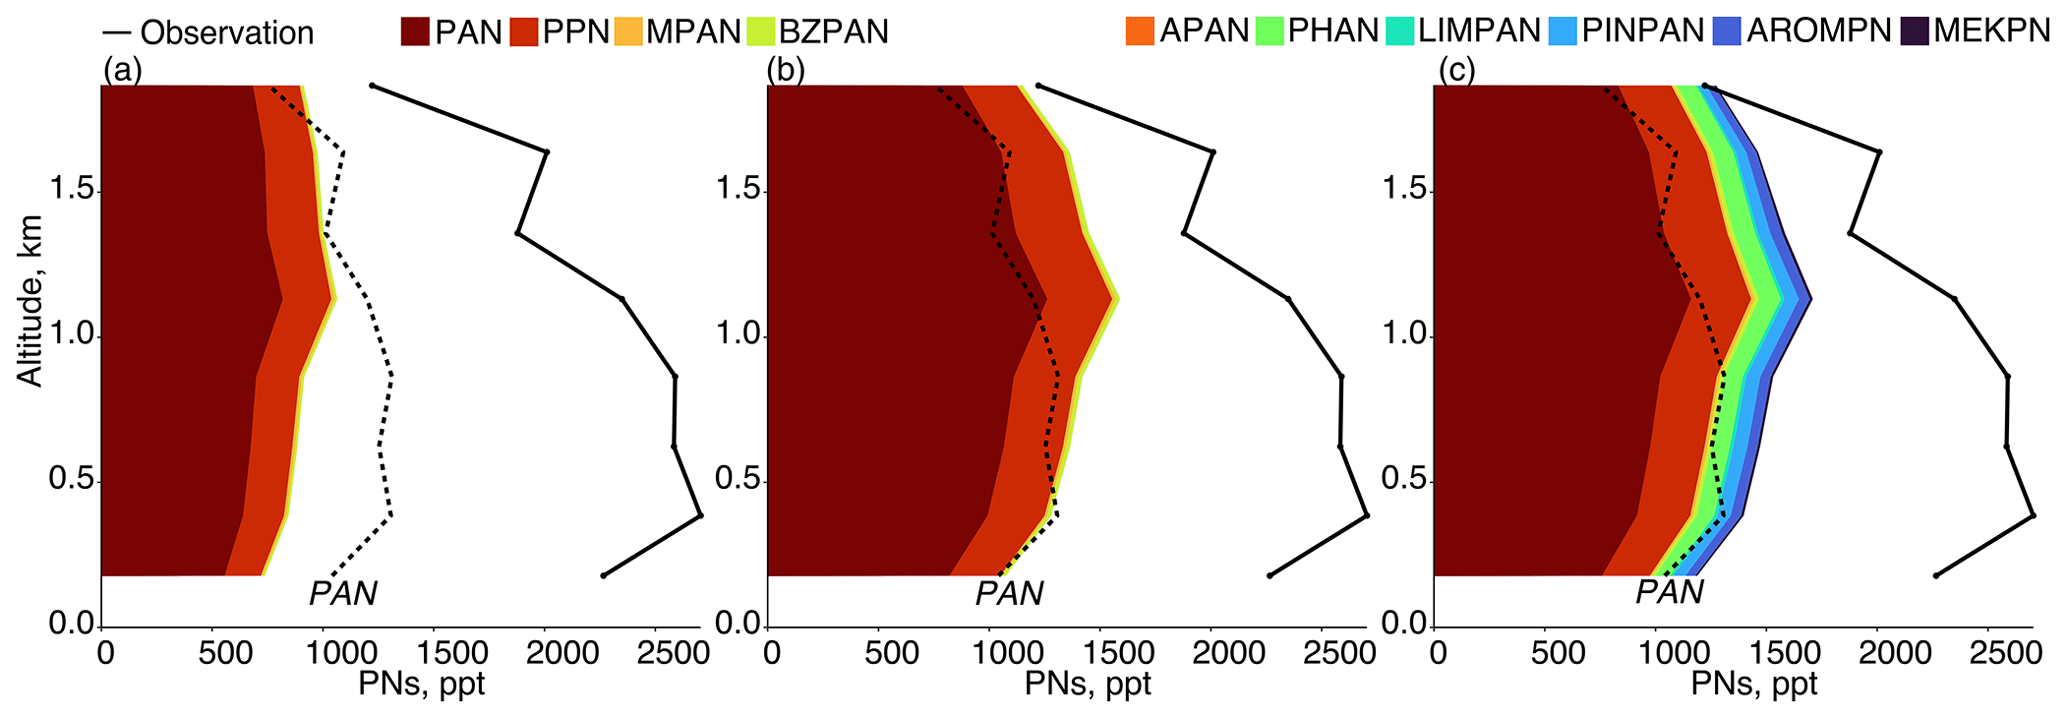
Figure 6Speciated mean vertical profiles of modeled PNs for the domain of Fig. 1 compared against observed PNs (solid black line) and PAN (dashed black line) for (a) base model, (b) scaled VOCs, and (c) added PN chemistry.
Lee et al. (2022) performed box modeling of VOCs during KORUS-AQ near the Daesan petrochemical complex (DPCC) to the southwest of Seoul and identified two higher PNs, peroxyhydroxyacetic nitric anhydride (PHAN) and peroxybenzoic nitric anhydride (PBZN), that contributed 17 % and 6 % to ∑PNs, respectively. They also identified an additional PN, peroxyacrylic nitric anhydride (APAN), that contributed up to 14 % of ∑PNs near the emission source. APAN, formed from 1,3-butadiene (C4H6) and acrolein, has been previously observed over petrochemical industrial areas (Roberts et al., 2001) and in fire plumes (Roberts et al., 2022). A PN formed from α-pinene oxidation through pinonaldehyde (PINPAN) was identified by Noziere and Barnes (1998) and estimated to be similar in concentration to MPAN. Nault et al. (2024) performed box modeling using the MCMv3.3.1 in the F0AM box model to calculate potential additional PNs from the suite of observed VOCs during KORUS-AQ similar to Lee et al. (2022) but for the SMA. Identified PNs included PHAN; APAN; PINPAN; and PNs from methyl ethyl ketone (MEKPN), limonene (LIMPAN), and aromatics (AROMPN). We devised a chemical mechanism to produce these PNs for GEOS-Chem that is provided in Tables S1 and S2.
Figure 6c shows the model results with scaled VOCs and a revised scheme for producing additional PNs (listed in Table 4). APAN is less important in the SMA (< 1 % of PAN) than in the results of Lee et al. (2022), which used observations closer to the source of C4H6 emissions (Daesan chemical complex). We found that four out of the six added higher PNs had a ratio to PAN at least as large as MPAN (2 %), with PHAN having the largest ratio (9 %) followed by PINPAN (6 %). PAN itself decreased by 8 % in the revised scheme, which we attribute to both the re-speciation of the PAN acetylperoxy radical (CH3CO3) into other acetylperoxy radicals such as the 2-hydroxyacetylperoxy radical (GCO3) that makes PHAN (Table S2), and the removal of more peroxy radicals overall by the added higher PNs that would otherwise participate in ongoing photooxidation.
Figure 1c shows that the inclusion of additional higher PNs reduced ozone production by −1 % against aircraft observations, with a net impact on ozone of −1 ppb that also occurs at the surface (Fig. 4a). This result agrees with the finding from Nault et al. (2024) that PNs were a net sink for ozone production in the SMA during KORUS-AQ. The addition of higher PNs reduced formaldehyde by −2 % and acetaldehyde by −3 % (Fig. 3a–b), which we attribute to the increased radical sink as modeled OH decreased by −5 %. Figure 5c shows the impact on MDA8 ozone from adding modeled higher PNs to the simulation with scaled VOCs (Fig. 5b). Ozone decreased across South Korea, with the largest differences of −1 to −2 ppb in the SMA and Busan. Figure 7 shows PAN (a) and higher PNs (b) compared to formaldehyde. The PAN–formaldehyde relationship improved in the model with scaled VOCs and added PN chemistry, with the remaining bias in formaldehyde evident above approximately 6 ppb. The model underestimates the production of higher PNs as a function of formaldehyde, which suggests that an additional VOC source of these species is needed.
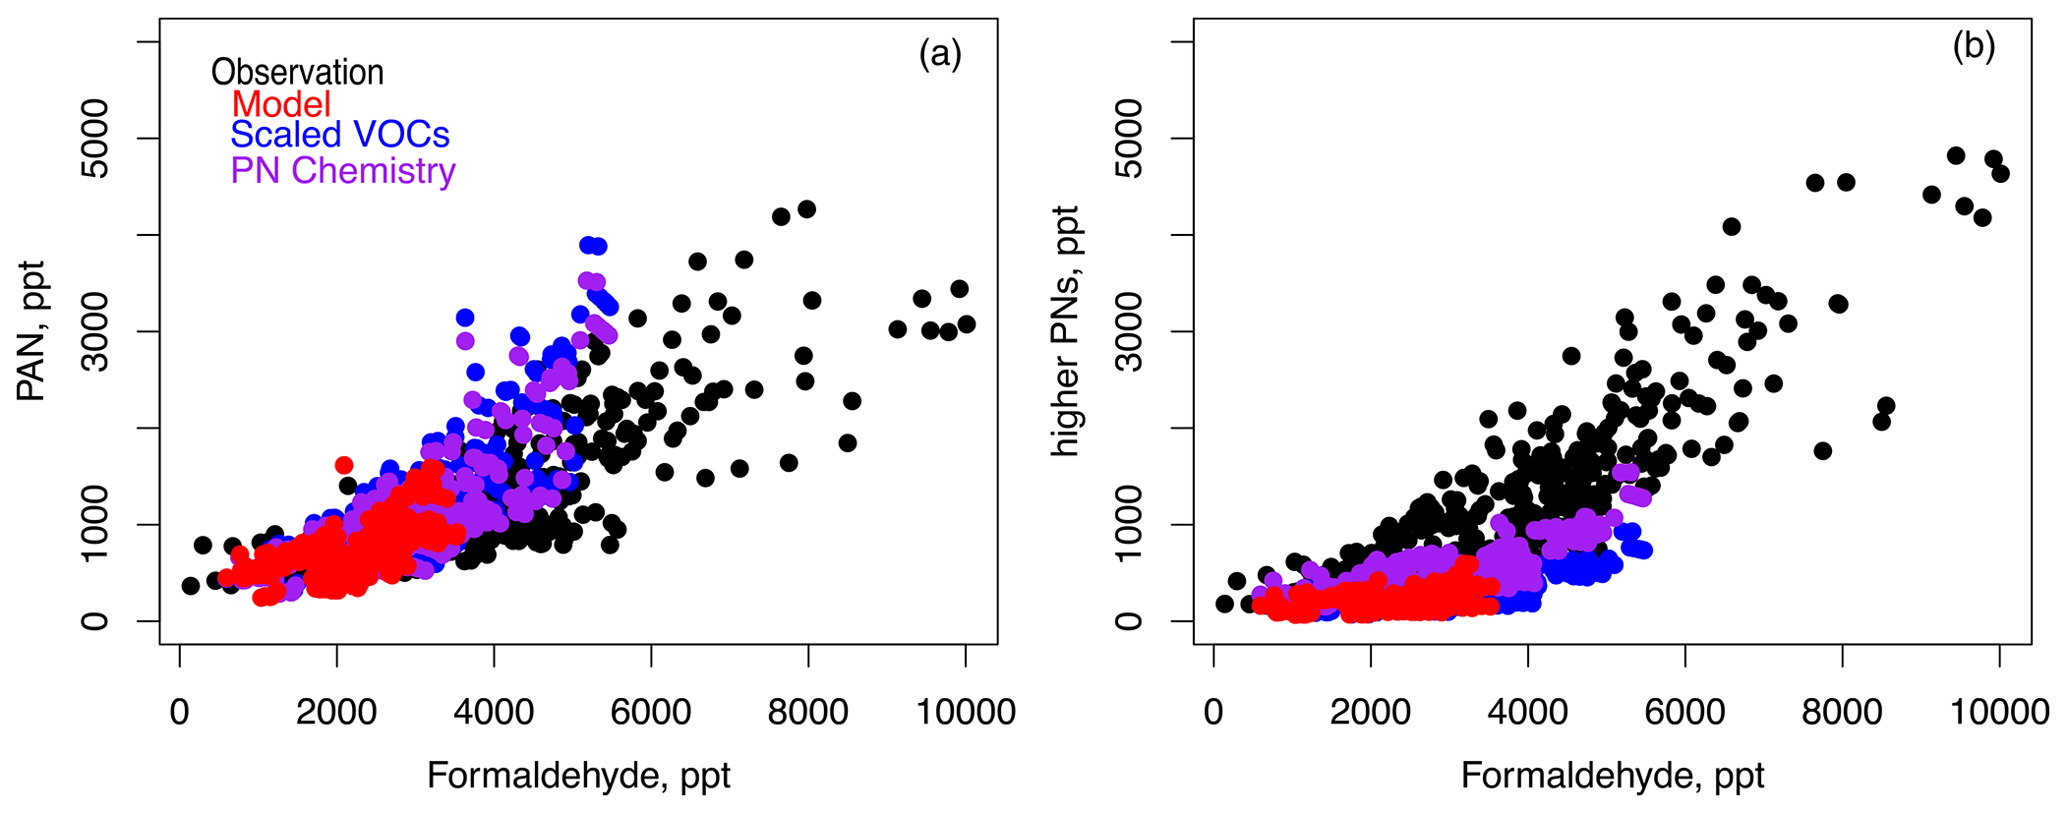
Figure 7Comparison of (a) PAN and (b) higher PNs against formaldehyde for individual modeled and observed data points in the domain of Fig. 1. Model sensitivity studies for scaled VOCs and added PN chemistry are described in Sects. 2 and 5, respectively.
We performed global simulations at 2 × 2.5° with the base model and the addition of higher PNs (without scaling VOCs in South Korea) to test the global relevance of these species. Figure 8 shows the global average surface concentrations from 1 May to 10 June 2016 of base model PNs (PAN, MPAN, PPN, BZPAN) and newly added higher PNs (PHAN, LIMPAN, PINPAN, AROMPN, MEKPN, APAN) and the difference in the revised model ∑PNs compared to the base model. The individual concentrations of the added PNs are shown in Fig. S5. Over land, ∑PNs increased from +2 % to +46 % with the newly added higher PNs (Fig. 8c), with the largest increase over the Amazon from monoterpene-derived PNs (LIMPAN and PINPAN, Fig. S5). C4H6 (1,3-butadiene) emissions were only included in the KORUSv5 inventory and therefore APAN was only simulated in East Asia with a maximum in China. AROMPN only increased in the Northern Hemisphere due to higher aromatic emissions. Globally, in order of importance, the maximum concentration of PAN was 1.3 ppb followed by PPN at 0.5 ppb. The maximum concentrations of PINPAN, PHAN, and LIMPAN were between 100 and 160 ppt. AROMPN, MPAN, BZPAN, and MEKPAN were between 20 and 70 ppt. APAN was negligible (2 ppt); however, future work should consider fire-related emissions of acrolein, which would increase the importance of APAN in some regions. All higher PNs are expected to be more important near source regions, and APAN likely has greater relevance to local photochemistry, as seen in higher-resolution studies such as Lee et al. (2022). Over land, ozone was reduced by −1 ppb by the added PNs (Fig. 8d), with differences in NO2 and OH of up to −20 % and −5 %, respectively. Smaller increases in ozone, NO2, and OH were simulated over the ocean due to transport of ∑PNs.
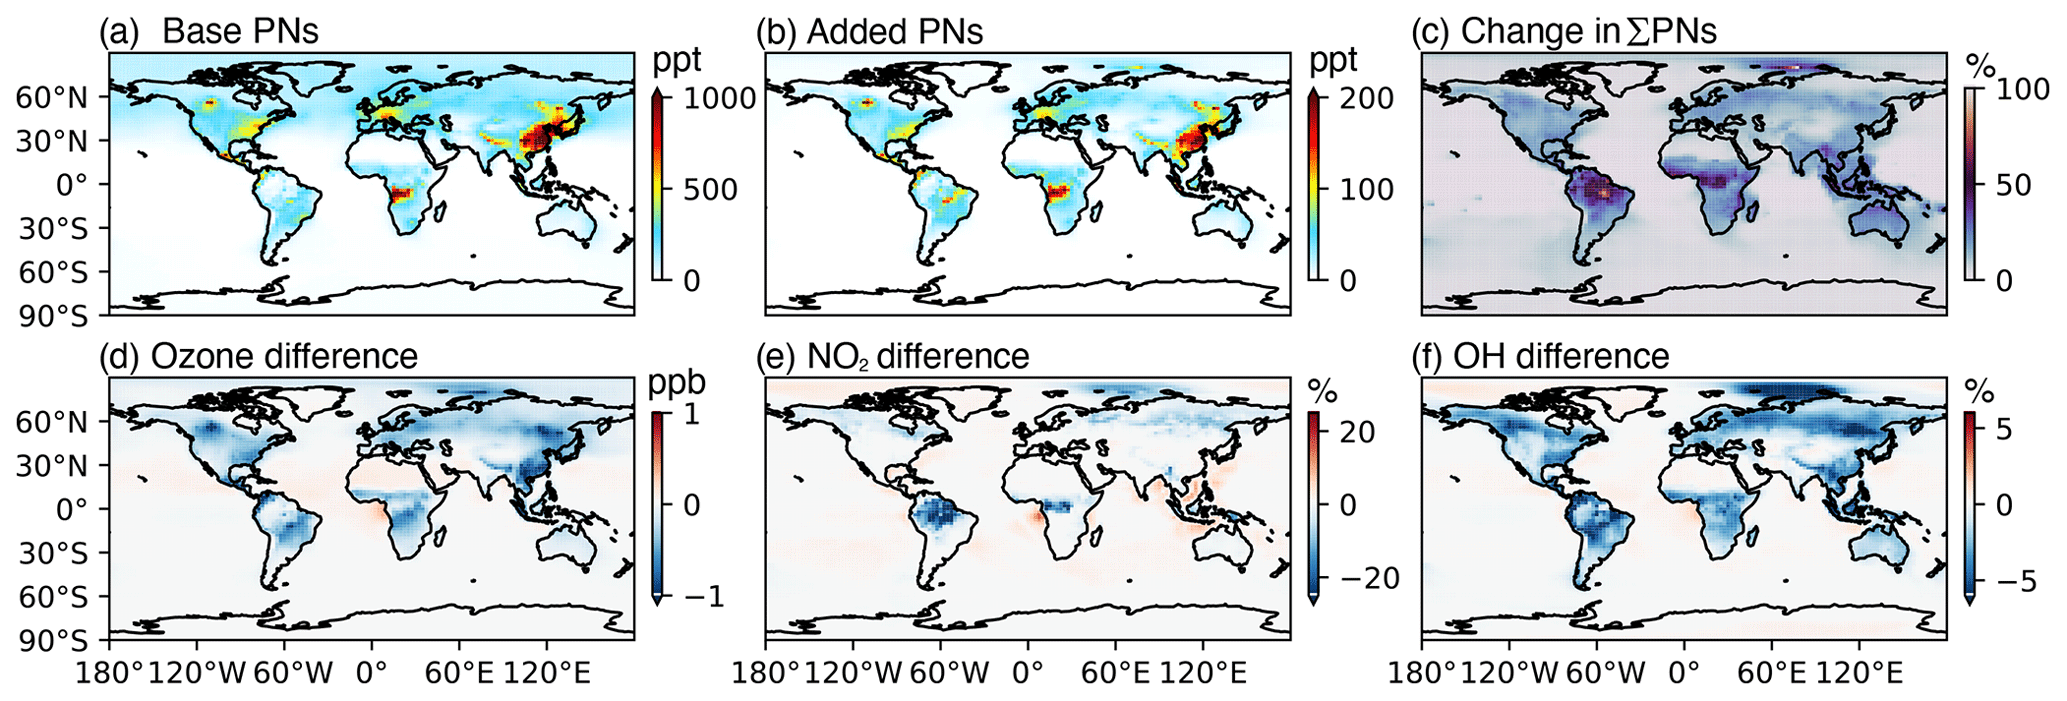
Figure 8Global average surface concentrations at 2 × 2.5° from 1 May to 10 June 2016 for (a) base PNs, i.e., PAN, MPAN, PPN, and BZPAN (Table 4); (b) added PNs, i.e., PHAN, LIMPAN, PINPAN, AROMPN, MEKPN, and APAN (Table 4); (c) percentage change in the revised model (Base + added PNs) compared to the base model; (d) difference in surface ozone; (e) difference in surface NO2,; and (f) difference in surface OH.
Figure 9 shows the global average model fraction of more commonly measured PNs (PAN, MPAN, PPN) compared to ∑PNs (PAN, MPAN, PPN, BZPAN, PHAN, LIMPAN, PINPAN, AROMPN, MEKPN, APAN) in the model with the new PN chemical scheme (Table S2). The global fraction is reduced from largely 100 % to between 50 % and 100 % (up to a 50 % reduction) with the largest change in regions dominated by monoterpene PNs (LIMPAN and PINPAN, Fig. S5). Over the United States, Europe, and Asia, this fraction is reduced from approximately 100 % to between 80 % and 90 %. Globally, PAN itself decreases similarly to the results shown for the SMA in Fig. 3d.
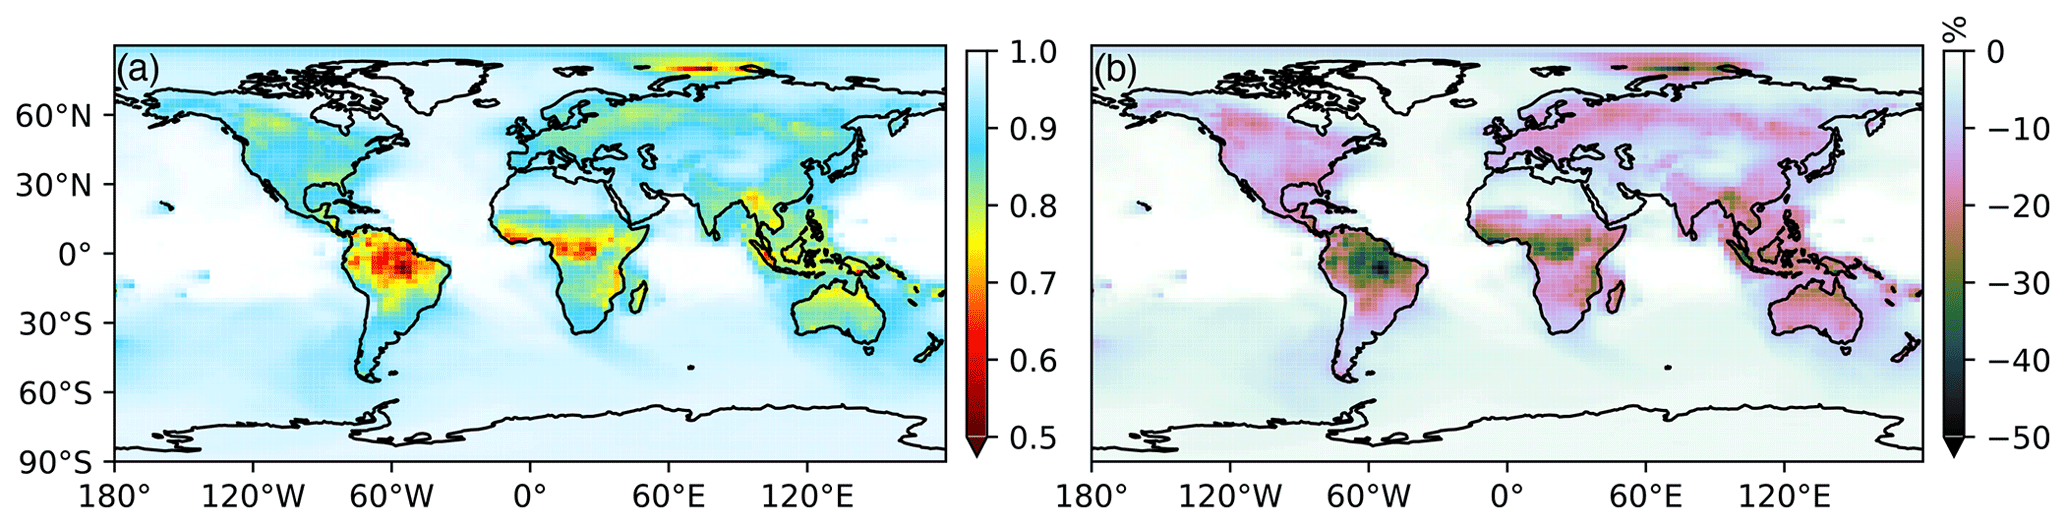
Figure 9(a) Modeled global average fraction of commonly measured PNs (PAN, MPAN, PPN) compared to ∑PNs (PAN, MPAN, PPN, BZPAN, PHAN, LIMPAN, PINPAN, AROMPN, MEKPN, APAN). (b) Reduction in commonly measured PNs vs. ∑PNs in the revised model simulation (Sect. 5) compared to the base simulation (approximately 100 %).
Figure 3a shows that despite better simulating the suite of observed VOCs (Fig. S1), the model with scaled VOCs and PN chemistry still underestimated average formaldehyde below 2 km in the SMA by −0.8 ppb (−20 %). Ozone, higher PNs, and ∑ANs also remained underestimated by −16 ppb (−17 %), −720 ppt (−57 %), and −370 ppt (−52 %) below 2 km, respectively. This implies that additional unmeasured VOCs must be present. Nault et al. (2024) used the observed relationship between Ox and ∑ANs in the SMA during KORUS-AQ to estimate that there must be an average of 1.7 s−1 of additional OH reactivity from unmeasured VOCs (shown in Fig. 1a). As in Nault et al. (2024), we calculated that this additional reactivity could further increase calculated ozone production by +2 ppb h−1 (Fig. 1c). This additional OH reactivity would likely bring the modeled OH overestimate at lower NOx (Fig. 2b) into better agreement with observations as observed by our sensitivity study with increased VOCs and would further improve the model NO to NO2 ratio (Fig. S3c).
Nault et al. (2024) suggested that likely sources of missing reactivity could be oxygenated VOCs, such as nonanal, and cycloalkenes or alkenes, such as monoterpenes. Nonanal is reactive with a lifetime against oxidation by OH of ∼ 3 h for the conditions in the SMA (OH = 3 ×10⁶ molec. cm−3) and would produce both higher PNs and ∑ANs (Bowman et al., 2003). Nonanal and octanal were recently measured at levels of 1 ppb or greater in several cities in the US (Coggon et al., 2023, 2024). In addition to other smaller carbonyls, such as formaldehyde and acetaldehyde, > C5 aldehydes such as nonanal are emitted from cooking activities (Ho et al., 2006; Coggon et al., 2023). VOCs from cooking are minimally represented in emissions inventories but could have a mass contribution nearly as large as emissions from mobile sources (Coggon et al., 2023). Similarly, anthropogenic monoterpene emissions are a poorly represented source in models that could make up as much as half of total monoterpenes even in a biogenically active area (Peng et al., 2022; Borbon et al., 2023; Peron et al., 2024). We hypothesize that oxygenated VOCs (OVOCs) such as > C5 aldehydes or cycloalkenes and alkenes such as monoterpenes could be a potential source of unaccounted for OH reactivity in some cities and would contribute to resolving missing ∑PNs (Fig. 3d) and ∑ANs (Fig. 3f). These species could also help reconcile modeled formaldehyde (Fig. 3a) and ozone (Fig. 3c) and would improve the model OH overestimate at lower NOx levels (Fig. 2b).
Simulations of ozone pollution in urban areas, particularly those that are VOC-limited, rely on a successful representation of VOC emissions in the model inventory. These VOCs also produce organic NOx and radical reservoirs, which serve as a local ozone sink but can produce ozone downwind. However, inventories of VOC emissions are more difficult to produce than for NOx given the larger number of compounds involved. Globally, VOC inventories have been shown to poorly represent local measurements (von Schneidemesser et al., 2023; Rowlinson et al., 2023). During the joint National Institute of Environmental Research (NIER) and National Aeronautics and Space Administration (NASA) Korea-United States Air Quality (KORUS-AQ) field study during May and June 2016, models underestimated ozone, formaldehyde, ∑PNs, and ∑ANs in the Seoul Metropolitan Area. This points to underestimated VOCs in the emissions inventory due to the VOC-limited regional photochemistry.
We assessed average model biases in observed VOCs and we increased emissions estimates in South Korea to improve model agreement. Large model-scale factors were required to reproduce observations for species related to volatile chemical products (methanol, acetone, monoterpenes, methyl ethyl ketone, xylenes, ethylbenzene), LPG and natural gas emissions (propane, butanes), and long-range transport (CO, C2H2, benzene). We expect that scale factors were overestimated given that we only considered underestimated VOCs in South Korea and not upwind in East Asia where we had minimal constraints on emissions. Scaling modeled VOC emissions individually to better match observations resulted in an increase in modeled OH reactivity from 4.7 to 7.0 s−1 and an increase in modeled average POx by +2 ppb h−1. Scaled VOC emissions improved formaldehyde by +30 % and acetaldehyde by +120 %. Ozone increased by +6 ppb aloft and up to +9 ppb at the surface. We found that ethanol emissions were largely responsible for the improved model acetaldehyde and had a similar impact as isoprene or alkenes on ozone production. Therefore, ethanol emissions may be important to consider in policy decisions regarding VOC reductions.
Peroxyacetyl nitrate (PAN) is produced in the SMA from many of the VOCs that were scaled to match observations including ethanol. This scaling improved the modeled PAN underestimate from −50 % to −23 %. We added model chemistry to produce six additional acyl peroxy nitrates (PNs) and found that four were at least as abundant as MPAN (2 % of PAN. Efforts should be made to look for these species (PHAN, LIMPAN, PINPAN, AROMPN) in future urban campaigns. The addition of these species reduced the fraction of commonly measured PNs (PAN, PPN, MPAN) globally from 100 % in the base model to between 50 % and 100 % depending on location. Over continents, the additional PNs reduced ozone by −1 ppb and OH by −5 %. Species found to be less important during KORUS-AQ here, such as APAN, have been detected in larger amounts in studies of fire plumes (Decker et al., 2019; Roberts et al., 2022). While we do not consider fire emission precursors for APAN such as acrolein in this work here, the chemistry scheme provided in this work will aid in modeling studies of the impacts of fire emissions on atmospheric composition.
Remaining model underestimates below 2 km in formaldehyde (−0.8 ppb, −20 %), ozone (−16 ppb, −17 %), higher PNs (−720 ppt, −57 %), and ∑ANs (−370 ppt, −52 %) are consistent with recent work finding that there is an average missing OH reactivity of 1.7 s−1 in the SMA (Nault et al., 2024). Likely sources of this reactivity, which would also produce formaldehyde, ozone, PNs, and ANs, are OVOCs such as > C5 aldehydes (e.g., nonanal) from cooking emissions and anthropogenic sources of cycloalkenes and monoterpenes such as limonene. Both VCPs and cooking emissions are poorly represented or missing from most VOC inventories. Recent work focusing on these emissions and their chemistry (Coggon et al., 2023; Warneke et al., 2023; Peng et al., 2022) should greatly improve models' ability to simulate urban air quality in regions around the world. Future work will evaluate the ability of the revised model chemistry here to simulate observations from the Atmospheric Emissions and Reactions Observed from Megacities to Marine Areas (AEROMMA) field study in the United States during June to August 2023 (https://csl.noaa.gov/projects/aeromma/, last access: 14 August 2024) and the Airborne and Satellite Investigation of Asian Air Quality (ASIA-AQ) field study (https://www-air.larc.nasa.gov/missions/asia-aq/index.html, last access: 14 August 2024) from January to March 2024. We find that to best simulate these studies, models with higher resolution than used here (< 25 km) would better be able to capture the behavior of OH and POx at varying levels of NOx, but resolution alone will not resolve model underestimates in HCHO and OH reactivity without improvements to VOC emissions inventories.
The GEOS-Chem model used here and the analysis code are available at https://doi.org/10.5281/zenodo.10819248 (Travis, 2024b). The F0AM box-modeling work from Nault et al. (2024) is available at https://doi.org/10.5281/zenodo.10723227 (Travis, 2024a). The KORUS-AQ aircraft data are available at https://doi.org/10.5067/SUBORBITAL/KORUSAQ/DATA01 (Chen, 2018).
The supplement related to this article is available online at: https://doi.org/10.5194/acp-24-9555-2024-supplement.
BAN and KRT conceptualized the manuscript. BAN performed the formal analysis of pO3 with input from KRT and JHC. KHB developed the new chemistry scheme for monoterpenes and new peroxynitrates in collaboration with KRT and BAN. DRB, RCC, AF, SRH, LGH, YRL, SM, KEM, IJS, and KU collected the observations used in this research and guided their use in this paper. KRT performed the modeling and analysis of results. All co-authors assisted with review and editing of the manuscript.
At least one of the (co-)authors is a member of the editorial board of Atmospheric Chemistry and Physics. The peer-review process was guided by an independent editor, and the authors also have no other competing interests to declare.
Publisher’s note: Copernicus Publications remains neutral with regard to jurisdictional claims made in the text, published maps, institutional affiliations, or any other geographical representation in this paper. While Copernicus Publications makes every effort to include appropriate place names, the final responsibility lies with the authors.
Benjamin A. Nault, Katherine R. Travis, Samuel R. Hall, Kirk Ullman, Donald R. Blake, Simone Meinardi, and Isobel J. Simpson acknowledge financial support received from NASA. We acknowledge William H. Brune, Alexander B. Thames, and David O. Miller for their measurements of OHR, OH, and HO2. We acknowledge Paul Wennberg and John Crounse for the measurements from CIT-CIMS. We acknowledge Glenn Diskin and Joshua DiGangi for their measurements of CO and CH4. We acknowledge Andrew Weinheimer for his measurements of O3, NO, and NO2 and Armin Wisthaler for his measurements of VOCs. We thank Tori Barber for her helpful discussions.
Benjamin A. Nault and Katherine R. Travis have been supported by NASA (grant no. 80NSSC22K0283). Samuel R. Hall and Kirk Ullman have been supported by NASA (grant no. NNX15AT99G). Donald R. Blake, Simone Meinardi, and Isobel J. Simpson have been supported by NASA (grant no. NNX15AT92G).
This paper was edited by Qi Chen and reviewed by two anonymous referees.
Arata, C., Misztal, P. K., Tian, Y., Lunderberg, D. M., Kristensen, K., Novoselac, A., Vance, M. E., Farmer, D. K., Nazaroff, W. W., and Goldstein, A. H.: Volatile organic compound emissions during HOMEChem, Indoor Air, 31, 2099–2117, https://doi.org/10.1111/ina.12906, 2021.
Bates, K. H., Jacob, D. J., Li, K., Ivatt, P. D., Evans, M. J., Yan, Y., and Lin, J.: Development and evaluation of a new compact mechanism for aromatic oxidation in atmospheric models, Atmos. Chem. Phys., 21, 18351–18374, https://doi.org/10.5194/acp-21-18351-2021, 2021.
Bertram, T. H., Perring, A. E., Wooldridge, P. J., Dibb, J., Avery, M. A., and Cohen, R. C.: On the export of reactive nitrogen from Asia: NOx partitioning and effects on ozone, Atmos. Chem. Phys., 13, 4617–4630, https://doi.org/10.5194/acp-13-4617-2013, 2013.
Borbon, A., Dominutti, P., Panopoulou, A., Gros, V., Sauvage, S., Farhat, M., Afif, C., Elguindi, N., Fornaro, A., Granier, C., Hopkins, J. R., Liakakou, E., Nogueira, T., Corrêa dos Santos, T., Salameh, T., Armangaud, A., Piga, D., and Perrussel, O.: Ubiquity of anthropogenic terpenoids in cities worldwide: Emission ratios, emission quantification and implications for urban atmospheric chemistry, J. Geophys. Res.-Atmos., 128, e2022JD037566, https://doi.org/10.1029/2022JD037566, 2023.
Bowman, J. H., Barket, D. J., and Shepson, P. B.: Atmospheric Chemistry of Nonanal, Environ. Sci. Technol., 37, 2218–2225, https://doi.org/10.1021/es026220p, 2003.
Brune, W. H., Miller, D. O., Thames, A. B., Allen, H. M., Apel, E. C., Blake, D. R., Bui, T. P., Commane, R., Crounse, J. D., Daube, B. C., Diskin, G. S., DiGangi, J. P., Elkins, J. W., Hall, S. R., Hanisco, T. F., Hannun, R. A., Hintsa, E. J., Hornbrook, R. S., Kim, M. J., McKain, K., Moore, F. L., Neuman, J. A., Nicely, J. M., Peischl, J., Ryerson, T. B., St. Clair, J. M., Sweeney, C., Teng, A. P., Thompson, C., Ullmann, K., Veres, P. R., Wennberg, P. O., and Wolfe, G. M.: Exploring Oxidation in the Remote Free Troposphere: Insights From Atmospheric Tomography (ATom), J. Geophys. Res. Atmos., 125, e2019JD031685, https://doi.org/10.1029/2019JD031685, 2020.
Carter, W. P. L.: Documentation of the SAPRC-99 Chemical Mechanism for VOC Reactivity Assessment, University of California, Riverside, Report Number 98-AP-RT17-001-FR, https://intra.engr.ucr.edu/~carter/pubs/s99doc.pdf (last access: 14 August 2024), 1999.
Chen, G.: KorUS-AQ Airborne Mission Overview, NASA Langley Atmospheric Science Data Center DAAC [data set], https://doi.org/10.5067/SUBORBITAL/KORUSAQ/DATA01, 2018.
Choi, J., Henze, D. K., Cao, H., Nowlan, C. R., González Abad, G., Kwon, H., Lee, H., Oak, Y. J., Park, R. J., Bates, K. H., Maasakkers, J. D., Wisthaler, A., and Weinheimer, A. J.: An Inversion Framework for Optimizing Non-Methane VOC Emissions Using Remote Sensing and Airborne Observations in Northeast Asia During the KORUS-AQ Field Campaign, J. Geophys. Res.-Atmos., 127, e2021JD035844, https://doi.org/10.1029/2021JD035844, 2022.
Coggon, M. M., Gkatzelis, G. I., McDonald, B. C., Gilman, J. B., Schwantes, R. H., Abuhassan, N., Aikin, K. C., Arend, M. F., Berkoff, T. A., Brown, S. S., Campos, T. L., Dickerson, R. R., Gronoff, G., Hurley, J. F., Isaacman-VanWertz, G., Koss, A. R., Li, M., McKeen, S. A., Moshary, F., Peischl, J., Pospisilova, V., Ren, X., Wilson, A., Wu, Y., Trainer, M., and Warneke, C.: Volatile chemical product emissions enhance ozone and modulate urban chemistry, P. Natl. Acad. Sci. USA, 118, e2026653118, https://doi.org/10.1073/pnas.2026653118, 2021.
Coggon, M. M., Stockwell, C. E., Xu, L., Peischl, J., Gilman, J. B., Lamplugh, A., Bowman, H. J., Aikin, K., Harkins, C., Zhu, Q., Schwantes, R. H., He, J., Li, M., Seltzer, K., McDonald, B., and Warneke, C.: Contribution of Cooking Emissions to the Urban Volatile Organic Compounds in Las Vegas, NV, EGUsphere [preprint], https://doi.org/10.5194/egusphere-2023-2749, 2023.
Coggon, M. M., Stockwell, C. E., Claflin, M. S., Pfannerstill, E. Y., Xu, L., Gilman, J. B., Marcantonio, J., Cao, C., Bates, K., Gkatzelis, G. I., Lamplugh, A., Katz, E. F., Arata, C., Apel, E. C., Hornbrook, R. S., Piel, F., Majluf, F., Blake, D. R., Wisthaler, A., Canagaratna, M., Lerner, B. M., Goldstein, A. H., Mak, J. E., and Warneke, C.: Identifying and correcting interferences to PTR-ToF-MS measurements of isoprene and other urban volatile organic compounds, Atmos. Meas. Tech., 17, 801–825, https://doi.org/10.5194/amt-17-801-2024, 2024.
Colombi, N. K., Jacob, D. J., Yang, L. H., Zhai, S., Shah, V., Grange, S. K., Yantosca, R. M., Kim, S., and Liao, H.: Why is ozone in South Korea and the Seoul metropolitan area so high and increasing?, Atmos. Chem. Phys., 23, 4031–4044, https://doi.org/10.5194/acp-23-4031-2023, 2023.
Crawford, J. H., Ahn, J.-Y., Al-Saadi, J., Chang, L., Emmons, L. K., Kim, J., Lee, G., Park, J.-H., Park, R. J., Woo, J. H., Song, C.-K., Hong, J.-H., Hong, Y.-D., Lefer, B. L., Lee, M., Lee, T., Kim, S., Min, K.-E., Yum, S. S., Shin, H. J., Kim, Y.-W., Choi, J.-S., Park, J.-S., Szykman, J. J., Long, R. W., Jordan, C. E., Simpson, I. J., Fried, A., Dibb, J. E., Cho, S., and Kim, Y. P.: The Korea–United States Air Quality (KORUS-AQ) field study, Elementa: Science of the Anthropocene, 9, 00163, https://doi.org/10.1525/elementa.2020.00163, 2021.
Crounse, J. D.: Measurement of Gas-Phase Hydroperoxides by Chemical Ionization Mass Spectrometry, Anal. Chem., 78, 6726–6732, https://doi.org/10.1021/ac0604235, 2006.
Day, D. A., Wooldridge, P. J., Dillon, M. B., Thornton, J. A., and Cohen, R. C.: A thermal dissociation laser-induced fluorescence instrument for in situ detection of NO2, peroxy nitrates, alkyl nitrates, and HNO3, J. Geophys. Res., 107, ACH 4-1–ACH 4-14, https://doi.org/10.1029/2001JD000779, 2002.
Decker, Z. C. J., Zarzana, K. J., Coggon, M., Min, K.-E., Pollack, I., Ryerson, T. B., Peischl, J., Edwards, P., Dubé, W. P., Markovic, M. Z., Roberts, J. M., Veres, P. R., Graus, M., Warneke, C., de Gouw, J., Hatch, L. E., Barsanti, K. C., and Brown, S. S.: Nighttime Chemical Transformation in Biomass Burning Plumes: A Box Model Analysis Initialized with Aircraft Observations, Environ. Sci. Technol., 53, 2529–2538, https://doi.org/10.1021/acs.est.8b05359, 2019.
de Gouw, J. A., Gilman, J. B., Kim, S. -W., Alvarez, S. L., Dusanter, S., Graus, M., Griffith, S. M., Isaacman-VanWertz, G., Kuster, W. C., Lefer, B. L., Lerner, B. M., McDonald, B. C., Rappenglück, B., Roberts, J. M., Stevens, P. S., Stutz, J., Thalman, R., Veres, P. R., Volkamer, R., Warneke, C., Washenfelder, R. A., and Young, C. J.: Chemistry of Volatile Organic Compounds in the Los Angeles Basin: Formation of Oxygenated Compounds and Determination of Emission Ratios, J. Geophys. Res.-Atmos., 123, 2298–2319, https://doi.org/10.1002/2017JD027976, 2018.
Faloona, I. C., Tan, D., Lesher, R. L., Hazen, N. L., Frame, C. L., Simpas, J. B., Harder, H., Martinez, M., Di Carlo, P., Ren, X., and Brune, W. H.: A Laser-induced Fluorescence Instrument for Detecting Tropospheric OH and HO2: Characteristics and Calibration, J. Atmos. Chem., 47, 139–167, https://doi.org/10.1023/B:JOCH.0000021036.53185.0e, 2004.
Farmer, D. K., Perring, A. E., Wooldridge, P. J., Blake, D. R., Baker, A., Meinardi, S., Huey, L. G., Tanner, D., Vargas, O., and Cohen, R. C.: Impact of organic nitrates on urban ozone production, Atmos. Chem. Phys., 11, 4085–4094, https://doi.org/10.5194/acp-11-4085-2011, 2011.
Fischer, E. V., Jacob, D. J., Yantosca, R. M., Sulprizio, M. P., Millet, D. B., Mao, J., Paulot, F., Singh, H. B., Roiger, A., Ries, L., Talbot, R. W., Dzepina, K., and Pandey Deolal, S.: Atmospheric peroxyacetyl nitrate (PAN): a global budget and source attribution, Atmos. Chem. Phys., 14, 2679–2698, https://doi.org/10.5194/acp-14-2679-2014, 2014.
Fisher, J. A., Jacob, D. J., Travis, K. R., Kim, P. S., Marais, E. A., Chan Miller, C., Yu, K., Zhu, L., Yantosca, R. M., Sulprizio, M. P., Mao, J., Wennberg, P. O., Crounse, J. D., Teng, A. P., Nguyen, T. B., St. Clair, J. M., Cohen, R. C., Romer, P., Nault, B. A., Wooldridge, P. J., Jimenez, J. L., Campuzano-Jost, P., Day, D. A., Hu, W., Shepson, P. B., Xiong, F., Blake, D. R., Goldstein, A. H., Misztal, P. K., Hanisco, T. F., Wolfe, G. M., Ryerson, T. B., Wisthaler, A., and Mikoviny, T.: Organic nitrate chemistry and its implications for nitrogen budgets in an isoprene- and monoterpene-rich atmosphere: constraints from aircraft (SEAC4RS) and ground-based (SOAS) observations in the Southeast US, Atmos. Chem. Phys., 16, 5969–5991, https://doi.org/10.5194/acp-16-5969-2016, 2016.
Fried, A., Walega, J., Weibring, P., Richter, D., Simpson, I. J., Blake, D. R., Blake, N. J., Meinardi, S., Barletta, B., Hughes, S. C., Crawford, J. H., Diskin, G., Barrick, J., Hair, J., Fenn, M., Wisthaler, A., Mikoviny, T., Woo, J.-H., Park, M., Kim, J., Min, K.-E., Jeong, S., Wennberg, P. O., Kim, M. J., Crounse, J. D., Teng, A. P., Bennett, R., Yang-Martin, M., Shook, M. A., Huey, G., Tanner, D., Knote, C., Kim, J., Park, R., and Brune, W.: Airborne formaldehyde and volatile organic compound measurements over the Daesan petrochemical complex on Korea's northwest coast during the Korea-United States Air Quality study, Elementa: Science of the Anthropocene, 8, 121, https://doi.org/10.1525/elementa.2020.121, 2020.
Gaubert, B., Emmons, L. K., Raeder, K., Tilmes, S., Miyazaki, K., Arellano Jr., A. F., Elguindi, N., Granier, C., Tang, W., Barré, J., Worden, H. M., Buchholz, R. R., Edwards, D. P., Franke, P., Anderson, J. L., Saunois, M., Schroeder, J., Woo, J.-H., Simpson, I. J., Blake, D. R., Meinardi, S., Wennberg, P. O., Crounse, J., Teng, A., Kim, M., Dickerson, R. R., He, H., Ren, X., Pusede, S. E., and Diskin, G. S.: Correcting model biases of CO in East Asia: impact on oxidant distributions during KORUS-AQ, Atmos. Chem. Phys., 20, 14617–14647, https://doi.org/10.5194/acp-20-14617-2020, 2020.
Gen, M., Liang, Z., Zhang, R., Go Mabato, B. R., and Chan, C. K.: Particulate nitrate photolysis in the atmosphere, Environmental Science: Atmospheres, 2, 111–127, https://doi.org/10.1039/D1EA00087J, 2022.
Gkatzelis, G. I., Coggon, M. M., McDonald, B. C., Peischl, J., Aikin, K. C., Gilman, J. B., Trainer, M., and Warneke, C.: Identifying Volatile Chemical Product Tracer Compounds in U.S. Cities, Environ. Sci. Technol., 55, 188–199, https://doi.org/10.1021/acs.est.0c05467, 2021.
Ho, S. S. H., Yu, J. Z., Chu, K. W., and Yeung, L. L.: Carbonyl Emissions from Commercial Cooking Sources in Hong Kong, J. Air Waste Manage., 56, 1091–1098, 2006.
Jenkin, M. E., Saunders, S. M., and Pilling, M. E.: The tropospheric degradation of volatile organic compounds: a protocol for mechanism development, Atmos. Environ., 31, 81–104, 1997.
Jo, D. S., Emmons, L. K., Callaghan, P., Tilmes, S., Woo, J., Kim, Y., Kim, J., Granier, C., Soulié, A., Doumbia, T., Darras, S., Buchholz, R. R., Simpson, I. J., Blake, D. R., Wisthaler, A., Schroeder, J. R., Fried, A., and Kanaya, Y.: Comparison of Urban Air Quality Simulations During the KORUS-AQ Campaign With Regionally Refined Versus Global Uniform Grids in the Multi-Scale Infrastructure for Chemistry and Aerosols (MUSICA) Version 0, J. Adv. Model. Earth Sy., 15, e2022MS003458, https://doi.org/10.1029/2022MS003458, 2023.
Kenagy, H. S., Romer Present, P. S., Wooldridge, P. J., Nault, B. A., Campuzano-Jost, P., Day, D. A., Jimenez, J. L., Zare, A., Pye, H. O. T., Yu, J., Song, C. H., Blake, D. R., Woo, J.-H., Kim, Y., and Cohen, R. C.: Contribution of Organic Nitrates to Organic Aerosol over South Korea during KORUS-AQ, Environ. Sci. Technol., 55, 16326–16338, https://doi.org/10.1021/acs.est.1c05521, 2021.
Khare, P. and Gentner, D. R.: Considering the future of anthropogenic gas-phase organic compound emissions and the increasing influence of non-combustion sources on urban air quality, Atmos. Chem. Phys., 18, 5391–5413, https://doi.org/10.5194/acp-18-5391-2018, 2018.
Kim, H., Park, R. J., Kim, S., Brune, W. H., Diskin, G. S., Fried, A., Hall, S. R., Weinheimer, A. J., Wennberg, P., Wisthaler, A., Blake, D. R., and Ullmann, K.: Observed versus simulated OH reactivity during KORUS-AQ campaign: Implications for emission inventory and chemical environment in East Asia, Elementa: Science of the Anthropocene, 10, 00030, https://doi.org/10.1525/elementa.2022.00030, 2022.
Kim, S., Sanchez, D., Wang, M., Seco, R., Jeong, D., Hughes, S., Barletta, B., Blake, D. R., Jung, J., Kim, D., Lee, G., Lee, M., Ahn, J., Lee, S.-D., Cho, G., Sung, M.-Y., Lee, Y.-H., Kim, D. B., Kim, Y., Woo, J.-H., Jo, D., Park, R., Park, J.-H., Hong, Y.-D., and Hong, J.-H.: OH reactivity in urban and suburban regions in Seoul, South Korea – an East Asian megacity in a rapid transition, Faraday Discuss., 189, 231–251, https://doi.org/10.1039/C5FD00230C, 2016.
Kim, K.-M., Kim, S.-W., Seo, S., Blake, D. R., Cho, S., Crawford, J. H., Emmons, L. K., Fried, A., Herman, J. R., Hong, J., Jung, J., Pfister, G. G., Weinheimer, A. J., Woo, J.-H., and Zhang, Q.: Sensitivity of the WRF-Chem v4.4 simulations of ozone and formaldehyde and their precursors to multiple bottom-up emission inventories over East Asia during the KORUS-AQ 2016 field campaign, Geosci. Model Dev., 17, 1931–1955, https://doi.org/10.5194/gmd-17-1931-2024, 2024.
Koplitz, S., Simon, H., Henderson, B., Liljegren, J., Tonnesen, G., Whitehill, A., and Wells, B.: Changes in Ozone Chemical Sensitivity in the United States from 2007 to 2016, ACS Environ. Au, 2, 206–222, https://doi.org/10.1021/acsenvironau.1c00029, 2021.
Kwon, H.-A., Park, R. J., Oak, Y. J., Nowlan, C. R., Janz, S. J., Kowalewski, M. G., Fried, A., Walega, J., Bates, K. H., Choi, J., Blake, D. R., Wisthaler, A., and Woo, J.-H.: Top-down estimates of anthropogenic VOC emissions in South Korea using formaldehyde vertical column densities from aircraft during the KORUS-AQ campaign, Elementa: Science of the Anthropocene, 9, 00109, https://doi.org/10.1525/elementa.2021.00109, 2021.
Lee, H.-J., Chang, L.-S., Jaffe, D. A., Bak, J., Liu, X., Abad, G. G., Jo, H.-Y., Jo, Y.-J., Lee, J.-B., and Kim, C.-H.: Ozone Continues to Increase in East Asia Despite Decreasing NO2: Causes and Abatements, Remote Sens.-Basel, 13, 2177, https://doi.org/10.3390/rs13112177, 2021.
Lee, Y. R., Ji, Y., Tanner, D. J., and Huey, L. G.: A low-activity ion source for measurement of atmospheric gases by chemical ionization mass spectrometry, Atmos. Meas. Tech., 13, 2473–2480, https://doi.org/10.5194/amt-13-2473-2020, 2020.
Lee, Y. R., Huey, L. G., Tanner, D. J., Takeuchi, M., Qu, H., Liu, X., Ng, N. L., Crawford, J. H., Fried, A., Richter, D., Simpson, I. J., Blake, D. R., Blake, N. J., Meinardi, S., Kim, S., Diskin, G. S., Digangi, J. P., Choi, Y., Pusede, S. E., Wennberg, P. O., Kim, M. J., Crounse, J. D., Teng, A. P., Cohen, R. C., Romer, P. S., Brune, W., Wisthaler, A., Mikoviny, T., Jimenez, J. L., Campuzano-Jost, P., Nault, B. A., Weinheimer, A., Hall, S. R., and Ullmann, K.: An investigation of petrochemical emissions during KORUS-AQ: Ozone production, reactive nitrogen evolution, and aerosol production, Elementa: Science of the Anthropocene, 10, 00079, https://doi.org/10.1525/elementa.2022.00079, 2022.
Lurmann, F. W., Lloyd, A. C., and Atkinson, R.: A chemical mechanism for use in long-range transport/acid deposition computer modeling, J. Geophys. Res., 91, 10905, https://doi.org/10.1029/JD091iD10p10905, 1986.
McDonald, B. C., Gouw, J. A. de, Gilman, J. B., Jathar, S. H., Akherati, A., Cappa, C. D., Jimenez, J. L., Lee-Taylor, J., Hayes, P. L., McKeen, S. A., Cui, Y. Y., Kim, S.-W., Gentner, D. R., Isaacman-VanWertz, G., Goldstein, A. H., Harley, R. A., Frost, G. J., Roberts, J. M., Ryerson, T. B., and Trainer, M.: Volatile chemical products emerging as largest petrochemical source of urban organic emissions, Science, 359, 760–764, https://doi.org/10.1126/science.aaq0524, 2018.
McDuffie, E. E., Smith, S. J., O'Rourke, P., Tibrewal, K., Venkataraman, C., Marais, E. A., Zheng, B., Crippa, M., Brauer, M., and Martin, R. V.: A global anthropogenic emission inventory of atmospheric pollutants from sector- and fuel-specific sources (1970–2017): an application of the Community Emissions Data System (CEDS), Earth Syst. Sci. Data, 12, 3413–3442, https://doi.org/10.5194/essd-12-3413-2020, 2020.
Miyazaki, K., Sekiya, T., Fu, D., Bowman, K. W., Kulawik, S. S., Sudo, K., Walker, T., Kanaya, Y., Takigawa, M., Ogochi, K., Eskes, H., Boersma, K. F., Thompson, A. M., Gaubert, B., Barre, J., and Emmons, L. K.: Balance of Emission and Dynamical Controls on Ozone During the Korea-United States Air Quality Campaign From Multiconstituent Satellite Data Assimilation, J. Geophys. Res.-Atmos., 124, 387–413, https://doi.org/10.1029/2018JD028912, 2019.
Nault, B. A., Travis, K. R., Crawford, J. H., Blake, D. R., Campuzano-Jost, P., Cohen, R. C., DiGangi, J. P., Diskin, G. S., Hall, S. R., Huey, L. G., Jimenez, J. L., Min, K.-E., Lee, Y. R., Simpson, I. J., Ullmann, K., and Wisthaler, A.: Using observed urban NOx sinks to constrain VOC reactivity and the ozone and radical budget in the Seoul Metropolitan Area, Atmos. Chem. Phys., 24, 9573–9595, https://doi.org/10.5194/acp-24-9573-2024, 2024.
Nihill, K. J., Ye, Q., Majluf, F., Krechmer, J. E., Canagaratna, M. R., and Kroll, J. H.: Influence of the Ratio on Oxidation Product Distributions under High-NO Conditions, Environ. Sci. Technol., 55, 6594–6601, https://doi.org/10.1021/acs.est.0c07621, 2021.
Noziere, B. and Barnes, I.: Evidence for formation of a PAN analogue of pinonic structure and investigation of its thermal stability, J. Geophys. Res.-Atmos., 103, 25587–25597, https://doi.org/10.1029/98JD01677, 1998.
Park, R. J., Oak, Y. J., Emmons, L. K., Kim, C.-H., Pfister, G. G., Carmichael, G. R., Saide, P. E., Cho, S.-Y., Kim, S., Woo, J.-H., Crawford, J. H., Gaubert, B., Lee, H.-J., Park, S.-Y., Jo, Y.-J., Gao, M., Tang, B., Stanier, C. O., Shin, S. S., Park, H. Y., Bae, C., and Kim, E.: Multi-model intercomparisons of air quality simulations for the KORUS-AQ campaign, Elementa: Science of the Anthropocene, 9, 00139, https://doi.org/10.1525/elementa.2021.00139, 2021.
Peng, Y., Mouat, A. P., Hu, Y., Li, M., McDonald, B. C., and Kaiser, J.: Source appointment of volatile organic compounds and evaluation of anthropogenic monoterpene emission estimates in Atlanta, Georgia, Atmos. Environ., 288, 119324, https://doi.org/10.1016/j.atmosenv.2022.119324, 2022.
Peron, A., Graus, M., Striednig, M., Lamprecht, C., Wohlfahrt, G., and Karl, T.: Deciphering anthropogenic and biogenic contributions to selected NMVOC emissions in an urban area, EGUsphere [preprint], https://doi.org/10.5194/egusphere-2024-79, 2024.
Perring, A. E., Bertram, T. H., Farmer, D. K., Wooldridge, P. J., Dibb, J., Blake, N. J., Blake, D. R., Singh, H. B., Fuelberg, H., Diskin, G., Sachse, G., and Cohen, R. C.: The production and persistence of ΣRONO2 in the Mexico City plume, Atmos. Chem. Phys., 10, 7215–7229, https://doi.org/10.5194/acp-10-7215-2010, 2010.
Richter, D., Weibring, P., Walega, J. G., Fried, A., Spuler, S. M., and Taubman, M. S.: Compact highly sensitive multi-species airborne mid-IR spectrometer, Appl. Phys. B, 119, 119–131, https://doi.org/10.1007/s00340-015-6038-8, 2015.
Roberts, J. M., Flocke, F., Weinheimer, A., Tanimoto, H., Jobson, B. T., Riemer, D., Apel, E., Atlas, E., Donnelly, S., Stroud, V., Johnson, K., Weaver, R., and Fehsenfeld, F. C.: Observations of APAN during TexAQS 2000, Geophys. Res. Lett., 28, 4195–4198, https://doi.org/10.1029/2001GL013466, 2001.
Roberts, J. M., Neuman, J. A., Brown, S. S., Veres, P. R., Coggon, M. M., Stockwell, C. E., Warneke, C., Peischl, J., and Robinson, M. A.: Furoyl peroxynitrate (fur-PAN), a product of VOC–NOx photochemistry from biomass burning emissions: photochemical synthesis, calibration, chemical characterization, and first atmospheric observations, Environmental Science: Atmospheres, 2, 1087–1100, https://doi.org/10.1039/D2EA00068G, 2022.
Rowlinson, M. J., Carpenter, L., Read, K., Punjabi, S., Adedeji, A., Fakes, L., Lewis, A., Richmond, B., Passant, N., Murrells, T., Henderson, B., Bates, K., Helmig, D., and Evans, M.: Revising VOC emissions speciation improves global simulations of ethane and propane, EGUsphere [preprint], https://doi.org/10.5194/egusphere-2023-2557, 2023.
Sachse, G. W., Hill, G. F., Wade, L. O., and Perry, M. G.: Fast-response, high-precision carbon monoxide sensor using a tunable diode laser absorption technique, J. Geophys. Res., 92, 2071–2081, https://doi.org/10.1029/JD092iD02p02071, 1987.
Saunders, S. M., Jenkin, M. E., Derwent, R. G., and Pilling, M. J.: Protocol for the development of the Master Chemical Mechanism, MCM v3 (Part A): tropospheric degradation of non-aromatic volatile organic compounds, Atmos. Chem. Phys., 3, 161–180, https://doi.org/10.5194/acp-3-161-2003, 2003.
Schroeder, J. R., Crawford, J. H., Ahn, J.-Y., Chang, L., Fried, A., Walega, J., Weinheimer, A., Montzka, D. D., Hall, S. R., Ullmann, K., Wisthaler, A., Mikoviny, T., Chen, G., Blake, D. R., Blake, N. J., Hughes, S. C., Meinardi, S., Diskin, G., Digangi, J. P., Choi, Y., Pusede, S. E., Huey, G. L., Tanner, D. J., Kim, M., and Wennberg, P.: Observation-based modeling of ozone chemistry in the Seoul metropolitan area during the Korea-United States Air Quality Study (KORUS-AQ), Elementa: Science of the Anthropocene, 8, 3, https://doi.org/10.1525/elementa.400, 2020.
Shetter, R. E. and Müller, M.: Photolysis frequency measurements using actinic flux spectroradiometry during the PEM-Tropics mission: Instrumentation description and some results, J. Geophys. Res.-Atmos., 104, 5647–5661, https://doi.org/10.1029/98JD01381, 1999.
Shi, Q., Tao, Y., Krechmer, J. E., Heald, C. L., Murphy, J. G., Kroll, J. H., and Ye, Q.: Laboratory Investigation of Renoxification from the Photolysis of Inorganic Particulate Nitrate, Environ. Sci. Technol., 55, 854–861, https://doi.org/10.1021/acs.est.0c06049, 2021.
Simpson, I. J., Blake, D. R., Blake, N. J., Meinardi, S., Barletta, B., Hughes, S. C., Fleming, L. T., Crawford, J. H., Diskin, G. S., Emmons, L. K., Fried, A., Guo, H., Peterson, D. A., Wisthaler, A., Woo, J.-H., Barré, J., Gaubert, B., Kim, J., Kim, M. J., Kim, Y., Knote, C., Mikoviny, T., Pusede, S. E., Schroeder, J. R., Wang, Y., Wennberg, P. O., and Zeng, L.: Characterization, sources and reactivity of volatile organic compounds (VOCs) in Seoul and surrounding regions during KORUS-AQ, Elementa: Science of the Anthropocene, 8, 37, https://doi.org/10.1525/elementa.434, 2020.
Slusher, D. L., Huey, L. G., Tanner, D. J., Flocke, F. M., and Roberts, J. M.: A thermal dissociation–chemical ionization mass spectrometry (TD-CIMS) technique for the simultaneous measurement of peroxyacyl nitrates and dinitrogen pentoxide, J. Geophys. Res., 109, D19315, https://doi.org/10.1029/2004JD004670, 2004.
Sommariva, R., de Gouw, J. A., Trainer, M., Atlas, E., Goldan, P. D., Kuster, W. C., Warneke, C., and Fehsenfeld, F. C.: Emissions and photochemistry of oxygenated VOCs in urban plumes in the Northeastern United States, Atmos. Chem. Phys., 11, 7081–7096, https://doi.org/10.5194/acp-11-7081-2011, 2011.
Sommariva, R., Alam, M. S., Crilley, L. R., Rooney, D. J., Bloss, W. J., Fomba, K. W., Andersen, S. T., and Carpenter, L. J.: Factors Influencing the Formation of Nitrous Acid from Photolysis of Particulate Nitrate, J. Phys. Chem. A, 127, 9302–9310, https://doi.org/10.1021/acs.jpca.3c03853, 2023.
St. Clair, J. M., McCabe, D. C., Crounse, J. D., Steiner, U., and Wennberg, P. O.: Chemical ionization tandem mass spectrometer for the in situ measurement of methyl hydrogen peroxide, Rev. Sci. Instrum., 81, 094102, https://doi.org/10.1063/1.3480552, 2010.
The International GEOS-Chem User Community: geoschem/GCClassic: GEOS-Chem 13.4.0, Zenodo [code], https://doi.org/10.5281/zenodo.6511970, 2022.
Tomsche, L., Piel, F., Mikoviny, T., Nielsen, C. J., Guo, H., Campuzano-Jost, P., Nault, B. A., Schueneman, M. K., Jimenez, J. L., Halliday, H., Diskin, G., DiGangi, J. P., Nowak, J. B., Wiggins, E. B., Gargulinski, E., Soja, A. J., and Wisthaler, A.: Measurement report: Emission factors of NH3 and NHx for wildfires and agricultural fires in the United States, Atmos. Chem. Phys., 23, 2331–2343, https://doi.org/10.5194/acp-23-2331-2023, 2023.
Travis, K.: F0AM Model setup for Nault et al., 2024 (egusphere-2024-596), Version v1, Zenodo [code], https://doi.org/10.5281/zenodo.10723227, 2024a.
Travis, K.: Model and analysis code for Travis et al., 2024 (egusphere-2024-951), Version v1, Zenodo [code], https://doi.org/10.5281/zenodo.10819248, 2024b.
Travis, K. R., Crawford, J. H., Chen, G., Jordan, C. E., Nault, B. A., Kim, H., Jimenez, J. L., Campuzano-Jost, P., Dibb, J. E., Woo, J.-H., Kim, Y., Zhai, S., Wang, X., McDuffie, E. E., Luo, G., Yu, F., Kim, S., Simpson, I. J., Blake, D. R., Chang, L., and Kim, M. J.: Limitations in representation of physical processes prevent successful simulation of PM2.5 during KORUS-AQ, Atmos. Chem. Phys., 22, 7933–7958, https://doi.org/10.5194/acp-22-7933-2022, 2022.
von Schneidemesser, E., McDonald, B. C., Denier van der Gon, H., Crippa, M., Guizzardi, D., Borbon, A., Dominutti, P., Huang, G., Jansens-Maenhout, G., Li, M., Ou-Yang, C., Tisinai, S., and Wang, J.: Comparing Urban Anthropogenic NMVOC Measurements with Representation in Emission Inventories – A Global Perspective, J. Geophys. Res.-Atmos., 128, e2022JD037906, https://doi.org/10.1029/2022JD037906, 2023.
Warneke, C., Schwantes, R., Veres, P. R., Rollins, A., Baidar, S., Alan, W., Senff, C., Langford, A., Aikin, K., Frost, G., Fahey, D., Lefer, B., Pierce, R. B., Kondragunta, S., Stockwell, C., Gentner, D., Lambe, A. T., Millet, D. B., Farmer, D., Ng, N. L., Kaiser, J., Young, C., Mak, J. E., Wolfe, G. M., Sullivan, J., Mueller, K., Karion, A., Valin, L., Witte, M., Russell, L. M., Ren, X., Dickerson, R., Decarlo, P., McDonald, B., and Brown, S. S.: The AEROMMA 2023 experiment (Atmospheric Emissions and Reactions Observed from Megacities to Marine Areas), https://csl.noaa.gov/projects/aeromma/whitepaper.pdf (last access: 19 December 2023), 2023.
Weinheimer, A. J., Walega, J. G., Ridley, B. A., Sachse, G. W., Anderson, B. E., and Collins, J. E.: Stratospheric NOy measurements on the NASA DC-8 during AASE II, Geophys. Res. Lett., 20, 2563–2566, https://doi.org/10.1029/93GL02627, 1993.
Weinheimer, A. J., Walega, J. G., Ridley, B. A., Gary, B. L., Blake, D. R., Blake, N. J., Rowland, F. S., Sachse, G. W., Anderson, B. E., and Collins, J. E.: Meridional distributions of NOx, NOy, and other species in the lower stratosphere and upper troposphere during AASE II, Geophys. Res. Lett., 21, 2583–2586, https://doi.org/10.1029/94GL01897, 1994.
Wernis, R. A., Kreisberg, N. M., Weber, R. J., Drozd, G. T., and Goldstein, A. H.: Source apportionment of VOCs, IVOCs and SVOCs by positive matrix factorization in suburban Livermore, California, Atmos. Chem. Phys., 22, 14987–15019, https://doi.org/10.5194/acp-22-14987-2022, 2022.
Wolfe, G. M., Thornton, J. A., McNeill, V. F., Jaffe, D. A., Reidmiller, D., Chand, D., Smith, J., Swartzendruber, P., Flocke, F., and Zheng, W.: Influence of trans-Pacific pollution transport on acyl peroxy nitrate abundances and speciation at Mount Bachelor Observatory during INTEX-B, Atmos. Chem. Phys., 7, 5309–5325, https://doi.org/10.5194/acp-7-5309-2007, 2007.
Wooldridge, P. J., Perring, A. E., Bertram, T. H., Flocke, F. M., Roberts, J. M., Singh, H. B., Huey, L. G., Thornton, J. A., Wolfe, G. M., Murphy, J. G., Fry, J. L., Rollins, A. W., LaFranchi, B. W., and Cohen, R. C.: Total Peroxy Nitrates (ΣPNs) in the atmosphere: the Thermal Dissociation-Laser Induced Fluorescence (TD-LIF) technique and comparisons to speciated PAN measurements, Atmos. Meas. Tech., 3, 593–607, https://doi.org/10.5194/amt-3-593-2010, 2010.
Wu, C., Wang, C., Wang, S., Wang, W., Yuan, B., Qi, J., Wang, B., Wang, H., Wang, C., Song, W., Wang, X., Hu, W., Lou, S., Ye, C., Peng, Y., Wang, Z., Huangfu, Y., Xie, Y., Zhu, M., Zheng, J., Wang, X., Jiang, B., Zhang, Z., and Shao, M.: Measurement report: Important contributions of oxygenated compounds to emissions and chemistry of volatile organic compounds in urban air, Atmos. Chem. Phys., 20, 14769–14785, https://doi.org/10.5194/acp-20-14769-2020, 2020.
Yang, L. H., Jacob, D. J., Colombi, N. K., Zhai, S., Bates, K. H., Shah, V., Beaudry, E., Yantosca, R. M., Lin, H., Brewer, J. F., Chong, H., Travis, K. R., Crawford, J. H., Lamsal, L. N., Koo, J.-H., and Kim, J.: Tropospheric NO2 vertical profiles over South Korea and their relation to oxidant chemistry: implications for geostationary satellite retrievals and the observation of NO2 diurnal variation from space, Atmos. Chem. Phys., 23, 2465–2481, https://doi.org/10.5194/acp-23-2465-2023, 2023.
Zhu, Q., Schwantes, R. H., Coggon, M., Harkins, C., Schnell, J., He, J., Pye, H. O. T., Li, M., Baker, B., Moon, Z., Ahmadov, R., Pfannerstill, E. Y., Place, B., Wooldridge, P., Schulze, B. C., Arata, C., Bucholtz, A., Seinfeld, J. H., Warneke, C., Stockwell, C. E., Xu, L., Zuraski, K., Robinson, M. A., Neuman, A., Veres, P. R., Peischl, J., Brown, S. S., Goldstein, A. H., Cohen, R. C., and McDonald, B. C.: A better representation of VOC chemistry in WRF-Chem and its impact on ozone over Los Angeles, EGUsphere [preprint], https://doi.org/10.5194/egusphere-2023-2742, 2023.
- Abstract
- Introduction
- Observations during KORUS-AQ
- Modeling setup and improvements
- Impact of improved representation of VOCs on model photochemistry
- Model simulation of peroxy acyl nitrates (∑PNs)
- Evidence for unmeasured VOCs and their effects on ozone chemistry
- Conclusions
- Code and data availability
- Author contributions
- Competing interests
- Disclaimer
- Acknowledgements
- Financial support
- Review statement
- References
- Supplement