the Creative Commons Attribution 4.0 License.
the Creative Commons Attribution 4.0 License.
 | 28 Aug 2024
How horizontal transport and turbulent mixing impact aerosol particle and precursor concentrations at a background site in the UAE
Ewan J. O'Connor
Anne Hirsikko
John Backman
Maria Filioglou
Anu-Maija Sundström
Juha Tonttila
Heikki Lihavainen
Hannele Korhonen
Eija Asmi
The optical, physical, and chemical properties of aerosol particles have been previously studied in the United Arab Emirates (UAE), but there is still a gap in the knowledge of particle sources and in the horizontal and vertical transport of aerosol particles and their precursors in the area. To investigate how aerosol particle and SO2 concentrations at the surface responded to changes in horizontal and vertical transport, we used data from a 1-year measurement campaign at a background site where local sources of SO2 were expected to be minimal. The measurement campaign provided a combination of in situ measurements at the surface and the boundary layer evolution from vertical and horizontal wind profiles measured by a Doppler lidar. The diurnal structure of the boundary layer in the UAE was very similar from day to day, with a deep, well-mixed boundary layer during the day transitioning to a shallow nocturnal layer, with the maximum boundary layer height usually being reached around 14:00 local time. Both SO2 and nucleation-mode aerosol particle concentrations were elevated for surface winds coming from the east or western sectors. We attribute this to oil refineries located on the eastern and western coasts of the UAE. The concentrations of larger cloud condensation nuclei (CCN)-sized particles and their activation fraction did not show any clear dependence on wind direction, but the CCN number concentration showed some dependence on wind speed, with higher concentrations coinciding with the weakest surface winds. Peaks in SO2 concentrations were also observed despite low surface wind speeds and wind directions unfavourable for transport. However, winds aloft were much stronger, with wind speeds of 10 m s−1 at 1 km common at night and wind directions favourable for transport; surface-measured concentrations increased rapidly once these particular layers started to be entrained into the growing boundary layer, even if the surface wind direction was from a clean sector. These conditions also displayed higher nucleation-mode aerosol particle concentrations, i.e. new particle formation events occurring due to the increase in the gaseous precursor.
- Article
(6818 KB) - Full-text XML
- BibTeX
- EndNote


Aerosol particles have various climate impacts and need to be carefully studied to provide more accurate future climate predictions. Aerosol particles originate from both natural and anthropogenic sources. The smallest aerosol particles can form directly in the atmosphere through nucleation and growth of gaseous precursors (Kulmala et al., 2004) in a process called new particle formation (NPF). One of the most important NPF precursors in the atmosphere is sulfuric acid (H2SO4), forming through photochemical reactions from SO2 (Weber et al., 1997; Kulmala et al., 2000; Sipilä et al., 2010). A fraction of the ultrafine aerosol particles formed in the NPF events can further grow and act as cloud condensation nuclei (CCN) (Laaksonen et al., 2005; Kuang et al., 2009; Merikanto et al., 2009; Bzdek and Johnston, 2010). The CCN are important because of their ability to form cloud droplets, and their concentrations have been shown to modify cloud properties such as the lifetime of clouds and, hence, have an impact on cloudiness and rainfall patterns (Albrecht, 1989; Jiang et al., 2006). To understand the complex chain of aerosol particle processes which are critical for the climate, it is important to study the combination of SO2 concentration, newly formed aerosol particles, and CCN concentration in the atmosphere.
Horizontal air transport and vertical air transport constantly modify the aerosol particle population we measure at a fixed surface location and the transport phenomena connected with the local meteorology are important factors to consider to interpret the aerosol particle observations. In the Negev Desert of Israel, Derimian et al. (2017) observed a shift towards larger aerosol particle sizes in the aerosol particle size distribution, which was associated with the sea breeze arrival. Krishna Moorthy et al. (2003) also observed a shift towards larger sizes in the aerosol particle mass size distribution when the air mass changed from continental to marine at a remote coastal station near the south-west tip of the Indian Peninsula. Kumar et al. (2016) measured the highest mass concentrations of elemental carbon, organic carbon, and water-soluble organic carbon at a high-altitude site (Mount Abu) in western India during winter months and attributed it “to the synoptic-scale long-range transport from the emission source regions in the Indo-Gangetic Plain”. Zhang et al. (2009) found three different types of aerosol particle vertical distributions, which were associated with different meteorological and weather conditions in Beijing, China. Wagner et al. (2009) observed increased aerosol particle concentrations compared to the surface in an elevated plume of Saharan dust transported to Portugal and, hence, underlined the importance of multi-platform measurements. The findings from previous studies underline the importance of studying aerosol particles in context with the potential for transport, suggesting that the profile of the horizontal wind should be measured, as should the profile of turbulent mixing or the identification of the well-mixed boundary layer.
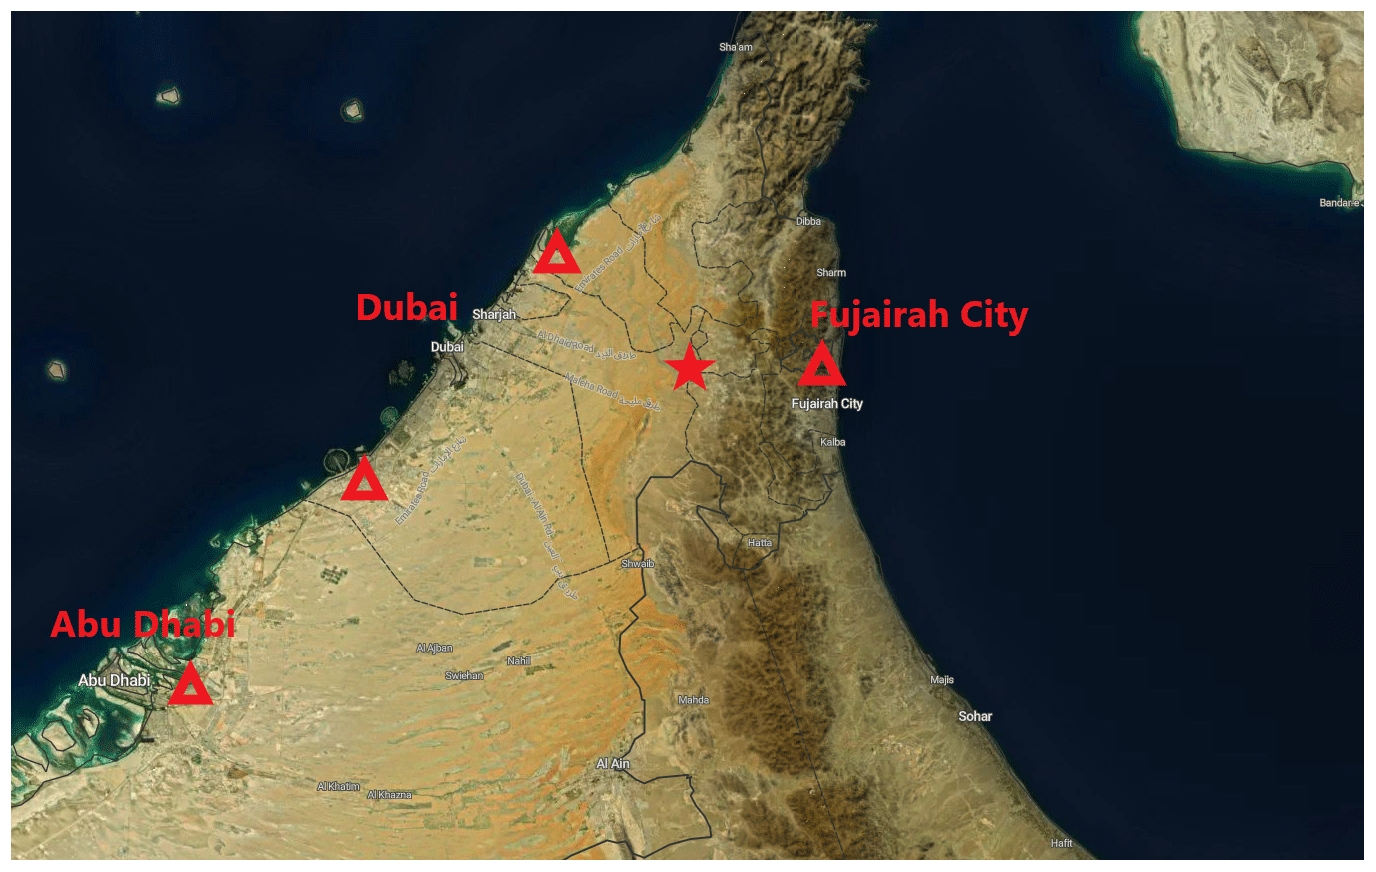
Figure 1A map (Buchhorn et al., 2020) showing the location of the measurement site with a red star. The red triangles represent the locations of significant oil refineries known by the writers. Copernicus Climate Change Service 2021. Figure and caption from Kesti et al. (2022).
The primary aerosol particles in the Arabian Peninsula originate from natural sources (desert dust, sea salt) and anthropogenic sources (road traffic, petroleum industry, and construction activities, Khodeir et al., 2012; Semeniuk et al., 2015; Lihavainen et al., 2016; Rushdi et al., 2017; Wehbe et al., 2021). In addition, the smaller secondary aerosol particles also play a key role in the region, according to previous studies. Exceptionally frequent and strong NPF events were observed in Hada Al Sham, Saudi Arabia, by Hakala et al. (2019). They attributed the NPF events to the transportation of precursor vapours, especially sulfuric acid, from coastal cities and industrial areas by the developed sea breeze in daytime. Frequent NPF events were also found in the United Arab Emirates (UAE) by Kesti et al. (2022).
There are only a few previous studies describing optical properties of aerosol particles in the UAE. Filioglou et al. (2020) reported the optical and geometrical properties of aerosol particles in the UAE region, suggesting “that the pure dust properties over the Middle East and western Asia, including the observation site, are comparable to those of African mineral dust regarding the linear particle depolarization ratios but not for the lidar ratios”. Long spatiotemporal trends of aerosol optical depth (AOD) in the UAE region were studied by Abuelgasim et al. (2021), and they found a significant increase in AOD during summer due to high wind speeds connected to primary aerosol particle sources. Beegum et al. (2016) investigated optical and radiative properties of aerosol particles over Abu Dhabi and found that AOD spectra varied “significantly throughout the year with higher aerosol loading and flatter spectra during spring/summer seasons and comparatively steeper spectra and lower values of AOD during autumn/winter seasons”. The physical and chemical properties of aerosol particles, and their response to mixing in the boundary layer, were studied by Kesti et al. (2022) at a background site in the UAE. They concluded that the vertical mixing of aerosol particles and their precursors potentially generates horizontal layers that could either favour or hinder secondary aerosol particle formation. Yet, aerosol particle and CCN regional sources, and the particle transport mechanisms and dynamics, have not been extensively studied in the UAE region.
Water shortage is a serious threat in the UAE and the larger Arabian Peninsula region (Wehbe et al., 2018; Wehbe and Temimi, 2021). Cloud seeding, as one of the precipitation enhancement techniques, has been under investigation as part of the UAE's strategy to solve water shortage issues (Al Hosari et al., 2021; Wehbe, 2022). The Optimization of Aerosol Seeding In rain enhancement Strategies (OASIS) project aimed to characterize the properties and efficiency of aerosol particles to act as CCN in the UAE region. In this study, we focus on how air mass transport and boundary layer mixing affect the aerosol particle and CCN concentrations measured at the surface. Typical methods for studying the vertical profile of aerosol particle properties are balloon sounding campaigns or aircraft measurements, but these methods are expensive and only cover short time periods. Here, we use continuous measurements of the lowest 2 km of the atmosphere with a ground-based Doppler lidar. This will help us to understand the surface–aerosol exchange in the area, which is not that well known. In Sect. 2, we give a brief description of the measurement site and methods used. In Sect. 3, we analyse how horizontal and vertical transport affect aerosol particle properties and SO2 concentration at the surface.
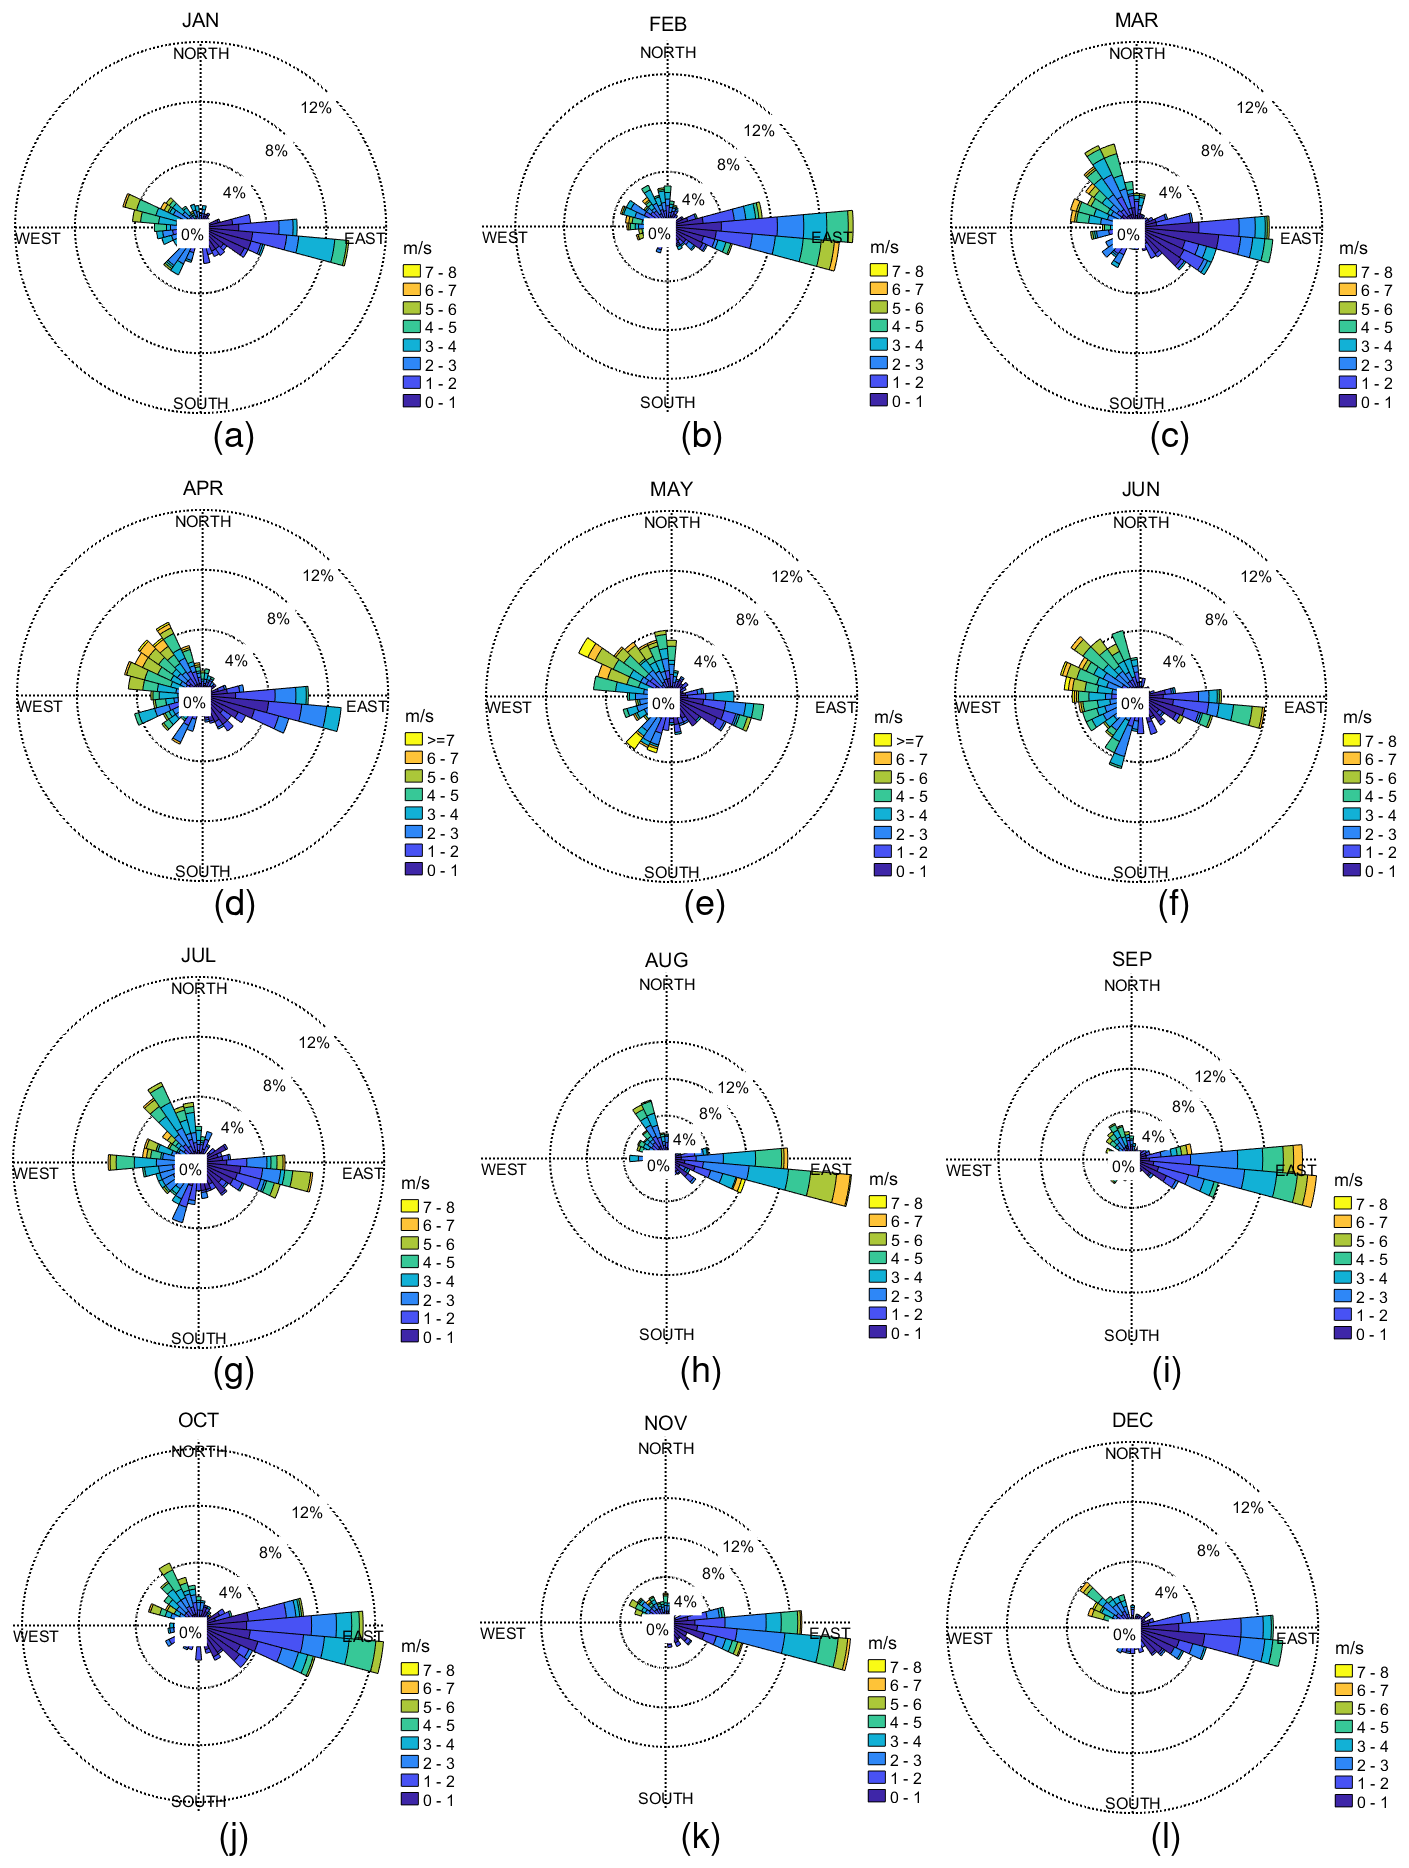
Figure 2Wind roses measured close to the surface at the measurement site during the campaign and averaged over different months: (a) January, (b) February, (c) March, (d) April, (e) May, (f) June, (g) July, (h) August, (i) September, (j) October, (k) November, and (l) December. The colours show the wind speed (m s−1), and the percentages indicate the percentage of time when wind was observed from a certain direction. The figure shows data from the automatic weather station.
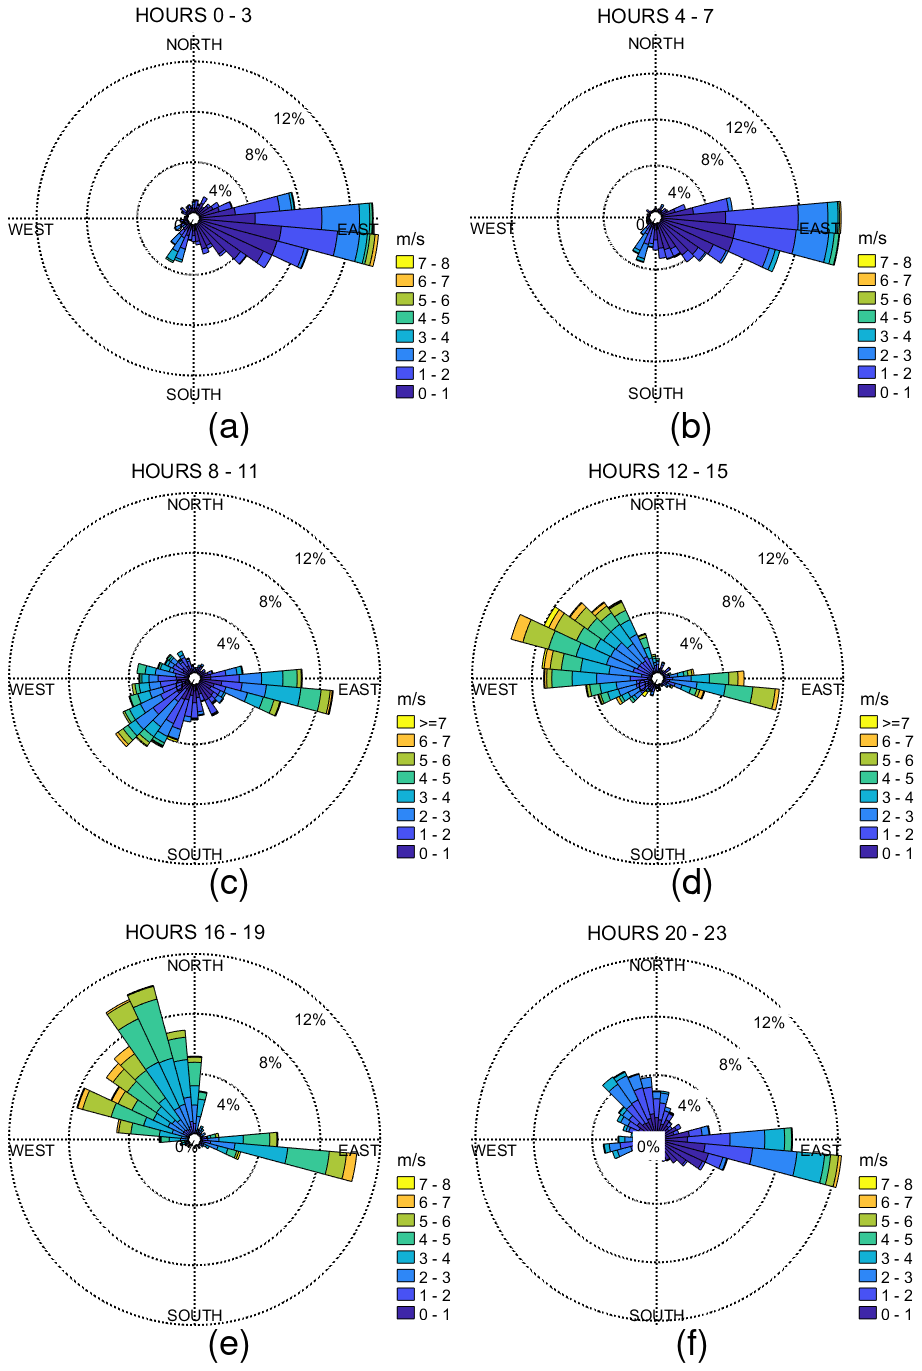
Figure 3Wind roses measured, in local time (hours UTC+4), close to the surface at the measurement site during the campaign and averaged over (a) hours 0–3, (b) hours 4–7, (c) hours 8–11, (d) hours 12–15, (e) hours 16–19, and (f) hours 20–23. The colours show the wind speed (m s−1), and the percentages indicate the percentage of time when wind was observed from a certain direction. The figure shows data from the automatic weather station.
2.1 Site description
The measurement campaign was conducted on a palm tree farm (25°14′7.8′′ N, 55°58′39.97′′ E, 165 m above sea level, Filioglou et al., 2020), representing a rural background with mainly sand desert and agricultural activities in the surroundings (Wehbe et al., 2017). The Arabian Gulf is about 70 km west of the measurement site, and the Gulf of Oman is around 40 km to the east. The western coastline hosts the city of Dubai and at least two major oil refineries. Fujairah City and one oil refinery are located on the eastern coast (Fig. 1).
2.2 Data sets
The measurement campaign was performed between February 2018 and February 2019. The campaign, instrumentation deployed, and data sets are described in more detail in Kesti et al. (2022). The data set is available from Kesti et al. (2024). In this study, we used the near-surface winds and the vertical profile of wind and mixing to investigate the measured concentrations and variability of aerosol particle nucleation-mode concentration, SO2 concentration, CCN concentration, and activation fraction. Here, we briefly summarize the main measurement methodology.
The surface meteorological parameters were measured with an automatic weather station (Vaisala WXT520) with a 5 min time resolution. The sensor was 7 m above ground level.
The vertical profile of horizontal wind speed and direction were measured with a HALO Photonics StreamLine Doppler lidar with a time resolution of 15 min. The profile of turbulent mixing was retrieved using the boundary layer classification described by Manninen et al. (2018), which combines the profiles of attenuated backscatter coefficient, vertical velocity skewness, dissipation rate, horizontal wind, and vector wind shear measured by the HALO Doppler lidar. The boundary layer classification scheme identifies the regions where mixing is connected to the surface, from which the mixing layer height is retrieved. The temporal resolution of the classification is 3 min. Detailed instrument specifications, instrument scan schedule, and data processing methods are discussed in Kesti et al. (2022).
The aerosol particle size distribution from 7 to 800 nm was measured with a differential mobility particle sizer (DMPS). The size range was divided into 30 discrete size bins, and the size spectra was measured over 6 min and 25 s. The data were inverted with the method described by Aalto et al. (2001) and Wiedensohler et al. (2012). In this study, we focused on the nucleation-mode aerosol particle concentration from 10 to 25 nm.
The SO2 concentrations were measured with a Thermo Scientific 43i-TLE. The time resolution for the measurement was 30 s.
The CCN concentration was measured with the cloud condensation nuclei counter (CCNc, Droplet Measurement Technology; Roberts and Nenes, 2005). The CCNc was operated at five different supersaturations (0.1, 0.2, 0.3, 0.6, and 1.0), and in this study, we focused on the measurements with a supersaturation of 1.0. The supersaturation of 1.0 was chosen to investigate all the possible aerosol particles, both the very hygroscopic and less hygroscopic particles, that would activate to CCN. The time resolution of the measurements was 60 min. To provide size-resolved CCN measurements, a differential mobility analyser (DMA) was added to enable the CCNc to measure an activated fraction of aerosol particles as a function of size (size range of 10–250 nm). The CCN number concentration was compared to the number concentration measured with a condensation particle counter (CPC) to determine the CCN-activated fraction of aerosol particles at a certain size. A detailed explanation of the calibration procedures performed for this instrument is given in Kesti et al. (2022).
Air mass back trajectories were computed using the Hybrid Single-Particle Lagrangian Integrated Trajectory (HYSPLIT) model (Stein et al., 2015) with GDAS1 meteorological information (https://www.ready.noaa.gov/data/archives/gdas1/, last access: 9 November 2023). A set of 48 h backward trajectories were computed for every hourly derived HALO Doppler lidar mixing layer height, each set comprising one back trajectory starting every 200 m in altitude from the surface to the top of the mixing layer at that hour. Then, these trajectories were collocated in time with SO2 observations and further separated into low (SO2≦0.1019 ppb) and high (SO2≧1.1740 ppb) concentrations utilizing the 10th–90th percentile ratio from the SO2 observations. The trajectories were further binned onto a horizontal 0.5×0.5° grid, keeping the counts passing through each grid cell to further derive the relative difference (RD) expressed as RD = (H−L)/(H+L) for every grid cell that the trajectories have passed through.
Previous studies (Filioglou et al., 2020; Kesti et al., 2022) have suggested clear diurnal and seasonal temporal patterns in atmospheric transport at the site. The seasonal variability in atmospheric conditions is quite weak, with the main difference between summer (March–August) and winter (September–February) being slightly higher wind speeds during summer (2.3±1.6 m s−1 in summer and 2.1±1.5 m s−1 in winter). The diurnal variability in surface wind direction is very distinctive and predictable, with winds being easterly before sunrise, turning to a western and north-western direction during the day, and back to being easterly at night. This reliable pattern allows us to investigate how changes in aerosol particle and SO2 concentrations are linked to local-scale and synoptic-scale transport.
3.1 Observed meteorological patterns
The diurnal behaviour and seasonal behaviour of the surface meteorological parameters measured at the site were analysed in Kesti et al. (2022). The observed surface temperatures varied from 10 to 48 °C, and the highest temperatures were recorded at noon during summer. The surface relative humidity varied from 6 % to 90 %, with the minimum during summer when the temperature reached its maximum. Ambient pressure was stable during the campaign. There were only eight rain events that were observed at the surface. The wind speeds were generally low at the surface, as evidenced by the mean hourly wind speed of 2.2 m s−1. The maximum wind speed of 17.5 m s−1 was measured on 13 May 2018, and the highest wind speeds were mostly observed in early summer. In the aforementioned study at this site, only the dominant wind conditions on an hourly or monthly basis were presented. Here, using wind roses, the seasonal and diurnal changes in the full wind distribution were investigated with respect to local time (UTC +4). Our results indicate a clear shift in the surface winds over the course of the year (Fig. 2); during autumn and winter months, the wind from the east was more frequent, whereas in late spring and early summer, the wind from the west was more frequent. Prevailing westerly winds were observed during spring and early summer. Winds from the east were generally associated with low wind speeds.
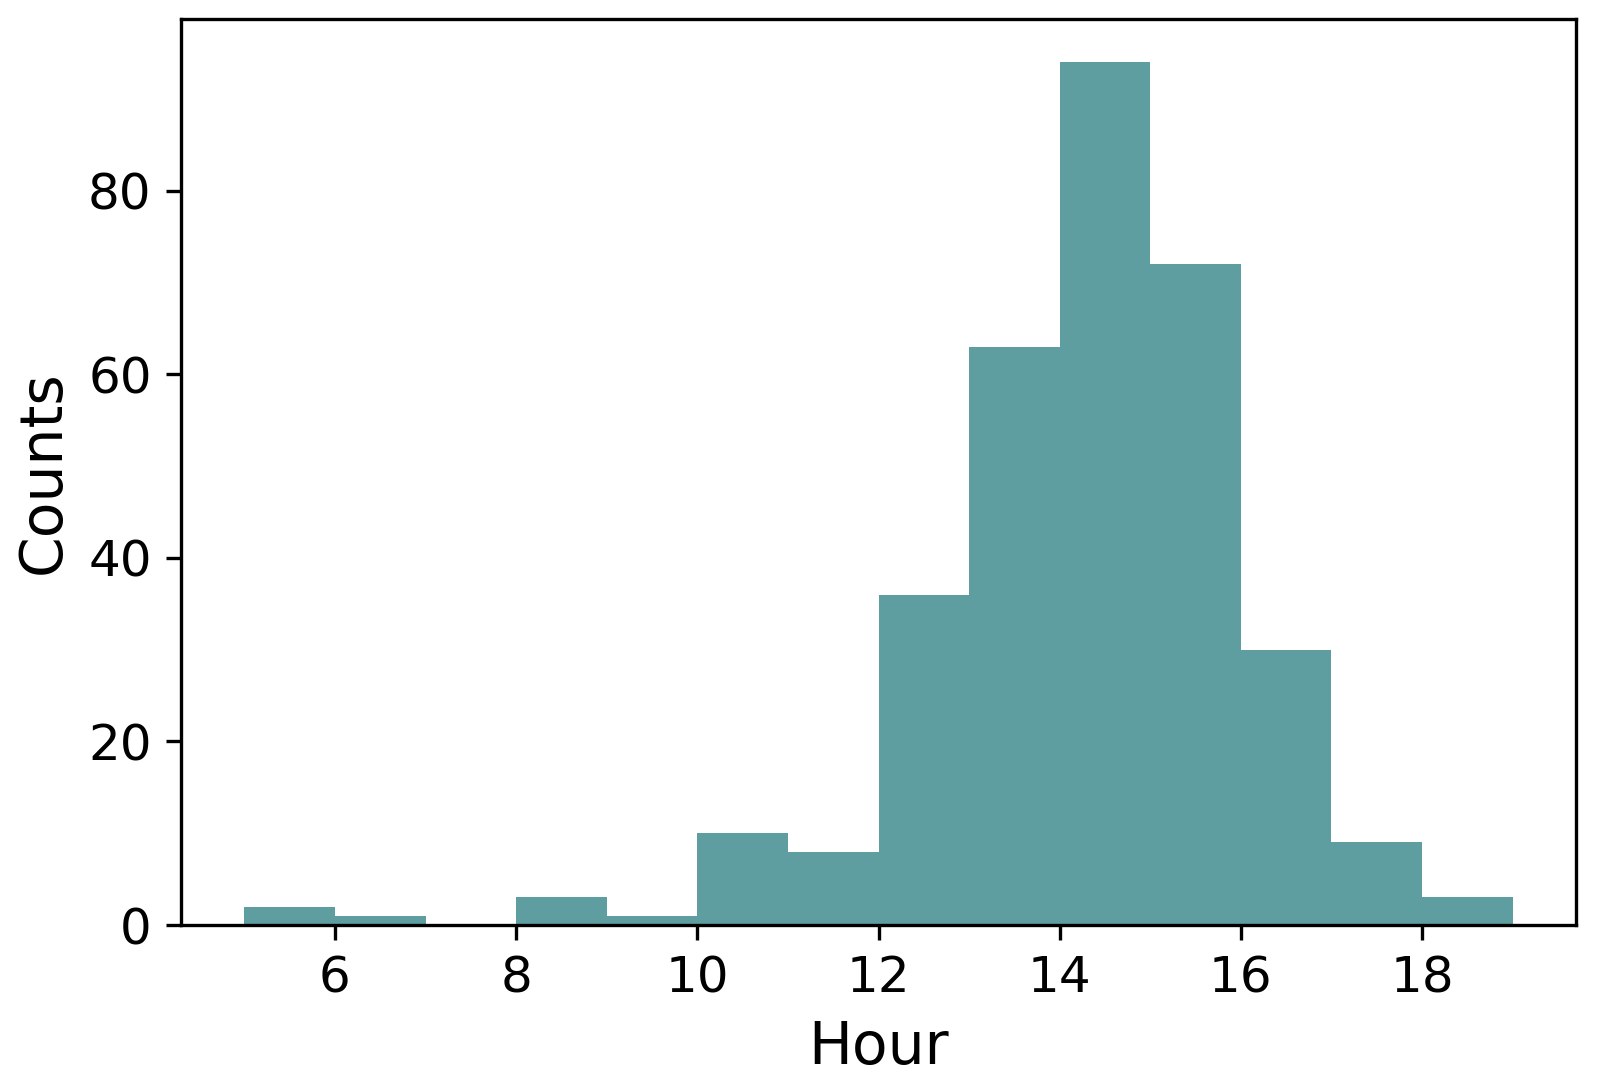
Figure 4A histogram of hours when the boundary layer has reached its maximum height during each campaign day. The time axis is local time (hours UTC+4).
A clear diurnal cycle in the near-surface wind can been seen in Fig. 3, where easterly winds at night change to westerly or north-westerly during the day and back to easterly by late evening. The winds at night are usually very light, with stronger winds present during the day either from the west or east. Wind roses for every separate hour can be seen in Fig. A1. The seasonal variation in wind was also investigated.
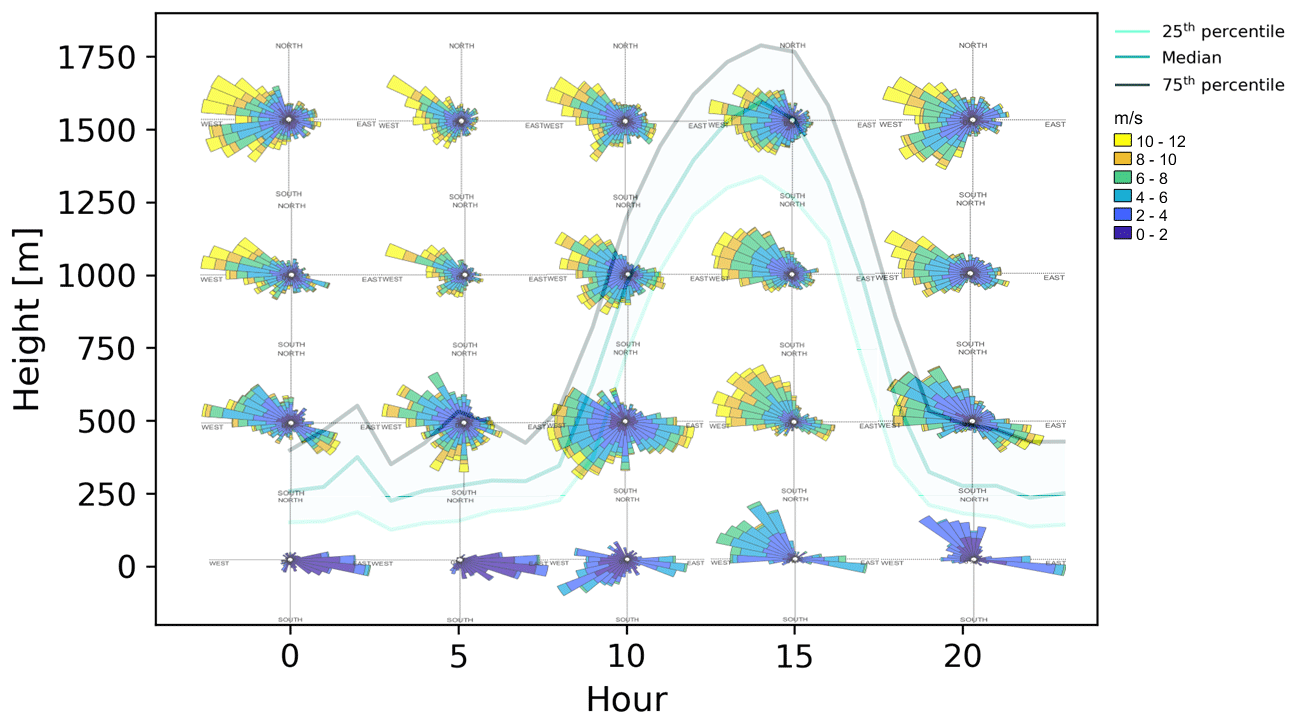
Figure 5Wind roses at different heights: first row from the bottom at the surface, second row from the bottom at a height of 493 m, third row from the bottom at a height of 1000 m, and fourth row from the bottom at a height of 1508 m. The colours show the wind speed (m s−1), and, in the background figure, the lines show the boundary layer height median with 25th and 75th percentiles. On the x axis is the hour (local time UTC+4) and on the y axis is the boundary layer height (m).
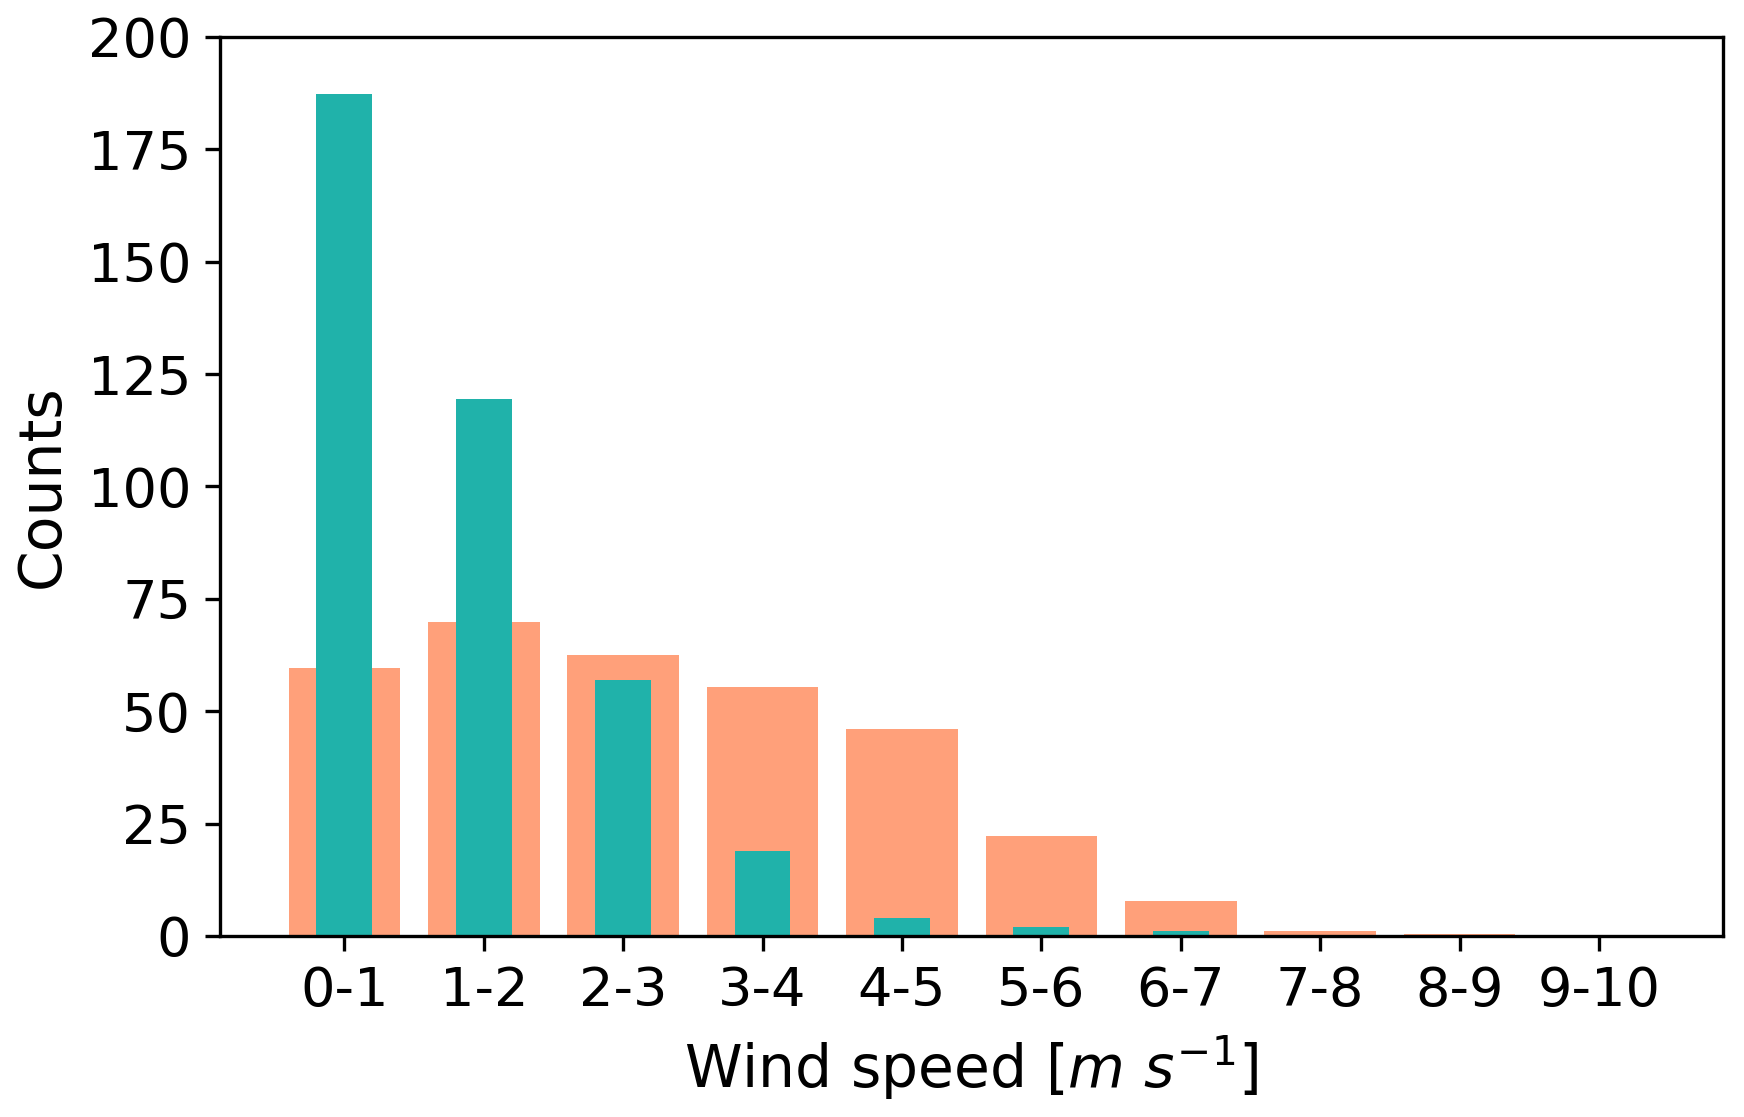
Figure 6Histograms of surface wind speed during the day (in orange) and night (green) showing counts per bin where the bin size is 1 m s−1 wide. The counts are normalized with respect to the different lengths of day (16 h) and night (8 h).
Following Filioglou et al. (2020), the seasons were divided into two: summer from March to August and winter from September to February. During the summer months, there was more airflow from the west compared to the winter months when the predominant wind direction was the east (Fig. A2). The observed diurnal variation in the wind direction at the site reflects the wind patterns that are so typical for the Arabian Gulf. Recent reanalysis of meteorological data over the past 40 years shows that the surface winds over the Arabian Gulf are predominantly north-westerly throughout the year (Dasari et al., 2022; Patlakas et al., 2019). In addition to this, there is a land–sea breeze that has been described as perennial and can reach hundreds of kilometres inland except for the northern parts of the gulf (Zhu and Atkinson, 2004; Eager et al., 2008). According to Eager et al. (2008), the sea breeze is usually first observed at the coast at midday local time and then moves inland, observed 15–20 km inland by about 15:00 local time. A land breeze occurring at night and flowing in the opposite direction to the daytime sea breeze is also evident in the climatological reanalysis. The HALO Doppler lidar wind profiles show that there is significant transport aloft (from the direction of the gulf) throughout the early morning and during the day, which corresponds to the larger mesoscale wind direction (north-westerly flow) for the region; this seems to be persistent all year round (Eager et al., 2008; Zhu and Atkinson, 2004). For a global picture of the links between the Arabian Peninsula's climate and global circulation patterns, see e.g. Attada et al. (2018) and the references therein.
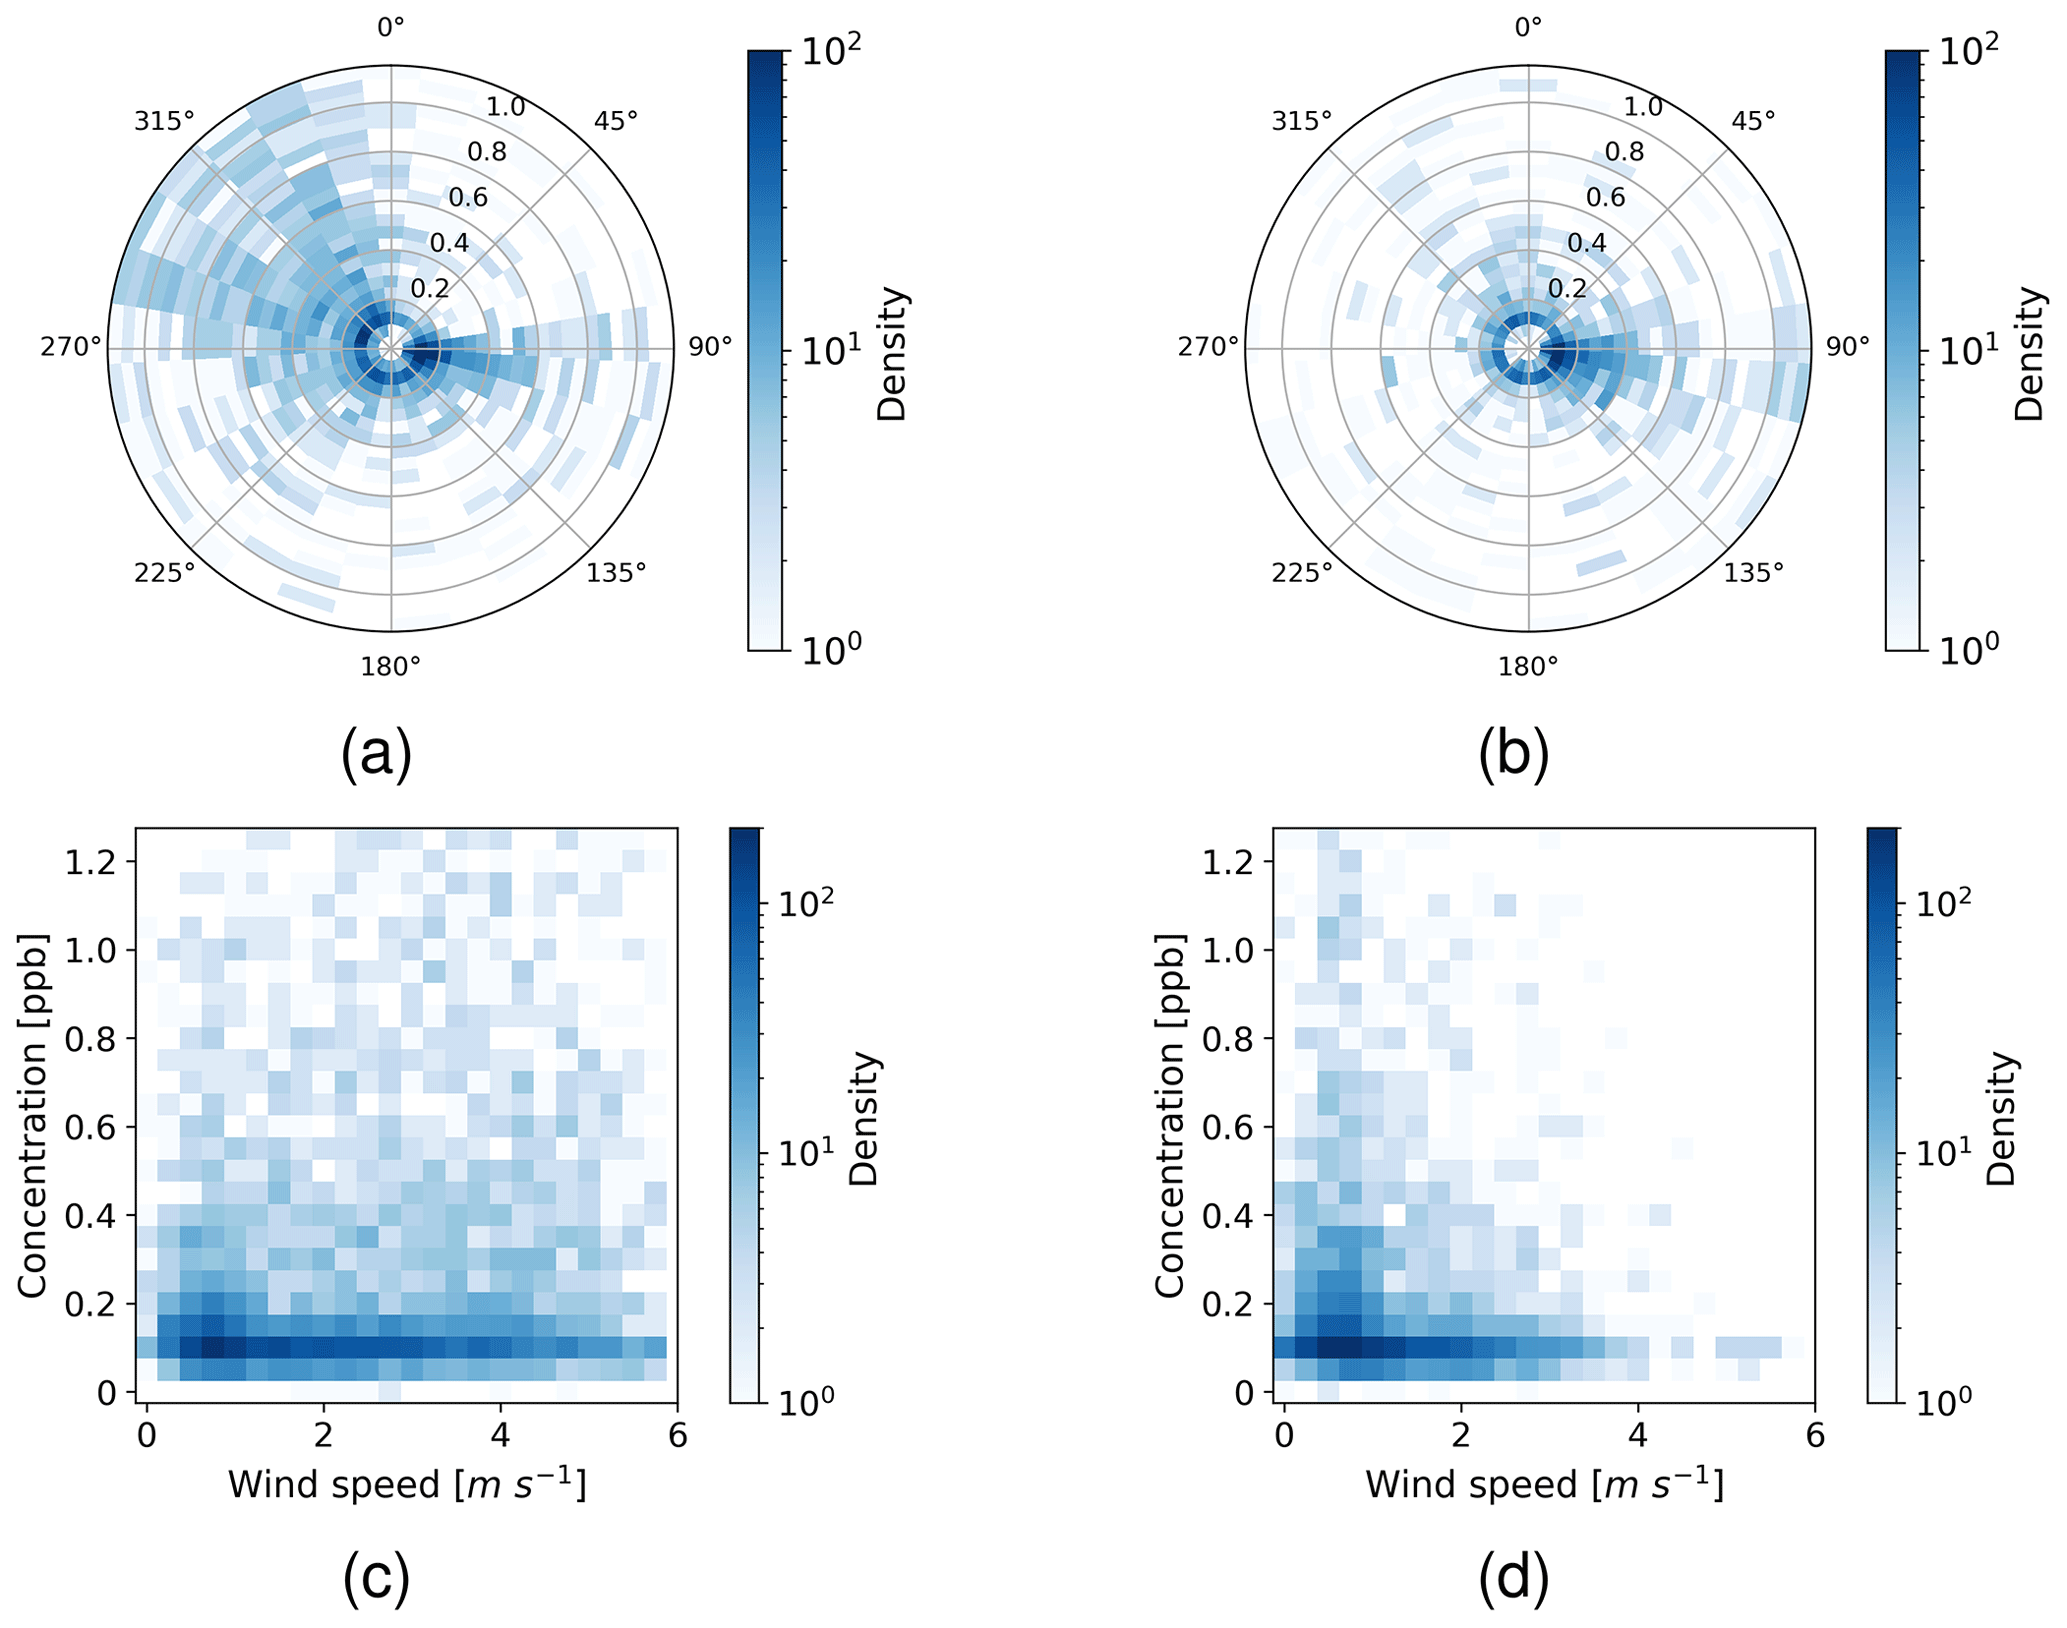
Figure 7Polar plots of SO2 concentration (ppb) with respect to wind direction (°) during (a) daytime and (b) nighttime. Two-dimensional histogram plots of SO2 concentration (ppb) versus wind speed (m s−1) during (c) daytime and (d) nighttime. The colour indicates the number of data points in the area, and the radius of the circles in panels (a) and (b) indicates the SO2 concentration in part per billion.
3.2 Daily evolution of boundary layer and vertical wind patterns
Kesti et al. (2022) investigated the effects of turbulent and non-turbulent boundary layer conditions and the effects of boundary layer height on aerosol particle properties and SO2 concentrations. They used the following three case studies: (1) a deep boundary layer with the horizontal transport aloft, (2) a shallow boundary layer, and (3) a deep boundary layer with a stagnant residual layer aloft. In this study, we investigate the boundary layer evolution and horizontal transport more broadly.
We defined the hours when the boundary layer height reached its maximum during each day during the campaign. The evolution of the boundary layer was analysed between the following sunrise and sunset hours: 05:00–20:00 LT (hereafter, all times are given in local time). In our analysis we used the boundary layer classification method developed by Manninen et al. (2018) to diagnose when surface-connected mixing was present. The number of days when surface-connected mixing was occurring at the site was around 90 % of all campaign days. Figure 4 shows that the maximum boundary layer height is most often reached after noon around 13:00–15:00.
The length of the day only varies by 3 h in the UAE region, and the diurnal structure of the boundary layer is very similar from day to day (Fig. 5). The median boundary layer height during the campaign was around 265±311 m at night and around 1067±894 m during the day.
Figure 5 shows that, with a shallow nocturnal boundary layer and light winds, the horizontal transport within the boundary layer (and, hence, the surface) at night is slow. However, there are stronger horizontal winds above at night, providing significant transport. Moreover, the wind direction can be different from the surface wind direction. Once the morning boundary layer grows to the altitudes where more significant SO2 transportation occurs, we observe peaks in SO2 concentration at the surface once these elevated layers are mixed down to the surface. Indications of this mixing of pollutants from above and down to the surface were already reported by Kesti et al. (2022) in a case study of a deep boundary layer with a stagnant residual layer aloft.
3.3 Effect of horizontal and vertical air mass transport on SO2 concentration and aerosol particle properties
In the next section, we investigate how the observed vertical and horizontal air mass transport and mixing impact aerosol particle processes, focusing on the formation of nucleation-mode aerosol particles from precursors, mainly SO2 here (Marti et al., 1997; Birmili and Wiedensohler, 2000).
As discussed in Sect. 3.1, the diurnal variation in wind speed and direction was very distinctive in the study area, and this is why we divided the data into daytime (05:00–20:00 local time) and nighttime (20:00–05:00 local time). Figure 6 shows the difference between daytime and nighttime wind speeds. During daytime, the wind speed distribution is wider, and the speeds are more evenly distributed, whereas during nighttime, the wind speed is generally quite low.
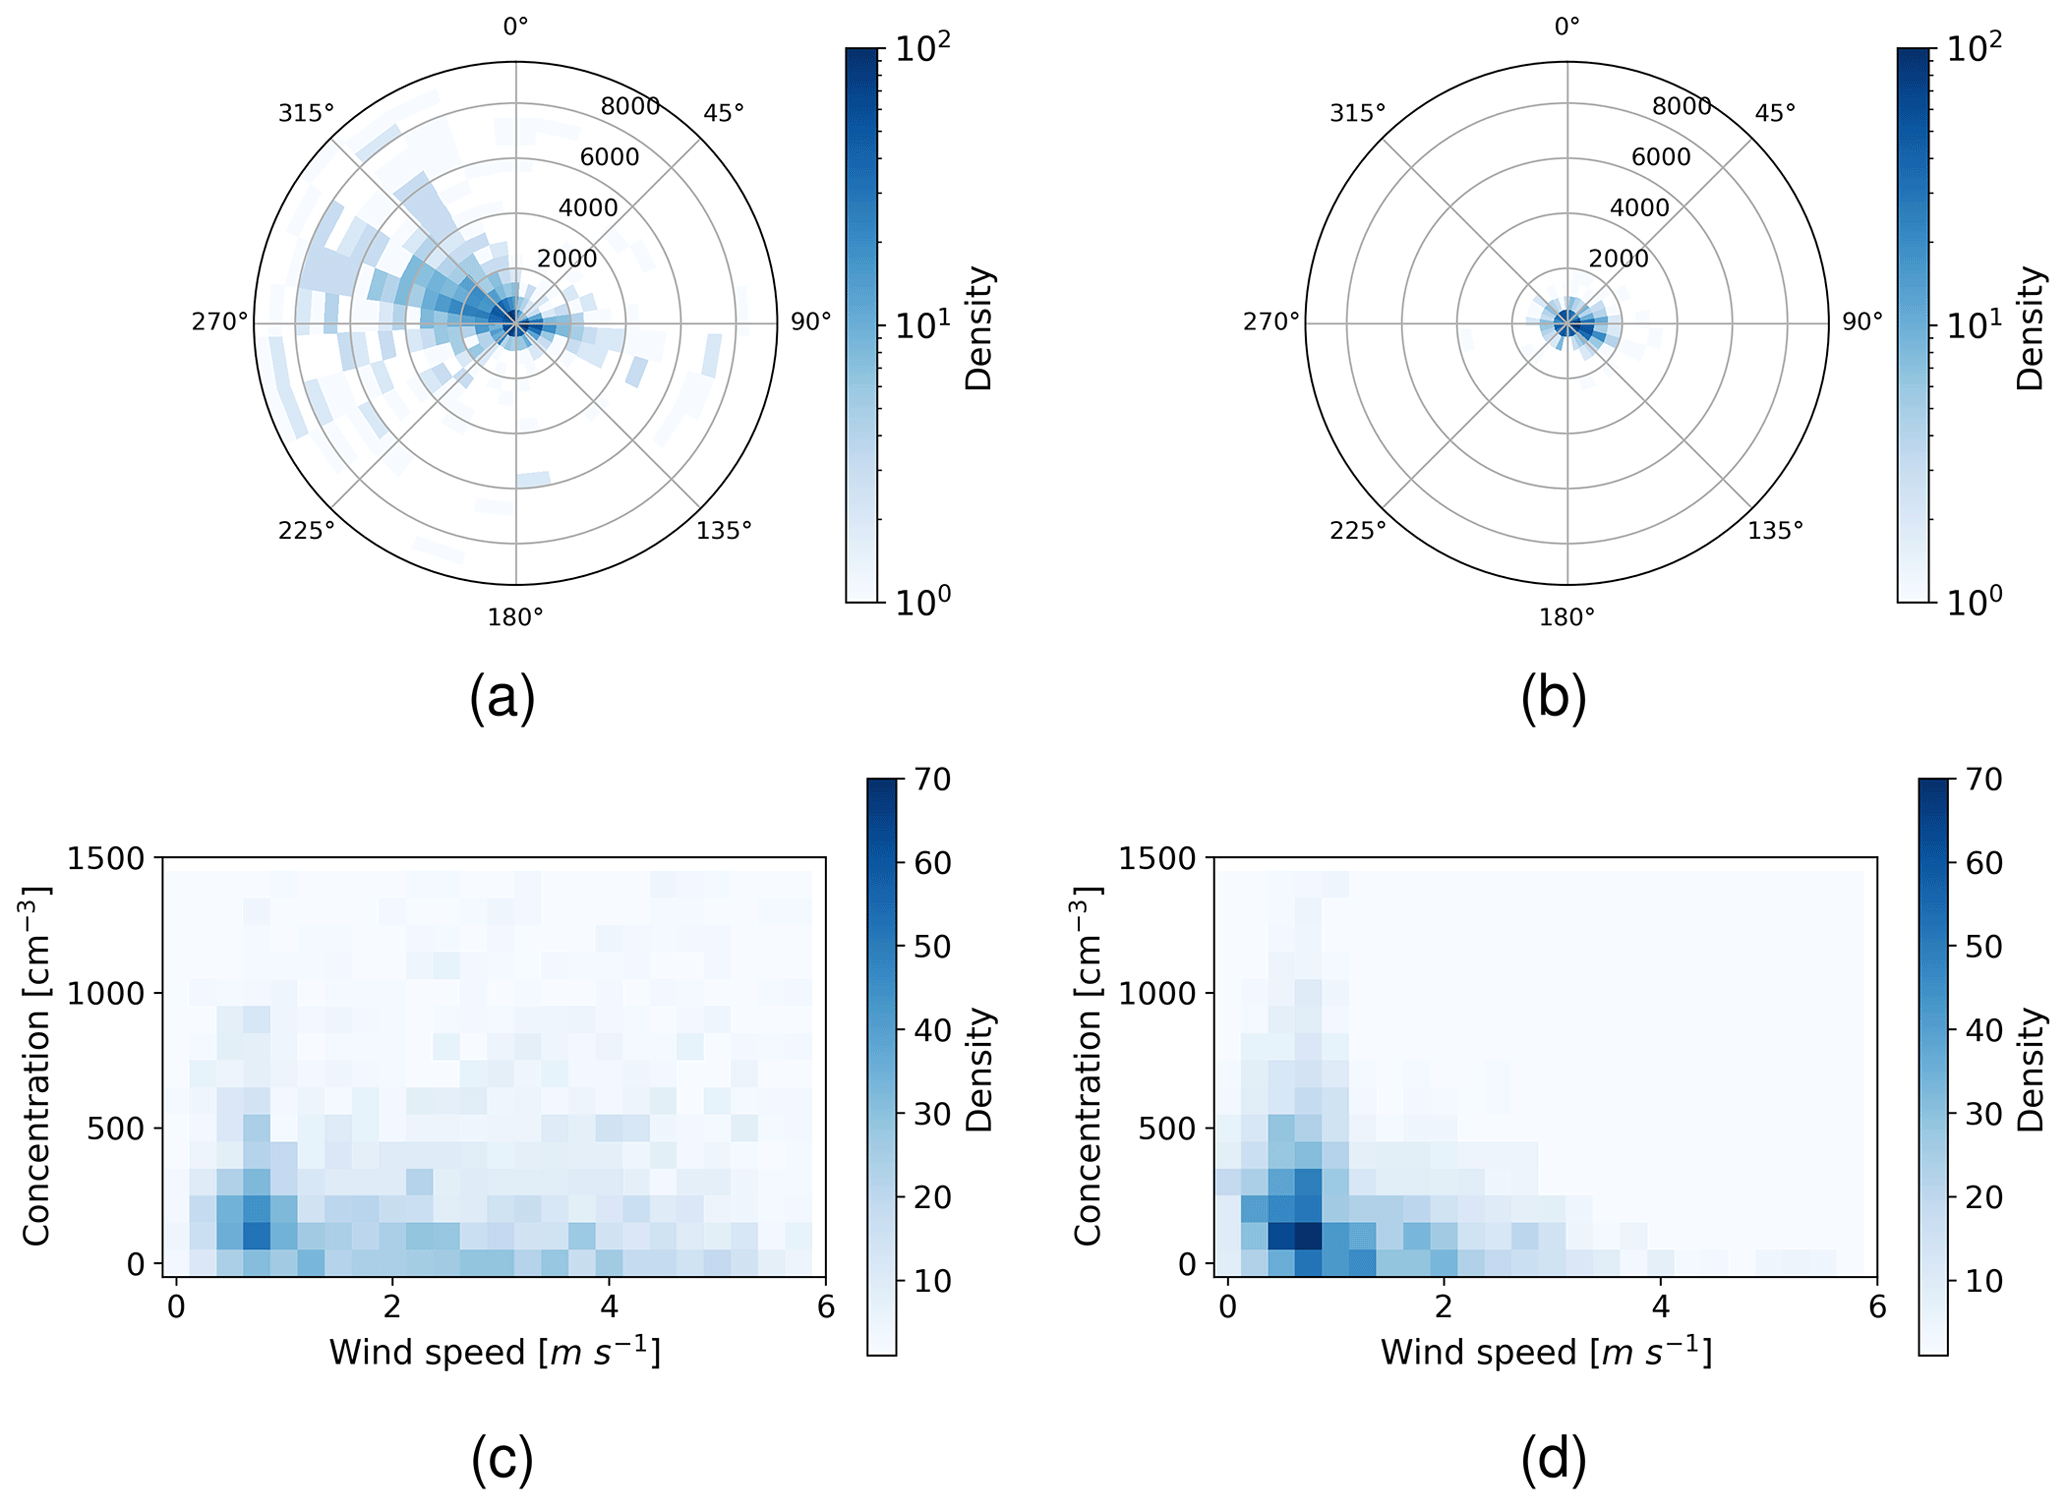
Figure 8Polar plots of nucleation-mode total number concentration (cm−3) with respect to the wind direction (°) during (a) daytime and (b) nighttime. Two-dimensional histogram plots of nucleation-mode total number concentration (cm−3) versus wind speed (m s−1) during (c) daytime and (d) nighttime. The colour indicates the number of data points in the area, and the radius of the circles in panels (a) and (b) indicates the nucleation-mode total number concentration in cm−3.
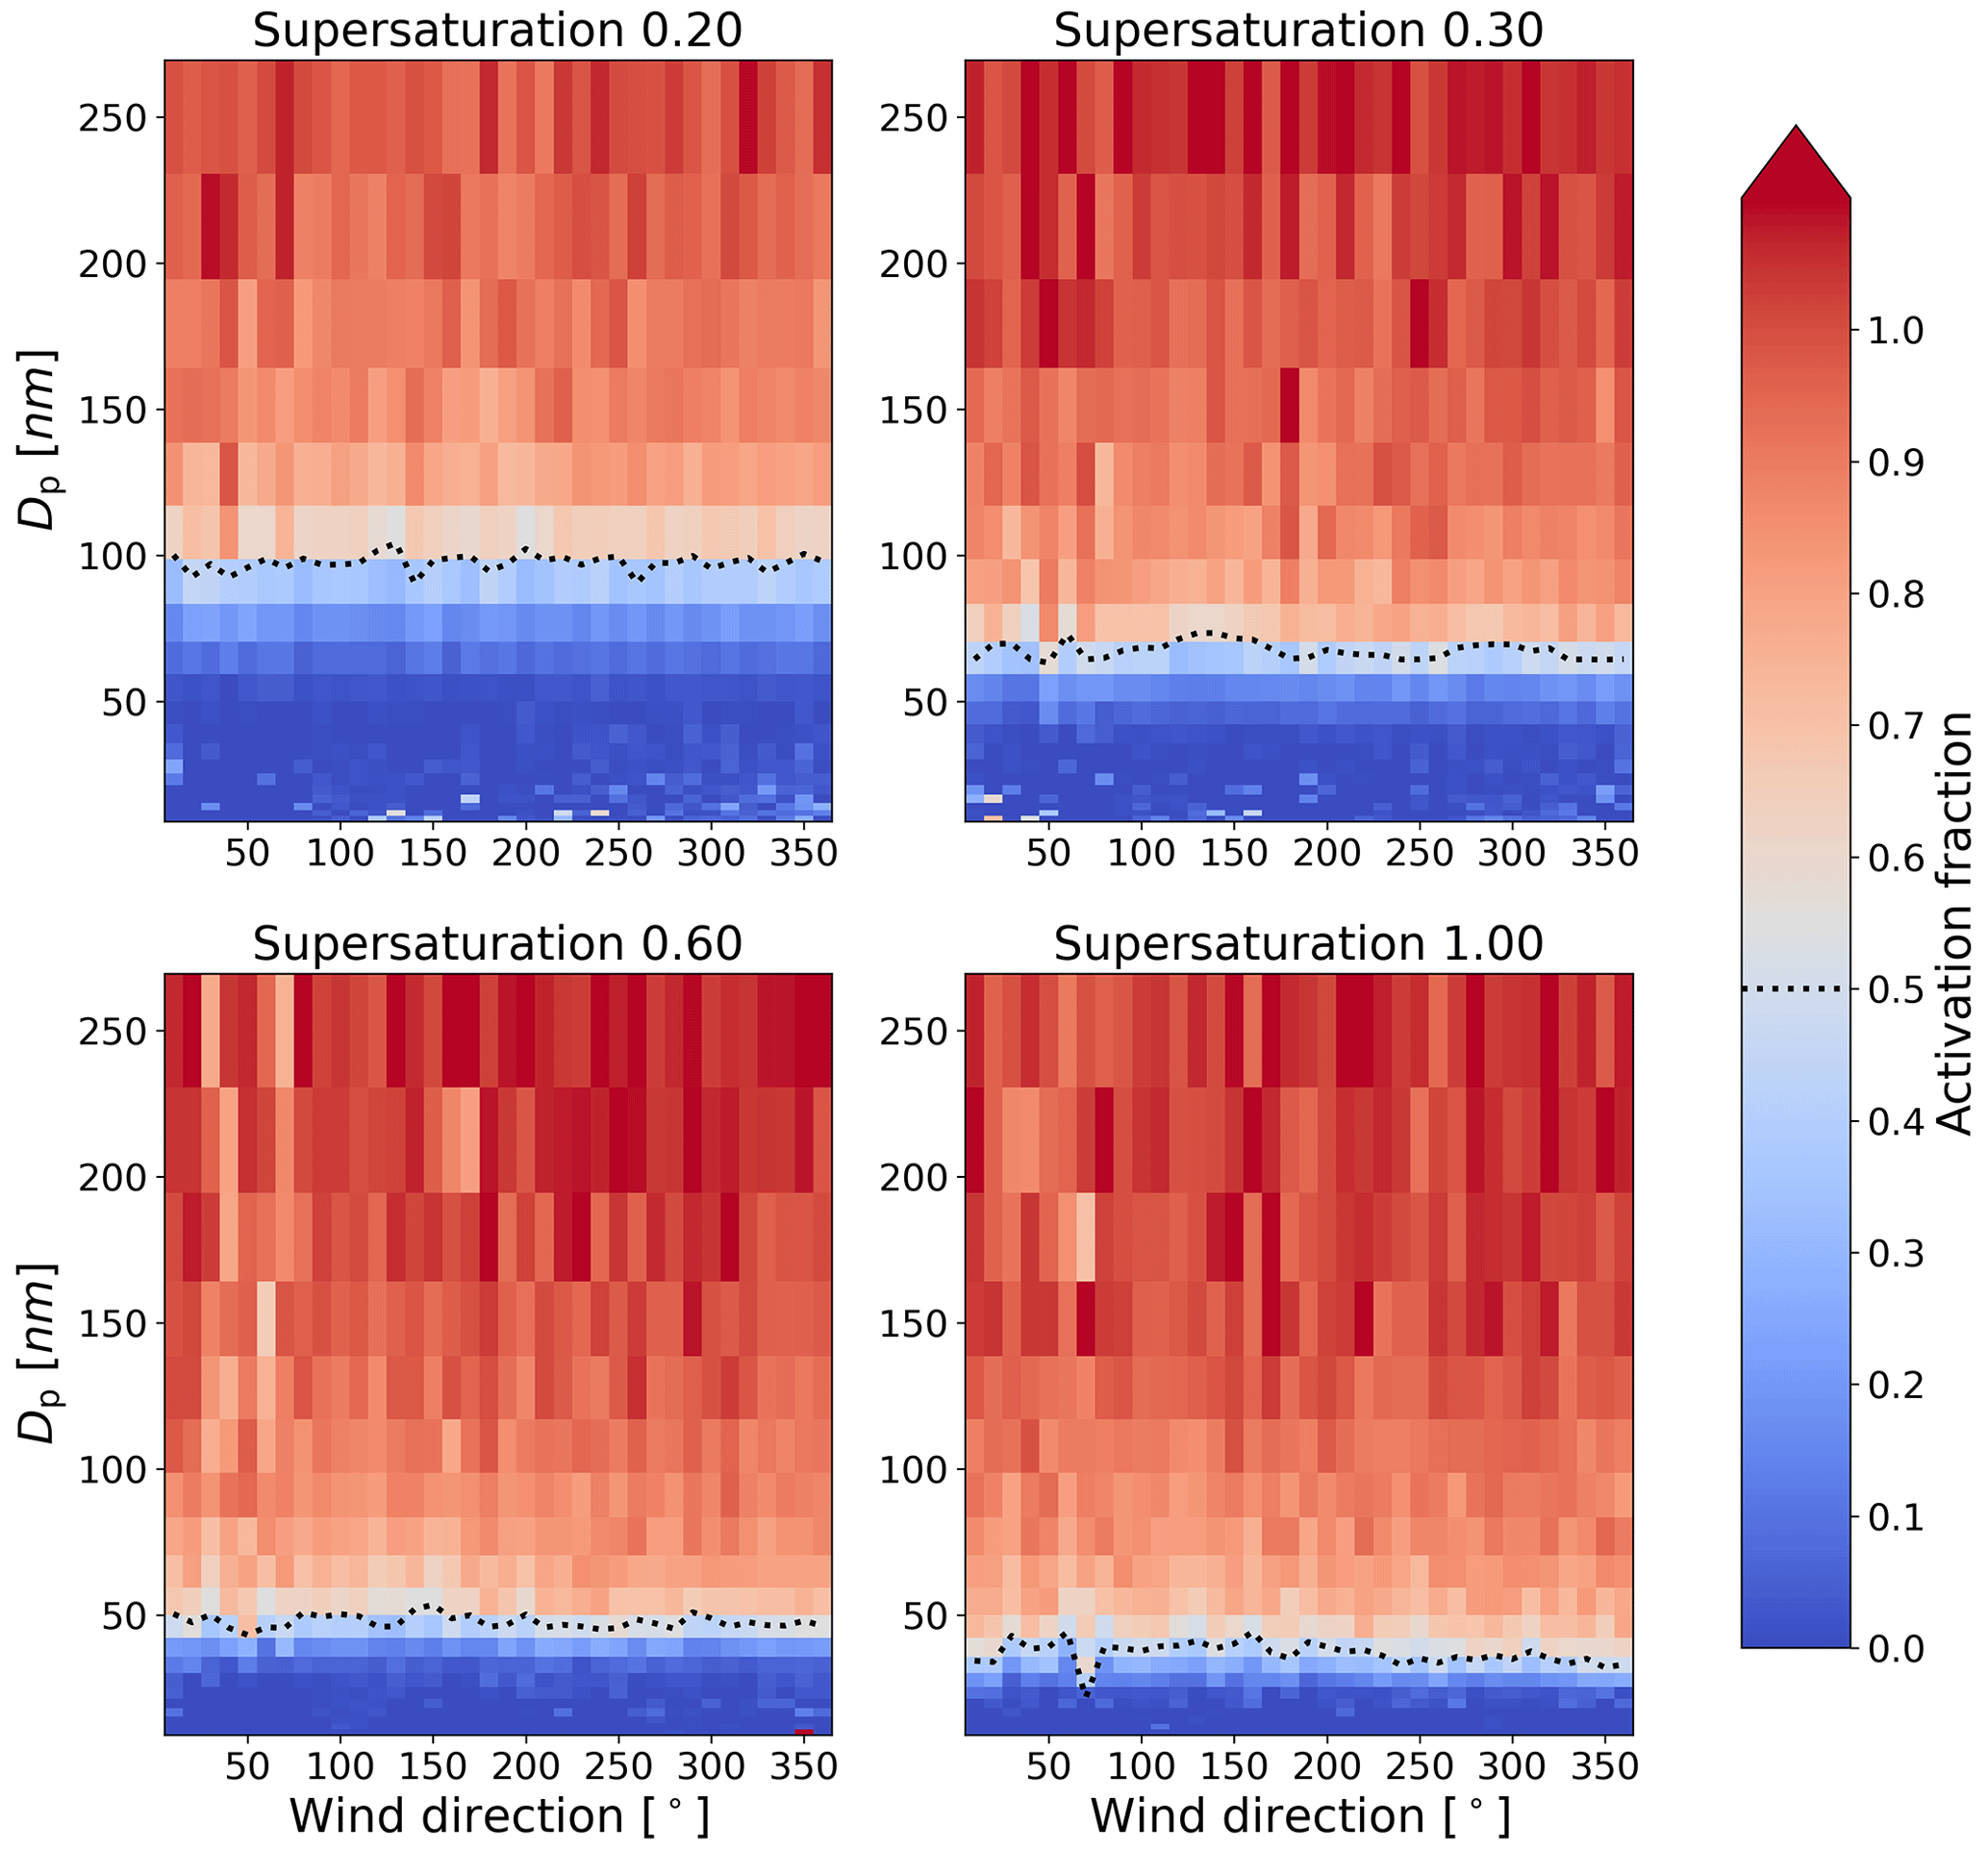
Figure 9Particle diameter (nm) versus wind direction (°) at four different supersaturations (0.2, 0.3, 0.6, 1.0). The colour indicates the activation fraction CCN CN, and the dotted line indicates the particle diameter at 50 % activation (D50).
3.3.1 SO2 and nucleation-mode aerosol particles
We measured higher SO2 concentrations when the wind was coming from specific directions during daytime (Fig. 7a). For example, when considering mean concentrations from wind directions 20–40, 80–100, 170–190, and 270–290° in daytime, the measured mean concentrations were 0.34±0.32, 0.24±0.32, 0.37±0.66, and 1.13±1.88 ppb, respectively. There are at least four major oil refineries known to us around the measurement site: one in the east, two to the south-west, and one to the north-west (Fig. 1). The locations of the refineries correlate with the observed elevated SO2 concentrations when the wind was coming from eastern or western directions. Figure 11a shows average SO2 column density number in Dobson units retrieved from the TROPOMI satellite measurements from May 2018 until February 2019. Elevated SO2 values can be seen in Dubai compared to the surroundings, which is in agreement with our surface measurements. Other refinery locations are not that clearly recognizable. It should be noted that the satellite measurements and surface measurements are not directly comparable since the satellite measurement is integrated through the entire atmospheric column. When the airflow was coming from the west in daytime, we measured higher SO2 concentrations compared to an eastern direction. When considering wind direction sectors 45–135° for the east and 225–315° for the west, the measured mean concentrations were 0.26±0.36 and 1.00±1.63 ppb, respectively. One explanation is not only the higher number of oil refineries on the western coast but also the mountains on the eastern side, which could deflect the SO2 pollution from reaching the site. However, there is a clear increase in SO2 concentrations when the wind is from the east. The airflow from the east is more predominant in nighttime, and, hence, the measured elevated SO2 concentration in nighttime is consistent with the wind direction where the source for SO2 exists (Fig. 7b). In nighttime, the measured mean SO2 concentrations from wind directions 20–40, 80–100, 170–190, and 270–290° were 0.47±1.05, 0.23±0.27, 0.38±0.71, and 0.46±0.71 ppb, respectively. In daytime, there is no clear dependence of SO2 concentration on wind speed (Fig. 7c). In nighttime, the concentrations are lower at higher wind speeds (Fig. 7d) but as Fig. 6 shows, there are not many high-wind-speed cases during nighttime (average concentrations in wind speeds 0–2 m s−1 and higher than 2 m s−1 were 0.31±0.46 and 0.30±0.53 ppb, respectively, having almost 4 times more data points in the first wind speed bin).
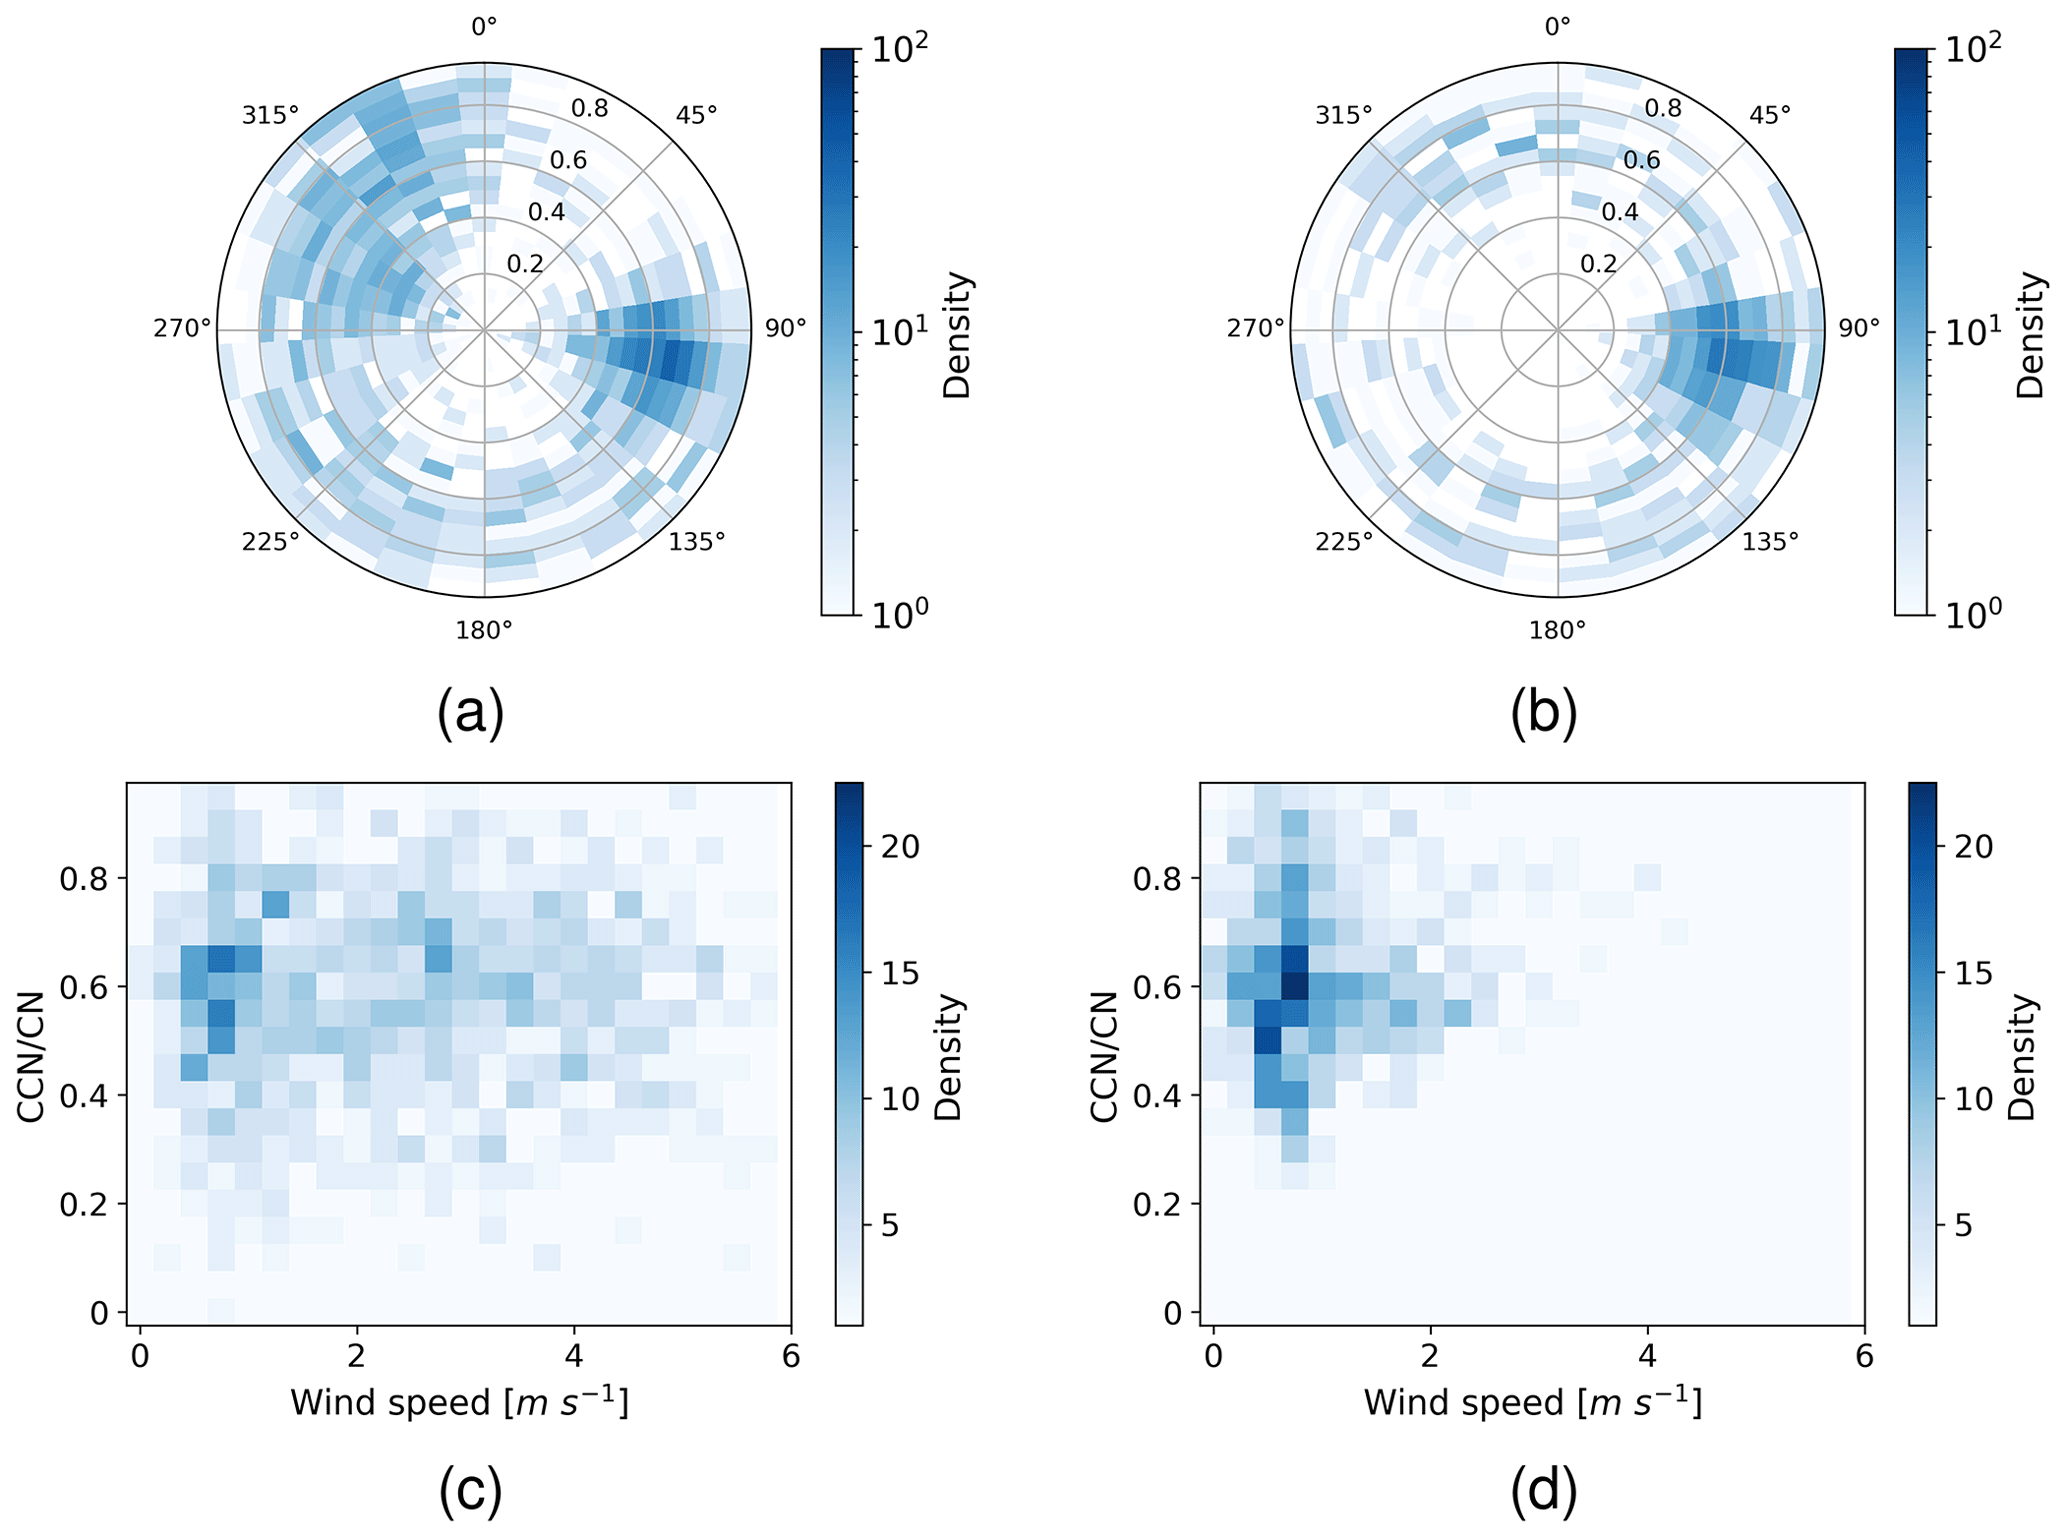
Figure 10CCN CN at a supersaturation of 1.0 with respect to the wind direction (°) during (a) daytime and (b) nighttime. Two-dimensional histogram plots of the activation fraction (CCN CN ) at a supersaturation of 1.0 versus wind speed (m s−1) during (c) daytime and (d) nighttime. The colour indicates the number of data points in the area, and the radius of the circles in panels (a) and (b) indicates the activation fraction at a supersaturation of 1.0.
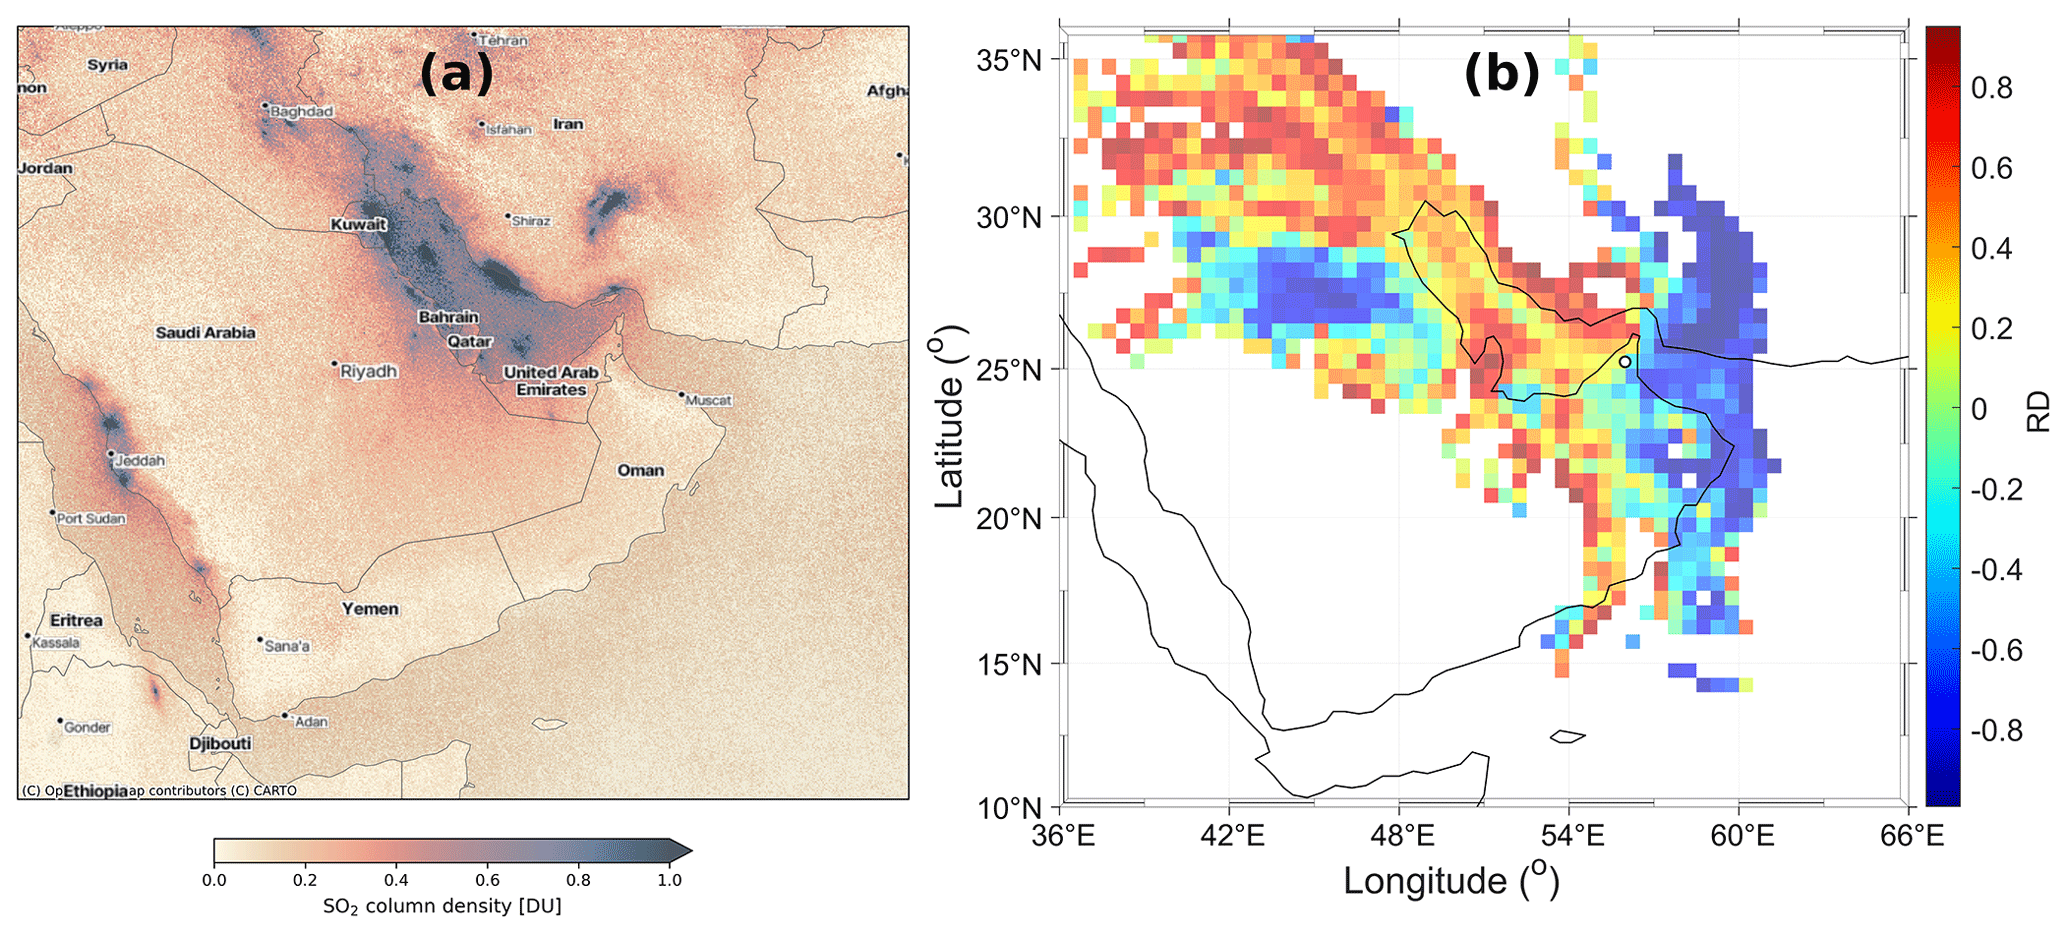
Figure 11(a) Mean SO2 concentration from the TROPOMI satellite for the period from May 2018 until December 2019. The concentrations are shown in Dobson units (1 DU molec. cm−2). © OpenStreetMap contributors 2024. Distributed under the Open Data Commons Open Database License (ODbL) v1.0. (b) Relative difference (RD) of the normalized counts between air masses associated with high (H) SO2 concentrations and low (L) SO2 concentrations binned onto a 0.5×0.5° grid. High SO2 concentrations denote values above the 90th percentile (1.174 ppb) and low concentrations below the 10th percentile (0.102 ppb). The RD is then calculated as RD = (H−L)/(H+L) for every grid cell that the trajectories have passed through. A maximum of 48 h air mass back trajectories is shown.
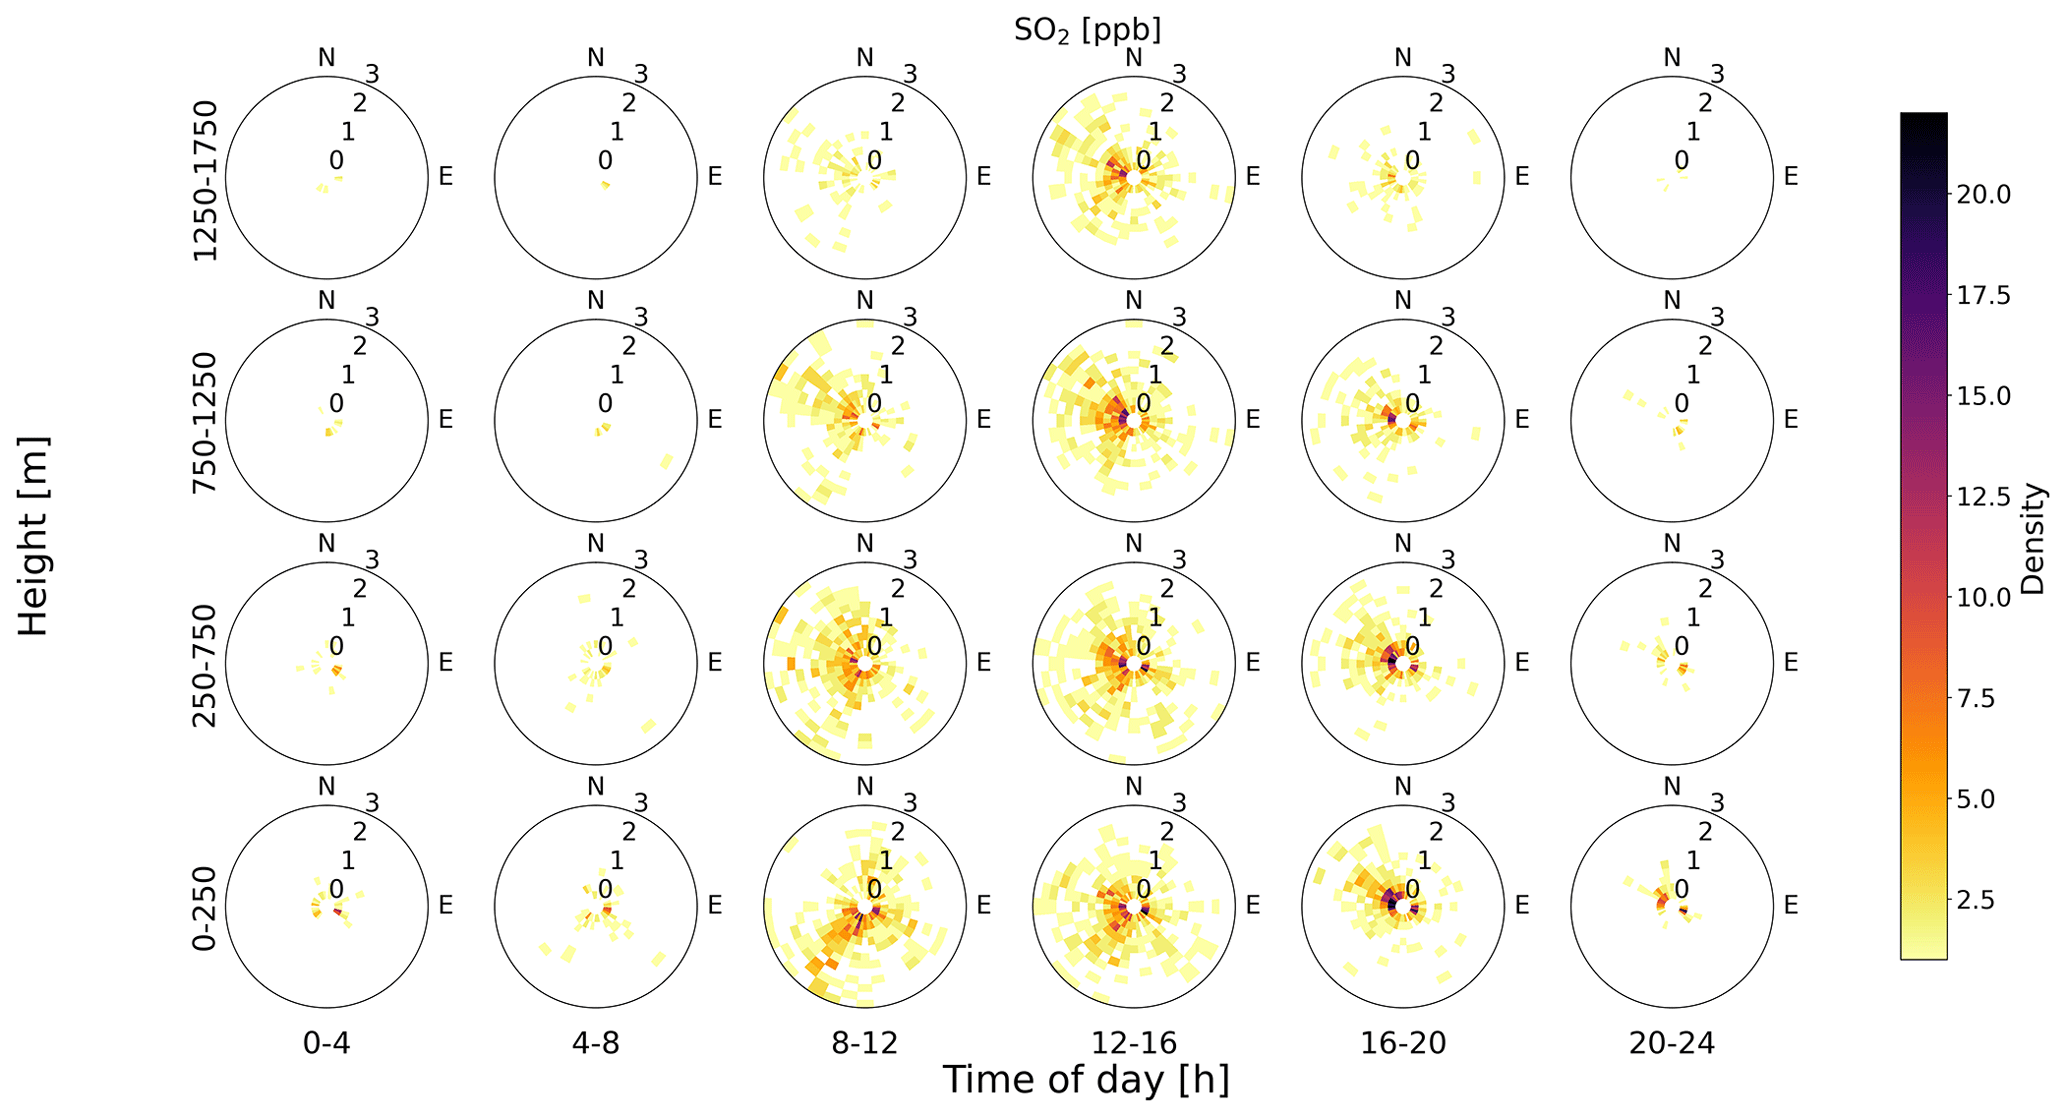
Figure 12Polar plots of SO2 concentration in parts per billion as a function of height (within the boundary layer) and time of day (local time, hours UTC+4). The rose plots for different heights have been constructed using HALO lidar data (wind speed and wind direction) at different heights and in combination with SO2 concentrations as measured at ground level. Only HALO lidar data from within the boundary layer are used in the figure.
Figure 8a shows an increase in nucleation-mode aerosol particle number concentration during daytime compared to nighttime (Fig. 8b). The mean nucleation-mode aerosol particle concentration during daytime was and during nighttime. The clearly higher nucleation-mode aerosol particle concentrations in daytime are explained by solar radiation, which, through photochemistry, causes new particle formation. The increased concentrations are focused on eastern and western wind directions, with higher concentrations in the western airflow. In daytime, the mean nucleation-mode aerosol particle concentrations in wind direction sectors 20–40, 80–100, 170–190, and 270–290° were 719±859, 517±851, 519±1192, and , respectively. This result is consistent with the SO2 concentration (Fig. 7a); this supports the fact that one of the most important new particle formation precursors in the atmosphere is sulfuric acid (H2SO4), which forms from sulfur dioxide (Weber et al., 1997; Kulmala et al., 2000; Sipilä et al., 2010). In nucleation-mode aerosol particles, the effect of wind speed follows the same pattern that it does in SO2 concentration: in daytime there is no clear dependence of nucleation-mode aerosol particle concentration on wind speed (Fig. 8c), and, during nighttime (Fig. 8d), the distribution follows the shape of the nighttime wind speed distribution in Fig. 6.
3.3.2 Cloud condensation nuclei (CCN)
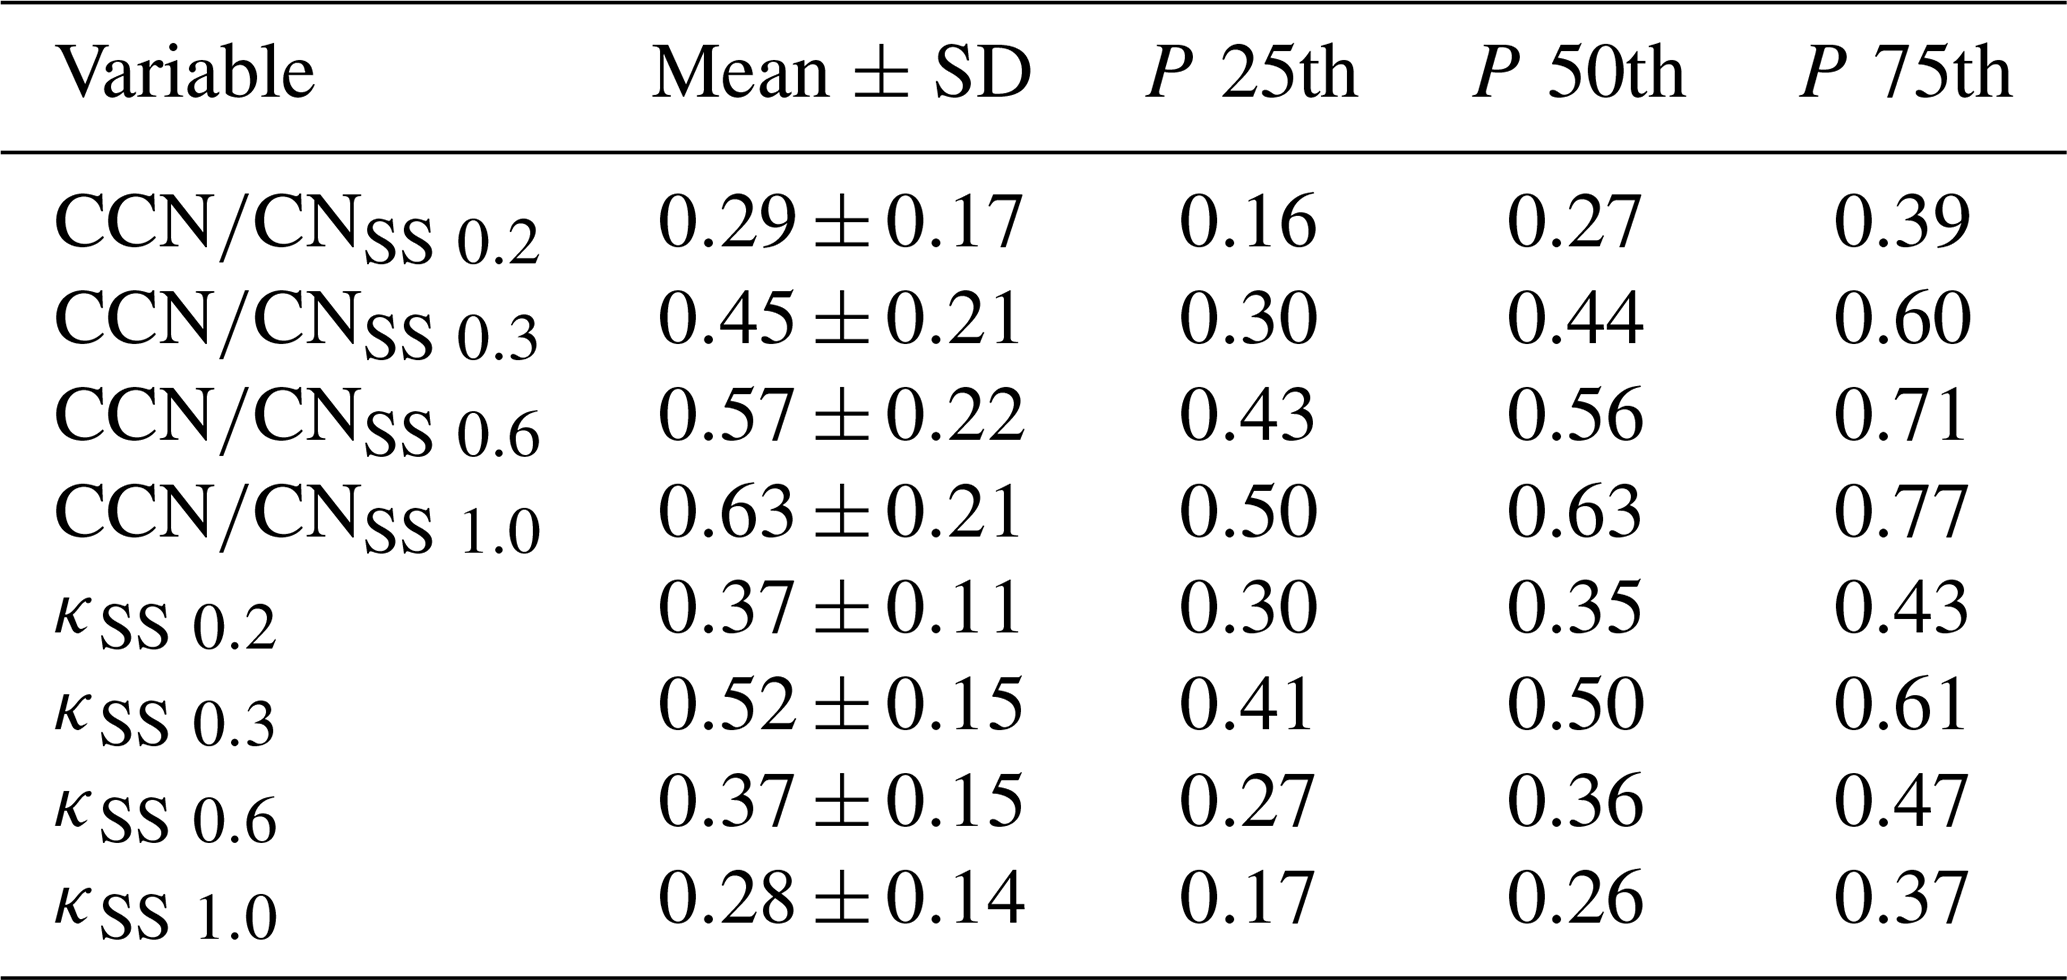
The effects of wind direction and time of the day were seen in nucleation-mode aerosol particle and SO2 concentrations. More specifically, winds from the west are associated with both increased SO2 concentrations and nucleation-mode particles (Figs. 7 and 8). The direction of westerly winds (at ground level) is the typical wind direction during the day, and the nighttime wind direction is typically from the east (see Fig. 3). When plotting the activated fraction of particles as a function of wind direction, the pattern is not as clear as for SO2 and nucleation-mode aerosols (Fig. 9). The dotted line in Fig. 9 shows the critical diameter (D50) at which 50 % of the particles have activated. Even at a supersaturation of 1.0, D50 is well above the nucleation-mode size range and was, on average, 37.9 nm for all wind directions. The mean D50 values for 0.6 %, 0.3 %, and 0.2 % were 47.6, 67.5, and 99.1 nm, respectively. The D50 values were calculated from fitting a sigmoid curve to the CCN CN (condensation nuclei) data for each DMA scan (from 10 to 250 nm) and using that fit to determine where the curve passed 50 % activation of CCN compared CN for the different supersaturations. The lowest supersaturation of 0.1 was omitted since those data were found to be unstable.
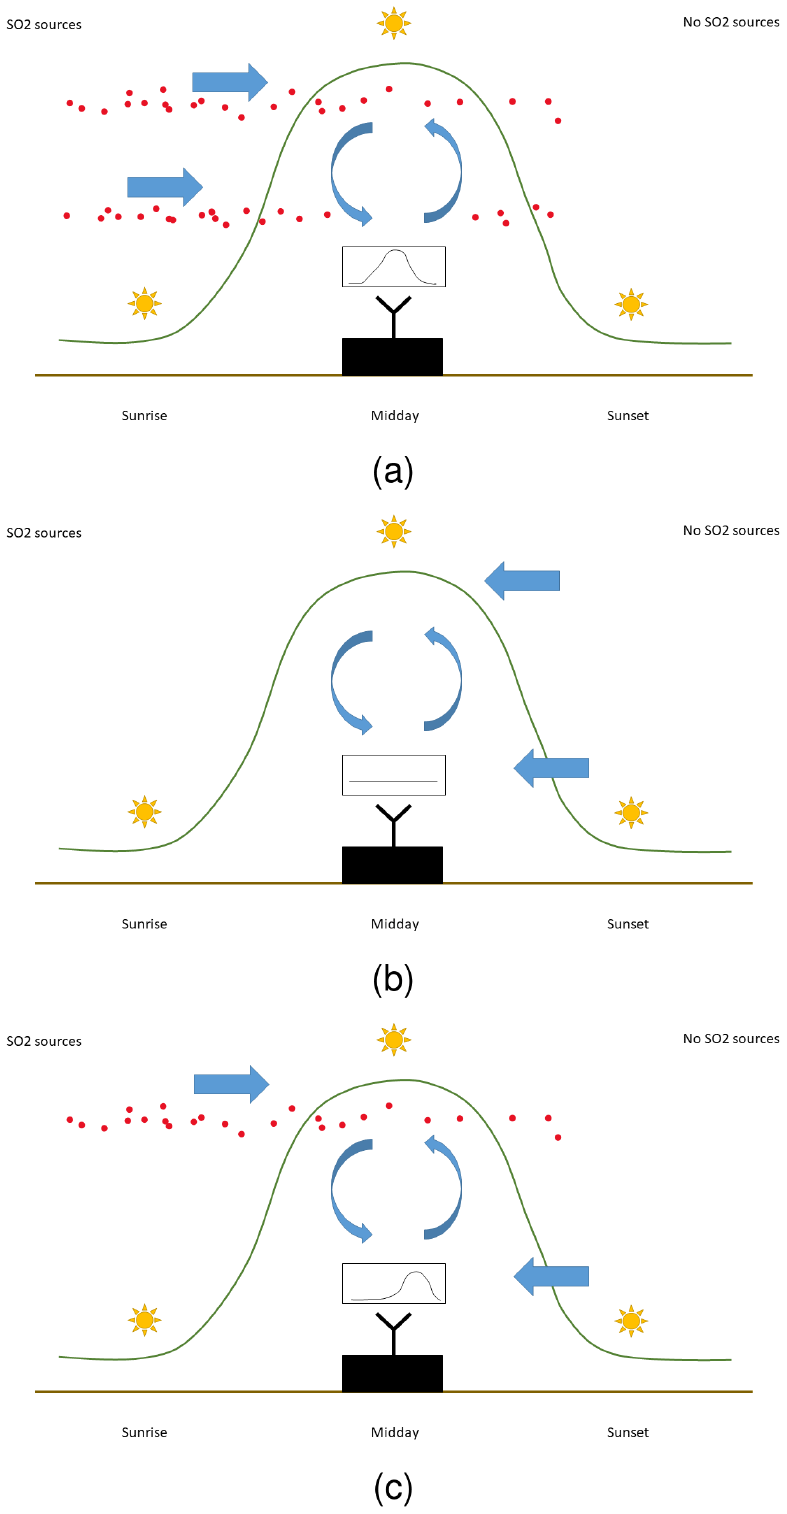
Figure 13A schematic diagram of SO2 mixing in a boundary layer. (a) SO2 transport in the upper and lower parts of an air column. (b) No SO2 transport in an air column. (c) SO2 transport in the upper part of an air column.
The activation fraction (CCN CN ) was slightly higher (around 0.6) when the wind came from the east, whereas the activation fraction was a bit lower when the wind came from the west (around 0.4, Fig. 10a). This could be due to different sources of aerosol particles from the different areas. More aerosol particles are coming from the west, but they do not activate that easily (comparing Fig. 10a with Fig. 8a). There was no clear difference between daytime and nighttime in the activation fraction, but the absence of wind from the western direction and, hence, the other source of CCN can be seen in Fig. 10b. Wind speed did not have a clear effect on the activation fraction at the site (Fig. 10c and d).
The figure shows that the D50 range is between around 40–100 nm at the site. Table A1 shows more statistics for the activation fraction and calculated κ values at different supersaturations.
3.3.3 Effect of boundary layer evolution on SO2
Horizontal transport of SO2 at the surface is not sufficient for explaining the variation in the concentrations measured at the surface during the campaign; in conditions with low daytime wind speeds at the surface, we still measured higher SO2 concentrations despite the remote locations of the SO2 sources (the closest oil refineries around 40 to 70 km from the site). Satellite measurements of SO2 from TROPOMI (Fig. 11a) show that there are major sources further afield in the Arabian Gulf and in Iraq and Iran, with significantly elevated background values throughout the gulf itself and extending inland around the gulf. Figure 5 shows that winds are much stronger aloft than at the surface and that the wind direction is predominantly from the gulf; hence, there is potential for long-range transport of SO2 from the significant source areas seen in Fig. 11a if this SO2 aloft is subsequently mixed down to the surface (Copernicus Sentinel-5P, 2020).
Combining the HALO Doppler lidar boundary layer evolution with our surface observations, we see increases in SO2 once the boundary layer grows in height to begin mixing elevated layers down to the surface (Fig. 12) and that this increase is already seen by mid-morning, long before sea breezes are expected to reach the station. Figure 12 also shows that the majority of high-SO2-concentration episodes (defined previously as being above the 90th percentile; 1.174 ppb) are when the wind direction at upper levels in the boundary layer is from the gulf.
To ensure that the observed wind directions measured aloft were representative of the larger mesoscale flow, an air mass back-trajectory analysis was performed for all layers within the boundary layer and binned with respect to the surface SO2 concentrations. The relative difference between air mass trajectories associated with high and low surface SO2 concentrations measured at the station is shown in Fig. 11b, and it displays a very similar spatial pattern to the mean SO2 concentration from the TROPOMI satellite (Fig. 11a); high relative difference values are consistently associated with regions having high mean SO2 concentrations, while trajectories coming from the ocean (low mean satellite SO2 concentrations), for example, are in the lowest 10th percentile range. Thus, we have confidence that long-range transport is responsible for the elevated SO2 concentrations measured at the station.
Our hypothesis is shown in Fig. 13 by a schematic diagram of different horizontal transport cases of SO2. The example case in panel (a) is when there is horizontal SO2 transport in both the upper and lower parts of an air column. In the second example, panel (b), we have a horizontal transport from a direction where there are no SO2 sources. In the third example, panel (c), there is horizontal SO2 transport only in the upper part of an air column, and the transported SO2 is mixed down to the surface when the boundary layer evolves and grows to the height of the air mass including SO2. We consider the example case in panel (c) an explanation for the measured higher SO2 concentrations at the surface during daytime when the surface winds speeds are low.
We used data from a 1-year measurement campaign conducted in the United Arab Emirates during 2018–2019 to investigate how aerosol particle and SO2 concentrations at the surface responded to changes in horizontal and vertical transport. In this sense, the measurement location was ideal as the boundary layer structure was very similar from day to day, with a deep well-mixed boundary layer during the day and a shallow nocturnal boundary layer. The maximum boundary layer height was usually reached in the afternoon around 14:00 local time.
The potential for horizontal transport at different altitudes was obtained from the vertical profile of the horizontal winds measured by the Doppler lidar scans, together with the surface measurements. At this location, vertical transport is dominated by the turbulent mixing within the daytime convective well-mixed boundary layer, and the extent of the vertical transport was diagnosed from the Doppler lidar vertical-pointing observations. It is assumed that the vertical mixing timescale in the well-mixed boundary layer is of the order of 10 min. For the surface measurements, the horizontal transport can then be defined with respect to the maximum wind speed in the vertical profile within the well-mixed boundary layer, as the vertical transport timescale will rapidly mix atmospheric constituents to all altitudes within the well-mixed boundary layer.
The measurement location was a rural background site, with local sources of SO2 expected to be minimal. Our results indicate that the majority of SO2 measured at the site has been transported from the major sources of SO2 in the region, located in the gulf and further afield in Iran and Iraq. This was clearly seen by the response of the SO2 concentration with the wind speed and direction within the boundary layer as it evolves over time, with elevated concentrations seen for air masses that passed over the sources in the gulf before arriving at the station.
The nearest cities and refineries are 40–100 km from the measurement location. Surface wind speeds at the station at night were often less than 1 m s−1, which would equate to a horizontal transport of 40 km, taking over 11 h (over 27 h for 100 km). Together with a shallow boundary layer, this implies that vertical and horizontal transport at night is quite limited. However, the wind speeds above the nocturnal boundary layer usually remained high at night, often reaching 10 m s−1 or more, implying transport times closer to 1–3 h. Therefore, as soon as the morning boundary layer begins to grow and entrain air from above, the surface can experience the impact of significant horizontal transport; the constituents of an entrained elevated layer will be mixed vertically throughout the boundary layer within approximately 10 min.
Elevated layers arriving with trajectories that passed over SO2 sources identified from measurements by the TROPOMI satellite usually contained significant quantities of SO2, and surface-measured concentrations increased rapidly once these particular layers started to be entrained into the growing boundary layer, even if the surface wind direction was from a clean sector. These conditions also often displayed higher nucleation-mode aerosol particle concentrations; i.e., new particle formation events occurred due to the increase in the gaseous precursor.
The CCN number concentration and activation fraction did not show a clear dependence on the wind direction. The CCN number concentration showed some dependence on wind speed, with slightly higher concentrations under weaker winds. These higher concentrations were attributed to a weaker dilution of aerosol particles within a shallower boundary layer, with a shallower boundary layer linked to lower surface wind speeds. A similar dependence of SO2 concentration on low surface wind speeds was not seen, which was likely due to the source of SO2 being in the elevated air mass and entrained down to the surface through vertical mixing.
A comprehensive picture of the processes affecting aerosol particle properties means that it is important not only to investigate what is happening at the surface but also to diagnose the impact of the dynamic boundary layer on the potential for significant horizontal transport in elevated layers and subsequent mixing in the vertical transport.
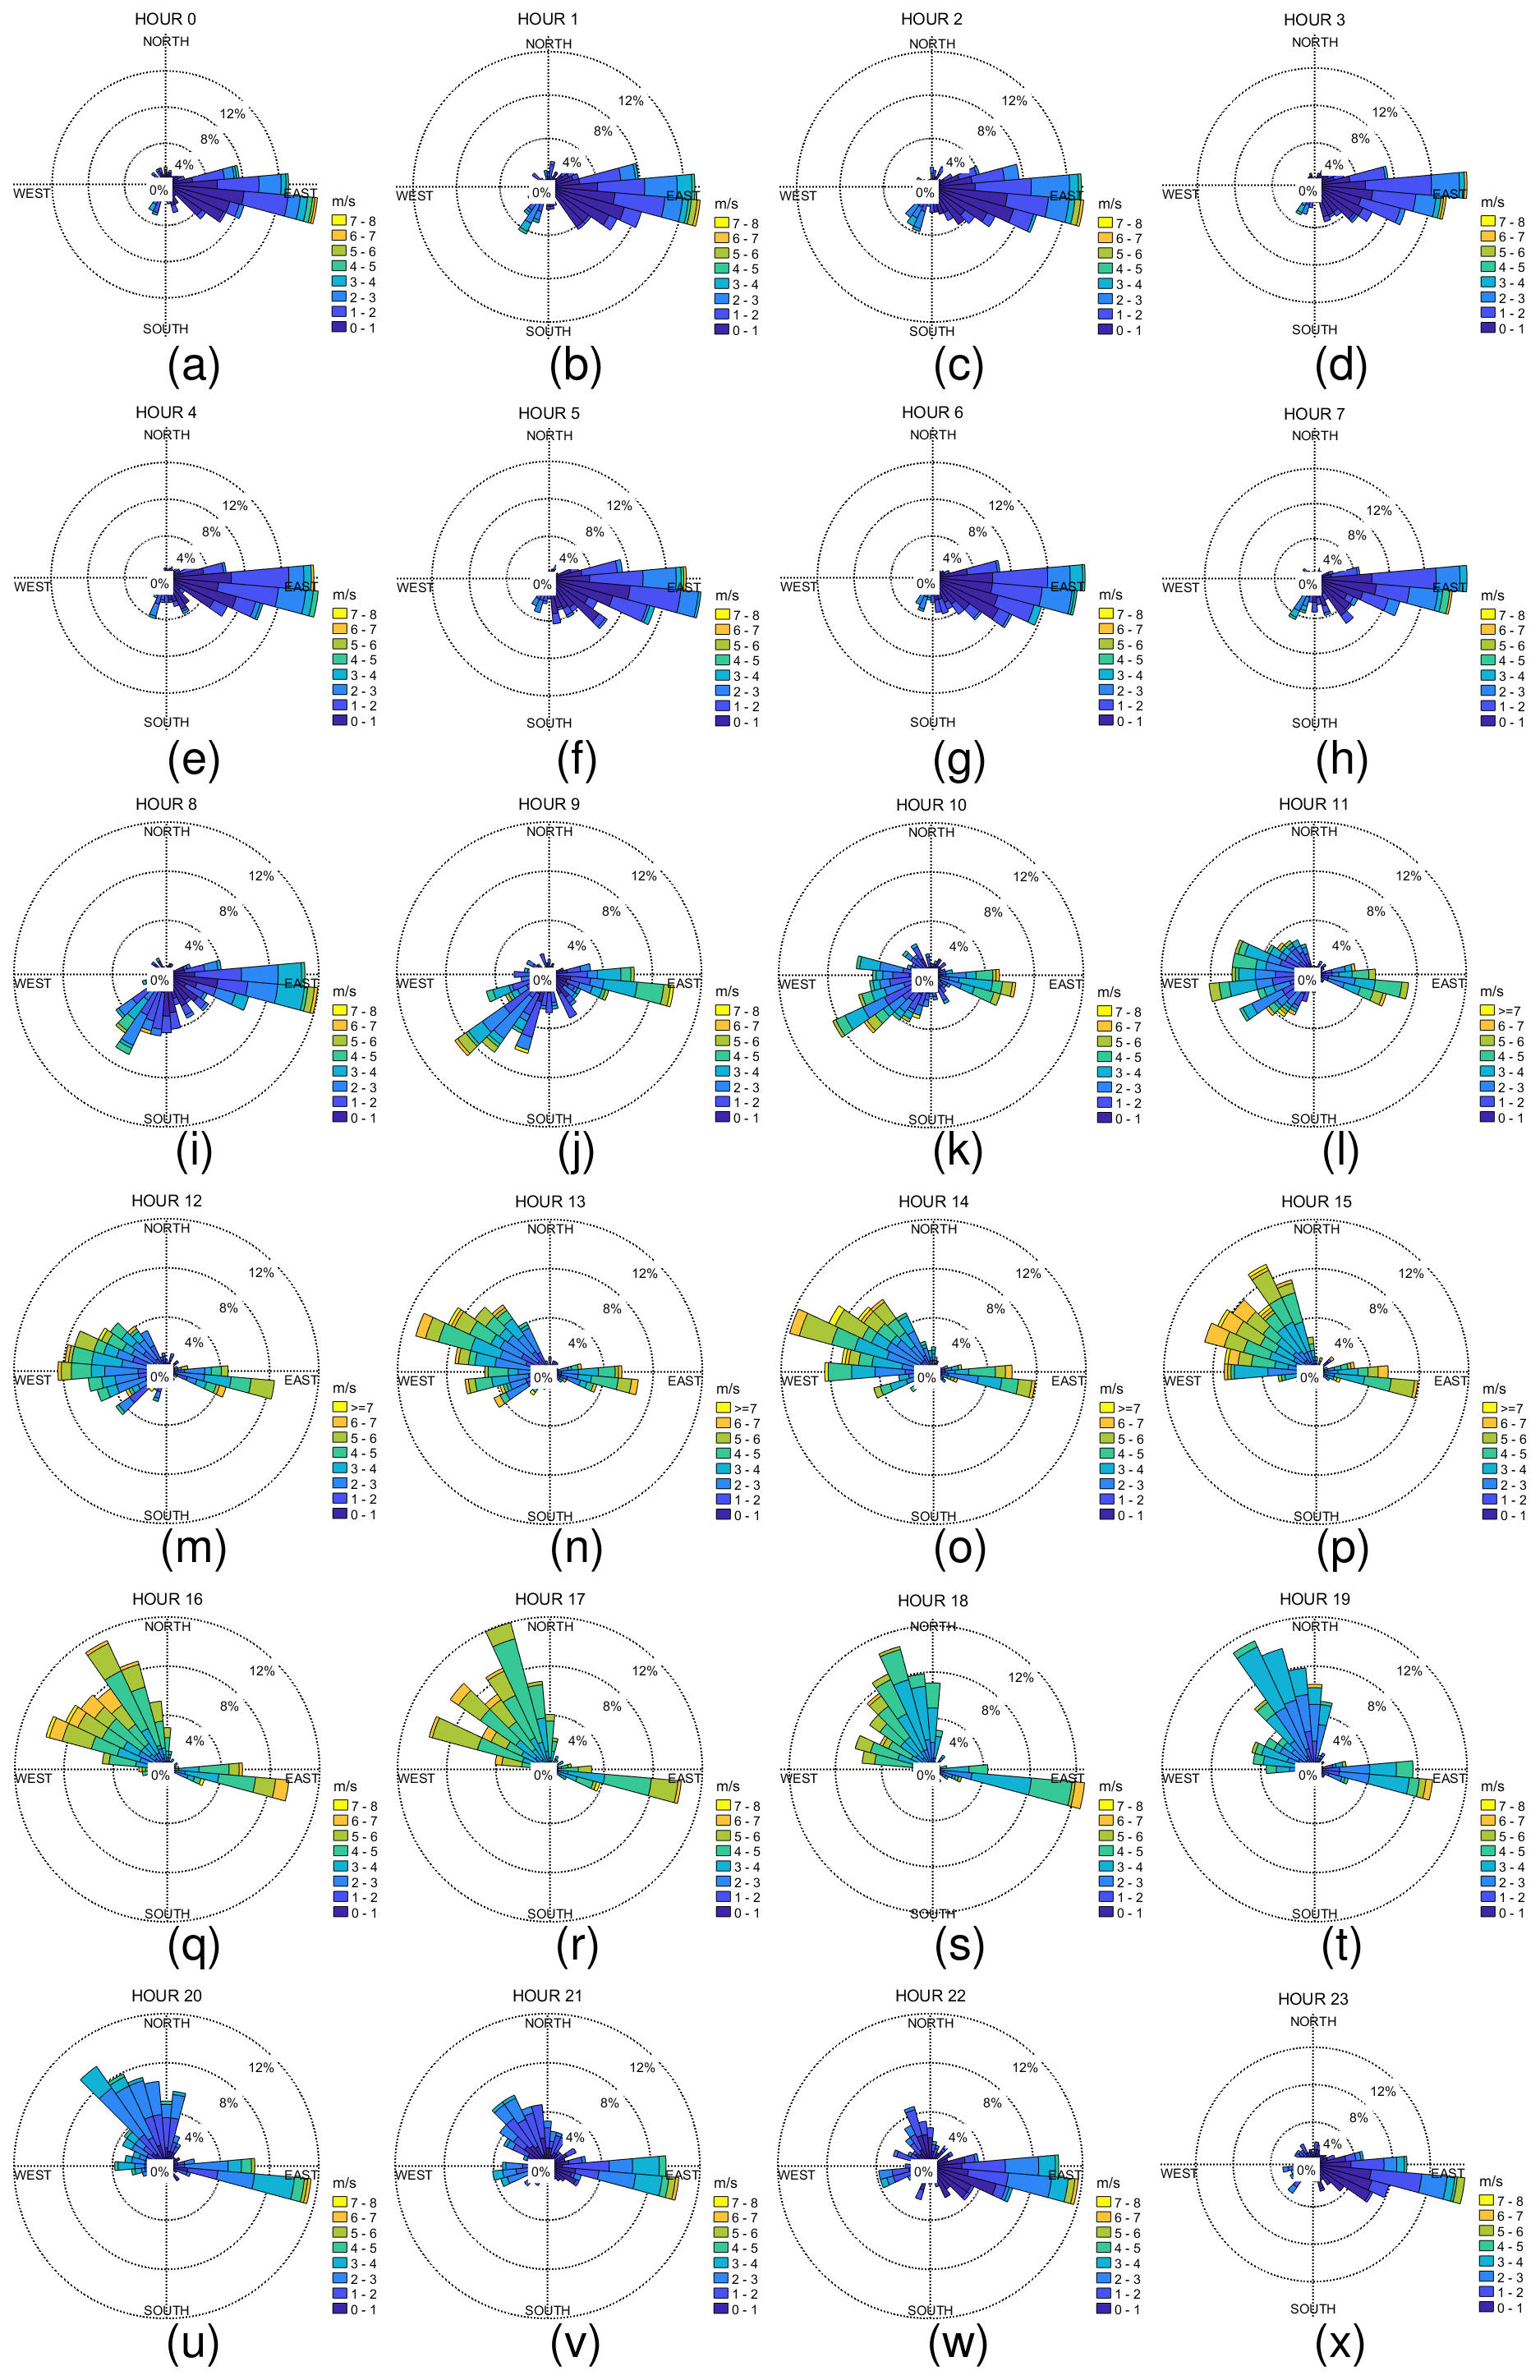
Figure A1Wind roses for different hours in the UAE: (a) 0, (b) 1, (c) 2, (d) 3, (e) 4, (f) 5, (g) 6, (h) 7, (i) 8, (j) 9, (k) 10, (l) 11, (m) 12, (n) 13, (o) 14, (p) 15, (q) 16, (r) 17, (s) 18, (t) 19, (u) 20, (v) 21, (w) 22, and (x) 23. The colours show the wind speed (m s−1), and the percentages indicate the percentage of time when wind was observed from a certain direction.
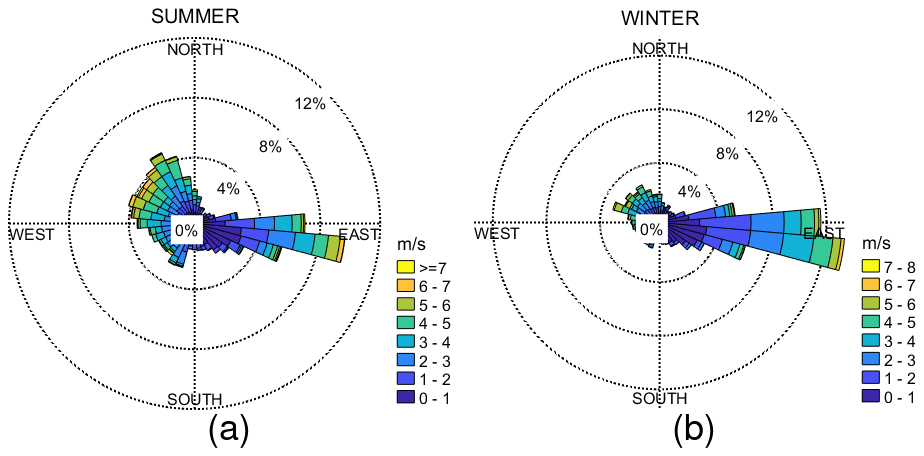
Figure A2Wind roses for different seasons in the UAE: (a) summer and (b) winter. The colours show the wind speed (m s−1), and the percentages indicate the percentage of time when wind was observed from a certain direction.
Table A1The minimum and maximum values for the mean, standard deviation, and 25th, 50th, and 75th percentile for the activation fraction. Also shown are the κ values at four different supersaturations.
The data used in this study were published by Kesti et al. (2024) (https://doi.org/10.57707/fmi-b2share.75069dfaf2184714a1976e9c435e2631). The satellite data are available from Copernicus Sentinel-5P (2020) at https://doi.org/10.5270/S5P-74eidii.
JK, EJOC, AH, and EA conceptualized the original paper. JK, JB, and HL were responsible for the measurements. JK, EJOC, and JB processed the data. JK, EJOC, JB, MF, and AMS performed the data analysis. JK wrote the paper. All authors were involved in the interpretation of the results and editing of the paper.
At least one of the (co-)authors is a member of the editorial board of Atmospheric Chemistry and Physics. The peer-review process was guided by an independent editor, and the authors also have no other competing interests to declare.
Any opinions, findings and conclusions or recommendations expressed in this material are those of the author(s) and do not necessarily reflect the views of the National Center of Meteorology, Abu Dhabi, UAE, funder of the research.
Publisher’s note: Copernicus Publications remains neutral with regard to jurisdictional claims made in the text, published maps, institutional affiliations, or any other geographical representation in this paper. While Copernicus Publications makes every effort to include appropriate place names, the final responsibility lies with the authors.
This work was supported by the National Center of Meteorology, Abu Dhabi, UAE, under the UAE Research Program for Rain Enhancement Science. The authors are grateful to Timo Anttila, Siddharth Tampi, and Farah Abdi for providing on-site technical support.
This research has been supported by the Maj ja Tor Nesslingin Säätiö (grant no. 202000254) and the Research Council of Finland (grant no. 337552).
This paper was edited by Geraint Vaughan and reviewed by two anonymous referees.
Aalto, P., Hämeri, K., Becker, E., Weber, R., Salm, J., Mäkelä, J. M., Hoell, C., O'Dowd, C. D., Hansson, H.-C., Väkevä, M., Koponen, I.K., Buzorius, G., and Kulmala, M.: Physical characterization of aerosol particles during nucleation events, Tellus B, 53, 344–358, https://doi.org/10.3402/tellusb.v53i4.17127, 2001. a
Abuelgasim, A., Bilal, M., and Alfaki, I. A.: Spatiotemporal variations and long term trends analysis of aerosol optical depth over the United Arab Emirates, Remote Sens. Appl. Soc. Environ., 23, 100532, https://doi.org/10.1016/j.rsase.2021.100532, 2021. a
Al Hosari, T., Al Mandous, A., Wehbe, Y., Shalaby, A., Al Shamsi, N., Al Naqbi, H., Al Yazeedi, O., Al Mazroui, A., and Farrah, S.: The UAE cloud seeding program: A statistical and physical evaluation, Atmosphere, 12, 1013, https://doi.org/10.3390/atmos12081013, 2021. a
Albrecht, B. A.: Aerosols, cloud microphysics, and fractional cloudiness, Science, 245, 1227–1230, 1989. a
Attada, R., Dasari, H. P., Chowdary, J. S., Yadav, R. K., Knio, O., and Hoteit, I.: Surface air temperature variability over the Arabian Peninsula and its links to circulation patterns, Int. J. Climatol., 39, 445–464, https://doi.org/10.1002/joc.5821, 2018. a
Beegum, S. N., Romdhane, H. B., Ali, M. T., Armstrong, P., and Ghedira, H.: Optical and radiative properties of aerosols over Abu Dhabi in the United Arab Emirates, J. Earth Syst. Sci., 125, 1579–1602, 2016. a
Birmili, W. and Wiedensohler, A.: New particle formation in the continental boundary layer: Meteorological and gas phase parameter influence, Geophys. Res. Lett., 27, 3325–3328, 2000. a
Buchhorn, M., Smets, B., Bertels, L., Lesiv, M., Tsendbazar, N.-E., Masiliunas, D., Linlin, L., Herold, M., and Fritz, S.: Copernicus Global Land Service: Land Cover 100m: Collection 3: epoch 2019: Globe (Version V3.0.1), Zenodo [data set], https://doi.org/10.5281/zenodo.3939050, 2020. a
Bzdek, B. R. and Johnston, M. V.: New particle formation and growth in the troposphere, Anal. Chem., 82, 7871–7878, https://doi.org/10.1021/ac100856, 2010. a
Copernicus Sentinel-5P (processed by ESA): TROPOMI Level 2 Sulphur Dioxide Total Column, Version 02, European Space Agency [data set], https://doi.org/10.5270/S5P-74eidii, 2020. a, b
Dasari, H. P., Viswanadhapalli, Y., Langodan, S., Abualnaja, Y., Desamsetti, S., Vankayalapati, K., Thang, L., and Hoteit, I.: High‐resolution climate characteristics of the Arabian Gulf based on a validated regional reanalysis, Meteorol. Appl., 29, 5, https://doi.org/10.1002/met.2102, 2022. a
Derimian, Y., Choël, M., Rudich, Y., Deboudt, K., Dubovik, O., Laskin, A., Legrand, M., Damiri, B., Koren, I., Unga, F., Moreau, M., Andreae, M. O., and Karnieli, A.: Effect of sea breeze circulation on aerosol mixing state and radiative properties in a desert setting, Atmos. Chem. Phys., 17, 11331–11353, https://doi.org/10.5194/acp-17-11331-2017, 2017. a
Eager, R. E., Raman, S., Wootten, A., Westphal, D. L., Reid, J. S., and Al Mandoos, A.: A climatological study of the sea and land breezes in the Arabian Gulf region, J. Geophys. Res.-Atmos., 113, D15, https://doi.org/10.1029/2007jd009710, 2008. a, b, c
Filioglou, M., Giannakaki, E., Backman, J., Kesti, J., Hirsikko, A., Engelmann, R., O'Connor, E., Leskinen, J. T. T., Shang, X., Korhonen, H., Lihavainen, H., Romakkaniemi, S., and Komppula, M.: Optical and geometrical aerosol particle properties over the United Arab Emirates, Atmos. Chem. Phys., 20, 8909–8922, https://doi.org/10.5194/acp-20-8909-2020, 2020. a, b, c, d
Hakala, S., Alghamdi, M. A., Paasonen, P., Vakkari, V., Khoder, M. I., Neitola, K., Dada, L., Abdelmaksoud, A. S., Al-Jeelani, H., Shabbaj, I. I., Almehmadi, F. M., Sundström, A.-M., Lihavainen, H., Kerminen, V.-M., Kontkanen, J., Kulmala, M., Hussein, T., and Hyvärinen, A.-P.: New particle formation, growth and apparent shrinkage at a rural background site in western Saudi Arabia, Atmos. Chem. Phys., 19, 10537–10555, https://doi.org/10.5194/acp-19-10537-2019, 2019. a
Jiang, H., Xue, H., Teller, A., Feingold, G., and Levin, Z.: Aerosol effects on the lifetime of shallow cumulus, Geophys. Res. Lett., 33, 14, https://doi.org/10.1029/2006GL026024, 2006. a
Kesti, J., Backman, J., O'Connor, E. J., Hirsikko, A., Asmi, E., Aurela, M., Makkonen, U., Filioglou, M., Komppula, M., Korhonen, H., and Lihavainen, H.: Aerosol particle characteristics measured in the United Arab Emirates and their response to mixing in the boundary layer, Atmos. Chem. Phys., 22, 481–503, https://doi.org/10.5194/acp-22-481-2022, 2022. a, b, c, d, e, f, g, h, i, j
Kesti, J., O'Connor, E. J., Hirsikko, A., Backman, J., Filioglou, M., Sundström, A.-M., Tonttila, J., Lihavainen, H., Korhonen, H., and Asmi, E.: Datasets for the manuscript “How horizontal transport and turbulent mixing impacts aerosol particle and precursor concentrations at a background site in the UAE” by Kesti et al. (2024), Finnish Meteorological Institute [data set], https://doi.org/10.57707/fmi-b2share.75069dfaf2184714a1976e9c435e2631, 2024. a, b
Khodeir, M., Shamy, M., Alghamdi, M., Zhong, M., Sun, H., Costa, M., Chen, L.-C., and Maciejczyk, P.: Source apportionment and elemental composition of PM2.5 and PM10 in Jeddah City, Saudi Arabia, Atmos. Pollut. Res., 3, 331–340, 2012. a
Krishna Moorthy, K., Pillai, P. S., and Suresh Babu, S.: Influence of changes in the prevailing synoptic conditions on the response of aerosol characteristics to land-and sea-breeze circulations at a coastal station, Bound. Lay. Meteorol., 108, 145–161, 2003. a
Kuang, C., McMurry, P., and McCormick, A.: Determination of cloud condensation nuclei production from measured new particle formation events, Geophys. Res. Lett., 36, 9, https://doi.org/10.1029/2009GL037584, 2009. a
Kulmala, M., Pirjola, L., and Mäkelä, J. M.: Stable sulphate clusters as a source of new atmospheric particles, Nature, 404, 66–69, 2000. a, b
Kulmala, M., Vehkamäki, H., Petäjä, T., Dal Maso, M., Lauri, A., Kerminen, V.-M., Birmili, W., and McMurry, P.: Formation and growth rates of ultrafine atmospheric particles: a review of observations, J. Atmos. Sci., 35, 143–176, 2004. a
Kumar, A., Ram, K., and Ojha, N.: Variations in carbonaceous species at a high-altitude site in western India: Role of synoptic scale transport, Atmos. Environ., 125, 371–382, 2016. a
Laaksonen, A., Hamed, A., Joutsensaari, J., Hiltunen, L., Cavalli, F., Junkermann, W., Asmi, A., Fuzzi, S., and Facchini, M. C.: Cloud condensation nucleus production from nucleation events at a highly polluted region, Geophys. Res. Lett., 32, 6, https://doi.org/10.1029/2004GL022092, 2005. a
Lihavainen, H., Alghamdi, M., Hyvärinen, A.-P., Hussein, T., Aaltonen, V., Abdelmaksoud, A., Al-Jeelani, H., Almazroui, M., Almehmadi, F., Al Zawad, F., Hakala, J., Khoder, M., Neitola, K., Petäjä, T., Shabbaj, J., and Hämeri, K.: Aerosols physical properties at Hada Al Sham, western Saudi Arabia, Atmos. Environ., 135, 109–117, 2016. a
Manninen, A., Marke, T., Tuononen, M., and O'Connor, E.: Atmospheric boundary layer classification with Doppler lidar, J. Geophys. Res.-Atmos., 123, 8172–8189, 2018. a, b
Marti, J. J., Weber, R. J., McMurry, P. H., Eisele, F., Tanner, D., and Jefferson, A.: New particle formation at a remote continental site: Assessing the contributions of SO2 and organic precursors, J. Geophys. Res.-Atmos., 102, 6331–6339, 1997. a
Merikanto, J., Spracklen, D. V., Mann, G. W., Pickering, S. J., and Carslaw, K. S.: Impact of nucleation on global CCN, Atmos. Chem. Phys., 9, 8601–8616, https://doi.org/10.5194/acp-9-8601-2009, 2009. a
Patlakas, P., Stathopoulos, C., Flocas, H., Kalogeri, C., and Kallos, G.: Regional Climatic Features of the Arabian Peninsula, Atmosphere, 10, 4, https://doi.org/10.3390/atmos10040220, 2019. a
Roberts, G. and Nenes, A.: A continuous-flow streamwise thermal-gradient CCN chamber for atmospheric measurements, Aerosol Sci. Technol., 39, 206–221, 2005. a
Rushdi, A. I., El-Mubarak, A. H., Lijotra, L., Al-Otaibi, M. T., Qurban, M. A., Al-Mutlaq, K. F., and Simoneit, B. R.: Characteristics of organic compounds in aerosol particulate matter from Dhahran city, Saudi Arabia, Arabian J. Chem., 10, S3532–S3547, 2017. a
Semeniuk, T. A., Bruintjes, R., Salazar, V., Breed, D., Jensen, T., and Buseck, P. R.: Processing of aerosol particles within the Habshan pollution plume, J. Geophys. Res.-Atmos., 120, 1996–2012, 2015. a
Sipilä, M., Berndt, T., Petäjä, T., Brus, D., Vanhanen, J., Stratmann, F., Patokoski, J., Mauldin III, R. L., Hyvärinen, A.-P., Lihavainen, H., and Kulmala, M.: The role of sulfuric acid in atmospheric nucleation, Science, 327, 1243–1246, 2010. a, b
Stein, A. F., Draxler, R. R., Rolph, G. D., Stunder, B. J. B., Cohen, M. D., and Ngan, F.: NOAA's HYSPLIT Atmospheric Transport and Dispersion Modeling System, B. Am. Meteor. Soc., 96, 2059–2077, https://doi.org/10.1175/BAMS-D-14-00110.1, 2015. a
Wagner, F., Bortoli, D., Pereira, S., Costa, M. J., Maria Silva, A., Weinzierl, B., Esselborn, M., Petzold, A., Rasp, K., Heinold, B., and Tegen, I.: Properties of dust aerosol particles transported to Portugal from the Sahara desert, Tellus B, 61, 297–306, 2009. a
Weber, R., Marti, J., McMurry, P., Eisele, F., Tanner, D., and Jefferson, A.: Measurements of new particle formation and ultrafine particle growth rates at a clean continental site, J. Geophys. Res.-Atmos., 102, 4375–4385, 1997. a, b
Wehbe, Y.: Unraveling the Spatiotemporal Dynamics of Satellite-Inferred Water Resources in the Arabian Peninsula, in: Satellite Monitoring of Water Resources in the Middle East, 99–114, Springer, https://doi.org/10.1007/978-3-031-15549-9_7, 2022. a
Wehbe, Y. and Temimi, M.: A remote sensing-based assessment of water resources in the Arabian Peninsula, Remote Sens., 13, 247, https://doi.org/10.3390/rs13020247, 2021. a
Wehbe, Y., Ghebreyesus, D., Temimi, M., Milewski, A., and Al Mandous, A.: Assessment of the consistency among global precipitation products over the United Arab Emirates, J. Hydrol. Reg. Stud., 12, 122–135, 2017. a
Wehbe, Y., Temimi, M., Ghebreyesus, D. T., Milewski, A., Norouzi, H., and Ibrahim, E.: Consistency of precipitation products over the Arabian Peninsula and interactions with soil moisture and water storage, Hydrol. Sci. J., 63, 408–425, 2018. a
Wehbe, Y., Tessendorf, S. A., Weeks, C., Bruintjes, R., Xue, L., Rasmussen, R., Lawson, P., Woods, S., and Temimi, M.: Analysis of aerosol–cloud interactions and their implications for precipitation formation using aircraft observations over the United Arab Emirates, Atmos. Chem. Phys., 21, 12543–12560, https://doi.org/10.5194/acp-21-12543-2021, 2021. a
Wiedensohler, A., Birmili, W., Nowak, A., Sonntag, A., Weinhold, K., Merkel, M., Wehner, B., Tuch, T., Pfeifer, S., Fiebig, M., Fjäraa, A. M., Asmi, E., Sellegri, K., Depuy, R., Venzac, H., Villani, P., Laj, P., Aalto, P., Ogren, J. A., Swietlicki, E., Williams, P., Roldin, P., Quincey, P., Hüglin, C., Fierz-Schmidhauser, R., Gysel, M., Weingartner, E., Riccobono, F., Santos, S., Grüning, C., Faloon, K., Beddows, D., Harrison, R., Monahan, C., Jennings, S. G., O'Dowd, C. D., Marinoni, A., Horn, H.-G., Keck, L., Jiang, J., Scheckman, J., McMurry, P. H., Deng, Z., Zhao, C. S., Moerman, M., Henzing, B., de Leeuw, G., Löschau, G., and Bastian, S.: Mobility particle size spectrometers: harmonization of technical standards and data structure to facilitate high quality long-term observations of atmospheric particle number size distributions, Atmos. Meas. Tech., 5, 657–685, https://doi.org/10.5194/amt-5-657-2012, 2012. a
Zhang, Q., Ma, X., Tie, X., Huang, M., and Zhao, C.: Vertical distributions of aerosols under different weather conditions: Analysis of in-situ aircraft measurements in Beijing, China, Atmos. Environ., 43, 5526–5535, 2009. a
Zhu, M. and Atkinson, B. W.: Observed and modelled climatology of the land–sea breeze circulation over the Persian Gulf, Int. J. Climatol., 24, 883–905, https://doi.org/10.1002/joc.1045, 2004. a, b