the Creative Commons Attribution 4.0 License.
the Creative Commons Attribution 4.0 License.
 | 27 Aug 2024
Observed and CMIP6-model-simulated organic aerosol response to drought in the contiguous United States during summertime
Drought events have been linked with the enhancements of organic aerosols (OAs), but the mechanisms have not been comprehensively understood. This study investigates the relationships between the monthly standardized precipitation–evapotranspiration index (SPEI) and surface OA in the contiguous United States (CONUS) during the summertime from 1998 to 2018. OA under severe drought conditions shows a significant increase in mass concentrations across most of the CONUS relative to non-drought periods, with the Pacific Northwest (PNW) and Southeast United States (SEUS) experiencing the highest average enhancement of 1.79 µg m−3 (112 %) and 0.92 µg m−3 (33 %), respectively. In the SEUS, a linear regression approach between OA and sulfate was used to estimate the epoxydiol-derived secondary organic aerosol (IEPOX SOA), which is the primary driver of the OA enhancements under droughts due to the simultaneous increase in emissions of biogenic volatile organic compounds (VOCs; such as isoprene and monoterpene) and sulfate. The rise in sulfate is mainly caused by the reduced wet deposition because of the up to 62 % lower precipitation amount. In the PNW, OA enhancements are closely linked to intensified wildfire emissions, which raise OA mass concentrations to be 4–8 times higher relative to non-fire conditions. All 10 Earth system models participating in the sixth phase of the Coupled Model Intercomparison Project (CMIP6) can capture the slopes between SPEI and OA in the PNW, with CESM2-WACCM and GFDL-ESM4 performing the best and worst in predicting the OA enhancement under severe droughts. However, all models significantly underestimate the OA increase in the SEUS, with Nor-ESM2-LM and MIRCO6 showing relatively better performance. This study reveals the key drivers of the elevated OA levels under droughts in the CONUS and underscores the deficiencies of current climate models in their predictive capacity for assessing the impact of future droughts on air quality.
- Article
(9234 KB) - Full-text XML
-
Supplement
(929 KB) - BibTeX
- EndNote


Drought events, marked by prolonged periods of water scarcity and precipitation deficits, have profound impacts on the hydrological cycle, ecosystems, and society (Wilhite et al., 2007). The contiguous United States (CONUS) is especially prone to droughts, and recent years have witnessed an escalation in both the frequency and severity of drought episodes across various regions (Leeper et al., 2022; Strzepek et al., 2010). These drought events are intricately linked to the modifications in atmospheric processes, such as emission, production, transport, and deposition, which can extend beyond the immediate hydrological impacts with far-reaching implications for air quality. Specifically, organic aerosol (OA), a major component of the particulate matter with an aerodynamic diameter less than or equal to 2.5 µm (PM2.5), emerges as a critical air quality concern influenced by the complex interactions between drought-induced meteorological conditions and biogeochemical processes.
OA can be directly emitted into the atmosphere through combustion activities, such as transportation fuel and biomass burning. This kind of OA is called primary organic aerosol (POA), whereas secondary organic aerosol (SOA) is produced by the oxidation of volatile organic compounds (VOCs). The intricate interplay between drought and OA dynamics involves complex feedback mechanisms. Biogenic isoprene, mainly emitted by terrestrial vegetation, is an important precursor of SOA and is highly sensitive to drought conditions. Both laboratory and field measurements have shown that biogenic emissions of isoprene will increase at the initial stage of drought development primarily due to temperature stimulus but drop eventually under prolonged severe drought limited by soil water availability (Pegoraro et al., 2005; Brilli et al., 2007; Potosnak et al., 2014). The abnormally high temperature and low humidity under droughts can enhance the oxidation of OA (Maria et al., 2004; Yli-Juuti et al., 2021), while low cloud water content lowers the aqueous SOA formation (Brégonzio-Rozier et al., 2016; Tsui et al., 2019), leading to compensating changes in the mass and hygroscopicity of OA. Aerosols are most effectively removed by wet scavenging, which will be reduced under lower rainfall intensity and frequency (Dawson et al., 2007; Fang et al., 2011). In addition, dry conditions can trigger large and high-intensity wildfires, emitting more POA and VOC precursors into the atmosphere (Ruffault et al., 2018; Taufik et al., 2017). The interactions of these factors underscore the need for a comprehensive understanding of the mechanisms driving variations in OA during drought events.
OA, due to its fine particulate nature and diverse chemical composition, exerts significant adverse effects on climate and human health. OA is found to be associated with a higher county-level cardiorespiratory mortality rate than other major PM2.5 components, such as sulfate, ammonium, and nitrate (Pye et al., 2021). OA can scatter solar radiation, form cloud condensation nuclei, and affect cloud droplet concentrations, posing big uncertainties for radiative forcing and climate feedback (Carslaw et al., 2013; Lee et al., 2016). Coupled chemistry–climate models and Earth system models (ESMs) are fundamental tools for studying global warming, and the accuracy of OA simulations in these models is a crucial constraint on their credibility in climate change simulation and projection (Gomez et al., 2023; Thornhill et al., 2021). The Coupled Model Intercomparison Project Phase 6 (CMIP6), containing the new generation of ESMs with interactive aerosol and gas chemistry implemented (Turnock et al., 2020), provides a valuable opportunity to evaluate the simulated OA and its response to drought, which is projected to be more frequent in the future (Cook et al., 2018).
Several case studies have focused on the impacts of droughts on the concentrations and speciation of PM2.5 in the CONUS by calculating the differences between drought and non-drought years (Wang et al., 2015; Borlina and Rennó, 2017; Zhao et al., 2019). Wang et al. (2015) and Zhao et al. (2019) compared the concentrations of PM2.5 and its compositions in the southern United States, in particular the Southeast United States, during the severe drought in the summer of 2011 against the non-drought years of 2010 and 2013, respectively. They show that PM2.5 has a respective enhancement of 47 % and 65 % with the largest contribution from the increase in organic carbon (OC) by 119 % and 117 %. Following OC, sulfate in the Southeast United States is enhanced by 84 % during the 2011 drought relative to 2013. However, fewer studies have carried out long-term analyses, which can help derive a more robust drought-aerosol association than case studies. Wang et al. (2017) performed a 25-year analysis during the growing season (March–October) from 1990 to 2014 and found that, on a monthly scale, the overall 17 % enhancement of PM2.5 in the CONUS is mainly attributed to the increase in OA, sulfate, and dust. Each of these species has a unique spatial pattern in their response to droughts, which warrants a further subregional analysis to reveal the processes causing such spatial distribution discrepancy.
In this study, we focus on the changes in OA under droughts over the CONUS during the study period of summertime from 1998 to 2018. Spatial patterns of the responses of OA to droughts will be explored, followed by a regional analysis focusing on the Southeast United States (SEUS) and Pacific Northwest (PNW) where the highest responsive rates of OA to droughts are found. The processes responsible for the increase in OA in these regions will be discussed. To conclude, the observed drought–OA relationships will be used as a process-level metric to evaluate OA simulations in the CMIP6 ESMs, which can shed light on future model development and improve aerosol predictions.
2.1 Drought indicator
The 1-month gridded Standardized Precipitation-Evapotranspiration Index (SPEI) data from the global SPEI database (https://spei.csic.es/, last access: 27 November 2023) were selected as being the drought indicator because of their numerical nature that allows for statistical analysis (e.g., correlation and regression). SPEI is a multi-scaler index, allowing for the identification and comparison of drought severity through time and space (Vicente-Serrano et al., 2010). Negative values of SPEI are indicative of droughts and vice versa. The dataset has a spatial resolution of 0.5° × 0.5° and a temporal range of 1973–2018. A composite analysis can also be conducted by applying the criteria of SPEI < −1.3 and SPEI > −0.5 to denote severe drought and non-drought conditions, respectively, as suggested by Wang et al. (2017).
2.2 Air quality and meteorological data
To expand the spatial coverage, we created a gridded daily organic carbon (OC) dataset (0.5° × 0.5°) from 1998 to 2018 that aggregates site-based observations from the Interagency Monitoring of Protected Visual Environments (IMPROVE) network using the modified inverse distance weighting method as done by Schnell et al. (2014). Data from the IMPROVE sites have been widely used by previous studies to investigate surface particulate matter trends or variations in the CONUS (e.g., Hand et al., 2012). A factor of 2.1 was used to convert OC observations to OA as suggested by other studies (Pye et al., 2017; Schroder et al., 2018). The US Environmental Protection Agency Chemical Speciation Network (EPA-CSN) also provides long-term OA data, but the CSN uses different sampling practices and analytical methods from IMPROVE, which can lead to systematic differences in OA measurements (Hand et al., 2012; Gorham et al., 2021). Thus, we only used the IMPROVE dataset in this study. To reduce the artifacts caused by different data completeness (e.g., old sites retired and new sites started), we selected the sites with data records longer than 5 years during the study period for interpolation following Li and Wang (2022). Based on this criterion, there are a total of 175 sites selected for interpolation, ∼ 80 % of which have a data record equal to or greater than 15 years, suggesting small temporal uncertainties caused by the spatial interpolation (Fig. S1 in the Supplement).
Sulfate is known to influence the formation of epoxydiol-derived secondary organic aerosol (IEPOX SOA), a key component of OA. To explore how this linkage changes with drought, we generated a gridded sulfate dataset following the same method as OC. Monthly sulfate wet depositions with associated precipitation amount and pH were obtained from the National Atmospheric Deposition Program (NADP). There are a total of 53 NADP sites in the SEUS (defined in Sect. 3.1) with a data record spanning more than 5 years during the study period. We obtained the satellite-based low-level (below 700 hPa) cloud cover and liquid water content (LWC) between 2000 to 2018 from the Clouds and the Earth's Radiant Energy System (CERES) monthly Single Scanner Footprint 1° × 1° (SSF1deg) product (NASA, 2015). To investigate OA changes from wildfire, monthly open fire emissions were from the Global Fire Emission Database version 4 (GFED4) for 1998–2018 (Giglio et al., 2013). The version of GFED4 we used includes the burned area contributions from small fires, which increases the total amount of burned area by 75 % relative to its previous version and brings the prescribed burned area estimates into closer agreement with those reported by the National Interagency Fire Center (Randerson et al., 2012). Thus, the prescribed fire burning is partly, if not completely, considered in the analysis.
2.3 CMIP6 AerChemMIP models
A total of 10 models from the CMIP6 Aerosol Chemistry Model Intercomparison Project (AerChemMIP) were selected: BCC-ESM1, CESM2-WACCM, CNRM-ESM2-1, EC-Earth3-AerChem, GFDL-ESM4, GISS-E2-1-G, MIROC6, MRI-ESM2-0, NorESM2-LM, and UKESM1-0-LL. They are the only models found at the time of writing with OA and sulfate mass concentration outputs from historical simulations with prescribed sea surface temperature in the AerChemMIP project from 1850 to 2014. No ensemble members were found for the 10 models. Various aerosol schemes are used by the models with different treatments for gas-phase reactions and secondary aerosol formation. More information and references (Danabasoglu et al., 2020; Dunne et al., 2020; Kelley et al., 2020; van Noije et al., 2021; Séférian et al., 2019; Seland et al., 2020; Senior et al., 2020; Tatebe et al., 2019; Wu et al., 2020; Yukimoto et al., 2019) for each model are listed in Table S1 in the Supplement.
3.1 Spatial distributions of organic aerosol response to drought
Figure 1a shows the maps of the mean summertime (JJA 1998–2018) surface OA concentrations under non-drought conditions and their changes under severe droughts with the observational sites (dots) overlaid. The associated frequency and OA standard deviation during non-drought and severe drought periods are displayed in Fig. S2. The western United States along the Rocky Mountains exhibit the highest severe drought frequency of up to 25 %, while wet and normal conditions are more common in the eastern United States and southern California, with a frequency of more than 80 %. Higher OA concentrations can be found in central California and the eastern United States under non-drought conditions, reflecting the average spatial distributions of summertime OA. Under severe droughts, most of the grids and sites display an enhanced OA level, with a mean increase of 0.72 µg m−3 across all the grids and 0.78 µg m−3 across all the sites in the CONUS. Higher enhancements occur in the Pacific Northwest (PNW; 42–50° N, 105–125° W; red box in Fig. 1a) and Southeast United States (SEUS; 25–37° N, 75–100° W; blue box in Fig. 1a). In both regions, the overall gridded OA statistical distributions under severe droughts move towards the higher end compared with those under non-drought conditions (Fig. 1b), with an increase in the mean value by 1.79 µg m−3 (112 %) and 0.92 µg m−3 (33 %) across the PNW and SEUS, respectively. Similar results are found using on-site data with a respective increase in the mean value by 2.18 µg m−3 (118 %) and 1.11 µg m−3 (34 %), which indicates that the interpolation does not significantly affect the results. OA experienced a downward trend in the SEUS during the last 2 decades due to the reduction of anthropogenic emissions (Ridley et al., 2018). To verify whether the trend will significantly affect our results in the SEUS, we reproduced Fig. 1b in Fig. S3a using detrended OA. The detrend is conducted by removing the 7-year moving average from the raw data in the same month of each year following Wang et al. (2017) and Li et al. (2022). OA enhancement under severe droughts is 0.78 and 1.02 µg m−3 for gridded and on-site data, respectively; these levels are comparable to those derived from raw OA data in the SEUS area. This indicates that anthropogenic emission changes do not significantly interfere with our analysis and instead natural processes play a more important role in causing the enhancement of OA in the SEUS region.
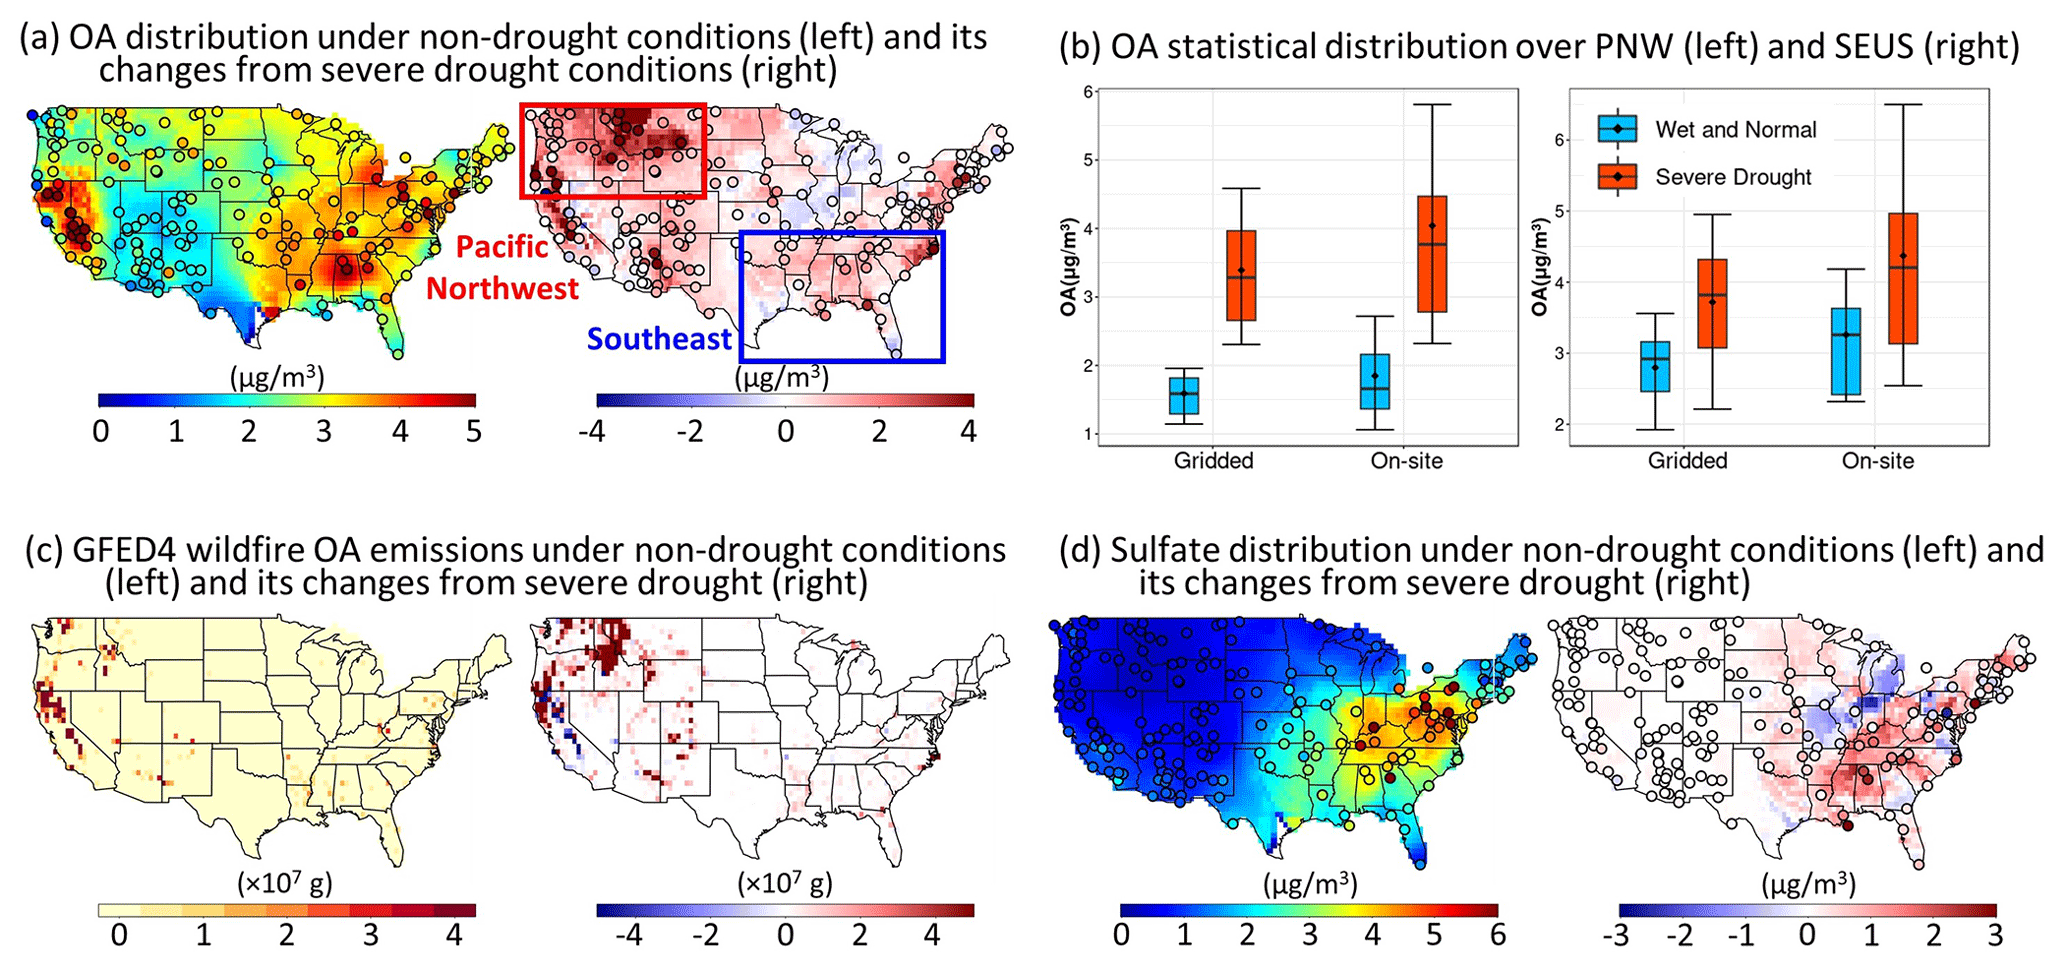
Figure 1(a) Maps of the mean gridded and in situ (dots) OA under non-drought (wet and normal) conditions (left) from 1998 to 2018 in JJA and its changes from severe drought conditions (right). (b) Comparisons of statistical distributions of gridded and on-site OA mass concentrations under severe drought (red boxes) and non-drought (blue boxes) conditions over the Pacific Northwest (left) and Southeast region (right). (c–d) Same as (a) but for OA monthly wildfire emissions from the GFED4 inventory and sulfate, respectively.
Wildfire, a major source of biomass burning, is one of the biggest contributors to both POA and SOA globally (Hallquist et al., 2009; Gilman et al., 2015; Jen et al., 2019). In the western United States, OA, as the largest component of PM2.5, experiences an upward trend, opposite to the rest of the country, due to the increasingly higher wildfire frequency (Dennison et al., 2014; McClure and Jaffe, 2018; Wang et al., 2022a). Indeed, we found many “hot spots” of wildfire emissions of OA over the western United States under non-drought conditions based on the GFED4 wildfire fire inventory (Fig. 1c). Severe droughts can lead to extremely high wildfire OA emissions over the PNW region, which corresponds to the highest OA enhancement and variability as shown in Figs. 1a and S2b, respectively. In contrast, the SEUS undergoes a much lower enhancement of wildfire OA emissions under severe droughts. Biogenic secondary organic aerosol (BSOA) is reported to be the major fine aerosol component in the SEUS, accounting for 60 %–90 % of the total PM2.5, due to the abundant isoprene emissions (Zhang et al., 2012; Hidy et al., 2014; Kim et al., 2015). The concentrations of BSOA in the SEUS region strongly depend on ambient sulfate through the reactive uptake of gas-phase epoxydiols (IEPOX) onto the aqueous acidified surface of sulfate particles (Surratt et al., 2010; Xu et al., 2015; Lopez-Hilfiker et al., 2016; Malm et al., 2017). Interestingly, the highest sulfate increase during drought is found in the SEUS (Fig. 1d), presumably due to enhanced gas-phase sulfate production and reduced wet deposition (Wang et al., 2015; Xie et al., 2019). The higher sulfate concentrations during droughts lead to the enhanced formation of IEPOX SOA, which is likely an important factor leading to a higher OA level in the SEUS.
Using the numerical drought indicator of SPEI, we calculated the linear slopes between monthly OA and SPEI in each grid (Fig. 2a). Consistent with the composite analysis in Figure 1a, most of the grids show negative slopes with the highest absolute values of more than 2 µg m−3 per unit change of SPEI occurring in the PNW region. It is noteworthy that negative values of SPEI indicate droughts, and thus the negative slopes with SPEI signify an enhanced OA level over most of the CONUS during drought. We further examined the monthly time series of the regional mean of SPEI, normalized OA, sulfate, and OA wildfire emissions in the PNW and SEUS (Fig. 2b). OA in the PNW region is strongly correlated with OA emissions from fire with a high correlation coefficient (R) of 0.88. The extremely high values of OA and OA fire emissions are also concurrent with droughts when SPEI is negative (red bars). Conversely, the SEUS has a weak correlation between OA and OA fire emissions yet a high association between OA and sulfate with an R value of 0.79. Wildfire seems only to have high contributions to peak OA values in extreme drought years, such as in 2011. Based on the correlation coefficients, more than 60 % and 70 % of the monthly OA variability can be explained by sulfate and wildfire emissions in the SEUS and PNW regions, respectively, which deserves an in-depth exploration in the next section.
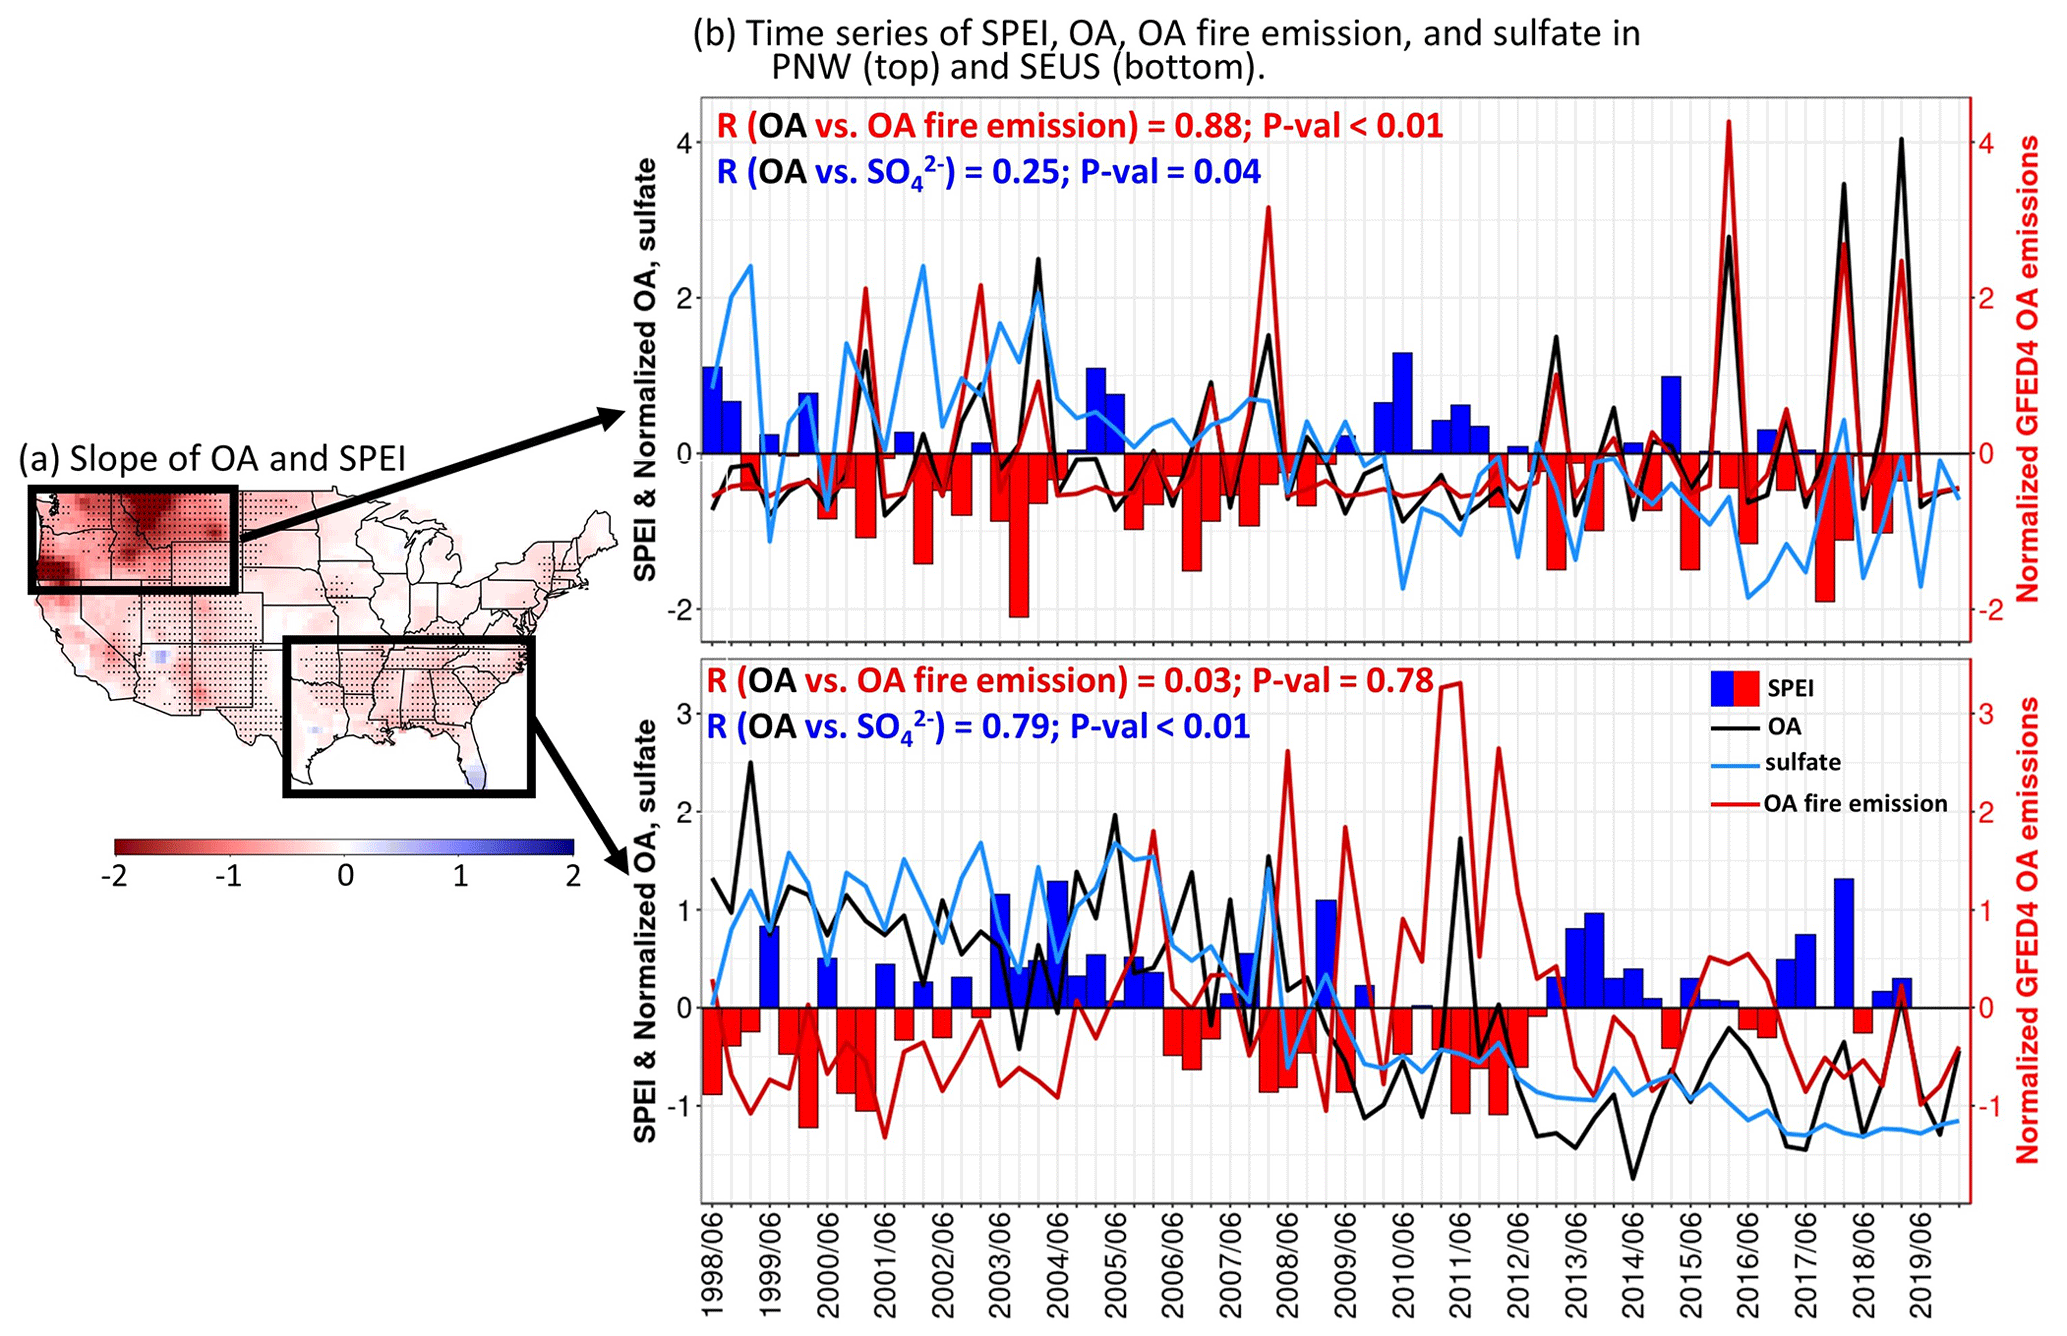
Figure 2(a) Map of the slopes between monthly gridded OA and SPEI. Black dots indicate the slopes with p values less than 0.05. (b) Time series of SPEI (bar), normalized OA (black line), sulfate (blue line), and wildfire OA emissions from the GFED4 inventory (red line; right axis) averaged across the PNW (top) and SEUS (bottom) region. The numbers indicate the correlation coefficient (R) and p value (P-val) between OA and sulfate (blue) and wildfire emissions (red).
3.2 Regional analysis in the Pacific Northwest and Southeast United States
In this section, we conducted a regional analysis of OA, focusing on OA relationships with sulfate in the SEUS and with wildfire emissions in the PNW. In the SEUS, we calculated the linear regression between OA and sulfate in Fig. 3a following the method of Malm et al. (2017). Each data point represents the SPEI-bin-averaged value of OA and sulfate from each grid cell. The bins are divided to have approximately the same number of samples following Xie et al. (2019). Only the grids with all five SPEI bins present are used (N = 673); this includes more than 95 % of the total grids (687). Thus, the binned regression calculation can represent the regional conditions of each SPEI bin. The resulting linear lines and formula are also displayed in Fig. 3a. Here the slope calculation is different from Zheng et al. (2020), in which they averaged OA and sulfate across all the sites in the SEUS and performed the linear regression temporally. We adopted a spatial calculation of the linear slopes for two reasons: (1) averaging across all the sites/grids will significantly reduce the number of data points after the allocation among SPEI bins, and (2) the regional mean of SPEI may average out some drought signals because drought is grid-specific and can differ spatially within the SEUS (Ford and Labosier, 2014). Despite the different methods used, the linear slope in our calculation (0.56) under non-drought conditions is similar to that of Zheng et al. (2020) using SEARCH (Southeastern Aerosol Research and Characterization) sites (0.51). Therefore, our linear slope calculation method reproduces the sensitivity of OA to sulfate reported by the existing studies.
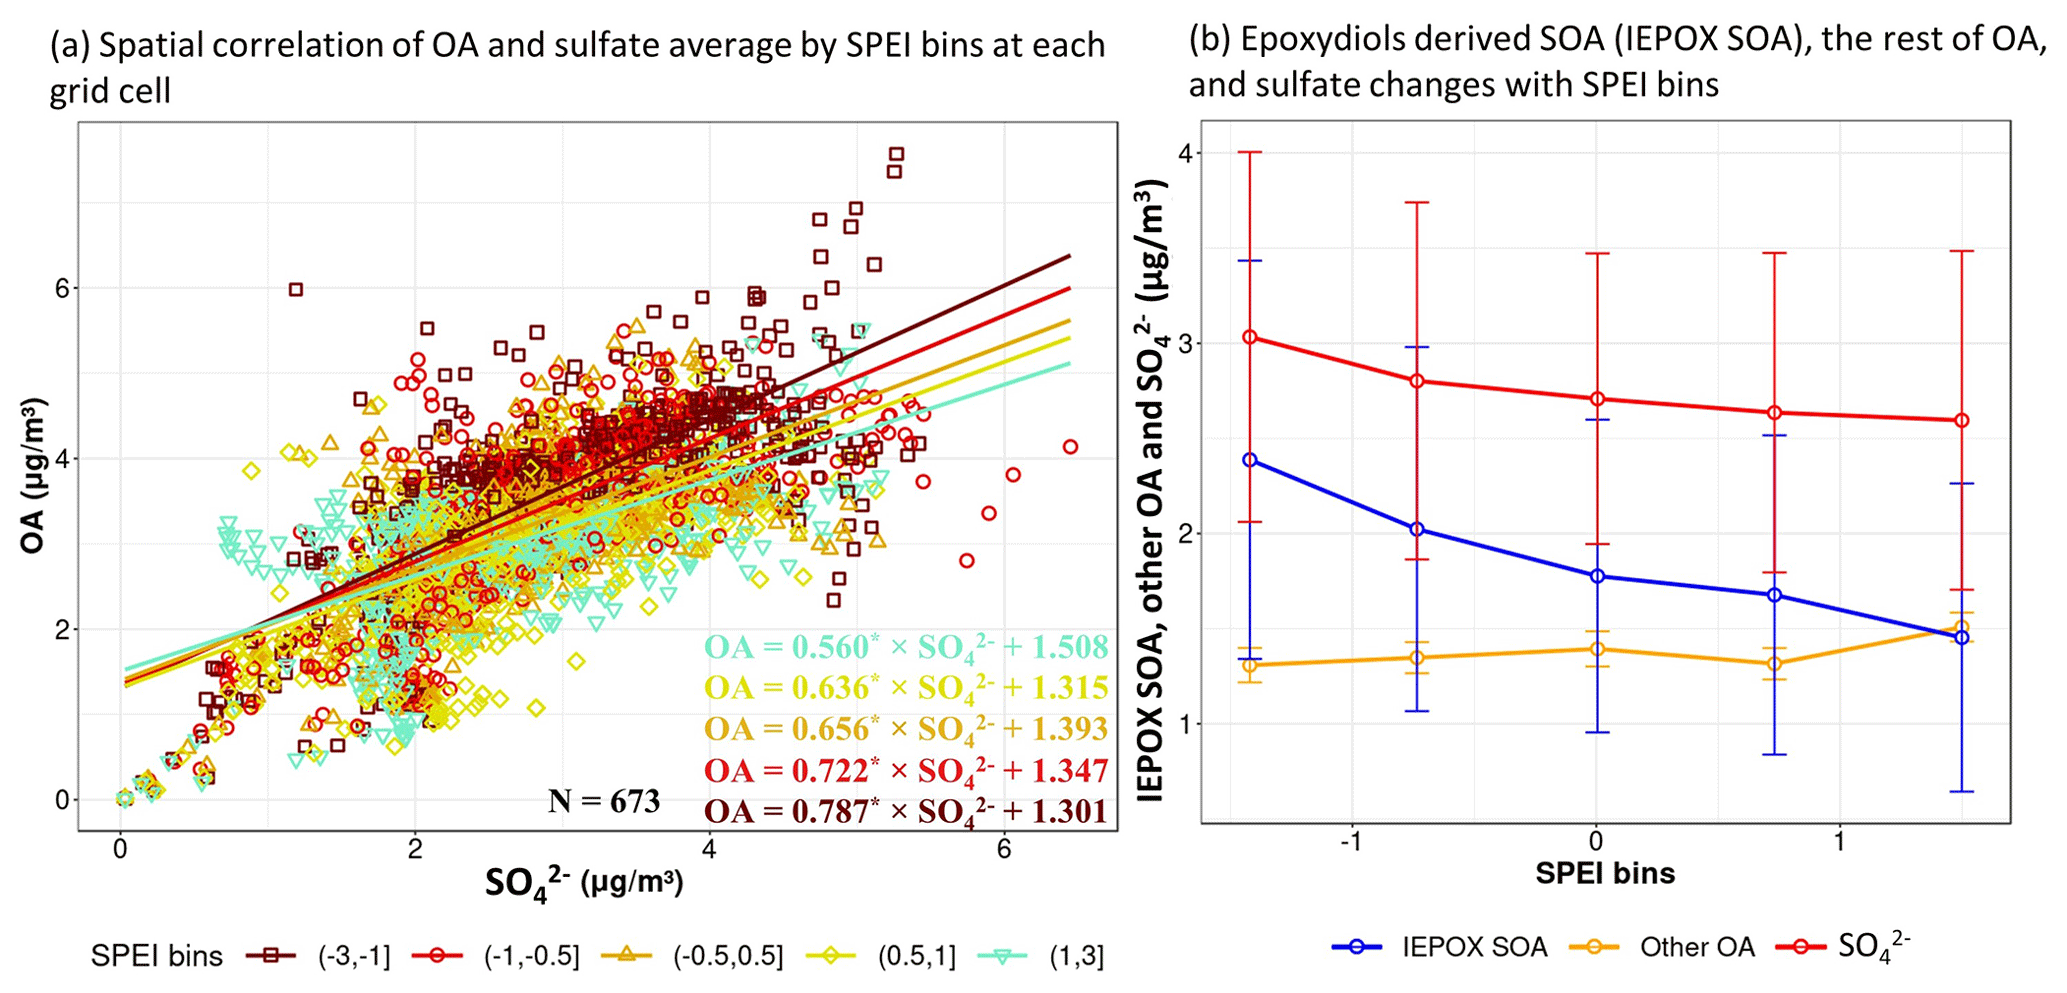
Figure 3(a) Scatter plot of the SPEI-bin-averaged sulfate and OA at each grid in the SEUS, with solid lines representing the linear regressions of OA and sulfate. The corresponding linear formula of each SPEI bin is listed in the bottom-right corner, with N indicating the number of data points for each regression calculation. The asterisks in the formula indicate the regression significance at a 95 % confidence level. (b) The epoxydiol-derived SOA (IEPOX SOA), other SOA, and sulfate changes with SPEI derived from the linear regressions in (a). Vertical bars indicate 1 standard deviation.
As SPEI changes from positive (non-drought) to negative (drought), the slope between OA and sulfate becomes increasingly higher, ranging from 0.56 to 0.79. This indicates more OA formations per unit increase in sulfate as drought severity intensifies. Although high correlations do not necessarily indicate causal relationships, the chemical mechanism of IEPOX SOA formation with the presence of sulfate is well documented (e.g., Shrivastava et al., 2017). The higher sensitivities of OA to sulfate under droughts can be explained by the increasingly higher isoprene concentrations, as shown in our previous studies in the SEUS (Li et al., 2022; Wang et al., 2022b), resulting in more IEPOX in the atmosphere to be further converted to the particle phase catalyzed by sulfate. In addition, the formation of monoterpene-derived organosulfates, a major component of IEPOX SOA, is also dependent on sulfate (D'Ambro et al., 2019), and the biogenic emissions of monoterpenes are likely to be intensified during droughts (Llusià et al., 2008; Wu et al., 2015). Organosulfates originated from anthropogenic precursors are also reported by some studies (Riva et al., 2015; Le Breton et al., 2018), but they are mainly found in highly polluted urban areas. We further reproduced Fig. 3a using detrended OA and sulfate data, which can remove the effects of anthropogenic emissions (Fig. S3b). A similar pattern of the gradually increasing slope from the wettest (slope = 0.18) to the driest (slope = 0.48) SPEI bin was found, which verifies that the stronger dependence of OA on sulfate under droughts is mainly caused by biogenic sources.
The intercept of the linear regression can be interpreted as other OA components that are not associated with sulfate-catalyzed IEPOX SOA, such as POA and anthropogenic SOA (Malm et al., 2017). Figure 3b shows that the intercepts (other OA) are stable among the five SPEI bins with a difference of less than 0.2 µg m−3 (15 %). The differences of regional mean OA minus the intercepts can then be regarded as IEPOX SOA related to sulfate. The resulting estimate of IEPOX SOA is 1.45, 1.68, 1.78, 2.02, and 2.39 µg m−3 for the five SPEI bins, ranging from wet to dry conditions. These values correspond to an increase of 0.30 µg m−3 IEPOX SOA per unit decrease in SPEI. Interestingly, there is also an increasingly higher sulfate level from wet to dry SPEI bins, with a mean value of 2.59, 2.63, 2.71, 2.80, and 3.03 µg m−3, respectively, corresponding to an overall increase rate of 0.14 µg m−3 sulfate per unit decrease in SPEI. Therefore, the increase in OA in the SEUS under droughts is largely caused by the boosted formation of BSOA due to the concurrent increase in VOC emissions and sulfate. This is consistent with the modeling case study by Zhao et al. (2019), who found that 98 % of the SOA increase during drought in the SEUS is of biogenic origin. It is noted that the approximation of IEPOX SOA here is the upper limit of BSOA since other processes that can lead to simultaneous changes in sulfate and OA, such as wildfire, are miscounted as BSOA in the calculation. Further analysis is needed to attribute the changes in SOA to different sources more accurately.
The source and sink of atmospheric sulfate are greatly affected by clouds and precipitation because most of the sulfate is formed in clouds and efficiently removed by wet scavenging (Barth et al., 2000; Rasch et al., 2000; Berg et al., 2015). Thus, it is understandable that sulfate is sensitive to drought considering both clouds and precipitation are significantly modulated under droughts. To further investigate the processes causing the increase in sulfate, we analyzed sulfate wet deposition, wet concentration, precipitation amount, and pH values (Fig. 4a–d) from the NADP network. There is a decreasing trend of sulfate wet deposition from 1.50 kg ha−1 per month at the wettest (SPEI > 1) to 0.87 kg ha−1 per month at the driest (SPEI < −1) level. The corresponding reduction in precipitation is 62 %. Since sulfate wet deposition is calculated using sulfate wet concentration weighted by precipitation, the 50 % decrease in sulfate wet deposition is driven by the reduced precipitation, which outweighs the increase in sulfate concentrations.
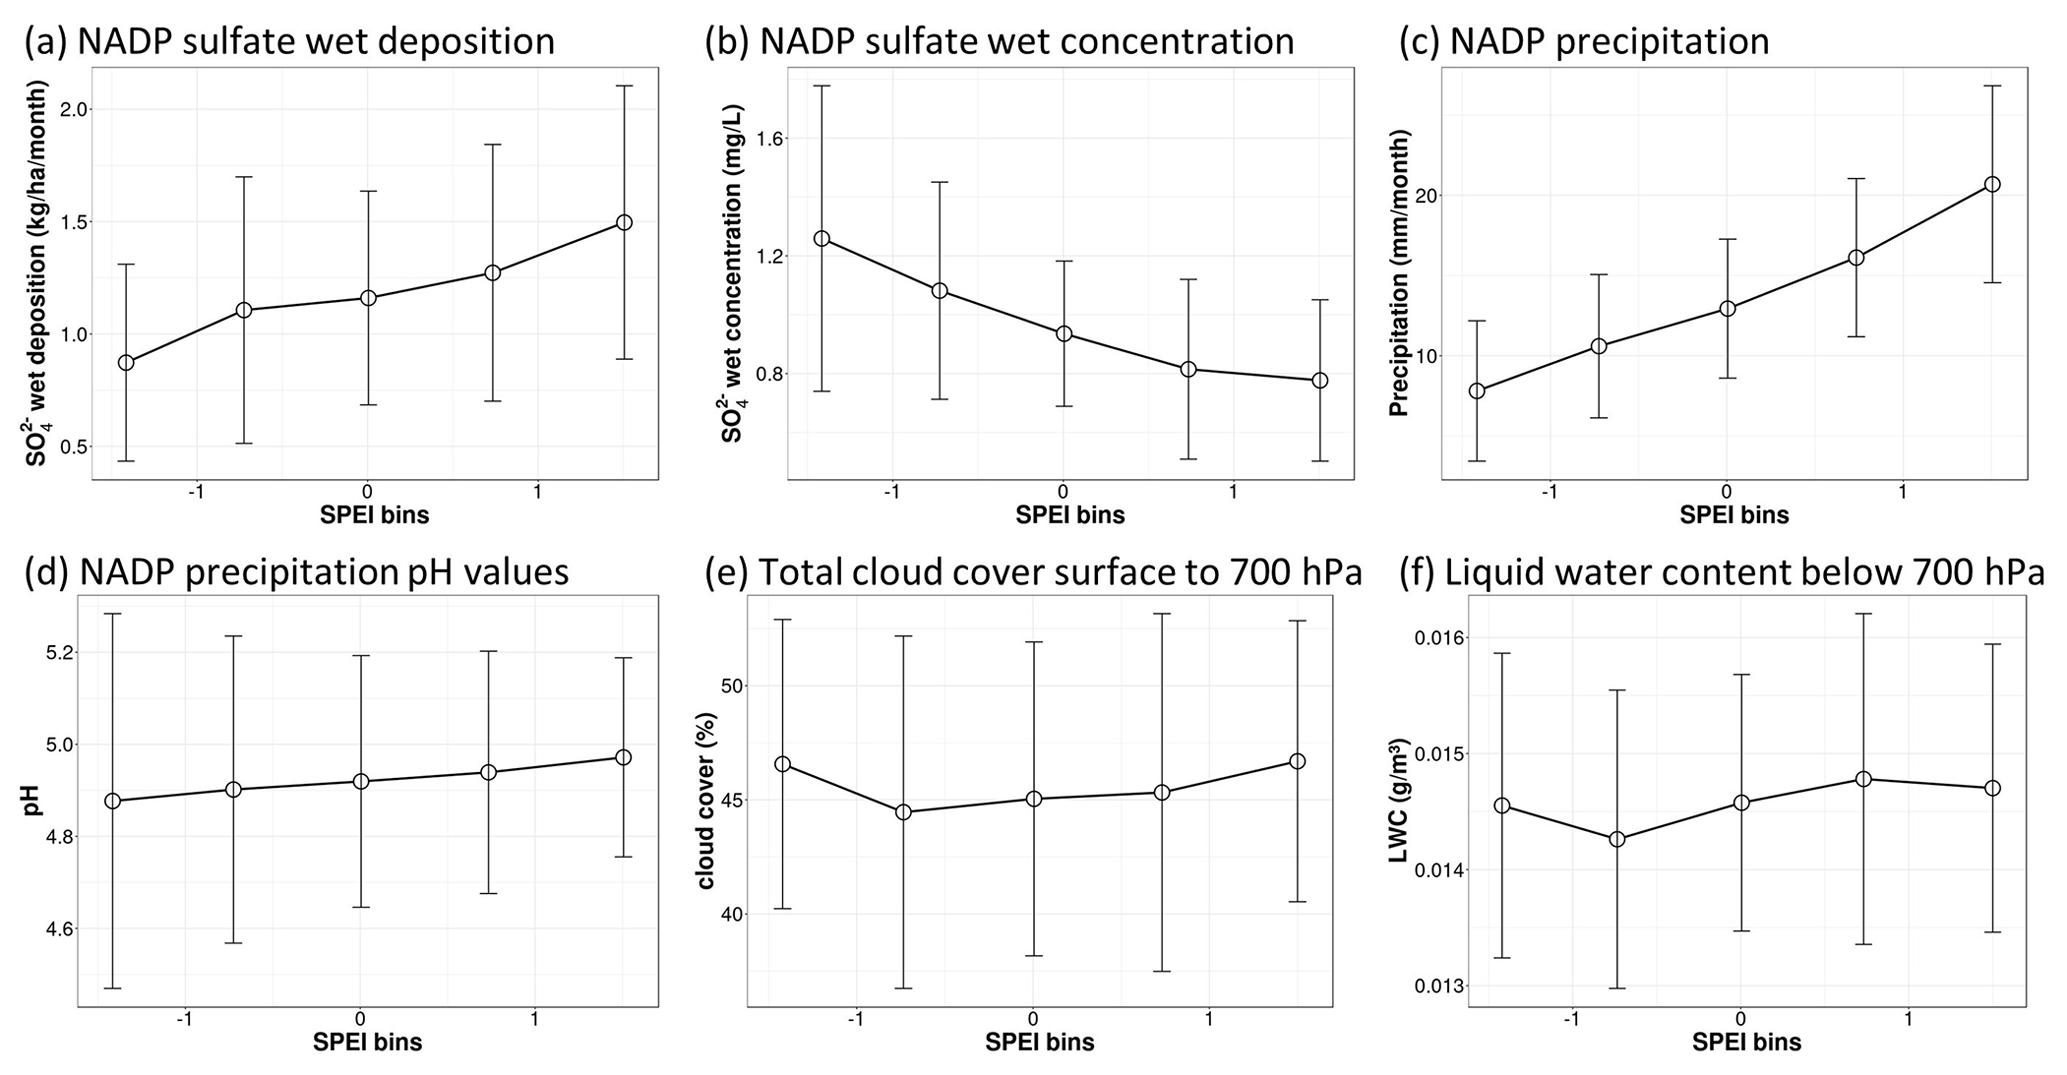
Figure 4SPEI-bin-averaged sulfate wet deposition (a), wet concentration (b), precipitation amount (c), and precipitation pH values (d) from the NADP network and the total cloud cover (e) and liquid water content (LWC; f) below 700 hPa from the MODIS satellite in the SEUS. Vertical bars indicate 1 standard deviation.
The low-level (below 700 hPa) cloud cover and liquid water content (LWC) are not highly sensitive to droughts, with less than 2 % and 4 % changes among the five SPEI bins, respectively (Fig. 4e–f). Thus, the increase in sulfate wet concentrations in precipitation is likely indicative of an enhanced formation of aqueous sulfate in the clouds, which then precipitates. Alternatively, gas-phase production of sulfate can also be elevated under droughts due to more sulfur dioxide (SO2) emissions (e.g., from increased electricity generation and fires) and higher temperatures (Tai et al., 2010; Wang et al., 2017) and then washed out by rainwater droplets, causing higher sulfate wet concentrations in precipitation. Both of these two pathways suggest that there is higher sulfate formation under droughts, which contributes to the enhanced sulfate besides reduced wet deposition. Furthermore, the mean pH value drops steadily with dryness levels from 4.98 to 4.87, which further intensifies the acid-catalyzed IEPOX ring opening and leads to faster BSOA formation (Surratt et al., 2010). Although the rate of IEPOX SOA formation is slower in cloud water compared to aerosol particles due to its relatively higher pH values (Gaston et al., 2014), the large liquid water content of clouds, which promotes dissolution, could lead to significant IEPOX SOA formation. Based on a box model simulation conducted by Tsui et al. (2019), increasing pH values in cloud water while keeping the other factors constant results in a slower rate of IEPOX SOA formation. Additionally, cloud water processing at pH ≤ 4 can produce more IEPOX SOA than aerosol particles. Despite the average pH value of ∼ 5 across the SEUS region, some sites may experience more acidic rainwater in drought months. During the study period, we found two sites in Georgia and North Carolina with pH values of less than 4, and their corresponding SPEI values are −0.98 and −1.39. Therefore, droughts are likely to reduce cloud pH values lower enough at some locations and favorable for significant IEPOX SOA formation.
Using the same approach as in the SEUS, we calculated the SPEI-bin-averaged OA and OA wildfire emissions from the GFED4 inventory in the PNW region shown in Fig. 5. OA fire emissions grow from 0.09 × 10⁷ g per month at the wettest level to 4.94 × 10⁷ g per month at the second driest level (SPEI between −1.5 and −1), followed by a small drop to 4.17 × 10⁷ g per month at the driest level (SPEI less than −1.5). This drop is likely caused by the reduction in the supply of fire fuel load under extreme drought conditions (Scasta et al., 2016). Overall, OA fire emissions increase by 1.44 × 10⁷ g per unit decrease in SPEI per month. The mass concentrations of OA resemble the changes in OA fire emissions, with an overall increase rate of 1.01 µg m−3 per unit decrease in SPEI, which indicates that more wildfire emissions are the major driver of the higher OA concentrations in the PNW.
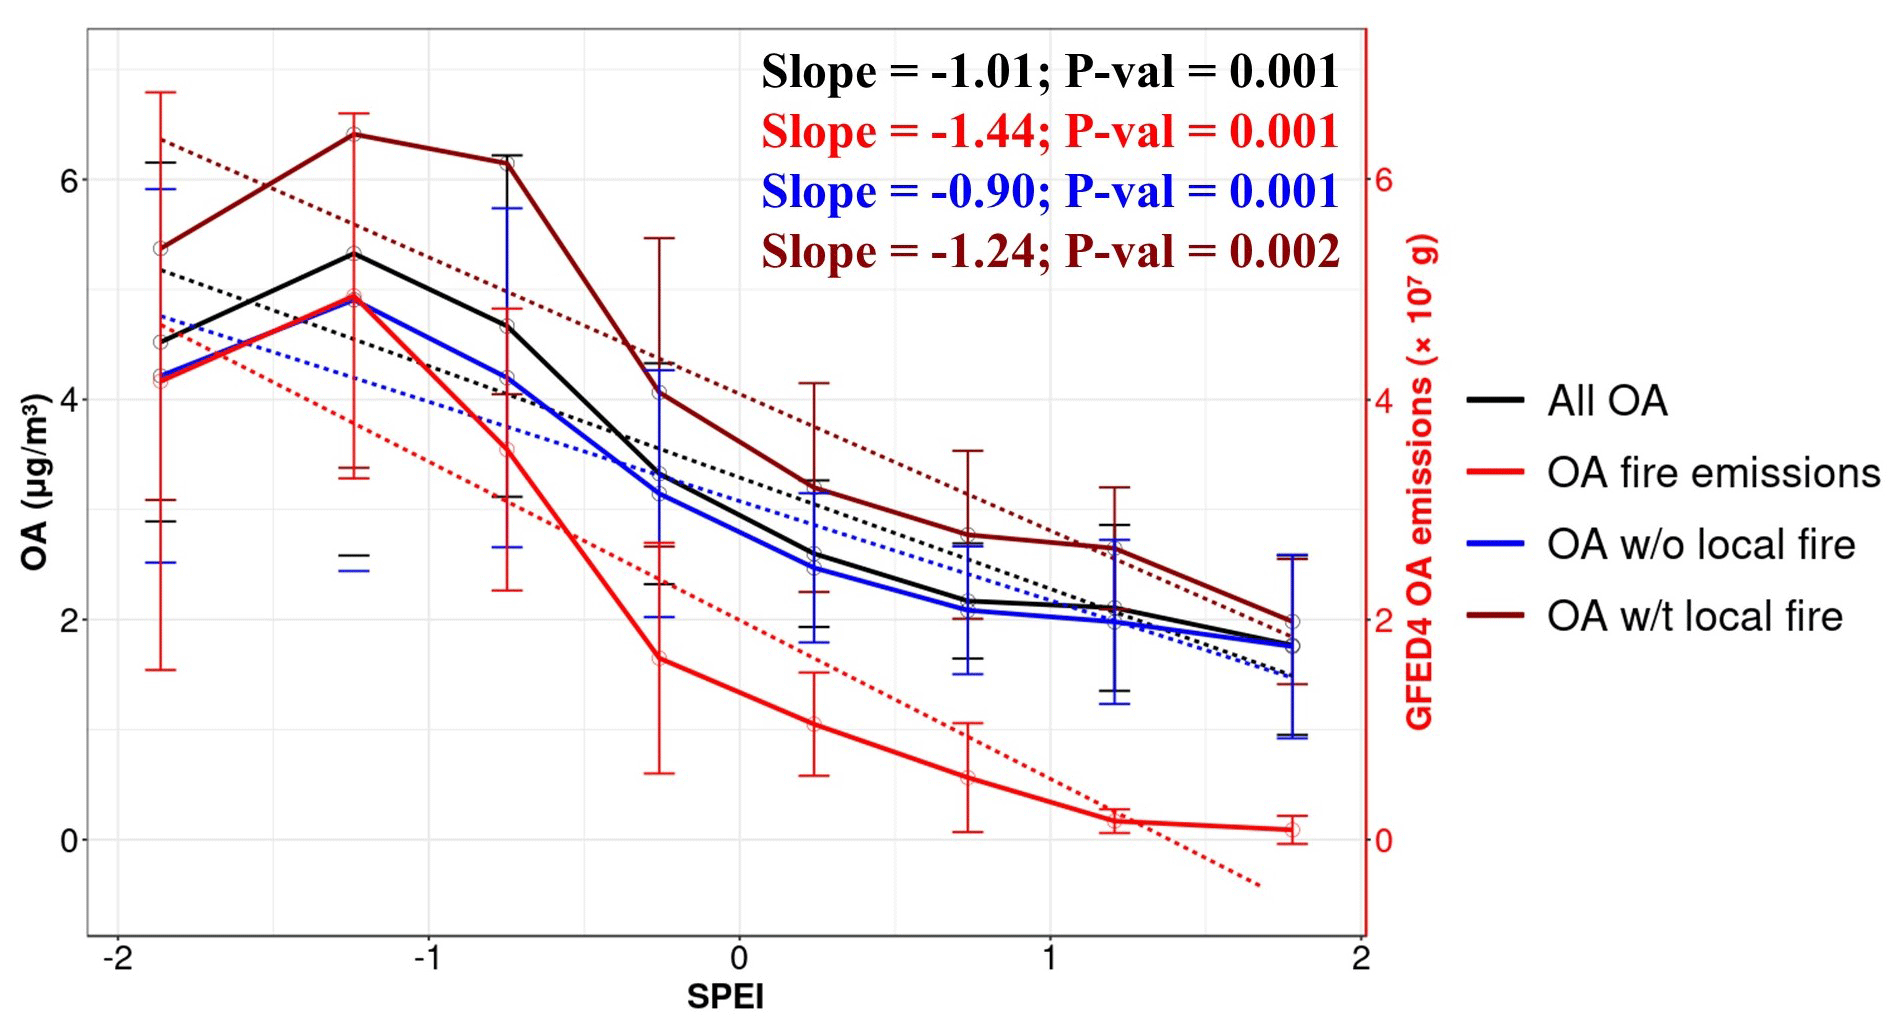
Figure 5Mean (point) and 1 standard deviation (vertical bar) of OA (black line), wildfire OA emissions from the GFED4 inventory (bright-red line; right axis), and OA with (dark-red line) and without (blue line) local fire occurrence within each SPEI bin. The dashed lines represent the linear regression with the slopes (Slope) and p values (P-val) of each variable listed in the top-right corner.
To better quantify the contributions of wildfire, we further separated OA values into those with local fire influences if OA fire emissions are greater than zero at each grid in each month and those without local fire influences if zero fire emissions are found. The time series of OA grouped by periods with and without wildfire emissions within each SPEI bin (Fig. S4) shows that the two groups have nearly identical temporal coverage, with data found in almost all years within most SPEI bins, which indicates that the separation does not cause temporal inconsistency. We admit that this separation relies on the accuracy of fire emissions and cannot rule out the effects of the long-range-transported OA from other regions, especially for the widespread drought events. As a result, it may overestimate OA values with no local fire occurrence. With this caveat in mind, we calculated the local fire effects as the difference between OA with and without fire emissions within each drought bin. Under the wettest conditions, there is a minor difference of 0.23 µg m−3 between OA with and without local fire effects, while this number becomes 4–8 times higher under droughts (SPEI < 0). The local fire-affected OA with one unit decrease in SPEI also increases by 0.34 µg m−3 faster than that without local fire occurrence. This illustrates the considerable contributions of local wildfire emissions to the changes in OA under droughts. Other processes, such as long-range-transported aged OA and locally produced BSOA, may also contribute to the differences if their contributions correlate with local fire emissions.
In summary, there is an increasing sensitivity of OA to sulfate as drought conditions worsen in the SEUS, driven by the heightened biogenic VOC emissions and the subsequent formation of IEPOX SOA. Sulfate levels also rise under droughts, influenced mainly by the reduced precipitation and the potentially increased aqueous and gas-phase sulfate production. In the PNW, OA and OA wildfire emissions exhibit a close correlation, indicating that wildfire emissions significantly drive higher OA concentrations therein.
3.3 CMIP6-model-simulated organic aerosol response to drought
In this section, we evaluated the surface OA concentrations from 10 CMPI6 models regarding their capability in predicting the observed SPEI–OA relationships over the CONUS during JJA 1998–2014. OA values from each model were interpolated linearly to match the spatial resolution of the gridded observational dataset. Figure 6a–j show the spatial distributions of the slopes between SPEI and OA simulated by each model. Compared with the observed slopes in Fig. 2a, all models capture the strong negative slopes of more than 2 µg m−3 per unit decrease in SPEI in the PNW region except for GFDL-ESM4, which shows a much smaller slope of less than 1 µg m−3 per SPEI. This indicates that the CMIP6 models correctly represent the sign and magnitude of the changes in OA fire emissions with droughts. By contrast, all the models have difficulties in reproducing the observed linear relationships between OA and SPEI in the SEUS. Compared to the significantly negative slope from observations, most of the models display insignificant or even positive slopes in the SEUS. BCC-ESM1, MRI-ESM2-0, and Nor-ESM2-LM show negative slopes only in part of the SEUS grids.
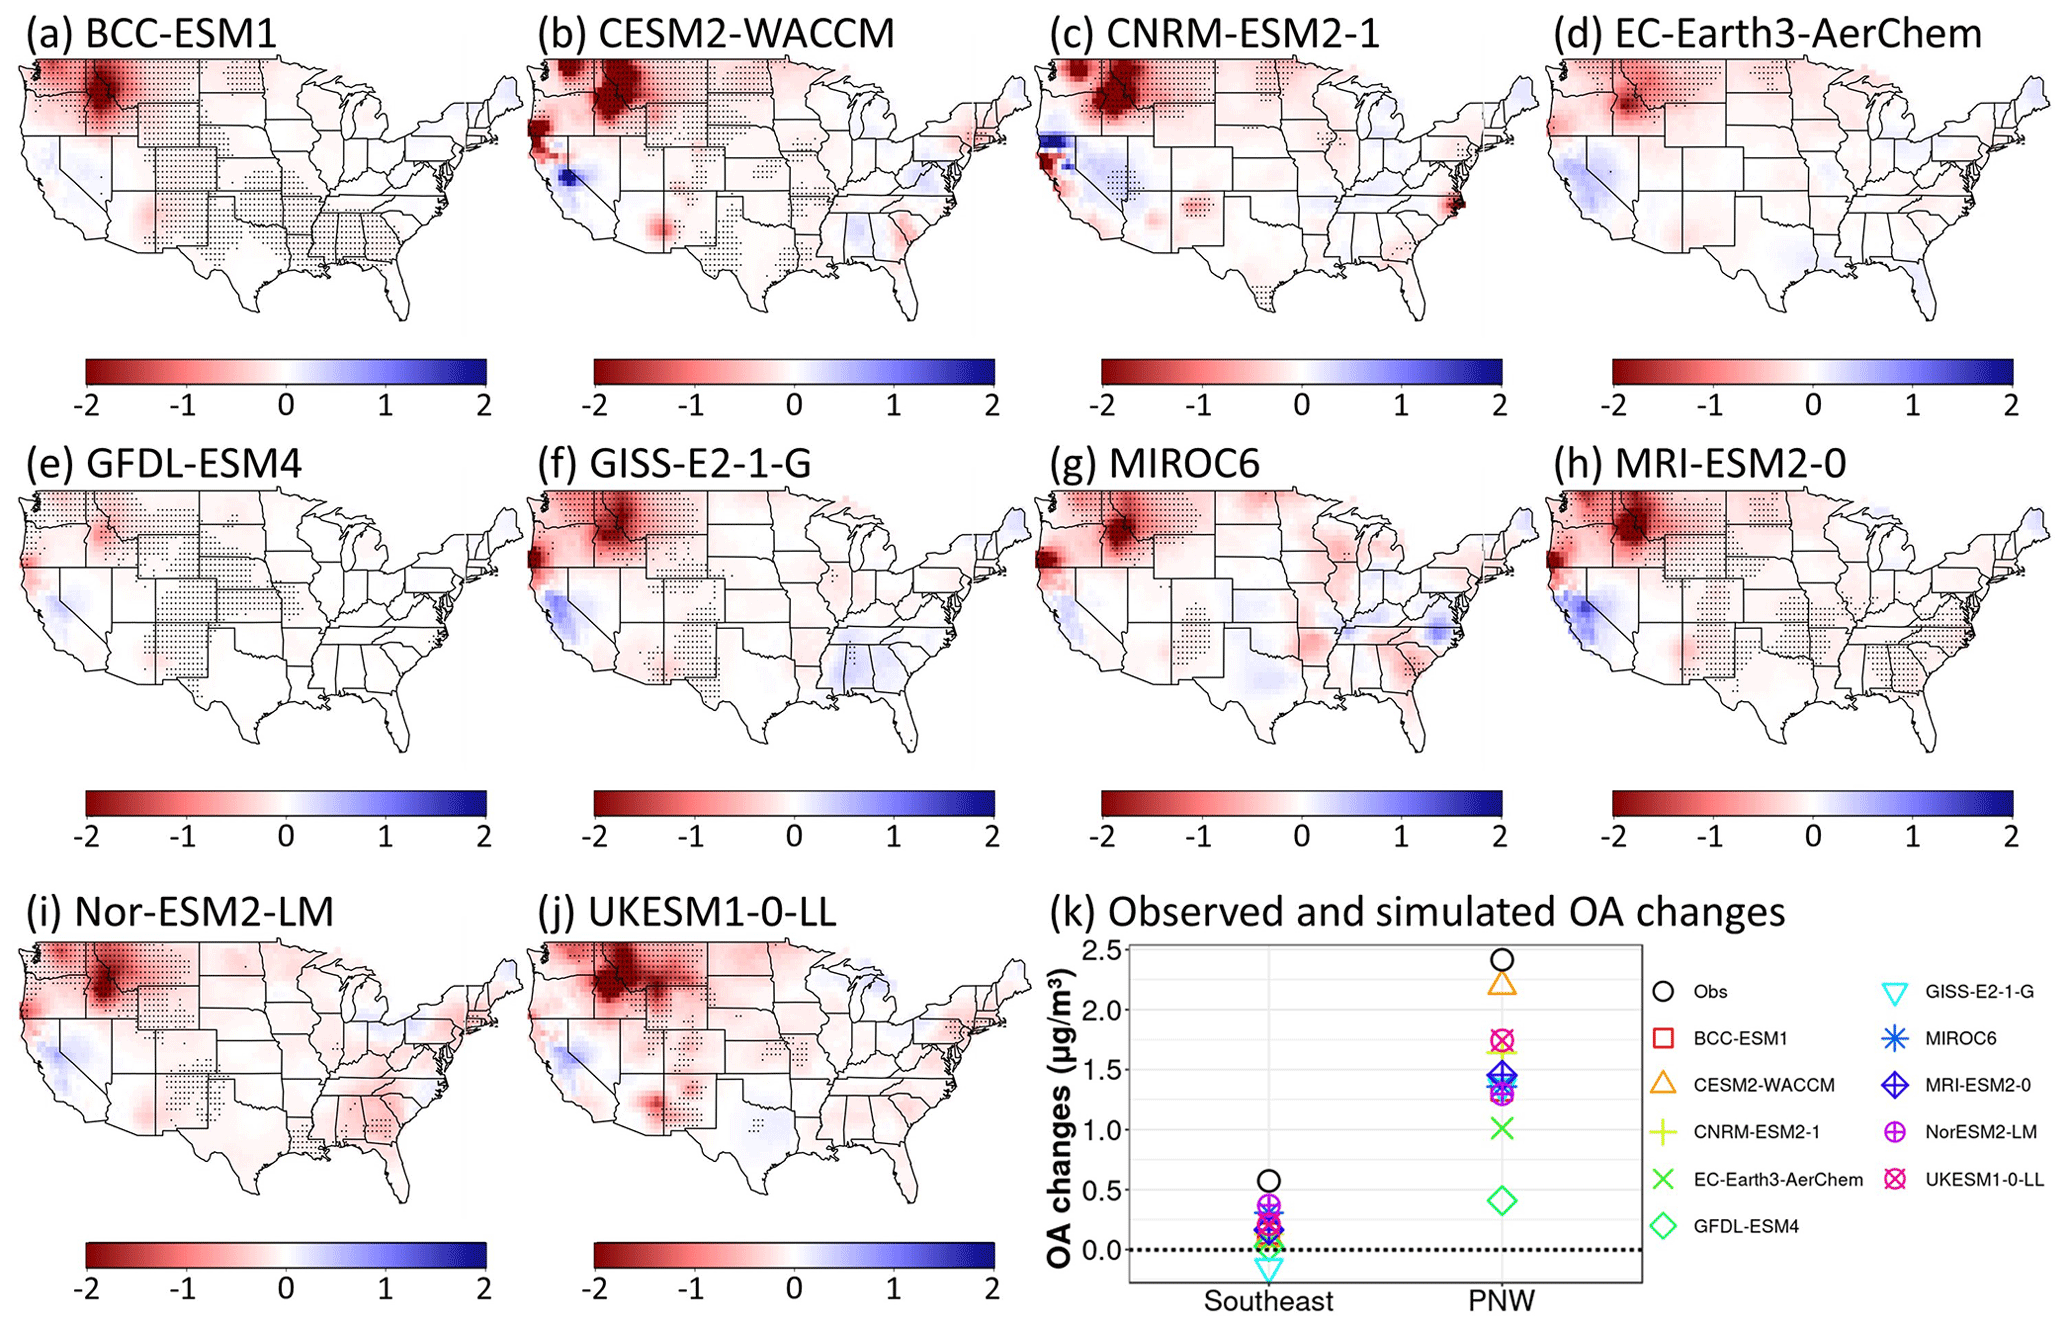
Figure 6(a–j) Slopes between CMIP6-model-simulated OA and SPEI from 1998 to 2014 during summertime, with black dots indicating p values less than 0.05. (k) Observed and simulated OA changes under severe droughts relative to non-drought conditions during the same study period in the PNW and SEUS regions.
We also evaluated model-predicted average OA enhancement under severe droughts relative to non-drought periods in the PNW and SEUS (Fig. 6k). In the PNW region, CESM2-WACCM simulates an increase in OA mass concentration by 2.20 µg m−3, closest to the observed value of 2.41 µg m−3, followed by UKESM1-0-LL and CNRM-ESM2-1 with an enhancement of 1.74 and 1.64 µg m−3, respectively. GFDL-ESM4 shows the highest underestimation of the OA enhancement by 2 µg m−3 (83 %), consistent with its smallest slopes shown in Fig. 6e. Smaller underestimations are found in other models, ranging from 0.96 µg m−3 (40 %) for MRI-ESM2-0 to 1.4 µg m−3 (58 %) for EC-Earth3-AerChem. In the SEUS, all the 10 models underpredict the observed OA increase of 0.57 µg m−3, with the two lowest underestimations of 0.21 µg m−3 (37 %) and 0.27 µg m−3 (47 %) found for Nor-ESM2-LM and MIRCO6, respectively. The other eight models show marginal OA enhancements between 0.02 to 0.21 µg m−3 or even a decrease (GISS-E2-1-G), indicating the incapabilities of these models in predicting OA changes in the SEUS under droughts.
The poor model performance in capturing the OA changes under severe drought in the SEUS inspires us to conduct a further regional analysis following Sect. 3.2. The observed and simulated changes in SEUS-mean OA, sulfate, and their slopes within each SPEI bin are shown in Fig. 7a–c, respectively. The modeled slopes are calculated in the same way as observations (Fig. 3a), and the associated scatter plot is shown in Fig. S5. For the absolute OA mass concentrations, UKESM1-0-LL has the best predictions, with a mean bias of less than 0.5 µg m−3 in each SPEI bin. CESM2-WACCM, CNRM-ESM2-1, EC-Earth3-AerChem, MICRO6, and NorESM2-LM overestimate OA values, while the other four models show an underestimation. For the sensitivity of OA to droughts, NorESM2-LM performs the best, with an increase rate of 0.13 µg m−3 per unit decrease in SPEI, although the rate is only 50 % of the observed value of 0.25 µg m−3. This is consistent with the result that this model has the lowest underestimation of OA enhancement under severe droughts. Higher underestimations of the OA sensitivity to droughts are found in MRI-ESM2-0, BCC-ESM1, and GFDL-ESM4, with a respective change rate of 0.09, 0.06, and 0.02 µg m−3 per SPEI. Conversely, GISS-E2-1-G simulates a decrease in OA by 0.04 µg m−3 per unit decrease in SPEI, which is consistent with the negative OA changes under severe droughts. The rest of the models do not have a statistically significant change rate of OA with droughts at a 95 % confidence level.
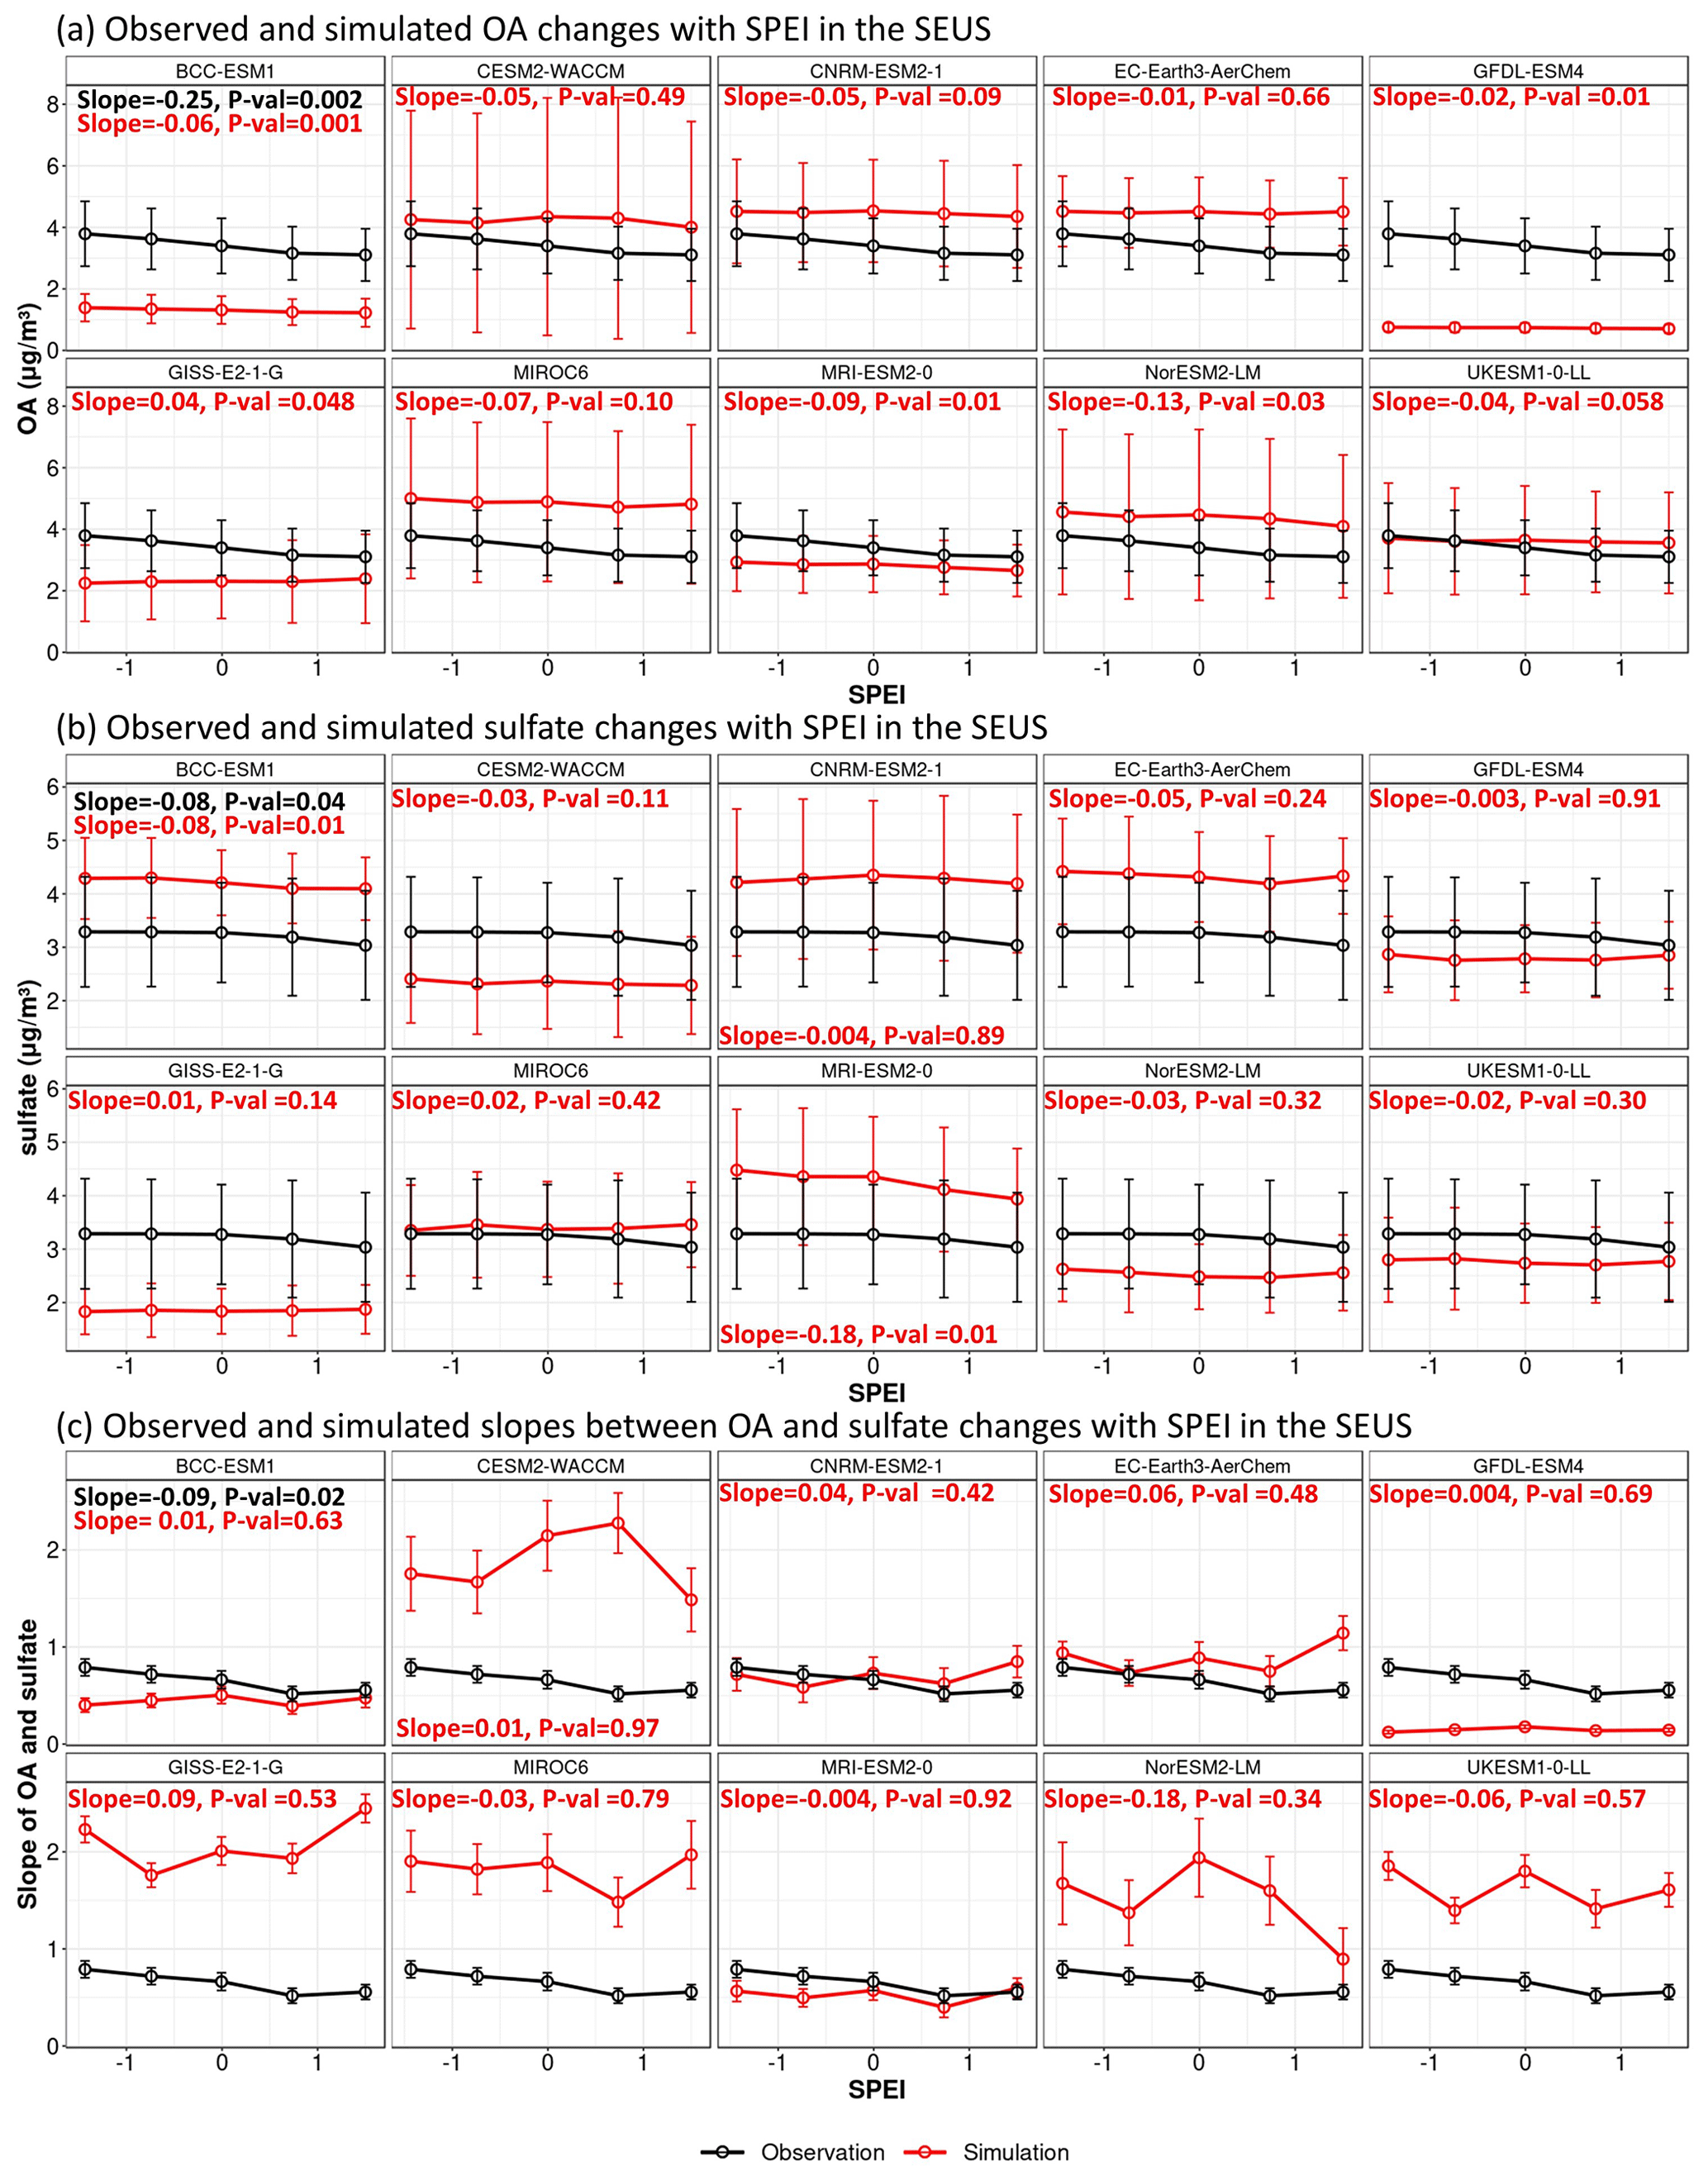
Figure 7SPEI-bin-averaged values of OA (a), sulfate (b), and slopes of OA and sulfate (c) from observations (black lines) and simulations (red lines) in the SEUS. Vertical bars indicate 1 standard deviation. The numbers in each subplot indicate the slopes (Slope) and p values (P-val) of the linear regression between each variable and SPEI.
As described in Fig. 3, the increase in OA under droughts in the SEUS is due to the concurrent increase in sulfate and biogenic VOC emissions. To investigate if the models have this mechanism, we also evaluated the modeled sensitivities of sulfate and the OA-sulfate slopes to SPEI. Only two models, BCC-ESM1 and MRI-ESM2-0, have statistically significant increase rates of sulfate with the decrease in SPEI, despite their overestimation of ∼ 1 µg m−3 (30 %) in terms of the absolute sulfate concentrations. BCC-ESM1 predicts the same change rate as observations with a value of 0.08 µg m−3 per unit change of SPEI, while MRI-ESM2-0 predicts a rate of 0.18 µg m−3, more than double the observed rate. For the slopes between OA and sulfate, however, all models cannot reproduce the observed increase rate of 0.09 per unit decrease in SPEI. This suggests either an insensitivity of biogenic VOC emissions in response to droughts or a lack of explicit aqueous chemistry for SOA formation in the models. For a further investigation, we summarized how SOA is treated in each model (Table S1). In fact, SOA schemes in the 10 CMIP6 models are simplified to reduce computational cost as the climate models need to perform hundreds of years of simulations with many ensemble members (Eyring et al., 2016). BCC-ESM1 and CESM2-WACCM use a volatility basis set (VBS) approach that categorizes VOCs based on their volatility and simulates the chemical aging process that leads to the formation of SOA. In CNRM-ESM2-1, SOA is prescribed from a monthly inventory without inline calculation. EC-Earth3-AerChem, GISS-E2-1-G, and MIROC6 include the two-product scheme, in which VOC oxidation leads to non-volatile and semi-volatile products. The rest of the models assume a fixed percentage of yield from the emissions of VOCs. In short, the heterogeneous formation of IEPOX SOA through reactive uptake on aqueous sulfate is not parameterized in the models. Therefore, the linear relationship between OA and sulfate in the models is not indicative of the mechanistic dependence of OA on sulfate as demonstrated in observations. Similar anthropogenic sources (e.g., fossil fuel combustion) and photochemical oxidants (e.g., O3 and OH) leading to the simultaneous production of sulfate and OA can also result in positive correlations (Zhang et al., 2011). The lack of the IEPOX SOA formation mechanism further explains why the enhancements of OA in the SEUS are barely captured by these models.
To sum up, most of the models can represent the linear relationships between OA and SPEI in the PNW region, with CESM2-WACCM and GFDL-ESM4 performing the best and worst in predicting the OA enhancement under severe droughts. However, all the models face challenges in capturing the OA increases under droughts in the SEUS, with Nor-ESM2-LM and MIRCO6 showing relatively better performance indicated by their lower underestimation of OA enhancement. These challenges are mainly caused by the lack of parameterizations of the aqueous formation of IEPOX SOA and the model deficiencies in capturing the increase pattern of sulfate as drought intensifies.
In this study, the changes in organic aerosol (OA) in response to drought in the CONUS were examined. We first displayed the spatial patterns of OA under non-drought and severe drought conditions and found most of the CONUS experiences an abnormally higher level of OA by an average of 0.72 µg m−3 relative to wet and normal conditions. Regionally, the highest average increase occurs in the PNW and SEUS areas by 1.79 µg m−3 (112 %) and 0.92 µg m−3 (33 %), respectively. The concurrent enhancement of wildfire OA emissions in the PNW and sulfate in the SEUS provides more insights into an in-depth investigation over these two regions.
In the SEUS, a linear regression between OA and sulfate was applied to estimate the amount of IEPOX SOA and other OA. Although a similar method has also been used by other studies (e.g., Malm et al., 2017), it is necessary to be aware of its limitations that the approximation of IEPOX SOA is the upper limit of BSOA since other processes that can lead to simultaneous changes in sulfate and OA are miscounted as BSOA in the calculation. Results from this simplified method indicate that the IEPOX SOA drives the increase in total OA from wet to dry conditions, while other OA stays stable. The increase in both biogenic VOC emissions and sulfate under droughts leads to the enhancement of IEPOX SOA. Data from the NADP network show that up to 62 % lower precipitation under droughts induces slower sulfate wet deposition rates and thus leaves more sulfate in the atmosphere. Higher sulfate wet concentration in the precipitation indicates more in-cloud and/or gas-phase sulfate production under droughts since cloud cover and liquid content do not show a strong sensitivity to droughts.
In the PNW, there is an overall increase of 1.44 × 10⁷ g in the monthly OA wildfire emissions per unit decrease in SPEI, which is the main driver of the elevated OA. There is a plateau of the OA fire emissions, with SPEI between −1.5 and −1, followed by a drop with SPEI less than −1.5. This implies that wildfire activities are not linearly related to moisture and are also limited by the availability of fuel load. Dividing OA into groups with or without local fire influence, we found that local fire events can increase the OA concentrations by 4–8 times relative to those without fire activities. Future work is needed to further investigate the changes in OA from other sources, such as long-range-transported OA and BSOA, in this region.
The evaluation of surface OA concentrations from 10 CMIP6 models provides valuable insights into their predictive capabilities in capturing the observed relationships between SPEI and OA over the CONUS. All the models are found to successfully capture the negative slopes in the PNW area, indicating correct sensitivities of OA wildfire emissions to droughts in these models. However, deficiencies are revealed in the SEUS, with most models displaying insignificant or positive slopes between OA and SPEI as opposed to significantly negative slopes from observations. The assessment of average OA enhancement during severe droughts relative to non-drought periods further underscores the models' varying degrees of accuracy in simulating OA response to drought. In the PNW, CESM2-WACCM stands out, with its simulated OA increase of 2.20 µg m−3 being closest to the observed value of 2.41 µg m−3, while GFDL-ESM4 exhibits the highest underestimation of OA enhancement by 2 µg m−3 (83 %). In the SEUS, all models consistently underpredict the observed OA increases, highlighting their limitations in predicting OA changes in this region under drought conditions. These limitations can be mainly attributed to the insensitivities of sulfate to SPEI and the model deficiencies in the parameterization of the IEPOX SOA dependence on inorganic sulfate.
This study reveals the key drivers of the enhanced OA mass concentrations in the CONUS, including higher wildfire emissions and the simultaneous increase in biogenic VOC emissions and inorganic sulfate, which highlights the complex physical and chemical processes involved in the aerosol composition changes under droughts. The discrepancies in simulating OA enhancements during severe droughts underscore the need for ongoing model improvement, particularly in accurately representing the emissions of biogenic isoprene and monoterpene, the life cycle of sulfate, and their intricate interactions. Addressing these limitations will be crucial for enhancing the reliability of climate models and their ability to predict the impact of future droughts on atmospheric composition and air quality in the CONUS.
Monthly SPEI data are obtained from https://spei.csic.es/spei_database_2_6 (Vicente-Serrano et al., 2010). Observations from the IMPROVE and NADP network are downloaded from https://views.cira.colostate.edu/fed/QueryWizard/ (FED, 2023). GFED4 wildfire emission inventory and MODIS satellite cloud cover data are archived at https://www.geo.vu.nl/~gwerf/GFED/GFED4/ (Giglio et al., 2013) and https://doi.org/10.5067/TERRA/CERES/SSF1DEGMONTH_L3.004A (NASA, 2015), respectively. The CMIP6 model outputs are publicly available online from the Earth System Federation Grid nodes.
The supplement related to this article is available online at: https://doi.org/10.5194/acp-24-9339-2024-supplement.
YW conceived the research idea. WL conducted the analysis. Both authors contributed to the preparation of the manuscript.
The contact author has declared that neither of the authors has any competing interests.
Publisher’s note: Copernicus Publications remains neutral with regard to jurisdictional claims made in the text, published maps, institutional affiliations, or any other geographical representation in this paper. While Copernicus Publications makes every effort to include appropriate place names, the final responsibility lies with the authors.
The authors acknowledge researchers from the IMPROVE and NADP networks for making surface aerosol mass and deposition observations. We thank individuals and groups from the Climatology and Climate Services Laboratory for creating the SPEI dataset. The authors also thank the modeling groups participating in the CMIP6 AerChemMIP project for making the surface aerosol species outputs available.
This research has been supported by the National Oceanic and Atmospheric Administration through the Atmospheric Chemistry, Carbon Cycle and Climate (AC4) program (grant no. NA19OAR4310177).
This paper was edited by Yun Qian and reviewed by two anonymous referees.
Barth, M. C., Rasch, P. J., Kiehl, J. T., Benkovitz, C. M., and Schwartz, S. E.: Sulfur chemistry in the National Center for Atmospheric Research Community Climate Model: Description, evaluation, features, and sensitivity to aqueous chemistry, J. Geophys. Res.-Atmos., 105, 1387–1415, https://doi.org/10.1029/1999JD900773, 2000.
Berg, L. K., Shrivastava, M., Easter, R. C., Fast, J. D., Chapman, E. G., Liu, Y., and Ferrare, R. A.: A new WRF-Chem treatment for studying regional-scale impacts of cloud processes on aerosol and trace gases in parameterized cumuli, Geosci. Model Dev., 8, 409–429, https://doi.org/10.5194/gmd-8-409-2015, 2015.
Borlina, C. S. and Rennó, N. O.: The impact of a severe drought on dust lifting in California's Owens Lake area, Sci. Rep., 7, 1784, https://doi.org/10.1038/s41598-017-01829-7, 2017.
Brégonzio-Rozier, L., Giorio, C., Siekmann, F., Pangui, E., Morales, S. B., Temime-Roussel, B., Gratien, A., Michoud, V., Cazaunau, M., DeWitt, H. L., Tapparo, A., Monod, A., and Doussin, J.-F.: Secondary organic aerosol formation from isoprene photooxidation during cloud condensation–evaporation cycles, Atmos. Chem. Phys., 16, 1747–1760, https://doi.org/10.5194/acp-16-1747-2016, 2016.
Brilli, F., Barta, C., Fortunati, A., Lerdau, M., Loreto, F., and Centritto, M.: Response of isoprene emission and carbon metabolism to drought in white poplar (Populus alba) saplings, New Phytol., 175, 244–254, https://doi.org/10.1111/j.1469-8137.2007.02094.x, 2007.
Carslaw, K. S., Lee, L. A., Reddington, C. L., Pringle, K. J., Rap, A., Forster, P. M., Mann, G. W., Spracklen, D. V., Woodhouse, M. T., Regayre, L. A., and Pierce, J. R.: Large contribution of natural aerosols to uncertainty in indirect forcing, Nature, 503, 67–71, https://doi.org/10.1038/nature12674, 2013.
Cook, B. I., Mankin, J. S., and Anchukaitis, K. J.: Climate change and drought: From past to future, Curr. Clim. Change Rep., 4, 164–179, https://doi.org/10.1007/s40641-018-0093-2, 2018.
D'Ambro, E. L., Schobesberger, S., Gaston, C. J., Lopez-Hilfiker, F. D., Lee, B. H., Liu, J., Zelenyuk, A., Bell, D., Cappa, C. D., Helgestad, T., Li, Z., Guenther, A., Wang, J., Wise, M., Caylor, R., Surratt, J. D., Riedel, T., Hyttinen, N., Salo, V.-T., Hasan, G., Kurtén, T., Shilling, J. E., and Thornton, J. A.: Chamber-based insights into the factors controlling epoxydiol (IEPOX) secondary organic aerosol (SOA) yield, composition, and volatility, Atmos. Chem. Phys., 19, 11253–11265, https://doi.org/10.5194/acp-19-11253-2019, 2019.
Danabasoglu, G., Lamarque, J.-F., Bacmeister, J., Bailey, D. A., DuVivier, A. K., Edwards, J., Emmons, L. K., Fasullo, J., Garcia, R., Gettelman, A., Hannay, C., Holland, M. M., Large, W. G., Lauritzen, P. H., Lawrence, D. M., Lenaerts, J. T. M., Lindsay, K., Lipscomb, W. H., Mills, M. J., Neale, R., Oleson, K. W., Otto-Bliesner, B., Phillips, A. S., Sacks, W., Tilmes, S., van Kampenhout, L., Vertenstein, M., Bertini, A., Dennis, J., Deser, C., Fischer, C., Fox-Kemper, B., Kay, J. E., Kinnison, D., Kushner, P. J., Larson, V. E., Long, M. C., Mickelson, S., Moore, J. K., Nienhouse, E., Polvani, L., Rasch, P. J., and Strand, W. G.: The Community Earth System Model Version 2 (CESM2), J. Adv. Model. Earth Sy., 12, e2019MS001916, https://doi.org/10.1029/2019MS001916, 2020.
Dawson, J. P., Adams, P. J., and Pandis, S. N.: Sensitivity of PM2.5 to climate in the Eastern US: a modeling case study, Atmos. Chem. Phys., 7, 4295–4309, https://doi.org/10.5194/acp-7-4295-2007, 2007.
Dennison, P. E., Brewer, S. C., Arnold, J. D., and Moritz, M. A.: Large wildfire trends in the western United States, 1984–2011, Geophys. Res. Lett., 41, 2928–2933, https://doi.org/10.1002/2014GL059576, 2014.
Dunne, J. P., Horowitz, L. W., Adcroft, A. J., Ginoux, P., Held, I. M., John, J. G., Krasting, J. P., Malyshev, S., Naik, V., Paulot, F., Shevliakova, E., Stock, C. A., Zadeh, N., Balaji, V., Blanton, C., Dunne, K. A., Dupuis, C., Durachta, J., Dussin, R., Gauthier, P. P. G., Griffies, S. M., Guo, H., Hallberg, R. W., Harrison, M., He, J., Hurlin, W., McHugh, C., Menzel, R., Milly, P. C. D., Nikonov, S., Paynter, D. J., Ploshay, J., Radhakrishnan, A., Rand, K., Reichl, B. G., Robinson, T., Schwarzkopf, D. M., Sentman, L. T., Underwood, S., Vahlenkamp, H., Winton, M., Wittenberg, A. T., Wyman, B., Zeng, Y., and Zhao, M.: The GFDL Earth System Model Version 4.1 (GFDL-ESM 4.1): Overall Coupled Model Description and Simulation Characteristics, J. Adv. Model. Earth Sy., 12, e2019MS002015, https://doi.org/10.1029/2019MS002015, 2020.
Eyring, V., Bony, S., Meehl, G. A., Senior, C. A., Stevens, B., Stouffer, R. J., and Taylor, K. E.: Overview of the Coupled Model Intercomparison Project Phase 6 (CMIP6) experimental design and organization, Geosci. Model Dev., 9, 1937–1958, https://doi.org/10.5194/gmd-9-1937-2016, 2016.
Fang, Y., Fiore, A. M., Horowitz, L. W., Gnanadesikan, A., Held, I., Chen, G., Vecchi, G., and Levy, H.: The impacts of changing transport and precipitation on pollutant distributions in a future climate, J. Geophys. Res.-Atmos., 116, D18303, https://doi.org/10.1029/2011JD015642, 2011.
FED: The Federal Land Manager Environmental Database query wizard, FED, https://views.cira.colostate.edu/fed/QueryWizard/ (last access: 27 December 2023), 2023.
Ford, T. and Labosier, C. F.: Spatial patterns of drought persistence in the Southeastern United States, Int. J. Climatol., 34, 2229–2240, 2014.
Gaston, C. J., Riedel, T. P., Zhang, Z., Gold, A., Surratt, J. D., and Thornton, J. A.: Reactive Uptake of an Isoprene-Derived Epoxydiol to Submicron Aerosol Particles, Environ. Sci. Technol., 48, 11178–11186, https://doi.org/10.1021/es5034266, 2014.
Giglio, L., Randerson, J. T., and van der Werf, G. R.: Analysis of daily, monthly, and annual burned area using the fourth-generation global fire emissions database (GFED4), J. Geophys. Res.-Biogeo., 118, 317–328, https://doi.org/10.1002/jgrg.20042, 2013 (data available at: https://www.geo.vu.nl/~gwerf/GFED/GFED4/, last access: 21 August 2024).
Gilman, J. B., Lerner, B. M., Kuster, W. C., Goldan, P. D., Warneke, C., Veres, P. R., Roberts, J. M., de Gouw, J. A., Burling, I. R., and Yokelson, R. J.: Biomass burning emissions and potential air quality impacts of volatile organic compounds and other trace gases from fuels common in the US, Atmos. Chem. Phys., 15, 13915–13938, https://doi.org/10.5194/acp-15-13915-2015, 2015.
Gomez, J., Allen, R. J., Turnock, S. T., Horowitz, L. W., Tsigaridis, K., Bauer, S. E., Olivié, D., Thomson, E. S., and Ginoux, P.: The projected future degradation in air quality is caused by more abundant natural aerosols in a warmer world, Commun. Earth Environ., 4, 1–11, https://doi.org/10.1038/s43247-023-00688-7, 2023.
Gorham, K. A., Raffuse, S. M., Hyslop, N. P., and White, W. H.: Comparison of recent speciated PM2.5 data from collocated CSN and IMPROVE measurements, Atmos. Environ., 244, 117977, https://doi.org/10.1016/j.atmosenv.2020.117977, 2021.
Hallquist, M., Wenger, J. C., Baltensperger, U., Rudich, Y., Simpson, D., Claeys, M., Dommen, J., Donahue, N. M., George, C., Goldstein, A. H., Hamilton, J. F., Herrmann, H., Hoffmann, T., Iinuma, Y., Jang, M., Jenkin, M. E., Jimenez, J. L., Kiendler-Scharr, A., Maenhaut, W., McFiggans, G., Mentel, Th. F., Monod, A., Prévôt, A. S. H., Seinfeld, J. H., Surratt, J. D., Szmigielski, R., and Wildt, J.: The formation, properties and impact of secondary organic aerosol: current and emerging issues, Atmos. Chem. Phys., 9, 5155–5236, https://doi.org/10.5194/acp-9-5155-2009, 2009.
Hand, J. L., Schichtel, B. A., Pitchford, M., Malm, W. C., and Frank, N. H.: Seasonal composition of remote and urban fine particulate matter in the United States, J. Geophys. Res.-Atmos., 117, D05209, https://doi.org/10.1029/2011JD017122, 2012.
Hidy, G. M., Blanchard, C. L., Baumann, K., Edgerton, E., Tanenbaum, S., Shaw, S., Knipping, E., Tombach, I., Jansen, J., and Walters, J.: Chemical climatology of the southeastern United States, 1999–2013, Atmos. Chem. Phys., 14, 11893–11914, https://doi.org/10.5194/acp-14-11893-2014, 2014.
Jen, C. N., Hatch, L. E., Selimovic, V., Yokelson, R. J., Weber, R., Fernandez, A. E., Kreisberg, N. M., Barsanti, K. C., and Goldstein, A. H.: Speciated and total emission factors of particulate organics from burning western US wildland fuels and their dependence on combustion efficiency, Atmos. Chem. Phys., 19, 1013–1026, https://doi.org/10.5194/acp-19-1013-2019, 2019.
Kelley, M., Schmidt, G. A., Nazarenko, L. S., Bauer, S. E., Ruedy, R., Russell, G. L., Ackerman, A. S., Aleinov, I., Bauer, M., Bleck, R., Canuto, V., Cesana, G., Cheng, Y., Clune, T. L., Cook, B. I., Cruz, C. A., Del Genio, A. D., Elsaesser, G. S., Faluvegi, G., Kiang, N. Y., Kim, D., Lacis, A. A., Leboissetier, A., LeGrande, A. N., Lo, K. K., Marshall, J., Matthews, E. E., McDermid, S., Mezuman, K., Miller, R. L., Murray, L. T., Oinas, V., Orbe, C., García-Pando, C. P., Perlwitz, J. P., Puma, M. J., Rind, D., Romanou, A., Shindell, D. T., Sun, S., Tausnev, N., Tsigaridis, K., Tselioudis, G., Weng, E., Wu, J., and Yao, M.-S.: GISS-E2.1: Configurations and Climatology, J. Adv. Model. Earth Sy., 12, e2019MS002025, https://doi.org/10.1029/2019MS002025, 2020.
Kim, P. S., Jacob, D. J., Fisher, J. A., Travis, K., Yu, K., Zhu, L., Yantosca, R. M., Sulprizio, M. P., Jimenez, J. L., Campuzano-Jost, P., Froyd, K. D., Liao, J., Hair, J. W., Fenn, M. A., Butler, C. F., Wagner, N. L., Gordon, T. D., Welti, A., Wennberg, P. O., Crounse, J. D., St. Clair, J. M., Teng, A. P., Millet, D. B., Schwarz, J. P., Markovic, M. Z., and Perring, A. E.: Sources, seasonality, and trends of southeast US aerosol: an integrated analysis of surface, aircraft, and satellite observations with the GEOS-Chem chemical transport model, Atmos. Chem. Phys., 15, 10411–10433, https://doi.org/10.5194/acp-15-10411-2015, 2015.
Le Breton, M., Wang, Y., Hallquist, Å. M., Pathak, R. K., Zheng, J., Yang, Y., Shang, D., Glasius, M., Bannan, T. J., Liu, Q., Chan, C. K., Percival, C. J., Zhu, W., Lou, S., Topping, D., Wang, Y., Yu, J., Lu, K., Guo, S., Hu, M., and Hallquist, M.: Online gas- and particle-phase measurements of organosulfates, organosulfonates and nitrooxy organosulfates in Beijing utilizing a FIGAERO ToF-CIMS, Atmos. Chem. Phys., 18, 10355–10371, https://doi.org/10.5194/acp-18-10355-2018, 2018.
Lee, L. A., Reddington, C. L., and Carslaw, K. S.: On the relationship between aerosol model uncertainty and radiative forcing uncertainty, P. Natl. Acad. Sci. USA, 113, 5820–5827, https://doi.org/10.1073/pnas.1507050113, 2016.
Leeper, R. D., Bilotta, R., Petersen, B., Stiles, C. J., Heim, R., Fuchs, B., Prat, O. P., Palecki, M., and Ansari, S.: Characterizing U.S. drought over the past 20 years using the U.S. drought monitor, Int. J. Climatol., 42, 6616–6630, https://doi.org/10.1002/joc.7653, 2022.
Li, W. and Wang, Y.: Reduced surface fine dust under droughts over the southeastern United States during summertime: observations and CMIP6 model simulations, Atmos. Chem. Phys., 22, 7843–7859, https://doi.org/10.5194/acp-22-7843-2022, 2022.
Li, W., Wang, Y., Flynn, J., Griffin, R. J., Guo, F., and Schnell, J. L.: Spatial variation of surface O3 responses to drought over the contiguous United States during summertime: Role of precursor emissions and ozone chemistry, J. Geophys. Res.-Atmos., 127, e2021JD035607, https://doi.org/10.1029/2021JD035607, 2022.
Llusià, J., Peñuelas, J., Alessio, G. A., and Estiarte, M.: Contrasting Species-Specific, Compound-Specific, Seasonal, and Interannual Responses of Foliar Isoprenoid Emissions to Experimental Drought in a Mediterranean Shrubland, Int. J. Plant Sci., 169, 637–645, https://doi.org/10.1086/533603, 2008.
Lopez-Hilfiker, F. D., Mohr, C., D'Ambro, E. L., Lutz, A., Riedel, T. P., Gaston, C. J., Iyer, S., Zhang, Z., Gold, A., Surratt, J. D., Lee, B. H., Kurten, T., Hu, W. W., Jimenez, J., Hallquist, M., and Thornton, J. A.: Molecular composition and volatility of organic aerosol in the southeastern U.S.: Implications for IEPOX derived SOA, Environ. Sci. Technol., 50, 2200–2209, https://doi.org/10.1021/acs.est.5b04769, 2016.
Malm, W. C., Schichtel, B. A., Hand, J. L., and Collett Jr., J. L.: Concurrent temporal and spatial trends in sulfate and organic mass concentrations measured in the IMPROVE monitoring program, J. Geophys. Res.-Atmos., 122, 10462–10476, https://doi.org/10.1002/2017JD026865, 2017.
Maria, S. F., Russell, L. M., Gilles, M. K., and Myneni, S. C. B.: Organic Aerosol Growth Mechanisms and Their Climate-Forcing Implications, Science, 306, 1921–1924, https://doi.org/10.1126/science.1103491, 2004.
McClure, C. D. and Jaffe, D. A.: US particulate matter air quality improves except in wildfire-prone areas, P. Natl. Acad. Sci. USA, 115, 7901–7906, https://doi.org/10.1073/pnas.1804353115, 2018.
NASA: CERES Time-Interpolated TOA Fluxes, Clouds and Aerosols Monthly Terra Edition4A, NASA Langley Atmospheric Science Data Center DAAC [data set], https://doi.org/10.5067/TERRA/CERES/SSF1DEGMONTH_L3.004A, 2015.
Pegoraro, E., Rey, A., Barron-Gafford, G., Monson, R., Malhi, Y., and Murthy, R.: The interacting effects of elevated atmospheric CO2 concentration, drought and leaf-to-air vapour pressure deficit on ecosystem isoprene fluxes, Oecologia, 146, 120–129, https://doi.org/10.1007/s00442-005-0166-5, 2005.
Potosnak, M. J., LeStourgeon, L., Pallardy, S. G., Hosman, K. P., Gu, L., Karl, T., Geron, C., and Guenther, A. B.: Observed and modeled ecosystem isoprene fluxes from an oak-dominated temperate forest and the influence of drought stress, Atmos. Environ., 84, 314–322, https://doi.org/10.1016/j.atmosenv.2013.11.055, 2014.
Pye, H. O. T., Murphy, B. N., Xu, L., Ng, N. L., Carlton, A. G., Guo, H., Weber, R., Vasilakos, P., Appel, K. W., Budisulistiorini, S. H., Surratt, J. D., Nenes, A., Hu, W., Jimenez, J. L., Isaacman-VanWertz, G., Misztal, P. K., and Goldstein, A. H.: On the implications of aerosol liquid water and phase separation for organic aerosol mass, Atmos. Chem. Phys., 17, 343–369, https://doi.org/10.5194/acp-17-343-2017, 2017.
Pye, H. O. T., Ward-Caviness, C. K., Murphy, B. N., Appel, K. W., and Seltzer, K. M.: Secondary organic aerosol association with cardiorespiratory disease mortality in the United States, Nat. Commun., 12, 7215, https://doi.org/10.1038/s41467-021-27484-1, 2021.
Randerson, J. T., Chen, Y., van der Werf, G. R., Rogers, B. M., and Morton, D. C.: Global burned area and biomass burning emissions from small fires, J. Geophys. Res.-Biogeo., 117, G04012, https://doi.org/10.1029/2012JG002128, 2012.
Rasch, P. J., Barth, M. C., Kiehl, J. T., Schwartz, S. E., and Benkovitz, C. M.: A description of the global sulfur cycle and its controlling processes in the National Center for Atmospheric Research Community Climate Model, Version 3, J. Geophys. Res.-Atmos., 105, 1367–1385, https://doi.org/10.1029/1999JD900777, 2000.
Ridley, D. A., Heald, C. L., Ridley, K. J., and Kroll, J. H.: Causes and consequences of decreasing atmospheric organic aerosol in the United States, P. Natl. Acad. Sci. USA, 115, 290–295, https://doi.org/10.1073/pnas.1700387115, 2018.
Riva, M., Tomaz, S., Cui, T., Lin, Y.-H., Perraudin, E., Gold, A., Stone, E. A., Villenave, E., and Surratt, J. D.: Evidence for an Unrecognized Secondary Anthropogenic Source of Organosulfates and Sulfonates: Gas-Phase Oxidation of Polycyclic Aromatic Hydrocarbons in the Presence of Sulfate Aerosol, Environ. Sci. Technol., 49, 6654–6664, https://doi.org/10.1021/acs.est.5b00836, 2015.
Ruffault, J., Curt, T., Martin-StPaul, N. K., Moron, V., and Trigo, R. M.: Extreme wildfire events are linked to global-change-type droughts in the northern Mediterranean, Nat. Hazards Earth Syst. Sci., 18, 847–856, https://doi.org/10.5194/nhess-18-847-2018, 2018.
Scasta, J. D., Weir, J. R., and Stambaugh, M. C.: Droughts and wildfires in western U.S. rangelands, Rangelands, 38, 197–203, https://doi.org/10.1016/j.rala.2016.06.003, 2016.
Schnell, J. L., Holmes, C. D., Jangam, A., and Prather, M. J.: Skill in forecasting extreme ozone pollution episodes with a global atmospheric chemistry model, Atmos. Chem. Phys., 14, 7721–7739, https://doi.org/10.5194/acp-14-7721-2014, 2014.
Schroder, J. C., Campuzano-Jost, P., Day, D. A., Shah, V., Larson, K., Sommers, J. M., Sullivan, A. P., Campos, T., Reeves, J. M., Hills, A., Hornbrook, R. S., Blake, N. J., Scheuer, E., Guo, H., Fibiger, D. L., McDuffie, E. E., Hayes, P. L., Weber, R. J., Dibb, J. E., Apel, E. C., Jaeglé, L., Brown, S. S., Thornton, J. A., and Jimenez, J. L.: Sources and secondary production of organic aerosols in the northeastern United States during winter, J. Geophys. Res.-Atmos., 123, 7771–7796, https://doi.org/10.1029/2018JD028475, 2018.
Séférian, R., Nabat, P., Michou, M., Saint-Martin, D., Voldoire, A., Colin, J., Decharme, B., Delire, C., Berthet, S., Chevallier, M., Sénési, S., Franchisteguy, L., Vial, J., Mallet, M., Joetzjer, E., Geoffroy, O., Guérémy, J.-F., Moine, M.-P., Msadek, R., Ribes, A., Rocher, M., Roehrig, R., Salas-y-Mélia, D., Sanchez, E., Terray, L., Valcke, S., Waldman, R., Aumont, O., Bopp, L., Deshayes, J., Éthé, C., and Madec, G.: Evaluation of CNRM Earth System Model, CNRM-ESM2-1: Role of Earth System Processes in Present-Day and Future Climate, J. Adv. Model. Earth Sy., 11, 4182–4227, https://doi.org/10.1029/2019MS001791, 2019.
Seland, Ø., Bentsen, M., Olivié, D., Toniazzo, T., Gjermundsen, A., Graff, L. S., Debernard, J. B., Gupta, A. K., He, Y.-C., Kirkevåg, A., Schwinger, J., Tjiputra, J., Aas, K. S., Bethke, I., Fan, Y., Griesfeller, J., Grini, A., Guo, C., Ilicak, M., Karset, I. H. H., Landgren, O., Liakka, J., Moseid, K. O., Nummelin, A., Spensberger, C., Tang, H., Zhang, Z., Heinze, C., Iversen, T., and Schulz, M.: Overview of the Norwegian Earth System Model (NorESM2) and key climate response of CMIP6 DECK, historical, and scenario simulations, Geosci. Model Dev., 13, 6165–6200, https://doi.org/10.5194/gmd-13-6165-2020, 2020.
Senior, C. A., Jones, C. G., Wood, R. A., Sellar, A., Belcher, S., Klein-Tank, A., Sutton, R., Walton, J., Lawrence, B., Andrews, T., and Mulcahy, J. P.: U.K. Community Earth System Modeling for CMIP6, J. Adv. Model. Earth Sy., 12, e2019MS002004, https://doi.org/10.1029/2019MS002004, 2020.
Shrivastava, M., Cappa, C. D., Fan, J., Goldstein, A. H., Guenther, A. B., Jimenez, J. L., Kuang, C., Laskin, A., Martin, S. T., Ng, N. L., Petaja, T., Pierce, J. R., Rasch, P. J., Roldin, P., Seinfeld, J. H., Shilling, J., Smith, J. N., Thornton, J. A., Volkamer, R., Wang, J., Worsnop, D. R., Zaveri, R. A., Zelenyuk, A., and Zhang, Q.: Recent advances in understanding secondary organic aerosol: Implications for global climate forcing, Rev. Geophys., 55, 509–559, https://doi.org/10.1002/2016RG000540, 2017.
Strzepek, K., Yohe, G., Neumann, J., and Boehlert, B.: Characterizing changes in drought risk for the United States from climate change, Environ. Res. Lett., 5, 044012, https://doi.org/10.1088/1748-9326/5/4/044012, 2010.
Surratt, J. D., Chan, A. W. H., Eddingsaas, N. C., Chan, M., Loza, C. L., Kwan, A. J., Hersey, S. P., Flagan, R. C., Wennberg, P. O., and Seinfeld, J. H.: Reactive intermediates revealed in secondary organic aerosol formation from isoprene, P. Natl. Acad. Sci. USA, 107, 6640–6645, https://doi.org/10.1073/pnas.0911114107, 2010.
Tai, A. P. K., Mickley, L. J., and Jacob, D. J.: Correlations between fine particulate matter (PM2.5) and meteorological variables in the United States: Implications for the sensitivity of PM2.5 to climate change, Atmos. Environ., 44, 3976–3984, https://doi.org/10.1016/j.atmosenv.2010.06.060, 2010.
Tatebe, H., Ogura, T., Nitta, T., Komuro, Y., Ogochi, K., Takemura, T., Sudo, K., Sekiguchi, M., Abe, M., Saito, F., Chikira, M., Watanabe, S., Mori, M., Hirota, N., Kawatani, Y., Mochizuki, T., Yoshimura, K., Takata, K., O'ishi, R., Yamazaki, D., Suzuki, T., Kurogi, M., Kataoka, T., Watanabe, M., and Kimoto, M.: Description and basic evaluation of simulated mean state, internal variability, and climate sensitivity in MIROC6, Geosci. Model Dev., 12, 2727–2765, https://doi.org/10.5194/gmd-12-2727-2019, 2019.
Taufik, M., Torfs, P. J. J. F., Uijlenhoet, R., Jones, P. D., Murdiyarso, D., and Van Lanen, H. A. J.: Amplification of wildfire area burnt by hydrological drought in the humid tropics, Nat. Clim. Change, 7, 428–431, https://doi.org/10.1038/nclimate3280, 2017.
Thornhill, G., Collins, W., Olivié, D., Skeie, R. B., Archibald, A., Bauer, S., Checa-Garcia, R., Fiedler, S., Folberth, G., Gjermundsen, A., Horowitz, L., Lamarque, J.-F., Michou, M., Mulcahy, J., Nabat, P., Naik, V., O'Connor, F. M., Paulot, F., Schulz, M., Scott, C. E., Séférian, R., Smith, C., Takemura, T., Tilmes, S., Tsigaridis, K., and Weber, J.: Climate-driven chemistry and aerosol feedbacks in CMIP6 Earth system models, Atmos. Chem. Phys., 21, 1105–1126, https://doi.org/10.5194/acp-21-1105-2021, 2021.
Tsui, W. G., Woo, J. L., and McNeill, V. F.: Impact of Aerosol-Cloud Cycling on Aqueous Secondary Organic Aerosol Formation, Atmosphere, 10, 666, https://doi.org/10.3390/atmos10110666, 2019.
Turnock, S. T., Allen, R. J., Andrews, M., Bauer, S. E., Deushi, M., Emmons, L., Good, P., Horowitz, L., John, J. G., Michou, M., Nabat, P., Naik, V., Neubauer, D., O'Connor, F. M., Olivié, D., Oshima, N., Schulz, M., Sellar, A., Shim, S., Takemura, T., Tilmes, S., Tsigaridis, K., Wu, T., and Zhang, J.: Historical and future changes in air pollutants from CMIP6 models, Atmos. Chem. Phys., 20, 14547–14579, https://doi.org/10.5194/acp-20-14547-2020, 2020.
van Noije, T., Bergman, T., Le Sager, P., O'Donnell, D., Makkonen, R., Gonçalves-Ageitos, M., Döscher, R., Fladrich, U., von Hardenberg, J., Keskinen, J.-P., Korhonen, H., Laakso, A., Myriokefalitakis, S., Ollinaho, P., Pérez García-Pando, C., Reerink, T., Schrödner, R., Wyser, K., and Yang, S.: EC-Earth3-AerChem: a global climate model with interactive aerosols and atmospheric chemistry participating in CMIP6, Geosci. Model Dev., 14, 5637–5668, https://doi.org/10.5194/gmd-14-5637-2021, 2021.
Vicente-Serrano, S. M., Beguería, S., and López-Moreno, J. I.: A multiscalar drought index sensitive to global warming: The Standardized Precipitation Evapotranspiration Index, J. Climate, 23, 1696–1718, https://doi.org/10.1175/2009JCLI2909.1, 2010 (data available at: https://spei.csic.es/spei_database_2_6, last access: 21 August 2024).
Wang, Y., Xie, Y., Cai, L., Dong, W., Zhang, Q., and Zhang, L.: Impact of the 2011 southern U.S. drought on ground-level fine aerosol concentration in summertime, J. Atmos. Sci., 72, 1075–1093, https://doi.org/10.1175/JAS-D-14-0197.1, 2015.
Wang, Y., Xie, Y., Dong, W., Ming, Y., Wang, J., and Shen, L.: Adverse effects of increasing drought on air quality via natural processes, Atmos. Chem. Phys., 17, 12827–12843, https://doi.org/10.5194/acp-17-12827-2017, 2017.
Wang, Y., Wang, J., Wang, Y., and Li, W.: Drought impacts on PM2.5 composition and amount over the US during 1988–2018, J. Geophys. Res.-Atmos., 127, e2022JD037677, https://doi.org/10.1029/2022JD037677, 2022a.
Wang, Y., Lin, N., Li, W., Guenther, A., Lam, J. C. Y., Tai, A. P. K., Potosnak, M. J., and Seco, R.: Satellite-derived constraints on the effect of drought stress on biogenic isoprene emissions in the southeastern US, Atmos. Chem. Phys., 22, 14189–14208, https://doi.org/10.5194/acp-22-14189-2022, 2022b.
Wilhite, D. A., Svoboda, M. D., and Hayes, M. J.: Understanding the complex impacts of drought: A key to enhancing drought mitigation and preparedness, Water Resour. Manag., 21, 763–774, https://doi.org/10.1007/s11269-006-9076-5, 2007.
Wu, C., Pullinen, I., Andres, S., Carriero, G., Fares, S., Goldbach, H., Hacker, L., Kasal, T., Kiendler-Scharr, A., Kleist, E., Paoletti, E., Wahner, A., Wildt, J., and Mentel, Th. F.: Impacts of soil moisture on de novo monoterpene emissions from European beech, Holm oak, Scots pine, and Norway spruce, Biogeosciences, 12, 177–191, https://doi.org/10.5194/bg-12-177-2015, 2015.
Wu, T., Zhang, F., Zhang, J., Jie, W., Zhang, Y., Wu, F., Li, L., Yan, J., Liu, X., Lu, X., Tan, H., Zhang, L., Wang, J., and Hu, A.: Beijing Climate Center Earth System Model version 1 (BCC-ESM1): model description and evaluation of aerosol simulations, Geosci. Model Dev., 13, 977–1005, https://doi.org/10.5194/gmd-13-977-2020, 2020.
Xie, Y., Wang, Y., Dong, W., Wright, J. S., Shen, L., and Zhao, Z.: Evaluating the response of summertime surface sulfate to hydroclimate variations in the continental United States: Role of meteorological inputs in the GEOS-Chem model, J. Geophys. Res.-Atmos., 124, 1662–1679, https://doi.org/10.1029/2018JD029693, 2019.
Xu, L., Guo, H., Boyd, C. M., Klein, M., Bougiatioti, A., Cerully, K. M., Hite, J. R., Isaacman-VanWertz, G., Kreisberg, N. M., and Knote, C.: Effects of anthropogenic emissions on aerosol formation from isoprene and monoterpenes in the southeastern United States, P. Natl. Acad. Sci. USA, 112, 37–42, 2015.
Yli-Juuti, T., Mielonen, T., Heikkinen, L., Arola, A., Ehn, M., Isokääntä, S., Keskinen, H.-M., Kulmala, M., Laakso, A., Lipponen, A., Luoma, K., Mikkonen, S., Nieminen, T., Paasonen, P., Petäjä, T., Romakkaniemi, S., Tonttila, J., Kokkola, H., and Virtanen, A.: Significance of the organic aerosol driven climate feedback in the boreal area, Nat. Commun., 12, 5637, https://doi.org/10.1038/s41467-021-25850-7, 2021.
Yukimoto, S., Kawai, H., Koshiro, T., Oshima, N., Yoshida, K., Urakawa, S., Tsujino, H., Deushi, M., Tanaka, T., Hosaka, M., Yabu, S., Yoshimura, H., Shindo, E., Mizuta, R., Obata, A., Adachi, Y., and Ishii, M.: The Meteorological Research Institute Earth System Model Version 2.0, MRI-ESM2.0: Description and Basic Evaluation of the Physical Component, J. Meteorol. Soc. Jpn., Ser. II, 97, 931–965, https://doi.org/10.2151/jmsj.2019-051, 2019.
Zhang, Q., Jimenez, J. L., Canagaratna, M. R., Ulbrich, I. M., Ng, N. L., Worsnop, D. R., and Sun, Y.: Understanding atmospheric organic aerosols via factor analysis of aerosol mass spectrometry: a review, Anal. Bioanal. Chem., 401, 3045–3067, https://doi.org/10.1007/s00216-011-5355-y, 2011.
Zhang, X., Liu, Z., Hecobian, A., Zheng, M., Frank, N. H., Edgerton, E. S., and Weber, R. J.: Spatial and seasonal variations of fine particle water-soluble organic carbon (WSOC) over the southeastern United States: implications for secondary organic aerosol formation, Atmos. Chem. Phys., 12, 6593–6607, https://doi.org/10.5194/acp-12-6593-2012, 2012.
Zhao, Z., Wang, Y., Qin, M., Hu, Y., Xie, Y., and Russell, A. G.: Drought impacts on secondary organic aerosol: a case study in the southeast United States, Environ. Sci. Technol., 53, 242–250, https://doi.org/10.1021/acs.est.8b04842, 2019.
Zheng, Y., Thornton, J. A., Ng, N. L., Cao, H., Henze, D. K., McDuffie, E. E., Hu, W., Jimenez, J. L., Marais, E. A., Edgerton, E., and Mao, J.: Long-term observational constraints of organic aerosol dependence on inorganic species in the southeast US, Atmos. Chem. Phys., 20, 13091–13107, https://doi.org/10.5194/acp-20-13091-2020, 2020.