the Creative Commons Attribution 4.0 License.
the Creative Commons Attribution 4.0 License.
 | 27 Aug 2024
On the sensitivity of aerosol–cloud interactions to changes in sea surface temperature in radiative–convective equilibrium
Suf Lorian
Clouds play a vital role in regulating Earth's energy balance and are impacted by anthropogenic aerosol concentration (Na) and sea surface temperature (SST) alterations. Traditionally, these factors, aerosols and SST, are investigated independently. This study employs cloud-resolving, radiative–convective-equilibrium (RCE) simulations to explore aerosol–cloud interactions (ACIs) under varying SSTs. ACIs are found to be SST-dependent even under RCE conditions. Notably, changes in cloud radiative effects for both longwave radiation and shortwave radiation lead to a decrease in top-of-atmosphere (TOA) energy gain with increasing Na. The changes in TOA shortwave flux exhibit greater sensitivity to underlying SST conditions compared to longwave radiation. To comprehend these trends, we perform a linear decomposition, analyzing the responses of different cloud regimes and contributions from changes in the cloud's opacity and occurrence. This breakdown reveals that ice and shallow clouds predominantly contribute to the radiative effect, mostly due to changes in the cloud's opacity and due to the Twomey effect, which is proportional to the baseline cloud fraction. Moreover, with an increase in Na, we observe an increase in latent heat release at the upper troposphere associated with heightened production of snow and graupel. We show that this trend, consistently across all SSTs, affects the anvil cloud cover by affecting the static stability at the upper troposphere via a similar mechanism to the stability iris effect, resulting in an increase in outgoing longwave radiation. In conclusion, under the ongoing climate change, studying the sensitivity of clouds to aerosols and SST should be conducted concomitantly as mutual effects are expected.
- Article
(4814 KB) - Full-text XML
-
Supplement
(17751 KB) - BibTeX
- EndNote


The response of clouds to anthropogenic perturbations is highly uncertain, posing a significant challenge in predicting future climate. This uncertainty stems mainly from two aspects: (1) uncertainty regarding the change in top-of-atmosphere (TOA) radiative flux resulting from the cloud response to warming, referred to as cloud feedback (Ceppi et al., 2017), and (2) uncertainty regarding the response of clouds to anthropogenic aerosols (Bellouin et al., 2020). In the latter case, aerosols, which can serve as cloud condensation nuclei (CCN) and ice nuclei, could affect the microphysical properties and processes in clouds (Bellouin et al., 2020). Specifically, clouds forming under higher aerosol concentrations (polluted clouds) usually have initially smaller and more numerous droplets, with a narrower size distribution compared to clean clouds (Squires, 1958; Squires and Twomey, 1960). The initial droplet size distribution affects the cloud's albedo (Twomey, 1974, 1977; Bellouin et al., 2020) and can affect key cloud processes such as condensation–evaporation, collision–coalescence, and sedimentation (Albrecht, 1989; Seinfeld et al., 2016; Dagan et al., 2017; Heikenfeld et al., 2019; Christensen et al., 2022). These effects are known to be dependent on the environmental conditions (Gryspeerdt and Stier, 2012; Christensen et al., 2016; Dagan and Stier, 2020b) and hence are expected to be state/time-dependent under ongoing climate change (Dagan et al., 2017; Igel and van den Heever, 2021; Dagan, 2022).
Ultimately, the microphysical effects mentioned above could modify the precipitation production (Albrecht, 1989). Specifically, the initiation of warm rain has been shown to be delayed and to start at higher elevations under more polluted conditions (Rosenfeld, 2000; Freud and Rosenfeld, 2012; Dagan et al., 2015; Heikenfeld et al., 2019). However, in deep convective clouds, the precipitation production could be compensated – or even overcompensated – for at higher levels of the clouds to which more water is advected under more polluted conditions (Rosenfeld et al., 2008; Koren et al., 2014; Altaratz et al., 2014). As the freezing level elevation increases with sea surface temperature (SST), at lower SSTs the warm layer (containing liquid only) of a deep convective cloud is narrower in comparison to higher SSTs. Thus, an aerosol perturbation is hypothesized to more likely suppress warm rain completely at lower SSTs than at higher SSTs, where the relatively deep warm layer of the clouds enables longer diffusional growth of the droplets to the critical size which initiates precipitation (Freud and Rosenfeld, 2012; Heikenfeld et al., 2019). Warm rain suppression and, as a consequence, enhanced freezing of this water in the cold (containing ice) sections of the cloud will result in more latent heat release at the upper parts of the troposphere (Rosenfeld et al., 2008; Igel and van den Heever, 2021) and thus in changes in the atmospheric stability.
In addition to the effect on precipitation, it has been previously suggested that aerosol's effect on deep convective clouds can increase the anvil cloud mass and extent by increasing the upward advection of water (Fan et al., 2010, 2013; Grabowski and Morrison, 2016; Chen et al., 2017). This trend could be explained by the convective invigoration hypothesis (Williams et al., 2002; Koren et al., 2005; Seifert and Beheng, 2006; Rosenfeld et al., 2008; Yuan et al., 2011; Koren et al., 2014). Under this hypothesis, which remains highly questionable (Varble et al., 2023; Romps et al., 2023), increasing aerosol concentrations have been suggested to drive stronger latent heat release and hence stronger vertical velocities. In addition, under high-aerosol-concentration conditions, the smaller hydrometeors are transported higher into the atmosphere for a given vertical velocity (Koren et al., 2015; Dagan et al., 2018, 2020), and their lifetime at the upper troposphere is longer due to a weaker sedimentation rate (Fan et al., 2013; Grabowski and Morrison, 2016). However, it is important to note that these proposed aerosol effects are still highly uncertain (Stevens and Feingold, 2009; Varble, 2018; Romps et al., 2023; Varble et al., 2023).
Cloud feedback, or the response of the cloud radiative effect (CRE) to surface warming, was recently shown to depend on the assumed aerosol concentration (Dagan, 2022). In the tropics, the radiative effect of both shallow (Gettelman and Sherwood, 2016) and deep (Ceppi et al., 2017) clouds is expected to further warm the surface. Shallow tropical and sub-tropical clouds – which have a general radiative cooling effect – are expected to become less prevalent and less radiatively opaque, thus producing a positive (but still highly uncertain) feedback (Gettelman and Sherwood, 2016; Nuijens and Siebesma, 2019). At the same time, deep tropical clouds are also expected to react to surface warming in a way that modifies their CRE (Ceppi et al., 2017). Specifically, it has been suggested that the tropical anvil cloud temperature and coverage react to surface warming (Hartmann and Larson, 2002; Zelinka and Hartmann, 2010; Bony et al., 2016; Ceppi et al., 2017). Tropical anvil clouds strongly modulate the longwave emissions of Earth as these clouds are much colder than the surface (by about 70–90 K) and are often opaque in the longwave, thus emitting a significantly lower amount of energy to space than otherwise would be emitted without them. In addition, anvil clouds could also strongly modulate the shortwave radiation budget, depending on their optical thickness (Hartmann and Berry, 2017; Li et al., 2019; Sokol et al., 2024). Hence, any anthropogenically driven changes to the anvil cloud properties, such as amount and temperature, could significantly affect Earth's energy budget (Zelinka and Hartmann, 2010; Ceppi et al., 2017).
A central feature of the anvil cloud response to SST changes is the fixed anvil temperature (FAT) hypothesis (Hartmann and Larson, 2002), which states that the temperature of anvil clouds is anticipated to remain roughly fixed with warming. According to the FAT hypothesis, anvil top heights are determined by clear-sky radiative cooling, which in turn is primarily determined by water vapor concentration. The water vapor concentration, following the Clausius–Clapeyron relation, sharply drops to negligible values near the temperatures of the upper troposphere, making the radiative cooling inefficient above this level and still efficient below this level. In a clear-sky free troposphere, radiative cooling is balanced by adiabatic warming due to subsiding motions; thus, the energy budget can be formulated as follows:
where Qr is the radiative cooling rate, ω is the clear-sky vertical pressure velocity, and S is the static stability defined as
where T is the air temperature, θ is the potential temperature, and P is the pressure.
The subsidence motion below the sharp drop in radiative cooling and the lack of subsidence above this level generate vertical divergence in the clear sky, which, due to conservation of mass, is balanced by horizontal divergence from the convective regions. This convective divergence controls anvil clouds (Hartmann and Larson, 2002; Zelinka and Hartmann, 2011, 2010; Bony et al., 2016) (below, in Fig. 7, vertical profiles of S, Qr, and ω and its vertical divergence are presented).
While observations, global climate models, and high-resolution convective-permitting models predict an increase in altitude of anvil clouds while maintaining nearly fixed temperatures, they also anticipate a decrease in anvil cloud coverage with rising surface temperatures (Zelinka and Hartmann, 2011; Bony et al., 2016; Williams and Pierrehumbert, 2017; Wing et al., 2020; Saint-Lu et al., 2020; Beydoun et al., 2021). The mechanisms behind this decrease in anvil cloud coverage rely on the same physics as do the mechanisms of the FAT hypothesis. Namely, it has been suggested that as the climate warms, the clouds rise but find themselves in a more stable atmosphere (while remaining at nearly the same temperature). This enhanced stability under warmer conditions reduces the convective outflow in the upper troposphere and hence decreases the anvil cloud fraction (Bony et al., 2016; Beydoun et al., 2021). Specifically, it was shown that the maximum of the radiatively driven mass divergence in convective regions (Dr), defined as
can accurately predict the anvil cloud fraction and decreases with the increase in stability occurring with an increase in SST (Bony et al., 2016; Beydoun et al., 2021). In addition to the radiatively driven divergence, slow evaporation (Seeley et al., 2019) and sedimentation (Beydoun et al., 2021) of the ice crystals at the upper troposphere contribute to anvil cloud formation. However, changes in the lifetime of anvil clouds – determined by changes in sedimentation and evaporation – were shown to play a secondary role in the response of anvil clouds to warming (Beydoun et al., 2021).
In this study, we focus on the synergistic SST and aerosol effects on tropical convective clouds, and specifically on the CRE, under equilibrium conditions using idealized cloud-resolving, radiative–convective-equilibrium (RCE) simulations. This is done following previous studies that uses RCE to examine different aspects of aerosol–cloud interactions (ACIs) (van den Heever et al., 2011; Storer and van den Heever, 2013; Beydoun and Hoose, 2019; Dagan, 2022).
2.1 Model description
The model used in this study is the System for Atmospheric Modeling (Khairoutdinov and Randall, 2003, SAM) version 6.11.7. The microphysics scheme used is the two-moment bulk microphysics of Morrison et al. (2005). The aerosols available for activation are represented by a power law function of the super-saturation (SS): CCN = NaSSk, where Na is the concentration of CCN available at 1 % super-saturation and k is a constant, here equal to 0.4, representing typical maritime conditions. CCN activation at the cloud base is parameterized using the vertical velocity and CCN spectrum parameters (Twomey, 1959). In this case, we use different Na concentrations for representing changes in aerosol concentration. Here, ice nucleation is not directly coupled to Na (i.e., changes in Na do not change the concentration of ice nucleating particles, INPs) but rather depends on the temperature and the supersaturation with respect to ice (Rasmussen et al., 2002). We note that, in realistic conditions, changes in Na might cause changes in INPs, an effect that should be addressed in future research. In our simulations, freezing occurs through homogeneous freezing and heterogeneous freezing by contact or immersion freezing (Morrison et al., 2005). Ice nucleation directly from vapor is not considered here, but depositional growth of cloud ice is enabled. Direct interactions between aerosols and radiation are also not considered here; however, aerosols could affect the radiation via the modification of the clouds' properties. In order to represent the Twomey effect (Twomey, 1977), the model is configured to pass cloud water and ice-crystal effective radii from the microphysics scheme to the radiation scheme.
2.2 Experimental design
The simulations used here generally follow the Radiative-Convective-Equilibrium Model Intercomparison Project Wing et al. (2018, RCEMIP) small domain protocol but with changes in aerosol concentration. The simulations are run in a small domain, of 96 km × 96 km, in order to avoid the effects of convective self-aggregation (Muller and Held, 2012; Lutsko and Cronin, 2018). The simulations are conducted with a horizontal grid spacing of 1 km, 68 vertical levels between 25 m and 31 km, and a vertical grid spacing increasing from 50 m at the surface to around 1 km at the domain top. To get solar insolation close to the tropical-mean value, the solar radiation is fixed at 551.58 W m−2, with a zenith angle of 42.05° (Wing et al., 2018). A diurnal cycle is not considered here, and we note that it might affect the convective development to some extent even over the ocean (Nesbitt and Zipser, 2003; Gasparini et al., 2022). In order to initialize convection, a small thermal noise is added near the surface at the beginning of each simulation.
The concentration of CO2 is fixed at the pre-industrial level (280 ppm), while there are 25 different Na and SST combinations – five different values for each. Na ranges from 20 to 2000 cm−3 (20, 100, 200, 1000, and 2000 cm−3), following a recent observational data set (Choudhury and Tesche, 2023), which showed the feasibility of this Na range. The SST ranges from 290 to 310 K in 5 K intervals. Snapshots of the different simulations are presented in Fig. S1 in the Supplement. This wide range of aerosol and SST conditions is used to maximize the effects and for establishing a better physical understanding. A fixed ozone profile, representing a typical tropical atmosphere, is used here (Wing et al., 2018). We note that using a fixed ozone profile under different SSTs is not entirely realistic and may have some effect on the cloud development (Harrop and Hartmann, 2012; Seidel and Yang, 2022). For simplicity, the effect of other trace gases (such as CH4 and N2O) is neglected. The temporal resolution of the simulations is 10 s, and that of the interactive radiative scheme is 5 min (using the CAM radiation scheme, Collins et al., 2006). All fields have an output resolution of 1 h; 3D fields are saved as snapshots, while domain statistics are saved as hourly averages. Each simulation was run for 150 d (Wing et al., 2018), and the last 30 d of each simulation was used for statistical analysis.
3.1 Response of the domain mean properties to aerosol perturbation under different SSTs
We start by examining the effect of changes in Na on the TOA energy gain under different SSTs (ΔR; Fig. 1a). Figure 1 illustrates that for all SSTs, an increase in Na decreases ΔR – an effect which becomes stronger with a decrease in the SST. The longwave (LW) and shortwave (SW) components of ΔR are negatively affected by Na (each declining by up to 4–5 W m−2 for the entire Na range considered here, depending on the SST; Fig. 1b and c), with ΔRSW being more susceptible to SST changes (Fig. 1c), and ΔRLW decreases in a roughly similar manner across all SSTs (Fig. 1b). Moreover, the CRE (calculated as all-sky radiative flux minus clear-sky radiative flux) is identified as the main driver of ΔR variations, while changes in clear-sky radiation have a minimal impact, as indicated by Fig. 1d–f. This is true in our simulations as changes in Na do not directly affect radiation by aerosol–radiation interactions.
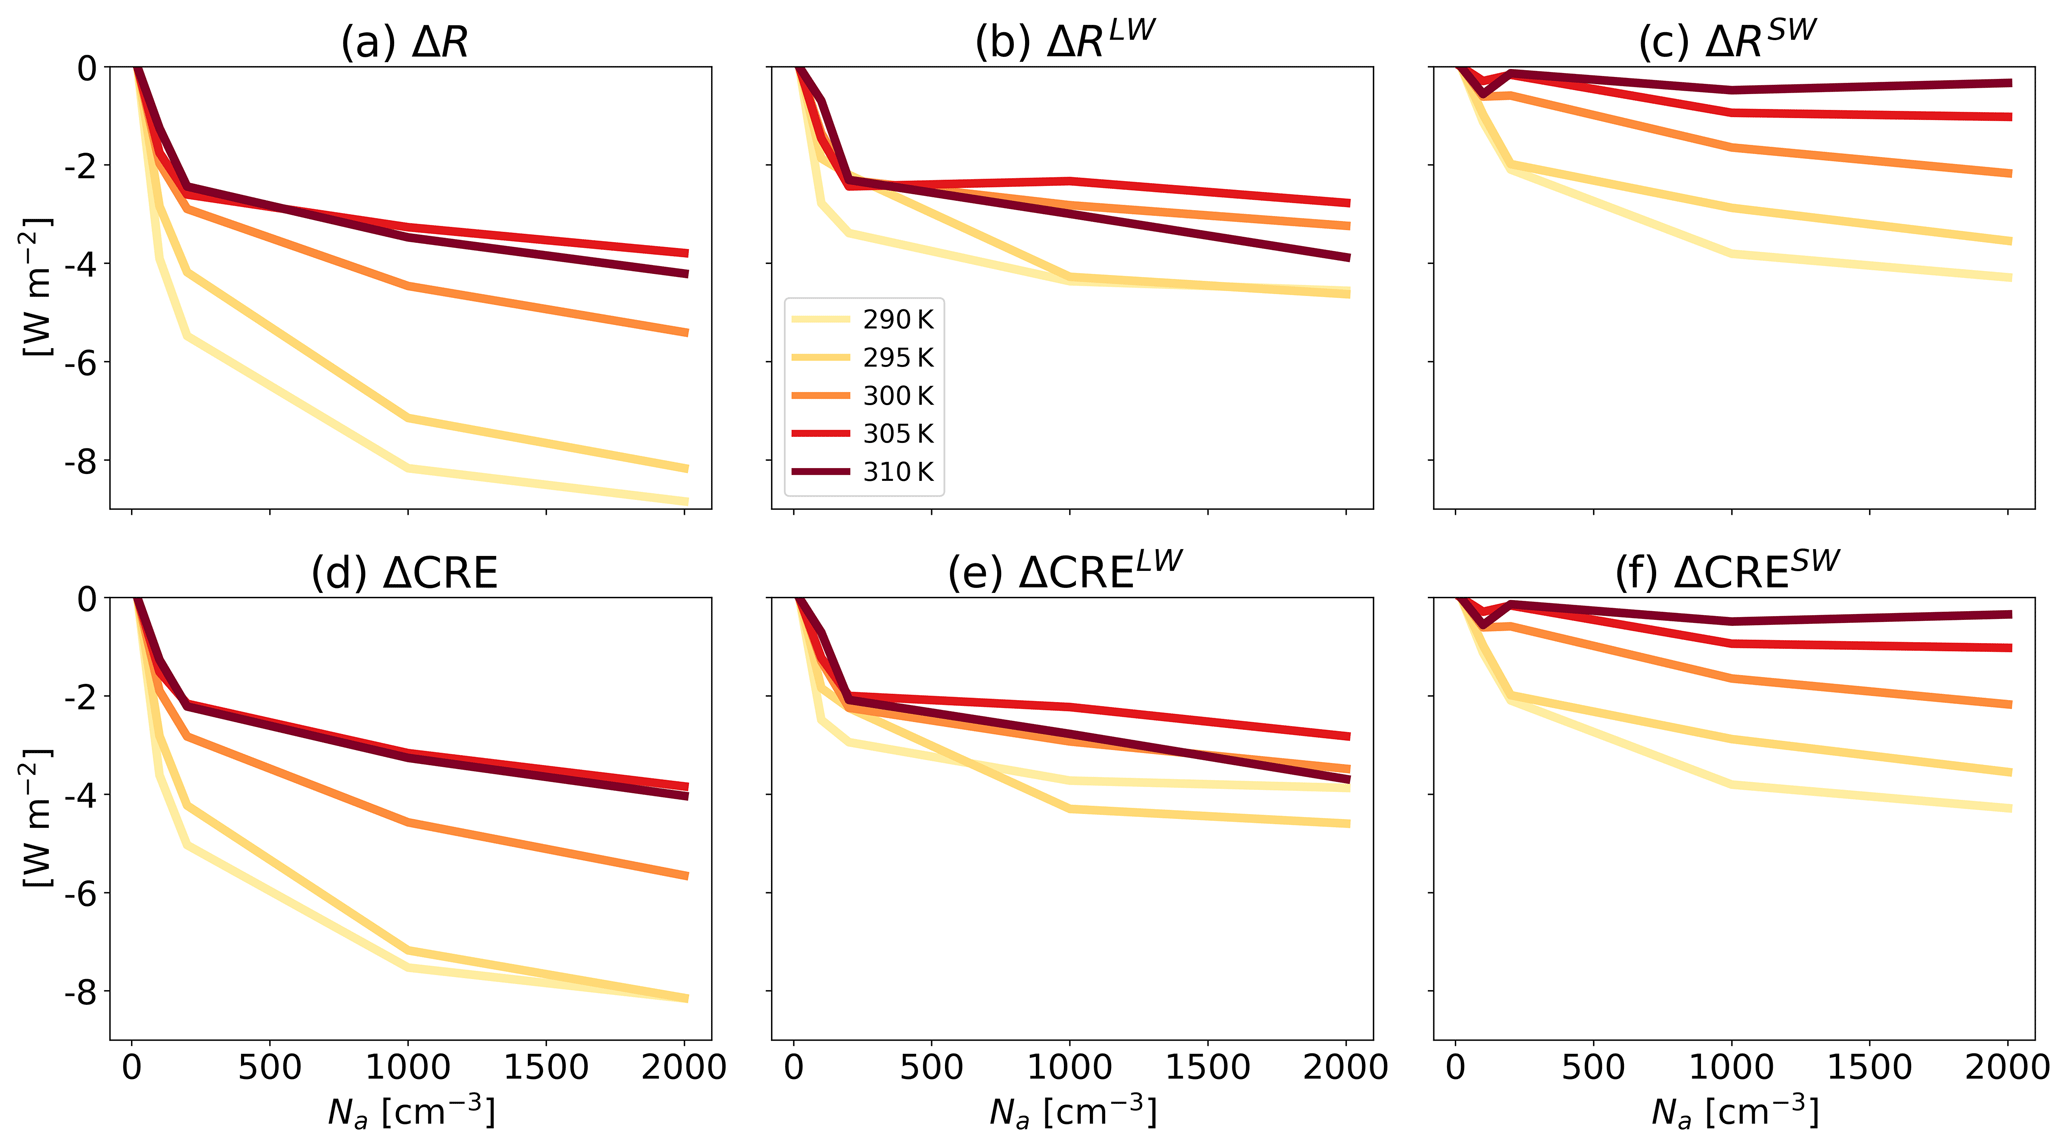
Figure 1Changes in the domain and time mean radiative fluxes at the top of the atmosphere due to changes in aerosol concentrations (Na). Panel (a) presents the total change in radiation, while panels (b) and (c) present changes in longwave (LW) and shortwave (SW) radiation, respectively. Panels (d)–(f) present the changes in the total cloud radiative effect (CRE) and its LW and SW components, respectively. The values are presented relative to the cleanest run (Na = 20 cm−3) for each SST, as indicated by the Δ sign.
In order to understand the radiative effect of an increase in Na under the different SSTs, we first examine the domain- and time-mean cloud liquid water path, ice water path, and cloud fraction (ℒ, ℐ and CF, respectively; Fig. 2). Figure 2 illustrates a monotonic increase in ℒ with Na, which is generally stronger under lower SSTs, and a monotonic decrease in ℐ, consistently across SSTs. In addition, Fig. 2c illustrates a general decrease in CF with Na, although not monotonic. We note that the CF trend is dependent on the choice of the cloud vs. clear-sky definition, as can be seen in Fig. S2.
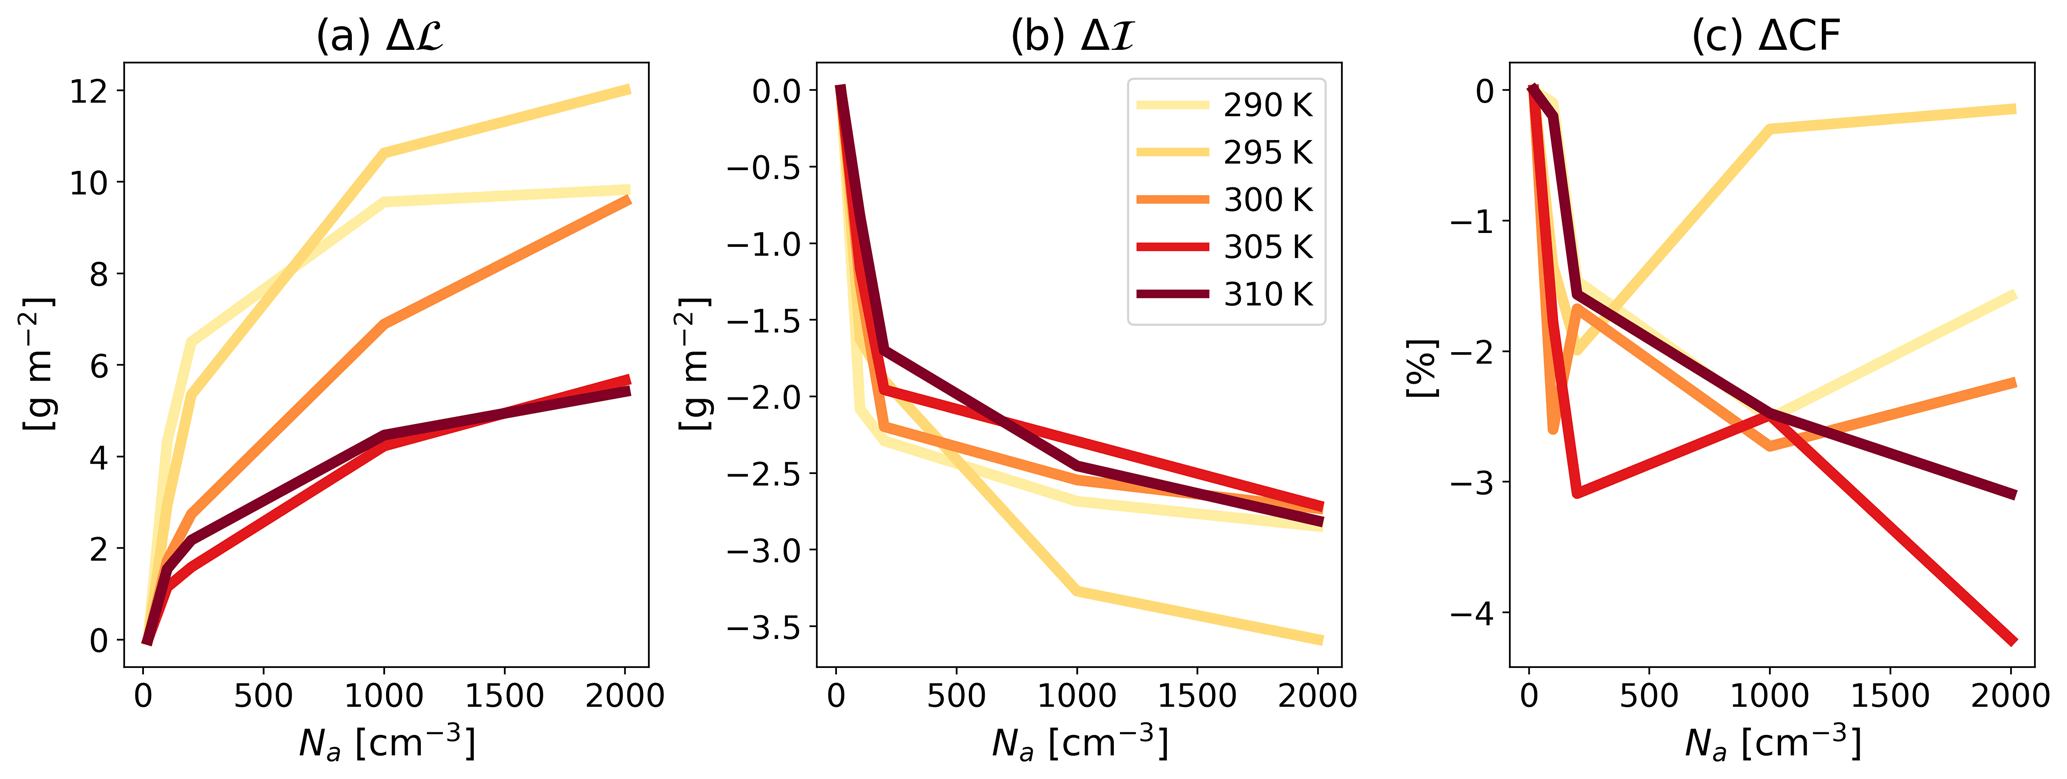
Figure 2The response of domain and time mean liquid water path (ℒ; a), ice water path (ℐ; b), and cloud fraction (CF; c) to an increase in Na. The values are presented relative to the cleanest run (Na = 20 cm−3) for each SST, as indicated by the Δ sign.
Next, we examine vertical profiles of the different hydrometeors (Fig. 3). We note that with an increase in SST, the freezing level increases. Since an increase in Na acts to push warm rain formation to higher levels (Rosenfeld, 2000; Freud and Rosenfeld, 2012; Heikenfeld et al., 2019), under lower SSTs, for which the freezing level is relatively shallow (about 1250 m above cloud base in the coldest case considered here), an increase in Na can inhibit warm rain (Fig. 3g). In contrast, under higher SSTs, for which the freezing level is relatively deep (about 6000 m above cloud base in the warmest case considered here), an increase in Na drives warm rain inhibition at the lower levels, which is compensated for at higher levels of the warm section (Fig. 3g). That is to say that under low SSTs the delay in warm rain is not being offset at higher levels within the warm section, while under high SSTs we do see such an offset. This explains the stronger rise in water content within the warm section (ℒ), with an increase in Na (Albrecht, 1989) under low-SST conditions compared to high-SST conditions (Fig. 2a).
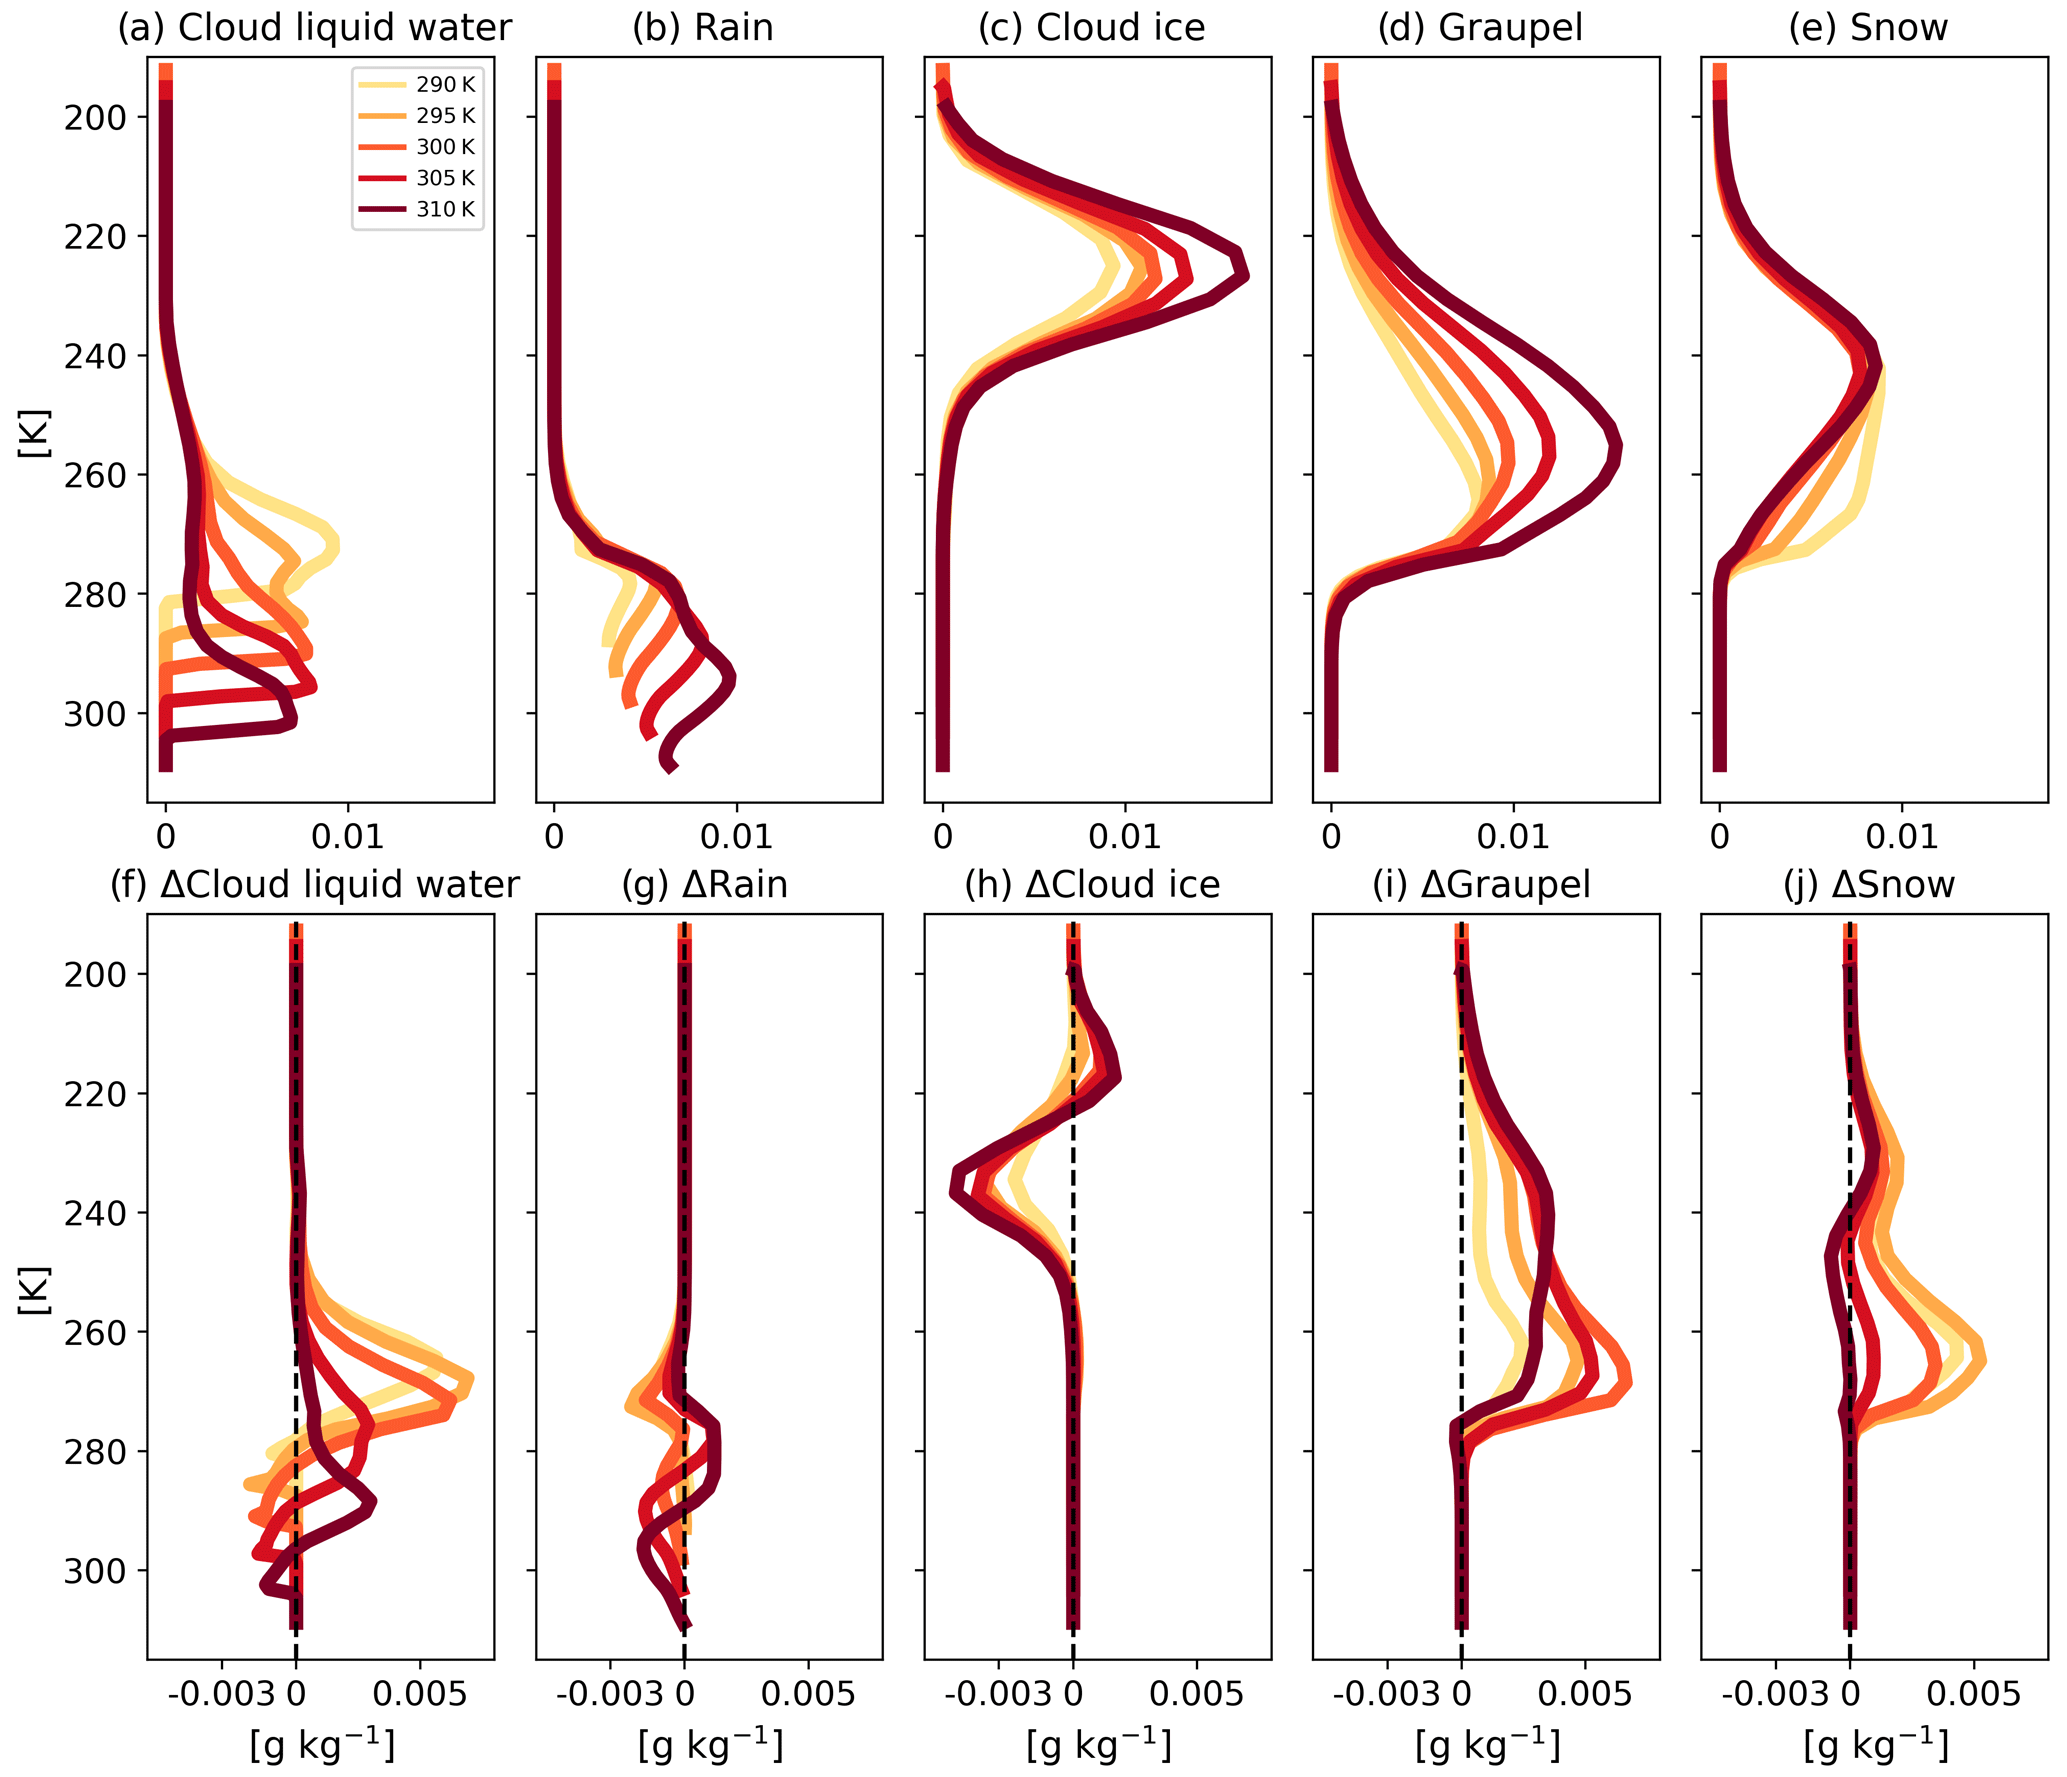
Figure 3Domain and time mean vertical profiles of the different hydrometeors for the cleanest runs (Na = 20 cm−3): (a) cloud liquid water, (b) rain, (c) ice, (d) graupel, and (e) snow, as well as their response to increasing Na to 2000 cm−3 relative to the cleanest run for each SST (f–j). Here we only present the cleanest runs and the response of the most polluted runs for clarity. The full range of Na is presented in Figs. S3–S7.
In addition to resulting in an increase in ℒ, the warm rain inhibition under higher Na results in more super-cooled water (Carrió and Cotton, 2011; Chen et al., 2017, Fig. 3f), leading to higher production of snow (Chen et al., 2017, Fig. 3j), and drives higher riming rates, thus producing more graupel (Chen et al., 2017, Fig. 3i). We will get back to this observed trend for the explanation of the results presented in Fig. 10 below. In addition, cloud ice declines with Na consistently across SSTs (Fig. 3h). This trend is consistent with the decline in ℐ and CF (Fig. 2b and c, respectively) and will be discussed further below (Fig. 6d).
3.2 Response by cloud regimes
Figures 1–3 examine the bulk cloud and radiative properties in the domain. However, as previously demonstrated, the impact of aerosols on clouds is cloud-regime-dependent (Gryspeerdt and Stier, 2012; Christensen et al., 2016; Dagan and Stier, 2020b). Therefore, it is crucial to analyze the distribution of cloud regimes in our simulations and discern how each specific cloud regime responds to the increase in Na. In this paper we define the cloud regimes based on different bins of ℒ and ℐ. For that purpose, Fig. 4 presents 2D histograms of the cloud occurrence (CO) at the different bins of ℒ and ℐ, as well as the average total, shortwave, and longwave CRE at these different bins, all for the coldest case considered here (SST = 290 K) as an example. Figure 4 also illustrates that the CF in these RCE simulations is mostly dominated by anvil clouds (e.g., Wing et al., 2020), i.e., clouds with negligible ℒ and high (thick anvil clouds; denoted by marker 1 in Fig. 4a) or low (thin anvil clouds; denoted by marker 2 in Fig. 4a) ℐ. However, Fig. 4a also illustrates the existence of two other types of clouds in these RCE simulations – shallow clouds (high ℒ and low ℐ; denoted by marker 3 in Fig. 4a) and deep convective clouds (high ℒ and high ℐ; denoted by marker 4 in Fig. 4a). We note that the shallow and deep cloud regimes may also consist of other types of clouds, such as cumulus congestus in the deep regime and two-layer-cloud conditions with cirrus clouds with relatively low ℐ above shallow clouds. Furthermore, Fig. 4e and j present the radiative significance of each ℒ and ℐ bin (i.e., the CO times the CRE for each bin), which illustrates a strong heating by thin anvil clouds and cooling by other cloud regimes. Lastly, Fig. 4k–n illustrate the difference between simulations with the highest (2000 cm−3) and the lowest (20 cm−3) Na conditions. Specifically, Fig. 4k illustrates that an increase in Na drives thinning of the anvil clouds, i.e., an increase in the frequency of thin anvil clouds and a decrease in the frequency of thick anvil clouds. Additionally, Fig. 4l–n illustrate that with an increase in Na the CRE decreases for all ℒ and ℐ bins (and especially for medium–high ℒ and low ℐ; Fig. 4l), driven mostly by changes in the SW (Fig. 4m), with only minor changes in the LW (Fig. 4n). This SW difference with Na can be explained by the Twomey effect (Twomey, 1974).
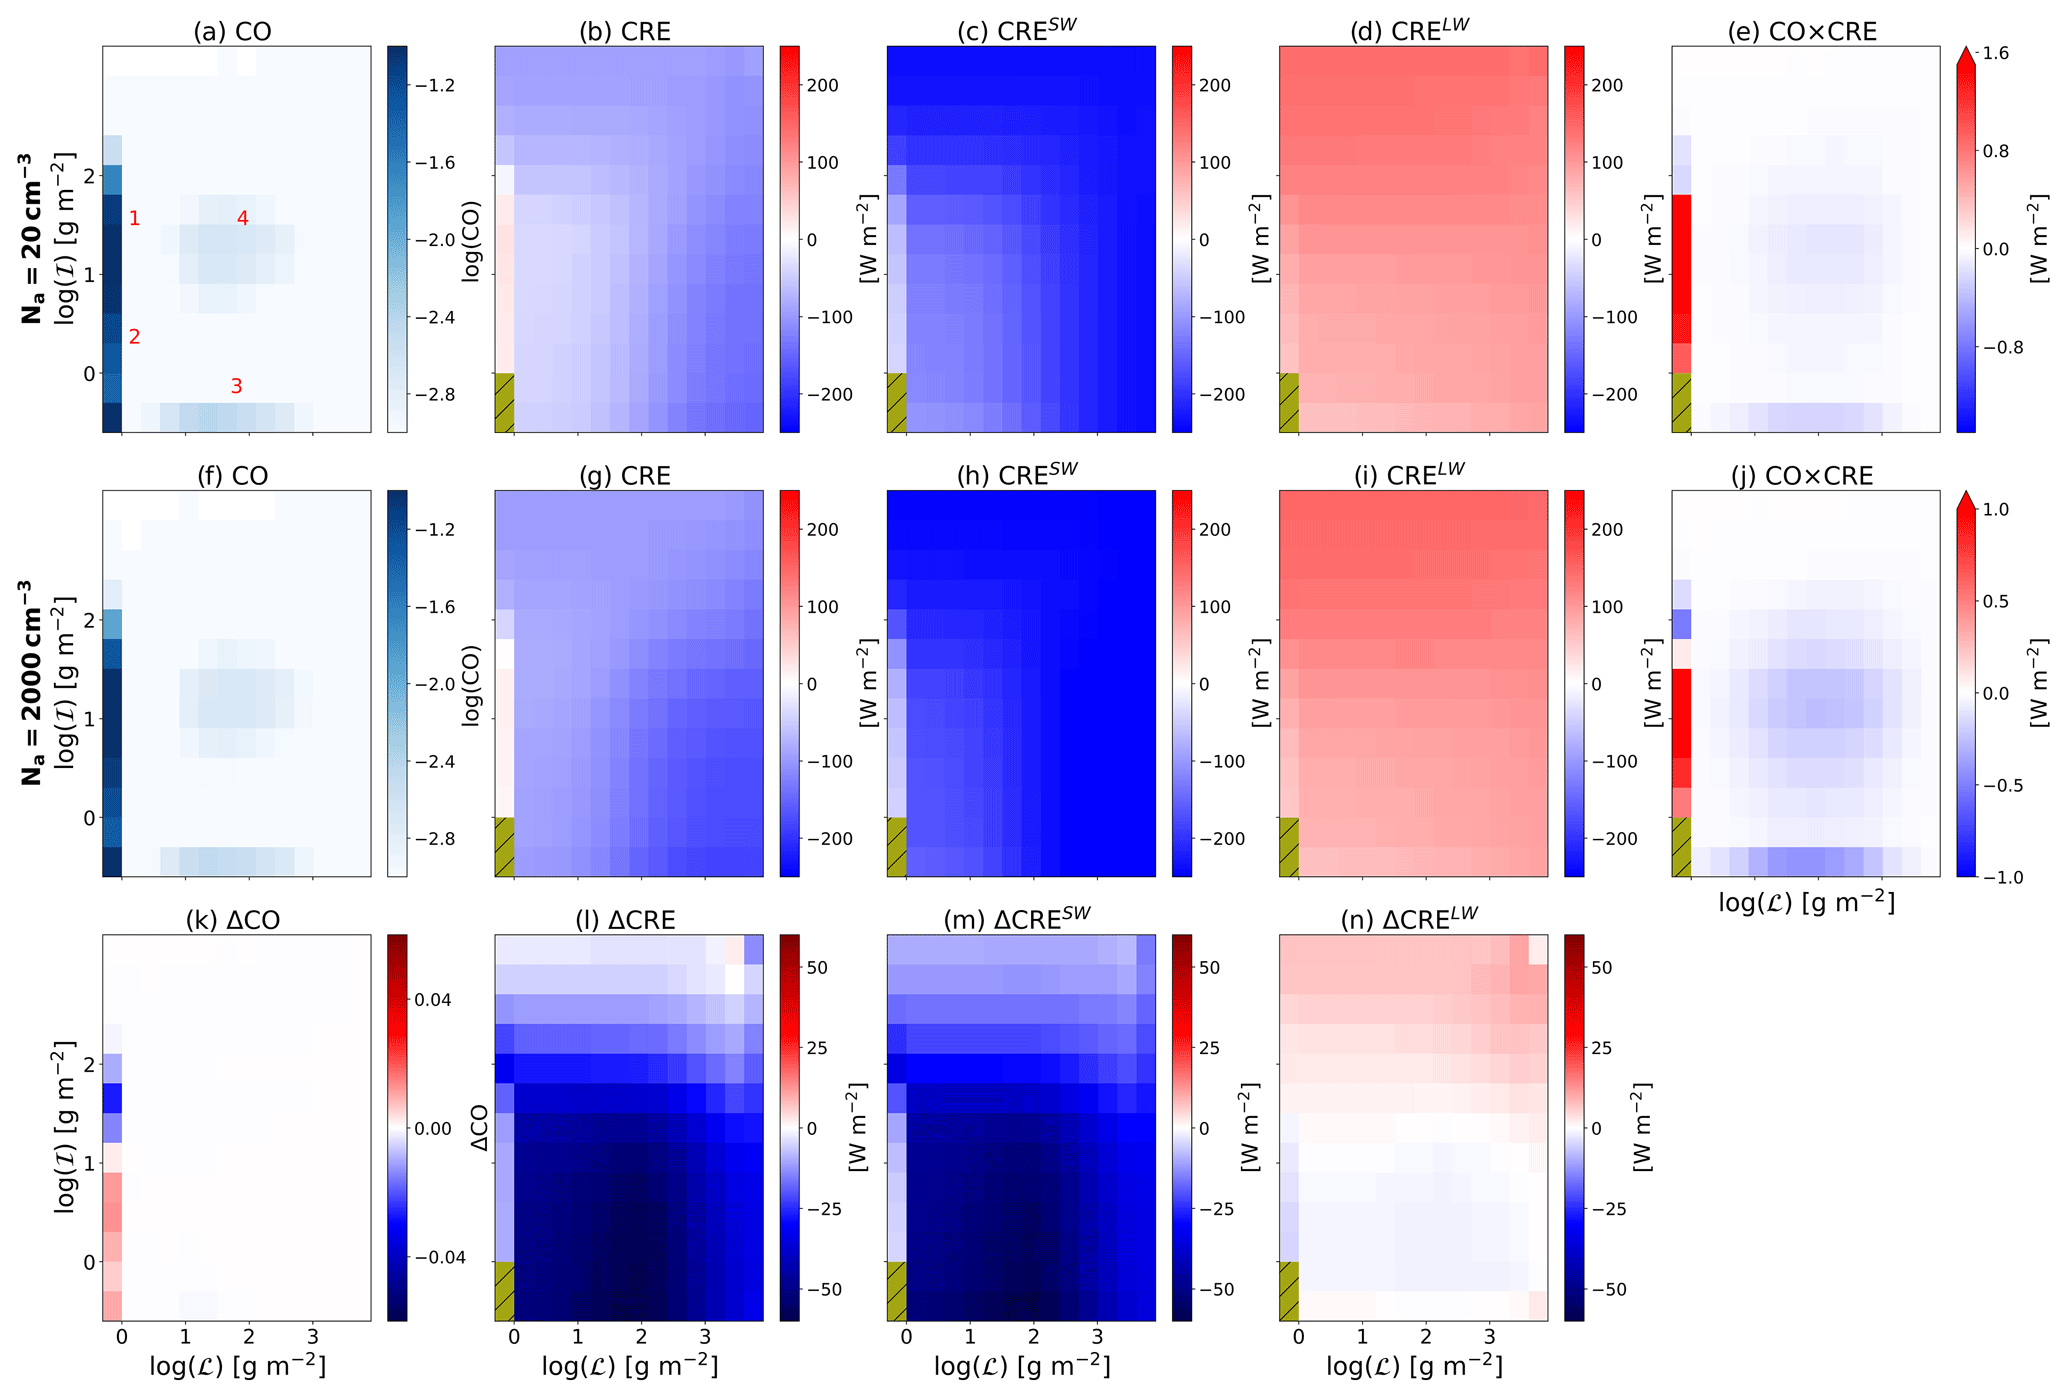
Figure 4Domain and time mean two-dimensional histograms of cloud occurrence (CO; a and f) at different bins of liquid water path (ℒ) and ice water path (ℐ) and the average total (b and g), shortwave (c and h), and longwave (d and i) cloud radiative effect (CRE) at these different bins. Furthermore, the radiative significance (CRE × CO) of each bin is illustrated in panels (e) and (j). These quantities are presented for two simulations using the lowest (Na = 20 cm−3; a–e) and the highest (Na = 2000 cm−3; f–j) Na, under SST = 290 K. Four different cloud regimes are marked in red in panel (a) – (1) thick anvil clouds, (2) thin anvil clouds, (3) shallow clouds, and (4) deep convective clouds – while the clear-sky regime is painted in tan. In addition, the difference between the highest and lowest Na conditions is presented in panels (k)–(n).
Following the method outlined in Sokol et al. (2024), we calculate the total regime's CF as the 2D integral over the regime's ℒ and ℐ bins as defined in Table S1 in the Supplement. Figure 5a illustrates a monotonic decrease across SSTs in thick anvil cloud fraction (CFthick) with increasing Na, consistently with the domain mean CF reduction (Figs. 2c and S8a). On the other hand, thin anvil cloud fraction (CFthin) mostly increases with Na, which is generally stronger for lower SSTs (Fig 5b), and illustrates a general thinning of anvil clouds. We note that the entire distribution of ℐ is shifted to lower values with Na, demonstrating this thinning of the anvil clouds (Figs. 4k, 2b, and 3h). A decrease in CFthick and thinning of the anvil clouds leads to more outgoing LW radiation out of the atmosphere and reduces ΔRLW, as can be seen in Fig. 1b. In addition, Fig. 5c presents the relative change in the shallow cloud fraction (CFshallow). It illustrates a rise in CFshallow with Na for low SST, while for high SST it illustrates a decrease in CFshallow with Na (the change in the shallow cloud fraction is not observed in Fig. 4k due to the dominance of ice clouds, which inflates the color-bar range). We note that although the relative changes in CFthick, CFthin, and CFshallow have similar magnitudes, the baseline (i.e., referring to the simulated value and not the difference between the most polluted and cleanest runs) CFthick and CFthin are an order of magnitude larger than CFshallow (Fig. S8). Lastly, deep cloud fraction (CFdeep) changes in a non-monotonic trend with Na (Fig. 5d), while also covering a small fraction of the domain (Fig. S8d).
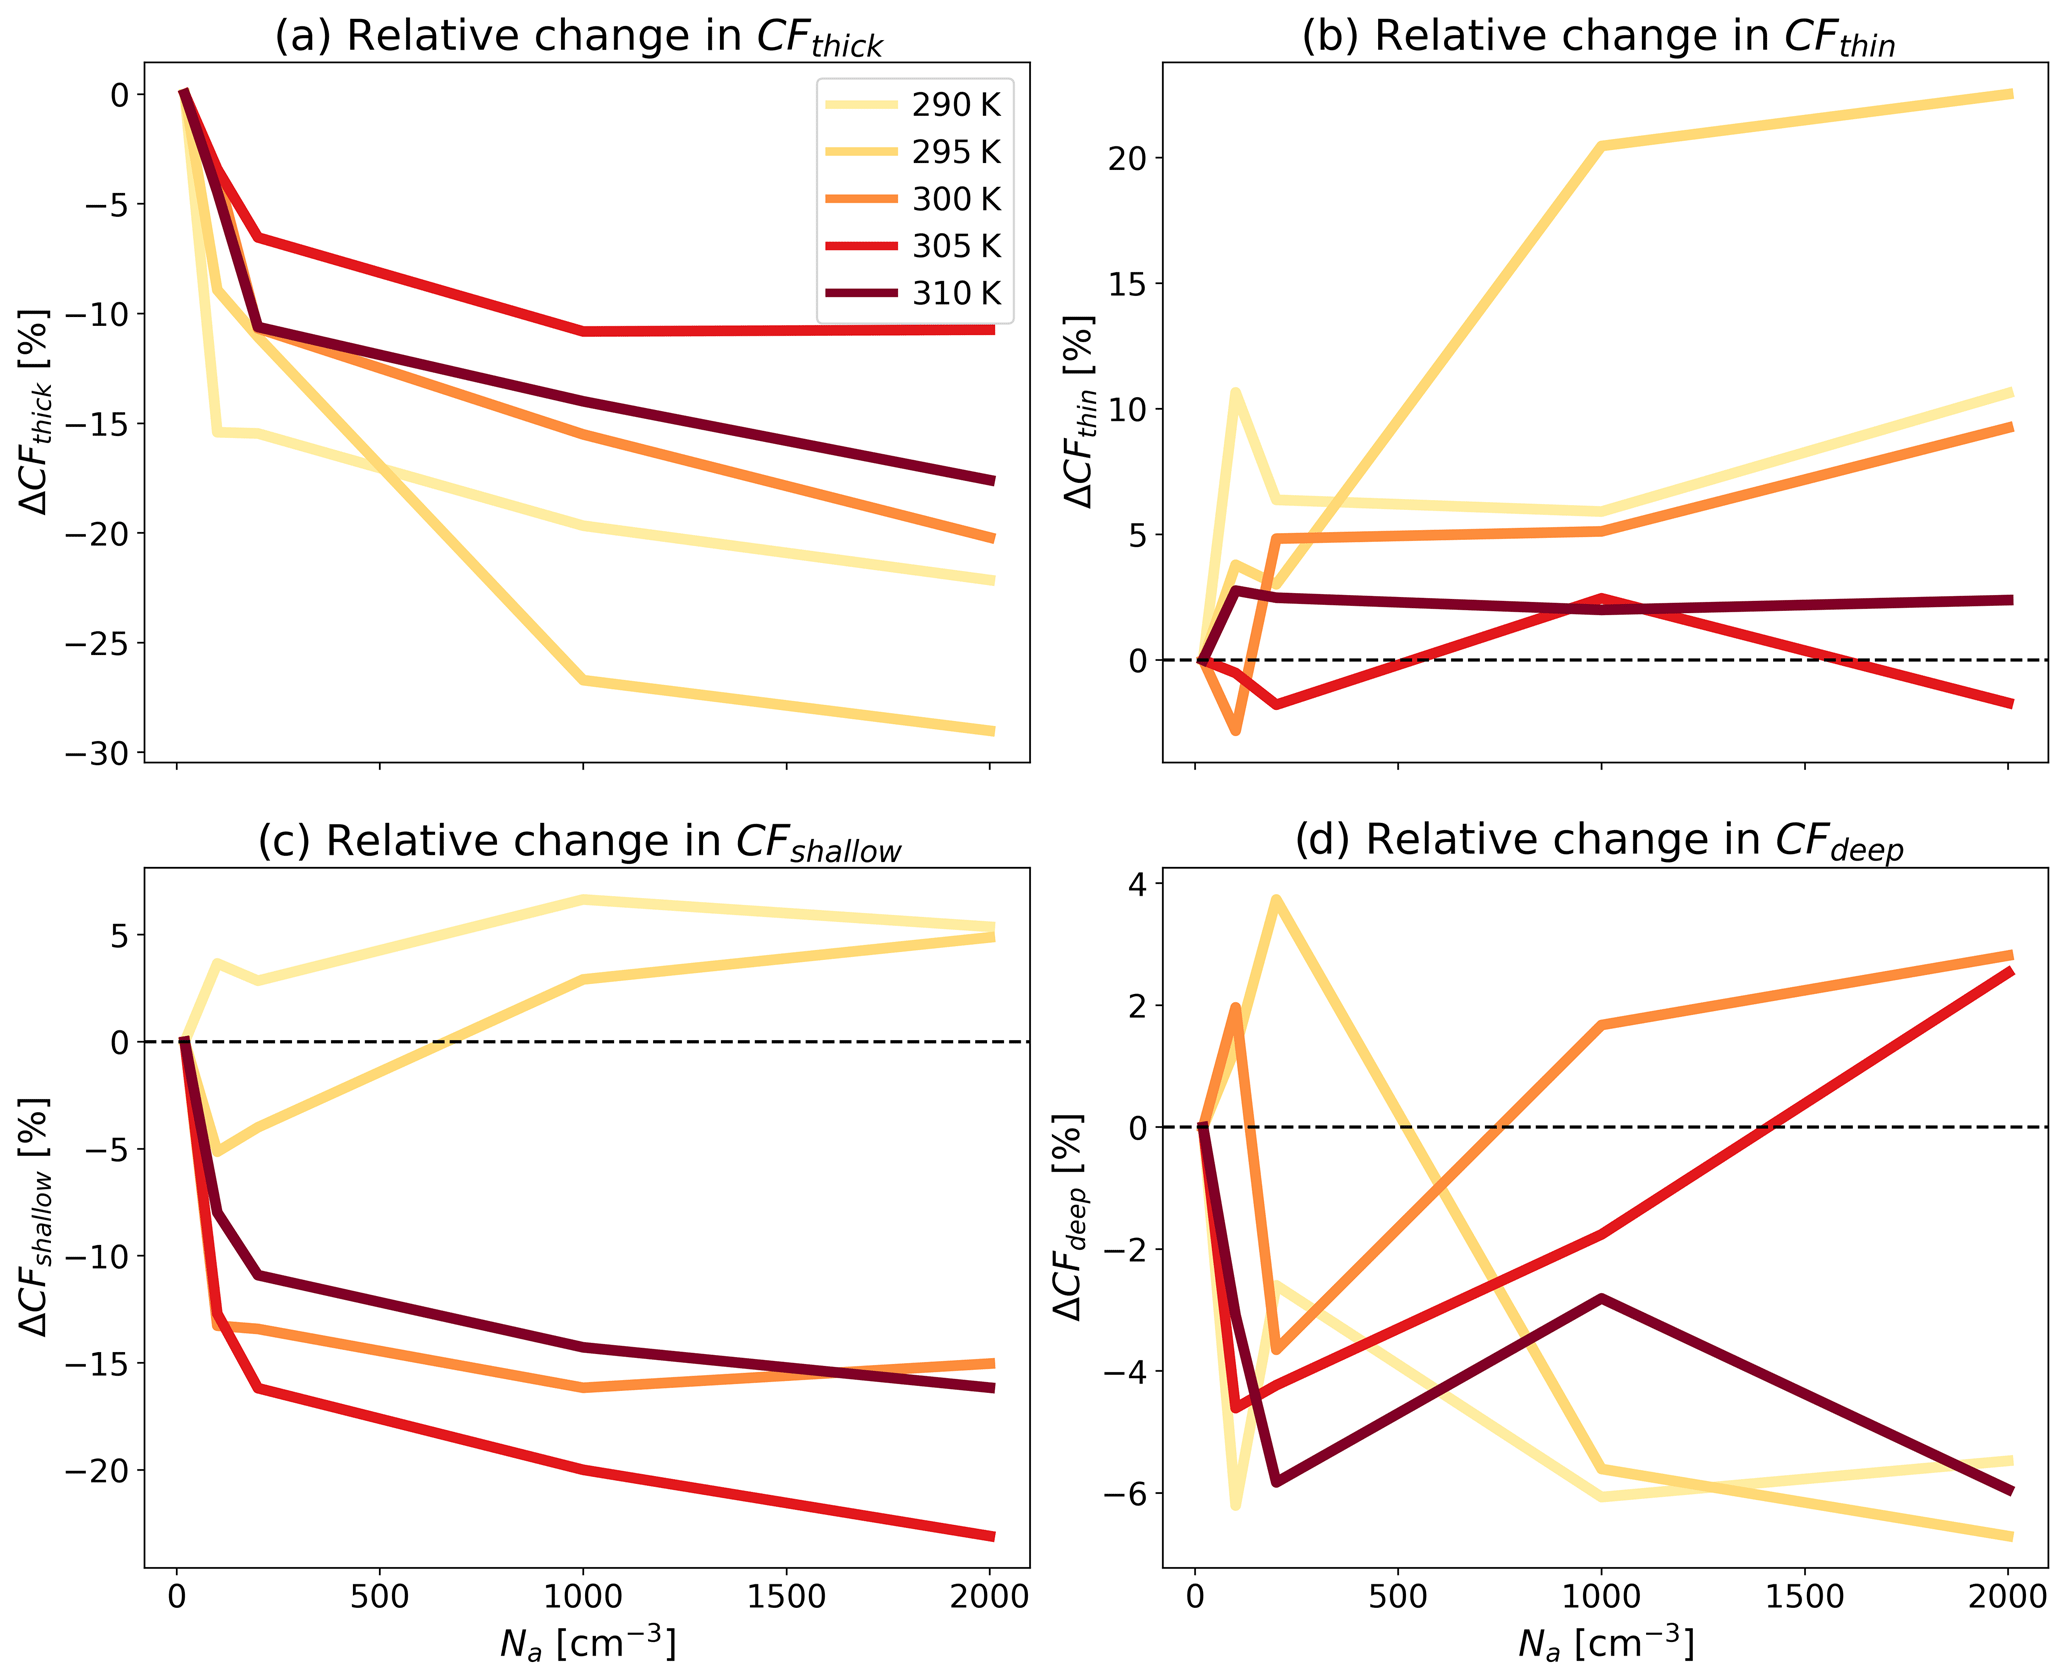
Figure 5The relative response of domain and time mean cloud fraction of thick ice (CFthick; a), thin ice (CFthin; b), and shallow (CFshallow; c) and deep convective clouds (CFdeep; d) to an increase in Na. The values are shown as a difference relative to the cleanest run (as denoted by the Δ sign) for each SST. The baseline cloud fractions are presented in Fig. S8.
Figure 4 illustrates that the response of the CRE to an increase in Na is driven both by changes in CO (Fig. 4k) and by changes in CRE for a given bin of ℒ and ℐ (Fig. 4l). Next, we aim to quantitatively separate these two effects. Thus, we write the total CRE as the 2D integral over the different bins of ℒ and ℐ of the CF times the CRE in each bin:
In the simulations presented here ΔCRE ≊ ΔR (Fig. 1). Thus, following a somewhat similar method to that presented in Bony et al. (2004) and Sokol et al. (2024), we decompose the mean ΔR into three contributions:
In this decomposition, the first term on the right-hand side, the “Opacity” term, represents changes in ΔR due to changes in the CRE per ℒ and ℐ bin, while the distribution of is held fixed; i.e., this term is calculated by multiplying Fig. 4a with Fig. 4l. This term represents changes in the cloud's opacity (reflectance and absorption) for a given liquid and ice amount (for example, by the Twomey effect). We note that this term could also be influenced by changes in clear-sky fluxes (Sokol et al., 2024). The second term on the right-hand side, the “Shift” term, represents changes in ΔR due to changes in the distribution of occurrence, while the CRE per ℒ and ℐ bin is held fixed; i.e., this term is calculated by multiplying Fig. 4b with Fig. 4k. The Shift term is contributed by both changes in the total CF and by a shift between the different cloud regimes (for example, thinning of ice clouds). The last term on the right-hand side, the nonlinear (“Nonlin”) term, represents the combined effect of changes in the CRE and the cloud occurrence in the different bins; i.e., this term is calculated by multiplying Fig. 4k with Fig. 4l.
Figure 6a–c illustrate the decomposition presented in Eq. (5) for the domain mean (i.e., integrating over all ℒ and ℐ bins, excluding the no-cloud regime as defined in Table S1) for all the different SSTs. Figure 6a–c also present the simulated response as presented in Fig. 1 (referred to as “Model”) and the sum over the three terms presented in Eq. (5) (referred to as “Total”). These panels illustrate that the Opacity term is the main driver for the decline in ΔR with Na (Fig. 6a), occurring mostly through the SW (Fig. 6b). In addition, Fig. 6 illustrates that the Opacity term is the main driver for the SST sensitivity, demonstrating a generally weaker response as the SST increases, consistent with Fig. 1c. The Shift term, on the other hand, demonstrates similar magnitudes but opposite sign in the SW and LW (Fig. 6b and c, respectively), with a weak SST dependence, thus making this term negligible in the total (Fig. 6a). The nonlinear term shows close to zero contributions to ΔR and its SW and LW components, thus justifying focusing on the linear decomposition in Eq. (5). We note that the decomposition results in a similar magnitude and SST trend to the model (comparing Total to Model in Fig. 6a–c), thus justifying its use. However, we also note a slight overestimation of ΔR using the decomposition at the lower SSTs (Fig. 6a).
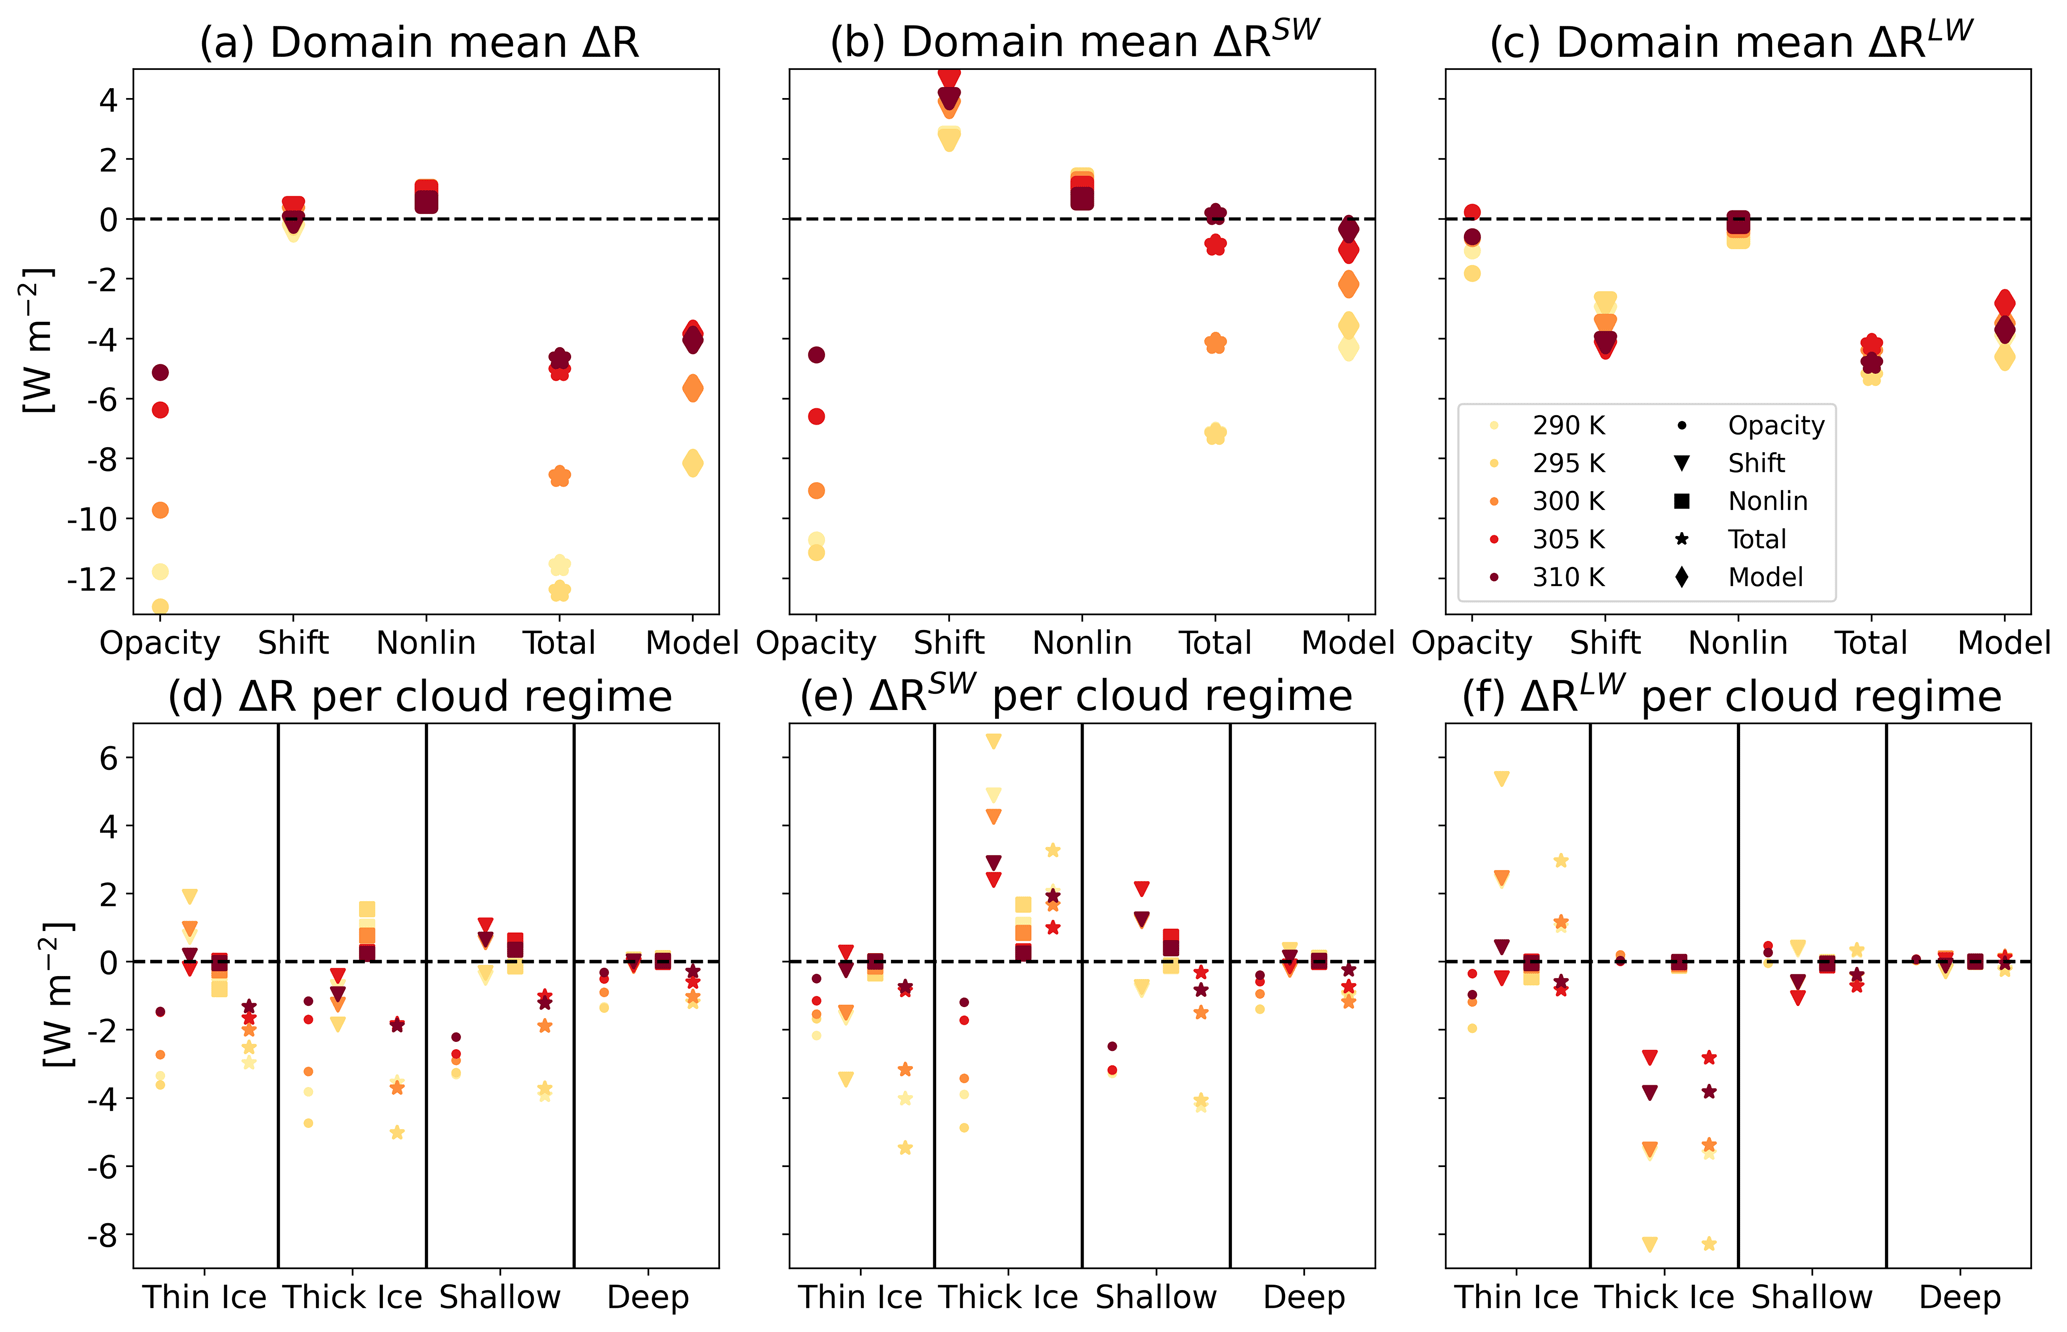
Figure 6The time mean ΔR, ΔRSW, and ΔRLW due to an increase in Na for the domain mean (a–c) and per cloud regime (d–f). The values shown are decomposed to the three terms shown in Eq. (5) (Opacity, Shift and Nonlin), and the increase in Na is represented by the difference between the most polluted run (Na = 2000 cm−3) and the cleanest run (Na = 20 cm−3) for each SST.
In addition to the domain mean, ΔR is decomposed per cloud regime by integrating over the relevant part of the ℒ and ℐ phase space (Fig. 6d–f and Table S1). These panels illustrate that deep convective clouds have negligible contributions to ΔR, ΔRSW, and ΔRLW, mostly due to their small coverage (Figs. 4a and S8d). Therefore, most of the contribution to ΔR comes from anvil cloud and shallow cloud changes.
The thick and thin ice clouds' response drives a negative net total ΔR, which is stronger under lower SSTs (Fig. 6d). This trend is dominated by the Opacity term, which is driven almost entirely by the SW part of the spectrum (Fig. 6e). This term represents an increase in the reflectivity of the ice clouds for a given ℒ and ℐ distribution and can be explained by a similar mechanism to the Twomey effect but for ice particles. We note that this result might differ under coupling of Na to ice nucleating particles, which is not considered here. This term becomes stronger (more negative) with a reduction in SST, especially for thick clouds, due to an increase in the baseline CF of these clouds (Fig. S8). The Shift term in thick ice clouds is strongly positive in the SW (Fig. 6e) and negative in the LW (Fig. 6f) due to the thinning of the ice clouds and the general reduction of the occurrence of these thick clouds (Figs. 4k and 5a). Thin ice clouds exhibit an opposite trend to thick clouds in the Shift term due to them increasing in CO with an increase in Na (Figs. 4k and 5b). However, the combined net effect of thick and thin ice clouds on the Shift term is low due to them being similar in magnitude but opposite in sign (Fig. 6d).
Similarly to the ice clouds' response, the shallow clouds' response also drives a negative net total ΔR, which becomes stronger under lower SSTs (Fig. 6d). As expected, changes in shallow clouds have a small impact in the LW (Fig. 6f) but a significant effect in the SW (Fig. 6e). As in ice clouds, the negative net total ΔR in the shallow cloud case is driven mostly by the Opacity term, which in this case can be explained by the classical Twomey effect. Unlike ice clouds, the Opacity term demonstrates a low sensitivity to the underlying SST, but the shallow clouds' Shift term exhibits strong SST sensitivity. This term, while having a relatively small magnitude, is negative under low SSTs and positive under high SSTs, consistent with the relative change in CFshallow, which is positive under low SSTs and negative under high SSTs (Fig. 5c). The contrasting response of CFshallow to Na under the different SSTs can be explained by warm rain inhibition at varying depths of warm layers. As was noted above, with an increase in SST, the warm layer depth increases, while an increase in Na acts to push warm rain formation to higher levels (Rosenfeld, 2000; Freud and Rosenfeld, 2012; Heikenfeld et al., 2019). Thus, under lower SSTs, for which the warm layer depth is relatively shallow, an increase in Na can inhibit warm rain (see Fig. 3g) and hence lead to an increase in CFshallow. In contrast, under higher SSTs, for which the warm layer depth is relatively deep, an increase in Na drives warm rain inhibition at the lower levels, which is compensated for at higher levels of the warm section (Fig. 3g), thus eliminating the positive effect on CFshallow.
The combined response of ice and shallow clouds to an increase in Na, as explained in this section, can explain the reduction in ΔRLW with Na, the reduction in ΔRSW with Na and its SST sensitivity, and hence the reduction in ΔR with Na and its SST sensitivity (Fig. 1).
3.3 Mechanism behind the ice cloud fraction's response to Na
As was noted above, a decrease in CFthick with Na (Fig. 5a) leads to more outgoing LW radiation out of the atmosphere (Fig. 1b). In order to understand the reduction in CFthick and the ice cloud thinning with Na, next we examine the sensitivity of the maximum (in the vertical dimension – see Fig. 7d) of the radiatively driven mass divergence (Bony et al., 2016, Dr) to Na under the different SSTs (Fig. 8). Figure 8a illustrates that the CFthick is strongly correlated with Dr (Pearson correlation coefficient ≈ 0.93 with p value < 0.01). While the general decrease in Dr with SST has previously been demonstrated (Bony et al., 2016), here we show that for a given SST, Dr generally decreases with Na (Fig. 8b). The general reduction in Dr with Na drives a general reduction in CFthick with Na for a given SST (Figs. 5a and 8c). This reduction in Dr and CFthick with Na explains the reduction in ℐ and cloud ice (Figs. 2b and 3h, respectively) with Na, which in turn can explain the reduction in ΔRLW (Fig. 1b).
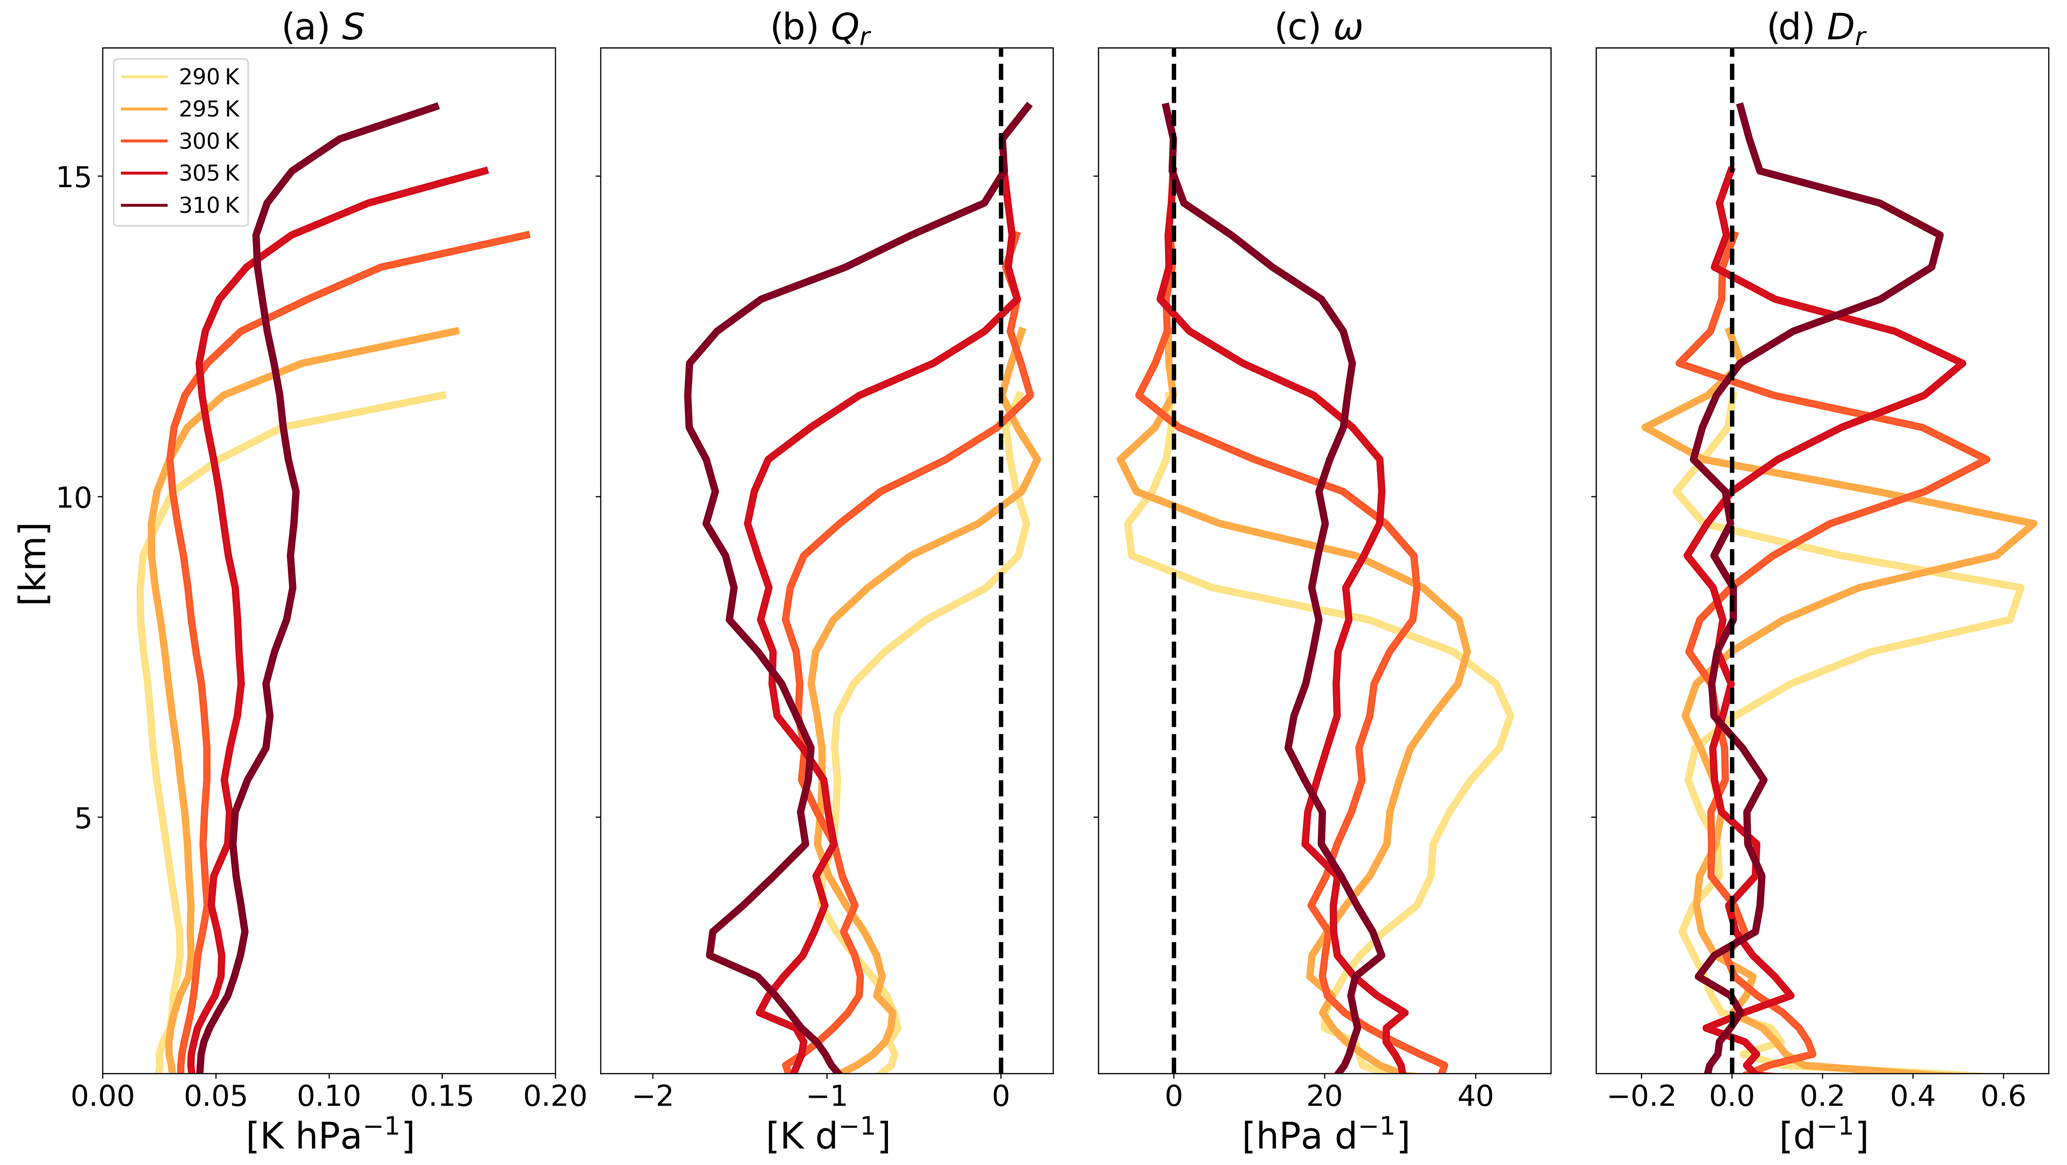
Figure 7Domain and time mean vertical profiles of the (a) static stability, S; (b) radiative cooling rate, Qr; (c) vertical pressure velocity, ω; and (d) radiatively driven mass divergence, Dr, for the different simulations conducted under Na = 20 cm−3 and different SST conditions.
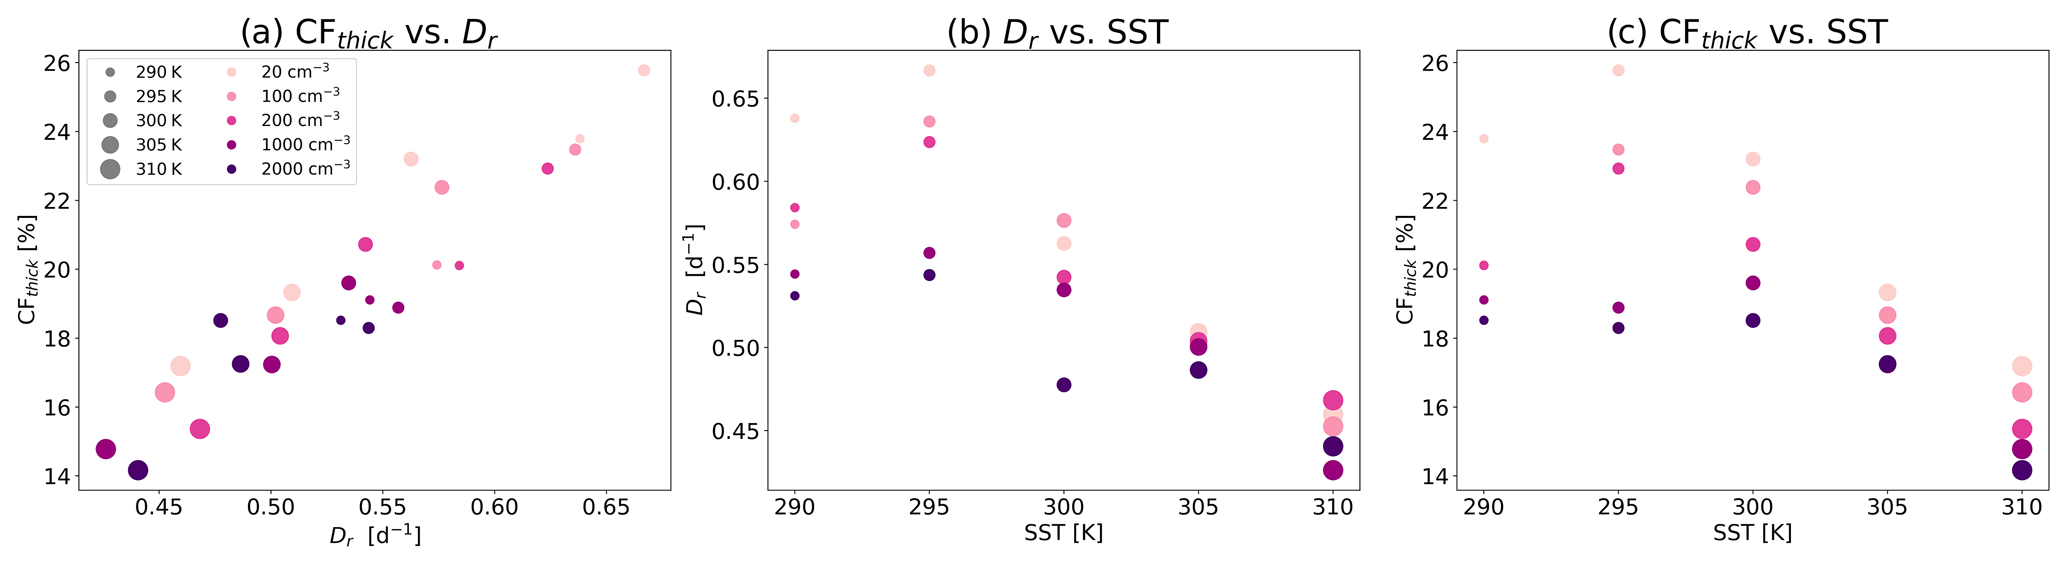
Figure 8Changes in domain and time mean thick ice cloud fraction (CFthick) with Dr for the different simulations conducted under different Na and SST (a), changes in Dr with SST (b), and changes in CFthick with SST (c).
In addition to modifying Dr, an increase in Na also affects the lifetime of anvil clouds by perturbing the sedimentation rate (Grabowski and Morrison, 2016). Specifically, high-aerosol conditions lead to smaller ice crystals, which sediment slower from the cloud (i.e., the sedimentation flux becomes less negative; Fig. S13), thus acting to increase CFthick. However, Fig. 5a shows a decrease in CFthick with Na in our simulations, thus making this only a secondary effect compared with the effect of Dr (agreeing with previous results regarding the effect of warming on anvil clouds; Beydoun et al., 2021).
A reduction in Dr with Na could be attributed to changes in Qr (the radiative cooling rate; Fig. 7b) and/or in the static stability (S; Fig. 7a). Thus, in order to understand the reasons behind the decrease in Dr with Na (for a given SST), in Fig. 9 we calculate the change in Dr with Na for the different SSTs, assuming that either Qr or S are held fixed at the value it attains at a reference Na of 200 cm−3 for each SST. This calculation is similar to that presented in Fig. 4 of Bony et al. (2016) but for changes in Na instead of changes in SST. Figure 9 illustrates that the reduction of Dr with an increase in Na can mostly be attributed to changes in S. This result is illustrated by the consistent reduction in Dr with Na for all SSTs when only S (or the temperature, T) is varied. However, when only Qr is varied, the trend of Dr with Na is not consistent across the different SSTs, and for some of the SSTs, the trend is not monotonic.
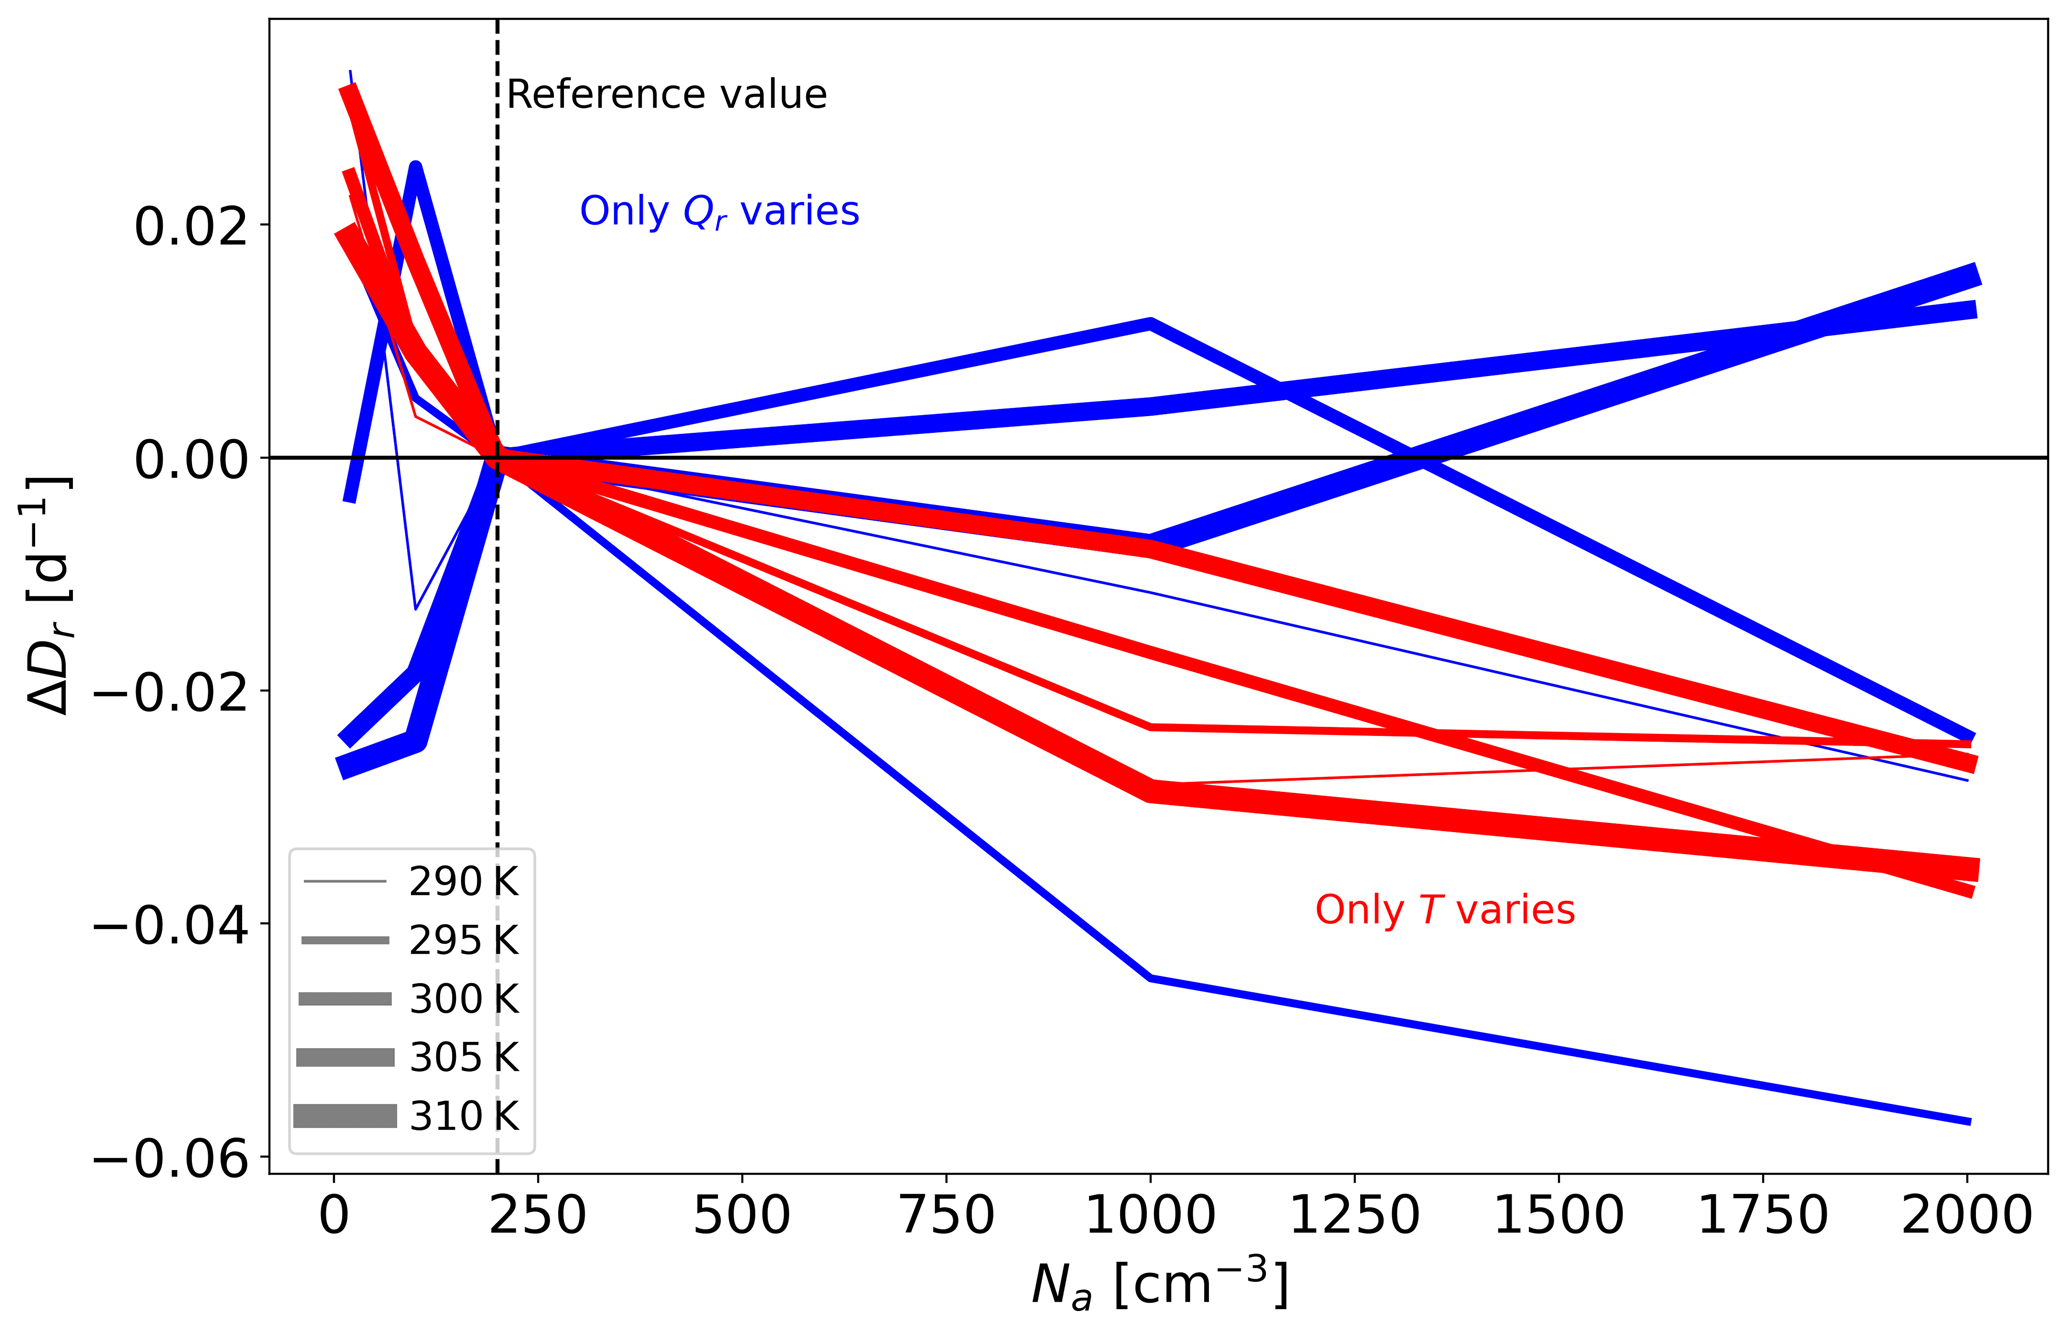
Figure 9Relationship between the radiatively driven divergence (Dr) and Na, diagnosed by assuming that only the temperature profile (T, red curves) or the clear-sky radiative cooling profile (Qr, blue curves) varies with Na. The reference for the T and Qr represents the simulations conducted under Na = 200 cm−3 (dashed vertical line) for each SST.
The domain and time mean temperature vertical profiles for the different simulations and their response to an increase in Na are presented in Fig. 10. This figure illustrates that, for a given SST, an increase in Na drives strong warming of the upper troposphere and in some cases a weak cooling of the lower troposphere. This trend demonstrates an increase in S with Na, which in turn explains the reduction in the anvil cloud fraction.
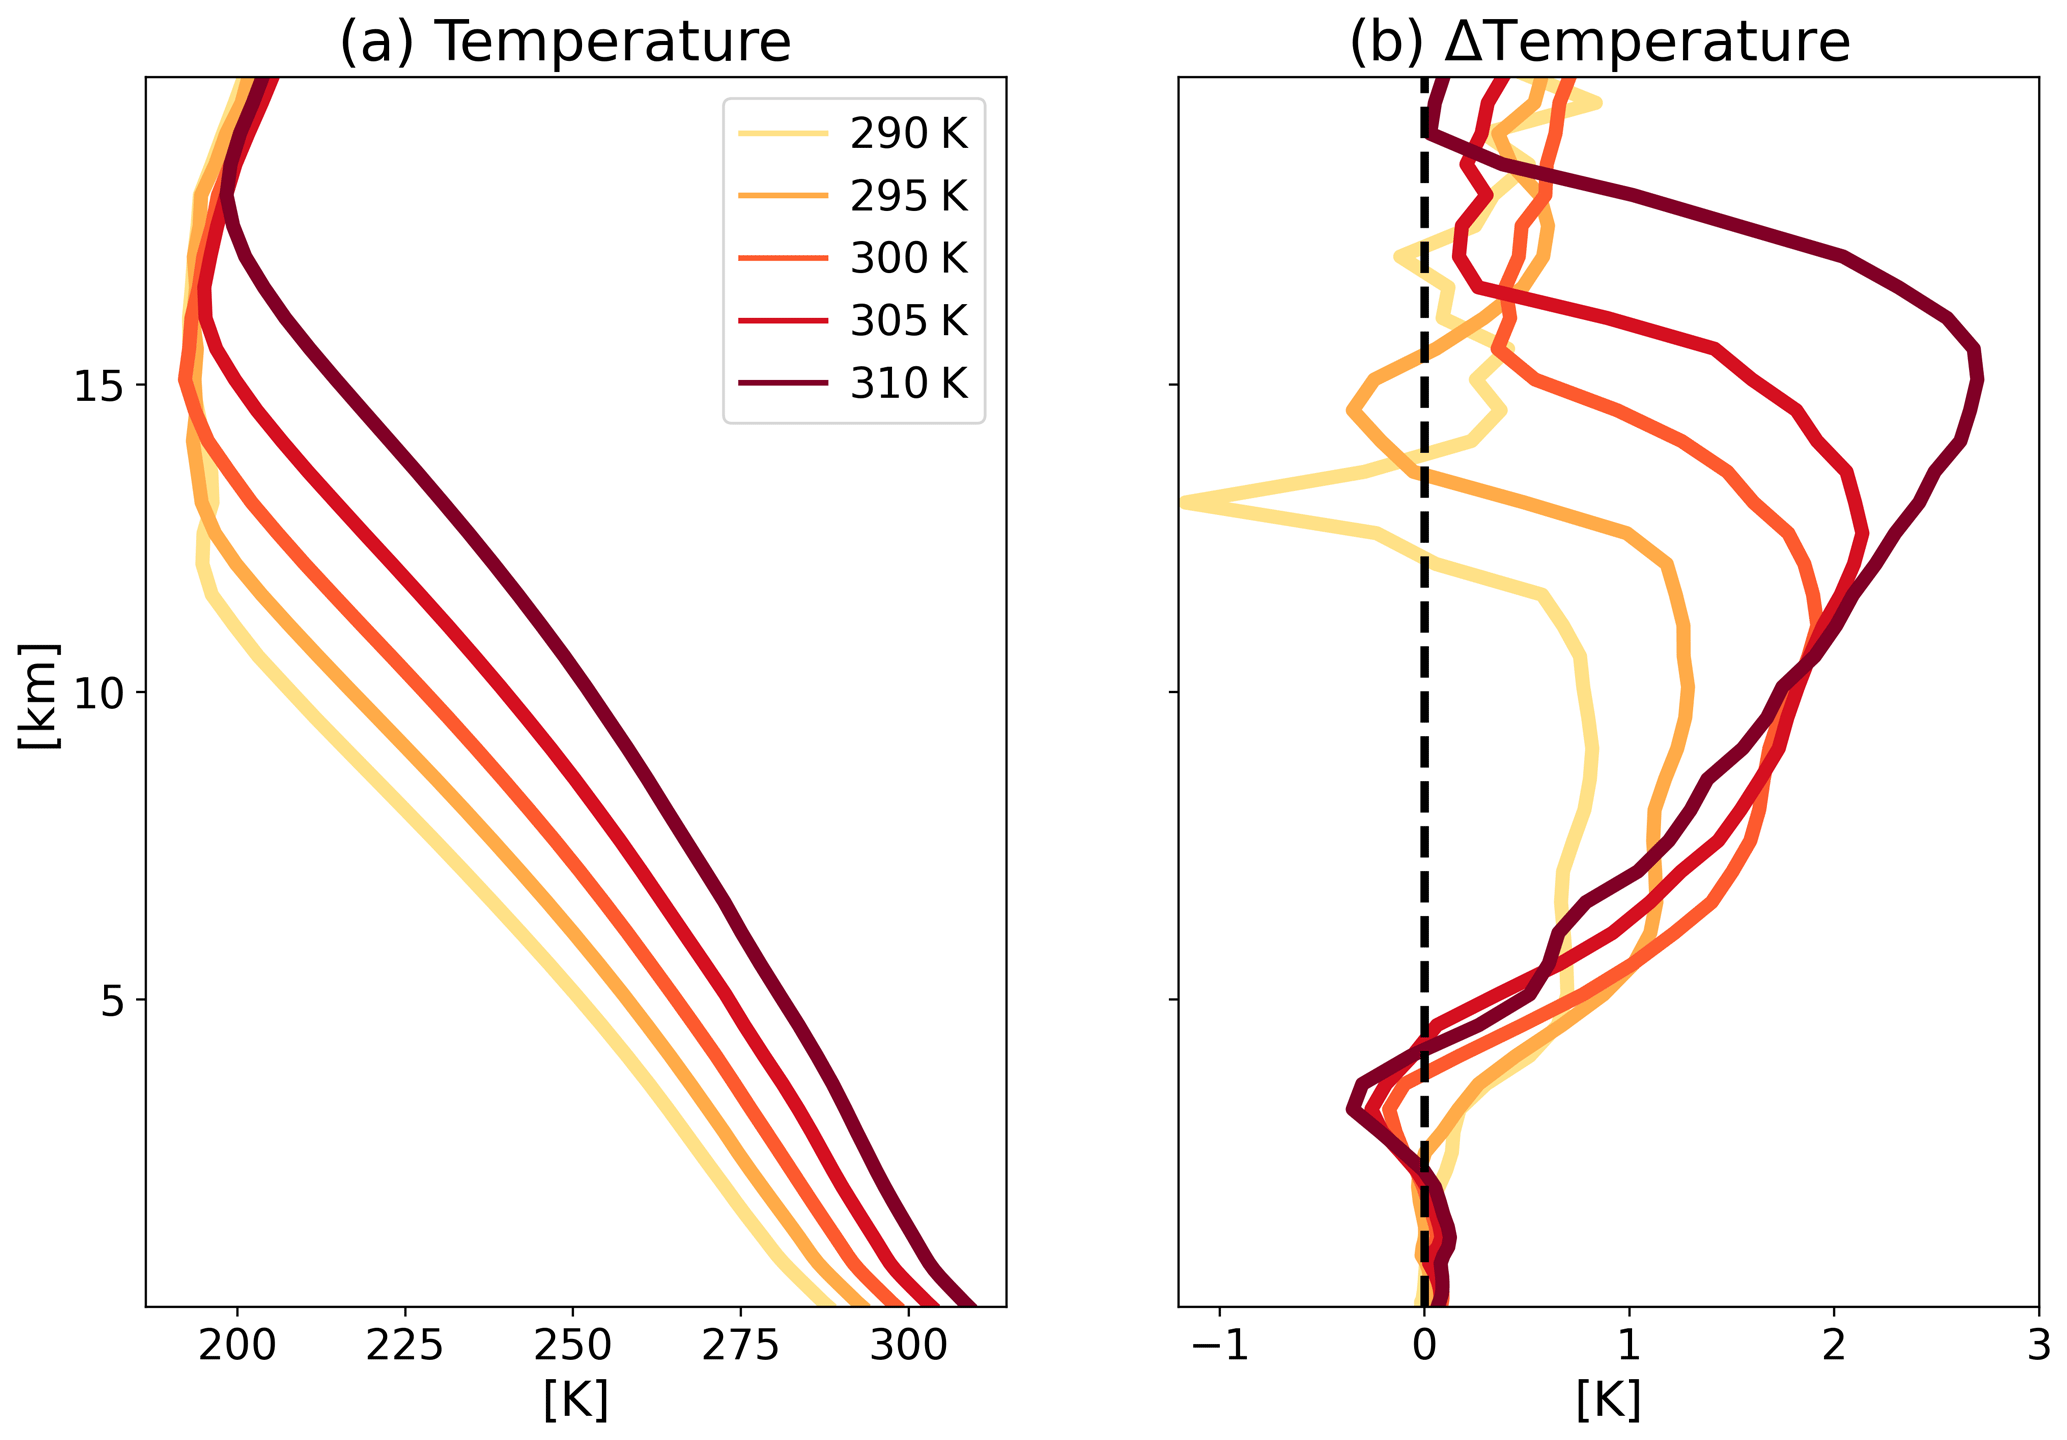
Figure 10Domain and time mean vertical profiles of temperature of the cleanest runs (Na = 20 cm−3; a) and their response to increasing Na to 2000 cm−3 relative to the cleanest run for each SST (b). Here we only present the cleanest runs and the response of the most polluted runs for clarity. The full range of Na is presented in Fig. S9.
A remaining open question concerns the reasons behind the strong warming of the upper troposphere (or the increase in S) with Na. In the model, a central prognostic variable is the liquid/ice water static energy (hL). The hL tendency equation contains five terms: advection (adv), radiation (rad), latent heating (lat, includes latent heating from freezing), turbulence, and large-scale tendency (Khairoutdinov and Randall, 2003). In an RCE configuration, by definition, the large-scale tendency is set to zero, thus having no effect here. In addition, in our simulations the turbulence term is negligible compared to the rest of the terms. Hence, in Fig. 11 we present vertical profiles of the domain and time mean due to latent heating, advection, and radiation of the different simulations. Figure 11 illustrates that under equilibrium conditions, the latent heating acts to heat the upper troposphere; advection acts to cool it, although by a smaller magnitude; and radiation acts to weakly cool the entire troposphere almost uniformly. This trend is enhanced with an increase in Na (Fig. 11d–f), suggesting that the increase in temperature of the upper troposphere with Na is mostly driven by a stronger latent heat release, which is consistent with the higher production rates of graupel and snow with Na (Fig. 3i and j). Graupel and snow, unlike small ice crystals, efficiently sediment out of the cold portion of the cloud, thus leaving behind the heat they released in their formation, resulting in a net warming effect. In addition, at higher altitudes, the air density drops. Thus, a given amount of latent heating will cause a larger temperature change at higher altitudes than low altitudes (Gasparini et al., 2024). Therefore, higher production of graupel and snow with Na is identified as the main driver of the observed temperature increase in the upper troposphere.
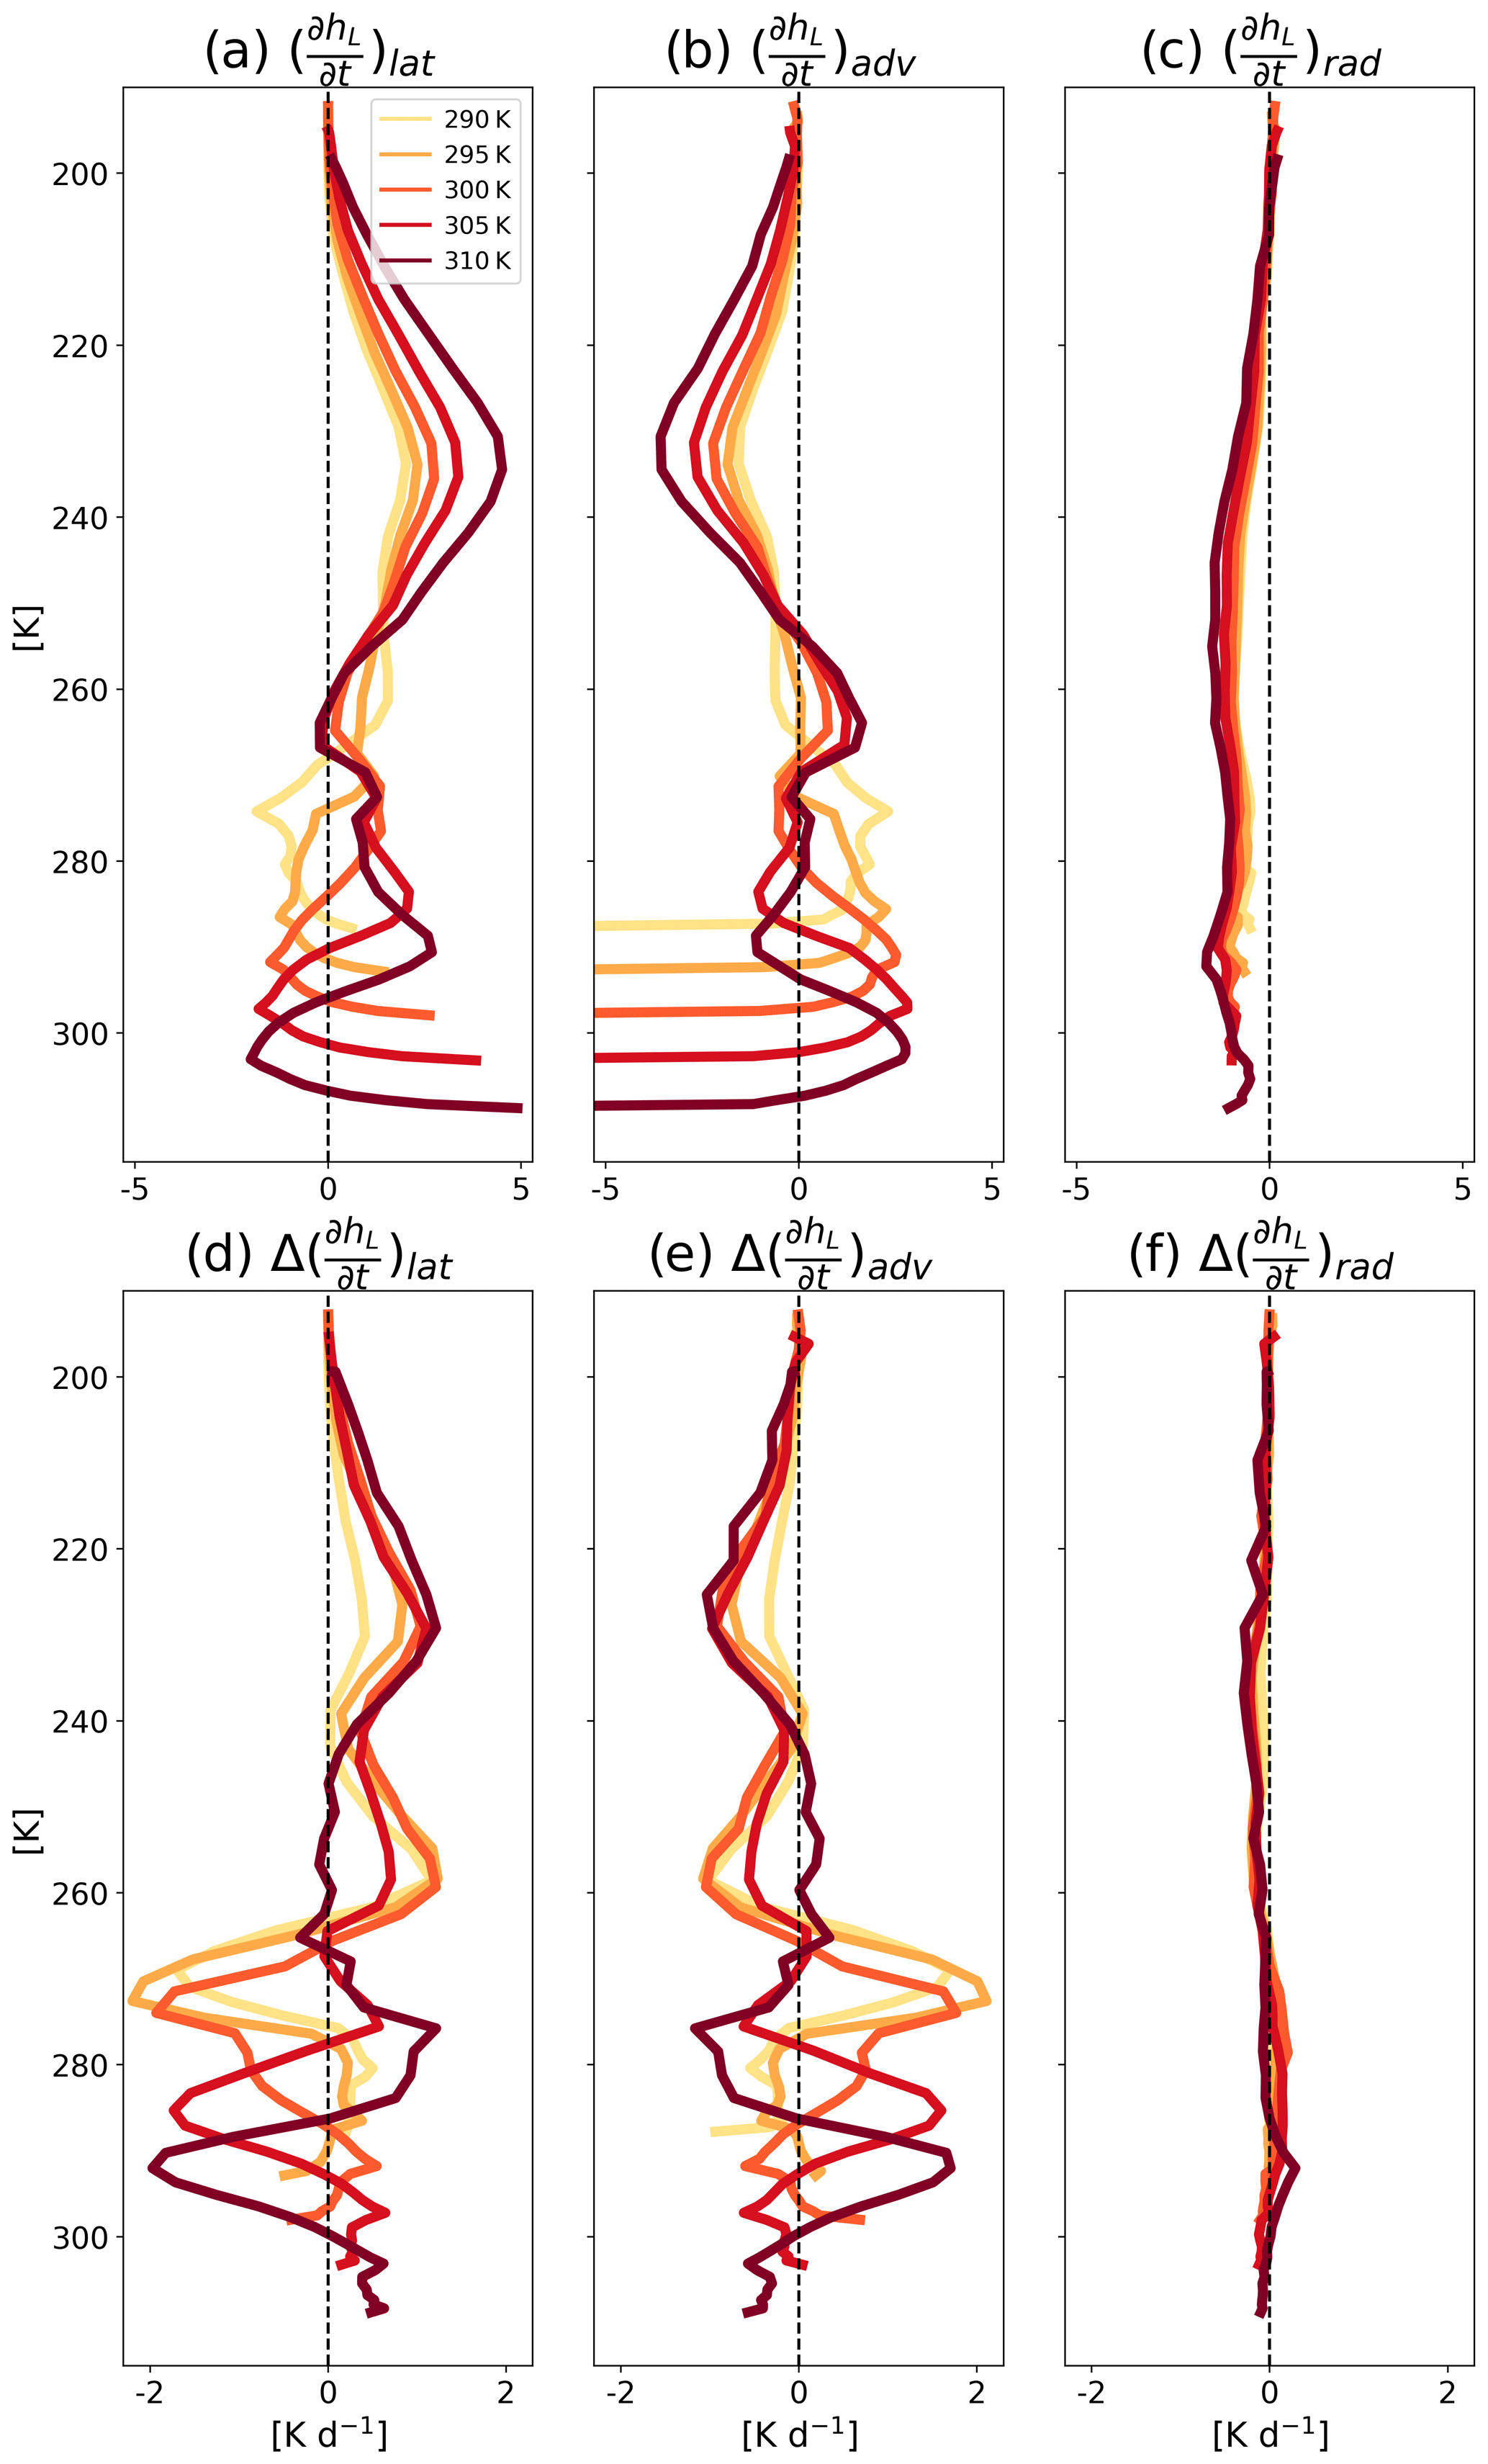
Figure 11Vertical profiles of the domain and time mean tendency of the liquid/ice water static energy (hL) for the cleanest runs (Na = 20 cm−3) due to (a) latent heating, (b) advection, and (c) radiation in the different simulations conducted under different SST and Na. Panels (d)–(f) present the response of these terms to increasing Na to 2000 cm−3 relative to the cleanest run for each SST. Here we only present the cleanest runs and the response of the most polluted runs for clarity. The full range of Na is presented in Figs. S10–S12.
3.4 Examining the surface precipitation response to aerosol perturbation using the atmospheric energy budget
Next, we examine the response of the surface precipitation to Na under the different SSTs. Figure 12a illustrates an increase in surface precipitation (in energy units, LΔSP, where L is the latent heat of vaporization and SP is the surface precipitation) with Na across SSTs. In order to understand this increase, we use the atmospheric energy budget perspective (Muller and O'Gorman, 2011; Dagan and Stier, 2020a; Williams et al., 2023) and decompose the changes in LΔSP to changes in LW atmospheric radiative cooling (ΔLWC, calculated as the TOA's LW radiation flux minus the surface's net LW radiation flux; Fig. 12b), changes in surface sensible heat flux (ΔSHF; Fig. 12c), and changes in atmospheric SW absorption (ΔSWA, calculated as the TOA's net SW radiation flux minus the surface's net SW radiation flux; Fig. 12d), following the notations of Williams et al. (2023):
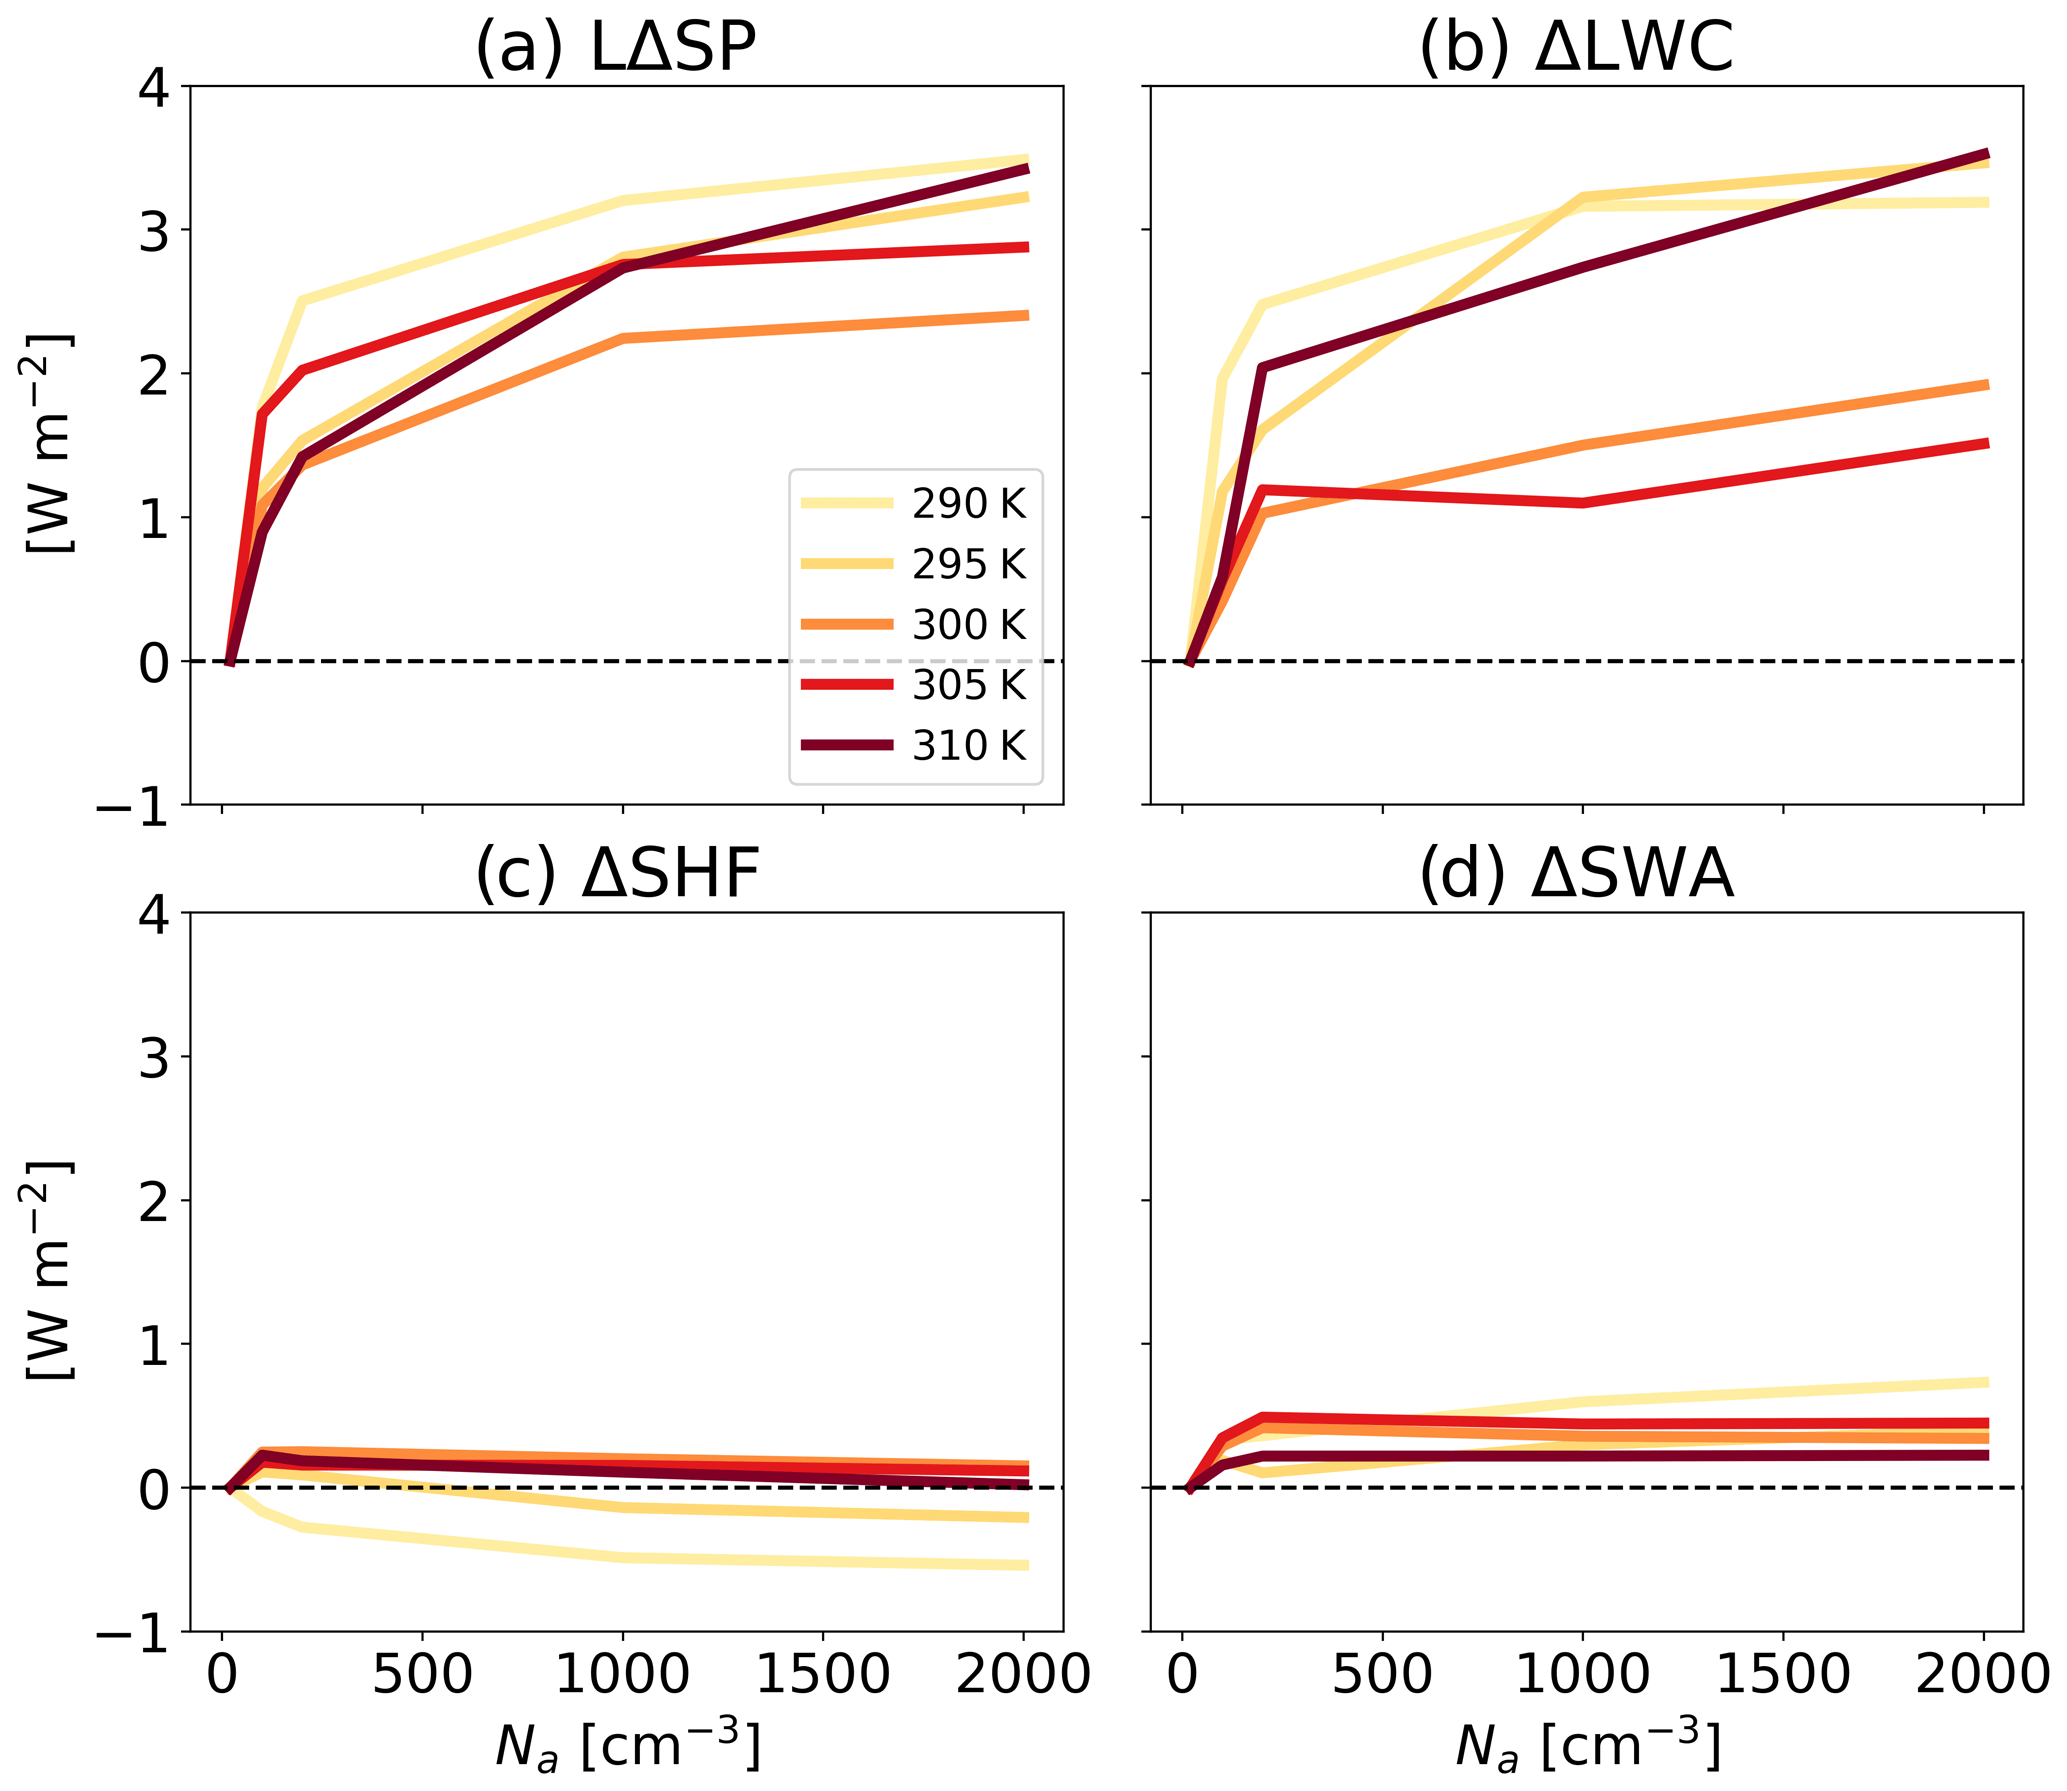
Figure 12The response of domain and time mean surface precipitation (LΔSP; a), longwave atmospheric radiative cooling (ΔLWC; b), surface sensible heat flux (ΔSHF; c), and atmospheric shortwave absorption (ΔSWA; d) to an increase in Na relative to the cleanest run for each SST (Na = 20 cm−3).
We note that Eq. (6) holds under equilibrium conditions, as simulated here (Muller and O'Gorman, 2011; Dagan and Stier, 2020a). Following the notations of Eq. (6), Fig. 12a can be reconstructed by summing Fig. 12b–d. Hence, we note that the increase in LΔSP could mostly be explained by enhanced ΔLWC (Fig. 12b), while changes in ΔSWA produce only a small positive contribution, and changes in ΔSHF present a small contribution and a non-consistent contribution across SSTs. The enhanced ΔLWC with Na is driven by clear-sky radiative cooling, which is in turn driven by the decreased CFthick with Na across SSTs, as illustrated in Fig. 5a. The enhanced ΔLWC is also consistent with the reduction in ΔRLW presented in Fig. 1b. These results suggest that under equilibrium conditions, higher Na concentrations drive higher LW cooling rates of the atmospheric column, which supports the production of more precipitation.
Under anthropogenically driven climate change, Earth's energy budget is influenced by changes in the atmospheric composition, including anthropogenic aerosols, which could affect the cloud radiative properties. In addition, changes in SST could drive changes in the cloud radiative properties as well, which can in turn further change the SST. In this study, we investigate the combined impact of SST and aerosol concentration (Na) on cloud properties in the framework of high-resolution radiative–convective-equilibrium (RCE) simulations.
Using these idealized RCE simulations, we demonstrate that increasing Na, which does not directly interact with radiation here, decreases top-of-atmosphere (TOA) energy gain across all SSTs, in the longwave (LW) and shortwave (SW) parts of the spectrum, as a result of changes in the cloud radiative effect. We also show that this effect is stronger under lower SSTs, mostly in the SW, which is consistent with the stronger increase in liquid water path (ℒ) with Na under lower SSTs. On the other hand, the TOA outgoing LW radiation increases similarly across SSTs, consistent with a decrease in ice water path (ℐ). Lastly, the cloud fraction (CF) response to an increase in Na is negative, although it is neither monotonic nor consistent across different SSTs.
To better understand these trends, we decompose the response of TOA energy gain (ΔR) to different cloud regimes (based on 2D histograms of ℒ and ℐ) and to contributions from changes in the cloud opacity (the Opacity term) and in cloud occurrence (the Shift term) based on a linear decomposition. This decomposition illustrates that most of ΔR's negative trend and its SST sensitivity is driven by the Opacity term, which in turn is driven by the SW part of the spectrum. This trend can be explained by the Twomey effect; i.e, for a given ℒ and ℐ the clouds become more reflective with a rise in Na. The Twomey effect is proportional to the baseline CF, thus becoming stronger under lower SST for which the baseline CF is higher. The Shift term, on the other hand, illustrates a compensation between a positive response in the SW and a negative response in the LW, thus producing a small net effect. Furthermore, we decompose ΔR and its components per cloud regime, which illustrates that ice and shallow clouds are the main drivers behind the Opacity term and Shift term trends. Lastly, this cloud regime decomposition illustrates that, together with the general reduction in CF and specifically in thick ice cloud fraction (CFthick), an increase in Na leads to the thinning of the ice clouds.
As has been previously reported (Bony et al., 2016), we observe a strong correlation between the ice CF, and specifically CFthick, and the maximum radiatively driven mass divergence at the upper troposphere (Dr). We demonstrate that Dr generally decreases with Na for a given SST, consistent with the reduction in CFthick and the shift of the anvil clouds toward thinner clouds (Fig. 4). The reduction in Dr with an increase in Na is shown here to be driven by an increase in static stability at the upper troposphere under more polluted conditions (Fig. 9). The decrease in anvil cloud fraction with Na across SSTs also leads to a decline in ℐ, causing an increase in the outgoing LW radiation, i.e., decreasing ΔRLW. This reduction in ΔRLW at the TOA directly increases LW cooling of the atmospheric column (ΔLWC), which, in turn, is identified as the main driver of enhanced surface precipitation (LΔSP). We note that an increased surface precipitation could mean that aerosols get rained out faster, thus moderating the aerosol concentration. In our simulations Na is prescribed; thus, this feedback is disabled. This feedback should be examined in future studies.
Lastly, we try to explain the observed relative warming of the upper troposphere with Na, which is consistent with the rise in static stability, by examining the tendency equation of liquid/ice water static energy (). We demonstrate that the increase in static stability with Na can be explained by an increase in the latent heating of the upper troposphere. Warm rain inhibition with Na leads to heightened production rates of graupel and snow, which efficiently sediment out from the colder region of the cloud. As they descend, they leave behind the latent heat released during their formation, resulting in an overall warming effect and increased stability.
The results presented here are based on idealized RCE simulations in a small domain, which suppress convective self-aggregation and large-scale circulation. In a larger domain, the circulation is suggested to intensify with an increase in Na (Dagan, 2024; Dagan et al., 2023). In this case, the large-scale circulation changes dominate the change in the domain mean cloud and radiative properties. In our simulations, we focus on the local response, and these larger-scale effects are not accounted for. Furthermore, the role of other modeling choices, such as horizontal and vertical resolution, and the role of boundary conditions (Dagan et al., 2022) in our results should be examined in future work. In addition, in this work we excluded aerosol–radiation interactions, which could drastically alter TOA energy gain (Bellouin et al., 2020; Williams et al., 2023) and as such could be of interest. Finally, our work is based on single-model simulations. An RCEMIP stage focusing on the aerosol effect on clouds and RCE climate is currently being conducted. This set of multi-model simulations under a harmonized setup will allow us to confront our conclusions with a large variety of models and microphysical schemes.
This work suggests that under equilibrium conditions, the magnitude of the effective radiative forcing by aerosol–cloud interactions decreases (becomes less negative) with an increase in SST. These results predict that under the ongoing global warming trend, the ability of aerosol–cloud interactions to counteract some of the positive radiative forcing by greenhouse gases will decrease with time. In addition, this suggests that studying the sensitivity of clouds to aerosol and SST should be conducted concomitantly as mutual effects are expected.
SAM is publicly available at http://rossby.msrc.sunysb.edu/SAM.html (Khairoutdinov, 2004). The data presented in this study are publicly available at https://doi.org/10.5281/zenodo.8338310 (Lorian and Dagan, 2023).
The supplement related to this article is available online at: https://doi.org/10.5194/acp-24-9323-2024-supplement.
SL carried out the simulations and analyses presented. GD assisted with the simulations. SL and GD designed and interpreted the analyses. SL prepared the manuscript with contributions from GD.
At least one of the (co-)authors is a member of the editorial board of Atmospheric Chemistry and Physics. The peer-review process was guided by an independent editor, and the authors also have no other competing interests to declare.
Publisher's note: Copernicus Publications remains neutral with regard to jurisdictional claims made in the text, published maps, institutional affiliations, or any other geographical representation in this paper. While Copernicus Publications makes every effort to include appropriate place names, the final responsibility lies with the authors.
We thank Blaž Gasparini and another anonymous reviewer for their constructive comments which improved our paper.
This research has been supported by the Israel Science Foundation (grant no. 1419/21).
This paper was edited by Timothy Garrett and reviewed by Blaž Gasparini and one anonymous referee.
Albrecht, B. A.: Aerosols, cloud microphysics, and fractional cloudiness, Science, 245, 1227–1230, 1989. a, b, c
Altaratz, O., Koren, I., Remer, L., and Hirsch, E.: Review: Cloud invigoration by aerosols–Coupling between microphysics and dynamics, Atmos. Res., 140, 38–60, 2014. a
Bellouin, N., Quaas, J., Gryspeerdt, E., Kinne, S., Stier, P., Watson-Parris, D., Boucher, O., Carslaw, K. S., Christensen, M., Daniau, A.-L., Dufresne, J.-L., Feingold, G., Fiedler, S., Forster, P., Gettelman, A., Haywood, J. M., Lohmann, U., Malavelle, F., Mauritsen, T., McCoy, D. T., Myhre, G., Mülmenstädt, J., Neubauer, D., Possner, A., Rugenstein, M., Sato, Y., Schulz, M., Schwartz, S. E., Sourdeval, O., Storelvmo, T., Toll, V., Winker, D., and Stevens, B.: Bounding global aerosol radiative forcing of climate change, Rev. Geophys., 58, e2019RG000660, https://doi.org/10.1029/2019RG000660, 2020. a, b, c, d
Beydoun, H. and Hoose, C.: Aerosol–Cloud–Precipitation Interactions in the Context of Convective Self-Aggregation, J. Adv. Model. Earth Sy., 11, 1066–1087, https://doi.org/10.1029/2018MS001523, 2019. a
Beydoun, H., Caldwell, P. M., Hannah, W. M., and Donahue, A. S.: Dissecting anvil cloud response to sea surface warming, Geophys. Res. Lett., 48, e2021GL094049, https://doi.org/10.1029/2021GL094049, 2021. a, b, c, d, e, f
Bony, S., Dufresne, J., Treut, H. L., Morcette, J., and Senior, C.: On dynamic and thermodynamic components of cloud changes, Clim. Dynam., 22, 71–86, https://doi.org/10.1007/s00382-003-0369-6, 2004. a
Bony, S., Stevens, B., Coppin, D., Becker, T., Reed, K. A., Voigt, A., and Medeiros, B.: Thermodynamic control of anvil cloud amount, P. Natl. Acad. Sci. USA, 113, 8927–8932, 2016. a, b, c, d, e, f, g, h, i
Carrió, G. and Cotton, W.: Urban growth and aerosol effects on convection over Houston. Part II: Dependence of aerosol effects on instability, Atmos. Res., 102, 167–174, 2011. a
Ceppi, P., Brient, F., Zelinka, M. D., and Hartmann, D. L.: Cloud feedback mechanisms and their representation in global climate models, WIREs Clim. Change, 8, e465, https://doi.org/10.1002/wcc.465, 2017. a, b, c, d, e
Chen, Q., Koren, I., Altaratz, O., Heiblum, R. H., Dagan, G., and Pinto, L.: How do changes in warm-phase microphysics affect deep convective clouds?, Atmos. Chem. Phys., 17, 9585–9598, https://doi.org/10.5194/acp-17-9585-2017, 2017. a, b, c, d
Choudhury, G. and Tesche, M.: A first global height-resolved cloud condensation nuclei data set derived from spaceborne lidar measurements, Earth Syst. Sci. Data, 15, 3747–3760, https://doi.org/10.5194/essd-15-3747-2023, 2023. a
Christensen, M. W., Chen, Y.-C., and Stephens, G. L.: Aerosol indirect effect dictated by liquid clouds, J. Geophys. Res.-Atmos., 121, 14–636, 2016. a, b
Christensen, M. W., Gettelman, A., Cermak, J., Dagan, G., Diamond, M., Douglas, A., Feingold, G., Glassmeier, F., Goren, T., Grosvenor, D. P., Gryspeerdt, E., Kahn, R., Li, Z., Ma, P.-L., Malavelle, F., McCoy, I. L., McCoy, D. T., McFarquhar, G., Mülmenstädt, J., Pal, S., Possner, A., Povey, A., Quaas, J., Rosenfeld, D., Schmidt, A., Schrödner, R., Sorooshian, A., Stier, P., Toll, V., Watson-Parris, D., Wood, R., Yang, M., and Yuan, T.: Opportunistic experiments to constrain aerosol effective radiative forcing, Atmos. Chem. Phys., 22, 641–674, https://doi.org/10.5194/acp-22-641-2022, 2022. a
Collins, W. D., Rasch, P. J., Boville, B. A., Hack, J. J., McCaa, J. R., Williamson, D. L., Briegleb, B. P., Bitz, C. M., Lin, S.-J., and Zhang, M.: The formulation and atmospheric simulation of the Community Atmosphere Model version 3 (CAM3), J. Climate, 19, 2144–2161, 2006. a
Dagan, G.: Equilibrium climate sensitivity increases with aerosol concentration due to changes in precipitation efficiency, Atmos. Chem. Phys., 22, 15767–15775, https://doi.org/10.5194/acp-22-15767-2022, 2022. a, b, c
Dagan, G.: Large-Scale Tropical Circulation Intensification by Aerosol Effects on Clouds, Geophys. Res. Lett., 51, e2024GL109015, https://doi.org/10.1029/2024GL109015, 2024. a
Dagan, G. and Stier, P.: Constraint on precipitation response to climate change by combination of atmospheric energy and water budgets, npj Climate and Atmospheric Science, 3, 1–5, 2020a. a, b
Dagan, G. and Stier, P.: Ensemble daily simulations for elucidating cloud–aerosol interactions under a large spread of realistic environmental conditions, Atmos. Chem. Phys., 20, 6291–6303, https://doi.org/10.5194/acp-20-6291-2020, 2020b. a, b
Dagan, G., Koren, I., and Altaratz, O.: Aerosol effects on the timing of warm rain processes, Geophys. Res. Lett., 42, 4590–4598, 2015. a
Dagan, G., Koren, I., Altaratz, O., and Heiblum, R. H.: Time-dependent, non-monotonic response of warm convective cloud fields to changes in aerosol loading, Atmos. Chem. Phys., 17, 7435–7444, https://doi.org/10.5194/acp-17-7435-2017, 2017. a, b
Dagan, G., Koren, I., and Altaratz, O.: Quantifying the effect of aerosol on vertical velocity and effective terminal velocity in warm convective clouds, Atmos. Chem. Phys., 18, 6761–6769, https://doi.org/10.5194/acp-18-6761-2018, 2018. a
Dagan, G., Stier, P., Christensen, M., Cioni, G., Klocke, D., and Seifert, A.: Atmospheric energy budget response to idealized aerosol perturbation in tropical cloud systems, Atmos. Chem. Phys., 20, 4523–4544, https://doi.org/10.5194/acp-20-4523-2020, 2020. a
Dagan, G., Stier, P., Spill, G., Herbert, R., Heikenfeld, M., van den Heever, S. C., and Marinescu, P. J.: Boundary conditions representation can determine simulated aerosol effects on convective cloud fields, Communications Earth & Environment, 3, 71, https://doi.org/10.1038/s43247-022-00399-5, 2022. a
Dagan, G., Yeheskel, N., and Williams, A. I.: Radiative forcing from aerosol–cloud interactions enhanced by large-scale circulation adjustments, Nat. Geosci., 16, 1092–1098, https://doi.org/10.1038/s41561-023-01319-8, 2023. a
Fan, J., Comstock, J. M., and Ovchinnikov, M.: The cloud condensation nuclei and ice nuclei effects on tropical anvil characteristics and water vapor of the tropical tropopause layer, Environ. Res. Lett., 5, 044005, https://doi.org/10.1088/1748-9326/5/4/044005, 2010. a
Fan, J., Leung, L. R., Rosenfeld, D., Chen, Q., Li, Z., Zhang, J., and Yan, H.: Microphysical effects determine macrophysical response for aerosol impacts on deep convective clouds, P. Natl. Acad. Sci. USA, 110, E4581–E4590, 2013. a, b
Freud, E. and Rosenfeld, D.: Linear relation between convective cloud drop number concentration and depth for rain initiation, J. Geophys. Res.-Atmos., 117, D02207, https://doi.org/10.1029/2011JD016457, 2012. a, b, c, d
Gasparini, B., Sokol, A. B., Wall, C. J., Hartmann, D. L., and Blossey, P. N.: Diurnal Differences in Tropical Maritime Anvil Cloud Evolution, J. Climate, 35, 1655–1677, https://doi.org/10.1175/JCLI-D-21-0211.1, 2022. a
Gasparini, B., Voigt, A., Mandorli, G., and Stubenrauch, C.: Basic physics predicts stronger high cloud radiative heating with warming, ESS Open Archive [preprint], https://doi.org/10.22541/essoar.172070593.34407568/v1, 11 July 2024. a
Gettelman, A. and Sherwood, S. C.: Processes responsible for cloud feedback, Current Climate Change Reports, 2, 179–189, 2016. a, b
Grabowski, W. W. and Morrison, H.: Untangling microphysical impacts on deep convection applying a novel modeling methodology. Part II: Double-moment microphysics, J. Atmos. Sci., 73, 3749–3770, 2016. a, b, c
Gryspeerdt, E. and Stier, P.: Regime-based analysis of aerosol-cloud interactions, Geophys. Res. Lett., 39, L21802, https://doi.org/10.1029/2012GL053221, 2012. a, b
Harrop, B. E. and Hartmann, D. L.: Testing the Role of Radiation in Determining Tropical Cloud-Top Temperature, J. Climate, 25, 5731–5747, https://doi.org/10.1175/JCLI-D-11-00445.1, 2012. a
Hartmann, D. L. and Berry, S. E.: The balanced radiative effect of tropical anvil clouds, J. Geophys. Res.-Atmos., 122, 5003–5020, 2017. a
Hartmann, D. L. and Larson, K.: An important constraint on tropical cloud-climate feedback, Geophys. Res. Lett., 29, 1951, https://doi.org/10.1029/2002GL015835, 2002. a, b, c
Heikenfeld, M., White, B., Labbouz, L., and Stier, P.: Aerosol effects on deep convection: the propagation of aerosol perturbations through convective cloud microphysics, Atmos. Chem. Phys., 19, 2601–2627, https://doi.org/10.5194/acp-19-2601-2019, 2019. a, b, c, d, e
Igel, A. L. and van den Heever, S. C.: Invigoration or Enervation of Convective Clouds by Aerosols?, Geophys. Res. Lett., 48, e2021GL093804, https://doi.org/10.1029/2021GL093804, 2021. a, b
Khairoutdinov, M.: System for Atmospheric Modeling (SAM), http://rossby.msrc.sunysb.edu/SAM.html (last access: 14 August 2024), 2004. a
Khairoutdinov, M. F. and Randall, D. A.: Cloud resolving modeling of the ARM summer 1997 IOP: Model formulation, results, uncertainties, and sensitivities, J. Atmos. Sci., 60, 607–625, 2003. a, b
Koren, I., Kaufman, Y. J., Rosenfeld, D., Remer, L. A., and Rudich, Y.: Aerosol invigoration and restructuring of Atlantic convective clouds, Geophys. Res. Lett., 32, L14828, https://doi.org/10.1029/2005GL023187, 2005. a
Koren, I., Dagan, G., and Altaratz, O.: From aerosol-limited to invigoration of warm convective clouds, Science, 344, 1143–1146, 2014. a, b
Koren, I., Altaratz, O., and Dagan, G.: Aerosol effect on the mobility of cloud droplets, Environ. Res. Lett., 10, 104011, https://doi.org/10.1088/1748-9326/10/10/104011, 2015. a
Li, R., Storelvmo, T., Fedorov, A. V., and Choi, Y.-S.: A positive IRIS feedback: Insights from climate simulations with temperature-sensitive cloud–rain conversion, J. Climate, 32, 5305–5324, 2019. a
Lorian, S. and Dagan, G.: Dataset for “On the sensitivity of aerosol-cloud interactions to changes in sea surface temperature in radiative-convective equilibrium”, Version v1, Zenodo [data set], https://doi.org/10.5281/zenodo.8338310, 2023. a
Lutsko, N. J. and Cronin, T. W.: Increase in precipitation efficiency with surface warming in radiative-convective equilibrium, J. Adv. Model. Earth Sy., 10, 2992–3010, 2018. a
Morrison, H., Curry, J., and Khvorostyanov, V.: A new double-moment microphysics parameterization for application in cloud and climate models. Part I: Description, J. Atmos. Sci., 62, 1665–1677, 2005. a, b
Muller, C. J. and Held, I. M.: Detailed investigation of the self-aggregation of convection in cloud-resolving simulations, J. Atmos. Sci., 69, 2551–2565, 2012. a
Muller, C. J. and O'Gorman, P.: An energetic perspective on the regional response of precipitation to climate change, Nat. Clim. Change, 1, 266–271, 2011. a, b
Nesbitt, S. W. and Zipser, E. J.: The Diurnal Cycle of Rainfall and Convective Intensity according to Three Years of TRMM Measurements, J. Climate, 16, 1456–1475, https://doi.org/10.1175/1520-0442(2003)016<1456:TDCORA>2.0.CO;2, 2003. a
Nuijens, L. and Siebesma, A. P.: Boundary layer clouds and convection over subtropical oceans in our current and in a warmer climate, Current Climate Change Reports, 5, 80–94, 2019. a
Rasmussen, R. M., Geresdi, I., Thompson, G., Manning, K., and Karplus, E.: Freezing Drizzle Formation in Stably Stratified Layer Clouds: The Role of Radiative Cooling of Cloud Droplets, Cloud Condensation Nuclei, and Ice Initiation, J. Atmos. Sci., 59, 837–860, https://doi.org/10.1175/1520-0469(2002)059<0837:FDFISS>2.0.CO;2, 2002. a
Romps, D. M., Latimer, K., Zhu, Q., Jurkat-Witschas, T., Mahnke, C., Prabhakaran, T., Weigel, R., and Wendisch, M.: Air pollution unable to intensify storms via warm-phase invigoration, Geophys. Res. Lett., 50, e2022GL100409, https://doi.org/10.1029/2022GL100409, 2023. a, b
Rosenfeld, D.: Suppression of rain and snow by urban and industrial air pollution, Science, 287, 1793–1796, 2000. a, b, c
Rosenfeld, D., Lohmann, U., Raga, G. B., O'Dowd, C. D., Kulmala, M., Fuzzi, S., Reissell, A., and Andreae, M. O.: Flood or drought: how do aerosols affect precipitation?, Science, 321, 1309–1313, 2008. a, b, c
Saint-Lu, M., Bony, S., and Dufresne, J.-L.: Observational evidence for a stability iris effect in the tropics, Geophys. Res. Lett., 47, e2020GL089059, https://doi.org/10.1029/2020GL089059, 2020. a
Seeley, J. T., Jeevanjee, N., Langhans, W., and Romps, D. M.: Formation of tropical anvil clouds by slow evaporation, Geophys. Res. Lett., 46, 492–501, 2019. a
Seidel, S. D. and Yang, D.: Temperatures of Anvil Clouds and Radiative Tropopause in a Wide Array of Cloud-Resolving Simulations, J. Climate, 35, 8065–8078, https://doi.org/10.1175/JCLI-D-21-0962.1, 2022. a
Seifert, A. and Beheng, K.: A two-moment cloud microphysics parameterization for mixed-phase clouds. Part 2: Maritime vs. continental deep convective storms, Meteorol. Atmos. Phys., 92, 67–82, 2006. a
Seinfeld, J. H., Bretherton, C., Carslaw, K. S., Coe, H., DeMott, P. J., Dunlea, E. J., Feingold, G., Ghan, S., Guenther, A. B., Kahn, R., Kraucunas, I., Kreidenweis, S. M., Molina, M. J., Nenes, A., Penner, J. E., Prather, K. A., Ramanathan, V., Ramaswamy, V., Rasch, P. J., Ravishankara, A. R., Rosenfeld, D., Stephens, G., and Wood, R.: Improving our fundamental understanding of the role of aerosol- cloud interactions in the climate system, P. Natl. Acad. Sci. USA, 113, 5781–5790, 2016. a
Sokol, A. B., Wall, C. J., and Hartmann, D. L.: Greater climate sensitivity implied by anvil cloud thinning, Nat. Geosci., 17, 398–403, https://doi.org/10.1038/s41561-024-01420-6, 2024. a, b, c, d
Squires, P.: The microstructure and colloidal stability of warm clouds: Part I–The relation between structure and stability, Tellus, 10, 256–261, 1958. a
Squires, P. and Twomey, S.: The relation between cloud droplet spectra and the spectrum of cloud nuclei, Geoph. Monog. Series, 5, 211–219, 1960. a
Stevens, B. and Feingold, G.: Untangling aerosol effects on clouds and precipitation in a buffered system, Nature, 461, 607–613, 2009. a
Storer, R. L. and van den Heever, S. C.: Microphysical Processes Evident in Aerosol Forcing of Tropical Deep Convective Clouds, J. Atmos. Sci., 70, 430–446, https://doi.org/10.1175/JAS-D-12-076.1, 2013. a
Twomey, S.: The nuclei of natural cloud formation part II: The supersaturation in natural clouds and the variation of cloud droplet concentration, Geofisica pura e applicata, 43, 243–249, 1959. a
Twomey, S.: Pollution and the planetary albedo, Atmos. Environ. (1967), 8, 1251–1256, 1974. a, b
Twomey, S.: The influence of pollution on the shortwave albedo of clouds, J. Atmos. Sci., 34, 1149–1152, 1977. a, b
van den Heever, S. C., Stephens, G. L., and Wood, N. B.: Aerosol Indirect Effects on Tropical Convection Characteristics under Conditions of Radiative–Convective Equilibrium, J. Atmos. Sci., 68, 699–718, https://doi.org/10.1175/2010JAS3603.1, 2011. a
Varble, A.: Erroneous attribution of deep convective invigoration to aerosol concentration, J. Atmos. Sci., 75, 1351–1368, 2018. a
Varble, A. C., Igel, A. L., Morrison, H., Grabowski, W. W., and Lebo, Z. J.: Opinion: A critical evaluation of the evidence for aerosol invigoration of deep convection, Atmos. Chem. Phys., 23, 13791–13808, https://doi.org/10.5194/acp-23-13791-2023, 2023. a, b
Williams, A. I. L., Watson-Parris, D., Dagan, G., and Stier, P.: Dependence of Fast Changes in Global and Local Precipitation on the Geographical Location of Absorbing Aerosol. J. Climate, 36, 6163–6176, https://doi.org/10.1175/JCLI-D-23-0022.1, 2023. a, b, c
Williams, E., Rosenfeld, D., Madden, N., Gerlach, J., Gears, N., Atkinson, L., Dunnemann, N., Frostrom, G., Antonio, M., Biazon, B., Camargo, R., Franca, H., Gomes, A., Lima, M., Machado, R., Manhaes, S., Nachtigall, L., Piva, H., Quintiliano, W., Machado, L., Artaxo, P., Roberts, G., Renno, N., Blakeslee, R., Bailey, J., Boccippio, D., Betts, A., Wolff, D., Roy, B., Halverson, J., Rickenbach, T., Fuentes, J.., and Avelino, E.: Contrasting convective regimes over the Amazon: Implications for cloud electrification, J. Geophys. Res.-Atmos., 107, 8082, https://doi.org/10.1029/2001JD000380, 2002. a
Williams, I. N. and Pierrehumbert, R. T.: Observational evidence against strongly stabilizing tropical cloud feedbacks, Geophys. Res. Lett., 44, 1503–1510, 2017. a
Wing, A. A., Reed, K. A., Satoh, M., Stevens, B., Bony, S., and Ohno, T.: Radiative–convective equilibrium model intercomparison project, Geosci. Model Dev., 11, 793–813, https://doi.org/10.5194/gmd-11-793-2018, 2018. a, b, c, d
Wing, A. A., Stauffer, C. L., Becker, T., Reed, K. A., Ahn, M.-S., Arnold, N. P., Bony, S., Branson, M., Bryan, G. H., Chaboureau, J.-P., De Roode, Stephan R., Gayatri, K., Hohenegger, C., Hu, I.-K., Jansson, F., Jones, T. R., Khairoutdinov, M., Kim, D., Martin, Z. K., Matsugishi, S., Medeiros, B., Miura, H., Moon, Y., Müller, S. K. Ohno, T., Popp, M., Prabhakaran, T., Randall, D., Rios-Berrios, R., Rochetin, N., Roehrig, R., Romps, D. M. Ruppert Jr., J. H., Satoh, M., Silvers, L. G., Singh, M. S., Stevens, B., Tomassini, L., van Heerwaarden, C. C., Wang, S., and Zhao, M.: Clouds and convective self-aggregation in a multimodel ensemble of radiative-convective equilibrium simulations, J. Adv. Model. Earth Sy., 12, e2020MS002138, https://doi.org/10.1029/2020MS002138, 2020. a, b
Yuan, T., Remer, L. A., Pickering, K. E., and Yu, H.: Observational evidence of aerosol enhancement of lightning activity and convective invigoration, Geophys. Res. Lett., 38, L04701, https://doi.org/10.1029/2010GL046052, 2011. a
Zelinka, M. D. and Hartmann, D. L.: Why is longwave cloud feedback positive?, J. Geophys. Res.-Atmos., 115, D16117, https://doi.org/10.1029/2010JD013817, 2010. a, b, c
Zelinka, M. D. and Hartmann, D. L.: The observed sensitivity of high clouds to mean surface temperature anomalies in the tropics, J. Geophys. Res.-Atmos., 116, D23103, https://doi.org/10.1029/2011JD016459, 2011. a, b