the Creative Commons Attribution 4.0 License.
the Creative Commons Attribution 4.0 License.
 | 20 Aug 2024
International airport emissions and their impact on local air quality: chemical speciation of ambient aerosols at Madrid–Barajas Airport during the AVIATOR campaign
Saleh Alzahrani
Doğuşhan Kılıç
Michael Flynn
Paul I. Williams
James Allan
Madrid–Barajas Airport (MAD) is the fourth-busiest airport in Europe. The aerosol chemical composition and the concentrations of other key pollutants were measured at the airport perimeter during October 2021 to assess the impact of airport emissions on local air quality. A high-fidelity ambient instrumentation system was deployed at Madrid–Barajas Airport to measure the following: concentrations of organic aerosols (with their composition), black carbon (eBC), carbon dioxide (CO2), carbon monoxide (CO), nitrogen dioxide (NOx), sulfur dioxide (SO2), particulate matter (PM2.5, PM10), total hydrocarbon (THC), and total particle number. The average concentrations of eBC, NOx, SO2, PM2.5, PM10, CO, and THC at the airport for the entire campaign were 1.07 µg m−3, 22.7 µg m−3, 4.10 µg m−3, 9.35 µg m−3, 16.43 µg m−3, 0.23 mg m−3, and 2.30 mg m−3, respectively. The source apportionment analysis of the non-refractory organic aerosol (OA) using positive matrix factorisation (PMF) allowed us to discriminate between different sources of pollution, namely less oxidised oxygenated organic aerosol (LO-OOA), alkane organic aerosol (AlkOA), and more oxidised oxygenated organic aerosol (MO-OOA). The results showed that LO-OOA and MO-OOA account for more than 80 % of the total organic particle mass measured near the runway. Trace gases correlate better with the AlkOA factor than LO-OOA and MO-OOA, indicating that AlkOA is mainly related to primary combustion emissions. Bivariate polar plots were used for pollutant source identification. Significantly higher concentrations of the obtained factors were observed at low wind speeds (<3 m s−1) from the southwest, where two of the runways and all terminals are located. Higher and ratios were observed when the winds originated from the northeast, where the two northern runways are located. These elevated ratios are attributed to the aircraft activity being the major pollutant source in the northeast area.
- Article
(3126 KB) - Full-text XML
-
Supplement
(529 KB) - BibTeX
- EndNote


Several studies have linked particulate matter (PM) to a range of harmful health effects, including respiratory and cardiovascular ailments (Boldo et al., 2006; Li et al., 2003a; Pope and Dockery, 2006; Schwarze et al., 2006). In recent years, a number of researchers have found an association between aviation emissions and potential adverse human health impacts. These emissions can lead to immune system malfunction, various pathologies, the development of cancer, and premature death. Hence, it is increasingly recognised as a serious worldwide public health concern (Yim et al., 2013; He et al., 2018; Jonsdottir et al., 2019). Airports contribute to primary and secondary inhalable and fine particulate matter (PM10 and PM2.5, with aerodynamic diameters of <10 and <2.5 µm, respectively), making them key determinants of urban air quality and a significant concern for local air quality management.
A few studies have reported that air pollutants emitted from large airports can play a vital role in worsening the regional air quality (Rissman et al., 2013; Hudda and Fruin, 2016). Hu et al. (2009) and Westerdahl et al. (2008) measured high ambient PM concentrations downwind of Los Angeles International Airport (LAX) and Santa Monica Airport (SMA) in California. A decline in the ambient air quality was observed up to 18 km downwind from international airports due to an increase in particle number concentrations linked to gas-turbine-emitted PM (Hudda et al., 2014; Hudda and Fruin, 2016). To date, several questions still remain to be answered regarding the chemical composition of aircraft plumes and the health risks associated with the exposure to the pollutants originating from airports in neighbouring communities. Responding to the growing concern about the risk of exposure to airport pollutants, studies have been conducted to gain a better understanding of airport emissions and their possible effects on local and regional air quality. Thus far, aircraft engines have been considered to be one of the major sources of both gaseous and particulate pollutants at the airport (Masiol and Harrison, 2014). Various campaigns have reported both physical and chemical properties of particulate and gaseous emissions (Kinsey, 2009; Kinsey et al., 2010, 2011; Mazaheri et al., 2011; Hudda et al., 2016). Jet A-1 aviation fuel is the most common type of fuel that is used in civil aviation. It is a complex mixture of aliphatic hydrocarbons and aromatic compounds, characterised by a mean ratio of ∼0.52 (with an average empirical molecular formula of C12H23) (Lee et al., 2010). The mass fraction of paraffins in jet fuel is over or equal to 75 %, while the aromatic content is less than or equal to 25 % (Liu et al., 2013). Although there are several fuel combustion sources at airports, including aircraft operation and diesel ground transport, the combustion of aviation fuel increases maximum particle counts in the 10–20 nm range based on particle size distribution analysis (Zhu et al., 2011). Other sources of airport-related PM emissions also contribute to local air pollution. Approximately 38 % of PM10, with a mean level of 48 µg m−3 at airports, can periodically originate from the construction activities related to terminal maintenance and expansion (Amato et al., 2010). Particles emitted by commercial aircraft can be divided into two main groups: non-volatile and volatile PM. Non-volatile PM (nvPM) is usually formed during the (incomplete) combustion process and then emitted from the aircraft combustion chamber. It consists mostly of carbonaceous substances such as soot, dust, and trace metals (Yu et al., 2019). nvPM has the physical property of being resistant to high temperatures and pressure. On the other hand, volatile PM is formed through a gas-to-particle conversion process, primarily by sulfur and organic compounds, which exist in the exhaust gas downstream of the engine after emission. Sulfuric compounds are formed as a result of sulfur in fuel, whereas organic particles are formed as combustion products and from fuel and oil vapours (ICAO, 2016; Smith et al., 2022). Aircraft and ground unit emissions have been documented in prior research (Masiol and Harrison, 2014), yet there is still a gap in knowledge about airport-related PM emissions in terms of (i) apportioning PM to individual sources at airports, (ii) specifying their chemical composition, and (iii) understanding the wider impacts of PM on local communities. This study aimed to obtain data to address these research gaps by providing further in-depth information on particle composition measurements and key pollutants observed within an airport environment. It characterises organic volatile PM emissions to assess the effect of aviation emissions on the local air quality. As part of the Assessing aViation emission Impact on local Air quality at airports: TOwards Regulation (AVIATOR) project, ambient measurements were conducted at Madrid–Barajas Airport to monitor the chemical properties of submicron particles near runways. Source apportionment analysis was performed based on the particle data collected via high-resolution mass spectrometry, and this analysis allowed us to discriminate between different sources of air pollution in the airport microenvironment. These findings will serve as a foundation for additional comprehensive research, such as toxicological and health effect studies of PM originating from aviation activities.
2.1 Description of the sampling location
Adolfo Suárez Madrid–Barajas Airport is the main international airport in Spain, located within the municipal limits of Madrid, 13 km northeast of Madrid's city centre. It is the fourth-busiest airport in Europe based on passenger volume (Eurostat Database, 2022). In 2019, 62 million travellers used Madrid–Barajas, and nearly half a million aircraft movements have been recorded thus far, making it the largest and busiest airport in the country. In 2021, nearly one-third of 62 million people travelled through Madrid–Barajas Airport because of the COVID-19 pandemic. The airport has five passenger terminals named T1, T2, T3, T4, and T4S. Madrid–Barajas Airport also has four runways: two on the north–south axis, parallel to each other (18L and 36R as well as 18R and 36L), and two on the northwest–southeast axis (14L and 32R as well as 14R and 32L). The runways enable simultaneous takeoffs and landings at the airport, allowing 120 operations per hour (one takeoff or landing every 30 s). The sampling location was chosen in collaboration with AENA, the owner and operator of Madrid–Barajas Airport, to facilitate the provision of power and access for servicing. Focusing on the temporal and spatial monitoring of the key pollutants, the site was positioned between runways 36L and 36R to sample the airport emissions from an optimal sampling point for aviation activities (Fig. 1). The distance from the sampling location to runways 18L and 36R, 18R and 36L, 14L and 32R, and 14R and 32L is 680 m, 620 m, 3.2 km, and 4.1 km, respectively. Furthermore, the distance between the sampling location and adjacent terminals T1, T2, and T3 is approximately 5 km, whereas the distance to terminals T4 and TS4 is 3 and 1.5 km, respectively. The nearest highway is located around 2.6 km away from the sampling location.
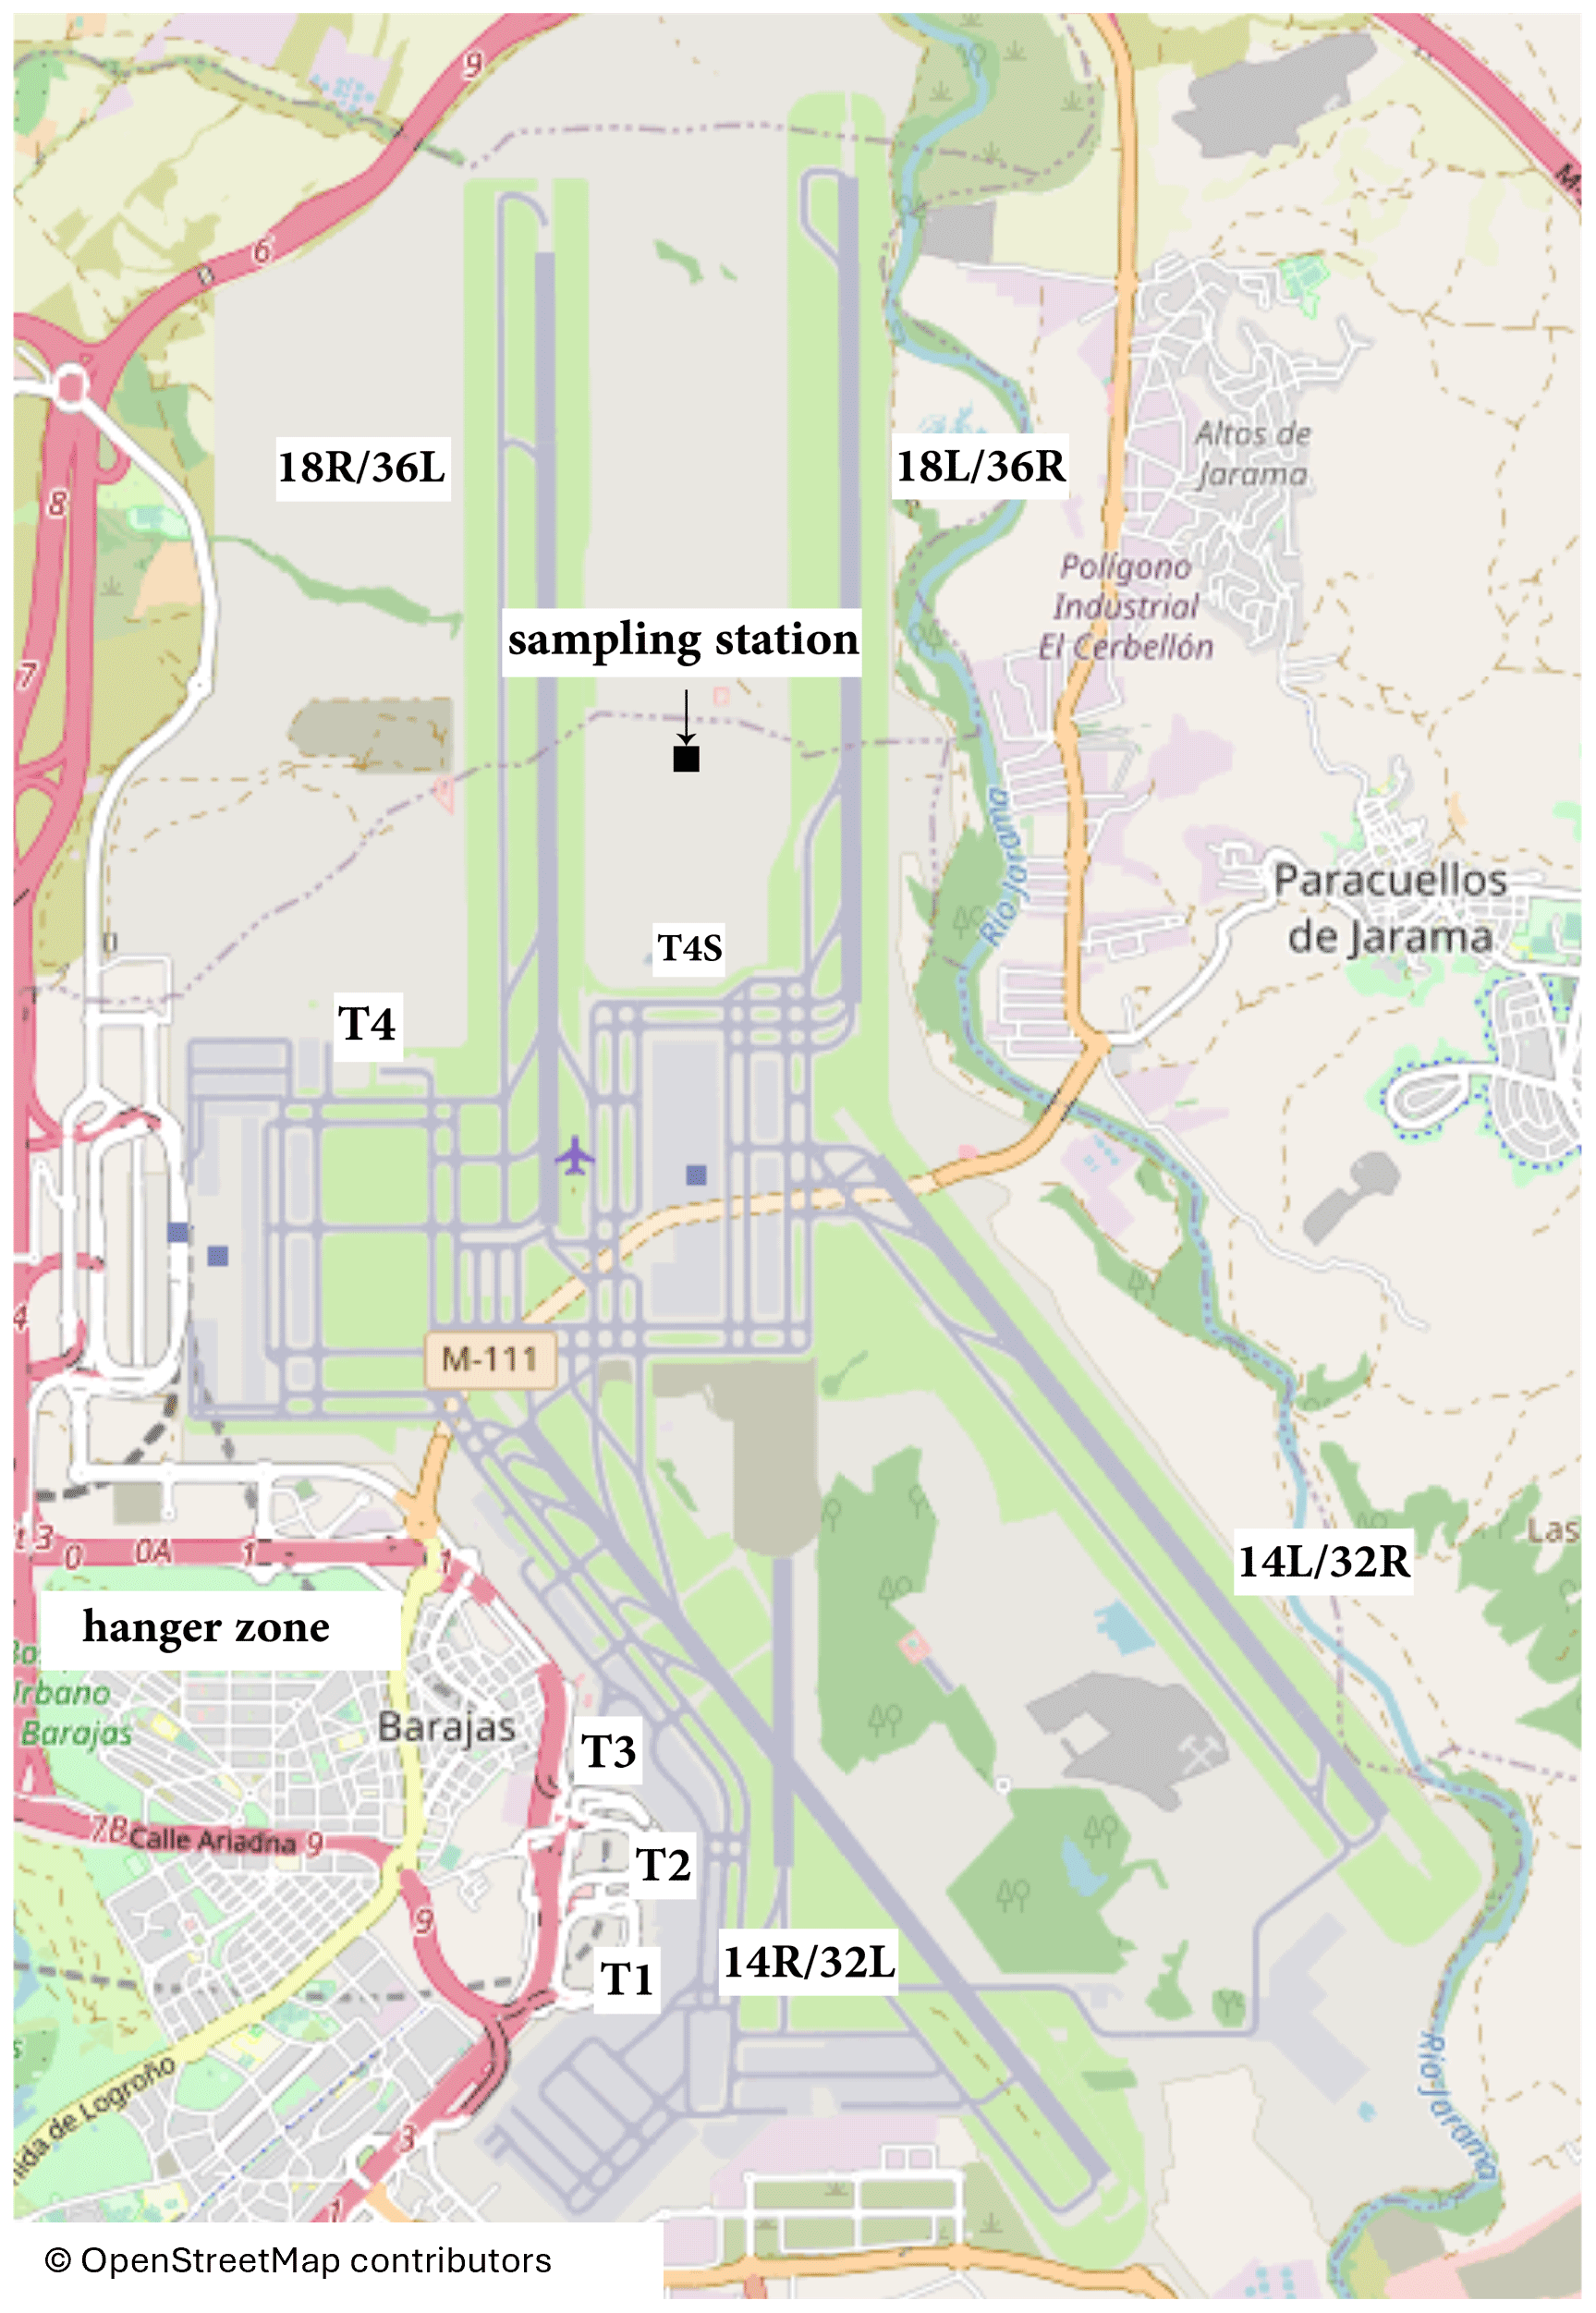
Figure 1Locations of runways, terminals, and sampling site at Adolfo Suárez Madrid–Barajas Airport. Measurements were performed between 8 and 23 October 2021. (Adapted from https://www.openstreetmap.org, last access: April 2024).
2.2 Sampling and instrumentation
The autumn campaign of AVIATOR took place in October 2021. Sampling was conducted continuously, starting at 12:00 on 8 October 2021 and ending at 20:00 on 23 October 2021 (local time used throughout). An ambient instrumentation system with specific reference to PM was deployed at Madrid–Barajas Airport to better characterise air quality in the airport microenvironment. The measurement equipment of the system includes an aerodyne high-resolution time-of-flight aerosol mass spectrometer (AMS) for the chemical speciation of the particles. AMS measures the concentration and chemical composition of non-refractory aerosols online. AMS provided high-resolution measurements of primary and secondary organic aerosol and inorganic aerosol, including sulfates, nitrates, and ammonium, from approximately 60 to 600 nm with 100 % transmission, extending to smaller and larger sizes with reduced transmission (Canagaratna et al., 2007). An aerodynamic lens is used to draw aerosols into a vacuum chamber. Particles are focused into a narrow beam and accelerated to a velocity inversely related to their vacuum aerodynamic diameter. The particles impact on a tungsten surface, heated to 600 °C, which causes them to flash vaporise. A 70 eV electron is used to ionise the vapours before they are analysed by mass spectrometry. During the measurement period, AMS sampled with a 1 µm cut-off inlet and at 30 s time resolution. In addition to standard AMS flow and baseline and single ion calibrations every second day, an ammonium nitrate solution was atomised to calibrate the AMS (for size-dependent ionisation efficiency). The analysis of the chemical characteristics of aircraft PM using an AMS has been described elsewhere in detail (Yu et al., 2010; Anderson et al., 2011; Smith et al., 2022). Equivalent black carbon mass concentration (eBC) based on aerosol optical absorption was monitored using the Multi-Angle Absorption Photometer (MAAP) during this campaign. MAAP operates at 670 nm wavelength and has a 10 s time response with a flow rate of 8 L min−1 for unattended long-term monitoring of carbonaceous particulate emissions from combustion sources (Petzold and Schönlinner, 2004). MAAP has previously been used for the monitoring of black carbon emission from aviation (Herndon et al., 2008; Timko et al., 2014). The instrument was set up to measure average eBC concentrations with 1 min intervals. Using a condensation particle counter (CPC; TSI model 3750) (D50≈7 nm), the total particle number concentration was measured in real time to capture temporal variability in particle number concentrations with a measurement range of up to 100 000 particles cm−3 and a time resolution of 1 s. Ambient CO2 concentrations near runways were also measured by a LI-COR CO2 trace gas analyser at 1 s intervals. In addition, meteorological parameters (temperature, pressure, relative humidity, wind speed, and direction) were measured at the site with the instrumentation system. The system was co-located with the AENA (REDAIR) fixed monitoring site to provide additional spatially resolved data. The REDAIR station monitors the concentration of sulfur dioxide (SO2), nitrogen dioxide (NOx), carbon monoxide (CO), ozone (O3), suspended-particle PM (including PM2.5 and PM10), and total hydrocarbon (THC) with a time resolution of 30 min.
2.3 Data analysis
AMS operated in mass spectrum (MS) mode to identify the chemical species present in the aerosol ensemble and quantify the overall mass loading. AMS data were analysed using the data analysis toolkit TOF-AMS SQUIRREL v1.65B, operated within Igor Pro (WaveMetrics, Inc.). Source Finder (SoFi) is a software package designed to analyse multivariate data using state-of-the-art source apportionment techniques to understand the sources of various pollutants (Canonaco et al., 2013). SoFi, running under IGOR 6.37, was used to deconvolve organic aerosol emissions via the positive matrix factorisation (PMF) model. The PMF model, implemented through the multilinear engine version 2 (ME-2) factorisation tool, was used to determine the number of factors (sources). ME-2, a multivariate solver, employs the same mathematical and statistical method as PMF to evaluate solutions (Paatero, 1999). ME-2 equations are designed for analysing and calculating the relative contributions of various source pollutants by measuring their concentration at receptor locations (Paatero and Tapper, 1994). The PMF model processes many variables and categorises them into two types: (i) source types, which can be determined based on the chemical composition of the pollutants, and (ii) source contributions, used to quantify the amount of contribution from each source to a sample. PMF inputs were restricted to only non-negative concentrations since no sample can have a negative source contribution. A step-by-step approach was employed to select the number of solutions (factors). The method described by Reyes-Villegas et al. (2016) and Smith et al. (2022) was used to determine the optimal solution. This approach initially began with a two-factor model and then incrementally increased to a maximum of five factors. PMF analysis was performed with seed runs and varying FPEAK values (ranging from −1 to 1 with steps of 0.1) to better differentiate organic aerosol sources. Seed runs and FPEAK are rotational techniques in the ME-2 tool, and they represent one of the unconstrained PMF run approaches used for the exploration of the solution space. During the analysis, it was noted that factor four consistently correlates with factor five, exhibiting identical time series and similarities in mass spectra. This difficulty in separating the two has previously been observed in the case of well-mixed pollutants, attributed to low temperatures and wind speeds (Reyes-Villegas et al., 2018). Greater stability was achieved when analysing three-factor solutions with varying FPEAK values. During the analysis, seed runs and PMF with FPEAK solutions showed no significant variation in the normalised scaled residual parameters (), with values close to 1. This is reasonable given that PMF determines the solution by minimising this value (Reyes et al., 2016). The factorisation strategy was entirely successful in separating three different sources, each with distinct mass spectra and differing time series. Consequently, three-factor solutions emerged as the optimal number of sources, demonstrating the best performance with the lowest residuals and values close to 1. Furthermore, the obtained solution exhibited the most favourable results, characterised by distinct diurnal trends and dissimilarities in time series and mass to charge ratios among the factors.
3.1 Variations in organic, inorganic, and oil emissions
The average mass concentration of organic and inorganic aerosols during the entire campaign was 9.6 µg m−3. The bar chart in Fig. 2 shows aerosol fractions, with organic species accounting for more than 70 % of the total aerosols. This is significantly higher than the nearest component, sulfate, which accounted for 15 %. It should also be noted that the nitrate and sulfate species measured by AMS could potentially contain an organic fraction. The PMF analysis in this paper primarily focuses on the composition of the organic mass concentration, which is discussed in further detail in Sect. 3.2. Previous studies have shown that lubrication oil has been detected in ambient air near runways, and it may further add to the total organic PM emissions due to aircraft engine operations (Timko et al., 2010b; Yu et al., 2010; Fushimi et al., 2019; Ungeheuer et al., 2022). Aircraft plume measurements indicated that oil was found to contribute 5 % to 100 % (Yu et al., 2012). The 85 signal is a well-known oil marker in the AMS mass spectrum, attributed to synthetic esters (C5H9O+) (Timko et al., 2014). The ratio of 85:71 is used as a marker for oil (Fig. 3). The value of 0.66 is used as a benchmark for oil contribution (Yu et al., 2012). Values below 0.66 indicate oil-free organic PM, while values above 0.66 suggest the presence of lubrication oil. However, based on the AMS measurements during the AVIATOR autumn campaign, lubrication oil accounted for only up to 5 % of the total aerosol mass, which is significantly less compared to the measurements of Yu et al. (2012). There are three probable explanations for the inability of AMS to detect oil precursors: (i) the oil particles are too small in diameter for AMS to detect; (ii) there is complete pyrolysis of the oil in the engine combustion zone, forming carbon monoxide (CO) and carbon dioxide (CO2) (Smith et al., 2022); or (iii) oil particles contribute an insignificant amount (by mass) to the organic mass in the engine exhaust and therefore are not detected. Additional factors that could potentially impact the minimal presence of oil lubrication in this analysis might involve the overall mass loading of aerosols, the influence of urban aerosol emissions, or the proximity of the sampling point to the nearest runways. Additional information on how the lubrication oil, as measured by AMS, varies with wind speed and direction is provided in the Supplement (Fig. S4). During the AVIATOR autumn campaign, measuring oil was challenging due to the prevalent urban background. A “little-oil” region was identified at low to moderate wind speeds (2–5 m s−1) originating from the southwest, encompassing terminal buildings (T1, T2, T3, T4, and TS4), two runways (14R and 32L as well as 18R and 36L), and a hangar zone. In contrast, a region “unlikely to contain oil” was noted when winds came from the northeast of the airport, near runways 18L and 36R, with relatively higher wind speeds (above 5 m s−1). Furthermore, Fig. S5 in the Supplement displays the daily ratio of 85:71 throughout the sampling period, pinpointing Sunday, 16 October, as the only day when the oil marker surpassed 0.66. On other days, the ratio of 85:71 suggested a minimal likelihood of oil presence. An hourly analysis within Fig. S5 reveals that the oil marker exceeded 0.66 only at 20:00, aligning with the evening peak in PM2.5 concentrations (Fig. S3 in the Supplement). This suggests a significant influence of urban background aerosols on the lubrication oil measurements. Since PMF analysis is based on the organic masses measured via AMS, lubrication oil is not identified as a determinant, and no oil organic mass profile has been reported in previous studies and here (Ulbrich et al., 2009). PMF has been proven to be inefficient at detecting such levels (Ulbrich et al., 2009); therefore, oil contribution to the organic mass may be under-represented in this study.
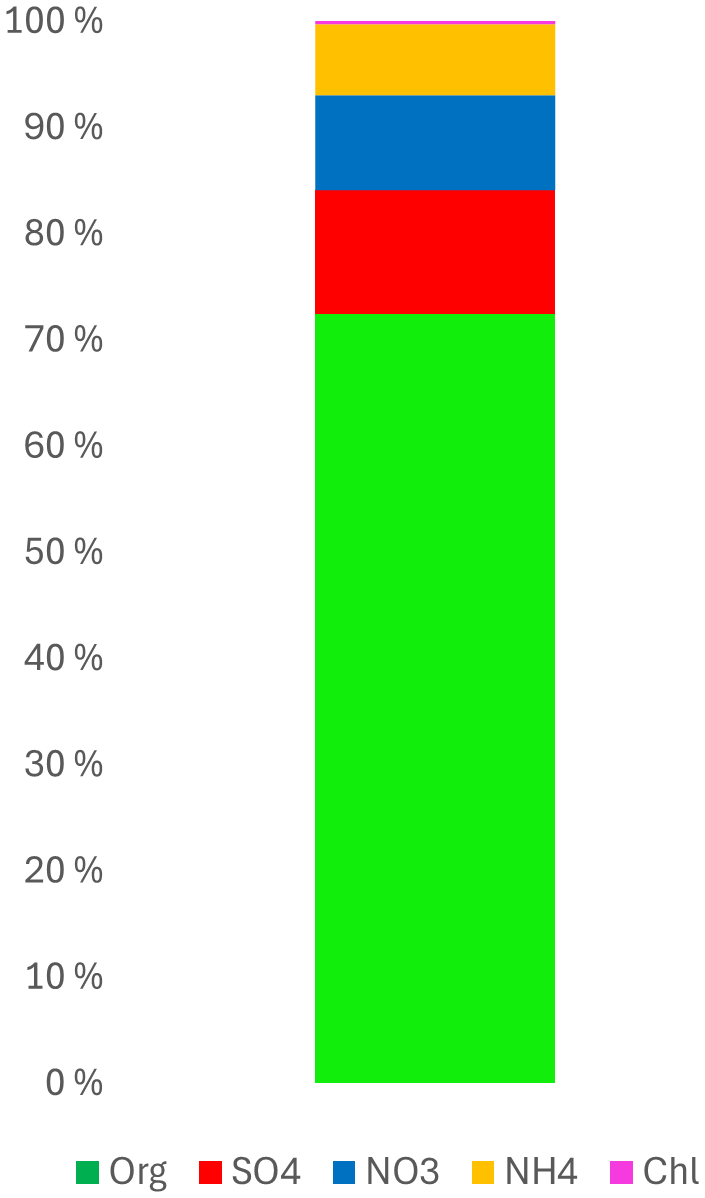
Figure 2The bar chart shows aerosol fractions where organic and sulfate species account for more than 80 % of the total aerosol mass.
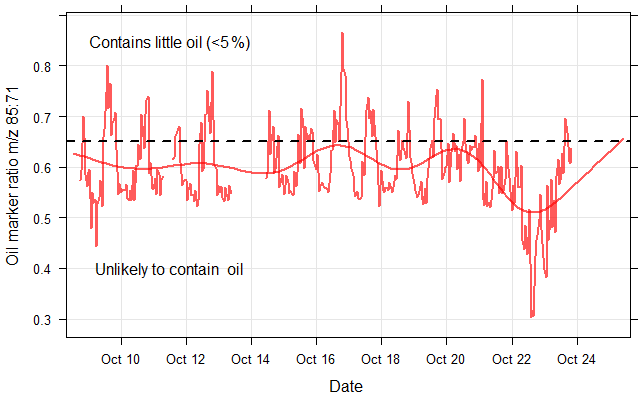
Figure 3Temporal variability of lubrication oil fraction in total aerosol mass obtained from AMS measurements. The ratio of was used as the mass marker to identify lubrication oil. The smooth red line is fitted to the data, while the dashed black line represents the value of 0.66, assumed for oil-free organic PM emitted from aircraft engines. The analysis showed that no oil or very little (<5 %) oil fraction was detected during the measurement period.
3.2 PMF analysis
The PMF analysis in this study aims to provide the relative contribution of the sources of aerosols near runways. In addition to determining the diurnal pattern of the obtained factors during the autumn campaign, PMF solutions were used to investigate how meteorology affects airborne particulate pollution. During the AVIATOR autumn campaign at Madrid–Barajas Airport, three sources were identified via PMF (Fig. 4 shows the results of the PMF analysis, the mass spectral fingerprint). The first factor in Fig. 4, LO-OOA, stands for less oxidised oxygenated organic aerosol. It is a type of secondary organic aerosol (SOA) characterised by its low degree of oxidation. LO-OOA is formed in the atmosphere through the oxidation of volatile organic compounds (VOCs), which can originate from a variety of anthropogenic sources. In this analysis LO-OOA shows the presence of an aromatic marker at 115, a marker used for identifying indene (C9H8) ion in previous studies focusing on aviation emissions (Timko et al., 2014; Smith et al., 2022). LO-OOA is associated with aromatic fragments at 77 () and 105 (). It presents a high relative intensity (0.13) at 43 () (characteristic of LO-OOA) and a lower relative intensity (<0.04) at 91, which is related to toluene ion () (Timko et al., 2014; Smith et al., 2022). Ambient temperature plays a crucial role in influencing the LO-OOA factor, displaying significant diurnal fluctuations. The lowest concentrations of LO-OOA are recorded at midday, coinciding with the peak in ambient temperatures (Fig. 5). A prior PMF analysis of organic particulate matter from aircraft emissions revealed a significant aromatic factor within the organic PM, characterised by elevated signals at 77, 91, 105, 115, and 128 (Timko et al., 2014). The aromatic factor identified by Timko et al. (2014) was found to dominate the organic PM emissions from turbojet engines at low-thrust settings. It was associated with the products of incomplete combustion and exhibited high variability, which varied with engine power settings (the sum of signals in the factor decreased as engine power increased). Another study by Smith et al. (2022) investigated the chemical composition of organic aerosols emitted by gas turbines and identified a semi-volatile oxygenated organic aerosol (SV-OOA) factor, which forms through oxidative processes near the engine exit. A strong correlation (R=0.91) and similarity in mass spectra between the LO-OOA in this study and the SV-OOA described by Smith et al. (2022) were observed. Owing to the absence of volatility measurements during this period and the limited time for ageing (no more than a few minutes), we consider the LO-OOA factor in our analysis to be the most accurate estimate available, rather than the SV-OOA as suggested by Smith et al. (2022). The second factor, identified based on the PMF analysis of the Madrid airport sample, is the alkane organic aerosol (AlkOA) factor. It is associated with unburned fuel and emissions from incomplete combustion, exhibiting high relative intensities at 43, 57, and 85, indicative of decane (C10H22), a common alkane in jet fuel. The mass spectral fingerprint of decane is similar to that of the other aliphatic hydrocarbons (e.g. long-chain alkanes) found in jet A-1 fuel, as reported by Yu et al. (2012) and Smith et al. (2022). The AlkOA factor is referred to here as a marker to identify emissions originating from unburnt fuel/incomplete fuel combustion products. Previously, the primary aliphatic factor had been found in PMF analysis by Timko et al. (2014) and was characterised by increased signals at masses such as , , , and . Each of these masses correspond to an alkane. The primary aliphatic factor in the Timko et al. (2014) study was strongly correlated with black carbon soot emissions under high-power conditions. The strong association between the primary aliphatic factor and soot emissions suggests they originate from similar combustion processes. Timko et al. (2014) concluded that the primary aliphatic factor is derived from combustion-related sources and can potentially contain significant amounts of unburnt jet fuel. Additionally, a strong positive linear correlation was observed between the AlkOA factor identified in this study and the decane factor from the NIST WebBook (R=0.83) (NIST Mass Spectrometry Data Center, 1990), as well as between the AlkOA factor determined here and the AlkOA factor reported by Smith et al. (2022) (R=0.93). The positive linear correlation among these three factors suggests they are indicative of similar primary pollutants derived from fuel vapours or incomplete combustion products associated with jet fuel. Results are consistent with previous findings of another study (Smith et al., 2022). The third factor, more oxidised oxygenated organic aerosol (MO-OOA), is a type of secondary organic aerosol (SOA) that can form from various origins and processes, such as photochemical processing of aged SOA and the regional-scale transport of chemical reactions. MO-OOA has a spectral fingerprint that consists of more oxidised ions (compared to LO-OOA and AlkOA), indicating a secondary aerosol fraction in the sample. MO-OOA is characterised by its notably high relative intensities (>0.18) at 29 (CHO+) and 44 (), which serve as markers for its identification (Alfarra et al., 2007). Given that MO-OOA has the highest ratio among the three factors, it is expected to be the most oxygenated (in terms of chemical content) factor. Being more oxidised potentially makes MO-OOA less volatile than LO-OOA (Jimenez et al., 2009; Smith et al., 2022). MO-OOA in this analysis indicates the formation of aged secondary organic aerosols with no significant diurnal variation (Fig. 5), often associated with air masses transported from polluted regions. Other sources may have been included in one or both factor solutions; consequently, this does not rule out the possibility of their existence.
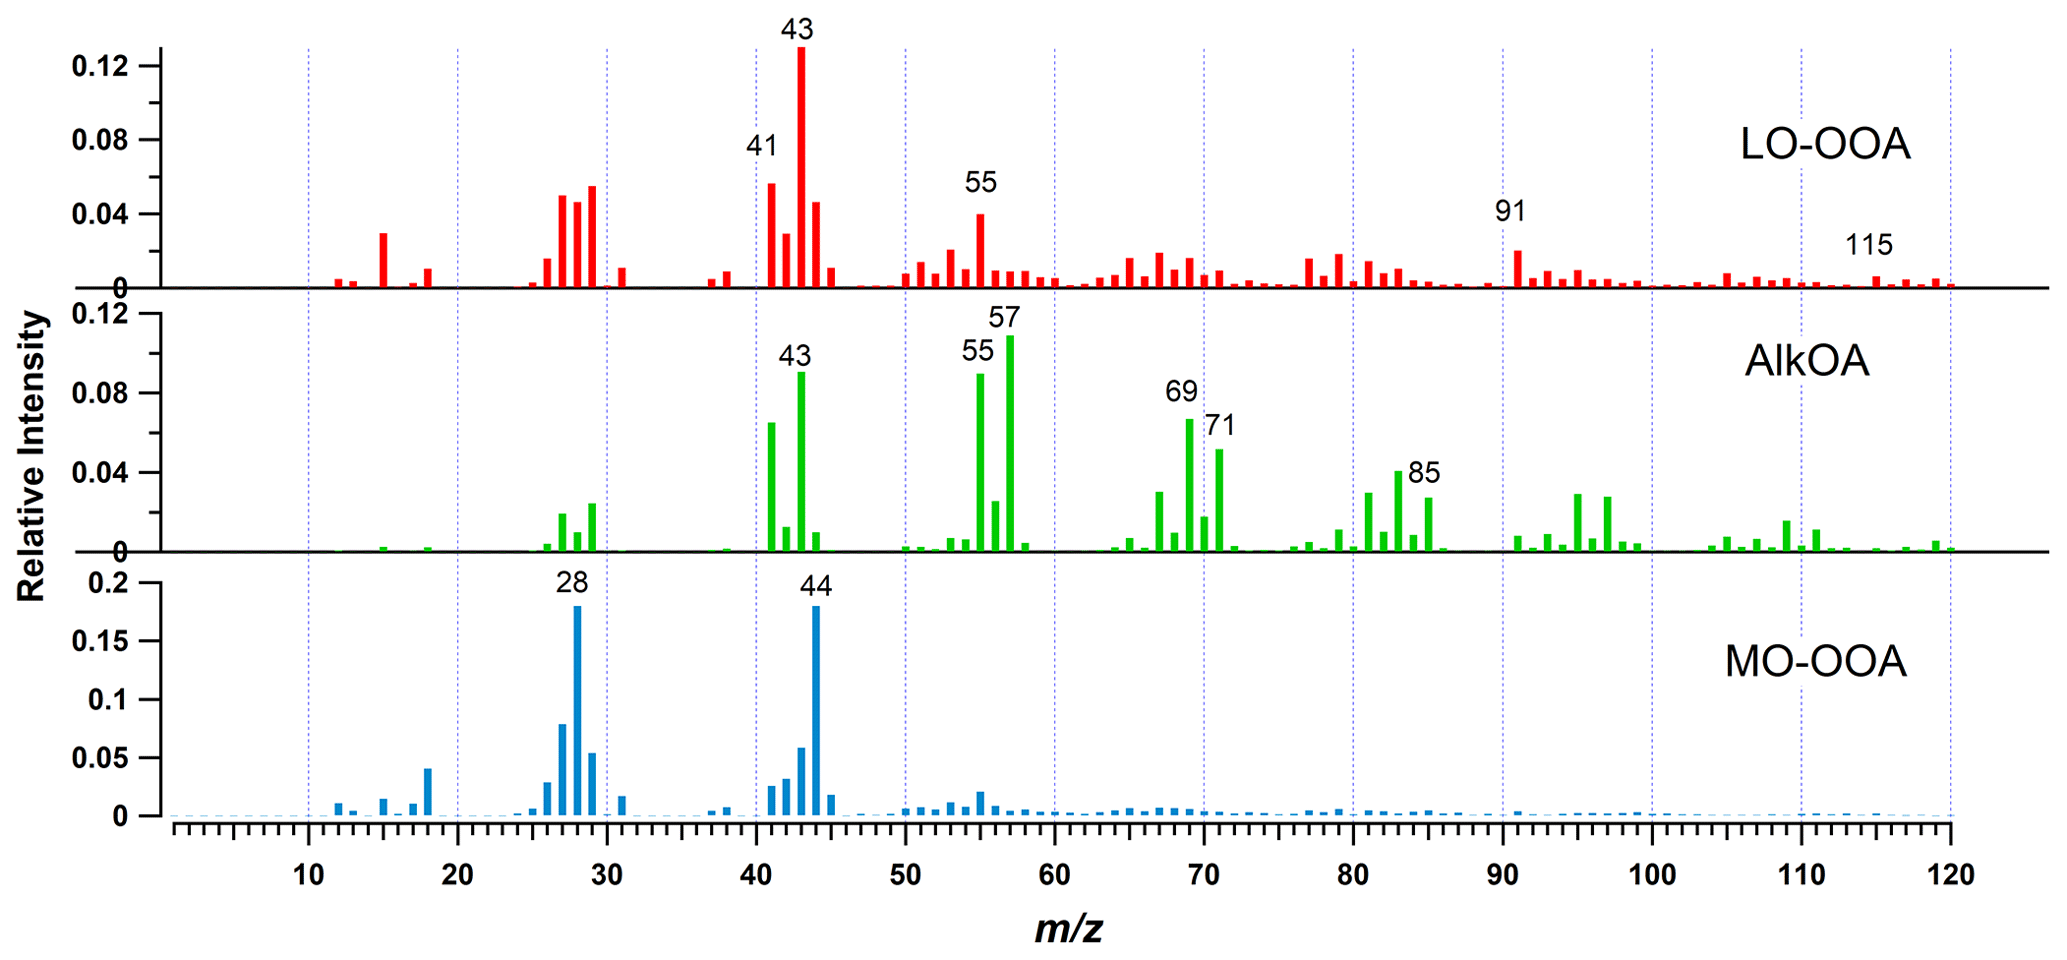
Figure 4The mass spectral fingerprint of the three factors from the PMF solutions. Less oxidised oxygenated organic aerosol (LO-OOA), alkane organic aerosol (AlkOA), and more oxidised oxygenated organic aerosol (MO-OOA), which can be indicative of secondary aerosols. Selected mass markers with a relative intensity higher than 0.01 are numbered.
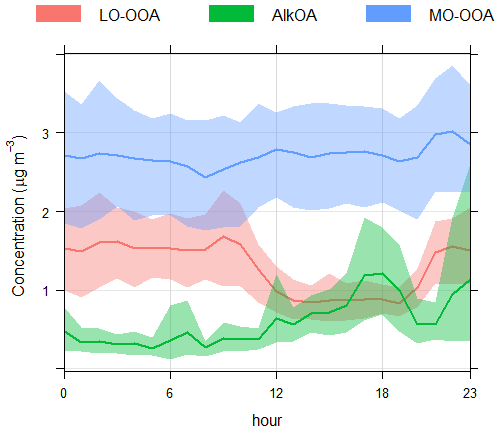
Figure 5Diurnal pattern of the solved factors from 8 October 2021 to 23 October 2021. The mean diurnal pattern is shown as solid lines, and the shading indicates the 95 % confidence interval around the mean.
3.3 The temporal distribution of factors and correlation with trace gases
Average hourly concentrations of the PMF-determined factors were calculated based on the hourly organic aerosol concentrations throughout the entire campaign to monitor the diurnal variation in the source contributions. The variation in the AlkOA concentration during the day is mostly associated with aircraft emissions (Fig. 5). The concentration of the AlkOA factor is relatively higher in the afternoon compared to the morning and midday. The pattern of diurnal AlkOA closely resembles that of diurnal flight activities, suggesting that the surge in AlkOA levels beginning at noon is linked to primary particles released by aircraft. The AlkOA factor shows an increase between 09:00 and 18:00 and again between 22:00 and 23:00. Based on the mean diurnal pattern with a 95 % confidence interval, the AlkOA factor increases during the 09:00 to 18:00 period, corresponding with peak flight activity (approximately 71 % of total flights). Further details on daily aircraft activities are provided in the Supplement (Fig. S2). The increase in AlkOA between 22:00 and 23:00 is not statistically significant due to high variability (Fig. 5). The increase in the AlkOA concentration from 22:00 to 23:00, or the subsequent decrease from 23:00 to 00:00, falls within the variability range of the 00:00 to 01:00 period. Therefore, a statistically significant decrease in the AlkOA concentration from 23:00 to 00:00 is hardly measurable. Meteorological factors may contribute to the variability in the diurnal cycle observed during this period. Additionally, unidentified local sources, such as airport ground service equipment, could potentially explain the variability observed from 22:00 to 00:00. This source has previously been reported as the main determinant of the air quality in the vicinity of the airport (Masiol and Harrison, 2014). The LO-OOA factor likely represents fresh secondary organic aerosols (SOAs), demonstrating high variability and sensitivity to ambient temperature fluctuations. The concentration of LO-OOA is at its lowest when daytime temperatures peak. LO-OOA may contain urban contributions and is potentially affected by background urban pollution from Madrid. The observed reduction in the LO-OOA factor during the afternoon can be attributed to dilution effects resulting from the rise in boundary layer height, along with the potential evaporation of LO-OOA particles due to increased ambient temperatures. This is supported by the variance in background particulate matter concentrations located south of the airport compared to those at the sampling point, approximately 6 km apart, as illustrated in Fig. S3. Figure S3 reveals that PM2.5 levels at both locations experience significant increases during morning and evening rush hours, with the sampling point consistently showing higher concentrations than the background location. The diurnal pattern of the background location demonstrates a rapid decrease in PM2.5 levels in the afternoon, unlike the measurements at the sampling point. Additionally, there is a noticeable lag of about an hour between the peak concentrations at the sampling point and those in the background, suggesting the influence of additional combustion sources of PM2.5, notably aviation-related activities, particularly during periods of increased airport traffic. Unlike other factors, MO-OOA shows no significant diurnal variation, indication the formation of aged secondary organic aerosols, often a result of atmospheric transport (Zhang et al., 2007). Detailed statistics of the factors obtained for the entire campaign are provided in the Supplement (Table S1). At Madrid–Barajas Airport, AlkOA exhibited moderate correlations with eBC, NOx, SO2, and CO, as evidenced by the linear correlation coefficients listed in Table 1 (R=0.56, R=0.52, R=0.53, and R=0.52). In contrast, the correlation of these trace gases and both LO-OOA and MO-OOA is lower compared to AlkOA, with R values ranging from 0.2 to 0.5, as shown in Table 1. The slightly higher correlation of AlkOA with BC, NOx, SO2, and CO (R>0.5) relative to LO-OOA and MO-OOA can be attributed to AlkOA being a primary pollutant, emitted directly from the source. Conversely, LO-OOA and MO-OOA are believed to be secondary pollutants, formed through the processes of condensation and coagulation of primary pollutants. In this study, urban contributions are predominantly subject to this processing, as there is insufficient time for significant photochemical oxidation of aviation emissions in such close proximity to the source. Additionally, the diurnal trends of BC, NOx, SO2, and CO can be significantly affected by meteorological conditions (e.g. wind speed, temperature) (Carslaw et al., 2006; Reyes et al., 2018). This influence accounts for their moderate correlation with AlkOA, with R values between 0.52 and 0.56, as detailed in Table 1. Similarly, AlkOA could potentially be affected by meteorological conditions. Since AlkOA is measured as part of AMS submicron particles, it is expected to behave similarly to eBC in the particle phase. Therefore, meteorological conditions likely influence both AlkOA and eBC in a similar manner. AlkOA and trace gases were normalised to facilitate comparison of their diurnal patterns, thereby enhancing understanding of their relative contributions and identifying trends among these pollutants. Normalising is accomplished by dividing the concentrations of the pollutants by their average value. Figure 6 shows diurnal patterns of the AlkOA factor, eBC, NOx, CO, and particle number concentration. The daily trends in eBC, NOx, and CO are mostly similar, with very pronounced increases in concentrations during the morning and evening rush hours. The average concentrations were 1.07 µg m−3, 22.7 µg m−3, and 0.23 mg m3 for eBC, NOx, and CO, respectively (Table S1). AlkOA gradually increases during the morning, with multiple minor peaks observed in the morning hours. The average concentration of AlkOA is higher at night than during the day. This increase is potentially related to daily aircraft activities. AlkOA began to increase, reaching a maximum during the afternoon rush hour from 12:00–18:00. A second rapid increase occurred around 20:00, potentially caused by an increase in the number of flights at this time (Fig. S2). Early-morning AlkOA concentrations are significantly lower compared to those of eBC, NOx, and CO. This difference could be attributed to reduced emissions resulting from decreased aircraft activities in early mornings (Fig. S2). The rise in trace gases and eBC observed in the early morning hours could originate from various airport operations. Such operations might encompass emissions from auxiliary power units, vehicle traffic, and the use of ground service equipment at the airport (Masiol and Harrison, 2014). The total number concentration exhibited a temporal pattern similar to that of AlkOA from 15:00–21:00. Likewise, the temporal profiles of AlkOA and trace gases were similar during the afternoon period (17:00–21:00). This similarity in temporal profiles suggests common source origins, which may be temporally associated with aircraft activity or the influence of background urban pollution.
Table 1Results of linear regression analysis between obtained factors (LO-OOA, AlkOA, and MO-OOA) and external tracers. Data from the entire campaign were used to perform the correlation analysis.
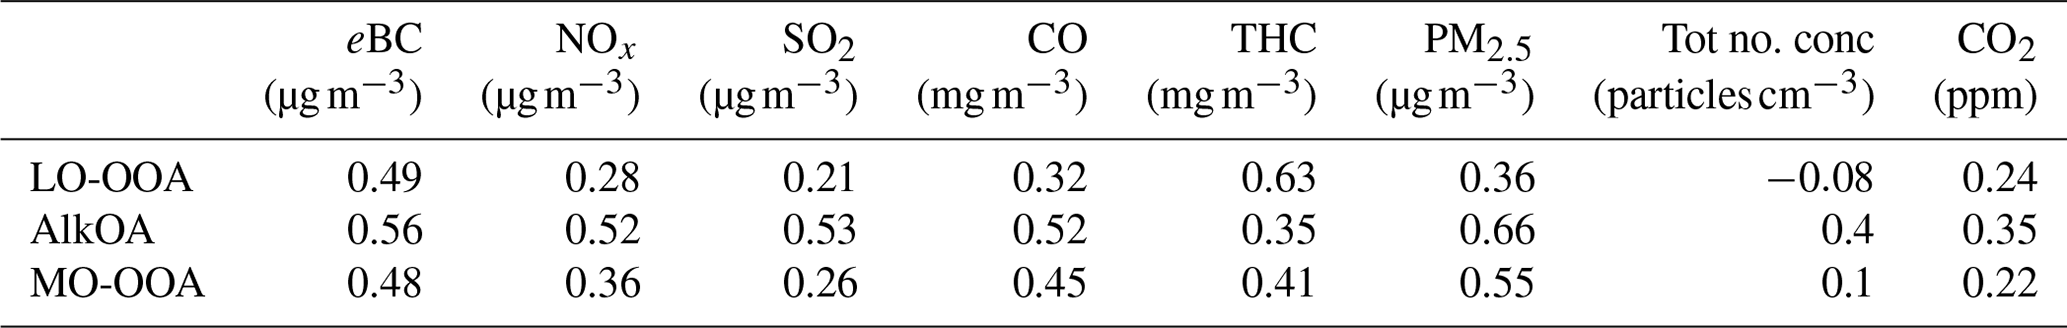
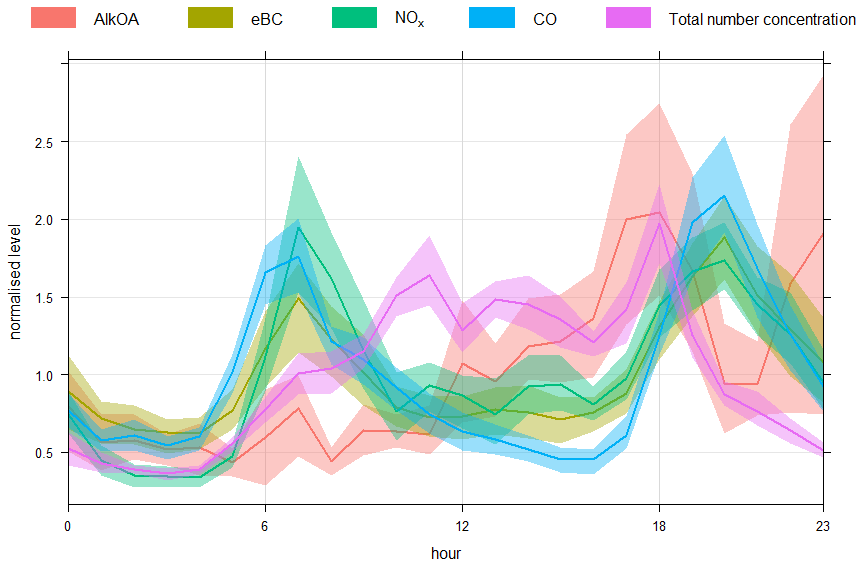
Figure 6The diurnal cycle of AlkOA compared to eBC, NOx, CO, and total number concentration. In this plot, the concentrations are normalised with the objective of comparing the patterns of different pollutants using the same scale.
3.4 Spatial analysis
Varying sources can be discriminated by means of bivariate polar plot techniques (Carslaw and Ropkins, 2012). Figure 7 illustrates the impact of airport activities on the average concentrations of factors (LO-OOA, AlkOA, and MO-OOA) as determined by PMF. The highest concentrations of AlkOA and MO-OOA were observed at low to moderate wind speeds (3–5 m s−1) coming from the west and southwest ( and , respectively), near the terminal buildings (T1, T2, T3, T4, and TS4), two of the runways (14R and 32L as well as 18R and 36L), and a nearby hanger zone. The most significant contributions of LO-OOA occur at wind speeds below 2 m s−1, with a correlation of . At such low wind speeds (<2 m s−1), LO-OOA and MO-OOA are more likely to be mixed and influenced by a nearby source (Crilley et al., 2015; Helin et al., 2018). By contrast, the minimum significant contribution from all factors was observed when the winds originated from the northeast of the airport, accompanied by relatively higher wind speeds (above 4 m s−1). Thus, based on the polar plots shown in Fig. 7, emissions from the terminal buildings and hanger zone located at the southwest of the measurement station are the major sources of total organic particle concentrations at the measurement station. The average contributions of LO-OOA, AlkOA, and MO-OOA were 1.63, 0.63, and 2.35 µg m−3, respectively (Table S1). During the AVIATOR campaign in October 2021, LO-OOA and MO-OOA constituted more than 80 % of the total organic mass. Based on the strength of the relationship outlined in Table 1 between derived factors and external tracers, the linear correlations (Pearson correlation) between (i) AlkOA with eBC and (ii) LO-OOA with THC were measured under varying wind speed and directions, as illustrated in Fig. 8. The relative contributions of AlkOA and LO-OOA were higher with winds originating from southwest of the airport compared to when winds carried air parcels to the sampling point from the northeast, as discussed earlier. However, the correlation coefficient for these factors varies significantly, ranging from 0.2 to 0.9, for all samples collected from various directions within the airport perimeter. For instance, AlkOA exhibits a strong linear correlation with eBC (Pearson coefficient higher than 0.9) when winds originate from the west, east, or northeast, as illustrated in Fig. 8. This correlation is attributed to the impact of runways 18L and 36R as well as 18R and 36L, which are situated to the east and west of the measurement site, respectively, as depicted in Fig. 1, where 90 % of aircraft takeoffs occur. Both AlkOA and eBC are related to jet fuel emissions, as they are directly emitted by aircraft engines as a result of fuel combustion. eBC emissions are a function of engine power settings, reaching their maximum at full thrust during takeoff (Kinsey et al., 2011; Hu et al., 2009). Furthermore, a significant linear correlation was measured between LO-OOA and THC when dominant winds were north easterlies (the air parcels move from runways 18L and 36R to the sampling station). THC emissions at airports are primarily dependent on the jet engine thrust setting (Anderson et al., 2006; Onasch et al., 2009). When engines operate at low thrust settings (e.g. during landing, taxiing, idling), combustion is less efficient, leading to the emission of higher amounts of hydrocarbons. The association between LO-OOA and THC in certain areas of the airport can be interpreted as indicative of fresh emissions from aircraft in service.
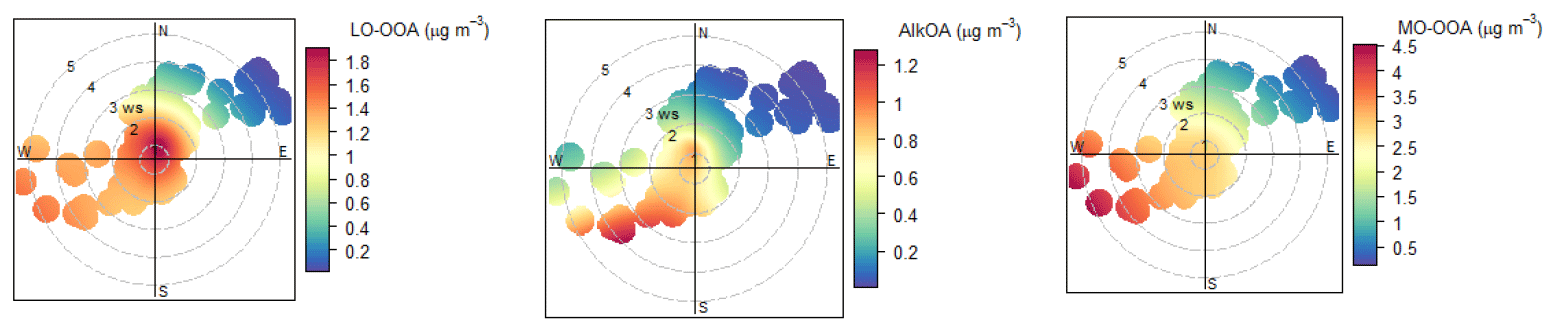
Figure 7Bivariate polar plots for LO-OOA, AlkOA, and MO-OOA (µg m−3). The highest concentrations were measured when the winds originated from the west and southwest. Runways 18R and 36L as well as 14R and 32L are located at the western and eastern sides of the measurement station and the hanger zone, respectively, with terminals T1, T2, T3, T4, and TS4 located at the south and southwest of the measurement site (Fig. 1).
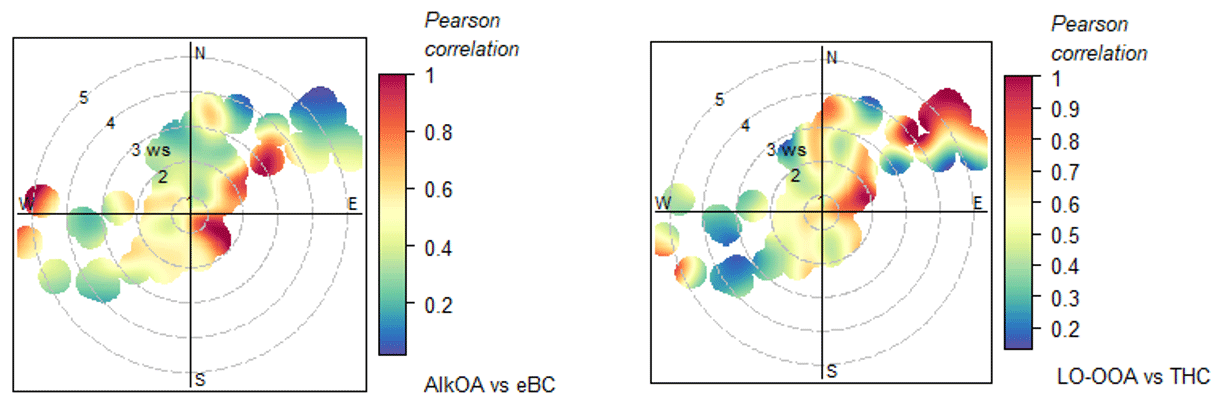
Figure 8A Pearson correlation analysis using bivariate polar plots (above) shows a significant positive linear correlation between AlkOA with eBC and LO-OOA with THC mass concentrations when prevailing winds were northeast (the location of runways 18L and 36R).
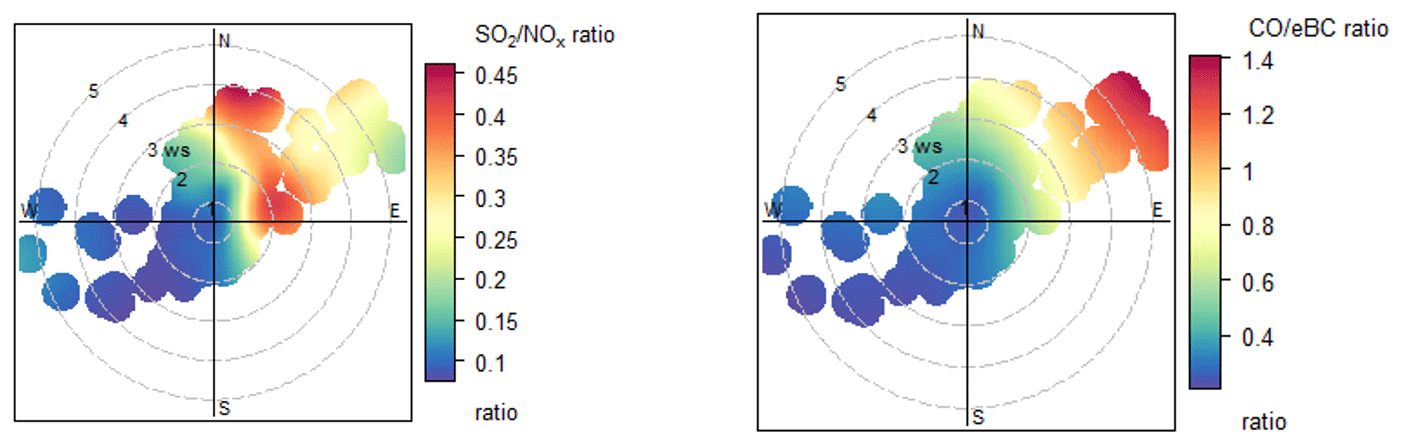
Figure 9Bivariate polar plots of and ratios at the airport. The angular contributions of SO2 and CO are different compared to the PMF-determined factors. The plots indicate that the flight activities at the east and northeast where the 18L and 36R runway is located are the source of increase in SO2 and CO.
NOx emitted by aircraft can potentially affect air quality up to 2.6 km away from the airport (Carslaw et al., 2006). However, accurately determining the airport's contribution to local NOx concentrations presents challenges due to other predominantly mobile sources of NOx in urban areas. In this study, the potential contribution of road traffic surrounding the airport, particularly from the motorways located to the south and southwest, originates from the same direction as runways 14R and 32L and all the terminals. Therefore, NOx contributions were higher from the south and southwest of the airport (including local on-road NOx) compared to those from the northeast. The lowest NOx concentrations were measured under moderate wind speed conditions (above 4 m s−1), as shown in Fig. S1 in the Supplement. This is possibly due to atmospheric mixing and plume dilution caused by advection (Carslaw et al., 2006), given that ground-level source emissions are inversely proportional to wind speed. During this campaign, the AENA (REDAIR) station located at the airport provided measurements of sulfur dioxide (SO2) and carbon monoxide (CO) (Fig. S1). Aviation activities have previously been reported as a significant source of gaseous and vapour-phase pollutants, such as SO2, CO, and NOx (Masiol and Harrison, 2014). In the same vein, mobile sources, such as vehicle exhaust, generally contribute to the increase in CO and NOx levels, as motor vehicle emissions are the dominant sources of CO and NOx emissions in urban areas (Yu et al., 2004). Given that Madrid–Barajas Airport is situated near Madrid and significantly influenced by external sources, particularly traffic on the southwest side of the airport, it experiences considerable environmental impact. Therefore, the ratios of and were used in this analysis as indicators of the relative emission strengths associated with aircraft movements. The ratio would increase in the case of aviation emissions compared to traffic emissions, since NOx emissions from aircraft are difficult to distinguish due to the major influence of other sources (Yu et al., 2004; Carslaw et al., 2006). Consequently, in situations where there are substantial levels of NOx emissions, the ratio will be low due to the impact of on-road vehicle emissions. This enables the identification of the relative contribution of aircraft at the airport, as shown in Fig. 9. The analysis of the and concentration ratios at Madrid–Barajas Airport in October 2021 varies based on wind direction and speed. The bivariate polar plots shown in Fig. 9 indicate higher and ratios were measured when dominant winds originated from the northeast of the airport, where there was minimal or no contribution from road traffic. The higher and ratios suggest the potential impact of aircraft taxiing and takeoff on local ambient SO2 and CO concentrations, particularly when winds originate from northeast, where the 18L and 36R runways are located. SO2 emissions are primarily associated with the sulfur content of the fuel and emissions from aircraft activities at the airport, such as approaching, taxiing, idling, and climbing. As a result, SO2 plays a significant role in tracing aircraft emissions at a local scale (Yang et al., 2018). Black carbon (eBC) and carbon monoxide (CO) are primarily produced by incomplete or inefficient combustion. Around the airport perimeter, aircraft are a significant contributor to CO emissions. Therefore, it is possible for aircraft engines to emit more CO compared to emissions from road traffic, due to the duration spent at the airport in taxiing and idling modes (Yu et al., 2004; Zhu et al., 2011). The ratio significantly varies with the source (Bond et al., 2004), indicating the presence of different emission sources in the vicinity of the airport, as previously reported. The highest levels of CO from aircraft are emitted at low engine power settings, such as during taxiing and idling. This significantly impacts air quality within the airport perimeter, as idle and taxi phases constitute the majority of the time an aircraft spends at the airport (Stettler et al., 2011; Yunos et al., 2017). A higher ratio in air parcels originating from the northeast can also be attributed to aircraft activity on runways 18L and 36R, which are located northeast of the measurement station. Conversely, SO2/NOx and ratios were lower (ranging from 0 to 0.4) when winds originated from the southwest due to significant sources of NOx and eBC in this direction, such as nearby road traffic. Based on the polar plots shown in Fig. 9, an aircraft SO2 and CO signal is identified to the east and northeast, distinct from the wind-dependent NOx pattern. Further details regarding the daily variation in meteorological parameters and trace gases during the sampling period are available in the Supplement (Fig. S1).
This study identified the impact of an international airport on the local air quality. As part of the AVIATOR campaign, several measurements were conducted at Madrid–Barajas Airport in October 2021 to monitor the chemical composition of submicron particles and ambient trace gas concentrations near runways. Assessing the impact of Madrid–Barajas Airport emissions on local air quality is challenging because of the complex nature of airport emissions and the strong influence from urban emissions. The proximity of the airport to urban areas, major highways, roads, and terminal buildings (T1, T2, T3, T4, and TS4) further complicates the task, making it difficult to clearly identify the specific contributions of aircraft emissions. However, aircraft emissions are characterised by high levels of unburned hydrocarbons, SO2, CO, and particulate black carbon (eBC), which are more concentrated around the airport facilities and runways. Therefore, looking at elevated levels of these markers might indicate a stronger influence from aviation-related activities, especially during times of high airport traffic. Total non-refractory particles were dominated by organics (more than 70 % of the total). Sulfate particles were the second-most abundant chemical species and accounted for about 15 % of the total aerosol. Based on AMS data (ratio of ), no significant oil fraction in the organic particulate matter (PM) samples was measured. This could indicate the absence of oil in the submicron particle size range or could be because the method used in this study (AMS) is not able to identify lubricant oil in PM. Thus, further measurements with improved measurement techniques may be required to identify the oil fraction in submicron organic aerosol. Trace gases were also monitored along with the particle monitoring tools. Average ambient concentrations of eBC, NOx, SO2, PM2.5, and PM10 at the airport during October 2021 were 1.07, 22.7, 4.10, 9.35, and 16.43 µg m−3, respectively. NOx contribution at the sampling point was the highest when the winds originated from south and southeast of the airport. There are two motorways with road traffic that are located in the same direction, as well as terminal buildings and runways to the south. Therefore, NOx concentrations were more likely determined by on-road traffic compared to the aircraft activity at the sampling point. Sources of organic aerosols (as the most abundant non-refractory aerosol group) were identified using positive matrix factorisation (PMF) analysis. PMF was able to discriminate between three main significant sources: less oxidised oxygenated organic aerosol (LO-OOA), alkane organic aerosol (AlkOA), and more oxidised oxygenated organic aerosol (MO-OOA). The sum of the LO-OOA and MO-OOA fractions accounted for more than 80 % of the total organic mass throughout the campaign; LO-OOA had the highest relative intensity (RI) at 43 (which is characteristic of LO-OOA), and MO-OOA had a high RI at 28 and 44 (which indicates a potential secondary aerosol fraction). The third factor, AlkOA, had high RIs at 43, 57, and 85 (previously attributed to decane), which is related to jet fuel vapour (Smith et al., 2022). Bivariate polar plots were used for the angular PMF-determined factor and ambient trace gas distributions based on wind speed and wind direction at the airport. It has been found that the PMF-determined factors had the highest relative contributions when the winds originated from the west and southwest of the airport where runways 14R and 32L and 18R and 36L, as well as terminals T1, T2, T3, T4, and TS4, are located. The and ratios have been shown to represent a useful tool for assessing relative emission strength associated with aircraft movements. Takeoff activities northeast of the measurement station were identified as a potential local source of SO2 and CO in Barajas–Madrid. Angular correlation analysis based on wind direction and speed indicated that eBC and THC emissions are potentially determined by aircraft takeoff activities at the 18L and 36R runways located along the east and northeast of the sampling point where more than 50 % of the takeoff activity took place in the sampling period.
There are two previously reported significant ways to reduce aviation emissions at airports, improving efficiency of the processes emitting air pollutants, such as electrification of airport taxiway operations (Salihu et al., 2021) and switching to sustainable alternative fuels where applicable. Improved ground activities at airports, such as an electric aircraft towing system, can potentially lead to an 82 % reduction in CO2 emissions (van Baaren, 2019), while switching to SAF alone reduces the landing–takeoff cycle (LTO) emissions by up to 70 % compared to fossil fuel (Schripp et al., 2022). Further, SAF use for auxiliary power units (APUs) can also potentially reduce NOx and CO2 emissions by at least 5 %. Therefore, improving energy efficiency of ground activities at airports and using SAF are recommended for policymakers to improve the overall air quality at airports.
The codes of this study are available from the corresponding author upon request.
The data of this study are available from the corresponding author upon request.
The supplement related to this article is available online at: https://doi.org/10.5194/acp-24-9045-2024-supplement.
SA, DK, MF, PIW, and JA designed the project; SA, DK, MF, and PIW conducted the fieldwork; SA performed the data analysis and wrote the original draft of the article; DK reviewed and edited the article; PIW and JA supervised the project and reviewed and edited the article.
At least one of the (co-)authors is a member of the editorial board of Atmospheric Chemistry and Physics. The peer-review process was guided by an independent editor, and the authors also have no other competing interests to declare.
Publisher's note: Copernicus Publications remains neutral with regard to jurisdictional claims made in the text, published maps, institutional affiliations, or any other geographical representation in this paper. While Copernicus Publications makes every effort to include appropriate place names, the final responsibility lies with the authors.
This research has been supported by Horizon Europe's European Innovation Ecosystems programme (grant no. 814801).
This paper was edited by Roya Bahreini and reviewed by two anonymous referees.
Alfarra, M. R., Prevot, A. S., Szidat, S., Sandradewi, J., Weimer, S., Lanz, V. A., Schreiber, D., Mohr, M., and Baltensperger, U.: Identification of the mass spectral signature of organic aerosols from wood burning emissions, Environ. Sci. Technol., 41, 5770–5777, 2007.
Amato, F., Moreno, T., Pandolfi, M., Querol, X., Alastuey, A., Delgado, A., Pedrero, M., and Cots, N.: Concentrations, sources and geochemistry of airborne particulate matter at a major European airport, J. Environ. Monitor., 12, 854–862, https://doi.org/10.1039/B925439K, 2010.
Anderson, B. E., Chen, G., and Blake, D. R.: Hydrocarbon emissions from a modern commercial airliner, Atmos. Environ., 40, 3601–3612, https://doi.org/10.1016/j.atmosenv.2005.09.072, 2006.
Anderson, B. E., Beyersdorf, A. J., Hudgins, C. H., Plant, J. V., Thornhill, K. L., Winstead, E. L., Ziemba, L. D., Howard, R., Corporan, E., Miake-Lye, R. C., and Herndon, S. C.: Alternative aviation fuel experiment (AAFEX), NASA, No. NASA/TM-2011-217059, 2011.
Boldo, E., Medina, S., Le Tertre, A., Hurley, F., Mücke, H. G., Ballester, F., Aguilera, I., and Eilstein, D., on behalf of the Apheis group: Apheis: Health impact assessment of long-term exposure to PM2.5 in 23 European cities, Eur. J. Epidemiol., 21, 449–458, https://doi.org/10.1007/s10654-006-9014-0, 2006.
Bond, T. C., Streets, D. G., Yarber, K. F., Nelson, S. M., Woo, J. H., and Klimont, Z.: A technology-based global inventory of black and organic carbon emissions from combustion, J. Geophys. Res.-Atmos., 109, D14203, https://doi.org/10.1029/2003JD003697, 2004.
Canagaratna, M. R., Jayne, J. T., Jimenez, J. L., Allan, J. D., Alfarra, M. R., Zhang, Q., Onasch, T. B., Drewnick, F., Coe, H., Middlebrook, A., and Delia, A.: Chemical and microphysical characterization of ambient aerosols with the aerodyne aerosol mass spectrometer, Mass Spectrom. Rev., 26, 185–222, https://doi.org/10.1002/mas.20115, 2007.
Canonaco, F., Crippa, M., Slowik, J. G., Baltensperger, U., and Prévôt, A. S. H.: SoFi, an IGOR-based interface for the efficient use of the generalized multilinear engine (ME-2) for the source apportionment: ME-2 application to aerosol mass spectrometer data, Atmos. Meas. Tech., 6, 3649–3661, https://doi.org/10.5194/amt-6-3649-2013, 2013.
Carslaw, D. C. and Ropkins, K.: Openair – an R package for air quality data analysis, Environ. Modell. Softw., 27, 52–61, https://doi.org/10.1016/j.envsoft.2011.09.008, 2012.
Carslaw, D. C., Beevers, S. D., Ropkins, K., and Bell, M. C.: Detecting and quantifying aircraft and other on-airport contributions to ambient nitrogen oxides in the vicinity of a large international airport, Atmos. Environ., 40, 5424–5434, https://doi.org/10.1016/j.atmosenv.2006.04.062, 2006.
Crilley, L. R., Bloss, W. J., Yin, J., Beddows, D. C. S., Harrison, R. M., Allan, J. D., Young, D. E., Flynn, M., Williams, P., Zotter, P., Prevot, A. S. H., Heal, M. R., Barlow, J. F., Halios, C. H., Lee, J. D., Szidat, S., and Mohr, C.: Sources and contributions of wood smoke during winter in London: assessing local and regional influences, Atmos. Chem. Phys., 15, 3149–3171, https://doi.org/10.5194/acp-15-3149-2015, 2015.
Eurostat Database: Air transport statistics, https://european-union.europa.eu/index_en (last access: September 2023), 2022.
Fushimi, A., Saitoh, K., Fujitani, Y., and Takegawa, N.: Identification of jet lubrication oil as a major component of aircraft exhaust nanoparticles, Atmos. Chem. Phys., 19, 6389–6399, https://doi.org/10.5194/acp-19-6389-2019, 2019.
He, R. W., Shirmohammadi, F., Gerlofs-Nijland, M. E., Sioutas, C., and Cassee, F. R.: Pro-inflammatory responses to PM0.25 from airport and urban traffic emissions, Sci. Total Environ., 640, 997–1003, https://doi.org/10.1016/j.scitotenv.2018.05.382, 2018.
Helin, A., Niemi, J. V., Virkkula, A., Pirjola, L., Teinilä, K., Backman, J., Aurela, M., Saarikoski, S., Rönkkö, T., Asmi, E., and Timonen, H.: Characteristics and source apportionment of black carbon in the Helsinki metropolitan area, Finland, Atmos. Environ., 190, 87–98, https://doi.org/10.1016/j.atmosenv.2018.07.022, 2018.
Herndon, S. C., Jayne, J. T., Lobo, P., Onasch, T. B., Fleming, G., Hagen, D. E., Whitefield, P. D., and Miake-Lye, R. C.: Commercial aircraft engine emissions characterization of in-use aircraft at Hartsfield-Jackson Atlanta International Airport, Environ. Sci. Technol., 42, 1877–1883, https://doi.org/10.1021/es072029+, 2008.
Hu, S., Fruin, S., Kozawa, K., Mara, S., Winer, A. M., and Paulson, S. E.: Aircraft emission impacts in a neighborhood adjacent to a general aviation airport in Southern California, Environ. Sci. Technol., 43, 8039–8045, https://doi.org/10.1021/es900975f, 2009.
Hudda, N. and Fruin, S. A.: International airport impacts to air quality: size and related properties of large increases in ultrafine particle number concentrations, Environ. Sci. Technol., 50, 3362–3370, https://doi.org/10.1021/acs.est.5b05313, 2016.
Hudda, N., Gould, T., Hartin, K., Larson, T. V., and Fruin, S. A.: Emissions from an international airport increase particle number concentrations 4-fold at 10 km downwind, Environ. Sci. Technol., 48, 6628–6635, https://doi.org/10.1021/es5001566, 2014.
Hudda, N., Simon, M. C., Zamore, W., Brugge, D., and Durant, J. L.: Aviation emissions impact ambient ultrafine particle concentrations in the greater Boston area, Environ. Sci. Technol., 50, 8514–8521, https://doi.org/10.1021/acs.est.6b01815, 2016.
International Civil Aviation Organization (ICAO): Environmental protection. Annex 16 to the Convention on International Civil Aviation, Volume II aircraft engine emissions, ICAO, Montreal, 2016.
Jimenez, J. L., Canagaratna, M. R., Donahue, N. M., Prevot, A. S. H., Zhang, Q., Kroll, J. H., DeCarlo, P. F., Allan, J. D., Coe, H., Ng, N. L., and Aiken, A. C.: Evolution of organic aerosols in the atmosphere, Science, 326, 1525–1529, https://doi.org/10.1126/science.1180353, 2009.
Jonsdottir, H. R., Delaval, M., Leni, Z., Keller, A., Brem, B. T., Siegerist, F., Schönenberger, D., Durdina, L., Elser, M., Burtscher, H., and Liati, A.: Non-volatile particle emissions from aircraft turbine engines at ground-idle induce oxidative stress in bronchial cells, Communications Biology, 2, 90, https://doi.org/10.1038/s42003-019-0332-7, 2019.
Kinsey, J. S.: Characterization of emissions from commercial aircraft engines during the Aircraft Particle Emissions eXperiment (APEX) 1 to 3, U.S. Environmental Protection Agency, Washington, DC, EPA/600/R-09/130, 2009.
Kinsey, J. S., Dong, Y., Williams, D. C., and Logan, R.: Physical characterization of the fine particle emissions from commercial aircraft engines during the Aircraft Particle Emissions eXperiment (APEX) 1–3, Atmos. Environ., 44, 2147–2156, https://doi.org/10.1016/j.atmosenv.2010.02.010, 2010.
Kinsey, J. S., Hays, M. D., Dong, Y., Williams, D. C., and Logan, R.: Chemical characterization of the fine particle emissions from commercial aircraft engines during the Aircraft Particle Emissions eXperiment (APEX) 1 to 3, Environ. Sci. Technol., 45, 3415–3421, https://doi.org/10.1021/es103880d, 2011.
Lee, D. S., Pitari, G., Grewe, V., Gierens, K., Penner, J. E., Petzold, A., Prather, M. J., Schumann, U., Bais, A., Berntsen, T., and Iachetti, D.: Transport impacts on atmosphere and climate: Aviation, Atmos. Environ., 44, 4678–4734, https://doi.org/10.1016/j.atmosenv.2009.06.005, 2010.
Li, N., Hao, M., Phalen, R. F., Hinds, W. C., and Nel, A. E.: Particulate air pollutants and asthma: a paradigm for the role of oxidative stress in PM-induced adverse health effects, Clin. Immunol., 109, 250–265, https://doi.org/10.1016/j.clim.2003.08.006, 2003.
Liu, G., Yan, B., and Chen, G.: Technical review on jet fuel production, Renew. Sust. Energ. Rev., 25, 59–70, 2013.
Masiol, M. and Harrison, R. M.: Aircraft engine exhaust emissions and other airport-related contributions to ambient air pollution: A review, Atmos. Environ., 95, 409–455, https://doi.org/10.1016/j.atmosenv.2014.05.070, 2014.
Mazaheri, M., Johnson, G. R., and Morawska, L.: An inventory of particle and gaseous emissions from large aircraft thrust engine operations at an airport, Atmos. Environ., 45, 3500–3507, https://doi.org/10.1016/j.atmosenv.2010.12.012, 2011.
NIST Mass Spectrometry Data Center: Decane, US Secretary of Commerce, https://webbook.nist.gov/cgi/cbook.cgi?ID=C124185&Mask=200#Mass-Spec (last access: September 2023), 1990.
Onasch, T. B., Jayne, J. T., Herndon, S., Worsnop, D. R., Miake-Lye, R. C., Mortimer, I. P., and Anderson, B. E.: Chemical properties of aircraft engine particulate exhaust emissions, J. Propul. Power, 25, 1121–1137, https://doi.org/10.2514/1.36371, 2009.
Paatero, P.: The multilinear engine – a table-driven, least squares program for solving multilinear problems, including the n-way parallel factor analysis model, J. Comput. Graph. Stat., 8, 854–888, https://doi.org/10.1080/10618600.1999.10474853, 1999.
Paatero, P. and Tapper, U.: Positive matrix factorization: A non-negative factor model with optimal utilization of error estimates of data values, Environmetrics, 5, 111–126, https://doi.org/10.1002/env.3170050203, 1994.
Petzold, A. and Schönlinner, M.: Multi-angle absorption photometry – a new method for the measurement of aerosol light absorption and atmospheric black carbon, J. Aerosol Sci., 35, 421–441, https://doi.org/10.1016/j.jaerosci.2003.09.005, 2004.
Pope III, C. A. and Dockery, D. W.: Health effects of fine particulate air pollution: lines that connect, J. Air Waste Manage., 56, 709–742, https://doi.org/10.1080/10473289.2006.10464485, 2006.
Reyes-Villegas, E., Green, D. C., Priestman, M., Canonaco, F., Coe, H., Prévôt, A. S. H., and Allan, J. D.: Organic aerosol source apportionment in London 2013 with ME-2: exploring the solution space with annual and seasonal analysis, Atmos. Chem. Phys., 16, 15545–15559, https://doi.org/10.5194/acp-16-15545-2016, 2016.
Reyes-Villegas, E., Priestley, M., Ting, Y.-C., Haslett, S., Bannan, T., Le Breton, M., Williams, P. I., Bacak, A., Flynn, M. J., Coe, H., Percival, C., and Allan, J. D.: Simultaneous aerosol mass spectrometry and chemical ionisation mass spectrometry measurements during a biomass burning event in the UK: insights into nitrate chemistry, Atmos. Chem. Phys., 18, 4093–4111, https://doi.org/10.5194/acp-18-4093-2018, 2018.
Rissman, J., Arunachalam, S., Woody, M., West, J. J., BenDor, T., and Binkowski, F. S.: A plume-in-grid approach to characterize air quality impacts of aircraft emissions at the Hartsfield–Jackson Atlanta International Airport, Atmos. Chem. Phys., 13, 9285–9302, https://doi.org/10.5194/acp-13-9285-2013, 2013.
Salihu, A. L., Lloyd, S. M., and Akgunduz, A.: Electrification of airport taxiway operations: A simulation framework for analyzing congestion and cost, Transportation Res. D-Tr. E., 97, 102962, https://doi.org/10.1016/j.trd.2021.102962, 2021.
Schripp, T., Anderson, B. E., Bauder, U., Rauch, B., Corbin, J. C., Smallwood, G. J., Lobo, P., Crosbie, E. C., Shook, M. A., Miake-Lye, R. C., and Yu, Z.: Aircraft engine particulate matter emissions from sustainable aviation fuels: Results from ground-based measurements during the NASA/DLR campaign ECLIF2/ND-MAX, Fuel, 325, 124764, https://doi.org/10.1016/j.fuel.2022.124764, 2022.
Schwarze, P. E., Øvrevik, J., Låg, M., Refsnes, M., Nafstad, P., Hetland, R. B., and Dybing, E.: Particulate matter properties and health effects: consistency of epidemiological and toxicological studies, Hum. Exp. Toxicol., 25, 559–579, https://doi.org/10.1177/096032706072520, 2006.
Smith, L. D., Allan, J., Coe, H., Reyes-Villegas, E., Johnson, M. P., Crayford, A., Durand, E., and Williams, P. I.: Examining chemical composition of gas turbine-emitted organic aerosol using positive matrix factorisation (PMF), J. Aerosol Sci., 159, 105869, https://doi.org/10.1016/j.jaerosci.2021.105869, 2022.
Stettler, M. E. J., Eastham, S., and Barrett, S. R. H.: Air quality and public health impacts of UK airports. Part I: Emissions, Atmos. Environ., 45, 5415–5424, https://doi.org/10.1016/j.atmosenv.2011.07.012, 2011.
Timko, M. T., Onasch, T. B., Northway, M. J., Jayne, J. T., Canagaratna, M. R., Herndon, S. C., Wood, E. C., Miake-Lye, R. C., and Knighton, W. B.: Gas turbine engine emissions – Part II: chemical properties of particulate matter, J. Eng. Gas Turbines Power, 132, 061505, https://doi.org/10.1115/1.4000132, 2010.
Timko, M. T., Albo, S. E., Onasch, T. B., Fortner, E. C., Yu, Z., Miake-Lye, R. C., Canagaratna, M. R., Ng, N. L., and Worsnop, D. R.: Composition and sources of the organic particle emissions from aircraft engines, Aerosol Sci. Tech., 48, 61–73, https://doi.org/10.1080/02786826.2013.857758, 2014.
Ulbrich, I. M., Canagaratna, M. R., Zhang, Q., Worsnop, D. R., and Jimenez, J. L.: Interpretation of organic components from Positive Matrix Factorization of aerosol mass spectrometric data, Atmos. Chem. Phys., 9, 2891–2918, https://doi.org/10.5194/acp-9-2891-2009, 2009.
Ungeheuer, F., Caudillo, L., Ditas, F., Simon, M., van Pinxteren, D., Kılıç, D., Rose, D., Jacobi, S., Kürten, A., Curtius, J., and Vogel, A. L.: Nucleation of jet engine oil vapours is a large source of aviation-related ultrafine particles, Communications Earth & Environment, 3, 319, https://doi.org/10.1038/s43247-022-00653-w, 2022.
van Baaren, E.: The Feasibility of a Fully Electric Aircraft Towing System, Master's thesis, Delft University of Technology, Delft, Netherlands, 2019.
Westerdahl, D., Fruin, S. A., Fine, P. L., and Sioutas, C.: The Los Angeles International Airport as a source of ultrafine particles and other pollutants to nearby communities, Atmos. Environ., 42, 3143–3155, https://doi.org/10.1016/j.atmosenv.2007.09.006, 2008.
Yang, X., Cheng, S., Lang, J., Xu, R., and Lv, Z.: Characterization of aircraft emissions and air quality impacts of an international airport, J. Environ. Sci.-China, 72, 198–207, https://doi.org/10.1016/j.jes.2018.01.007, 2018.
Yim, S. H., Stettler, M. E., and Barrett, S. R.: Air quality and public health impacts of UK airports. Part II: Impacts and policy assessment, Atmos. Environ., 67, 184–192, https://doi.org/10.1016/j.atmosenv.2012.10.017, 2013.
Yu, K. N., Cheung, Y. P., Cheung, T., and Henry, R. C.: Identifying the impact of large urban airports on local air quality by nonparametric regression, Atmos. Environ., 38, 4501–4507, https://doi.org/10.1016/j.atmosenv.2004.05.034, 2004.
Yu, Z., Liscinsky, D. S., Winstead, E. L., True, B. S., Timko, M. T., Bhargava, A., Herndon, S. C., Miake-Lye, R. C., and Anderson, B. E.: Characterization of lubrication oil emissions from aircraft engines, Environ. Sci. Technol., 44, 9530–9534, https://doi.org/10.1021/es102145z, 2010.
Yu, Z., Herndon, S. C., Ziemba, L. D., Timko, M. T., Liscinsky, D. S., Anderson, B. E., and Miake-Lye, R. C.: Identification of lubrication oil in the particulate matter emissions from engine exhaust of in-service commercial aircraft, Environ. Sci. Technol., 46, 9630–9637, https://doi.org/10.1021/es301692t, 2012.
Yu, Z., Timko, M. T., Herndon, S. C., Richard, C., Beyersdorf, A. J., Ziemba, L. D., Winstead, E. L., and Anderson, B. E.: Mode-specific, semi-volatile chemical composition of particulate matter emissions from a commercial gas turbine aircraft engine, Atmos. Environ., 218, 116974, https://doi.org/10.1016/j.atmosenv.2019.116974, 2019.
Yunos, S. N. M. M., Ghafir, M. F. A., and Wahab, A. A.: Aircraft LTO emissions regulations and implementations at European airports, AIP Conference Proceedings, 1831, 020006, https://doi.org/10.1063/1.4981147, 2017.
Zhang, Q., Jimenez, J. L., Allan, J., Coe, H., Ulbrich, I. M., Alfarra, M. R., Takami, A., Middlebrook, A. M., Sun, Y. L., Dzepina, K., Dunlea, E. J., Docherty, K. S., DeCarlo, P. F., Salcedo, D., Onasch, T. B., Jayne, J. T., Miyoshi, T., Shimono, A., and Worsnop, D. R.: Ubiquity and dominance of oxygenated species in organic aerosols in anthropogenically-influenced Northern Hemisphere midlatitudes, Geophys. Res. Lett., 34, L13801, https://doi.org/10.1029/2007GL029979, 2007.
Zhu, Y., Fanning, E., Yu, R. C., Zhang, Q., and Froines, J. R.: Aircraft emissions and local air quality impacts from takeoff activities at a large International Airport, Atmos. Environ., 45, 6526–6533, https://doi.org/10.1016/j.atmosenv.2011.08.062, 2011.