the Creative Commons Attribution 4.0 License.
the Creative Commons Attribution 4.0 License.
 | 20 Aug 2024
The effect of different climate and air quality policies in China on in situ ozone production in Beijing
Zhenze Liu
Freya A. Squires
Marvin Shaw
James R. Hopkins
Jacqueline F. Hamilton
Andrew R. Rickard
Alastair C. Lewis
Zongbo Shi
James D. Lee
In recent years, clean air policies have led to reductions in air pollution across China. Alongside this, emerging carbon neutrality (CN) policies that aim to address the impacts of climate change may also deliver air quality (AQ) co-benefits or climate penalties. Different CN policies will lead to different changes in volatile organic compound (VOC), NOx and particulate matter (PM) emissions, which will in turn impact the photochemical production of secondary pollutants such as ozone (O3). It is currently unclear how different combinations of AQ and CN policies may impact in situ O3 production across China in the future. A detailed chemical box model incorporating the Master Chemical Mechanism was developed to investigate the impact of combined AQ and CN policies on O3 formation in Beijing. The Multi-resolution Emission Inventory model for Climate and air pollution research (MEIC) and the Dynamic Projection model for Emissions in China (DPEC) were used to estimate future pollutant mixing ratios, relative to ambient observations of 35 VOCs, NOx, CO and aerosol surface area (ASA) during the APHH-Beijing 2017 summer campaign. The most ambitious policy scenario, “Ambitious Pollution 1.5D Goals”, led to the largest reduction in O3 production by 2060 but was not the most impactful scenario for reducing O3 production between 2030–2045. Larger reductions were observed under the “Ambitious Pollution Neutral Goals” policy, which focuses on achieving net zero by 2060. O3 production was found to be most sensitive to changes in the OLE2 group of VOCs (alkenes where ppm−1 min−1; a 5 % increase in OLE2 increased simulated O3 production by 1.12 %). However, reducing less reactive but higher concentration species in Beijing (such as short-chain alkanes) led to larger reductions in O3 production under all scenarios. O3 production was not sensitive to changes in ASA, with a 69 % decrease in ASA leading to a change of <1 % in O3. However, doubling biogenic VOCs in the model further increased O3 production in 2060 under all future scenarios by up to 18 %, indicating that the influence of future climate-induced changes in biogenic emissions may have a significant impact on in situ O3 formation in Beijing. This study highlights that the emission trajectories of certain specific VOCs are highly influential in determining possible future O3 air quality effects that may arise from increasing ambient temperatures and decarbonisation in Beijing.
- Article
(2684 KB) - Full-text XML
-
Supplement
(316 KB) - BibTeX
- EndNote


Ground-level ozone (O3) is a secondary air pollutant, formed from the photochemical reactions of volatile organic compounds (VOCs) and NOx (NO + NO2) emitted into the atmosphere. O3 can be detrimental to human health, mainly impacting the respiratory system (World Health Organization, 2013). As well as being directly harmful to human health, ground-level O3 can lead to crop degradation, which can in turn lead to large economic losses (Ainsworth, 2017; IPCC, 2014; Mills et al., 2018). To reduce the global burden of ground-level O3, effective pollution mitigation policies are required to reduce emissions of chemical species leading to O3 production. It is currently unclear how carbon neutrality and other climate targets will impact O3 precursor emissions and, subsequently, O3 production, in parallel with local air quality improvement interventions.
Between 2010 and 2017, a significant decline in anthropogenic emissions of pollutants was observed in China, owing to the implementation of widespread controls (Zheng et al., 2018). Despite an overall increase in population and GDP, reductions in emissions of NOx (17 %), CO (27 %), PM2.5 (35 %), PM10 (38 %), BC (27 %) and SO2 (62 %) have been estimated, with the largest reductions achieved since 2013 following the implementation of the Clean Air Act (Huang et al., 2018; Zheng et al., 2018). Despite success in reducing transportation and domestic stove emissions, persistent growth in emissions from the industry sector and solvent use means that non-methane VOC emissions have only slowed since 2013 (Li et al., 2019). Between 2013–2017, ground-level concentrations of O3 continued to increase due to secondary chemical processes, where the reduction in a set of precursor species without a co-reduction in others may lead to increased O3 formation (Huang et al., 2018). Ambient O3 levels in China regularly exceed health limits set by the World Health Organization (WHO) in urban centres and may continue to do so without the application of effective policy interventions.
Alongside direct air quality controls, future climate and carbon net-zero policies will also have consequences for secondary pollutant formation, with O3 one of the most difficult pollutants to predict for the future. Although climate policies are generally anticipated to deliver significant co-benefits to air quality, there will likely also be some ground-level O3 climate penalties to account for (Fu and Tian, 2019). Some interventions may lead to disbenefits for air quality, particularly for pollutants formed through secondary and/or non-linear chemical processes (Shindell and Smith, 2019).
The complexity of ground-level photochemical O3 formation makes policy evaluation of climate intervention a challenge. Ground-level O3 is formed in urban areas from OH radical-initiated reactions with volatile organic compounds (VOCs) and NOx. Peroxy radical species (ΣRO2 + HO2), formed from reactions of VOCs with OH, oxidise ambient NO to NO2. The rapid daytime photolysis of NO2 leads to the regeneration of NO, along with an oxygen atom (O(3P)), which further reacts with O2 to form O3. O3 production is sensitive to VOC structure and reactivity, where sometimes low concentrations of highly reactive VOCs may lead to significant O3 production (Nelson et al., 2021). However, when concentrations of NOx are very high relative to VOCs, OH radicals preferentially react with NO2, forming HNO3, terminating the radical propagation cycle. This leads to reduced peroxy radical formation and, thus, a reduction in O3 production and is often described as a VOC-limited regime. The non-linear nature of photochemical O3 production means that reductions in NOx under VOC-limited conditions may lead to increased O3 concentrations in NOx-saturated urban areas. In areas of high NOx, NO can act to remove O3 (O3 titration). Consequently, reducing NOx could lead to higher ambient O3 concentrations. This has recently been observed during the SARS-CoV-2 pandemic, where lockdowns in urban centres led to reduced road traffic and reduced NOx emissions, which often coincided with increased O3 levels (Lee et al., 2020; Sicard et al., 2020). In contrast, reductions in NOx in NOx-limited environments where O3 production is controlled by changes in NOx lead to a reduction in O3 production. Recent studies have also shown that reducing particulate matter may exacerbate O3 production further. This is due to the removal of a radical sink process, whereby aerosol particles engage in HO2 uptake. A recent modelling study over Asia described an “aerosol-inhibited” chemical regime, where O3 production can be significantly suppressed by the presence of this heterogeneous radical sink (Ivatt et al., 2022).
Where comprehensive VOC datasets are available, observationally constrained models incorporating detailed chemical mechanisms, such as the Master Chemical Mechanism (MCM; https://www.mcm.york.ac.uk/MCM/, last access: November 2023, Jenkin et al., 2015), can be used to investigate how changes in VOCs, NOx and aerosol surface area (ASA) may impact in situ O3 formation (Nelson et al., 2021). The sensitivity of in situ O3 production rates to changes in individual species (e.g. isoprene) and species subset (e.g. alkanes, alkenes, aromatics) concentrations can then be explored. Alongside its photochemical production, ambient O3 concentrations are also influenced by pollutant transportation both into and out of the measurement site. Although chemical box models do not account for pollutant transport or regional emissions, they are a useful tool to assess local O3 production (Nelson et al., 2021; Whalley et al., 2018, 2021).
A measurement suite of NOx, VOCs, CO, SO2, HONO, aerosol concentration and size, photolysis rates, and meteorological parameters was obtained during a measurement campaign in Beijing, China, in the summer of 2017 as part of the Air Pollution and Human Heath (APHH) programme (Shi et al., 2019). This comprehensive observational dataset is used in this study to tailor a chemical box model to simulate the instantaneous rates of O3 production (base model). The APHH-Beijing 2017 NOx, VOC and aerosol observations were then multiplied by scaling factors (Sect. 2.4) to investigate the change in O3 production rate under different scenarios. The scaling factors were obtained by comparing changes in emissions between the 2017 Multi-resolution Emission Inventory (MEIC) and future anthropogenic emission projections from the Dynamic Projection model for Emissions in China (DPEC) inventory up to 2060. The emissions taken from the DPEC inventory describe six scenarios, based on different air quality and carbon neutrality policies, and provide insight into how O3 production may vary in the future.
2.1 Site and instrument description
Ground-level measurements of volatile organic compounds (VOCs), NOx, CO, SO2, HONO, and aerosol concentration and size were made at the Institute of Atmospheric Physics (IAP), Chinese Academy of Sciences, during the summer of 2017. The measurements were part of a larger Air Pollution and Human Health (APHH) programme, with the aim to better understand the sources, atmospheric transformations and health impacts of air pollutants in Beijing (Shi et al., 2019). The measurement site was located between the third and fourth northern ring roads in Beijing, in an urban residential area (39° N, 116° E). A more detailed description of the measurement site and the instrumentation used can be found in Shi et al. (2019).
Speciated VOC measurements were obtained using a combination of a PTR-ToF-MS (proton transfer reaction time-of-flight mass spectrometry) instrument and a dual-column GC-FID (gas chromatography flame ionisation detector), coupled to Markes International CIA Advantage and UNITY 2 systems for sampling and subsequent pre-concentration of ambient VOC species. Water was removed from the sample via a cold glass finger (−30 °C) before it was adsorbed onto the Markes International Ozone Precursor dual-bed sorbent cold trap. After pre-concentration, the sample was thermally desorbed onto a gas chromatograph and split 50:50 to two columns. This allowed for the detection of both oxygenated (50 m × 0.53 mm Lowox column) and non-oxygenated (10 m × 0.53 mm Al2O3 PLOT column) species. A full list of observed VOCs used in this study is presented in Whalley et al. (2021) and summarised in Sect. 3.3, Table 2.
2.2 Model description
A zero-dimensional chemical box model, incorporating a subset of the Master Chemical Mechanism (MCM v3.3.1; Jenkin et al., 2015; Saunders et al., 2003) into the open-source AtChem2 modelling tool (Sommariva et al., 2020), was used to calculate in situ O3 production rates resulting from the ambient concentrations of precursor species being constrained. The MCM is a near-explicit description of the atmospheric chemical degradation of 143 VOCs, through 17 500 reactions of 6900 species (https://www.mcm.york.ac.uk/MCM/, last access: March 2022). The model was constrained to the campaign-averaged diel concentrations of 35 VOC species (Sect. 3.3, Table 2), NOx, CO, SO2, nine photolysis rates, temperature, pressure and relative humidity. Measured species were averaged or linearly interpolated to 15 min data before incorporation into the model. Each model was run for 5 d, with each day being constrained to the diel of the campaign averaged observations or an adjustment of these observations to investigate sensitivities to O3 production. Only the fifth day was used in this analysis to allow for the spin-up of model-generated intermediate compounds.
The model was also constrained to observed HONO, adjusted to a surface concentration to account for the vertical profile. This was calculated using campaign and hourly averaged measurements of the Deardorff velocity (w*), obtained during co-occurring flux measurements from a 325 m tower located next to the ground-level measurement site (Shi et al., 2019). The Deardorff velocity was used to approximate the rate of vertical HONO transport, allowing for the calculation of adjusted HONO ([HONO]adj) from observed HONO ([HONO]meas) using Eq. (1) (Nelson et al., 2021):
where t is the time taken for [HONO]meas to diffuse to the midpoint of the boundary layer at the measured Deardorff velocity (w*).
Total aerosol surface area (ASA) was also constrained in the model to account for the effect of HO2 aerosol uptake. The first-order loss of HO2 (k) to ASA was calculated using Eq. (2):
where ω is the mean molecular speed of HO2 (43 725 cm s−1 at 298 K); γ is the aerosol uptake coefficient (γ=0.2), as recommended by Jacob (2000); and A is the measured ASA in cm2 cm−3.
The model was constrained to the measured photolysis frequencies of j(O(1D)), j(NO2) and j(HONO), calculated from the measured wavelength-resolved actinic flux, as well as published absorption cross-sections and photodissociation quantum yield data (IUPAC Task Group, https://iupac.aeris-data.fr/, last access: September 2023). The photolysis rates of NO3, HCHO, CH3CHO and CH3COCH3 were calculated by scaling the ratio of clear-sky j(O1D) or j(NO2) to observed j(O1D) or j(NO2) rates, depending on whether the species photolyses above or below 360 nm. A full description of this methodology can be found in Whalley et al. (2021).
The physical loss of model-generated species through deposition or ventilation was estimated by running a model to produce glyoxal and varying these loss rates. Observed glyoxal concentrations were reproducible by the model when the model was constrained to measured boundary layer depth, and a deposition velocity of 0.5 cm s−1 was applied, along with a ventilation term as described by Whalley et al. (2021). A comparison of measured and modelled glyoxal showing good agreement is presented in the Supplement (Fig. S1).
2.3 O3 production and formation potential calculations
The rate of in situ O3 production was calculated by subtracting the rate of instantaneous O3 loss L(O3)inst from the rate of instantaneous O3 production P(O3)inst (see Eqs. 3–5). P(O3)inst is the sum of reactions of NO with both HO2 and RO2, leading to NO2 formation. L(O3)inst is the sum of all O3 loss rates, along with any routes of NO2 consumption that do not lead to O3 formation. This includes O3 loss to HO2 and to water via O1D, as well as NO2 loss to OH and RO2.
where f is the fraction of O(1D) atoms that react with water vapour to form OH, rather than undergoing collision stabilisation. The overall net production of O3. P(O3) was then calculated using Eq. (5):
O3 formation potentials (OFPs) were calculated for each group of VOCs (Table 2) using Eq. (6) (Liu et al., 2023).
where MIR is the maximum incremental reactivity of each VOC, taken from Carter (2010), and [VOC] is the concentration of an individual VOC in µg m−3. The MIR is a metric commonly used to measure the photochemical reactivity of an individual VOC by estimating the mass of O3 produced per fixed mass of the compound of interest (Carter, 2010). The values taken from Carter (2010) are applicable to VOC-limited regions with high NO concentrations. For groups of VOCs (e.g. ARO1; see Table 1), the sum of the OFPs (ΣOFP) is calculated by determining the average daytime (05:00–15:00 local time) OFP for each individual VOC and then summing these OFPs.
Table 1Future scenarios based on different climate and air quality outcomes, as defined by the Dynamic Projection Model for Emissions in China (DPEC). A detailed description of these scenarios can be found in Cheng et al. (2021).
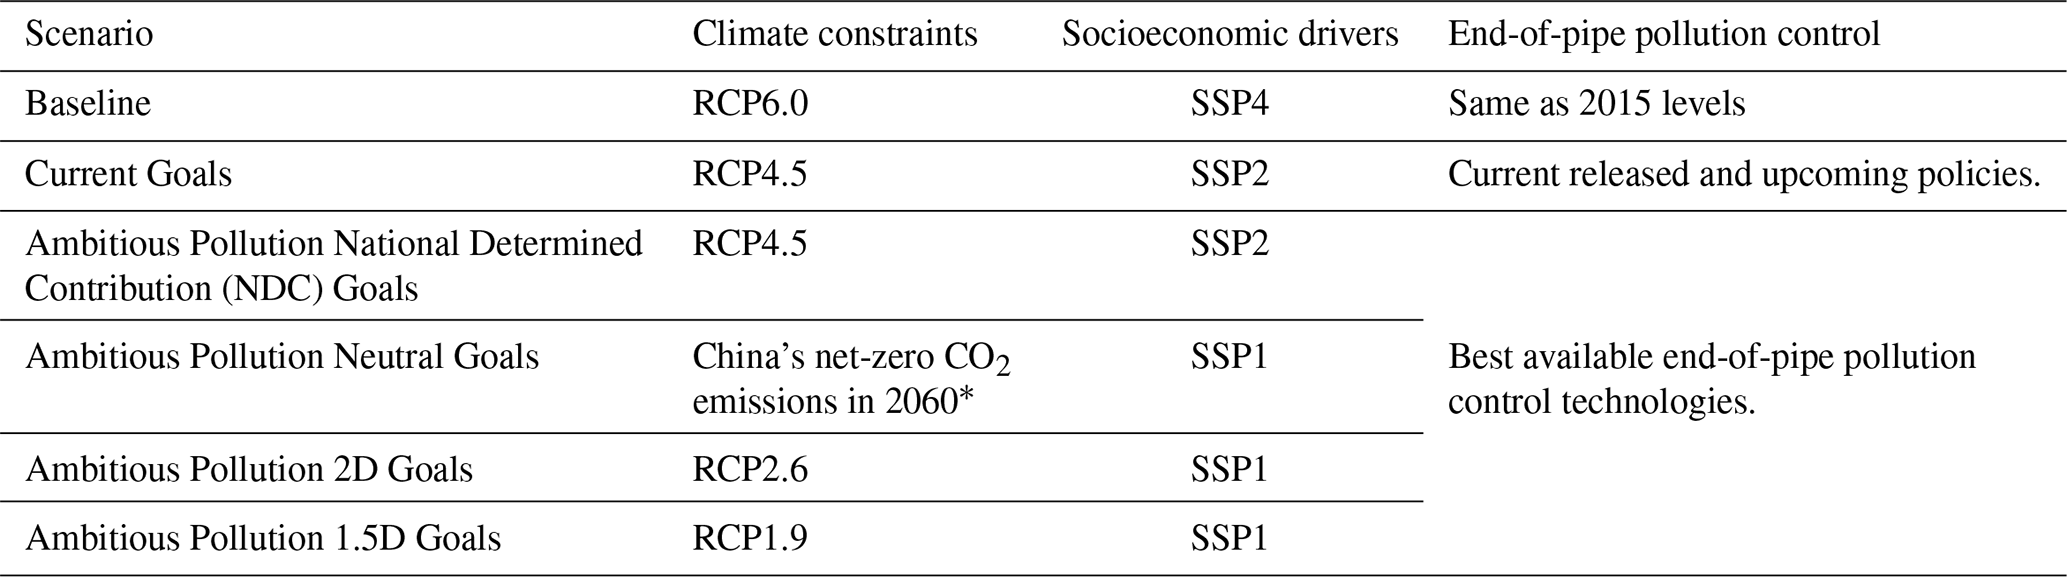
∗ This falls between RCP1.9 and RCP2.6.
2.4 Model scenarios
The Multi-resolution Emission Inventory model for Climate and air pollution research (MEIC) and the Dynamic Projection model for Emissions in China (DPEC) were used to derive estimates for future ambient mixing ratios of chemical species, relative to observations made during the APHH-Beijing summer campaign (http://meicmodel.org.cn/, last access: June 2022). The MEIC inventory provides a high-resolution (0.25°) database of anthropogenic emissions of air pollutants (Li et al., 2014, 2017, 2019; Zheng et al., 2018). The DPEC inventory aims to dynamically project the future emissions of air pollutants in China in the context of socio-economic development, global climate adaptations and carbon neutrality targets, combining pollution mitigation policies and carbon reduction pathways (Cheng et al., 2021). The DPEC inventory contains projections every 5 years until 2060 for six different air pollution mitigation and carbon neutrality scenarios, described in Table 1. Averaged inventory data for May and June were used in this study, aligning with the APHH-Beijing 2017 summer campaign.
Future estimations of VOCs, NOx and aerosol surface area (ASA) were determined by multiplying the 2017 observed values by a scaling factor, calculated by comparing anthropogenic emissions in the 2017 MEIC inventory to emissions in the DPEC inventory for the Beijing region. In this study, all compounds were assumed to have lifetimes within the footprint of the inventory grid. However, we acknowledge that the observed concentrations of some compounds with longer lifetimes (e.g. ethane, propane) will be impacted by emission changes further afield.
The APHH-Beijing 2017 observational dataset was adjusted in five ways to investigate changes to in situ O3 production. This study focuses on the impacts of emission changes on chemical processing, and it is likely that meteorology will also evolve due to a changing climate. However, here we assume that meteorological parameters remain at observed (APHH-Beijing 2017) levels in all scenarios.
-
Scenario 1. Anthropogenic VOCs (AVOCs; see Table 2), which include all observed VOCs excluding isoprene, α-pinene and limonene, and NOx, were each multiplied by a scaling factor of 0.01, 0.025, 0.05, 0.075, 0.1, 0.2, 0.25, 0.3, 0.4, 0.5, 0.6, 0.7, 0.75, 0.8, 0.9, 1, 1.1, 1.25, 1.5, 1.75 and 2. The model was run for all 441 combinations of these factors for VOCs and NOx. This allowed for isopleths to be constructed and, hence, the identification of NOx-limited/VOC-limited transition points.
-
Scenario 2. AVOCs, NOx and ASA were varied using scaling factors calculated from the difference between emissions defined in the 2017 MEIC inventory and projected emissions under six future DPEC scenarios every 5 years between 2025 and 2060 (Table 1).
-
Scenario 3. AVOCs and NOx were varied using scaling factors calculated from the difference between emissions defined in a 2017 inventory and projected emissions under the six future DPEC scenarios, but ASA remains fixed at APHH-Beijing 2017 observed levels.
-
Scenario 4. AVOCs were grouped as defined in the SAPRC07 mechanism (Sect. 3.3, Table 2) and incrementally increased by 5 % to assess in situ O3 sensitivity to individual VOC groupings. A description of the SAPRC07 speciation can be found in Carter (2010).
-
Scenario 5. The observed mixing ratios of VOCs likely to be predominantly from biogenic sources (isoprene, α-pinene and limonene) are multiplied by a factor of 1, 1.1, 1.2, 1.3, 1.4, 1.5, 1.6, 1.7, 1.8, 1.9 and 2 for six future DPEC scenarios for 2060. AVOCs are varied as per DPEC projections.
Table 2List of volatile organic compounds included in the box modelling analysis, including measurement instrument and SAPRC07 group speciation.
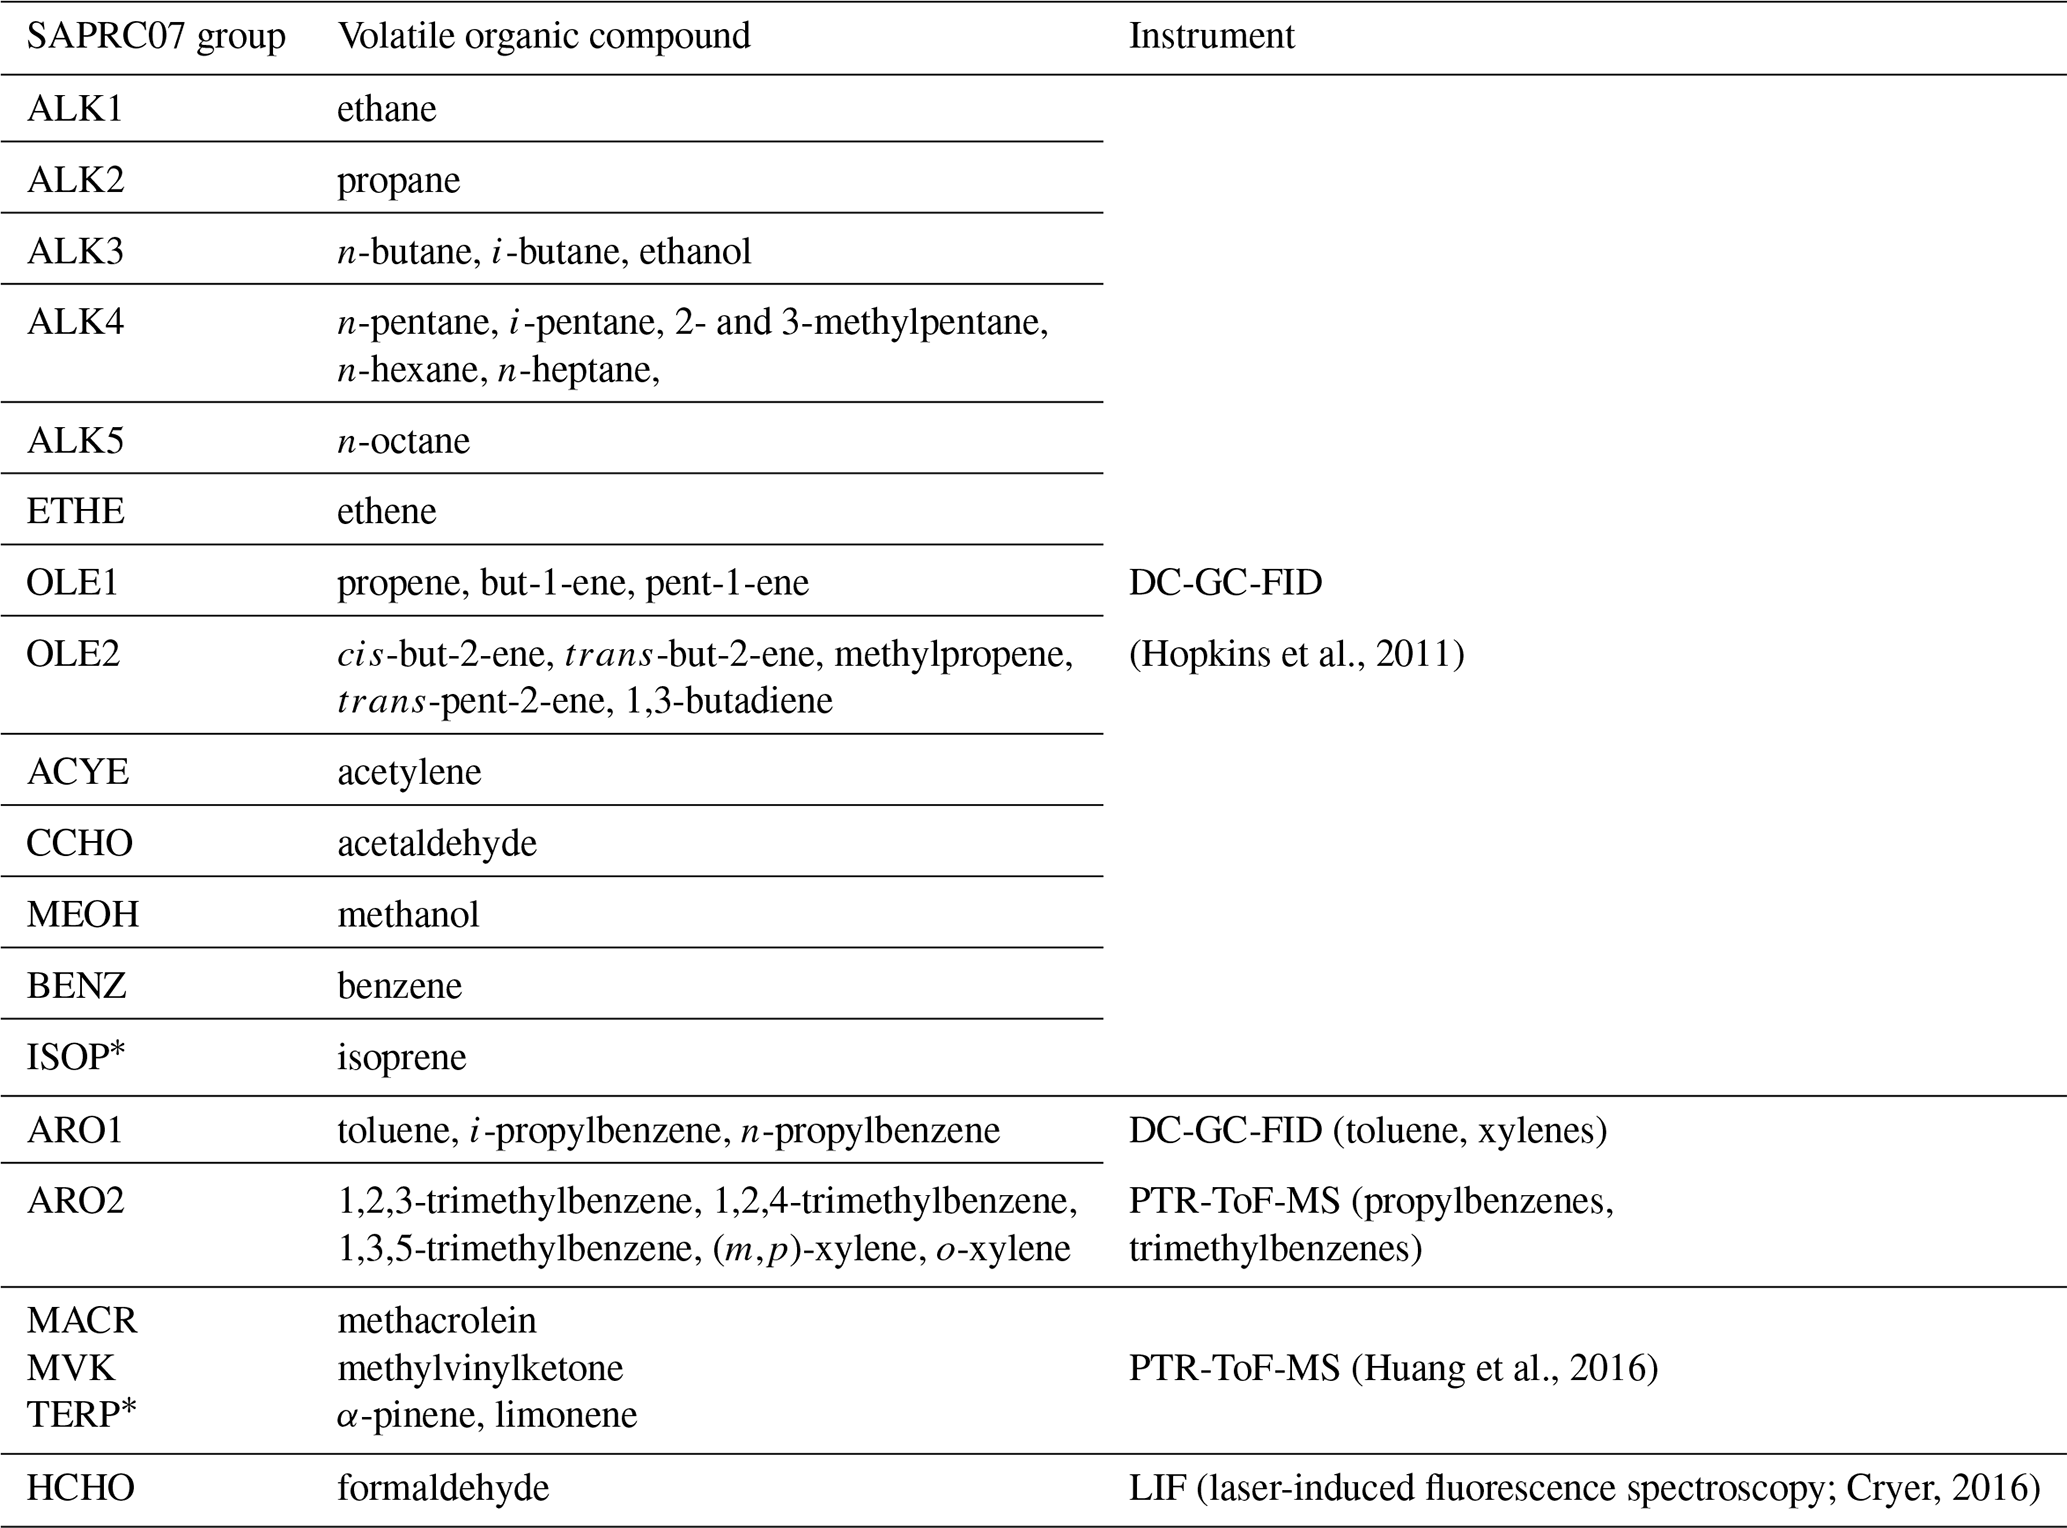
∗ Mixing ratios of ISOP and TERP are not included in “AVOCs” and are kept constant when VOCs are varied by the DPEC inventory, since they are considered to mainly derive from biogenic sources.
3.1 Projected changes in bulk VOCs and NOx since 2017 observations
The DPEC emissions inventory was used to project changes in anthropogenic VOCs and NOx across Beijing since the APHH-Beijing 2017 measurement campaign as described in Sect. 2.4. Projected changes in anthropogenic VOCs and NOx were estimated by comparing emissions estimate differences from the MEIC 2017 inventory with respective DPEC inventories. Figure 1 shows the projected percentage change in anthropogenic VOCs and NOx up to 2060 for the six future scenarios defined in Table 1.
Under current pollution and climate goals defined by DPEC, where intermediate air quality and climate policies are applied (“Current Goals” scenario), NOx and VOCs are projected to reduce by ca. 48 % and 31 % in the Beijing region, respectively, compared to 2017 observed values, by 2030. Reductions in NOx and VOCs are projected for all air quality and climate policy scenarios, except for the “Baseline” scenario. The largest reductions in NOx are achieved with “Ambitious Pollution Neutral Goals” (59 %), followed by “Ambitious Pollution 1.5D Goals” and “Ambitious Pollution 2D Goals” (both 56 %). The largest reductions in VOCs are predicted with Ambitious Pollution 1.5D Goals (42 %), closely followed by Ambitious Pollution Neutral Goals (41 %) and Ambitious Pollution 2D Goals (40 %). However, projections for the Baseline scenario show increased NOx and VOCs by 2030 (43 % and 13 % respectively).
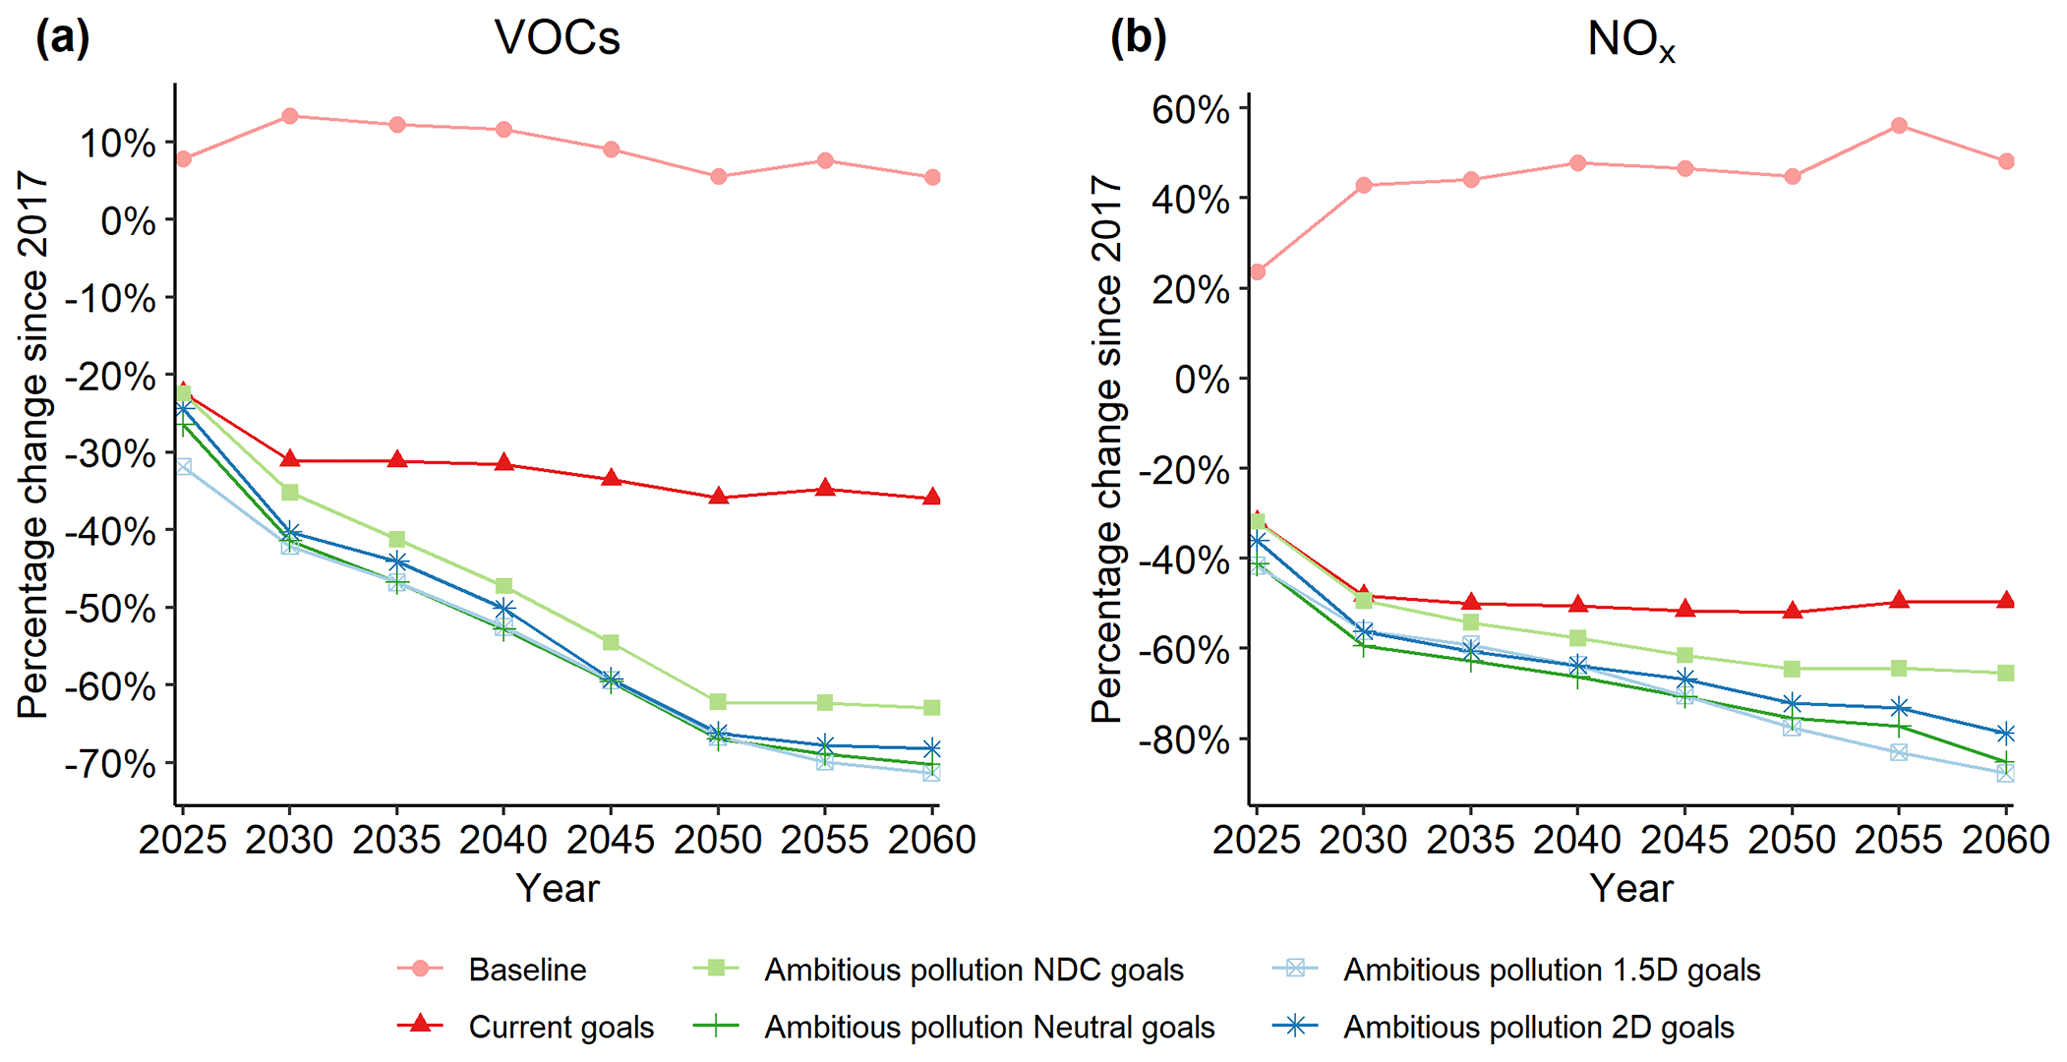
Figure 1Projected change in total anthropogenic VOCs (a) and NOx (b) emissions for the Beijing region since the APHH-Beijing 2017 summer campaign. Six future scenarios described in the DPEC inventory are presented up to 2060.
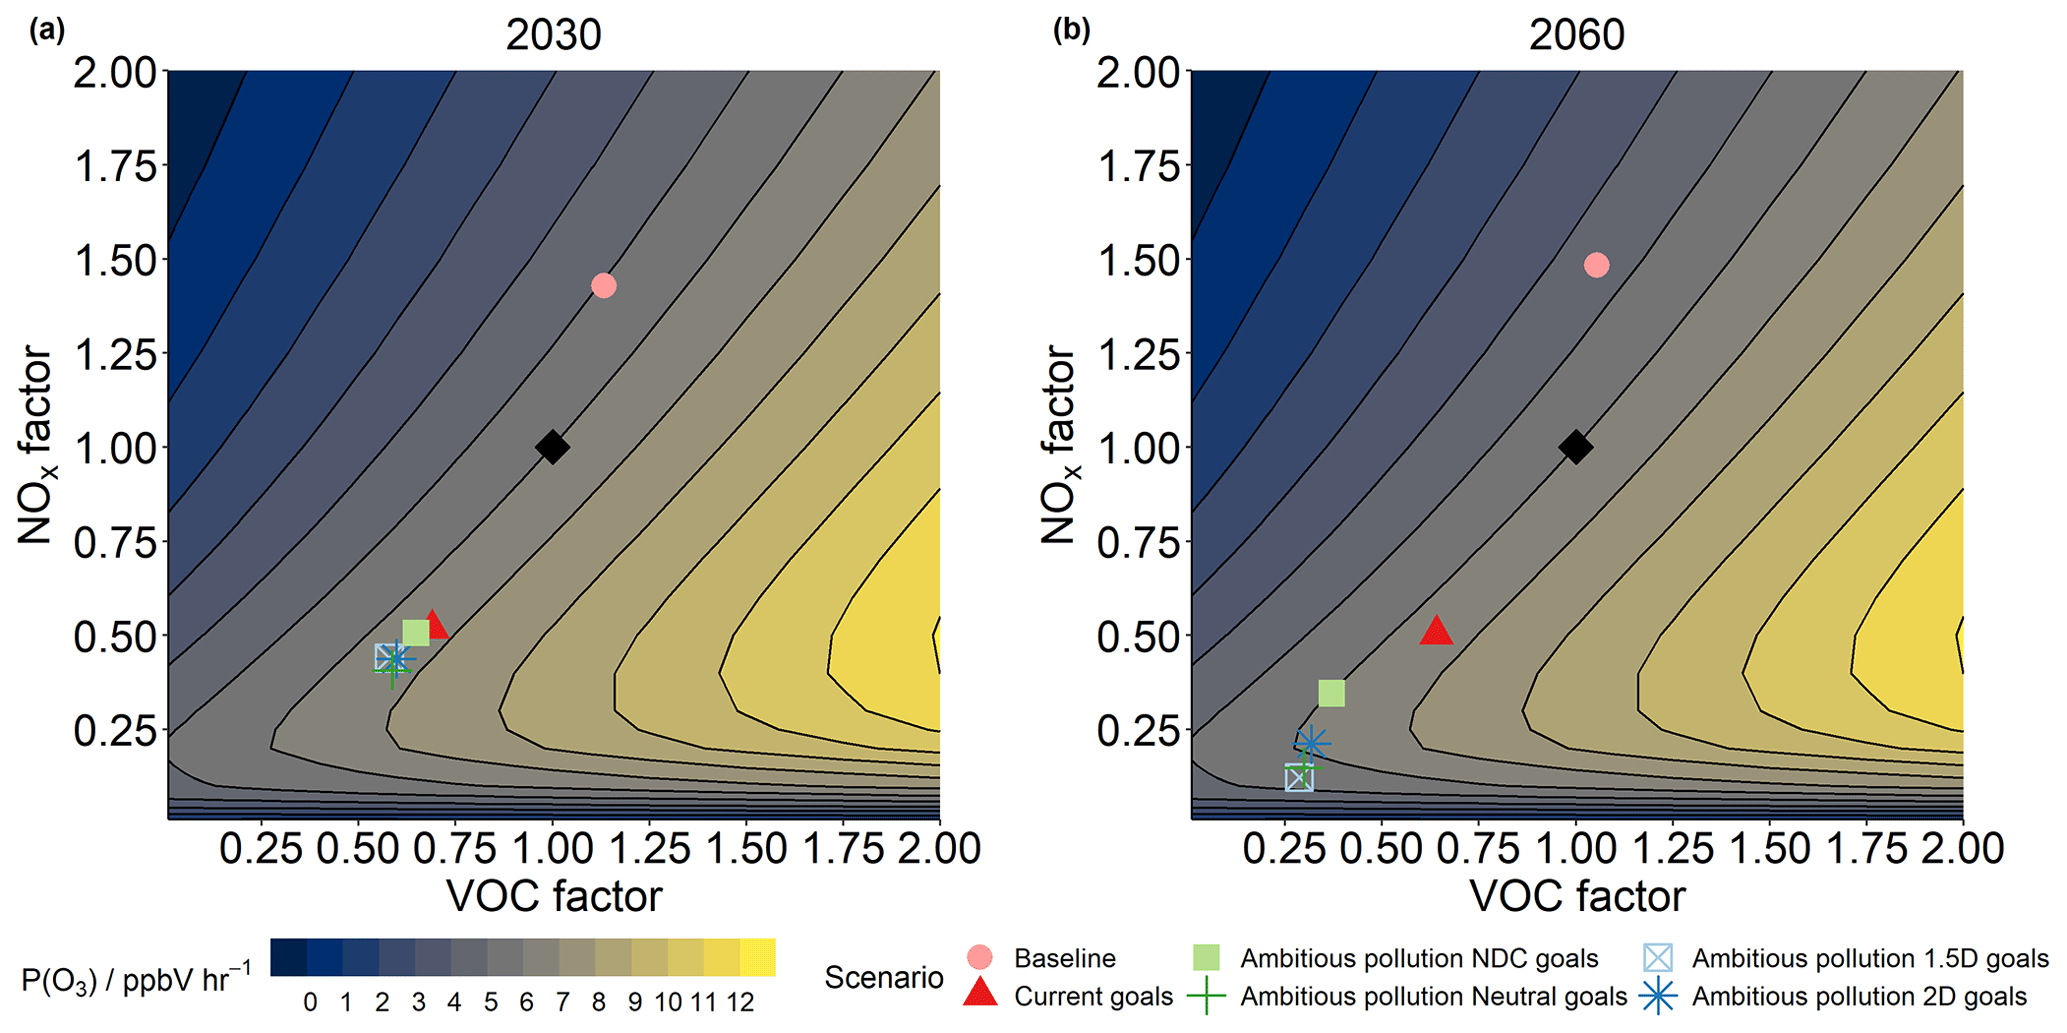
Figure 2Change in the daytime (05:00–15:00 local time) O3 production rate arising from varying observational NOx and VOCs by a scaling factor independent of the DPEC inventory. The black diamond represents modelled O3 production rates using observed values during the APHH-Beijing 2017 campaign. The coloured shapes represent the modelled O3 production rates for each DPEC scenario (Table 1), determined from the projected change in NOx and VOC concentrations by 2030 (a) and 2060 (b) using the DPEC inventory.
3.2 The effect of changes in observed AVOCs and NOx on modelled in situ O3 production rates
First, a model constrained to observations of AVOCs and NOx during APHH-Beijing was varied by different scaling factors to investigate the sensitivity of in situ O3 production rates to its precursor species (scenario 1, Sect. 2.4). This variation is not related to the DPEC scenarios. The resulting isopleth indicates that O3 production at the measurement site in 2017 was VOC-limited (see black diamond, Fig. 2), consistent with previous studies, for example, Li et al. (2020) and Ren et al. (2022). Reductions in NOx up to ca. 75 % without a co-reduction in total VOCs lead to an overall increase in the daytime in situ O3 production rate of up to 30 %. When NOx is reduced by more than ca. 75 %, there is a switch in chemical regime to become NOx-limited, and further reductions in NOx lead to reductions in O3 production. The scaled changes in NOx and VOCs under the six DPEC scenarios (Table 1) were then mapped onto the modelled O3 production rates calculated independently to the DPEC projections (scenario 1, Sect. 2.4). The position of each DPEC scenario on the modelled P(O3) isopleth in 2030 and 2060 using projections for NOx and total bulk AVOCs are shown by the filled diamonds in Fig. 2.
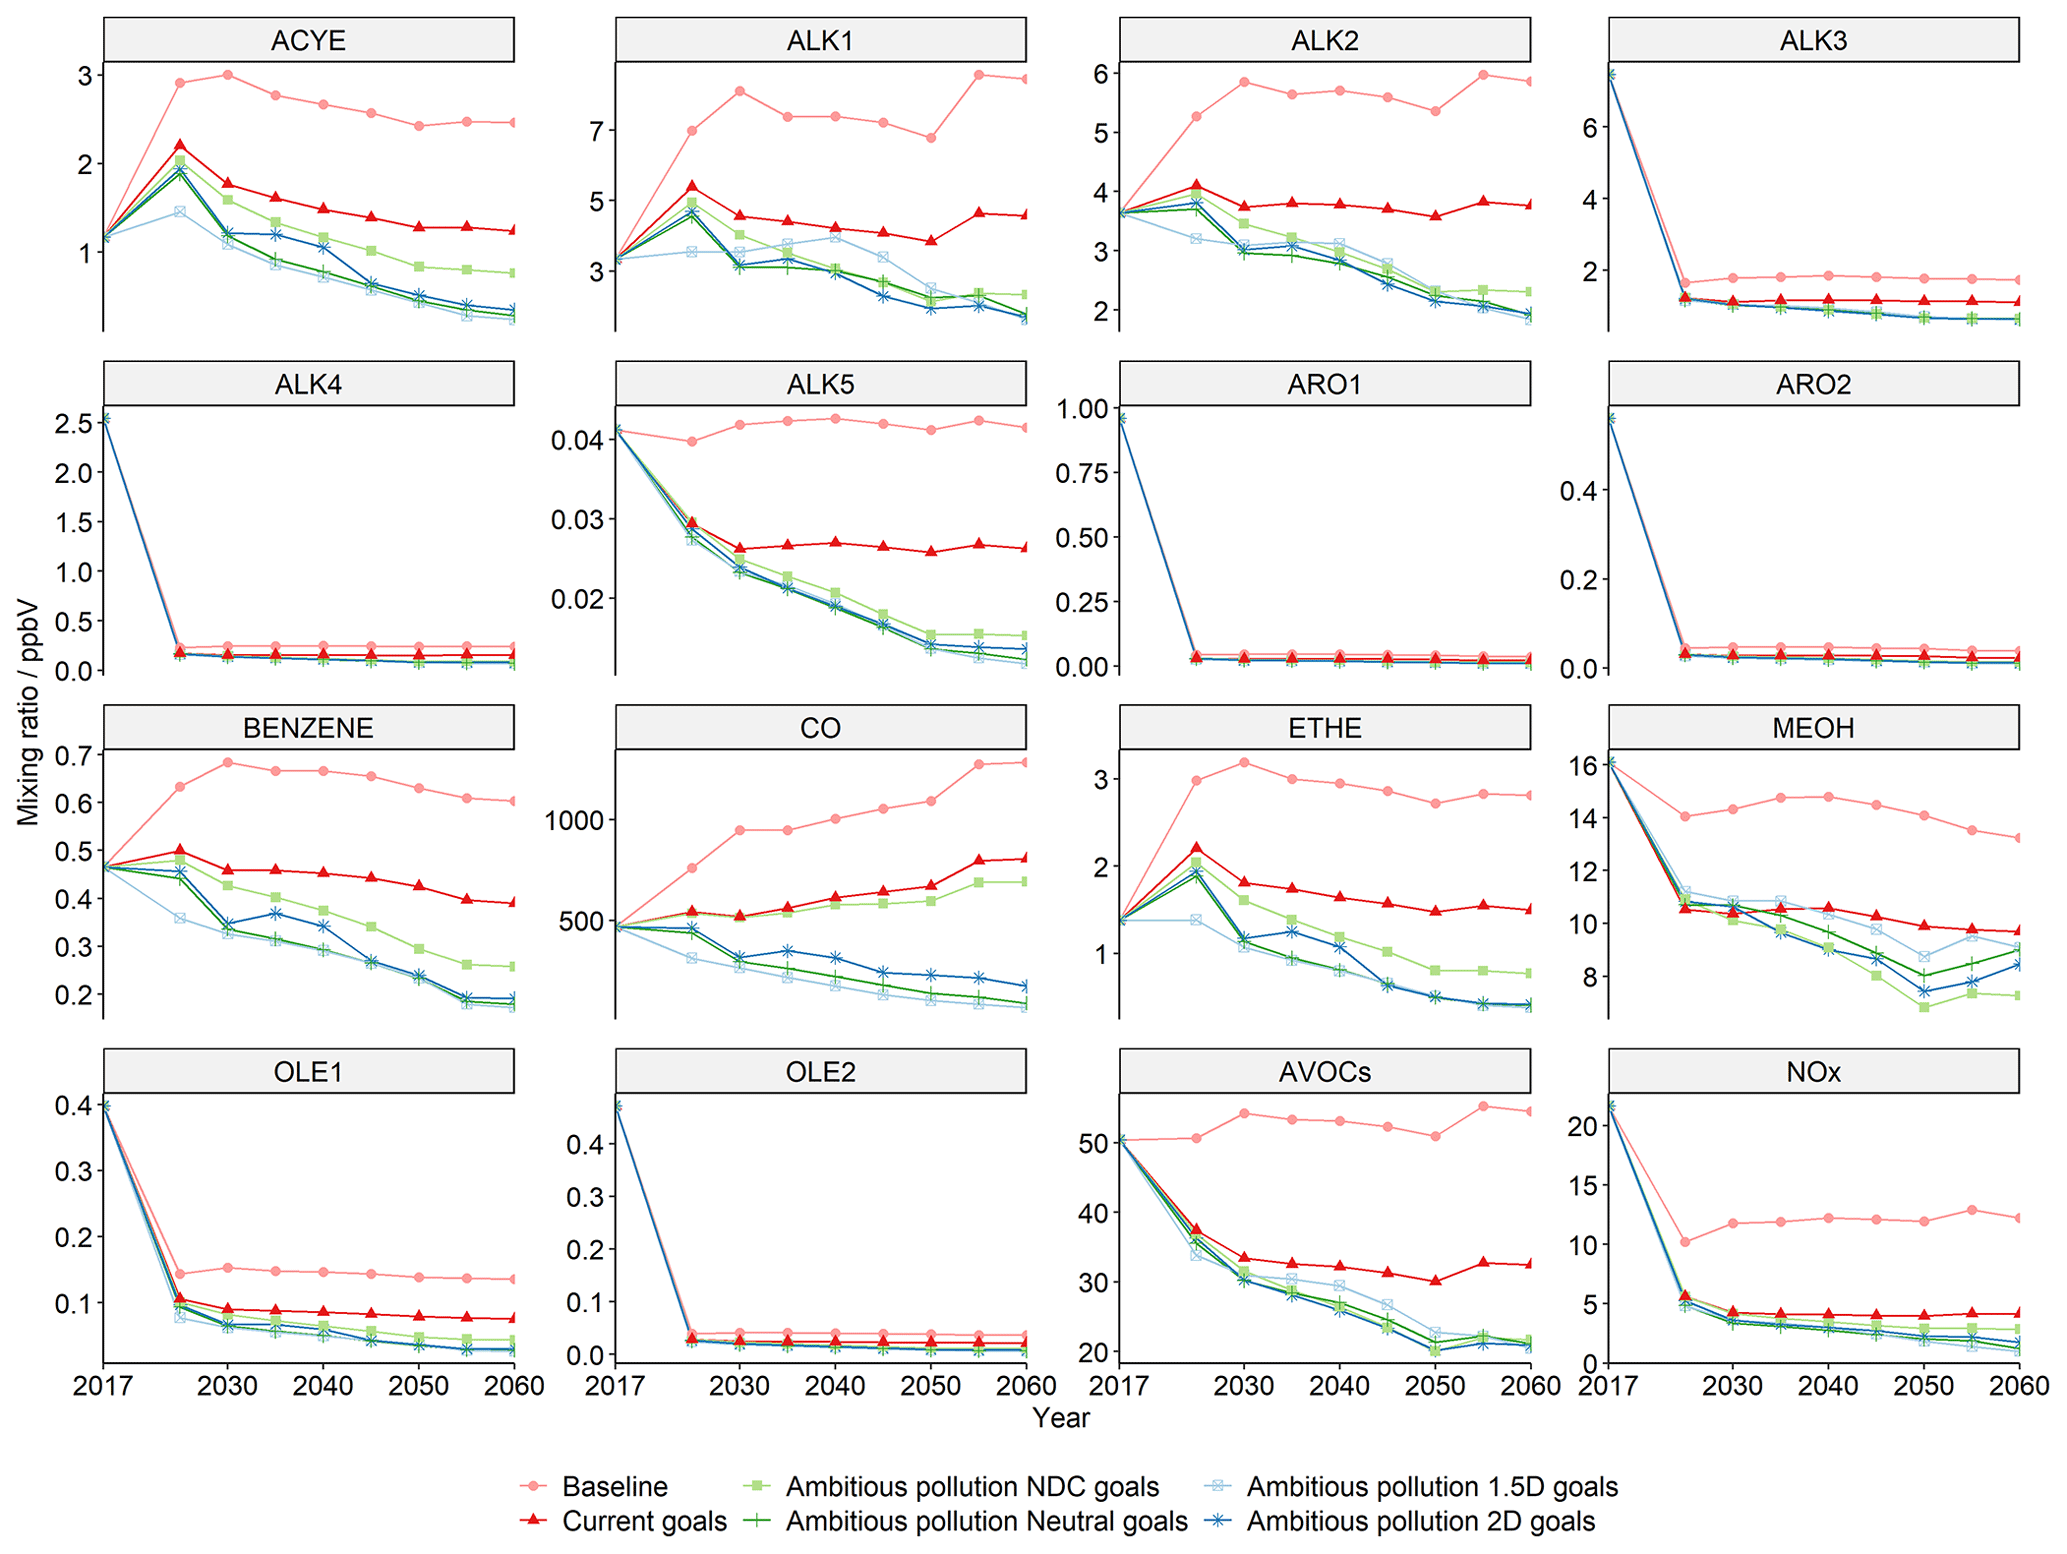
Figure 3Projected absolute change in mixing ratio of key AVOC sub-groups (those observed during APHH-Beijing 2017) and NOx for the six DPEC air pollution and climate policy scenarios (Table 1) every 5 years between 2025 and 2060, in comparison to the APHH-Beijing 2017 campaign. AVOCs include all VOCs observed during APHH-Beijing 2017, excluding isoprene, α-pinene and limonene (Table 2). Note that the y axis scale is different in each sub-plot.
Excluding the Baseline scenario, all scenarios show slight increases in local O3 production rate by 2030 compared to 2017 observations (ca. 0.5 ppb h−1). In contrast, the O3 production rate decreases under the Baseline scenario by ca. 1 ppb h−1, despite increasing NOx and VOCs. By 2060, projected O3 production rates are comparable to the 2017 rate for all Ambitious Pollution policy scenarios, with a 0.5 ppb h−1 increase estimated for the Current Goals scenario. O3 production rates have reduced further for the Baseline scenario, by ca. 1.5 ppb h−1 compared to 2017 rates, by a further 0.5 ppb h−1 compared to 2030. 2060 scenario NOx reductions are sufficient that all Ambitious Pollution policy scenarios are approaching a transition from a VOC-limited to a NOx-limited chemical regime, where further reductions in NOx without additional VOC reduction interventions would result in further reductions in O3 production.
The above analysis provides an overall trend that in situ O3 production might be expected to change when bulk AVOCs are varied alongside NOx. However, we recognise that varying NOx and bulk AVOCs by a fixed scaling factor is not necessarily representative of dynamic changes across multiple sources/sectors. As different policies apply different air pollution and climate change abatement strategies, the types and ratios of different VOC emission changes under different policies may vary significantly. In addition, calculated O3 production rates may not directly translate into increased or decreased ambient O3 levels in the future since overall O3 levels are also dependent on regional effects and chemical transportation. Despite this, the chemical modelling of in situ O3 can still give us important insights into which chemical species have the greatest impact on in situ O3 production, which contributes to overall local O3 levels.
3.3 The effect of changes in VOC groups on in situ O3 production rate
To investigate how in situ O3 production rate varies under different carbon neutrality (CN) policies (Sect. 2.4, Table 1), O3 production rates under each scenario were modelled, up to 2060. Rather than varying bulk VOCs, grouped projected AVOCs were calculated using the DPEC defined change in emissions of the VOC. The VOC groupings are as defined by those in the SAPRC07 chemical mechanism (Carter, 2010; Li et al., 2014), as outlined in Table 2. Emission projections for the different future scenarios are highly uncertain due to their socioeconomic and political nature but can provide us some insight into how in situ O3 production might be impacted by different variations in its precursor species.
The projected changes in mixing ratio for a selection of AVOCs under the six different scenarios are presented in Fig. 3. By 2025, there is an overall reduction in AVOCs (as defined by Table 2, excluding isoprene, α-pinene and limonene which remain at APHH-Beijing 2017 levels) of between 25 %–33 %, except for the Baseline scenario where AVOCs remain unchanged (< 1 %). For many of the reactive AVOCs, large reductions are expected between 2017 and the first projected future scenario in 2025 under all air quality and climate change scenarios. These large reductions (Fig. 3) can be seen in the ARO1 and ARO2 groups (ca. 96 % reduction), as well as the OLE1, OLE2, ALK3 and ALK4 groups (ca. 75 %–95 % reduction). Other VOCs groups, such as ACYE, ALK1 and ETHE initially increase under all scenarios up to 2025 (by ca. 35 %–65 %), before a gradual decline up to 2060 under Ambitious Pollution scenarios (by ca. 50 %–70 %). Overall, the largest VOC reductions are observed under the most ambitious air quality and climate change scenario, Ambitious Pollution 1.5D Goals (by 59 %). However, there are some notable exceptions. High concentrations of methanol (MEOH) were observed in the APHH-Beijing 2017 campaign, and the DPEC inventory does not forecast MEOH to reduce as much in the Ambitious Pollution 1.5D Goals scenario, as it does in the other Ambitious Pollution scenarios between 2025 and 2060. In addition, the ALK1 group is estimated to increase in the region by ca. 19 % by 2040 under the Ambitious Pollution 1.5D scenario but reduces or remains unchanged under the other Ambitious Pollution scenarios.
The resulting modelled O3 production rates when DPEC-scaled changes to concentrations of NOx, SAPRC07-speciated AVOCs, CO and ASA are applied are presented in Fig. 4 (scenario 2, Sect. 2.4).
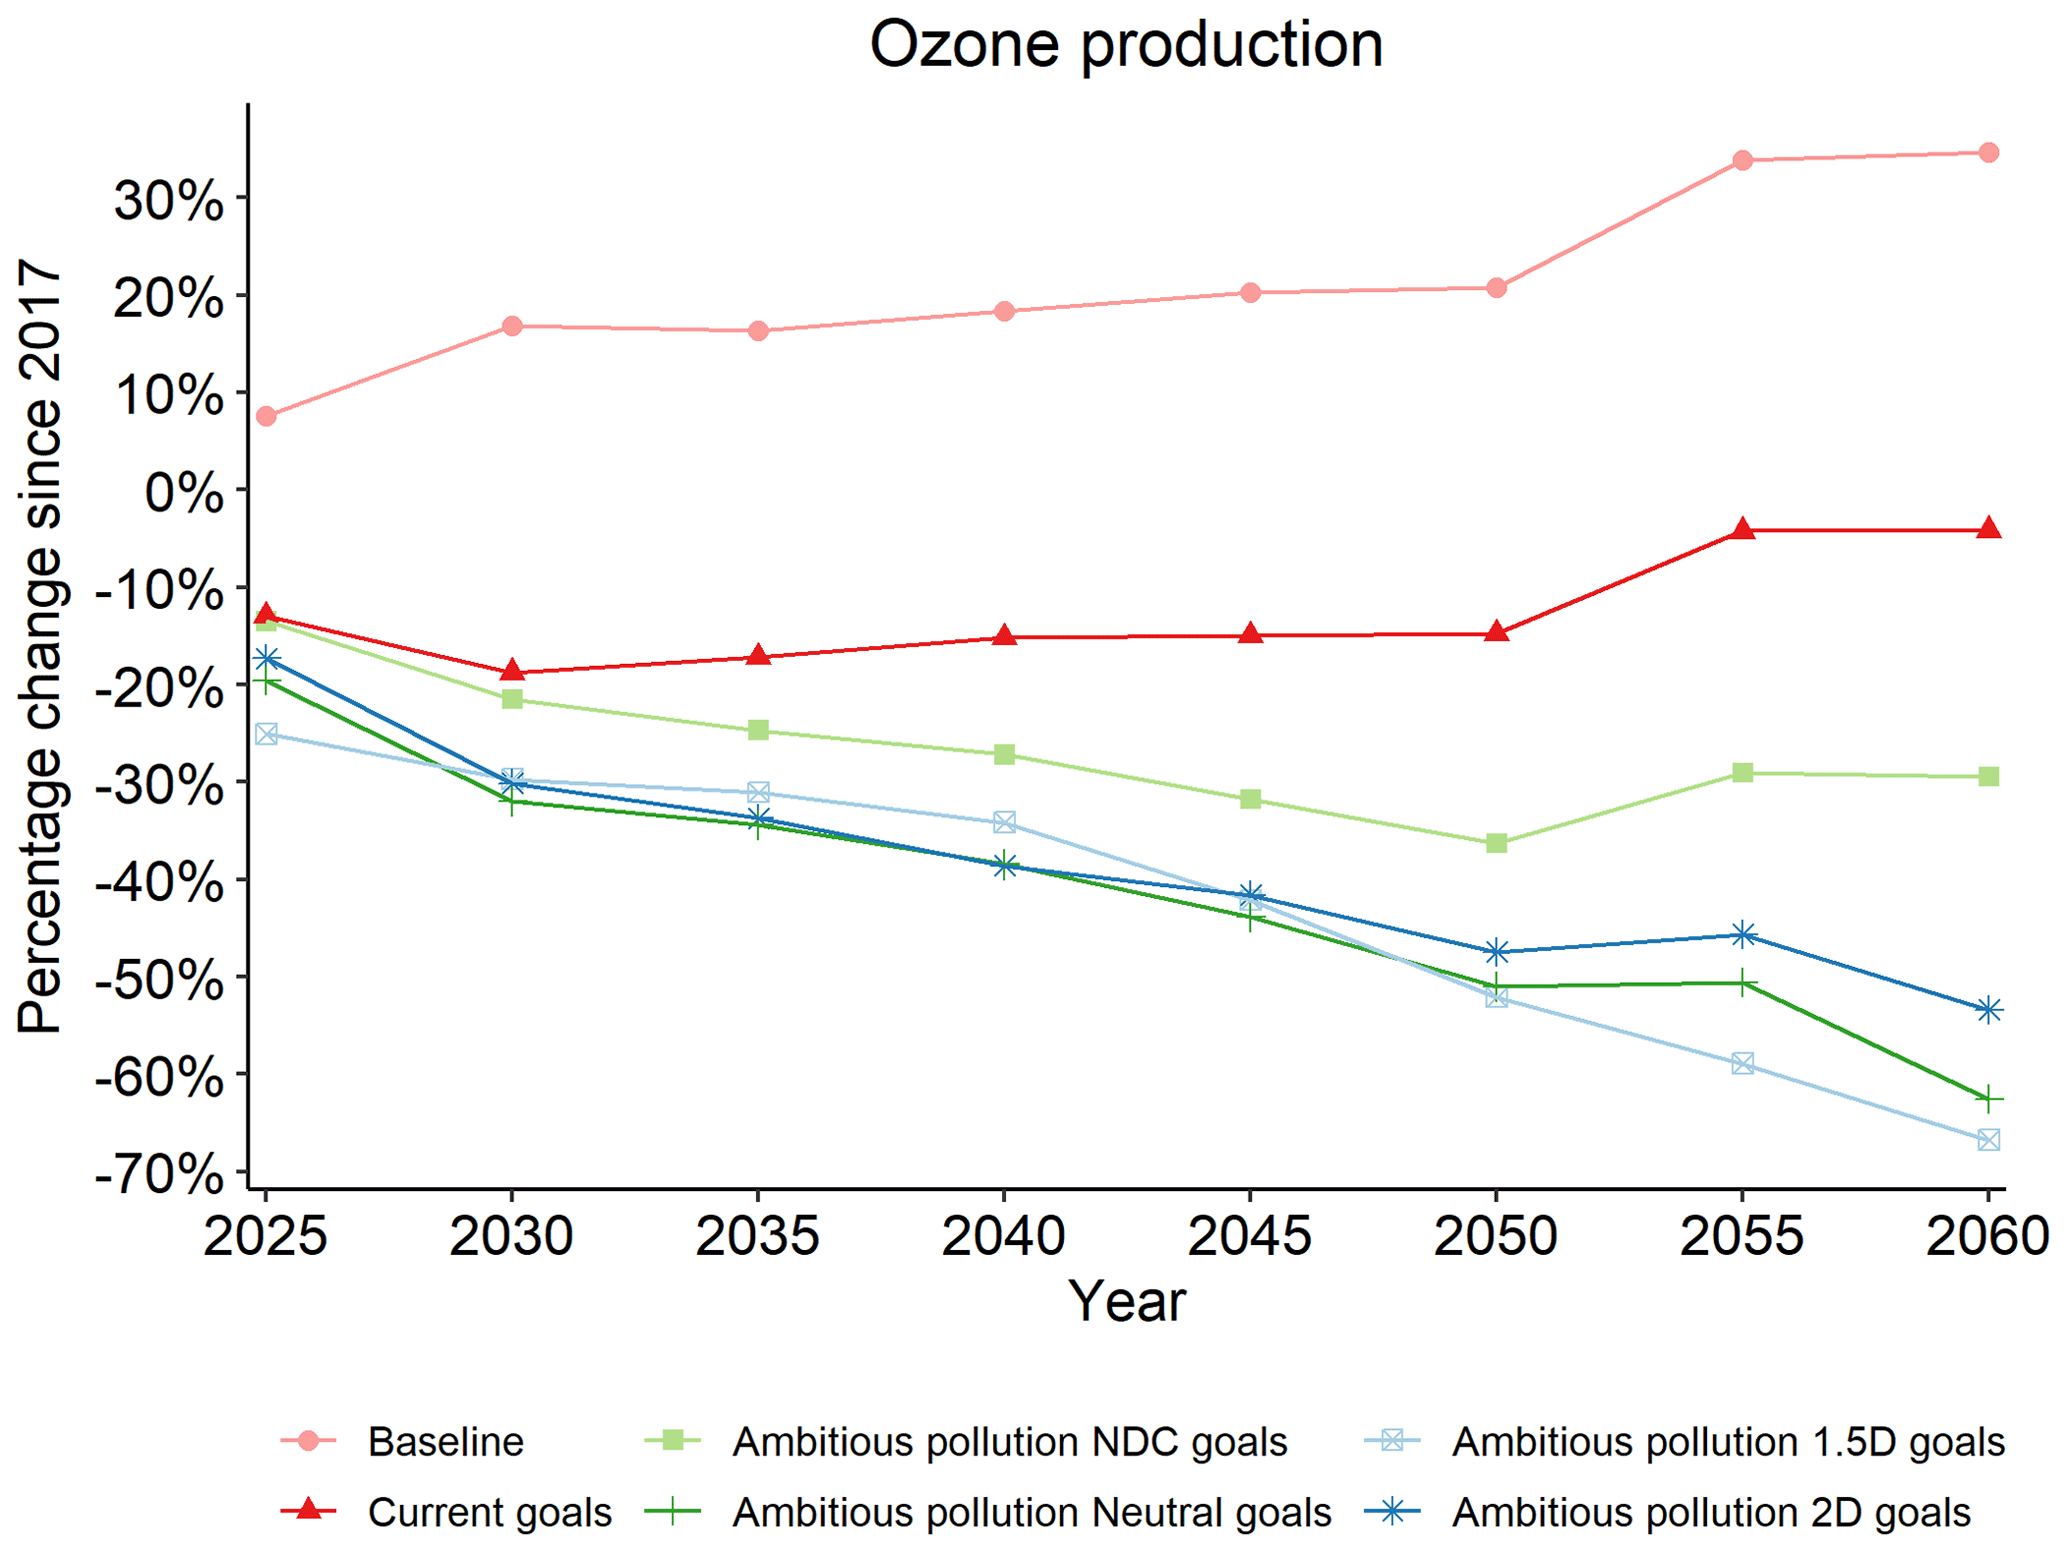
Figure 4Projected percentage change in O3 production rate since 2017 observations, when VOC and NOx observations are scaled using the DPEC emissions inventory.
In contrast to the isopleth projections presented in Fig. 3, when the subset of anthropogenic SAPRC07-speciated VOCs and NOx are varied, overall, all modelled O3 production rates decrease up to 2060 under all scenarios except for the Baseline scenario (by ca. 30 %–60 %). When minimal air quality and climate policies are applied (Baseline scenario), O3 production rate steadily increases up to 2050 by ca. 20 %. Between 2050 and 2055, a steep increase of a further ca. 15 % is projected. Under all other scenarios, O3 production rate reduces with time. However, under the Current Goals scenario, the reduction in O3 formation is significant at first (ca. 20 % by 2030) but increases after 2050, resulting in a minimal difference in production rates between 2017 and 2060. More significant reductions in O3 production are observed under the Ambitious Pollution and climate policy scenarios. The largest reduction in O3 production rate by 2060 is observed under the ambitious pollution policy combined with a climate policy limiting global warming to +1.5 °C, Ambitious Pollution 1.5D Goals (ca. 60 %). However, this policy is not the most effective at reducing local O3 production rates during intermediate years. Interestingly, between 2030 and 2045, two ambitious pollution scenarios with less rigorous climate policies lead to marginally larger reductions in O3 production rate. Ambitious pollution policies with a global warming limit of +2 °C (Ambitious Pollution 2D Goals) and with a net-zero policy by 2060 (Ambitious Pollution Neutral Goals) both reduce O3 production further than the most ambitious climate policy scenario between 2030 and 2045.
The contrast in results for all scenarios using the isopleth analysis (Fig. 2) and the scenario modelling study (Fig. 3), alongside the variation in bulk VOC and NOx in the different scenarios (Fig. 1), highlights the importance of using a detailed chemical mechanism to investigate how changes in emissions might impact O3 production rates in future scenarios. When NOx and VOCs are varied in bulk, the only scenario projected to reduce O3 production is the Baseline scenario. However, the opposite is true when speciated AVOCs are varied by projections defined by the SAPRC07 AVOC groupings in the DPEC inventory. The different scenarios result in different emission reductions in different AVOCs, with different propensities leading to O3 production.
3.4 Sensitivity of in situ O3 production to concentration changes of specific AVOCs and ASA
To further investigate which chemical species are driving the largest changes in O3 production rate, SAPRC07 AVOC groups were incrementally increased by 5 %, with all other groups remaining at 2017 observed levels. The resulting change in O3 production rate for each incremental change is presented in Table 3 and compared to the group-determined maximum incremental reactivities (MIRs) in high NOx conditions and the subsequently calculated O3 formation potentials (OFPs) (see Sect. 2.3).
Table 3Change in O3 production rate, P(O3), when incrementally increasing the observed concentrations of each SAPRC07 AVOC grouping by +5 %. Changes in P(O3) are listed in descending order from the largest increase in P(O3). These are compared to MIRs determined by Carter (2010) and the calculated sum of OFPs for each group (Liu et al., 2023).
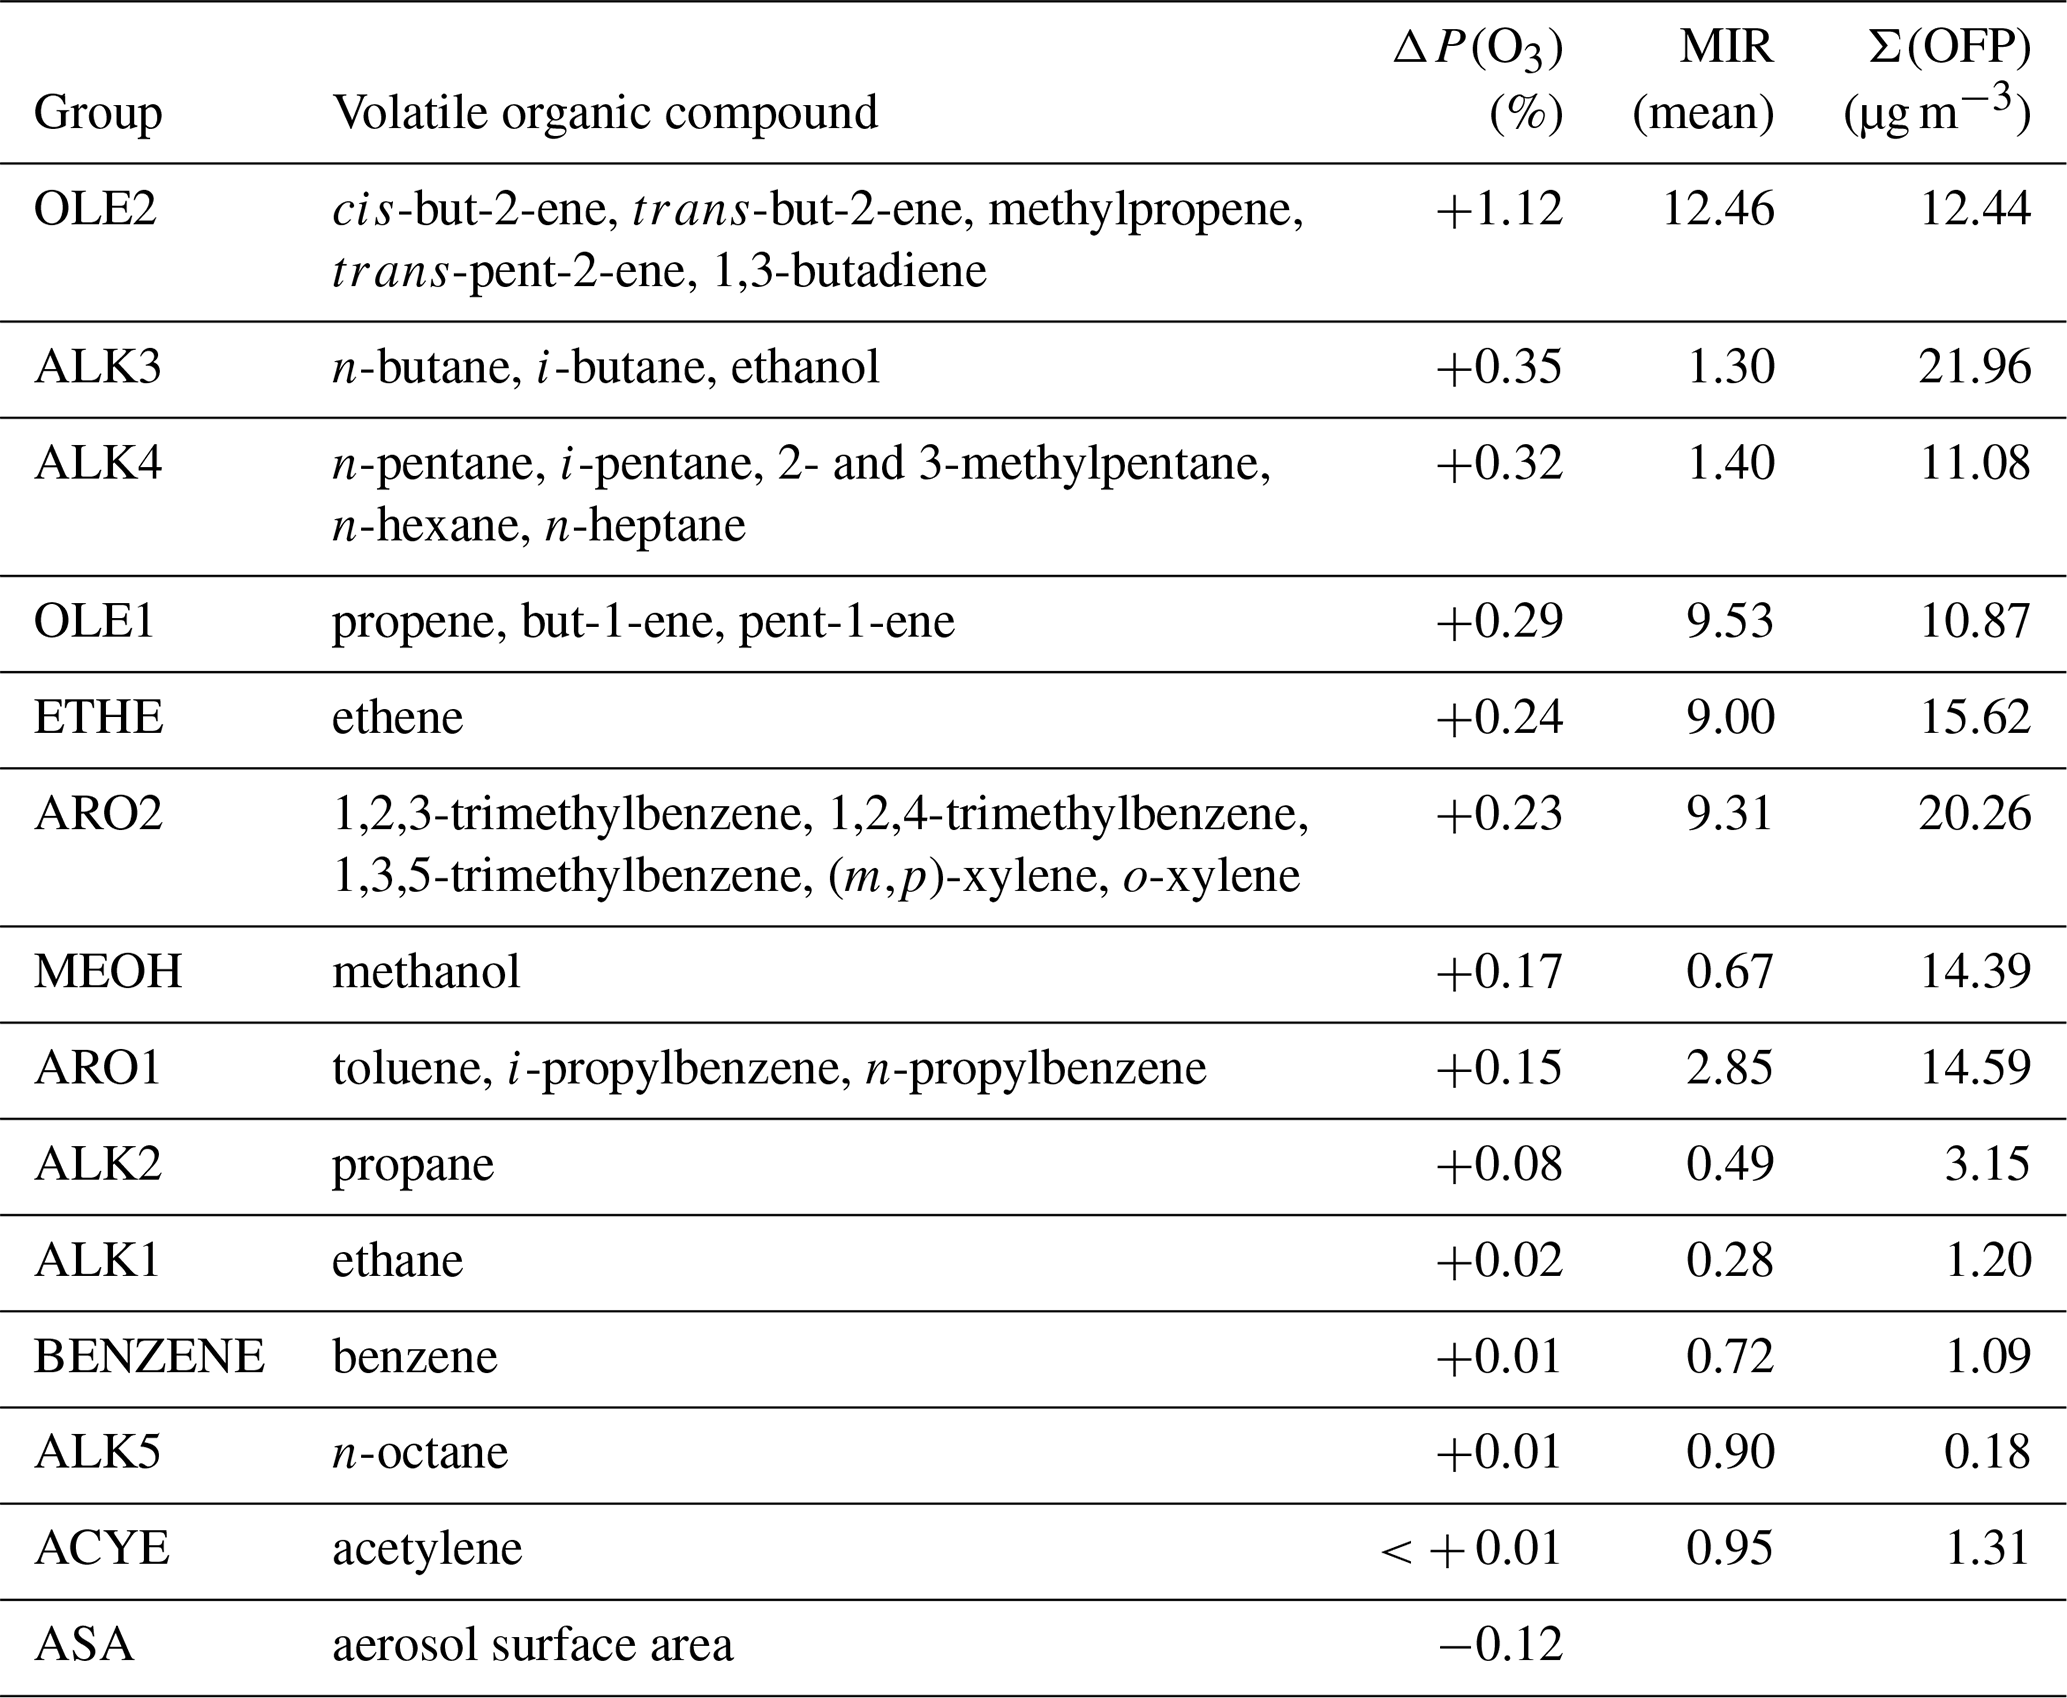
Local in situ O3 production rates in 2017 were most sensitive to changes in the OLE2 group (ΔP(O3) = +1.12 %), which includes highly reactive C4–C5 alkenes such as but-2-enes and trans-pent-2-ene (Table 3). During APHH-Beijing 2017, alkene concentrations were reported to be much higher than a comparable field campaign in London, with mean alkene concentrations more than double those observed during the ClearfLo summer campaign in 2012 (Whalley et al., 2021). Higher concentrations observed during the 2017 campaign, combined with their fast reactivity ( ppm−1 min−1) of these alkenes, result in a high sensitivity of O3 production toward this group. After the OLE2 group, O3 production was most sensitive to changes in the ALK3 and ALK4 groups, which include the C4–C7 alkanes and ethanol, followed by the OLE1 group which includes the less reactive alkenes ( ppm−1 min−1, excluding ethene) such as propene and but-1-ene.
The observed changes in P(O3) in increasing selected species by 5 % are generally in agreement with the maximum incremental reactivities (MIRs) of each species, determined by Carter (2010). However, the total O3 formation potential (ΣOFP) of the ALK3 group is almost double that of the OLE2 group, despite ΔP(O3) being 3 times more sensitive to a 5 % increase in OLE2 than for ALK3. The large OFP attributed to ALK3 is explained by the very high concentrations of ethanol observed during the APHH-Beijing 2017 campaign. However, modelled P(O3) is less sensitive to small changes in ethanol in the APHH-Beijing 2017 model, where the full chemistry, bespoke to the observational data, is accounted for. Although the MIRs derived by Carter et al. (2010) and subsequently calculated ΣOFP are a good guide for determining the key contributors to O3 formation, the detailed chemical model provides a more bespoke tool for assessing the key drivers of in situ O3 formation at this particular location.
The sensitivities of modelled O3 production to these VOCs can be combined with the trends in projected concentrations presented in Fig. 4 to explain why O3 production is not reduced the most under the Ambitious Pollution 1.5D Goals between 2030–2045. Ethane (ALK1) emissions are projected to increase compared to 2017 levels under the Ambitious Pollution 1.5D Goals until 2040 and are a large proportion of AVOCs by mixing ratio (Fig. 3). Although increasing ethane mixing ratios by 5 % only leads to an increase in O3 production of 0.02 %, the observed increase in ethane of ca. 25 % up to 2040 could have a more pronounced impact on increasing O3 production than smaller incremental changes in more reactive species such as OLE2 that are present in much smaller concentrations by 2025 (< 0.1 ppbv compared to ca. 4 ppbv of ethane). Similarly, although this study shows that modelled O3 production rate is not very sensitive to changes in the ALK2 group, substantial concentrations of this VOC group are observed. As a result, the overall trend in AVOCs (Table 2, excluding isoprene, α-pinene and limonene) shows a weaker decline for the Ambitious Pollution 1.5D scenario, which is reflected in the modelled O3 production trend (Fig. 4).
It is worth noting that projections in HONO mixing ratios are not included in the DPEC inventory at the time of this study. As a result, mixing ratios of HONO are kept constant under all model scenarios. How HONO might change under different future scenarios is highly uncertain. Although it is generally expected that HONO mixing ratios correlate with changes in NOx, its formation is dependent on multiple factors including photolysis rates, heterogeneous reactions and meteorological conditions (Sander and Peterson, 1984; Lee et al., 2016). However, a recent study found that reductions in NOx during the COVID-19 lockdowns in the Chinese megacity of Zhengzhou did not lead to comparable reductions in HONO during the day (Wang et al., 2024). When HONO is increased by 5 % in the model, we observe a 1.9 % increase in O3 production. This shows that O3 production is highly sensitive to changes in HONO and emphasises the importance of improving our understanding of how HONO might be expected to change under different socioeconomic, climate and carbon neutrality goals.
3.5 The effect of changes in ASA on in situ O3 production
The observed aerosol surface area during the APHH-Beijing 2017 campaign was also varied using DPEC projections for changes in PM2.5 and PM10. A more detailed description of how aerosol surface area (ASA) is incorporated into the chemical mechanism can be found in Sect. 2.2. The future scenarios were modelled with and without DPEC-derived variations in ASA (scenarios 2 and 3, Sect. 2.4). DPEC projected ASA decreases with time under all scenarios, except for the Baseline scenario. Under Ambitious Pollution 1.5D, 2D and Neutral Goals, ASA is projected to increase up to 2025 before decreasing by ca. 20 %–40 % of 2017 levels by 2030 and then further decreasing to 50 %–70 % of 2017 values by 2060. ASA is projected to increase under “Ambitious Pollution National Determined Contribution (NDC) Goals”, Current Goals and Baseline scenarios by 2030 (64 %, 71 % and 250 % respectively) and by 2060 (21 %, 55 % and 221 % respectively) relative to 2017 levels. Despite large percentage changes in ASA, very small changes in O3 production rate are estimated when DPEC ASA estimates are applied in the model (Fig. 5).
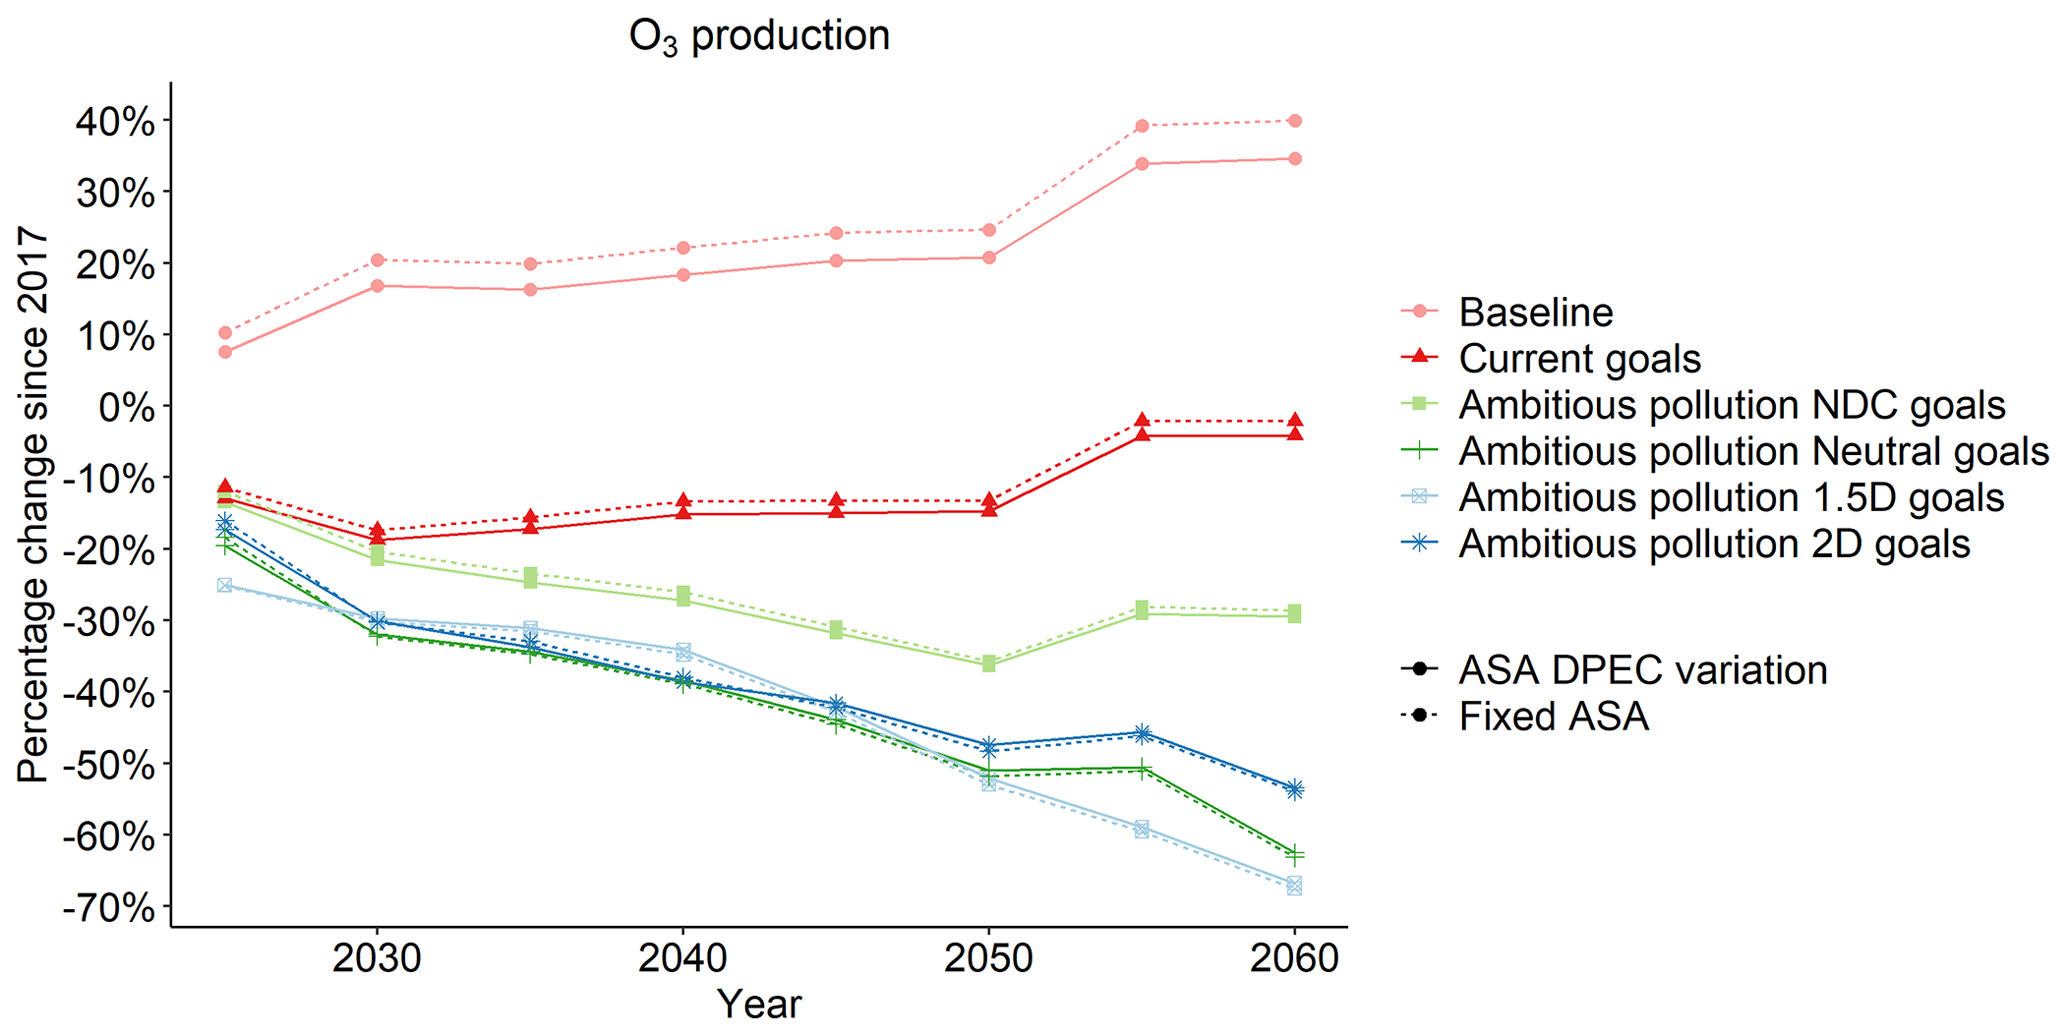
Figure 5Modelled changes in O3 production rate since 2017 levels under six different DPEC future scenarios between 2025 and 2060. Both the modelled O3 production fixed at observed 2017 ASA levels (dashed line) and modelled O3 production rate with ASA varying according to DPEC-derived estimates (solid line) are shown.
On comparing O3 production rate with or without the inclusion of the DPEC-derived ASAs, the largest percentage difference in O3 production was under the Baseline scenario, where O3 production was 5.3 % lower in 2055 and 2060 when large increases in ASA were applied from 2017 on (221 %). This can also be attributed to the large concentrations of AVOCs projected from the MEIC emissions estimates, leading to a larger supply of HO2 radicals to be taken up by the ASA enhancement. Under the only other two scenarios where ASA was estimated to increase less steeply (Current Goals and NDC Goals by 55 % and 22 % by 2060 respectively), including DPEC ASA values had very little impact (1 %–2 % difference in O3 production), and even smaller changes were found for scenarios where DPEC ASA was projected to decrease (Ambitious Pollution 1.5D, 2D and Neutral Goals by 69 %, 59 % and 64 % by 2060 respectively), with percentage differences < 1 %. This suggests changes in ASA will not appreciably impact O3 production under the future DPEC scenarios. A study by Whalley et al. (2021) evaluating O3 formation sensitivity to the APHH-Beijing 2017 observations found that reductions in ASA only enhanced HO2 concentrations under very low NOx (< 0.3 ppbv) at observed VOC levels. This is also consistent with previous studies, which suggest there is no evidence that aerosol chemistry has significant impact on ozone production in the North China Plain and that aerosol light extinction may cancel out the impacts of aerosols on ozone production in South China (Tan et al., 2020, 2022). This suggests that under the DPEC scenarios presented here, co-reductions in VOCs alongside NOx sufficiently reduce HO2 to reduce the impact of ASA on resultant O3 production rates.
3.6 The effect of biogenic compounds on in situ O3 production rate
Whilst DPEC projections can be used to project changes in anthropogenic emissions of VOCs and NOx, it is less clear how local biogenic emissions will change up to 2060. As compounds such as isoprene and the monoterpenes are primarily from biogenic sources, changes in their mixing ratios have not yet been accounted for in the anthropogenic VOC subset (AVOCs) used in this modelling study. However, with increasing global temperatures and urban greening, it is estimated that biogenic VOC (BVOC) emissions in Beijing will increase over time, with recent studies estimating a 25 % increase in biogenic emissions in China in the 2050s (Liu et al., 2019; Xie et al., 2017).
To investigate the sensitivity of projected O3 production rate to increasing BVOC emissions under the six different scenarios, the models were re-run for 2060, with isoprene, α-pinene and limonene multiplied by a scaling factor of between 1 and 2 at 0.1 increments (scenario 5, Sect. 2.4). Figure 6 shows how the change in O3 production rate since 2017 varies for the six scenarios with increasing isoprene, α-pinene and limonene in 2060.
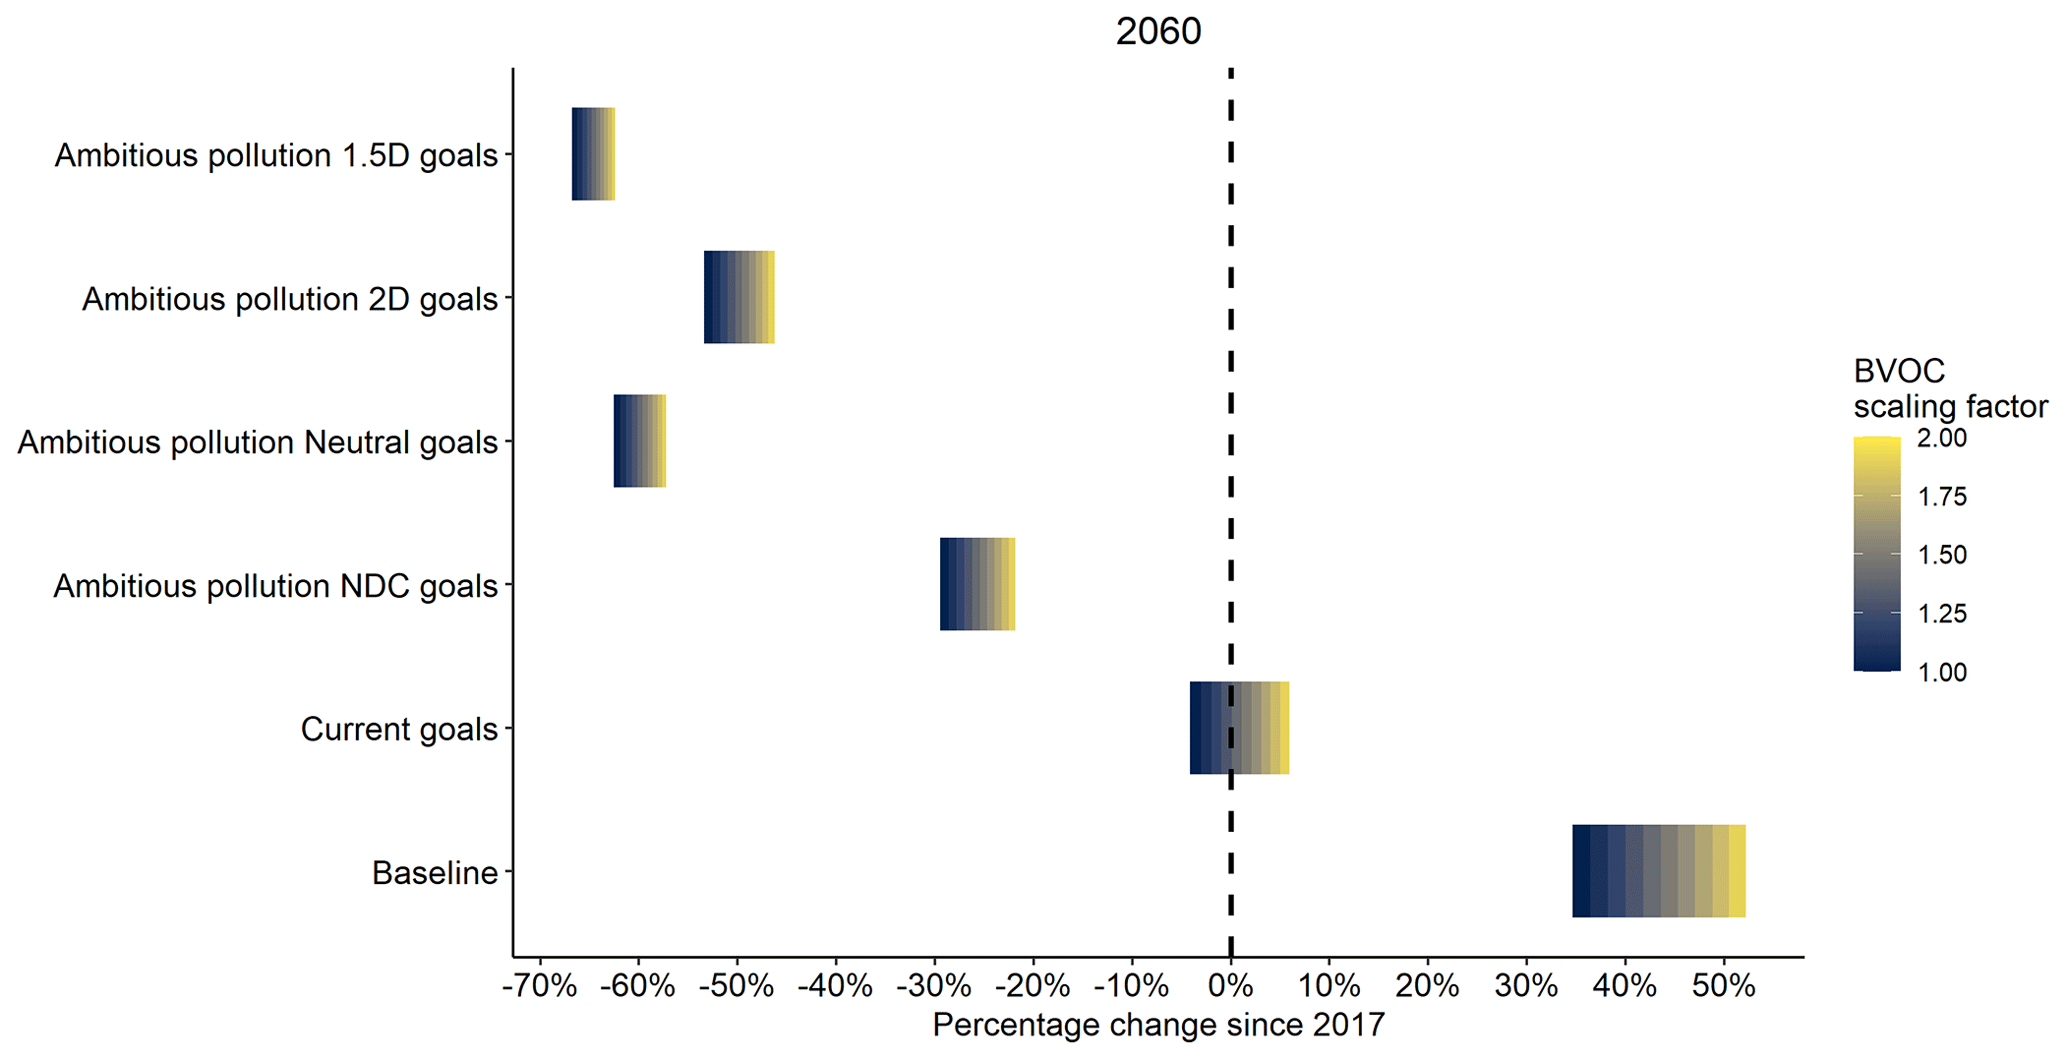
Figure 6Percentage change in O3 in 2060 since 2017 for the six different DPEC future scenarios (Table 1). Coloured bars show the range of percentage change when BVOC concentrations (isoprene, α-pinene and limonene) are multiplied by a scaling factor of between 1–2. Values to the left and right of the dashed line indicate decreasing and increasing O3 production rates respectively.
O3 production rates calculated using the less ambitious Baseline and Current Goals scenarios were found to be most sensitive to increasing biogenic concentrations in 2060. For the Baseline scenario, doubling biogenic concentrations led to a further 18 % increase in O3 production rates since 2017 compared to APHH-Beijing 2017 concentrations (scaling factor = 1). In the Current Goals scenario, a switch in the O3 production rate from being a reduction to an increase since 2017 was found when biogenic concentrations were increased by ca. 40 %. In all ambitious scenarios, O3 production rates are found to decrease since 2017, even when biogenic concentrations are doubled. However, the Ambitious Pollution 2D Goals and Ambitious Pollution NDC Goals are more sensitive to increasing biogenic concentrations (7 % and 8 % increase in percentage change in O3 production rates on doubling respectively) compared to the Ambitious Pollution 1.5D Goals and Ambitious Pollution NDC Goals (4 % and 5 % respectively). In all cases presented here, < 2 % of the sensitivity is attributed to limonene and α-pinene, and almost all the sensitivity observed here can be attributed to changes in isoprene alone. However, the impact of BVOC emissions on O3 production rates is highly uncertain, and it is likely that there are many more fast-reacting terpenes present in Beijing, whose reactivity is not accounted for in this study. In addition, from a pollution abatement perspective, increasing BVOCs will be much harder to controls than AVOCs. This sensitivity study highlights the importance of understanding the biogenic speciation and how biogenic compounds are expected to vary in the Beijing region, as these compounds are likely to have important implications for in situ O3 production in this urban environment.
Future in situ O3 production rates have been investigated for Beijing using detailed measurements of precursor species taken during the APHH-Beijing 2017 summer campaign alongside future air quality and climate policy emission projections for the Beijing region. A chemical isopleth indicated a currently VOC-limited regime (in 2017), which would switch to a NOx-limited regime if NOx alone were reduced by ∼ 75 %. Based on this, and on estimated reductions in total VOCs and NOx under the DPEC scenarios, O3 production rates were projected to increase under all four Ambitious Pollution scenarios. However, when speciated AVOCs were varied in the model rather than total DPEC VOCs, reductions in O3 production rate were observed. This highlighted the need to consider the detailed individual VOC speciation when estimating in situ O3 production rate effects. O3 production rate was found to be most sensitive to the OLE2 VOC group, which includes reactive C4–C5 alkenes such as but-2-enes and pent-2-ene. This sub-group is forecast to be reduced considerably by 2025 (ca. 95 %) under the Ambitious Pollution scenarios and is likely to strongly influence the reductions in observed in situ O3 production. Between 2030–2045, the most ambitious scenario, Ambitious Pollution 1.5D Goals, did not lead to the largest reductions in O3 production rate. This can be attributed to reductions in less reactive species that are present in large amounts in Beijing, such as the smaller-chain alkanes (ALK1 and ALK2). Aerosol surface area (ASA) was found to have a minimal effect on O3 production rates, with a 69 % decrease in ASA leading to a change in O3 production rate of < 1 %. O3 production was considerably impacted by possible climate-induced changes in BVOC emissions, almost entirely driven by changes in isoprene. Doubling the mixing ratios of isoprene, α-pinene and limonene led to the largest increases in O3 production under the Baseline scenario, increasing O3 production by 18 % in 2060 compared to O3 production projections using changes to anthropogenic VOCs alone. However, it is important to note that the future scenarios presented here are highly uncertain due to their socioeconomic and political nature and can only be used as a guide. The focus of this study is the impacts of the changing VOC emissions scenarios on photochemical O3 formation. However, there are several other important factors that will evolve in a changing climate that will likely affect the formation and concentrations of O3, such as meteorology and extreme temperature and biomass burning events impacting urban areas such as Beijing. Heterogeneous sources of HONO, an important source of OH radical in urban environments (Lee et al., 2016), are also likely to change, impacting urban oxidising capacity and hence O3 formation. However, how these factors are likely to change is highly uncertain and should be looked at further in future studies. Although estimates for in situ O3 production have been presented in this study, percentage changes in O3 production cannot be applied to O3 concentrations. This is due to the nature of the chemical modelling used, as only instantaneous O3 production can be reproduced, and it does not account for background O3 or O3 transported into and out of the measurement site in Beijing. To fully understand how O3 concentrations may vary in future scenarios, further analysis using regional transport models may be required. However, this study provides important insights into how the in situ chemical processing leading to additional O3 production and destruction in Beijing may vary in the future and highlights the key need to further understand how resultant concentrations from BVOC emissions are expected to change in future years.
Data are available at http://catalogue.ceda.ac.uk/uuid/7ed9d8a288814b8b85433b0d3fec0300 (Harrison et al., 2018).
The supplement related to this article is available online at: https://doi.org/10.5194/acp-24-9031-2024-supplement.
BSN prepared the manuscript with contributions from all authors. FAS, MS and JRH provided measurements and data processing of pollutants used in this study. JFH, ZL, ARR, ACL, JDL and ZS contributed to scientific discussion.
The contact author has declared that none of the authors has any competing interests.
Publisher's note: Copernicus Publications remains neutral with regard to jurisdictional claims made in the text, published maps, institutional affiliations, or any other geographical representation in this paper. While Copernicus Publications makes every effort to include appropriate place names, the final responsibility lies with the authors.
This project was undertaken on the Viking Cluster, a high-performance computing facility provided by the University of York, and supported by the University of York Research Computing team. The authors would like to thank and acknowledge Alfred Mayhew for additional modelling support.
This research has been supported by the Natural Environment Research Council (grant no. 2021GRIP02COP-AQ).
This paper was edited by Jayanarayanan Kuttippurath and reviewed by two anonymous referees.
Ainsworth, E. A.: Understanding and improving global crop response to ozone pollution, The Plant J., 90, 886–897, https://doi.org/10.1111/tpj.13298, 2017.
Carter, W. P. L.: Development of the SAPRC-07 chemical mechanism, Atmos. Environ., 44, 5324–5335, https://doi.org/10.1016/j.atmosenv.2010.01.026, 2010.
Cheng, J., Tong, D., Zhang, Q., Liu, Y., Lei, Y., Yan, G., Yan, L., Yu, S., Cui, R. Y., Clarke, L., Geng, G., Zheng, B., Zhang, X., Davis, S. J., and He, K.: Pathways of China's PM2.5 air quality 2015–2060 in the context of carbon neutrality, Natl. Sci. Rev., 8, nwab078, https://doi.org/10.1093/nsr/nwab078, 2021.
Cryer, D. R.: Measurements of hydroxyl radical reactivity and formaldehyde in the atmosphere, PhD Thesis, University of Leeds, https://etheses.whiterose.ac.uk/16834 (last access: July 2024), 2016.
Fu, T. M. and Tian, H.: Climate Change Penalty to Ozone Air Quality: Review of Current Understandings and Knowledge Gaps, Curr. Pollution Rep., 5, 159–171, https://doi.org/10.1007/s40726-019-00115-6, 2019.
Harrison, R., Sokhi, R., Kelly, F. J., Nemitz, E., Bloss, W., Loh, M., and Lewis, A. C.: Atmospheric Pollution & Human Health in a Developing Megacity (APHH), CEDA Archive [data set], https://catalogue.ceda.ac.uk/uuid/7ed9d8a288814b8b85433b0d3fec0300/ (last access: November 2022), 2018.
Hopkins, J. R., Jones, C. E., and Lewis, A. C.: A dual channel gas chromatograph for atmospheric analysis of volatile organic compounds including oxygenated and monoterpene compounds, J. Environ. Monitor., 13, 2268, https://doi.org/10.1039/c1em10050e, 2011.
Huang, J., Pan, X., Guo, X., and Li, G.: Health impact of China's Air Pollution Prevention and Control Action Plan: an analysis of national air quality monitoring and mortality data, Lancet Planet. Health., 2, e313–e323, https://doi.org/10.1016/S2542-5196(18)30141-4, 2018.
Huang, Z., Zhang, Y., Yan, Q., Zhang, Z., and Wang, X.: Real-time monitoring of respiratory absorption factors of volatile organic compounds in ambient air by proton transfer reaction time-of-flight mass spectrometry, J. Hazard. Mater., 320, 547–555, https://doi.org/10.1016/j.jhazmat.2016.08.064, 2016.
IPCC Core Writing Team: Climate Change 2014: Synthesis Report, Contribution of Working Groups I, II and III to the Fifth Assessment Report of the Intergovernmental Panel on Climate Change, edited by: Pachauri, R. K. and Meyer, L. A., Geneva, Switzerland, 151, https://www.ipcc.ch/report/ar5/syr/ (last access: November 2023), 2014.
Ivatt, P. D., Evans, M. J., and Lewis, A. C.: Suppression of surface ozone by an aerosol-inhibited photochemical ozone regime, Nat. Geosci., 15, 536–540, https://doi.org/10.1038/s41561-022-00972-9, 2022.
Jacob, D. J.: Heterogeneous chemistry and tropospheric ozone, Atmos. Environ., 34, 2131–2159, https://doi.org/10.1016/S1352-2310(99)00462-8, 2000.
Jenkin, M. E., Young, J. C., and Rickard, A. R.: The MCM v3.3.1 degradation scheme for isoprene, Atmos. Chem. Phys., 15, 11433–11459, https://doi.org/10.5194/acp-15-11433-2015, 2015.
Lee, J. D., Whalley, L. K., Heard, D. E., Stone, D., Dunmore, R. E., Hamilton, J. F., Young, D. E., Allan, J. D., Laufs, S., and Kleffmann, J.: Detailed budget analysis of HONO in central London reveals a missing daytime source, Atmos. Chem. Phys., 16, 2747–2764, https://doi.org/10.5194/acp-16-2747-2016, 2016.
Lee, J. D., Drysdale, W. S., Finch, D. P., Wilde, S. E., and Palmer, P. I.: UK surface NO2 levels dropped by 42 % during the COVID-19 lockdown: impact on surface O3, Atmos. Chem. Phys., 20, 15743–15759, https://doi.org/10.5194/acp-20-15743-2020, 2020.
Li, M., Zhang, Q., Streets, D. G., He, K. B., Cheng, Y. F., Emmons, L. K., Huo, H., Kang, S. C., Lu, Z., Shao, M., Su, H., Yu, X., and Zhang, Y.: Mapping Asian anthropogenic emissions of non-methane volatile organic compounds to multiple chemical mechanisms, Atmos. Chem. Phys., 14, 5617–5638, https://doi.org/10.5194/acp-14-5617-2014, 2014.
Li, M., Liu, H., Geng, G., Hong, C., Liu, F., Song, Y., Tong, D., Zheng, B., Cui, H., Man, H., Zhang, Q., and He, K.: Anthropogenic emission inventories in China: A review, Natl. Sci. Rev., 4, 834–866, https://doi.org/10.1093/nsr/nwx150, 2017.
Li, M., Zhang, Q., Zheng, B., Tong, D., Lei, Y., Liu, F., Hong, C., Kang, S., Yan, L., Zhang, Y., Bo, Y., Su, H., Cheng, Y., and He, K.: Persistent growth of anthropogenic non-methane volatile organic compound (NMVOC) emissions in China during 1990–2017: drivers, speciation and ozone formation potential, Atmos. Chem. Phys., 19, 8897–8913, https://doi.org/10.5194/acp-19-8897-2019, 2019.
Li, Q., Su, G., Li, C., Liu, P., Zhao, X., Zhang, C., Sun, X., Mu, Y., Wu, M., Wang, Q., and Sun, B.: An investigation into the role of VOCs in SOA and ozone production in Beijing, China, Sci. Total. Environ., 720, 137536, https://doi.org/10.1016/j.scitotenv.2020.137536, 2020.
Liu, S., Xing, J., Zhang, H., Ding, D., Zhang, F., Zhao, B., Sahu, S. K., and Wang, S.: Climate-driven trends of biogenic volatile organic compound emissions and their impacts on summertime ozone and secondary organic aerosol in China in the 2050s, Atmos. Environ., 218, 117020, https://doi.org/10.1016/j.atmosenv.2019.117020, 2019.
Liu, Z., Wang, B., Wang, C., Sun, Y., Zhu, C., Sun, L., Yang, N., Fan, G., Sun, X., Xia, Z., Pan, G., Zhu, C., Gai, Y., Wang, X., Xiao, Y., Yan, G., and Xu, C.: Characterization of photochemical losses of volatile organic compounds and their implications for ozone formation potential and source apportionment during summer in suburban Jinan, China, Environ. Res., 238, 117158, https://doi.org/10.1016/j.envres.2023.117158, 2023.
Mills, G., Sharps, K., Simpson, D., Pleijel, H., Broberg, M., Uddling, J., Jaramillo, F., Davies, W. J., Dentener, F., Van den Berg, M., Agrawal, M., Agrawal, S. B., Ainsworth, E. A., Büker, P., Emberson, L., Feng, Z., Harmens, H., Hayes, F., Kobayashi, K., Paoletti, E., Van Dingenen, R.: Ozone pollution will compromise efforts to increase global wheat production, Glob. Change Biol., 24, 3560–3574, https://doi.org/10.1111/gcb.14157, 2018.
Nelson, B. S., Stewart, G. J., Drysdale, W. S., Newland, M. J., Vaughan, A. R., Dunmore, R. E., Edwards, P. M., Lewis, A. C., Hamilton, J. F., Acton, W. J., Hewitt, C. N., Crilley, L. R., Alam, M. S., Şahin, Ü. A., Beddows, D. C. S., Bloss, W. J., Slater, E., Whalley, L. K., Heard, D. E., Cash, J. M., Langford, B., Nemitz, E., Sommariva, R., Cox, S., Shivani, Gadi, R., Gurjar, B. R., Hopkins, J. R., Rickard, A. R., and Lee, J. D.: In situ ozone production is highly sensitive to volatile organic compounds in Delhi, India, Atmos. Chem. Phys., 21, 13609–13630, https://doi.org/10.5194/acp-21-13609-2021, 2021.
Ren, J., Guo, F., and Xie, S.: Diagnosing ozone–NOx–VOC sensitivity and revealing causes of ozone increases in China based on 2013–2021 satellite retrievals, Atmos. Chem. Phys., 22, 15035–15047, https://doi.org/10.5194/acp-22-15035-2022, 2022.
Sander, S. P. and Peterson, M. E.: Kinetics of the Reaction HO2+NO2+M=HO2NO2+M, J. Phys. Chem., 88, 1566–1571, https://doi.org/10.1021/j150652a025, 1984.
Saunders, S. M., Jenkin, M. E., Derwent, R. G., and Pilling, M. J.: Protocol for the development of the Master Chemical Mechanism, MCM v3 (Part A): tropospheric degradation of non-aromatic volatile organic compounds, Atmos. Chem. Phys., 3, 161–180, https://doi.org/10.5194/acp-3-161-2003, 2003.
Shi, Z., Vu, T., Kotthaus, S., Harrison, R. M., Grimmond, S., Yue, S., Zhu, T., Lee, J., Han, Y., Demuzere, M., Dunmore, R. E., Ren, L., Liu, D., Wang, Y., Wild, O., Allan, J., Acton, W. J., Barlow, J., Barratt, B., Beddows, D., Bloss, W. J., Calzolai, G., Carruthers, D., Carslaw, D. C., Chan, Q., Chatzidiakou, L., Chen, Y., Crilley, L., Coe, H., Dai, T., Doherty, R., Duan, F., Fu, P., Ge, B., Ge, M., Guan, D., Hamilton, J. F., He, K., Heal, M., Heard, D., Hewitt, C. N., Hollaway, M., Hu, M., Ji, D., Jiang, X., Jones, R., Kalberer, M., Kelly, F. J., Kramer, L., Langford, B., Lin, C., Lewis, A. C., Li, J., Li, W., Liu, H., Liu, J., Loh, M., Lu, K., Lucarelli, F., Mann, G., McFiggans, G., Miller, M. R., Mills, G., Monk, P., Nemitz, E., O'Connor, F., Ouyang, B., Palmer, P. I., Percival, C., Popoola, O., Reeves, C., Rickard, A. R., Shao, L., Shi, G., Spracklen, D., Stevenson, D., Sun, Y., Sun, Z., Tao, S., Tong, S., Wang, Q., Wang, W., Wang, X., Wang, X., Wang, Z., Wei, L., Whalley, L., Wu, X., Wu, Z., Xie, P., Yang, F., Zhang, Q., Zhang, Y., Zhang, Y., and Zheng, M.: Introduction to the special issue “In-depth study of air pollution sources and processes within Beijing and its surrounding region (APHH-Beijing)”, Atmos. Chem. Phys., 19, 7519–7546, https://doi.org/10.5194/acp-19-7519-2019, 2019.
Shindell, D. and Smith, C. J.: Climate and air-quality benefits of a realistic phase-out of fossil fuels. Nature, 573, 408–411, https://doi.org/10.1038/s41586-019-1554-z, 2019.
Sicard, P., De Marco, A., Agathokleous, E., Feng, Z., Xu, X., Paoletti, E., Rodriguez, J. J. D., and Calatayud, V.: Amplified ozone pollution in cities during the COVID-19 lockdown, Sci. Total Environ., 735, 139542, https://doi.org/10.1016/j.scitotenv.2020.139542, 2020.
Sommariva, R., Cox, S., Martin, C., Borońska, K., Young, J., Jimack, P. K., Pilling, M. J., Matthaios, V. N., Nelson, B. S., Newland, M. J., Panagi, M., Bloss, W. J., Monks, P. S., and Rickard, A. R.: AtChem (version 1), an open-source box model for the Master Chemical Mechanism, Geosci. Model Dev., 13, 169–183, https://doi.org/10.5194/gmd-13-169-2020, 2020.
Tan, Z., Hofzumahaus, A., Lu, K., Brown, S. S., Holland, F., Huey, L. G., Kiendler-Scharr, A., Li, X., Liu, X., Ma, N., Min, K-E., Rohrer, F., Shao, M., Wahner, A., Wang, Y., Weidensohler, A., Wu, Y., Wu, Z., Zeng, L., Zhang, Y., and Fuchs, H.: No Evidence for a Significant Impact of Heterogeneous Chemistry on Radical Concentrations in the North China Plain in Summer 2014, Environ. Sci. Technol., 54, 5973–5979, https://doi.org/10.1021/acs.est.0c00525, 2020.
Tan, Z., Lu, K., Ma, X., Chen, S., He, L., Huang, X., Li, X., Lin, X., Tang, M., Yu, D., Wahner, A., and Zhang, Y.: Multiple Impacts of Aerosols on O3 Production are Largely Compensated: A Case Study Shenzhen, China, Environ. Sci. Technol., 56, 24, 17569–17580, https://doi.org/10.1021/acs.est.2c06217, 2022.
Wang, M., Wang, S., Zhang, R., Yuan, M., Xu, Y., Shang, L., Song, X., Zhang, X. and Zhang, Y.: Exploring the HONO source during the COVID-19 pandemic in a megacity in China, J. Environ. Sci., 149, 616–627, https://doi.org/10.1016/j.jes.2023.12.021, 2024.
Whalley, L. K., Stone, D., Dunmore, R., Hamilton, J., Hopkins, J. R., Lee, J. D., Lewis, A. C., Williams, P., Kleffmann, J., Laufs, S., Woodward-Massey, R., and Heard, D. E.: Understanding in situ ozone production in the summertime through radical observations and modelling studies during the Clean air for London project (ClearfLo), Atmos. Chem. Phys., 18, 2547–2571, https://doi.org/10.5194/acp-18-2547-2018, 2018.
Whalley, L. K., Slater, E. J., Woodward-Massey, R., Ye, C., Lee, J. D., Squires, F., Hopkins, J. R., Dunmore, R. E., Shaw, M., Hamilton, J. F., Lewis, A. C., Mehra, A., Worrall, S. D., Bacak, A., Bannan, T. J., Coe, H., Percival, C. J., Ouyang, B., Jones, R. L., Crilley, L. R., Kramer, L. J., Bloss, W. J., Vu, T., Kotthaus, S., Grimmond, S., Sun, Y., Xu, W., Yue, S., Ren, L., Acton, W. J. F., Hewitt, C. N., Wang, X., Fu, P., and Heard, D. E.: Evaluating the sensitivity of radical chemistry and ozone formation to ambient VOCs and NOx in Beijing, Atmos. Chem. Phys., 21, 2125–2147, https://doi.org/10.5194/acp-21-2125-2021, 2021.
World Health Organization: Review of evidence on health aspects of air pollution – REVIHAAP Project: Technical Report [Internet], Copenhagen: WHO Regional Office for Europe, https://www.ncbi.nlm.nih.gov/books/NBK361805/ (last access: November 2023), 2013.
Xie, M., Shu, L., Wang, T., Liu, Q., Gao, D., Li, S., Zhuang, B., Han, Y., Li, M., and Chen, P.: Natural emissions under future climate condition and their effects on surface ozone in the Yangtze River Delta region, China, Atmos. Environ., 150, 162–180, https://doi.org/10.1016/j.atmosenv.2016.11.053, 2017.
Zheng, B., Tong, D., Li, M., Liu, F., Hong, C., Geng, G., Li, H., Li, X., Peng, L., Qi, J., Yan, L., Zhang, Y., Zhao, H., Zheng, Y., He, K., and Zhang, Q.: Trends in China's anthropogenic emissions since 2010 as the consequence of clean air actions, Atmos. Chem. Phys., 18, 14095–14111, https://doi.org/10.5194/acp-18-14095-2018, 2018.