the Creative Commons Attribution 4.0 License.
the Creative Commons Attribution 4.0 License.
 | 09 Aug 2024
Trends in observed surface solar radiation and their causes in Brazil in the first 2 decades of the 21st century
Lucas Ferreira Correa
Doris Folini
Boriana Chtirkova
Martin Wild
Numerous studies have investigated the long-term variability in surface solar radiation (SSR) around the world. However, the large disparity in the availability of observational data between developed and less developed/developing countries leads to an under-representation of studies on SSR changes in the latter. This is especially true for South America, where few observational studies have investigated the SSR trends and usually only at a local or regional scale. In this study we use data from 34 stations distributed throughout all of the regions of Brazil to present the SSR trends in the first 2 decades of the 21st century and investigate their associated causes. The stations were grouped into eight composites according to their proximity. Our results show that in north and northeast Brazil a strong dimming occurred, with significant contributions from increasing atmospheric absorption, most likely due to anthropogenic emissions, and increasing cloud cover. In the southeast and midwest regions of Brazil, near-zero trends resulted from competing effects of clear-sky processes (attenuation of solar radiation under cloudless conditions) and strong negative trends in cloud cover. In the southern part of the Amazon and in south Brazil a statistically insignificant brightening was observed, with significant contributions from decreasing biomass burning emissions in the former and competing minor contributions in the latter. These results can help deepen our knowledge and understanding of SSR long-term trends and their causes in South America, reducing the under-representation of this continent when compared with regions like Europe.
- Article
(7908 KB) - Full-text XML
- BibTeX
- EndNote


Decadal trends in surface solar radiation (SSR) have been the subject of study since pioneering work in the late 1980s and early 1990s tried to understand the long-term variations in SSR (Ohmura and Lang, 1989; Russak, 1990; Dutton et al., 1991; Stanhill and Moreshet, 1992). Several studies have followed, presenting the trends and discussing their causes and potential consequences in several parts of the world (Wild, 2009), such as in Europe (e.g. Natsis et al., 2024; Kazadzis et al., 2018; Manara et al., 2016; Norris and Wild, 2007; Power, 2003), North America (e.g. Liepert, 2002), China (e.g. Feng and Wang, 2019; Wang et al., 2015; Xia et al., 2007), Japan (e.g. Kudo et al., 2012), and New Zealand (Liley, 2009). Global dimming (negative trends in SSR) and brightening (positive trends in SSR) have been associated, in most of the cases, with changes in cloud cover (e.g. Stjern et al., 2008; Augustine and Capotondi, 2022) and changes in aerosol loadings (e.g. Wild et al., 2021; Kambezidis et al., 2012), with the dominant aspect depending on regional atmospheric and emission features. However, many regions of the world are still under-represented by such studies, mostly because of the lack of observational high-quality data in most of developing and in less developed countries in contrast to regions like Europe, North America, or East Asia. South America is an important region to be mentioned in this context.
The lack of long-term SSR data in South America, as reported by different authors (Ohmura, 2009; Gilgen et al., 2009), is the main cause for the absence of a long literature in the region. Still, a few studies tried to assess SSR variability in South America. Ohmura (2009) presented and discussed SSR decadal trends based on a few stations in Venezuela at the end of the 20th century. Schwartz (2005) used astronomical extinction measurements to estimate clear-sky SSR trends at one astronomical observatory in Chile during 2 decades (1978–1997). Yuan et al. (2021) and Jiao et al. (2023) used machine learning methods to spatially interpolate SSR ground observations and reanalysis data and used this approach to assess SSR decadal variability over the whole globe, including South America, covering the second half of the 20th century and the first 2 decades of the 21st century. Da Silva et al. (2010), de Jong et al. (2019), and de Lima et al. (2019) all assessed SSR variability in Brazil with a focus on the potential for photovoltaic energy production. Zuluaga et al. (2021) and Raichijk (2012) used sunshine duration to assess the SSR variability in Brazil for the last 2–4 decades of the 20th century and the beginning of the 21st century. A similarity between most of these studies is the fact that they had to rely on reanalysis, modelling data, and indirect estimators of SSR (like sunshine duration), with the only study to use ground observations being limited to a small region in Venezuela. This leaves regions such as the densely populated area of southeast Brazil or the highly climate-relevant Amazon region without any direct assessment of the regional SSR long-term variability. Yamasoe et al. (2021) presented and discussed an SSR time series of 56 years (1961–2016) measured in the city of Sao Paulo and that is, to our knowledge, the longest and most detailed analysis of directly observed SSR in South America. The studies referenced here apply different methods, to different regions, in different periods, and thus it is difficult to directly compare them. But, in general terms, studies based on sunshine duration tend to indicate a brightening in Brazil after the 1980s, while studies using machine learning techniques and regional observational studies show a spatial heterogeneity in the SSR trends in Brazil in the last few decades. All these studies provide different pieces of information about SSR variability in this part of the world; however, none of them provide a large-scale assessment of the long-term SSR decadal trends using ground observations of SSR, as done for regions like Europe (e.g. Chiacchio and Wild, 2010; Pfeifroth et al., 2018), China (e.g. Yang et al., 2018), or the United States (e.g. Long et al., 2009).
To tackle this gap in the literature, we made use of the availability of SSR data from automated meteorological stations from the Instituto Brasileiro de Meteorologia (INMET) from 2001 onwards to provide a large-scale assessment of SSR decadal trends and underlying causes at the beginning of the 21st century in the Brazilian territory, which covers approximately half of the South American continent. The direct assessment of SSR long-term variability (using observed SSR) over such a large area in South America represents a novel contribution of this work. The objective of this study is to present the in situ observed SSR decadal trends around Brazil in the first 2 decades of the 21st century and discuss their underlying causes. This is done at the regional level, rather than locally, by selecting stations in strategic locations around the Brazilian territory and grouping them into station composites. With this study we intend to help reduce the under-representativity of global dimming and brightening (GDB) studies in South America.
2.1 In situ SSR and cloud cover measurements
Surface solar radiation data for 32 of the 34 stations (see Table A1, in Appendix A) are collected and controlled by the Instituto Nacional de Meteorologia (INMET) and were retrieved from the BDMEP portal (https://bdmep.inmet.gov.br/, last access: 27 October 2023). The stations were chosen based on data availability in the regions of each composite used in this study (see Sect. 2.4). The data were retrieved at hourly time resolution. All data were tested at the hourly time scale for consistency using the physical and extremely rare limits established by Long and Dutton (2002). None of the INMET stations used in this study were reported to have major discontinuities in the records. Nevertheless, we still applied the penalized maximal F test by Wang (2008) to verify the time series for inhomogeneities. No homogeneity problems were identified in the stations used in this study.
The hourly values were further converted into daily means by simply taking the average of the 24 hourly values in a day. If 1 hourly value was missing (due to either lack of data or removal during quality test), the 1 hourly value was filled linearly using the previous and next hours and the daily value was the average of 24 hourly values (23 observed and 1 filled linearly). If more than one hourly value was missing, the daily value was not calculated. In this way, daily values were always the result of the average of 24 hourly values. Daily values were further converted into monthly values by simply averaging the daily means within the same month. Monthly values were only calculated when at least 70 % of the days in a month were available. For example, 70 % of the days of any April are equivalent to 21 d. Therefore, if any April had 21 or more valid daily values, the monthly value would be calculated as the average of all available daily values. On the other hand, if less than 21 d had valid data, the monthly value would not be calculated. Further conversion from monthly to annual values again occurred by simply averaging the 12 months. If one, two, or three monthly values went missing, the long-term mean (mean for the whole period with available data) for that month would be used instead, and the annual mean was still calculated. If more than three monthly values were missing, then the annual value was not calculated. In this way, the annual value was always a result of 12 monthly values, from which no more than 3 were filled with the long-term mean. The averaging procedure from daily to monthly and from monthly to annual values reproduces similar methodologies used in previous studies (e.g. Stjern et al., 2008; Manara et al., 2016).
The BSRN (Baseline Surface Radiation Network; Ohmura et al., 1998; Driemel et al., 2018b) station at Florianopolis was also used in this study. Its data were provided at 15 min intervals. Data from the station operated by the Instituto de Astronomia, Geofisica e Ciencias Atmosfericas of the Universidade de São Paulo (IAG/USP), located in the city of Sao Paulo, were also used. Data from this station were provided as daily means. Both time series were also checked for consistency with the same procedure applied to the INMET stations, at the hourly time scale for the BSRN station and at the daily time scale for the IAG/USP station. Metadata for both stations did not report any discontinuities, and the tests performed using the penalized maximal F test by Wang (2008) also did not indicate any inhomogeneity in the time series. The SSR long-term variability at the São Paulo station was previously carefully analysed by Yamasoe et al. (2021). This station also has the longest time coverage among all of the stations used in this study: all the other stations only have data after 2000, while this stations has available data from earlier decades. But we limited the analysis to the period with coverage of the other stations because we intend to investigate the SSR variability at the regional level (composites) rather than at the local level (individual station). The procedure to convert from sub-daily to daily averages, from daily to monthly, and from monthly to annual values at these two stations was the same as the procedure used for the INMET stations.
Cloud cover data were also retrieved through the BDMEP portal from the INMET. The stations were the same as used for the INMET SSR measurements with the addition of data from Florianopolis. In Florianopolis, where the SSR data are originally from BSRN, the location of the SSR and the cloud measurements differ by a few kilometres. Cloud cover data are collected from visual inspections at 00:00, 12:00, and 18:00 UTC and are provided in units of tenths () of cloud cover. The daily cloud cover values used in this study are a result of the average from the 12:00 and 18:00 UTC observations. This is equivalent to 09:00 and 15:00 local time (LT); at most of the stations used in this study (8 and 14 for the westernmost stations). At the Sao Paulo station, the diurnal cloud cover values are a result of hourly observations between 07:00 and 18:00 LT. Cloud cover data were converted into monthly and then annual values using the same procedure as used for the SSR data. The cloud cover data are also used to calculate the cloud cover radiative effect (CCRE), following the procedure described by Norris and Wild (2007). This variable gives an estimation of the change in SSR produced by changes in cloud cover.
The SSR data described in this section are used to estimate the SSR trends presented in Table 1 and to calculate the fractional atmospheric column absorption (see Sect. 2.4), which also has the trends presented in Table 1. The cloud cover data described in this section were used to estimate cloud cover trends presented in Table 1 and to apply one of the two methods for clear-sky identification used in this study (see Sect. 2.3).
Table 1Trends (in W m−2 per decade) for all-sky and clear-sky (using Correa et al., 2022, and using SYNOP cloud cover) SSR, all-sky and clear-sky (using Correa et al., 2022) fractional atmospheric absorption, and SYNOP cloud cover at the eight composites used in this study. The cloud cover radiative effect (CCRE) referring to the SYNOP cloud cover trend is also included – this is an estimate of the effect on SSR of the cloud cover changes. SSR trends in W m−2 per decade; fractional atmospheric absorption trends in fraction (values between 0 and 1) per decade; SYNOP cloud cover in % per decade; and CCRE in W m−2. Trends in bold are statistically significant at the 95 % confidence level. Trends for SYNOP cloud cover were calculated using the Mann–Kendall test (see Sect. 2.6) and as a result the confidence interval is not always symmetrical. For this reason the confidence interval is shown in square brackets. Stations in each composite are listed in Table A1 (Appendix A).
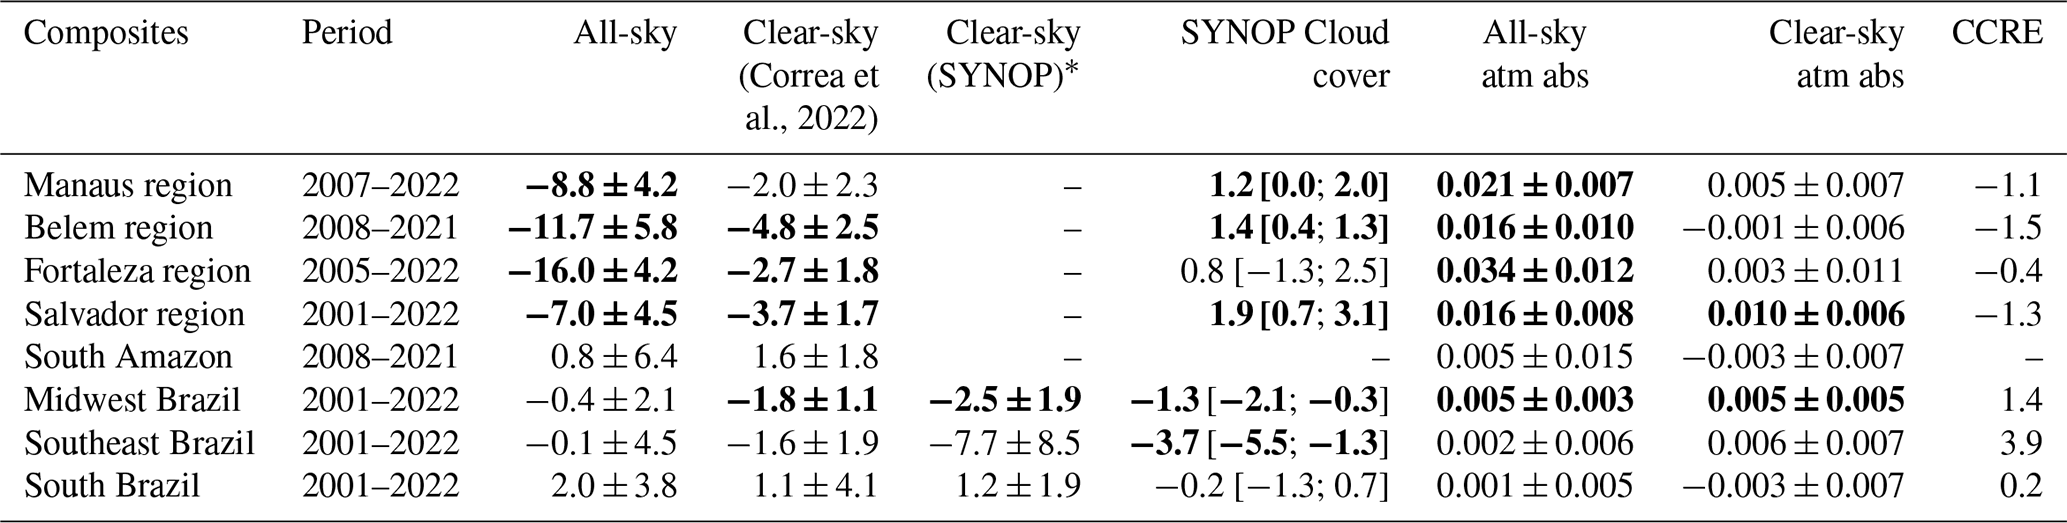
* Missing values for clear-sky SYNOP trends are due to the limited number of SYNOP cloud cover data (0 stations for the south Amazon composite, 2 out of 4 stations for Belem and Manaus composites) or due to not enough days flagged as clear-sky in order to generate a clear-sky time series (according to the procedure described in Sect. 2.3).
2.2 Satellite and reanalysis data
To investigate aerosol optical depth (AOD) variability, we used data from the CAMS (Copernicus Atmosphere Monitoring System) reanalysis (Inness et al., 2019) provided by ECMWF. This product has monthly time steps and a spatial resolution of approximately 80 km, with temporal coverage starting from 2003. Gueymard and Yang (2020) validated CAMS data using AERONET stations from around the world, including South America, and found that the reanalysis performs well in comparison with in situ aerosol observations, therefore being well suited for regional and global studies. To assess the aerosol absorption optical depth (AAOD) at 500 nm, we used data from the OMAERUV aerosol algorithm from the Ozone Monitoring Instrument (OMI; Torres et al., 2007). The product is provided at daily time resolution and 1° resolution and is available from 2004 onwards. Due to the frequent occurrence of missing daily values in the AAOD data from OMI (because of different aspects, such as cloudy scenes), conversion from daily to monthly values was done only when at least 2 d in a month were available. From monthly to annual values, the conversion was only performed when at least 11 of the 12 months had available data (the missing month would be filled with the long-term mean, that is the mean for the whole period with data availability). We should also highlight that aerosol absorption is a variable highly dependent on the spectral region, and thus the absorption at 500 nm could not be representative for the whole spectrum.
We also used shortwave radiative fluxes measured at the top of the atmosphere (TOA) by the CERES (Cloud and Earth's Radiant Energy System; Doelling et al., 2013) instruments on board the satellites Terra and Aqua. The CERES-SSF product (Doelling et al., 2016) used in this study provided TOA shortwave fluxes at monthly time intervals and 1° spatial resolution from 2000 onwards. The same product also provided incoming shortwave radiative fluxes at the TOA, which was also used in this study. The data from CERES were used to estimate fractional atmospheric column absorption (see Sect. 2.4).
Anthropogenic emissions were assessed using EDGAR (Emissions Database for Global Atmospheric Research; Crippa et al., 2018). The data provide anthropogenic emission estimates at 0.1° spatial resolution and do not consider large-scale biomass burning, land use change, and forestry (Crippa et al., 2018). This dataset was used, even though it does not include biomass burning, because it provides information about aerosol emissions from all other sources, which are also relevant, such as urban and industrial emissions. For this study we acquired the data in annual values and in units of kg m−1 s−1. The unit was further converted to kg per grid yr−1 (kg emitted for each 0.1° grid yr−1). Finally, total column water vapour was obtained from the ERA5 reanalysis (Hersbach et al., 2020), which provides data with a 0.25° spatial resolution and monthly time resolution. Cloud cover from ERA5 was also used as supporting information in addition to the previously mentioned SYNOP cloud cover measured in situ.
The AOD, AAOD, water vapour, and anthropogenic emissions data described in this section were used to identify the spatial distribution of the trends for these variables. The TOA incoming and outgoing irradiance data described in this section were used to estimate fractional atmospheric column absorption (see Sect. 2.4). For all gridded data described in this section, the stations were sampled by taking the grid box containing the station coordinates.
2.3 Clear-sky SSR
Time series of clear-sky SSR were derived using two different methods. At all stations we used (1) the clear-sky method proposed by Correa et al. (2022), and at the stations with SYNOP cloud cover data we also (2) derived clear-sky using cloud cover information. We applied both methods on the daily time series. For the first method, we calculate station-specific daily transmittance thresholds for every month of the year. Days with transmittance lower than this threshold for the specific station in the respective month are flagged as cloudy and removed. Days with transmittance above the thresholds are flagged as clear-sky. As this method relies on the reduction in atmospheric transmittance under cloudy conditions, its main weakness is associated with extreme aerosol events that could suddenly strongly reduce transmittance. Thus this method is not well suited for the analysis of high-frequency (interannual) variability, but it has been shown to be adequate for the assessment of long-term trends (Correa et al., 2022).
For the second method, we simply used in situ observations of cloud cover to identify cloudy scenes. We set the threshold of cloud cover to 2/10 (20 %), where any day with cloud cover above that was flagged as cloudy and removed. The choice of the cloud cover threshold represents a trade-off, where low thresholds (e.g. 0 %) would completely avoid any cloud signal but would also remove days with low cloud occurrence, where the effects of cloud-free processes still dominate, and where the time series with very few valid values are left out. For this reason, we allowed a higher threshold, assuming that on days with such low cloud cover (0 %–20 %) the cloud-free processes still dominate the signal of the SSR variability.
In both methods, the removal of cloudy days results in clear-sky SSR time series with many gaps. Thus, special care should be taken when converting from daily to monthly values and from monthly to annual values. Monthly values were only calculated when at least two daily values were available for the respective month. But before taking their average, each available daily value is normalized to the 15th day of the month by multiplying the daily irradiance with a normalization factor. This normalization factor is a result of the ratio between the TOA daily irradiance on the 15th day of the month and on the day flagged as clear-sky. This is done to correct for the solar geometry at different times of the month. From monthly to annual values, the procedure is the same as for all-sky SSR: the calculation is made when at least 10 months are available, with missing values being replaced by long-term means. When less than 10 months are available, the annual means are not calculated.
2.4 Fractional atmospheric column absorption
The daily fractional atmospheric column absorption (Fabs) was calculated for every station by combining SSR measured at the surface, surface albedo from ERA5 at the 0.25 ° × 0.25° spatial resolution, and incoming and outgoing shortwave radiation at the TOA from CERES-SSF at 1° from the Terra satellite (1 ° × 1 ° spatial resolution) and at daily time resolution. For the gridded data, the pixel containing the station coordinates was used. These variables were combined in Eq. (1) to calculate Fabs:
where SWupTOA is the outgoing shortwave radiation at TOA, SWdownTOA is the incoming shortwave radiation at TOA, albedoSFC is the surface albedo, and SWdownSFC is the SSR. Thus, the term () represents the fraction (0–1) of the incoming shortwave radiation at the TOA which is reflected back to space, and the term () represents the fraction (0–1) of the incoming shortwave radiation at the TOA which is absorbed at the surface. Then, Fabs represent the fraction of the incoming shortwave radiation at the TOA which is absorbed within the atmosphere column. Fabs values can range between 0 and 1, where 0 would represent no atmospheric absorption and 1 would represent a blackbody absorption by the atmosphere.
2.5 Selection of station composites
The stations used in this study were divided into eight composites based on geographical proximity, demographics, and atmospheric features found in Brazil. That is, the composites were organized with the intent of covering different climate characteristics around the country and, in most cases, included data from big cities (> 1 million inhabitants). The use of data from big cities facilitates the construction of the composite time series, since the stations with the longest time series and fewer missing data were found near big centres. The composites are (1) Manaus region, (2) Belem region, (3) Fortaleza region, (4) Salvador region, (5) south Amazon, (6) midwest Brazil, (7) southeast Brazil, and (8) south Brazil. The locations of all stations are shown in Fig. 1, and colours and markers denote the different composites. Each composite is composed of three to five stations. Based on a literature review, Reboita et al. (2010) divided the precipitation regimes in South America into eight regions, of which five regions are in the Brazilian territory. Ferreira and Reboita (2022) revisited the topic and applied a non-hierarchical clustering technique to classify the precipitation regimes in South America. The authors also found eight different precipitation regimes in the continent and only minor spatial differences to the previous study, with five of the regimes being present in the Brazilian territory. All of them were at least partly represented by the composites.
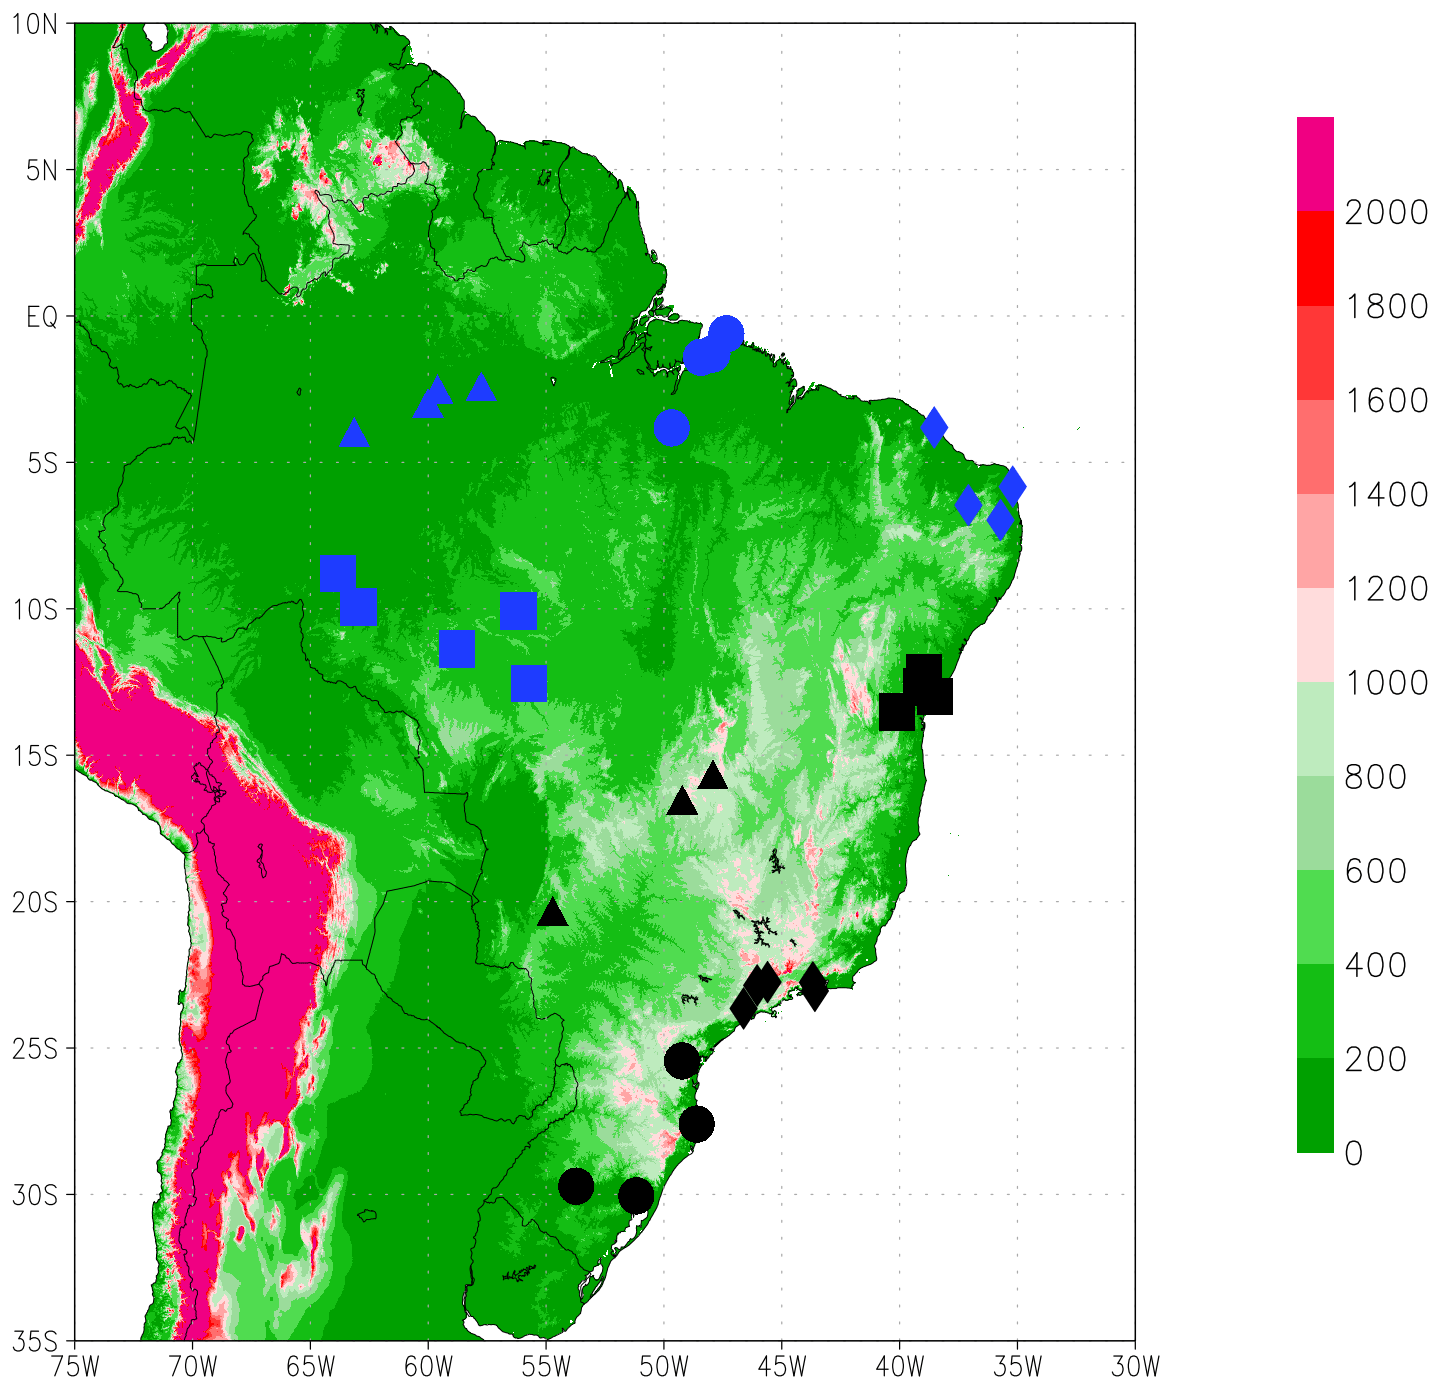
Figure 1Map of surface solar radiation stations and composites used in this study and topography of South America (in metres above sea level). Colours and shapes represent the different composites: blue triangles = Manaus region; blue circles = Belem region; blue diamonds = Fortaleza region; black squares = Salvador region; blue squares = south Amazon; black triangles = midwest Brazil; black diamonds = southeast Brazil; black circles = south Brazil.
In the north of Brazil two composites were centred around the two biggest cities in the Brazilian Amazon: (1) Manaus and (2) Belem. Precipitation and cloudiness in both regions are strongly tied to local mesoscale phenomena, like local convection, sea breeze circulation, and squall lines. At a large scale, the Intertropical Convergence Zone (ITCZ) also has a significant influence on the precipitation in the regions, playing a major role in the seasonality of precipitation (Fisch et al., 1998). Feedbacks with the Amazon rainforest are also important, especially the recycling of precipitation. But regarding biomass burning in the Amazon, the most important area is located in the southern part of the Amazon (Artaxo et al., 2006), south of both Belem and Manaus. The occurrence of the South American Low-Level Jet (Vera et al., 2006), important for moisture and aerosol transport from the Amazon to southeast Brazil, leaves the locations of Belem and Manaus with a lower influence of biomass burning aerosols than the southern fraction of the Amazon. Still, the influence of aerosols from the forests (either biogenic or related to biomass burning) should not be neglected (Rosário et al., 2019), and crucially, the importance of anthropogenic emissions from such big population centres should be taken into account.
In the northeast of Brazil, the composites of (3) Fortaleza and (4) Salvador share similar general characteristics regarding precipitation and cloudiness regimes. The stations in these composites are also centred around big population areas (Fortaleza and Salvador), where anthropogenic emissions should be taken into account. The biggest difference to the composites around Manaus and Belem is that these two composites are not located in the Amazon region. But they are located in the same precipitation regime division proposed by Ferreira and Reboita (2022), with two stations of the Fortaleza composite being located in a different subdivision.
Composite (5), south Amazon, was chosen to cover the region under the strongest influence of biomass burning aerosols from the Amazon (Artaxo et al., 2006). The stations in this composite are located in a different subdivision by Ferreira and Reboita (2022), where large-scale phenomena (such as the Bolivian high, the South Atlantic Convergence Zone, and cold fronts) play an important role in cloud formation. This composite is not centred around a big city, and the most populated city in the area is Porto Velho, with a population of approximately 500 000 people (IBGE, 2022). A few degrees south of the south Amazon composite are the stations of the (6) midwest Brazil composite. They are located approximately halfway between the south Amazon composite and the densely populated southeast Brazil composite. It is a dry region mostly influenced by large-scale phenomena compared with the north and northeast regions of Brazil. The biggest city in the composite is Brasilia.
The southeast region is the most densely populated area in Brazil, where big centres like Sao Paulo and Rio de Janeiro are located. Like the midwest and south Amazon composites, cloud formation in this region is mostly associated with large-scale phenomena, with significant influence from local convection and sea breeze being limited mostly to summer months (Reboita et al., 2010; Ferreira and Reboita, 2022). The (7) southeast Brazil composite covers this area. The transport of humidity and aerosols from the south Amazon are both relevant aspects to consider, but regarding aerosols, urban–industrial emissions from the large population centres should be more relevant. The last station composite covers the southernmost part of the country. The (8) south Brazil composite is entirely located in subtropical latitudes and covers its own precipitation regime subdivision from Ferreira and Reboita (2022). Large-scale phenomena like frontal systems and extra-tropical cyclones play a major role for cloud formation and moisture transport from the ocean. It is also a densely populated region, with big cities like Porto Alegre, Curitiba, and Florianopolis; thus, urban–industrial aerosol emissions should be taken into account.
The whole discussion in this study revolves around these eight composites. Each variable was fully processed and converted to annual values at the station level and only after that were they grouped with the other stations in the respective composite. The list of stations in each composite can be found in Table A1 (Appendix A).
2.6 Trend calculations
The trend analysis was based on annual anomalies of SSR. To calculate the annual anomalies, the absolute SSR annual values were subtracted from the average SSR value for the whole period of data availability for the respective composite (see Table 1). This did not affect the trends, but facilitated the visualization and comparison between time series, since the anomalies are centred around a common value (0). Decadal trends of SSR and most other variables presented in this study were calculated using a linear least squares (LLS) regression, with the confidence intervals (at the 95 % confidence level) being calculated using Eq. (4) from Nishizawa and Yoden (2005). Cloud cover time series, in most cases, did not have the residuals normally distributed; thus, to account for this, we calculated their trends using Sen's slope (Sen, 1968) and the Mann–Kendall test (Mann, 1945; Kendall, 1975). Trends of ground observations were calculated for the whole time availability of the composites; however, as the time availability varies from one composite to another, the periods used for trend calculations vary by a few years. SSR trends are displayed in units of W m−2 per decade. The period considered in each composite is displayed in Table 1.
3.1 All-sky and clear-sky SSR trends
Figure 2 shows the time series of the all-sky SSR anomalies for the eight composites analysed in this study. All trends calculated in this study are shown in Table 1.
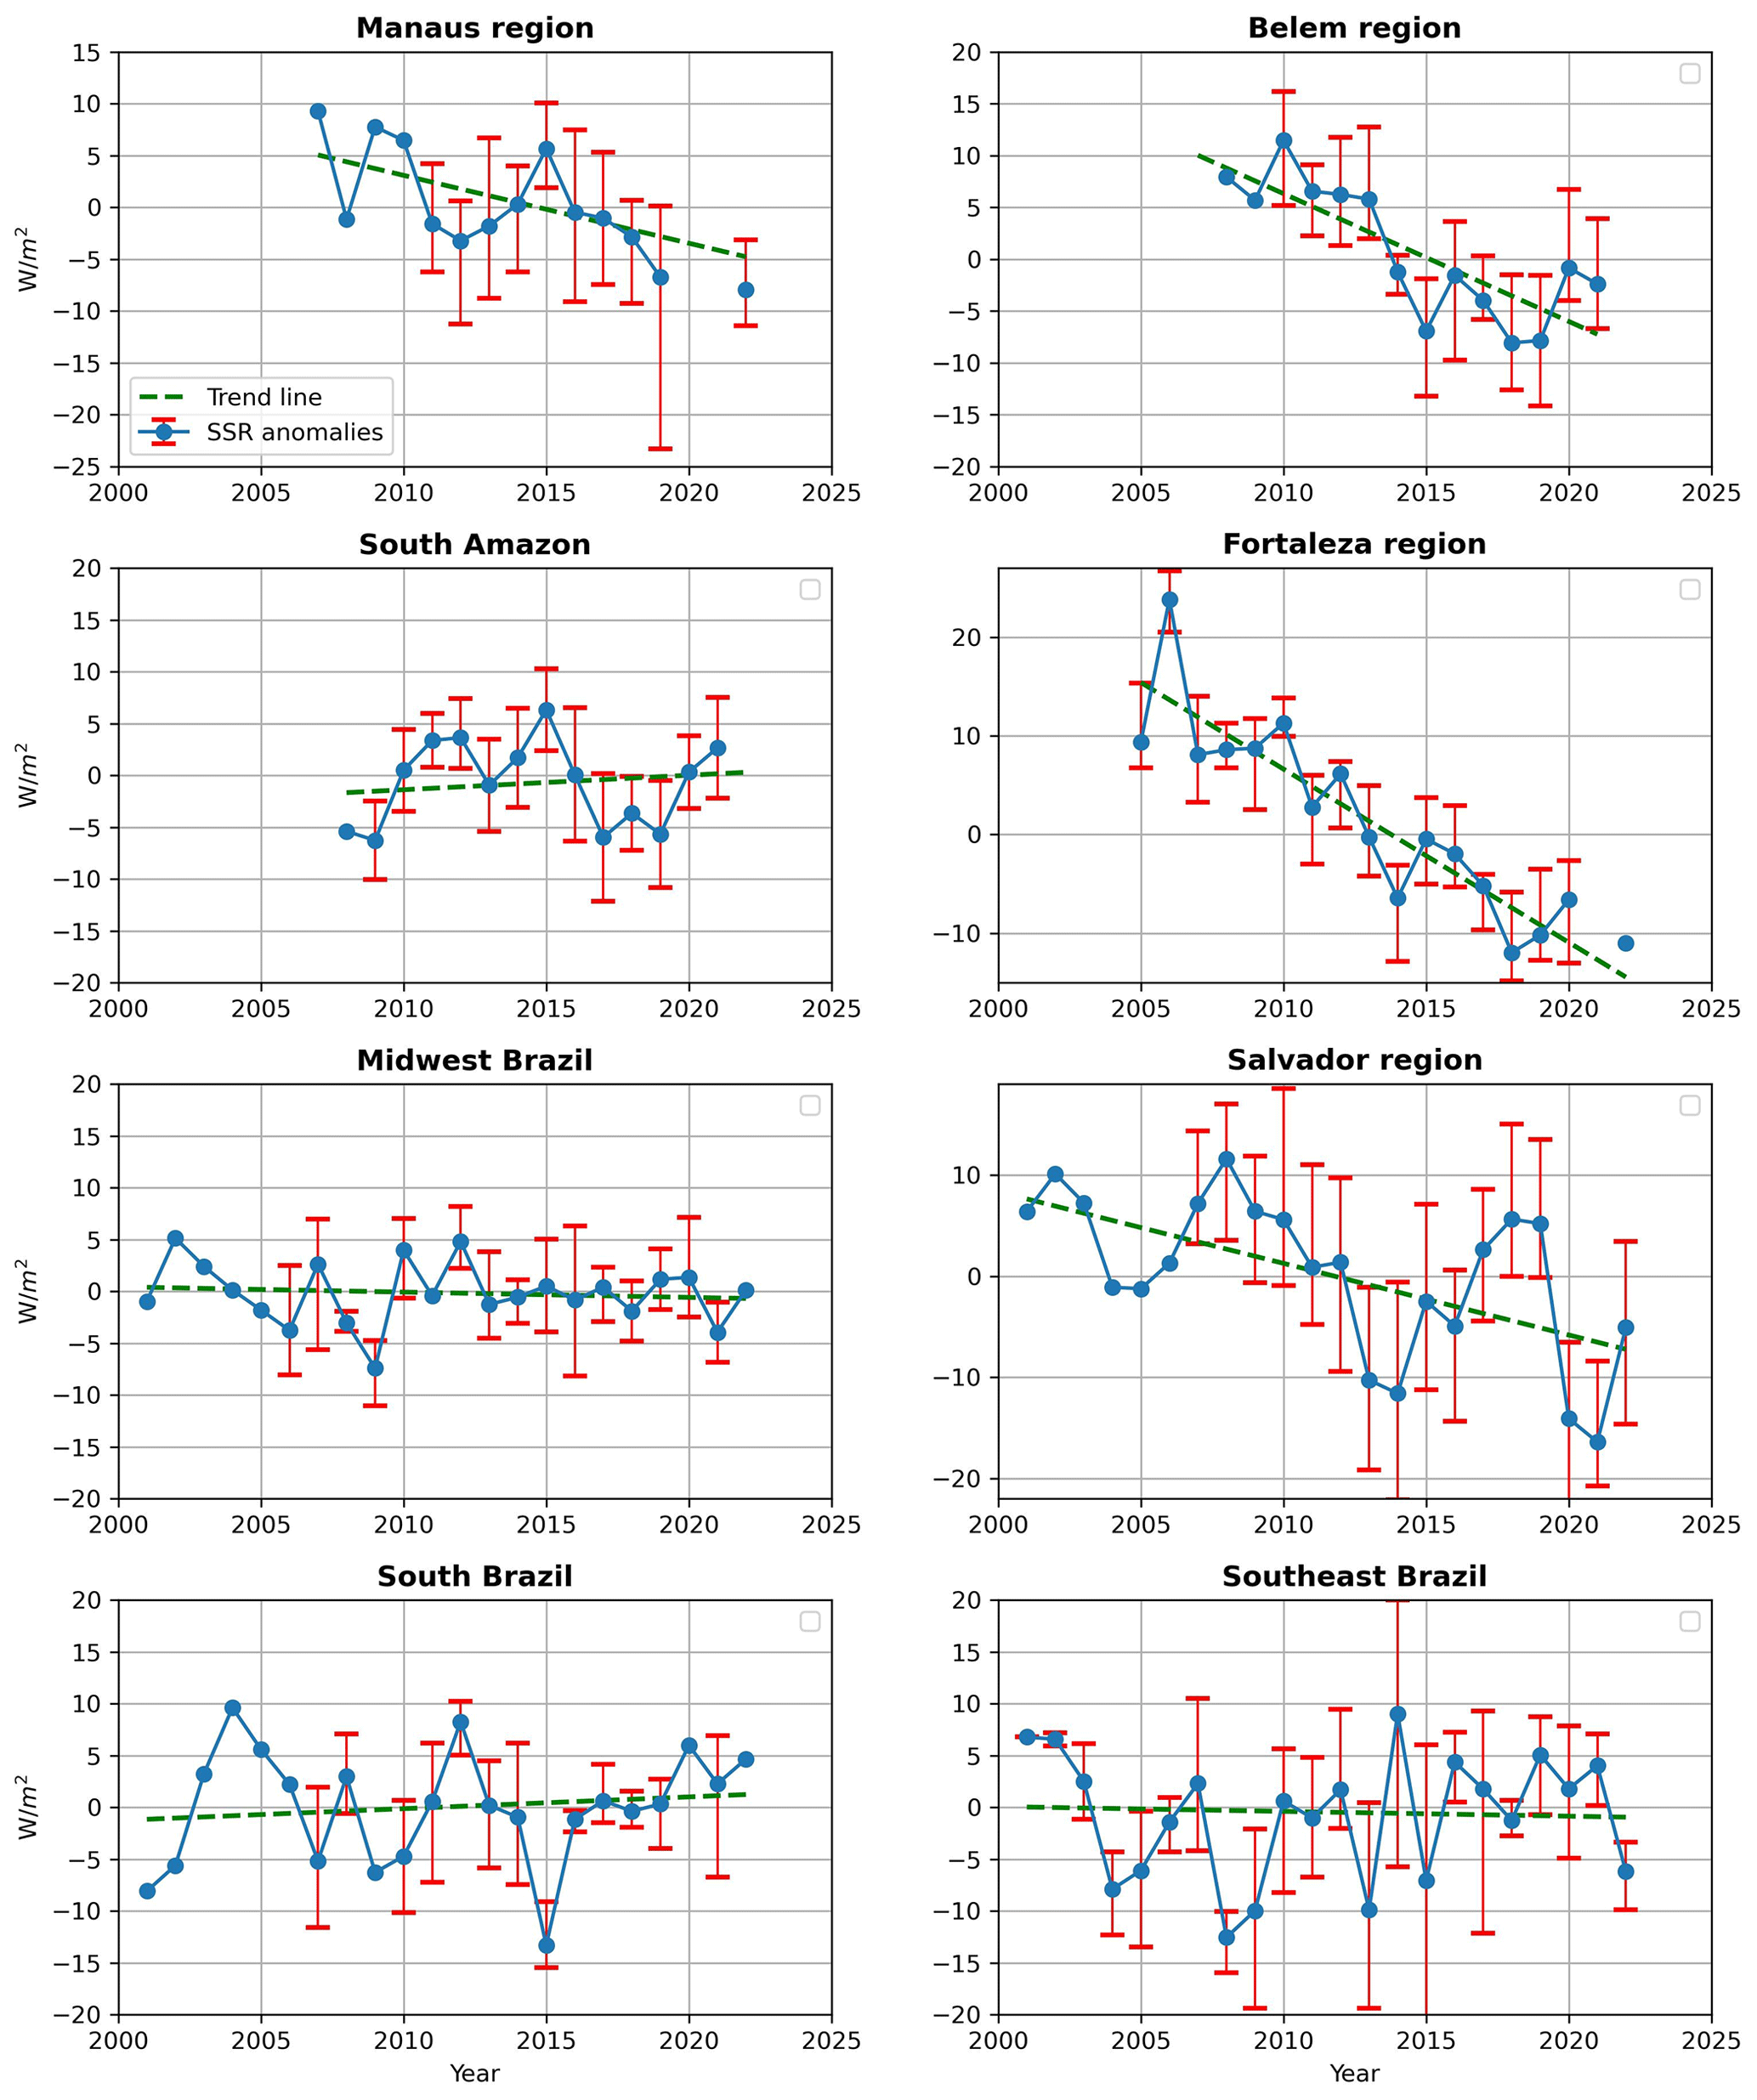
Figure 2Time series of all-sky surface solar radiation annual anomalies for the eight composites used in this study. Each composite is composed of three to five stations. In each composite, anomalies are calculated with respect to the mean of the entire period (shown in Table 1). The error bars indicate the maximum and minimum value for the individual stations in the respective year and composite. Trends are indicated by dashed lines.
The period covered by the data in this study should always be kept in mind, as it is shorter than long-term studies of SSR trends in regions such as Europe, North America, and China. However, this time span should be enough to start identifying the relevant features affecting SSR on timescales of a decade and beyond. In the north and northeast Brazil composites (Belem, Manaus, Fortaleza, and Salvador) statistically significant (at the 95 % confidence level) negative SSR trends (dimming) were observed. In the southeast and midwest composites, trends were negative although near zero and statistically insignificant. The south Amazon and south Brazil composites both show statistically insignificant positive SSR trends (brightening). This reveals a contrasting spatial distribution of the all-sky SSR trends in the first 2 decades of the 21st century in Brazil: while strong dimming occurred in the northern half of the Amazon region and in the northeastern coastal region, near-zero to weak positive SSR trends occurred from the southern part of the Amazon down to the south of Brazil, including the central area of the country and the densely populated southeast region. Figure 3 shows the time series of clear-sky SSR derived with the two methods used in the study.
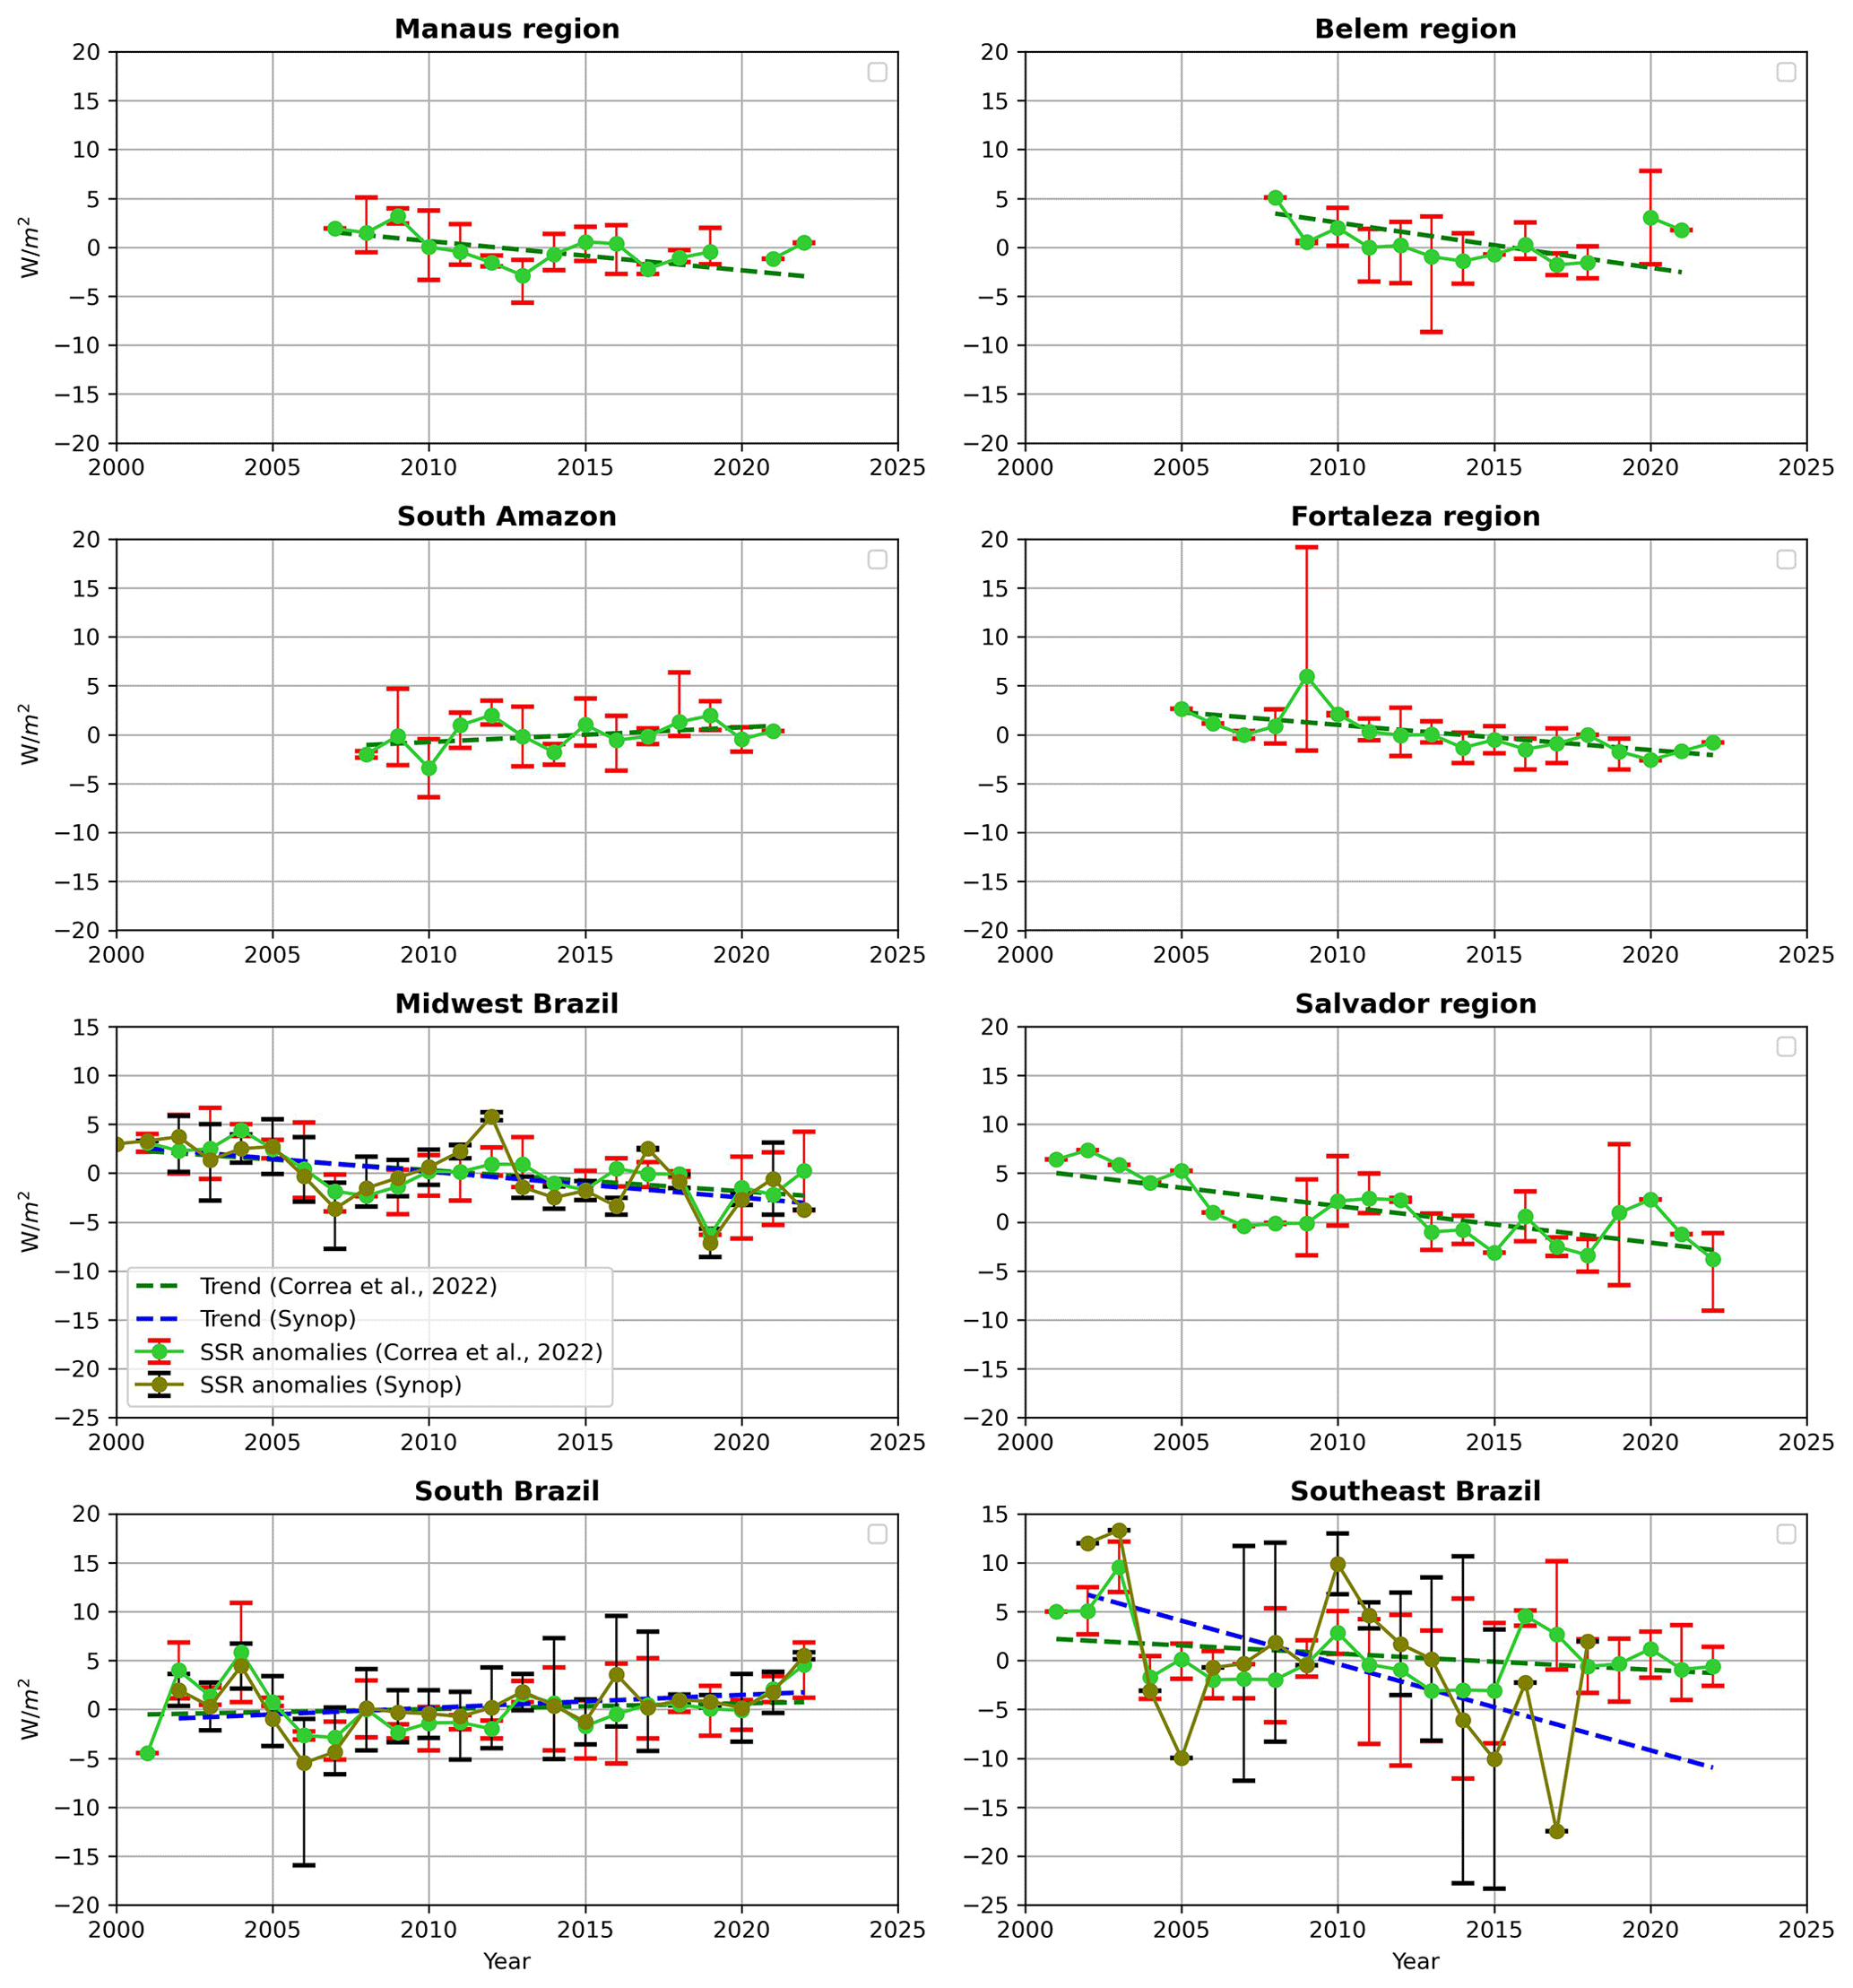
Figure 3Time series of clear-sky surface solar radiation annual anomalies (with respect to the composite full time coverage shown in Table 1) from the eight composites used in this study. Light green time series derived using the method by Correa et al. (2022) and olive green time series derived using SYNOP cloud cover to identify clear skies. The error bars indicate the maximum and minimum value for the individual stations in the respective year and composite. Trends are indicated by dashed lines.
Time series of clear-sky SSR based on SYNOP cloud cover could not be derived in five out of the eight composites (see Fig. 3 and Table 1). SYNOP clear-sky time series were derived when at least three stations in the composite had clear-sky data (see availability in Table A1). The Manaus, Belem, and south Amazon composites did not fulfil this requirement. For both the Fortaleza and Salvador region composites, SYNOP cloud cover data were available for all stations; however, the few occurrences of low cloud cover days did not enable the derivation of clear-sky SSR time series following the procedure described in Sect. 2.3.
Clear-sky SSR time series generally show a similar pattern to that observed in all-sky SSR. All of the composites show the same sign as the trends in all-sky SSR, and six of them also indicate the same statistical significance (or insignificance). The only exceptions are the midwest and Manaus composites. The former showed statistically insignificant negative trends in all-sky SSR but statistically significant negative clear-sky SSR trends. The opposite occurred in the Manaus composite: statistically significant all-sky SSR trends and statistically insignificant clear-sky SSR trends. For the composites where clear-sky data could be derived with both methods, in two of them (south and midwest Brazil) both methods indicate very similar inter-annual variability and trends, while the other (southeast Brazil) two methods do not show strong agreement in the inter-annual variability, but they show agreement in the direction of the trend. Therefore, the results of the clear-sky SSR trends are supported by both clear-sky methods. Regarding the magnitudes of the clear-sky SSR trends in comparison with the all-sky trends, another general pattern could be observed. In all composites with statistically significant negative all-sky SSR trends (Belem, Manaus, Fortaleza, and Salvador), the clear-sky SSR trends showed a substantially smaller magnitude. In the southeast and midwest, both with near-zero all-sky SSR trends, the clear-sky SSR trends were both negative and of larger magnitude than their all-sky counterparts. In the two composites with observed statistically insignificant all-sky SSR brightening (south Amazon and south Brazil), the clear-sky SSR trends showed similar magnitudes to the all-sky SSR trends.
These results indicate that the clear-sky processes in the atmosphere contributed to the observed all-sky SSR trends in the whole of Brazil, but only in the south Amazon and in south Brazil might their magnitude have been large enough to be able to explain the observed SSR trends. “Clear-sky processes” in this context refers to the interaction between solar radiation and the components of the atmosphere without the presence of clouds. Further analysis is thus needed to better understand the reasons for the clear-sky and all-sky decadal SSR trends observed in Brazil.
3.2 Cloud cover, AOD, and water vapour trends
Clouds, aerosols, and water vapour all can attenuate solar radiation; therefore, their variability is analysed in more detail in this section. The order in which they are mentioned follows the order of relevance in the discussion of solar radiation attenuation in the atmosphere, with clouds being the most important aspect and water vapour the least important aspect. Figure 4 shows the SYNOP cloud cover time series for seven of the eight composites analysed in the study (the cloud cover time series for the southern Amazon composite could not be constructed due to too many missing data). The associated trends can be found in Table 1.
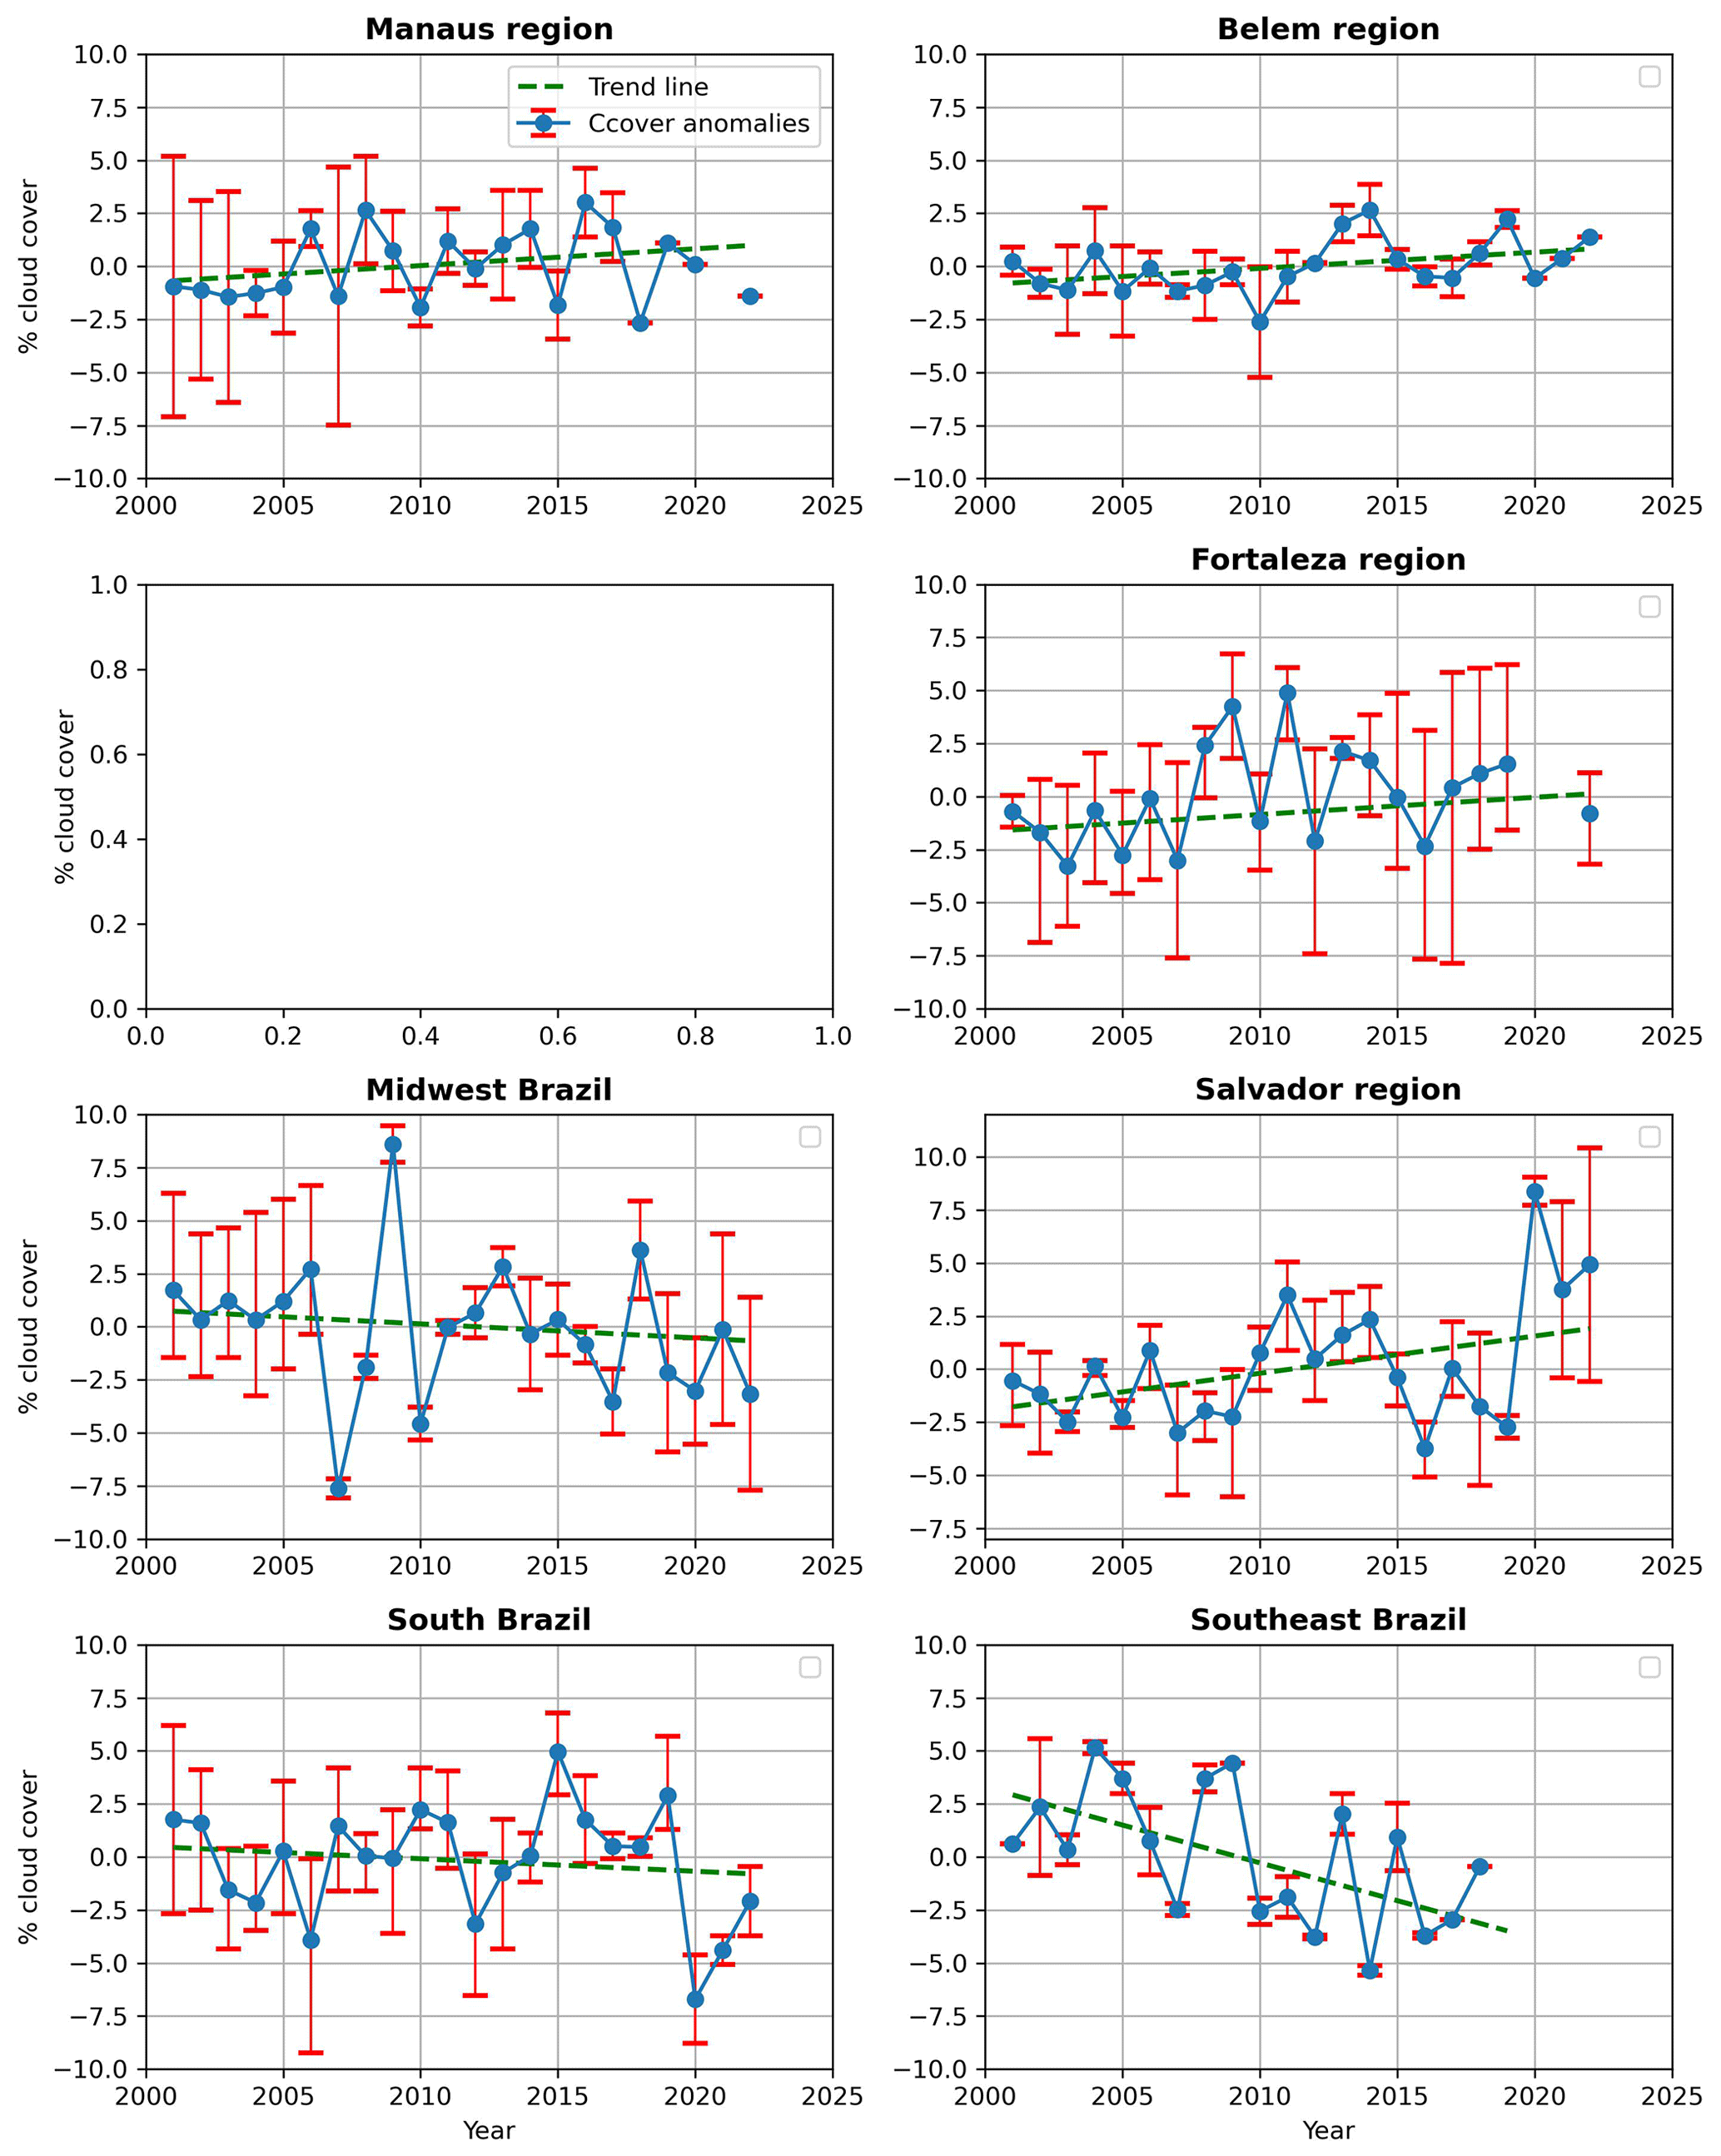
Figure 4Time series of annual mean SYNOP cloud cover for seven of the eight composites used in this study. Not enough data were available to derive a time series for the south Amazon composite. The error bars indicate the maximum and minimum value for the individual stations in the respective year and composite. Trends are indicated by dashed lines.
The Manaus, Belem, and southeast Brazil composites do not have SYNOP cloud cover data for all stations (two out of four available for Manaus and Belem and three out of five for southeast Brazil); therefore, a comparison between all-sky SSR trends and SYNOP cloud cover at these composites is based on the assumption that the cloud cover observations for the composites are representative of all stations. This is a reasonable assumption given the geographical proximity between the stations within these three composites and the lack of any climatic or geographical feature that can strongly affect cloudiness at individual stations (e.g. high topography). In these composites, all stations are located in areas with the same precipitation regimes as those classified by Ferreira and Reboita (2022), which also corroborates the assumption of good representativeness.
Cloud cover trends are in most cases consistent in sign with the all-sky SSR trends; that is, positive (negative) trends in cloud cover occur during a period of negative (positive) SSR trends. This is the case for the four composites with statistically significant all-sky SSR dimming (Belem, Manaus, Fortaleza, and Salvador). They all show positive trends in cloud cover, and all, except Fortaleza, show statistical significance. This is consistent in the sense that the increase in cloud cover contributes to the observed decrease in SSR, especially considering that the magnitude of the clear-sky SSR trends at these locations was significantly smaller than the all-sky SSR trends. However, quantitatively, the small magnitude of the cloud cover trends (between 0.8 % and 1.9 % per decade) challenges any hypothesis of a major contribution of cloud cover changes to the decadal SSR trends; that is, the cloud cover trends are too small and, and as a consequence, the contribution of changes in cloud cover to the SSR trends is expected to be minor. This contribution is estimated objectively by the CCRE (see Table 1), which shows, in most cases, low values (in comparison with the all-sky SSR trends), suggesting only a minor contribution from cloudiness to the SSR trends.
Cloud cover trends show near-zero values in the south region, suggesting no major cloud cover contribution to the SSR trends. The southeast and midwest regions show both statistically significant negative trends in cloud cover, with remarkably strong values in the southeast (−3.7 % [−5.5; −1.3] per decade). Both composites show near-zero but negative all-sky SSR trends, with stronger negative clear-sky SSR trends. Thus, the cloud cover trends exert an opposite effect to that of the clear-sky processes at both composites. This is also consistent, in the sense that with clear-sky processes and cloud cover having competing opposite effects, if their magnitude is similar, their effects cancel out, and the resulting all-sky SSR trend would be near zero.
Figure 5 shows the decadal trend maps of annual AOD in the period 2003–2020 from the CAMS reanalysis and of total column water vapour in the period 2001–2020 from ERA5.
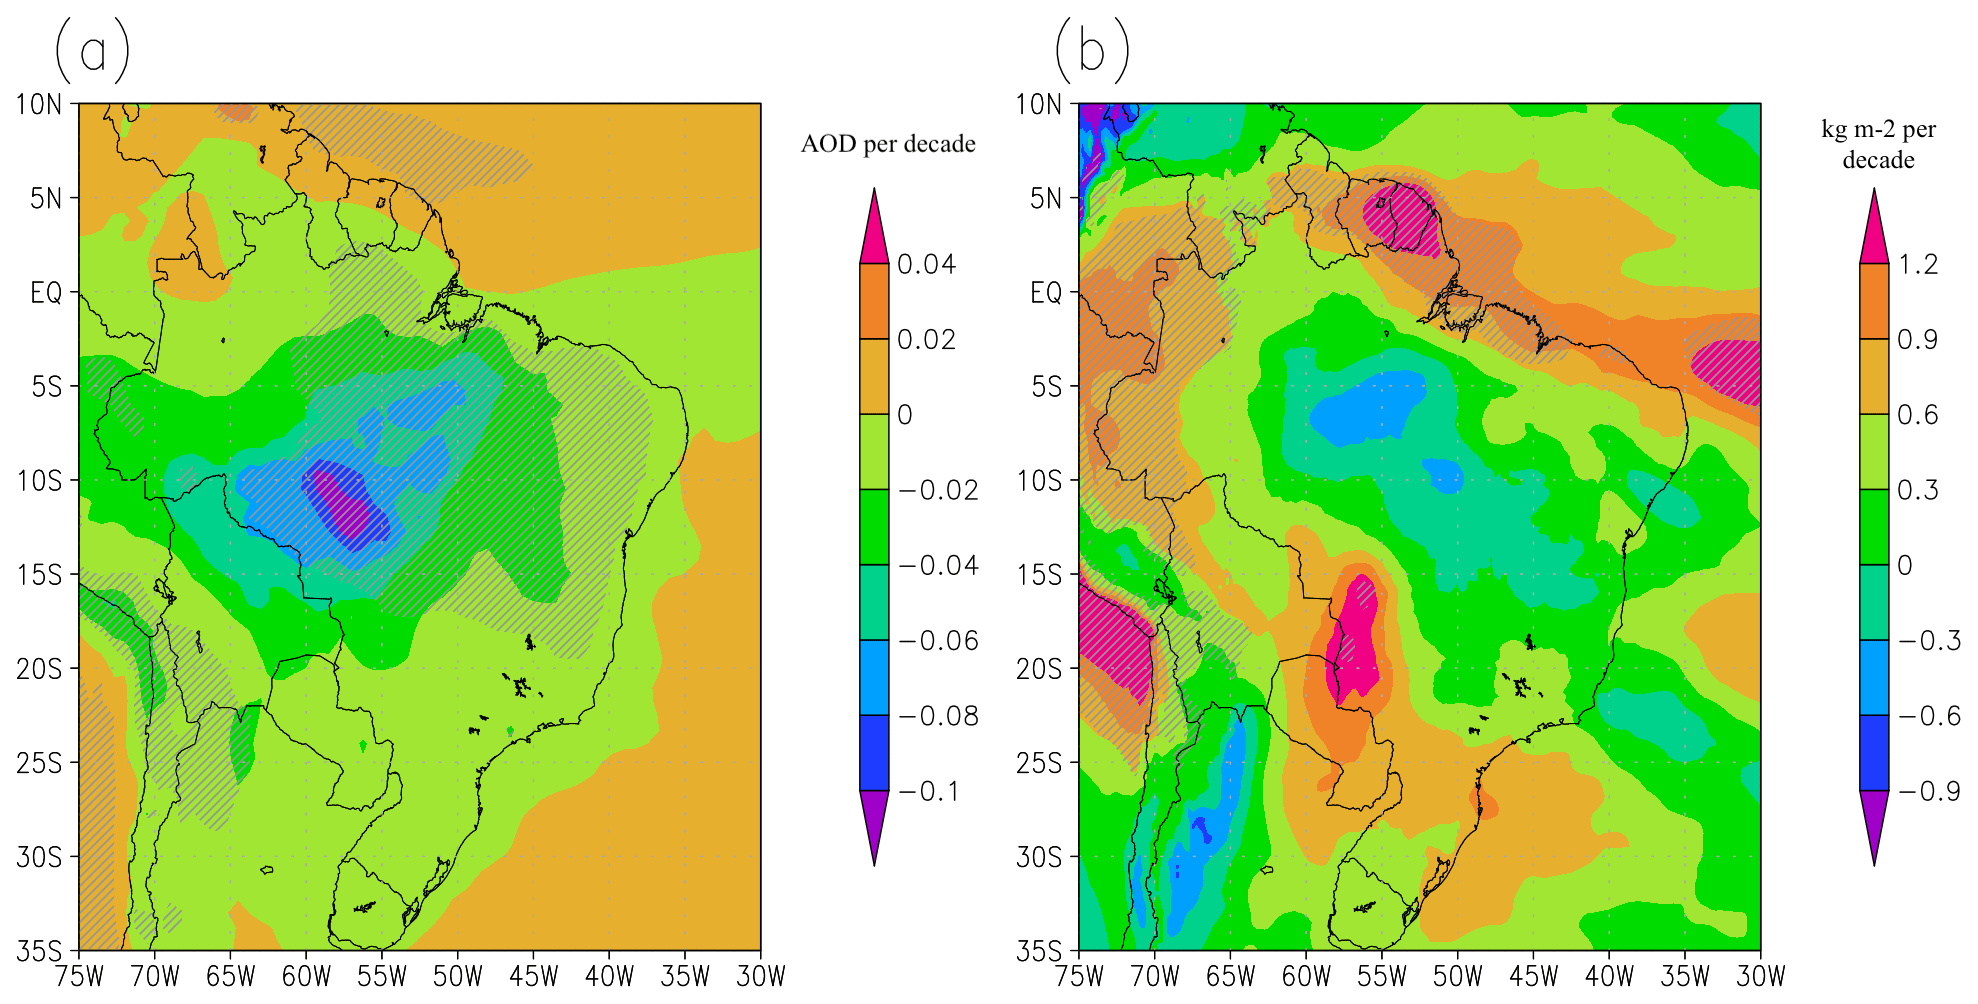
Figure 5Maps of decadal trends of (a) AOD [unitless] in the period 2003–2020* from the CAMS reanalysis and of (b) total column water vapour [in kg m−2] in the period 2001–2020 from ERA5. Shaded areas indicate statistical significance (at the 95 % confidence level). * The dataset was available only from 2003 onwards.
In Fig. 5a we see a strong negative AOD trend in the south Amazon during the period and slightly negative to near-zero trends in the rest of the country. Trends are statistically significant in the south Amazon and in the inner area of the country down to approximately 15° south (shaded areas), while they lose significance towards the coast. The process that dominates the AOD trends in the south Amazon (and in the whole country) is the reduction of biomass burning in the Amazon region. The southern part of the Amazon region is the area that suffers most from biomass burning (Artaxo et al., 2006), especially in the dry season during the Southern Hemisphere winter. A reduction in forest fires at the beginning of the 21st century has been reported (Silva Junior et al., 2021), and its effect is clear in the AOD trends. This result is consistent with the observed clear-sky SSR brightening in the south Amazon region, but it challenges the negative clear-sky SSR trends observed in most of the country. This suggests that changes in AOD were not primarily responsible for the clear-sky SSR trends in the whole of Brazil, with the exception of the south Amazon region.
The water vapour trend map (Fig. 5b) shows remarkably negative trends in the central Amazon, in a region around the east coast of Brazil, and in the southernmost part of the country. Remarkably positive trends are present from midwest Brazil (south of the Amazon region) stretching to southeast Brazil and in the northeast and north coastal regions of the country. The spatial distribution of the decadal variability in water vapour does not generally comply with the observed clear-sky SSR trends. We used these trends to estimate the change in atmospheric clear-sky absorption due to solely water vapour, using the empirical model presented by Hakuba et al. (2016). Based on these estimations, even in a region with strong water vapour trend such as midwest Brazil, these changes would be responsible for an increase in atmospheric clear-sky absorption (and consequently a decrease in SSR) of approximately 0.4 W m−2 per decade. This is almost 1 order of magnitude smaller than the clear-sky SSR trends in the region (−1.8 and −2.5 W m−2 per decade, for clear-sky conditions based on Correa et al., 2022, and Synop cloud cover, respectively). This suggests that the water vapour contribution to the observed clear-sky SSR trends, when present, was only minor.
3.3 Atmospheric absorption and anthropogenic emissions
To better understand the reasons behind the observed clear-sky SSR trends and the overall processes responsible for the all-sky SSR trends, we analysed the changes in fractional atmospheric absorption under all-sky and clear-sky conditions. This is a relevant aspect to be assessed because changes in atmospheric shortwave absorption can be an important driver of SSR trends (Schwarz et al., 2020). Figure 6 shows these time series for the composites considered in this study both under all-sky and clear-sky conditions.

Figure 6Time series of all-sky (red) and clear-sky (green) fractional atmospheric column absorption annual anomalies for the eight composites used in this study.
The fractional atmospheric absorption under all-sky conditions increased in most of the composites in the first 2 decades of the 21st century. Five composites showed statistically significant positive trends in Fabs: Manaus, Belem, Fortaleza, Salvador, and the midwest. The other composites also showed positive trends, but they were statistically insignificant. Under clear-sky conditions, the trends are obviously smaller, as the cloud-induced multiple scattering does not play a role in enhancing column absorption. Only in the Salvador and midwest composites were statistically significant positive trends observed in the atmospheric absorption under clear-sky conditions. All the other composites show statistically insignificant trends with the same sign as their all-sky counterparts, with the exception of the south Amazon, which shows statistically insignificant negative trends under clear-sky conditions, contrasting the statistically insignificant positive trend under all-sky conditions.
These results reveal two important aspects of the SSR variability in Brazil. First, in seven out of the eight composites the changes in clear-sky absorption comply with the clear-sky SSR trends; that is, increasing (decreasing) clear-sky atmospheric absorption was always linked to a decrease (increase) in clear-sky SSR. Second, the presence of clouds greatly increased atmospheric absorption (not shown) but also its trends. This most likely happened because of the intensification of multiple scattering occurring under partially cloudy skies, resulting in a magnification of the trends seen in clear-sky conditions. This is reinforced by the fact that the strongest all-sky atmospheric absorption trends were found in the four cloudiest composites (Manaus, Belem, Fortaleza, and Salvador), which happen to be the four composites with statistically significant negative all-sky SSR trends (dimming). Even though these results are consistent with each other, they also suggest that AOD only showed strong trends in the south Amazon region and that water vapour only contributed a minor part to the observed changes in atmospheric absorption (see discussion above). Thus, this raises the question of what could be the main reason for the changes in atmospheric absorption in Brazil. To try to answer this question, we analysed the decadal trend in aerosol absorption optical depth (AAOD) at 500 nm from OMI. The trend map is displayed in Fig. 7.
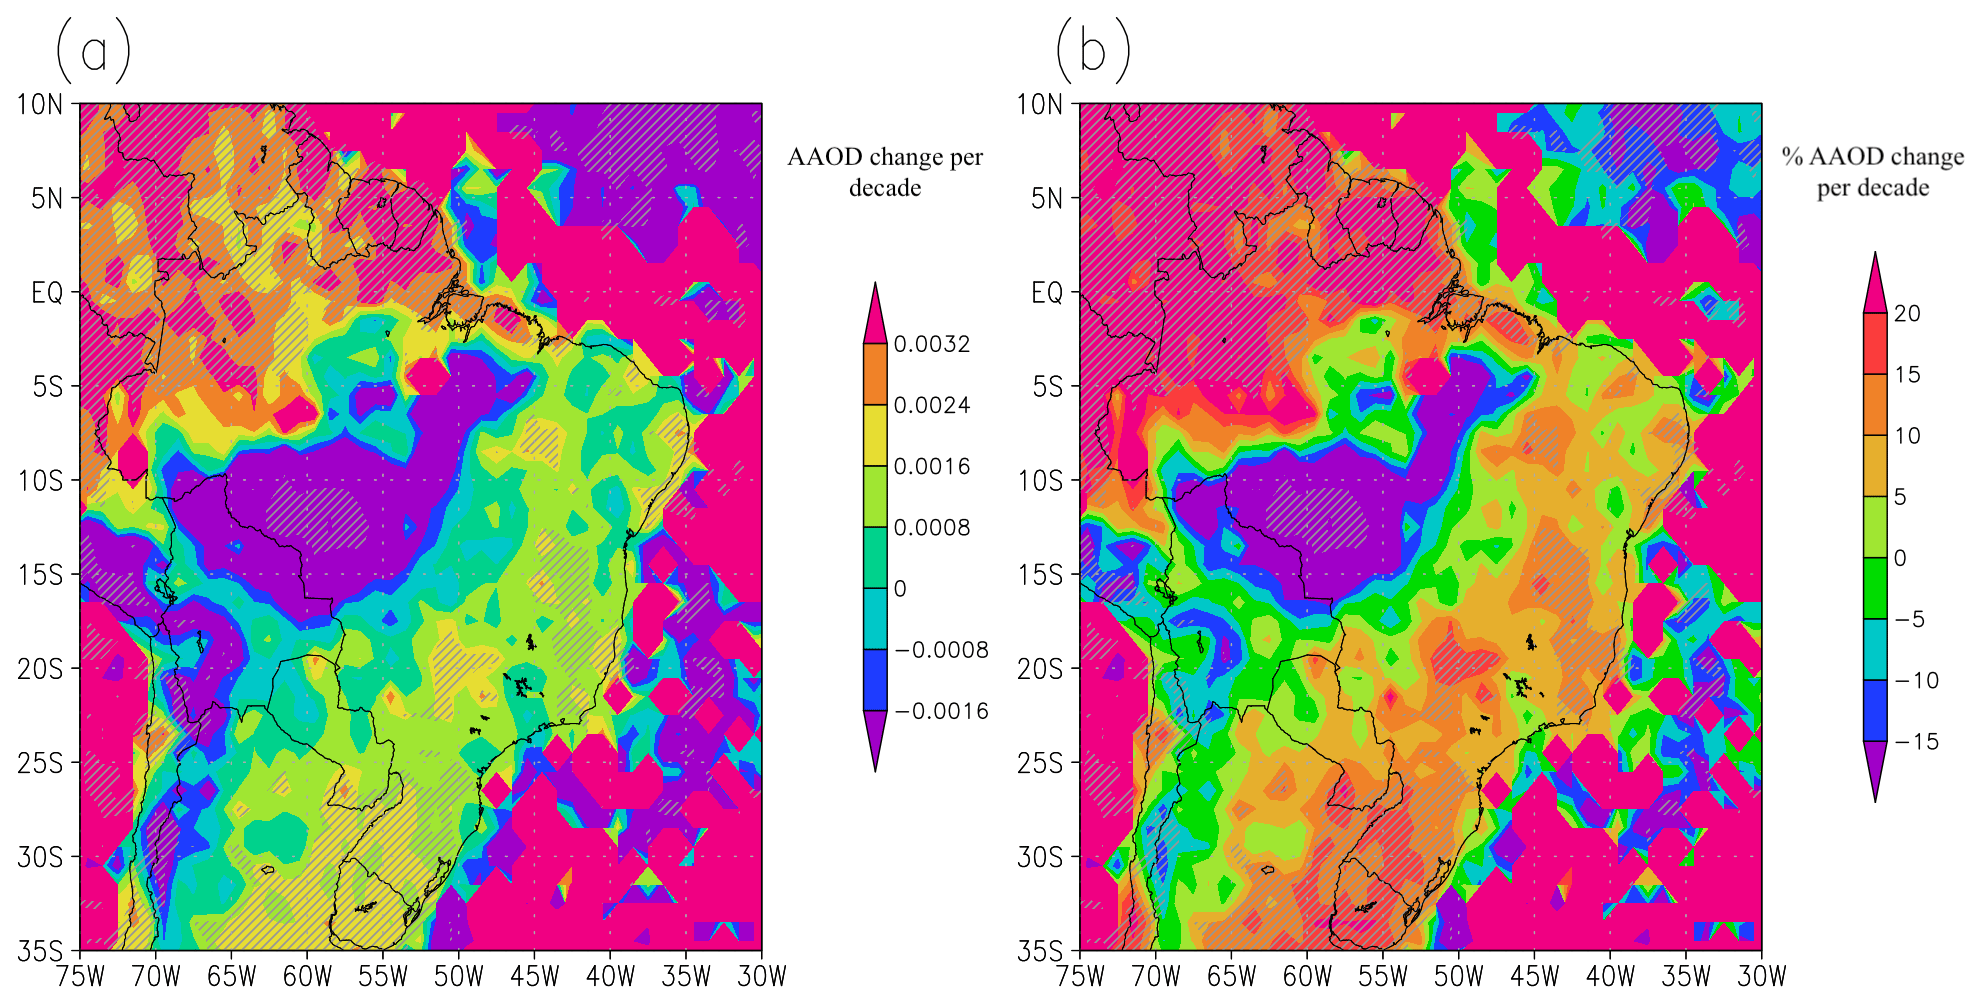
Figure 7(a) Absolute and (b) relative (%) decadal trends in absorption aerosol optical depth (AAOD) in the period 2005–2022 from OMI. Shaded areas indicate statistical significance (at the 95 % confidence level).
The map shows a clear distinction between the region under strong influence of the forest fires in the Amazon (south Amazon) and the rest of Brazil. In the south Amazon, the data show a decrease in AAOD in the period 2005–2022, while in the rest of the country an increase in absorption AAOD at 500 nm is observed. The spatial distribution of the trends suggests that the reduction in AAOD in the south Amazon could be associated with the reduction in forest fires also evident in the AOD trends. In the rest of the country, positive trends in AAOD are observed. This reveals a significant change in the optical properties of the aerosols present in Brazil in the first 2 decades of the 21st century, with a trend towards more absorbing aerosols (at 500 nm) in most of the country. The AOD trend map (Fig. 5a) shows that in the same areas where AAOD increases, AOD remains nearly constant, with trends close to 0. In order to better visualize potential reasons for an increase in AAOD at 500 nm in most of Brazil, we also investigated trends in anthropogenic SO2 and black carbon emissions in Brazil. They are displayed in Fig. 8.
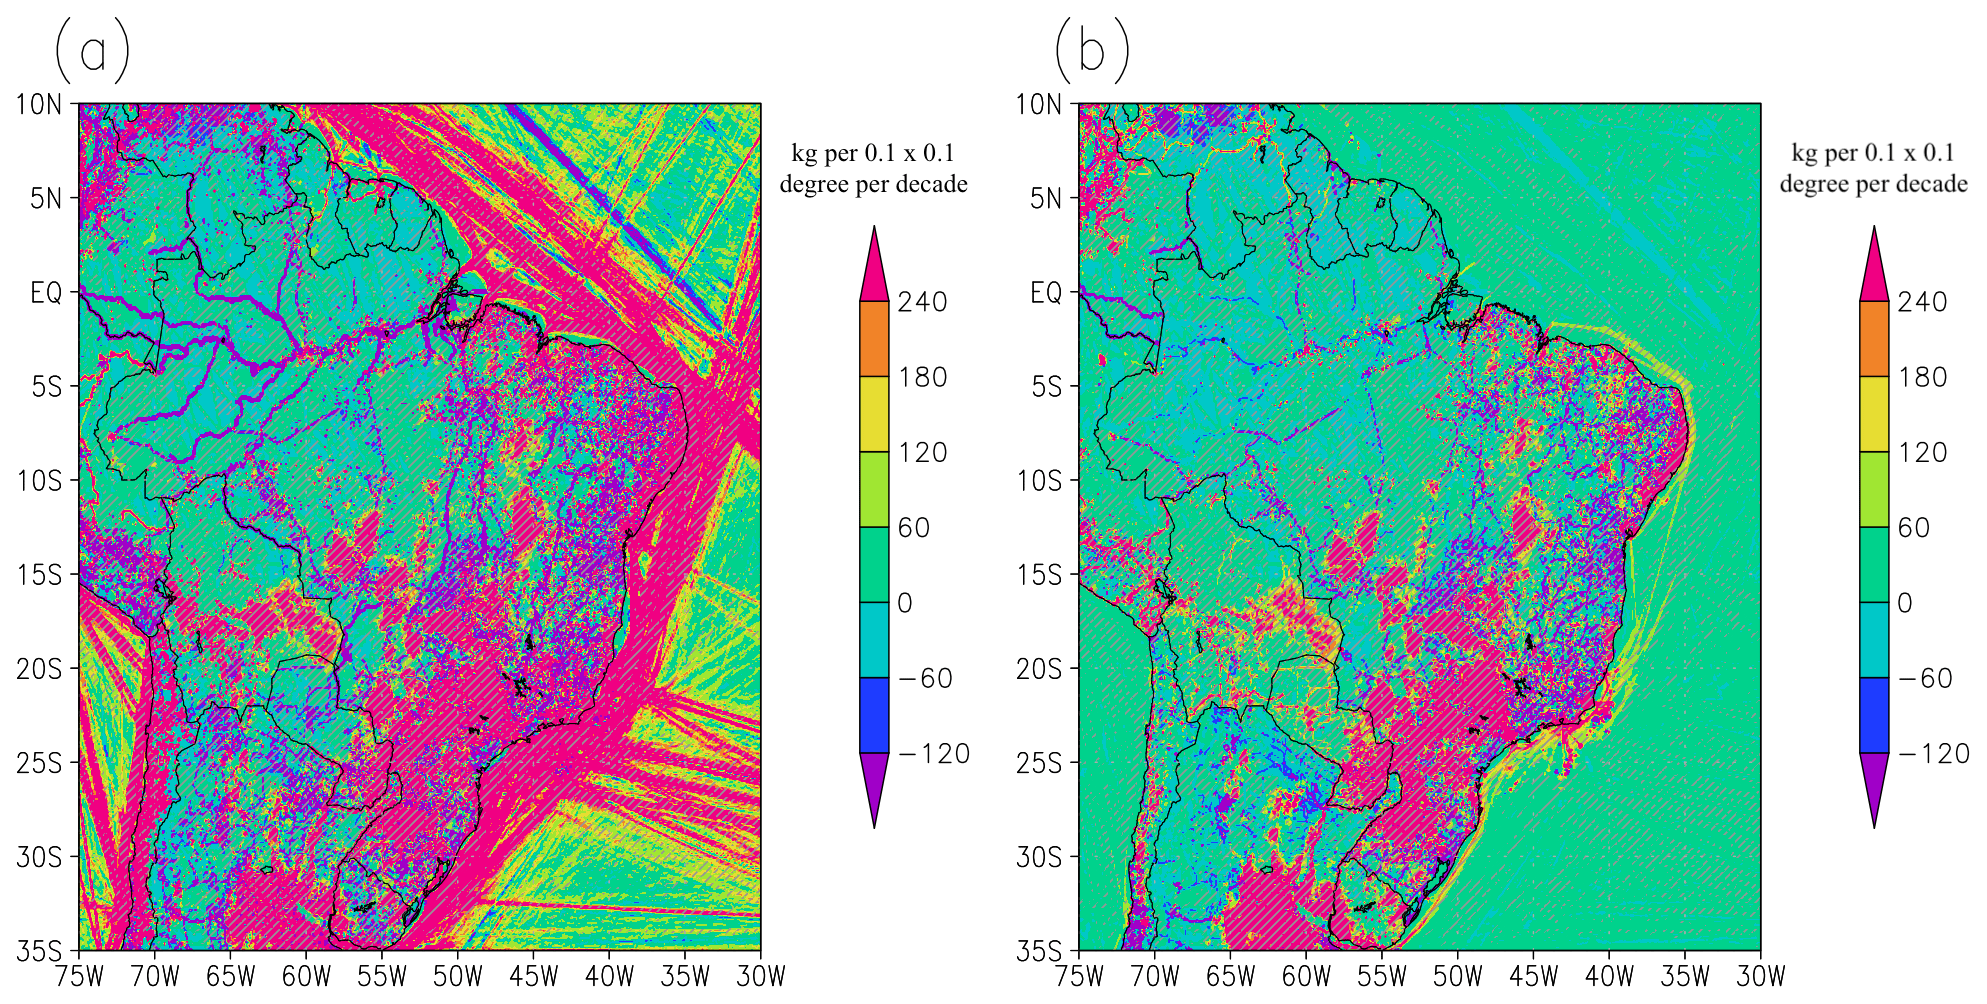
Figure 8Decadal trends of annual mean (a) SO2 and (b) black carbon anthropogenic emissions (in kg per 0.1° × 0.1° grid per decade) for the period 2001–2018 from EDGAR. Shaded areas indicate statistical significance (at the 95 % confidence level).
The trends show a general increase in anthropogenic emissions in most of Brazil, especially in highly populated areas. The only areas not showing an increase in anthropogenic emissions are in the Amazon rainforest. This might be counterintuitive when comparing the emission trends (Fig. 8) with the AOD trends (Fig. 5a), as the strongest AOD trend is observed in the south of the Amazon region. However, EDGAR emission estimates do not consider large-scale biomass burning, land use change, and forestry (Crippa et al., 2018). As discussed in Sect. 3.2, the AOD negative trend is mostly associated with reductions in biomass burning in the first 2 decades of the 21st century in the Amazon. Therefore, the biggest cause of the AOD trend (Fig. 5a) is not considered in the emission data used in Fig. 8.
Although, according to Fig. 8, anthropogenic emissions did not increase significantly in the Amazon region, emissions still increased around the biggest cities in the region, such as Manaus and Belem. This is of special relevance for this study, since seven of the eight composites are centred around cities with over 1 million inhabitants, where the large and usually increasing population (Lobo and Cunha, 2019) plays an important role in the atmospheric composition. The only composite that does not follow this rule is the south Amazon composite, where the biggest city is Porto Velho, which in 2020 had a population of less than 500 000 people (IBGE, 2022). As anthropogenically emitted aerosols tend to account for a larger fraction of solar radiation absorption than natural aerosols (Wang et al., 2009), this increase in anthropogenic emissions (especially of black carbon) complies with the increasing AAOD in most of Brazil. Although sulfate aerosols absorb much less shortwave radiation than black carbon, the increasing presence of scattering aerosols can also have a similar effect to the presence of broken clouds for atmospheric absorption (as discussed for the composites in north and northeast Brazil): they increase multiple scattering, increasing the optical path of the photons, which increases the chances for absorption by the atmosphere. Therefore, the increase in anthropogenic emissions complies with the observed increase in atmospheric absorption in most of Brazil during the study period. Similar results indicating a stronger impact of the changes in optical properties of the aerosols than the changes in aerosol optical depth on the observed SSR trends were also found for Japan in the 1990s by Kudo et al. (2012).
4.1 Physical consistency of the results
The results of this study point to a relevant impact of changes in atmospheric absorption in at least half of the regions analysed. However, this is based on the fractional atmospheric absorption data, which are derived (as described in Sect. 2.4) by combining in situ SSR (point) measurements with gridded data of surface albedo and outgoing shortwave radiation at TOA, at 0.25 and 1.0° spatial resolution, respectively. Thus, the first question to be addressed is whether these results can be trusted even with the use of different spatial resolutions. Schwarz et al. (2018) investigated the spatial representativeness of SSR measurements in many stations around the world, including four stations in Brazil: Florianopolis, São Martinho da Serra (both in south Brazil), Brasilia (in the midwest), and Petrolina (∼ 450 km from Salvador). The authors found a good representativity of SSR for the 1° surroundings at most stations around the world at the monthly time scales, with estimated decorrelation lengths (the distance over which a point measurement is representative) always higher than 3° in all of the four Brazilian locations. Madhavan et al. (2017) investigated the spatial representativeness of SSR measurements at shorter time scales and found that point measurements were representative to a 10 km × 10 km area in time scales up to around 1 h (from 26 min in overcast conditions to 70 min in broken cloud conditions). The authors demonstrated that the decorrelation lengths increase linearly (on a log–log scale) with decreasing frequency (longer time averaging). Following the results of the study by Madhavan et al. (2017), this would lead to decorrelation lengths around the order of 100 km (∼ 1°) at the daily (24 h) time scales. Therefore, based on the interpretation of these results, we can expect a satisfactory consistency in the results from combining point measurements at the surface with 1° measurements at the TOA at daily time scales, as done in this study. An in-depth analysis to estimate the decorrelation lengths at daily time scales of each station is beyond the scope of the study.
The performance of the gridded products used in this study are discussed in their respective documentations, referenced in Sect. 2. Spectral surface albedo is reported as a main source of uncertainty in the satellite-based products, especially OMI AAOD; however, this tends to be a major problem over the ocean. Sub-grid cloud contamination also tends to represent a problem for the retrieval of satellite-based products. However, this is reported to lead to an over-/under-estimation of the average AAOD but should not affect the representation of its long-term variability. No issues with the long-term variability in the reanalysis products were reported.
Regarding atmospheric absorption, previous studies (e.g. Li et al., 1995; Byrne et al., 1996) have shown an enhancement in atmospheric absorption under cloudy conditions. According to previous literature, such an enhancement would not be caused by cloud absorption but by cloud scattering, which increases the optical path of a photon in the atmosphere, consequently increasing the chances of this photon to be absorbed by other components of the atmosphere, such as water vapour and aerosols. Although the existence of this mechanism is clear, the quantitative influence this could have on the energy budget at any location would also depend on the characteristics of cloud occurrence (e.g. the frequency of cloud free, overcast and partially cloudy conditions). As much as cloud-free conditions are not optimal for atmospheric absorption, completely overcast conditions are not either. Under fully cloudy conditions, the backscattering of incoming shortwave radiation is high, usually not increasing the optical path of the photons and not allowing them to reach lower levels of the atmosphere, where water vapour and aerosol concentrations are higher. Thus, the high occurrence of partially cloudy conditions would increase the cloud effects on atmospheric absorption via the increase in the optical path of the photons. Such conditions are found in Belem, Manaus, Fortaleza, and Salvador due to the importance of local convection for cloud formation in such hot and humid locations. The differences in the fractional atmospheric absorption trends between clear-sky and all-sky conditions at these locations reinforces this: trends under all-sky conditions are 1 order of magnitude larger than their clear-sky counterparts. This is not observed at all the other locations, which have a higher dependence on mesoscale and synoptic-scale phenomena for cloud formation than the previously mentioned locations. In fact, a difference in the precipitation regimes between the region where all four aforementioned composites are located and the rest of Brazil has already been pointed out by Reboita et al. (2010) and Ferreira and Reboita (2022).
Chtirkova et al. (2023) investigated the potential effect of internal variability on the SSR trends and the relevance especially of Atlantic oceanic modes like the Atlantic Meridional Mode (AMM) or the Atlantic Multidecadal Oscillation (AMO) to affect SSR trends by changing cloudiness in Brazil. The AMM and AMO had lower values during the period of study (2001–2022), which should lead to decreasing SSR in northeast Brazil. This is consistent with the negative SSR trends in the region. But it is important to note that this reduction in the oceanic mode values did not represent a major phase transition of these modes. A major increase in AMO occurred in the 1990s, and the cloud cover trends (from ERA5) for the period 1990–2006 show a strong decrease in cloud cover in most of Brazil, especially the south and western part of the country. No SSR data were available for further investigation in this study, but the importance of internal variability for SSR trends should not be neglected in future studies.
The trends in SSR and supporting information in the eight composites made it possible to separate the discussion of the causes for the SSR trends into three groups. The composites in each group and their common characteristics are listed in Table 2.
Table 2Groups of composites with and their common characteristics as indicated by the results presented in this study.
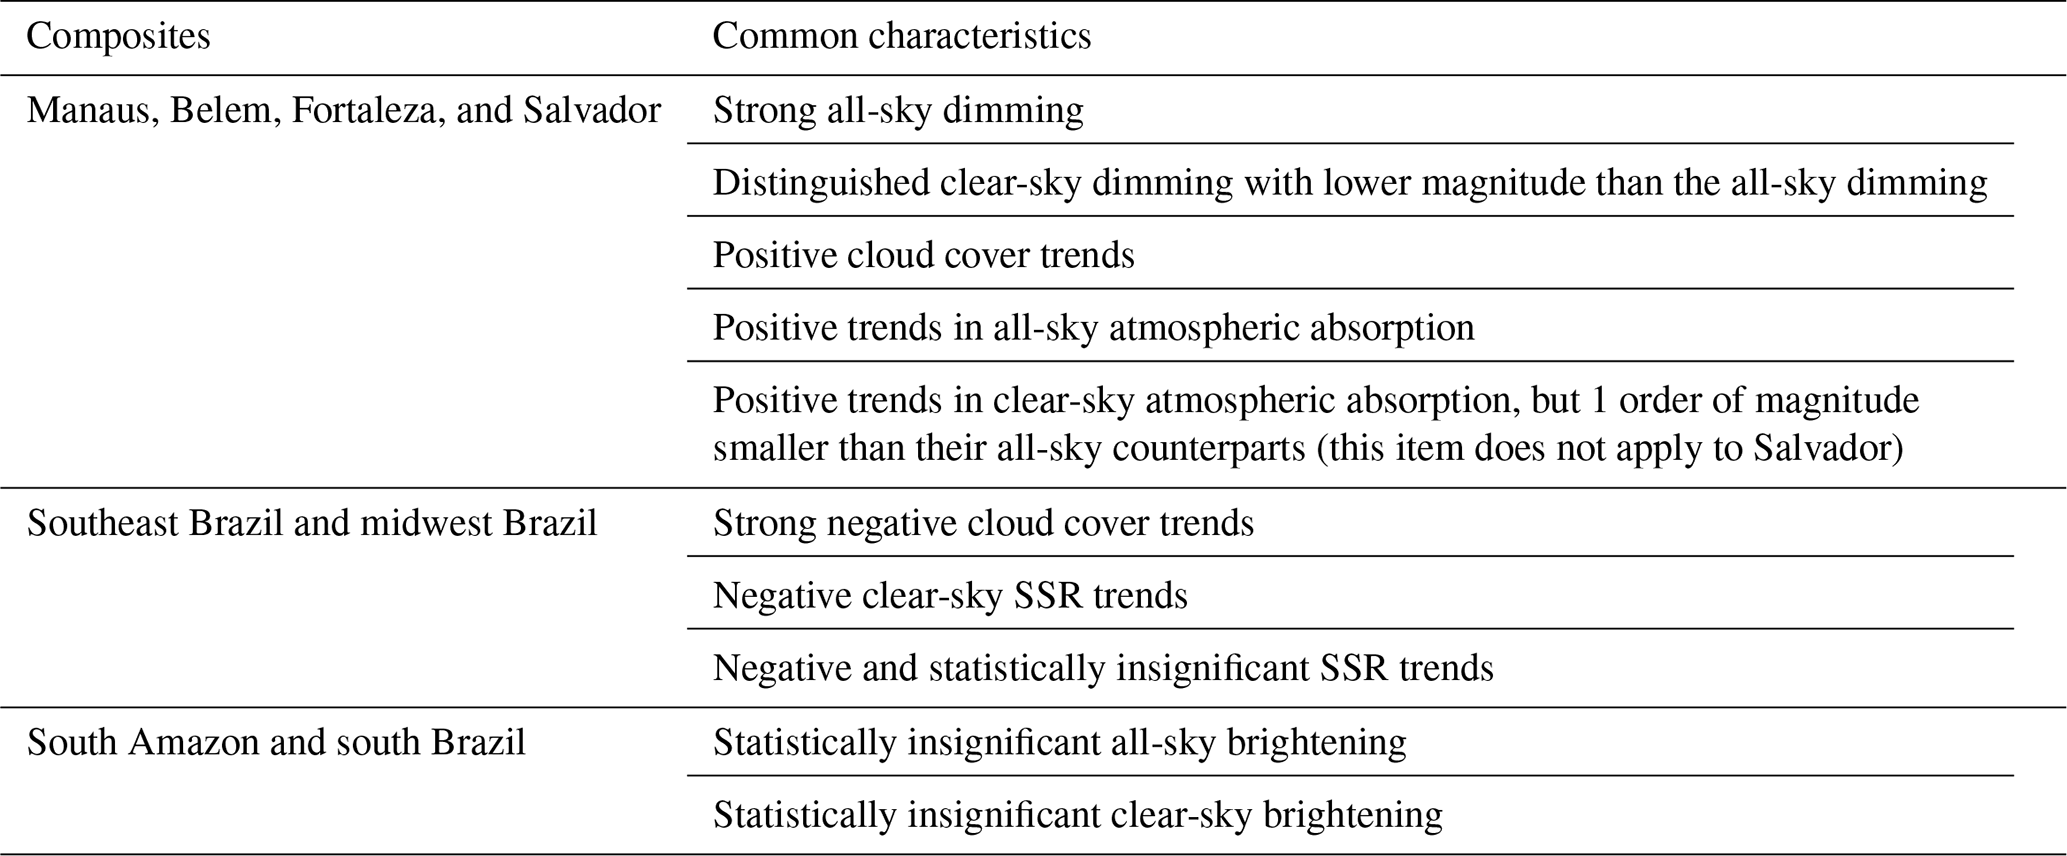
Based on this, we separated the discussion on the causes for SSR trends into three sections, each covering one of the three groups.
4.2 Dimming in north and northeast Brazil
In this section, we discuss the dimming observed in the Manaus, Belem, Fortaleza, and Salvador composites located in north and northeast Brazil. All of the composites showed statistically significant all-sky dimming during the study period, associated with a clear-sky dimming which was statistically significant in all composites, except Manaus. The difference in the magnitude of the all-sky SSR trends (from −6.3 W m−2 per decade in Salvador to −18.8 W m−2 per decade in Fortaleza) to the clear-sky SSR trends (from −2.0 W m−2 per decade in Manaus to −4.8 W m−2 per decade in Belem) in the four composites suggests that the clear-sky processes alone are unlikely to be strong enough to explain the SSR trends in these locations. However, the fact that the clear-sky trends show the same sign as the all-sky trends, with (in most cases) statistical significance, indicates that processes occurring under clear skies contributed significantly to the overall trends. The contrast between all-sky and clear-sky trends also indicates a potential contribution of changes in cloud cover to the trends. In fact, we identified positive cloud cover trends, consistent with the observed reduction in SSR, but the magnitude of the trends (from 0.8 % per decade in Fortaleza to 1.9 % per decade in Salvador) and the resulting impact of these cloud cover trends on the SSR trends, estimated by the CCRE (see Table 1), are small when compared with the SSR trends. Thus, our results (summarized in Table 1) suggest contributions from both clear-sky processes and cloud cover to the SSR trends, but none of them show a remarkable dominance over the other.
Further analysis of the atmospheric absorption showed strong positive (and statistically significant) trends in atmospheric absorption in all four composites. Schwarz et al. (2020) have shown that changes in atmospheric shortwave absorption can be an important driver of dimming and brightening. We also found that the atmospheric absorption trends were greatly enhanced by the presence of clouds. This happens because the scattering by clouds increases the optical path of the photons. This effect occurs primarily under broken cloud conditions, when three-dimensional multiple scattering magnifies this effect. Our findings comply with the results presented by Byrne et al. (1996) and references therein, which highlight the enhancement of atmospheric absorption of solar radiation under broken cloud conditions. Results from Li et al. (1995) also suggested that this effect is stronger in tropical regions, and the authors discuss that this is associated primarily with aerosol and water vapour absorption rather than cloud absorption. The characteristics of the distribution of cloudiness in the four composites, displayed in Fig. 9, might also play a role in this process. Stations from these composites tend to have frequent occurrences of partially cloudy conditions. In the Belem, Fortaleza, and Salvador composites, the daily cloud cover is between 25 % and 80 % on around two-thirds of the days. For the Manaus and midwest Brazil composites, this range of cloud cover occurred on around half of the days and for south and southeast Brazil composites, this value is around one-third. Thus, at the daily scale we see a dominance of partially cloudy occurrences at three out of the four composites discussed in this section. Although the same distinguishable characteristic was not found for the Manaus composite at the daily scale, based on the regionalization of precipitation regimes by Reboita et al. (2010), we would expect the same finding at a more refined time scale also for the Manaus composite. This would be the expectation because of the higher relevance of local convection at hot and humid locations (convective clouds cause more broken cloud fields than do large-scale synoptic clouds) at the four composites discussed in this section in comparison with the other composites, where mesoscale and synoptic meteorological systems tend to play a more important role for cloud formation. This higher occurrence of broken clouds in the regions of the four composites discussed in this section then tends to play an important role in the enhancement of atmospheric absorption.
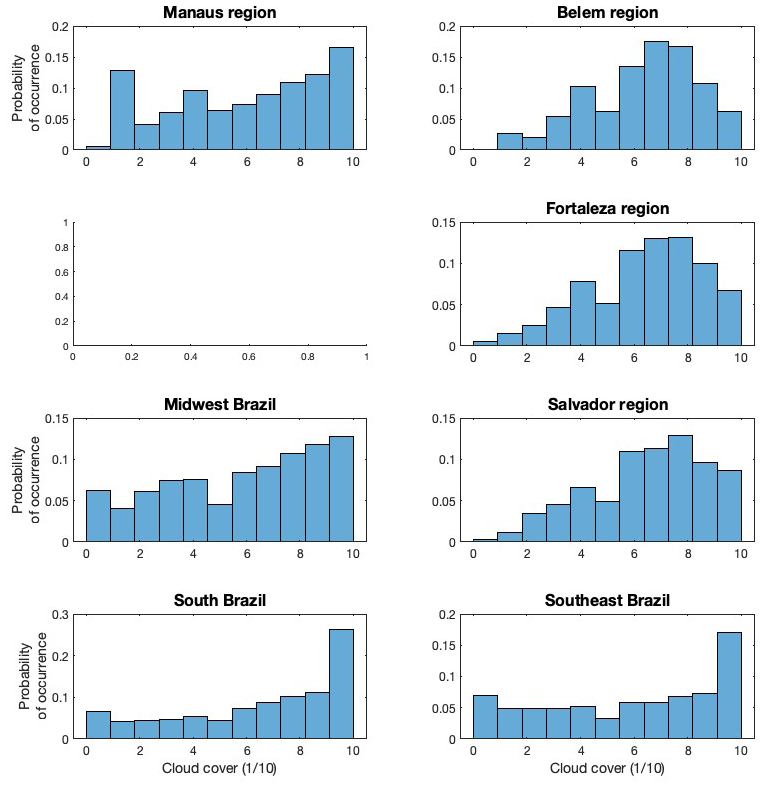
Figure 9Distribution of daily SYNOP cloud cover occurrences in seven out of the eight composites used in this study. Not enough data were available to derive a distribution for the south Amazon composite.
A simple multiplication between the incoming TOA radiation at each composite and the trends in fractional all-sky atmospheric absorption (shown in Table 1) reveals an estimated increase in all-sky atmospheric absorption from approximately 6 ± 3 W m−2 per decade in Belem to 14 ± 5 W m−2 per decade in Fortaleza. If we assume that such an increase in atmospheric absorption is directly reflected in a reduction in SSR, we find that the effect of changes in atmospheric absorption under all-sky conditions is higher than the estimated clear-sky SSR trends (see Table 1), and the estimated effects of changes in cloud cover (see CCRE in Table 1) are more consistent with the magnitude of the observed all-sky SSR trends (presented in Table 1). Thus, these results suggest that the increase in atmospheric absorption was the strongest contributor to the negative SSR trends observed in these four composites in north and northeast Brazil, with contributions also from changes in cloud cover. The difference in the all-sky and clear-sky absorption trends at these four composites indicates that clouds played an important role in the increase in absorption, most likely by enhancing the optical path of photons via multiple scattering under partially cloudy conditions. The results also suggest that these changes in atmospheric absorption were greatly influenced by the changes in the optical properties of the aerosols present in these regions. Our results showed the occurrence of increasing anthropogenic emissions of SO2 and black carbon, which did not seem to significantly change the AOD (possibly because of its competing effects with the reduction in biomass burning emissions in south Amazon) but increased the AAOD. This is most likely the cause for the increase in atmospheric absorption at the four composites. All of this points to a relevant influence of anthropogenic factors to the SSR trends in the first 2 decades of the 21st century in the regions around Manaus, Belem, Fortaleza, and Salvador. These are all big cities with over 1 million inhabitants each, and therefore this result could be biased towards big population centres.
4.3 Midwest and southeast Brazil
In this section we discuss the causes of the decadal SSR trends in the midwest and southeast Brazil composites. Both all-sky SSR composites show near-zero trends, with −0.4 ± 2.7 W m−2 per decade in the midwest and −0.6 ± 5.4 W m−2 per decade in southeast Brazil in the first 2 decades of the 21st century. Both composites show clear-sky SSR dimming (statistically significant in the midwest and statistically insignificant in the southeast) and statistically significant decrease in cloud cover in the study period. An increase in atmospheric absorption was also observed at these locations, but the trends were substantially smaller than the trends observed in the four composites discussed in the previous section. These results already suggest different physical processes play a role in the causes of SSR decadal trends in these regions.
The trends in fractional clear-sky atmospheric absorption in the two composites are similar to each other (0.0051 ± 0.005 per decade in the midwest and 0.0059 ± 0.007 per decade in the southeast) and are larger than the trends in three out of the four composites discussed in the previous section. The clear-sky absorption trends are also larger than the all-sky absorption trends in the midwest and southeast. This indicates a bigger relative relevance of the cloud-free processes for the SSR trends in these two regions compared with the four locations previously discussed. This is reinforced by the clear-sky SSR dimming at the two locations and is also most likely associated with increasing anthropogenic emissions, which lead to more absorptive aerosols, without a significant change in AOD.
A comparison between the results of these two composites with the four composites in north and northeast Brazil supports the discussion regarding the impacts of broken clouds on the solar atmospheric absorption and the distribution of cloud cover occurrences presented in the previous section. As discussed by Reboita et al. (2010) and Ferreira and Reboita (2022), in the region from midwest to southeast Brazil a stronger influence of large-scale synoptic meteorological systems like cold fronts, the South Atlantic Convergence Zone (SACZ), and the South American Low-Level Jet (SALLJ) contrast with north and northeast Brazil, where local convection and circulation play a more important role. This leads to different precipitation and cloudiness regimes between the composites discussed in this section and in previous sections. These regimes magnify the effects of atmospheric absorption in north and northeast Brazil, again in agreement with the results by Li et al. (1995) but not doing so in the rest of the country.
The results of these two composites also show a significant positive effect of changes in cloud cover on the SSR trends. Strong significant negative trends in cloud cover were observed in both regions. As a result of the competing effects between cloud-free processes and changes in cloud cover, the resulting SSR trends in the first 2 decades of the 21st century were negative, but near-zero, for both composites. This shows opposing effects of anthropogenic (changes in aerosols) and natural (changes in cloud cover) changes cancelling out.
4.4 South Amazon and south Brazil
In this section we discuss the causes for the SSR decadal trends in the south Amazon and south Brazil. In both regions statistically insignificant brightening was observed in the all-sky SSR trends. Clear-sky SSR trends also showed brightening (statistically insignificant) in both regions. Cloud cover trends in south Brazil were rather small (−0.4 % [−1.4; 0.6] per decade), while cloud data were not available for the south Amazon.
For the south Amazon, the most relevant aspect to be discussed is the strong negative trend in AOD observed in the study period associated with the documented reduction in deforestation and biomass burning in the Amazon (Silva Junior et al., 2021). Amazon biomass burning aerosols play an important role in the atmospheric transmissivity in the region but their emissions, and consequently their effects, are highly seasonally dependent, as shown by Schwarz et al. (2019). For this reason, although the annual AOD decadal trends show very strong negative values, the strong effects on SSR are present mostly in the dry season (Southern Hemisphere winter) and are smoothed out with annual means and decadal trend calculations. The seasonal clear-sky SSR trends in this composite are positive (statistically insignificant at the 95 % confidence level) in winter and spring (5.0 ± 5.6 and 1.1 ± 3.9 W m−2 per decade, respectively) and negative (statistically insignificant at the 95 % confidence level) in summer and fall (−2.6 ± 2.7 and −1.6 ± 3.3 W m−2 per decade, respectively), reinforcing this hypothesis. This smoothing of the AOD effects in the annual means and decadal trends is most likely the reason why, despite the strong negative AOD trends in the region, the all-sky and clear-sky SSR trends show positive trends with an absolute magnitude remarkably smaller than the trends observed in north and northeast Brazil. This counterintuitive result (strong negative AOD decadal trend not resulting in strong brightening, neither in all-sky nor in clear-sky SSR) reveals the importance of taking seasonality into account when investigating the response of SSR to changes in AOD.
In south Brazil, the SSR decadal trends are weakly positive and not of statistical significance, both under all-sky and clear-sky conditions. This suggests the lack of a strong driver for the SSR trends in the period analysed. Cloud cover shows a small negative trend (statistically insignificant). Near-zero trends are also found in AOD and in atmospheric absorption. The map of AAOD at 500 nm shows small positive trends in the period analysed, but water vapour shows small negative trends. It is important to note that due to the logarithmic response of atmospheric absorption to changes in water vapour (e.g. Hakuba et al., 2016), this is the region in Brazil with the strongest sensitivity to changes in water vapour expected. Combining all these results shows competing small effects from different sources and this is most likely the reason for the resulting non-significant trend observed. Another relevant aspect to be highlighted is that the period of analysis did not show a strong transition in the signal from oceanic modes in the Atlantic. Chtirkova et al. (2023) pointed out the importance of the AMM and AMO oceanic modes for the SSR trends in South America. This could be relevant for all composites, but the lack of strong effects on SSR changes of the existing forcing elements in south Brazil in the post-2000 period led us to hypothesize that in a transitional period of AMM and/or AMO, internal variability could dominate the SSR trends in this region, especially via changes in cloud cover. This hypothesis is reinforced by the cloud cover trends from ERA5 for the period 1990–2006 (Fig. A1), showing strong negative cloud cover trends in the region associated with the transitioning of the AMO from a negative to a positive phase. The expectation is that the cloud cover trends in this period dominated the SSR trends, causing brightening in the last decade of the 20st century in south Brazil. However, the lack of SSR data before 2000 did not allow us to verify this hypothesis.
In this study we presented and investigated the magnitudes of the SSR trends and their associated causes over the first 2 decades of the 21st century based on 34 stations in Brazil, divided into 8 composites of 3–5 stations each. These are the Manaus region, Belem region, south Amazon, Fortaleza region, midwest, Salvador region, southeast Brazil, and south Brazil. The exact temporal coverage of the SSR time series was composite-dependent, covering 22 years (2001–2022) in the four southernmost composites (south, southeast, midwest, and Salvador) and only 14 years (2008–2021) in the south Amazon composite, the shortest time span of all composites in this study. The limited length of the periods should be kept in mind, as they are shorter than the long-term dimming/brightening studies performed in regions like Europe.
We used cloud cover data from in situ measurements, clear-sky SSR time series derived with two different methods (using SYNOP cloud cover and the method by Correa et al., 2022), atmospheric absorption calculated combining in situ and satellite measurements, AOD from the CAMS reanalysis, AAOD from OMI satellite observations, and anthropogenic emissions from EDGAR to investigate the causes of the SSR trends in the eight composites in their period of data availability. All in situ data went through quality control procedures to attest their validity, and documentation of gridded data was carefully considered to account for potential issues. Our results showed that a strong dimming occurred in the composites located in north and northeast Brazil (Manaus, Belem, Fortaleza, and Salvador) in the period of study, while the other four composites all showed statistically insignificant trends (positive in the south Amazon and south Brazil and negative in the southeast and midwest).
A detailed analysis of the data revealed significant contributions of both clear-sky SSR and cloud cover changes to the trends observed in north and northeast Brazil but with a dominance of the effects of increasing atmospheric absorption under all-sky conditions. This is believed to be associated with increased anthropogenic/urban emissions, which would also explain the clear-sky SSR dimming and the characteristics of cloud occurrence in those regions. Previous studies (e.g. Li et al., 1995; Byrne et al., 1996) have discussed the increase in atmospheric absorption under broken cloud conditions due to the multiple scattering by clouds and absorption by water vapour and aerosols. The massive occurrence of partially cloudy conditions in these regions, in comparison with the other composites analysed in this study, make this mechanism much more relevant at the north and northeast Brazil stations than in all the others. The importance of changes in atmospheric shortwave absorption to dimming and brightening have also been highlighted by Schwarz et al. (2020). Although in the present study we have been able to identify different factors significantly affecting SSR trends in these regions and their magnitude, it would be important in future work to more precisely quantify the contributions of each factor causing SSR changes and to project the contributions of these factors in the future.
In southeast and midwest Brazil, statistically insignificant negative SSR trends in the period indicated that no single strong forcing dominated dimming and brightening. Therefore, the small trends were most likely the result of competing effects of negative cloud cover trends (resulting in a positive forcing on all-sky SSR) and negative clear-sky SSR trends (resulting in a negative forcing on all-sky SSR), where the clear-sky trends are also most likely associated with changes in aerosol absorption (due to changes in anthropogenic/urban aerosols). In the south Amazon the signal of the strong aerosol reduction, resulting from the reduction in biomass burning in the Amazon at the beginning of the 21st century (Silva Junior et al., 2021), dominated the observed brightening. This AOD reduction covered a large area in central Brazil, but did not reach most of the other composites, and areas with the strongest negative AOD trends (stronger than −0.06 per decade) were all located in the south of the Amazon. However, the resulting SSR trends (both all-sky and clear-sky) were not statistically significant. A potential reason for this might be the strong seasonality of the biomass burning in the Amazon (Schwarz et al., 2019), which means that the strong changes in AOD are affecting SSR only a few months per year, during winter and spring months (which might not be massively relevant since the stations in the composite are around 10–15° south). Due to missing data, we were not able to assess the extent of cloud cover contribution to this result. Finally in south Brazil, competing minor effects of cloud-free processes and cloud cover changes resulted in statistically insignificant brightening.
This study contributes to the understanding of the causes of SSR decadal trends in a region of the world with still limited observational data. Further research would, however, be very relevant, especially in the quantification of each of the factors causing SSR changes and in the estimation of these factors in the future.
Table A1Stations used in the study, the composites they were associated with, their coordinates, information on whether SYNOP cloud cover data were available and the percentage of months with available data (out of all the months in the period used for the respective composite; see Table 1).
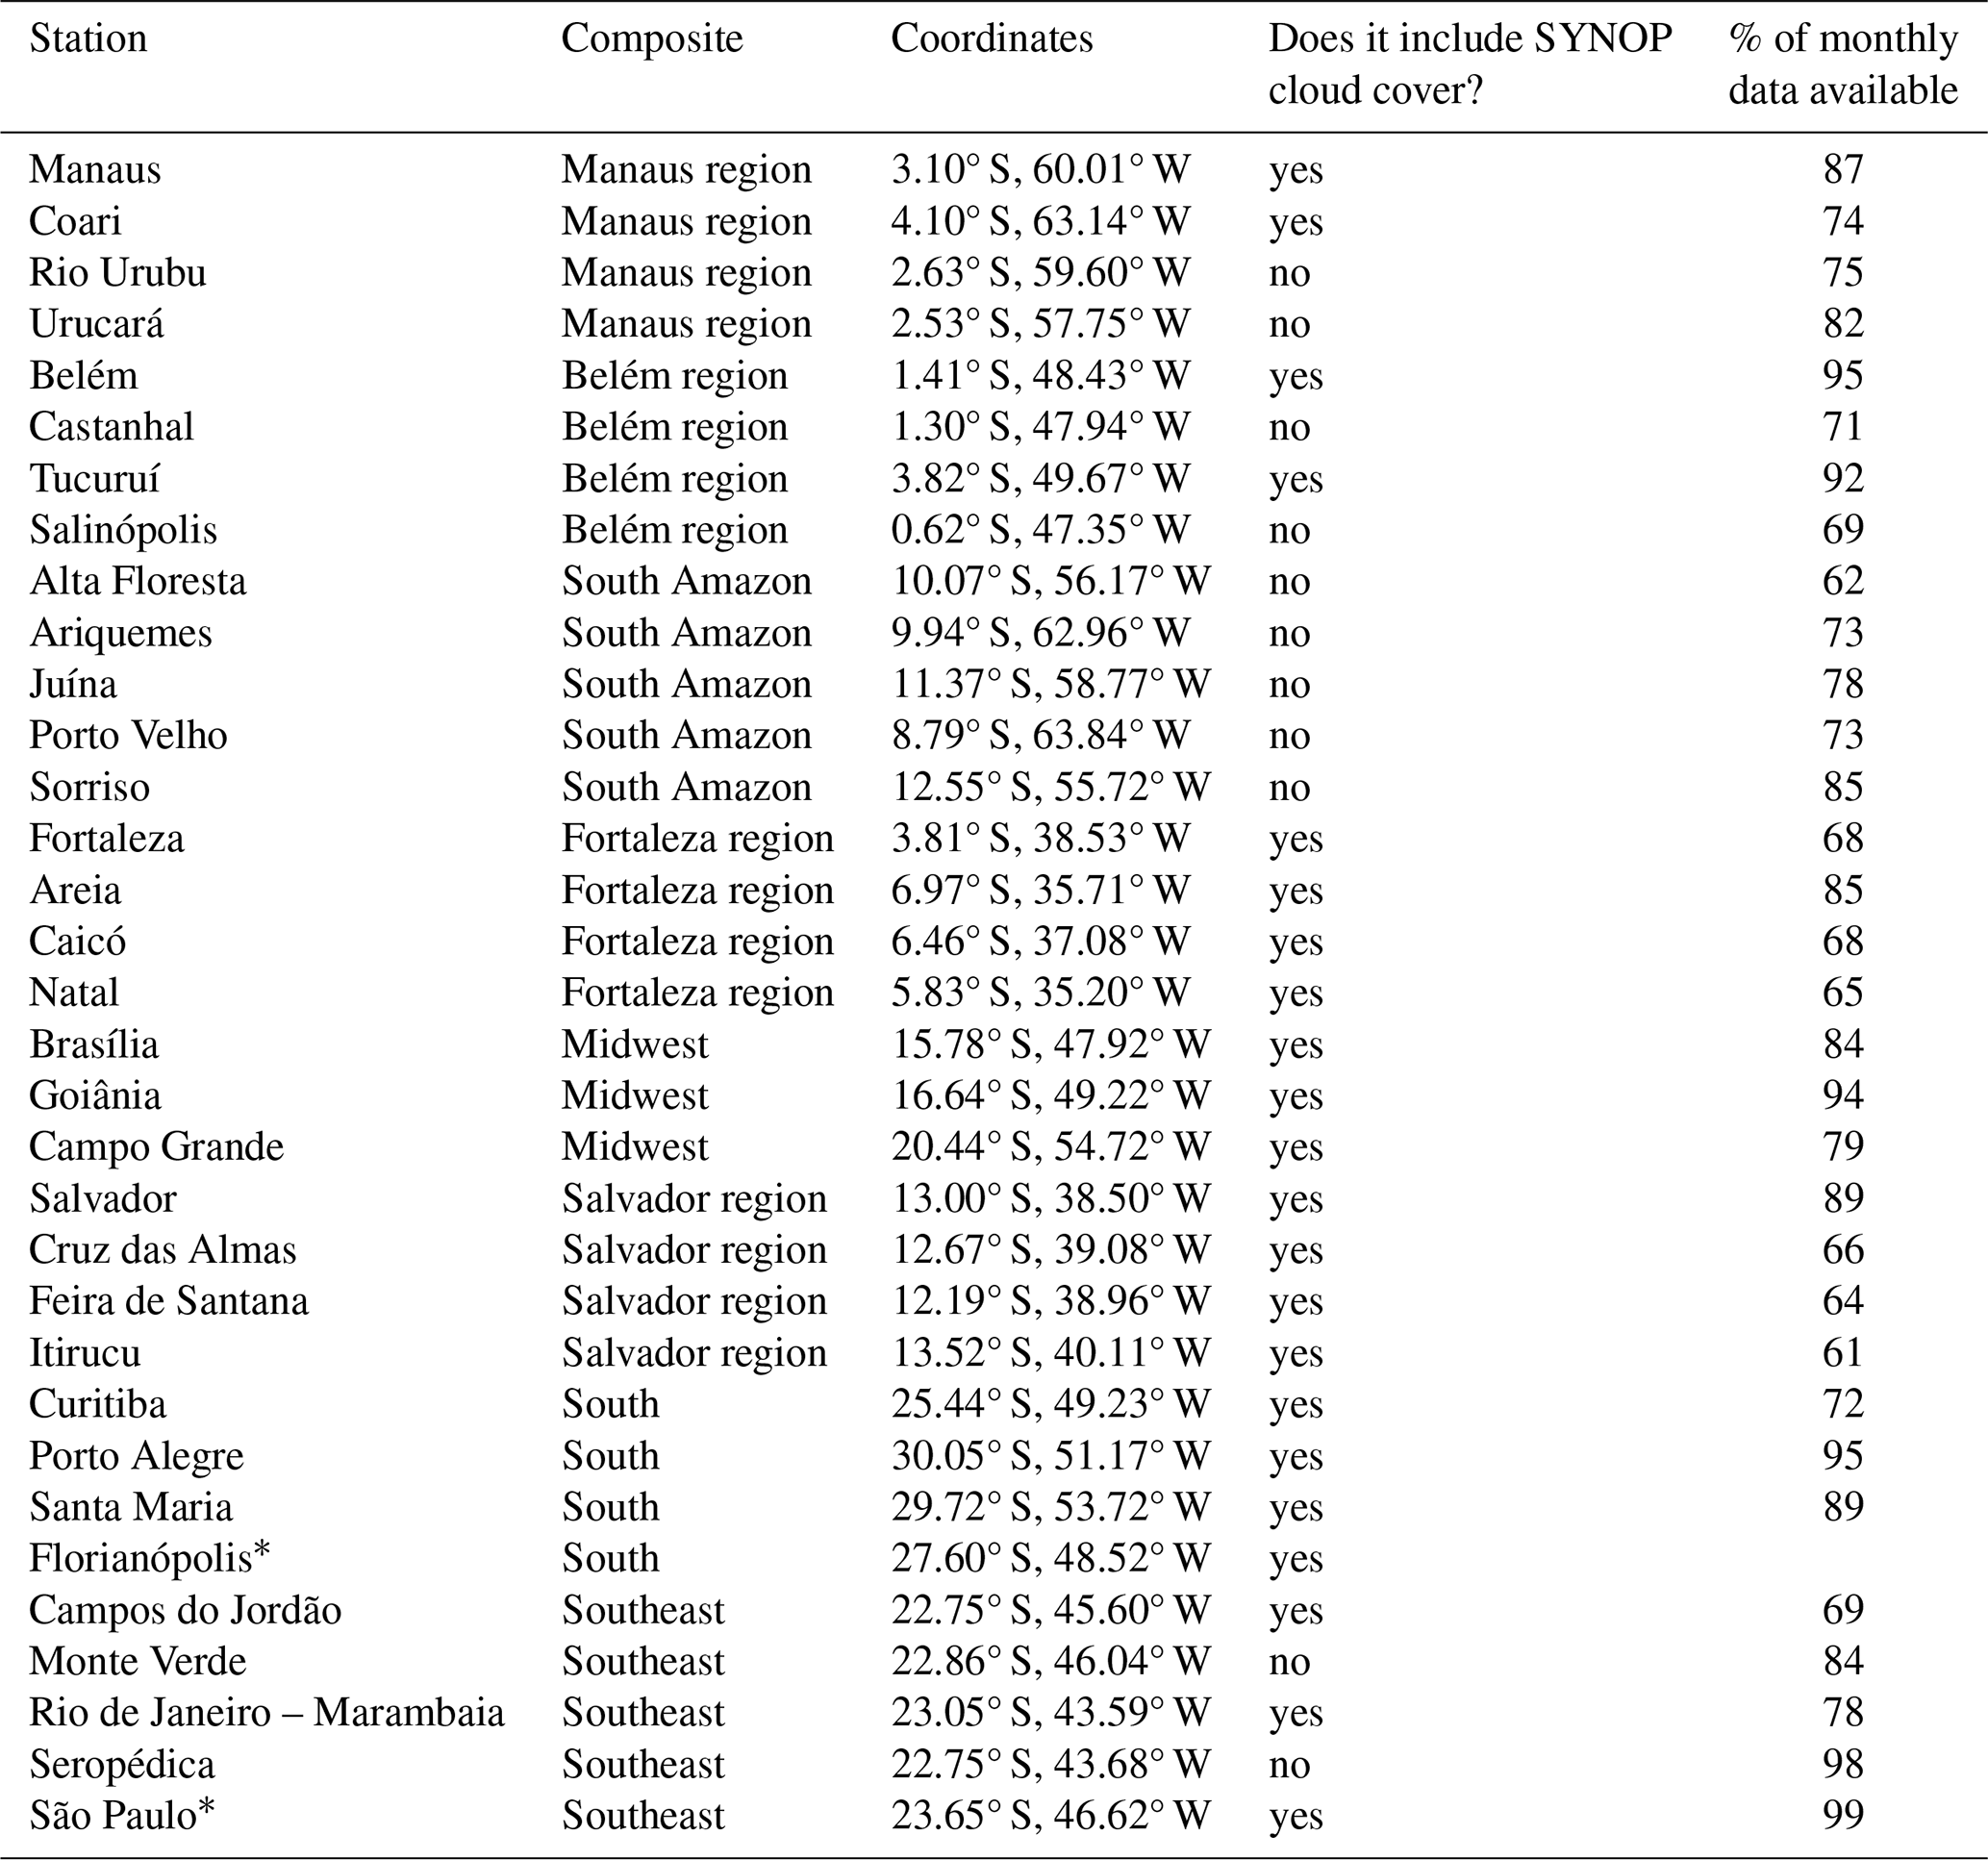
* Stations not from the Brazilian National Institute of Meteorology. Florianópolis station from BSRN; São Paulo station from the Institute for Astronomy, Geophysics and Atmospheric Sciences at the University of São Paulo.
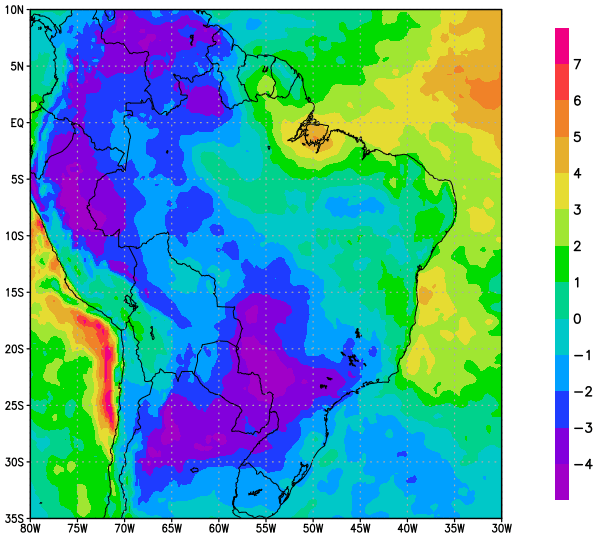
Figure A1Total cloud cover trends for the period 1990–2006 (in % per decade) from ERA5.
The data from the IAG/USP station can be requested at http://www.estacao.iag.usp.br/sol_dados.php (IAG-USP Estação Meteorológica, 2024). The data from INMET stations can be requested at https://bdmep.inmet.gov.br/ (INMET, 2024). The BSRN SSR data are available at https://doi.org/10.1594/PANGAEA.880000 (Driemel et al., 2018a). The CERES products are available at https://doi.org/10.5067/TERRA/CERES/SSF1DEGMONTH_L3.004A (NASA/LARC/SD/ASDC, 2015). The ERA 5 reanalysis data used in this study are available at https://doi.org/10.24381/cds.f17050d7 (Hersbach et al., 2023). The CAMS AOD reanalysis data are available under https://www.ecmwf.int/en/research/climate-reanalysis/cams-reanalysis (ECMWF, 2024). Data of anthropogenic emission estimates are available at the EDGAR website (https://edgar.jrc.ec.europa.eu/emissions_data_and_maps (EDGAR, 2024). The data from the OMI instrument used in this study are available at https://doi.org/10.5067/Aura/OMI/DATA3003 (Torres, 2008). The satellite cloud fraction data from CLARA, used to apply the clear-sky method used in this study can be found at https://doi.org/10.5676/EUM_SAF_CM/CLARA_AVHRR/V003 (Karlsson et al., 2023).
LFC designed the study, organized the data, and wrote the original manuscript. DF, BC, and MW revised and edited the text. All authors contributed to the analysis and to the final paper.
The contact author has declared that none of the authors has any competing interests.
Publisher’s note: Copernicus Publications remains neutral with regard to jurisdictional claims made in the text, published maps, institutional affiliations, or any other geographical representation in this paper. While Copernicus Publications makes every effort to include appropriate place names, the final responsibility lies with the authors.
The authors would like to thank the Instituto Nacional de Meteorologia (INMET) and the Weather Station of the Institute of Astronomy, Geophysics and Atmospheric Science of the University of São Paulo for providing the meteorological observations. We express our gratitude to the teams that produce and maintain the high-quality meteorological data used in this study from BSRN, CERES, ERA5, CAMS, OMI, EDGAR, and CLARA.
This research has been supported by the Swiss National Science Foundation (grant no. 200020_188601).
This paper was edited by Stelios Kazadzis and reviewed by three anonymous referees.
Artaxo, P., Oliveira, P. H., Lara, L. L., Pauliquevis, T. M., Rizzo, L. V., Junior, C. P., Paixão, M. A., Longo, K. M., de Freitas, S., and Correia, A. L.: Efeitos climáticos de partículas de aerossóis biogênicos e emitidos em queimadas na Amazônia, Revista Brasileira de Meteorologia, 21, 168–189, 2006.
Augustine, J. A. and Capotondi, A.: Forcing for multidecadal surface solar radiation trends over Northern Hemisphere continents, J. Geophys. Res.-Atmos., 127, e2021JD036342, https://doi.org/10.1029/2021JD036342, 2022.
Byrne, R. N., Somerville, R. C. J., and Subaşilar, B.: Broken-cloud enhancement of solar radiation absorption, J. Atmos. Sci., 53, 878–886, https://doi.org/10.1175/1520-0469(1996)053<0878:BCEOSR>2.0.CO;2, 1996.
Chiacchio, M. and Wild, M.: Influence of NAO and clouds on long-term seasonal variations of surface solar radiation in Europe, J. Geophys. Res.-Atmos., 115, D00D22, https://doi.org/10.1029/2009JD012182, 2010.
Chtirkova, B., Folini, D., Correa, L. F., and Wild, M.: Internal variability of the climate system mirrored in decadal-scale trends of surface solar radiation, J. Geophys. Res.-Atmos., 128, e2023JD038573, https://doi.org/10.1029/2023JD038573, 2023.
Correa, L. F., Folini, D., Chtirkova, B., and Wild, M.: A Method for Clear-Sky Identification and Long-Term Trends Assessment Using Daily Surface Solar Radiation Records, Earth and Space Science, 9, e2021EA002197, https://doi.org/10.1029/2021EA002197, 2022.
Crippa, M., Guizzardi, D., Muntean, M., Schaaf, E., Dentener, F., van Aardenne, J. A., Monni, S., Doering, U., Olivier, J. G. J., Pagliari, V., and Janssens-Maenhout, G.: Gridded emissions of air pollutants for the period 1970–2012 within EDGAR v4.3.2, Earth Syst. Sci. Data, 10, 1987–2013, https://doi.org/10.5194/essd-10-1987-2018, 2018.
Da Silva, V. D. P. R., e Silva, R. A., Cavalcanti, E. P., Braga, C. C., de Azevedo, P. V., Singh, V. P., and Pereira, E. R. R.: Trends in solar radiation in NCEP/NCAR database and measurements in northeastern Brazil, Sol. Energy, 84, 1852–1862, https://doi.org/10.1016/j.solener.2010.07.011, 2010.
de Jong, P., Barreto, T. B., Tanajura, C. A., Kouloukoui, D., Oliveira-Esquerre, K. P., Kiperstok, A., and Torres, E. A.: Estimating the impact of climate change on wind and solar energy in Brazil using a South American regional climate model, Renew. Energ., 141, 390–401, https://doi.org/10.1016/j.renene.2019.03.086, 2019.
de Lima, F. J. L., Martins, F. R., Costa, R. S., Gonçalves, A. R., dos Santos, A. P. P., and Pereira, E. B.: The seasonal variability and trends for the surface solar irradiation in northeastern region of Brazil, Sustainable Energy Technologies and Assessments, 35, 335–346, https://doi.org/10.1016/j.seta.2019.08.006, 2019.
Doelling, D. R., Loeb, N. G., Keyes, D. F., Nordeen, M. L., Morstad, D., Nguyen, C., Wielicki, B. A., and Sun, M.: Geostationary enhanced temporal interpolation for CERES flux products, J. Atmos. Ocean. Tech., 30, 1072–1090, https://doi.org/10.1175/JTECH-D-12-00136.1, 2013.
Doelling, D. R., Sun, M., Nordeen, M. L., Haney, C. O., Keyes, D. F., and Mlynczak, P. E.: Advances in geostationary-derived longwave fluxes for the CERES synoptic (SYN1deg) product, J. Atmos. Ocean. Tech., 33, 503–521, https://doi.org/10.1175/JTECH-D-15-0147.1, 2016.
Driemel, A., Augustine, J., Behrens, K., Colle, S., Cox, C. J., Cuevas-Agulló, E., Denn, F. M., Duprat, T., Dutton, E. G., Fukuda, M., Grobe, H., Haeffelin, M., Hodges, G., Hyett, N., Ijima, O., Kallis, A., Knap, W., Kustov, V., Lanconelli, C., Long, C., Longenecker, D., Lupi, A., Maturilli, M., Mimouni, M., Ntsangwane, L., Ogihara, H., Olano, X., Olefs, M., Omori, M., Passamani, L., Pereira, E. B., Schmithüsen, H., Schumacher, S., Sieger, R., Tamlyn, J., Vogt, R., Vuilleumier, L., Xia, X., Ohmura, A., and König-Langlo, G.: Baseline surface radiation data (1992-2017), PANGAEA [data set], https://doi.org/10.1594/PANGAEA.880000, 2018a.
Driemel, A., Augustine, J., Behrens, K., Colle, S., Cox, C., Cuevas-Agulló, E., Denn, F. M., Duprat, T., Fukuda, M., Grobe, H., Haeffelin, M., Hodges, G., Hyett, N., Ijima, O., Kallis, A., Knap, W., Kustov, V., Long, C. N., Longenecker, D., Lupi, A., Maturilli, M., Mimouni, M., Ntsangwane, L., Ogihara, H., Olano, X., Olefs, M., Omori, M., Passamani, L., Pereira, E. B., Schmithüsen, H., Schumacher, S., Sieger, R., Tamlyn, J., Vogt, R., Vuilleumier, L., Xia, X., Ohmura, A., and König-Langlo, G.: Baseline Surface Radiation Network (BSRN): structure and data description (1992–2017), Earth Syst. Sci. Data, 10, 1491–1501, https://doi.org/10.5194/essd-10-1491-2018, 2018b.
Dutton, E. G., Stone, R. S., Nelson, D. W., and Mendonca, B. G.: Recent interannual variations in solar radiation, cloudiness, and surface temperature at the South Pole, J. Climate, 4, 848–858, https://doi.org/10.1175/1520-0442(1991)004<0848:RIVISR>2.0.CO;2, 1991.
ECMWF: CAMS Reanalysis, https://www.ecmwf.int/en/research/climate-reanalysis/cams-reanalysis, last access: 21 February 2024.
EDGAR - Emissions Database for Global Atmospheric Research: https://edgar.jrc.ec.europa.eu/emissions_data_and_maps, last access: 21 February 2024.
Feng, F. and Wang, K.: Determining factors of monthly to decadal variability in surface solar radiation in China: Evidences from current reanalyses, J. Geophys. Res.-Atmos., 124, 9161–9182, https://doi.org/10.1029/2018JD030214, 2019.
Ferreira, G. W. and Reboita, M. S.: A new look into the South America precipitation regimes: Observation and Forecast, Atmosphere, 13, 873, https://doi.org/10.3390/atmos13060873, 2022.
Fisch, G., Marengo, J. A., and Nobre, C. A.: Uma revisão geral sobre o clima da Amazônia, Acta Amazon., 28, 101–101, https://doi.org/10.1590/1809-43921998282126, 1998 (in Portuguese with English abstract).
Gilgen, H., Roesch, A., Wild, M., and Ohmura, A.: Decadal changes in shortwave irradiance at the surface in the period from 1960 to 2000 estimated from Global Energy Balance Archive Data, J. Geophys. Res.-Atmos., 114, D00D08, https://doi.org/10.1029/2008JD011383, 2009.
Gueymard, C. A. and Yang, D.: Worldwide validation of CAMS and MERRA-2 reanalysis aerosol optical depth products using 15 years of AERONET observations, Atmos. Environ., 225, 117216, https://doi.org/10.1016/j.atmosenv.2019.117216, 2020.
Hakuba, M. Z., Folini, D., and Wild, M.: On the zonal near-constancy of fractional solar absorption in the atmosphere, J. Climate, 29, 3423–3440, https://doi.org/10.1175/JCLI-D-15-0277.1, 2016.
Hersbach, H., Bell, B., Berrisford, P., Hirahara, S., Horányi, A., Muñoz-Sabater, J., Nicolas, J., Peubey, C., Radu, R., Schepers, D., Simmons, A., Soci, C., Dee, D., and Thépaut, J. N.: The ERA5 global reanalysis, Q. J. Roy. Meteor. Soc., 146, 1999–2049, https://doi.org/10.1002/qj.3803, 2020.
Hersbach, H., Bell, B., Berrisford, P., Biavati, G., Horányi, A., Muñoz Sabater, J., Nicolas, J., Peubey, C., Radu, R., Rozum, I., Schepers, D., Simmons, A., Soci, C., Dee, D., and Thépaut, J.-N.: ERA5 monthly averaged data on single levels from 1940 to present, Copernicus Climate Change Service (C3S) Climate Data Store (CDS) [data set], https://doi.org/10.24381/cds.f17050d7, 2023.
IAG-USP Estação Meteorológica: IAG/USP station data, http://www.estacao.iag.usp.br/sol_dados.php, last access: 21 February 2024.
IBGE: Censo Demográfico, Fundação Instituto Brasileiro de Geografia e Estatística, Rio de Janeiro, Brazil, https://censo2022.ibge.gov.br/panorama/index.html (last access: 1 November 2023), 2022.
INMET (Instituto Nacional de Meteorologia): Banco de Dados Meteorológicos (BDMEP), https://bdmep.inmet.gov.br/, last access: 21 February 2024.
Inness, A., Ades, M., Agustí-Panareda, A., Barré, J., Benedictow, A., Blechschmidt, A.-M., Dominguez, J. J., Engelen, R., Eskes, H., Flemming, J., Huijnen, V., Jones, L., Kipling, Z., Massart, S., Parrington, M., Peuch, V.-H., Razinger, M., Remy, S., Schulz, M., and Suttie, M.: The CAMS reanalysis of atmospheric composition, Atmos. Chem. Phys., 19, 3515–3556, https://doi.org/10.5194/acp-19-3515-2019, 2019.
Jiao, B., Su, Y., Li, Q., Manara, V., and Wild, M.: An integrated and homogenized global surface solar radiation dataset and its reconstruction based on a convolutional neural network approach, Earth Syst. Sci. Data, 15, 4519–4535, https://doi.org/10.5194/essd-15-4519-2023, 2023.
Kambezidis, H. D., Kaskaoutis, D. G., Kharol, S. K., Moorthy, K. K., Satheesh, S. K., Kalapureddy, M. C. R., Vinoj, V., Wild, M., Anantha, R., and Kuniyal, J. C.: Multi-decadal variation of the net downward shortwave radiation over south Asia: The solar dimming effect, Atmos. Environ., 50, 360–372, https://doi.org/10.1016/j.atmosenv.2011.11.008, 2012.
Karlsson, K.-G., Riihelä, A., Trentmann, J., Stengel, M., Solodovnik, I., Meirink, J. F., Devasthale, A., Jääskeläinen, E., Kallio-Myers, V., Eliasson, S., Benas, N., Johansson, E., Stein, D., Finkensieper, S., Håkansson, N., Akkermans, T., Clerbaux, N., Selbach, N., Schröder, M., and Hollmann, R.: CLARA-A3: CM SAF cLoud, Albedo and surface RAdiation dataset from AVHRR data - Edition 3, Satellite Application Facility on Climate Monitoring (CM SAF) [data set], https://doi.org/10.5676/EUM_SAF_CM/CLARA_AVHRR/V003, 2023.
Kazadzis, S., Founda, D., Psiloglou, B. E., Kambezidis, H., Mihalopoulos, N., Sanchez-Lorenzo, A., Meleti, C., Raptis, P. I., Pierros, F., and Nabat, P.: Long-term series and trends in surface solar radiation in Athens, Greece, Atmos. Chem. Phys., 18, 2395–2411, https://doi.org/10.5194/acp-18-2395-2018, 2018.
Kendall, M. G.: Rank correlation methods, 2nd impression, Charles Griffin and Company Ltd., London and High Wycombe, 1975.
Kudo, R., Uchiyama, A., Ijima, O., Ohkawara, N., and Ohta, S.: Aerosol impact on the brightening in Japan, J. Geophys. Res.-Atmos., 117, D07208, https://doi.org/10.1029/2011JD017158, 2012.
Li, Z., Barker, H. W., and Moreau, L.: The variable effect of clouds on atmospheric absorption of solar radiation, Nature, 376, 486–490, https://doi.org/10.1038/376486a0, 1995.
Liepert, B. G.: Observed reductions of surface solar radiation at sites in the United States and worldwide from 1961 to 1990, Geophys. Res. Lett., 29, 61-1–61-4, https://doi.org/10.1029/2002GL014910, 2002.
Liley, J. B.: New Zealand dimming and brightening, J. Geophys. Res.-Atmos., 114, D00D10, https://doi.org/10.1029/2008JD011401, 2009.
Lobo, C. and Cunha, J. M. P. d.: Migração e mobilidade pendular nas áreas de influência de metrópoles brasileiras, Mercator (Fortaleza), 18, e18017, https://doi.org/10.4215/rm2019.e18017, 2019.
Long, C. N. and Dutton, E. G.: BSRN Global Network Recommended QC Tests, V2.0, BSRN Technical Report, http://hdl.handle.net/10013/epic.38770.d001 (last access: 1 August 2024), 2002.
Long, C. N., Dutton, E. G., Augustine, J. A., Wiscombe, W., Wild, M., McFarlane, S. A., and Flynn, C. J.: Significant decadal brightening of downwelling shortwave in the continental United States, J. Geophys. Res.-Atmos., 114, D00D06, https://doi.org/10.1029/2008JD011263, 2009.
Madhavan, B. L., Deneke, H., Witthuhn, J., and Macke, A.: Multiresolution analysis of the spatiotemporal variability in global radiation observed by a dense network of 99 pyranometers, Atmos. Chem. Phys., 17, 3317–3338, https://doi.org/10.5194/acp-17-3317-2017, 2017.
Manara, V., Brunetti, M., Celozzi, A., Maugeri, M., Sanchez-Lorenzo, A., and Wild, M.: Detection of dimming/brightening in Italy from homogenized all-sky and clear-sky surface solar radiation records and underlying causes (1959–2013), Atmos. Chem. Phys., 16, 11145–11161, https://doi.org/10.5194/acp-16-11145-2016, 2016.
Mann, H. B.: Nonparametric tests against trend, Econometrica, 13, 245–259, https://doi.org/10.2307/1907187, 1945.
NASA/LARC/SD/ASDC: CERES Time-Interpolated TOA Fluxes, Clouds and Aerosols Monthly Terra Edition4A, NASA Langley Atmospheric Science Data Center DAAC [data set], https://doi.org/10.5067/TERRA/CERES/SSF1DEGMONTH_L3.004A, 2015.
Natsis, A., Bais, A., and Meleti, C.: Trends from 30-Year Observations of Downward Solar Irradiance in Thessaloniki, Greece, Appl. Sci., 14, 252, https://doi.org/10.3390/app14010252, 2023.
Nishizawa, S. and Yoden, S.: Distribution functions of a spurious trend in a finite length data set with natural variability: Statistical considerations and a numerical experiment with a global circulation model, J. Geophys. Res.-Atmos., 110, D12105, https://doi.org/10.1029/2004JD005714, 2005.
Norris, J. R. and Wild, M.: Trends in aerosol radiative effects over Europe inferred from observed cloud cover, solar “dimming”, and solar “brightening”, J. Geophys. Res.-Atmos., 112, D08214, https://doi.org/10.1029/2006JD007794, 2007.
Ohmura, A.: Observed decadal variations in surface solar radiation and their causes, J. Geophys. Res.-Atmos., 114, D00D05, https://doi.org/10.1029/2008JD011290, 2009.
Ohmura, A. and Lang, H.: Secular variation of global radiation over Europe, in: Current Problems in Atmospheric Radiation, edited by: Lenoble, J. and Geleyn, J. F., Proceedings of the International Radiation Symposium 1988, 298–301, 1989.
Ohmura, A., Dutton, E. G., Forgan, B., Fröhlich, C., Gilgen, H., Hegner, H., Heimo, A., König-Langlo, G., McArthur, B., Müller, G., Philipona, R., Pinker, R. T., Whitlock, C. H., Dehne, K., and Wild, M.: Baseline Surface Radiation Network (BSRN/WCRP): New precision radiometry for climate research, B. Am. Meteorol. Soc., 79, 2115–2136, https://doi.org/10.1175/1520-0477(1998)079<2115:BSRNBW>2.0.CO;2, 1998.
Pfeifroth, U., Sanchez-Lorenzo, A., Manara, V., Trentmann, J., and Hollmann, R.: Trends and variability of surface solar radiation in Europe based on surface- and satellite-based data records, J. Geophys. Res.-Atmos., 123, 1735–1754, https://doi.org/10.1002/2017JD027418, 2018.
Power, H. C.: Trends in solar radiation over Germany and an assessment of the role of aerosols and sunshine duration, Theor. Appl. Climatol., 76, 47–63, https://doi.org/10.1007/s00704-003-0005-8, 2003.
Raichijk, C.: Observed trends in sunshine duration over South America, Int. J. Climatol., 32, 669–680, https://doi.org/10.1002/joc.2296, 2012.
Reboita, M. S., Gan, M. A., Da Rocha, R. P., and Ambrizzi, T.: Precipitation regimes in South America: a bibliography review, Revista Brasileira de Meteorologia, 25, 185–204, https://doi.org/10.1590/S0102-77862010000200004, 2010.
Rosário, N. E., Sauini, T., Pauliquevis, T., Barbosa, H. M. J., Yamasoe, M. A., and Barja, B.: Aerosol optical depth retrievals in central Amazonia from a multi-filter rotating shadow-band radiometer calibrated on-site, Atmos. Meas. Tech., 12, 921–934, https://doi.org/10.5194/amt-12-921-2019, 2019.
Russak, V.: Trends of solar radiation, cloudiness and atmospheric transparency during recent decades in Estonia, Tellus B, 42, 206-210, https://doi.org/10.3402/tellusb.v42i2.15205, 1990.
Schwartz, R. D.: Global dimming: Clear-sky atmospheric transmission from astronomical extinction measurements, J. Geophys. Res.-Atmos., 110, D14210, https://doi.org/10.1029/2005JD005882, 2005.
Schwarz, M., Folini, D., Hakuba, M. Z., and Wild, M.: From point to area: Worldwide assessment of the representativeness of monthly surface solar radiation records, J. Geophys. Res.-Atmos., 123, 13857–13877, https://doi.org/10.1029/2018JD029169, 2018.
Schwarz, M., Folini, D., Yang, S., and Wild, M.: The annual cycle of fractional atmospheric shortwave absorption in observations and models: spatial structure, magnitude, and timing, J. Climate, 32, 6729–6748, https://doi.org/10.1175/JCLI-D-19-0212.1, 2019.
Schwarz, M., Folini, D., Yang, S., Allan, R. P., and Wild, M.: Changes in atmospheric shortwave absorption as important driver of dimming and brightening, Nat. Geosci., 13, 110–115, https://doi.org/10.1038/s41561-019-0528-y, 2020.
Sen, P. K.: Estimates of the regression coefficient based on Kendall's tau, J. Am. Stat. Assoc., 63, 1379–1389, https://doi.org/10.2307/2285891, 1968.
Silva Junior, C. H., Pessôa, A. C., Carvalho, N. S., Reis, J. B., Anderson, L. O., and Aragão, L. E.: The Brazilian Amazon deforestation rate in 2020 is the greatest of the decade, Nature Ecology & Evolution, 5, 144–145, https://doi.org/10.1038/s41559-020-01368-x, 2021.
Stanhill, G. and Moreshet, S.: Global radiation climate changes: The world network, Climatic Change, 21, 57–75, https://doi.org/10.1007/BF00143253, 1992.
Stjern, C. W., Kristjánsson, J. E., and Hansen, A. W.: Global dimming and global brightening–An analysis of surface radiation and cloud cover data in northern Europe, Int. J. Climatol., 29, 643–653, https://doi.org/10.1002/joc.1735, 2009.
Torres, O., Tanskanen, A., Veihelmann, B., Ahn, C., Braak, R., Bhartia, P. K., Veefkind, P., Levelt, P., and De Leeuw, G.: Aerosols and surface UV products from Ozone Monitoring Instrument observations: An overview, J. Geophys. Res.-Atmos., 112, D24S47, https://doi.org/10.1029/2007JD008809, 2007.
Torres, O. O.: OMI/Aura Near UV Aerosol Optical Depth and Single Scattering Albedo L3 1 day 1.0 degree x 1.0 degree V3, NASA Goddard Space Flight Center, Goddard Earth Sciences Data and Information Services Center (GES DISC) [data set], https://doi.org/10.5067/Aura/OMI/DATA3003, 2008.
Vera, C., Baez, J., Douglas, M., Emmanuel, C. B., Marengo, J., Meitin, J., Nicolini, M., and Zipser, E.: The South American low-level jet experiment, B. Am. Meteorol. Soc., 87, 63–77, https://doi.org/10.1175/BAMS-87-1-63, 2006.
Wang, C., Jeong, G. R., and Mahowald, N.: Particulate absorption of solar radiation: anthropogenic aerosols vs. dust, Atmos. Chem. Phys., 9, 3935–3945, https://doi.org/10.5194/acp-9-3935-2009, 2009.
Wang, K., Ma, Q., Li, Z., and Wang, J.: Decadal variability of surface incident solar radiation over China: Observations, satellite retrievals, and reanalyses, J. Geophys. Res.-Atmos., 120, 6500–6514, https://doi.org/10.1002/2015JD023420, 2015.
Wang, X. L.: Penalized maximal F test for detecting undocumented mean shift without trend change, J. Atmos. Ocean. Tech., 25, 368–384, https://doi.org/10.1175/2007JTECHA982.1, 2008.
Wild, M.: Global dimming and brightening: A review, J. Geophys. Res.-Atmos., 114, D00D16, https://doi.org/10.1029/2008JD011470, 2009.
Wild, M., Wacker, S., Yang, S., and Sanchez-Lorenzo, A.: Evidence for clear-sky dimming and brightening in central Europe, Geophys. Res. Lett., 48, e2020GL092216, https://doi.org/10.1029/2020GL092216, 2021.
Xia, X., Chen, H., Li, Z., Wang, P., and Wang, J.: Significant reduction of surface solar irradiance induced by aerosols in a suburban region in northeastern China, J. Geophys. Res.-Atmos., 112, D22S02, https://doi.org/10.1029/2006JD007562, 2007.
Yamasoe, M. A., Rosário, N. M. É., Almeida, S. N. S. M., and Wild, M.: Fifty-six years of surface solar radiation and sunshine duration over São Paulo, Brazil: 1961–2016, Atmos. Chem. Phys., 21, 6593–6603, https://doi.org/10.5194/acp-21-6593-2021, 2021.
Yang, S., Wang, X. L., and Wild, M.: Homogenization and trend analysis of the 1958–2016 in situ surface solar radiation records in China, J. Climate, 31, 4529–4541, https://doi.org/10.1175/JCLI-D-17-0891.1, 2018.
Yuan, M., Leirvik, T., and Wild, M.: Global trends in downward surface solar radiation from spatial interpolated ground observations during 1961–2019, J. Climate, 34, 9501–9521, https://doi.org/10.1175/JCLI-D-21-0165.1, 2021.
Zuluaga, C. F., Avila-Diaz, A., Justino, F. B., and Wilson, A. B.: Climatology and trends of downward shortwave radiation over Brazil, Atmos. Res., 250, 105347, https://doi.org/10.1016/j.atmosres.2020.105347, 2021.