the Creative Commons Attribution 4.0 License.
the Creative Commons Attribution 4.0 License.
 | 07 Aug 2024
Elucidating the boundary layer turbulence dissipation rate using high-resolution measurements from a radar wind profiler network over the Tibetan Plateau
Deli Meng
Xiaoran Guo
Yinjun Wang
Ning Li
Yuping Sun
Zhen Zhang
Na Tang
Haoran Li
Fan Zhang
Bing Tong
Hui Xu
Tianmeng Chen
The planetary boundary layer (PBL) over the Tibetan Plateau (TP) exerts a significant influence on regional and global climate, while its vertical structures of turbulence and evolution features remain poorly understood, largely due to the scarcity of observations. This study examines the vertical profile of and daytime variation in the turbulence dissipation rate (ε) in the PBL and free troposphere over the TP using the high-resolution (6 min and 120 m) measurements from a radar wind profiler (RWP) network, combined with hourly data from ERA5 during the period from 1 September 2022 to 31 October 2023. Observational analyses show that the magnitude of ε below 3 km under all-sky conditions exhibits a large spatial discrepancy over the six RWP stations over the TP. Particularly, the values of ε at Minfeng and Jiuquan over the northern TP and at Dingri (alternately Tingri) over the southern TP are roughly an order of magnitude greater than those at Lijiang, Ganzi (alternately Garzê), and Hongyuan over the eastern TP. This could be partially attributed to the difference in land cover across the six RWP stations. In terms of the diurnal variation, ε rapidly intensifies from 09:00 local standard time (LST) to 14:00 LST and then gradually levels off in the late afternoon. Under clear-sky conditions, both ε and the planetary boundary layer height (zi) are greater compared with cloudy-sky conditions, which could be due to the cooling effect of clouds, which reduces the solar irradiation reaching the surface. In the lower PBL (0.3 ≤ ≤ 0.5), where z is the height above ground level, the dominant influential factor in the development of turbulence is the surface–air temperature difference (Ts−Ta). By comparison, in the upper PBL (0.6 ≤ ≤ 1.0), both Ts−Ta and vertical wind shear (VWS) affect the development of turbulence. Above the PBL (1.0 < ≤ 2.0), the shear production resulting from VWS dominates the variation in turbulence. Under cloudy-sky conditions, the reduced Ts−Ta and weakened surface sensible heat flux tend to inhibit the turbulent motion in the PBL. On the other hand, the strong VWS induced by clouds enhances the turbulence above the PBL. The findings obtained here underscore the importance of the RWP network in revealing the fine-scale structures of the PBL over the TP and gaining new insight into the PBL evolution.
- Article
(12653 KB) - Full-text XML
-
Supplement
(2379 KB) - BibTeX
- EndNote


Turbulence ranks among the most intricate phenomena within the atmosphere, ensuring that the planetary boundary layer (PBL) remains thoroughly mixed during daylight hours (Li et al., 2023). As a result, the structure of the PBL is, to a considerable extent, governed by the evolution of turbulence (Teixeira et al., 2021). The turbulence dissipation rate (ε) reflects the amount of turbulent kinetic energy (TKE) that is converted into heat at the Kolmogorov scale and is a measure of the turbulence intensity (McCaffrey et al., 2017; Muñoz-Esparza et al., 2018). Proper parameterizations of the turbulence dissipation term with the aid of observations have great impacts on the forecast skill of weather and climate models, as ε strongly affects vertical turbulent mixing through its influence on TKE (Yang et al., 2017). Accurate estimation of ε is crucial for understanding the structure of turbulence in the PBL. To date, a variety of instruments have been used to observe or retrieve the vertical profiles of ε, including sodar, radar wind profiler (RWP), radiosonde, Doppler wind lidar (DWL), and ultrasonic anemometer instruments (Jacoby-Koaly et al., 2002; Dodson and Griswold, 2021; Lv et al., 2021; Kotthaus et al., 2023). Compared with DWL, RWPs exhibit better capability in capturing turbulence structures in cloudy sky. Furthermore, it is hard for radiosondes and ultrasonic anemometers to perform temporally continuous measurements of atmospheric turbulence due to high costs.
The Tibetan Plateau (TP), with an average elevation greater than 4000 m above sea level () and an area of approximately 2.5×10⁶ km2, towers into the lower and middle troposphere (Huang et al., 2023). By receiving a greater amount of solar shortwave radiation, the surface layer of the TP can transfer more heat through the PBL to the free atmosphere (Wang et al., 2015; Ma et al., 2023). The PBL over the TP exhibits strong convective thermals of warm air and upward motions due to the lower air density and buoyancy effect, which results in significant turbulence motions and turbulence–convection interactions with “popcorn” cloud structures (Xu et al., 2002, 2023). Understanding the statistical behavior of ε is key to revealing the vertical structure and evolution of PBL turbulence, which could improve the parameterization of PBL processes over the TP (Wang et al., 2015; Xu et al., 2019; Zhao et al., 2019; Ma et al., 2023). However, due to the limited observations of turbulence profiles, the daytime variation characteristics of ε over the TP and its main influencing mechanisms remain poorly understood.
A vast range of previous studies have attempted to figure out the mechanisms behind the turbulence, but most of them have been based on radiosonde measurements, model simulation, or reanalysis data (e.g., Banerjee et al., 2018; Che and Zhao, 2021; C. X. Wang et al., 2023). A myriad of driving mechanisms have been proposed to account for the PBL development over the TP, such as surface thermal and dynamic forcing or atmospheric stability (Chen et al., 2016; Lai et al., 2021; Wang and Zhang, 2022; Chechin et al., 2023; C. X. Wang et al., 2023). It has been demonstrated that the buoyancy term contribution on the southern slope of the TP is significantly larger than that on the southeastern edge of the TP (Wang et al., 2015). A larger surface–air temperature difference (Ts−Ta) and a larger sensible heat flux promote the rapid growth of a deep PBL in the western and southern TP (Chen et al., 2013, 2016; Wang et al., 2016; Z. G. Li et al., 2017; Zhang et al., 2022).
Except for the abovementioned thermal and dynamic effects, the cloud radiative effect is found to be another significant factor that can dramatically modulate the evolution of daytime PBL turbulence (Bodenschatz et al., 2010; Davis et al., 2020). For instance, cloud radiative forcing accounts for the rapid morning transition from a stable to unstable PBL, thereby notably affecting the diurnal variation in the PBL (Su et al., 2023). Notably, longwave radiative cooling at the top of stratocumulus clouds can enhance turbulent diffusion within the stratocumulus-topped PBL (Sun et al., 2016). A recent observational study suggests that cloud radiative cooling contributed about 32 % to turbulent mixing even near the surface (Huang et al., 2020). In other words, cloud radiative processes, including entrainment and radiative cooling, can affect TKE in the atmosphere (Nicholls, 1986; Sedlar et al., 2022; Chechin et al., 2023).
The TP is characterized by a high frequency of cumulus clouds that is about 5 times the regional mean over other areas of China (Wang et al., 2015), and the occurrence frequency of clouds over the TP shows large diurnal and spatial variability, with the maxima in the afternoon in the eastern TP (Wan et al., 2022). The clouds have been found to significantly suppress the development of the summer PBL in the early afternoon across China using fine-resolution radiosonde observations (Guo et al., 2019). Under continuous cloudy-sky conditions, the convective PBL develops slowly due to the smaller surface sensible heat compared to clear-sky conditions (Wang and Zhang, 2022). The turbulence motion in the PBL and its dynamic structure contribute to the formation and development of the popcorn-like convective clouds (Xu et al., 2002; Wang et al., 2020). Compared with eastern China, the higher occurrence of low cloud in the afternoon over the TP is found to facilitate the PBL development, mainly owing to the lower atmospheric density (Wang et al., 2020).
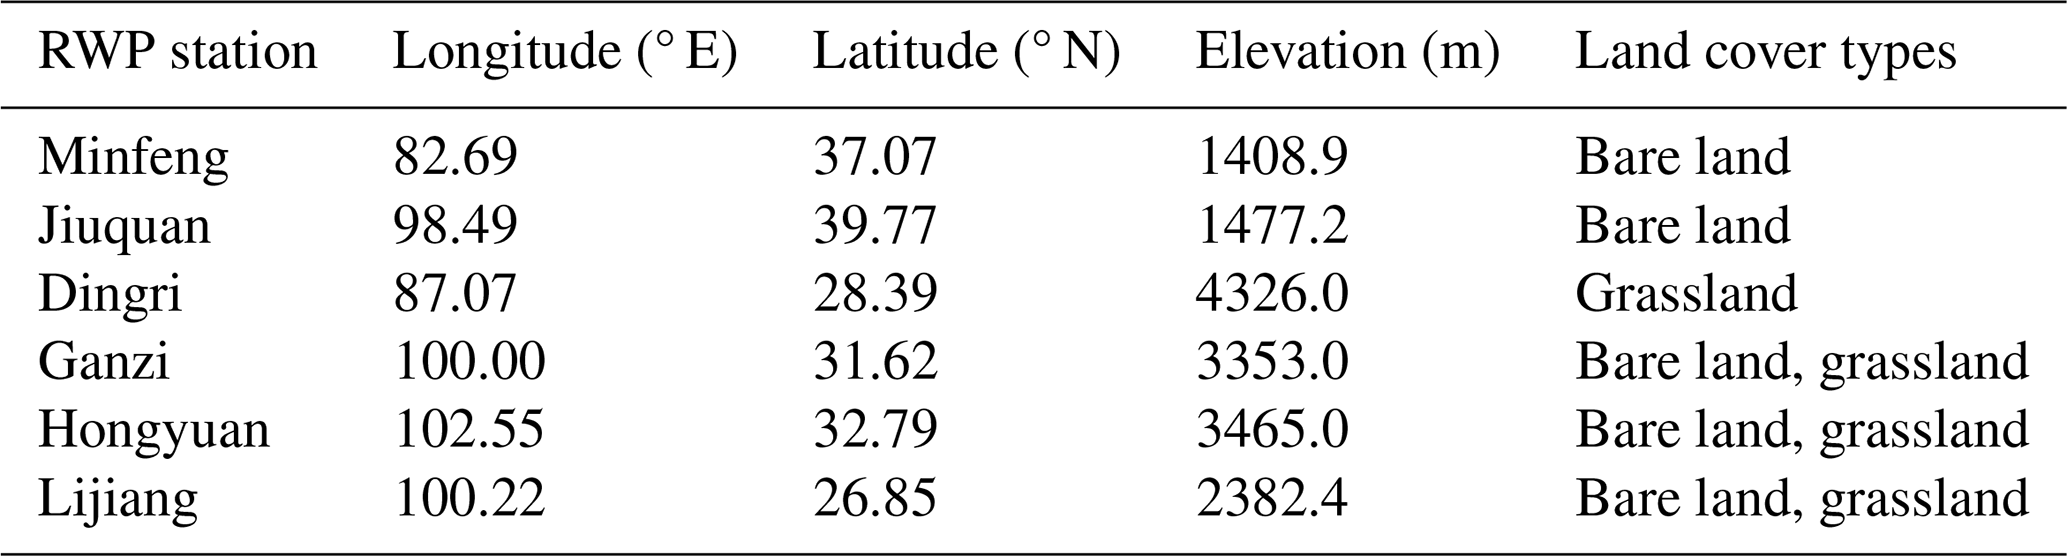
Table 1Summary of the geographical conditions and land surface of the six radar wind profiler (RWP) stations over the Tibetan Plateau (TP).
However, the differences in turbulence vertical structures between clear-sky and cloudy-sky conditions are rarely explored, and the possible mechanism influencing the cloud-topped PBL turbulence evolution remains unclear. To the best of our knowledge, most of the abovementioned studies over the TP lack high-temporal-resolution turbulence profile observations. Coincidently, the RWP network in China provides us with a valuable opportunity to characterize the PBL turbulence structure over the TP (Guo et al., 2021a). Therefore, the main objective of this study is to resolve the above issues over the TP, using observations from the RWP network together with other ground-based meteorological measurements and the ERA5 data. We also analyze the joint effect of thermodynamics and dynamics on ε structure in the daytime (09:00–17:00 local standard time, LST) PBL through Ts−Ta and vertical wind shear (VWS).
The remainder of this paper proceeds as follows: Sect. 2 describes the data and methods used in this study. In Sect. 3, we analyze the spatio-temporal characteristics and daytime pattern of ε over the TP and investigate the possible thermodynamic and dynamic effect on PBL turbulence under clear-sky and cloudy-sky conditions. The summary and conclusions are given in Sect. 4.
2.1 The RWP network over the TP
In this study, we use the vertical measurements of RWP data with a vertical resolution of 120 m and a temporal resolution of 6 min from the RWP network over the TP, which contains six operational stations (Minfeng, Jiuquan, Hongyuan, Ganzi (alternately Garzê), Lijiang, and Dingri (alternately Tingri)) operated by the China Meteorological Administration (CMA) during the period from 1 September 2022 to 31 October 2023. The spatial distribution of the RWP network over the TP is shown in Fig. 1, and detailed information for each RWP station, including longitude, latitude, elevation, and land cover type, is given in Table 1. Among these six RWP stations, the Dingri station is located in the foothills of the Himalayas with an elevation of more than 4300 and is dominated by the land cover of bare land and alpine grassland. The Lijiang station is located in the southeastern TP and is characterized by complex terrain with an elevation of about 2400 . The Ganzi and Hongyuan stations are situated in the eastern TP, with elevations ranging from 3300 to 3500 and whose underlying land cover is mainly alpine grassland. The Minfeng and Jiuquan stations are situated in arid and semiarid zones to the north of the TP, with elevations ranging from 1400 to 1500 m, and their dominant underlying land cover is mainly bare land. Therefore, these two stations are good representatives of the northern TP.
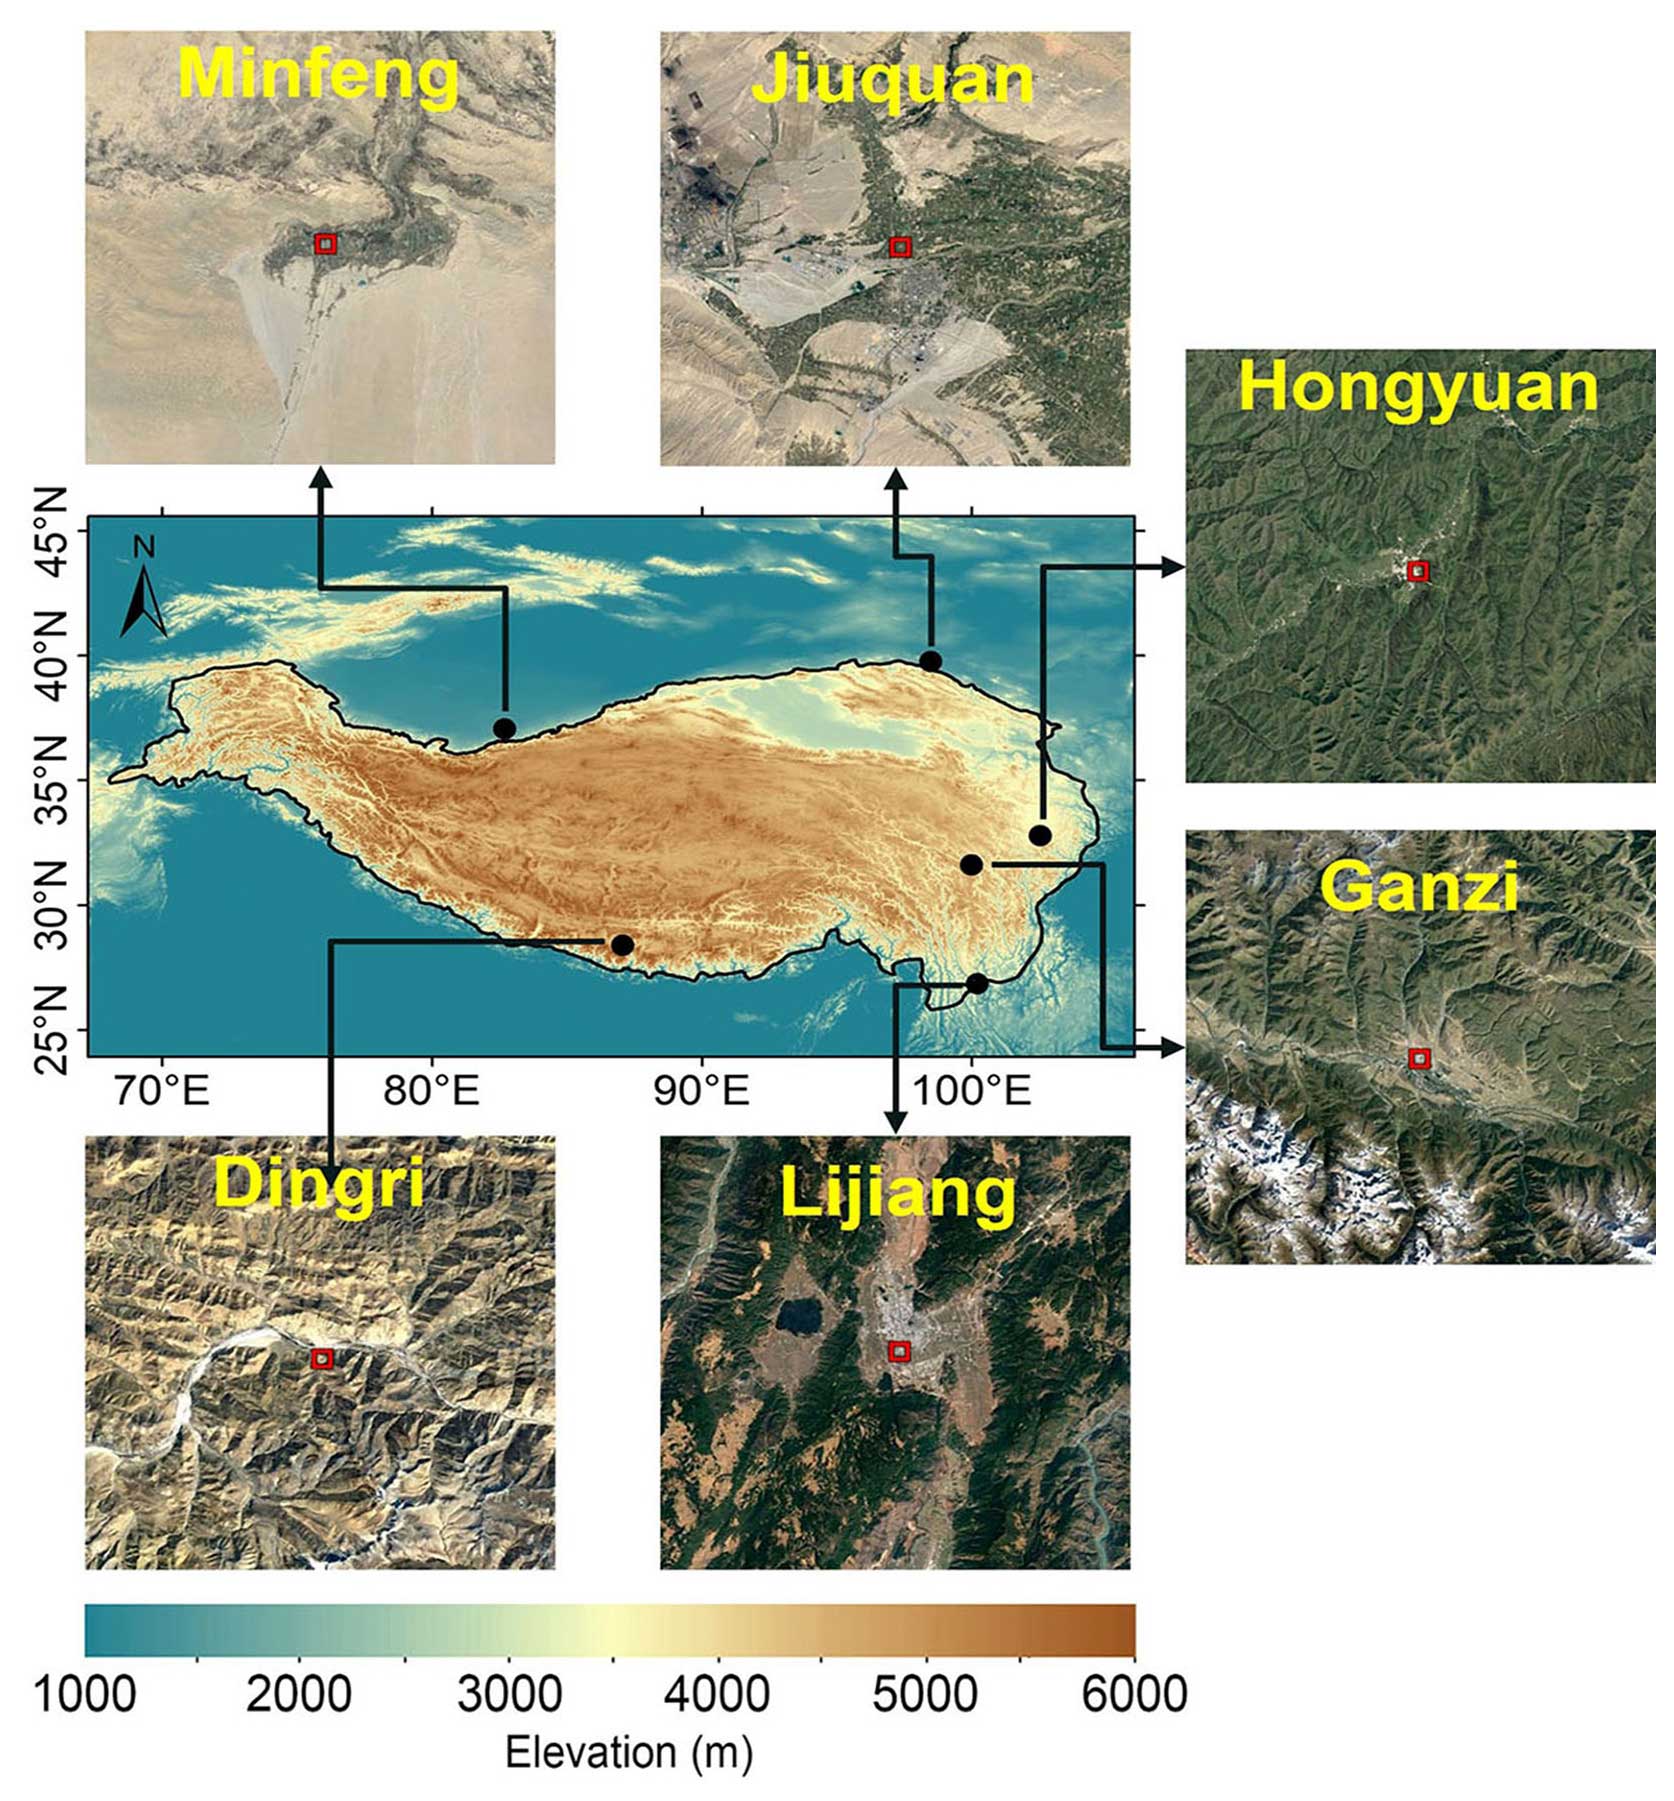
Figure 1The spatial distribution of the radar wind profiler (RWP) network, which is comprised of six stations (in filled black circles) on the Tibetan Plateau (TP). The inset map surrounding the main frame denotes the RGB satellite image from ©Google Earth that is centered at each RWP station.
RWPs have the capability to obtain high-temporal-resolution atmospheric turbulence and wind profiles over the TP compared to the radiosonde and reanalysis, which makes it possible to analyze the fine PBL structures. The low-detection and medium-detection modes of RWPs can acquire the wind field and turbulence information below 5.0 km above ground level () (McCaffrey et al., 2017; Ruan et al., 2014). RWPs provide the radial observations (marked as the RAD subset), including profiles of the radial velocity, Doppler spectral width, and signal-to-noise ratio (SNR). Also provided by RWPs are real-time sampling data (marked as the ROBS subset), including the profiles of horizontal wind (direction and speed), vertical velocity, and refractive index structure constant (Liu et al., 2020). There exist large uncertainties in the profiling measurements from RWPs; thus the quality control for both RAD and ROBS subsets is indispensable before retrieving related dynamic variables over the TP (Liu et al., 2020; S. Q. Wang et al., 2023). For instance, the profiling measurements highly deviate from the truth below 0.5 and above 5.0 , which is attributed to the near-surface clutter and significant beam attenuation, respectively (Guo et al., 2023). Thus, here only the RWP measurements at heights from 0.5 to 5.0 km are utilized for analysis.
2.2 Miscellaneous meteorological data
In this study, hourly ground-based meteorological variables, including 2 m air temperature (Ta), ground surface temperature (Ts), pressure, and cloud cover, are derived from the six automatic weather stations over the TP. Also, 1 min rainfall observations from rain gauges are used to minimize the potential influence of rainfall on the profiling measurements from the RWP network. All these meteorological datasets are subjected to strict data quality control by the National Meteorological Information Center (NMIC) of the CMA (S. Q. Wang et al., 2023). In addition, the hourly temperature data at pressure levels from the ERA5 data are used in this study (Hersbach et al., 2020).
2.3 Methods
2.3.1 Retrieval of the turbulence dissipation rate
As widely used ground-based equipment for detecting atmospheric wind profiles (Liu et al., 2020), RWPs have the advantage of estimating ε, since they can measure the Doppler velocity spectrum in the radar volume where the turbulence parcel motion accounts for the spectral width broadening (Jacoby-Koaly et al., 2002; White et al., 1999). In this study, the spectral width method is applied to retrieve ε from the RAD subset based on the underlying assumption that turbulence is isotropic, and the contributions to the spectral width from turbulent and non-turbulent process are independent of each other (Solanki et al., 2022; White et al., 1999).
The major steps for ε retrieval can be summarized as follows: (1) the spectral width variance consisting of the turbulence and non-turbulence variance is obtained from the spectral width measurements. (2) The non-turbulent broadening variances are decomposed into beam-broadening variance due to the finite width of the beam, shear-broadening variance generated by the presence of a wind gradient, and broadening variance arising from data processing and other factors (Nastrom, 1997). (3) The turbulent broadening variance () is extracted from the spectral width variance by excluding the abovementioned non-turbulent broadening variances. (4) ε is estimated from (White et al., 1999). For more details about the spectral width method, refer to Jacoby-Koaly et al. (2002), McCaffrey et al. (2017), Nastrom (1997), and Solanki et al. (2021).
One caveat of the abovementioned methods used to estimate ε lies in its sensitivity to the uncertainty in measuring horizontal wind speed and the occurrence of negative values of , resulting in negative ε (i.e., an invalid retrieval that should be discarded), which has previously been documented (e.g., Chen et al., 2022; McCaffrey et al., 2017). It is noteworthy that ε estimates derived from the RWP network lack validation against in situ ε measurements from sonic anemometers in aircraft or towers. This is another factor causing uncertainties that needs to be addressed in the future.
2.3.2 Estimation of planetary boundary layer height
The PBL height (hereafter referred to as zi) is an important parameter for characterizing the fine vertical structure of the PBL, which has important implications for the air mass exchange between the Earth's surface and the atmosphere aloft and thus affects cloud development and air pollutant dispersion (Dai et al., 2014; Dodson and Griswold, 2021; Guo et al., 2021b; Z. Q. Li et al., 2017; Wang et al., 2022).
Here daytime zi at each RWP station is retrieved from the original SNR profiles from the RAD subset based on the improved threshold method (ITM), which was originally proposed by Liu et al. (2019). The steps are briefly outlined as follows. First of all, the original SNR profiles are normalized, leading to the profile of normalized SNR (NSNR), which is expected to avoid instrumental inconsistencies. Secondly, the NSNR threshold is set to 0.75 based on the zi estimated by the radiosonde measurements at the same station. Thirdly, the profile of NSNR is scanned downward from the top to the ground surface. Finally, zi is determined as the height where the NSNR profile is greater than 0.75 for the first time. For more details about the ITM, refer to Liu et al. (2019).
It is not optimal to retrieve zi directly from the RWP measurements during the nighttime, when the turbulence is weaker and SNR is stronger, leading to an overestimation of zi (Duncan et al., 2022). The accuracy of the SNR data from RWPs directly affects the accuracy of zi. The zi estimation for the ITM is particularly applicable in the daytime PBL (Bianco et al., 2008; Collaud Coen et al., 2014). The presence of clouds is proved to bring about uncertainty in zi retrievals from the ITM due to the challenge in identifying the peak from the NSNR profile (Angel and Manoj, 2024). Notably, a convective cloud is accompanied by strong turbulence, which results in its boundary being misjudged as zi.
2.3.3 Vertical wind shear
The ROBS subset is used to calculate VWS, which is an important parameter that indicates the dynamical effect on the development of the PBL (Zhang et al., 2020). VWS is given as follows:
where u and v denote the zonal and meridional wind component, respectively, and z denotes the sample height in meters above ground level.
2.3.4 Classification of cloudy- and clear-sky conditions
Using RWPs combined with the ground-based cloud cover observations at each station, the effect of clouds on daytime variations in PBL turbulence and zi over the TP is investigated. Firstly, the 1 min precipitation and 6 min RWP data are time-matched to remove the profile data 30 min before and after the precipitation and obtain non-precipitation data (Wu et al., 2024). Then, all-sky conditions are defined as non-precipitation hours. Finally, the clear-sky (cloudy-sky) conditions are identified as hours with the cloud fraction is less (greater) than 30 % (80 %) (Guo et al., 2016; Solanki et al., 2021).
2.3.5 Calculation of the gradient Richardson number
The evolution of turbulence in the PBL has previously been recognized to be closely associated with atmospheric stability (Chechin et al., 2023; Chen et al., 2013; Lai et al., 2021; Muhsin et al., 2016). Therefore, we take the gradient Richardson number (Ri) as a variable to characterize atmospheric stability and the formation of turbulence over the TP. Following Stull (1988), Ri is formulated as follows:
where θv is the virtual potential temperature from ERA5; u and v are the hourly zonal and meridional wind components derived from RWPs, respectively; g is the gravitational acceleration; and z represents the sample height in meters above ground level.
3.1 Spatio-temporal distributions of the daytime PBL turbulence dissipation rate
Both the PBL turbulence dissipation rate and zi have significant diurnal variations over mountain and urban areas (Adler and Kalthoff, 2014; Liu et al., 2019; Solanki et al., 2021; Yang et al., 2023). Since the longitude of the six stations over the TP ranges from 82.7 to 102.6° E, it is necessary to use the LST to accurately capture the daytime variations in the PBL and make a comparison between different stations.
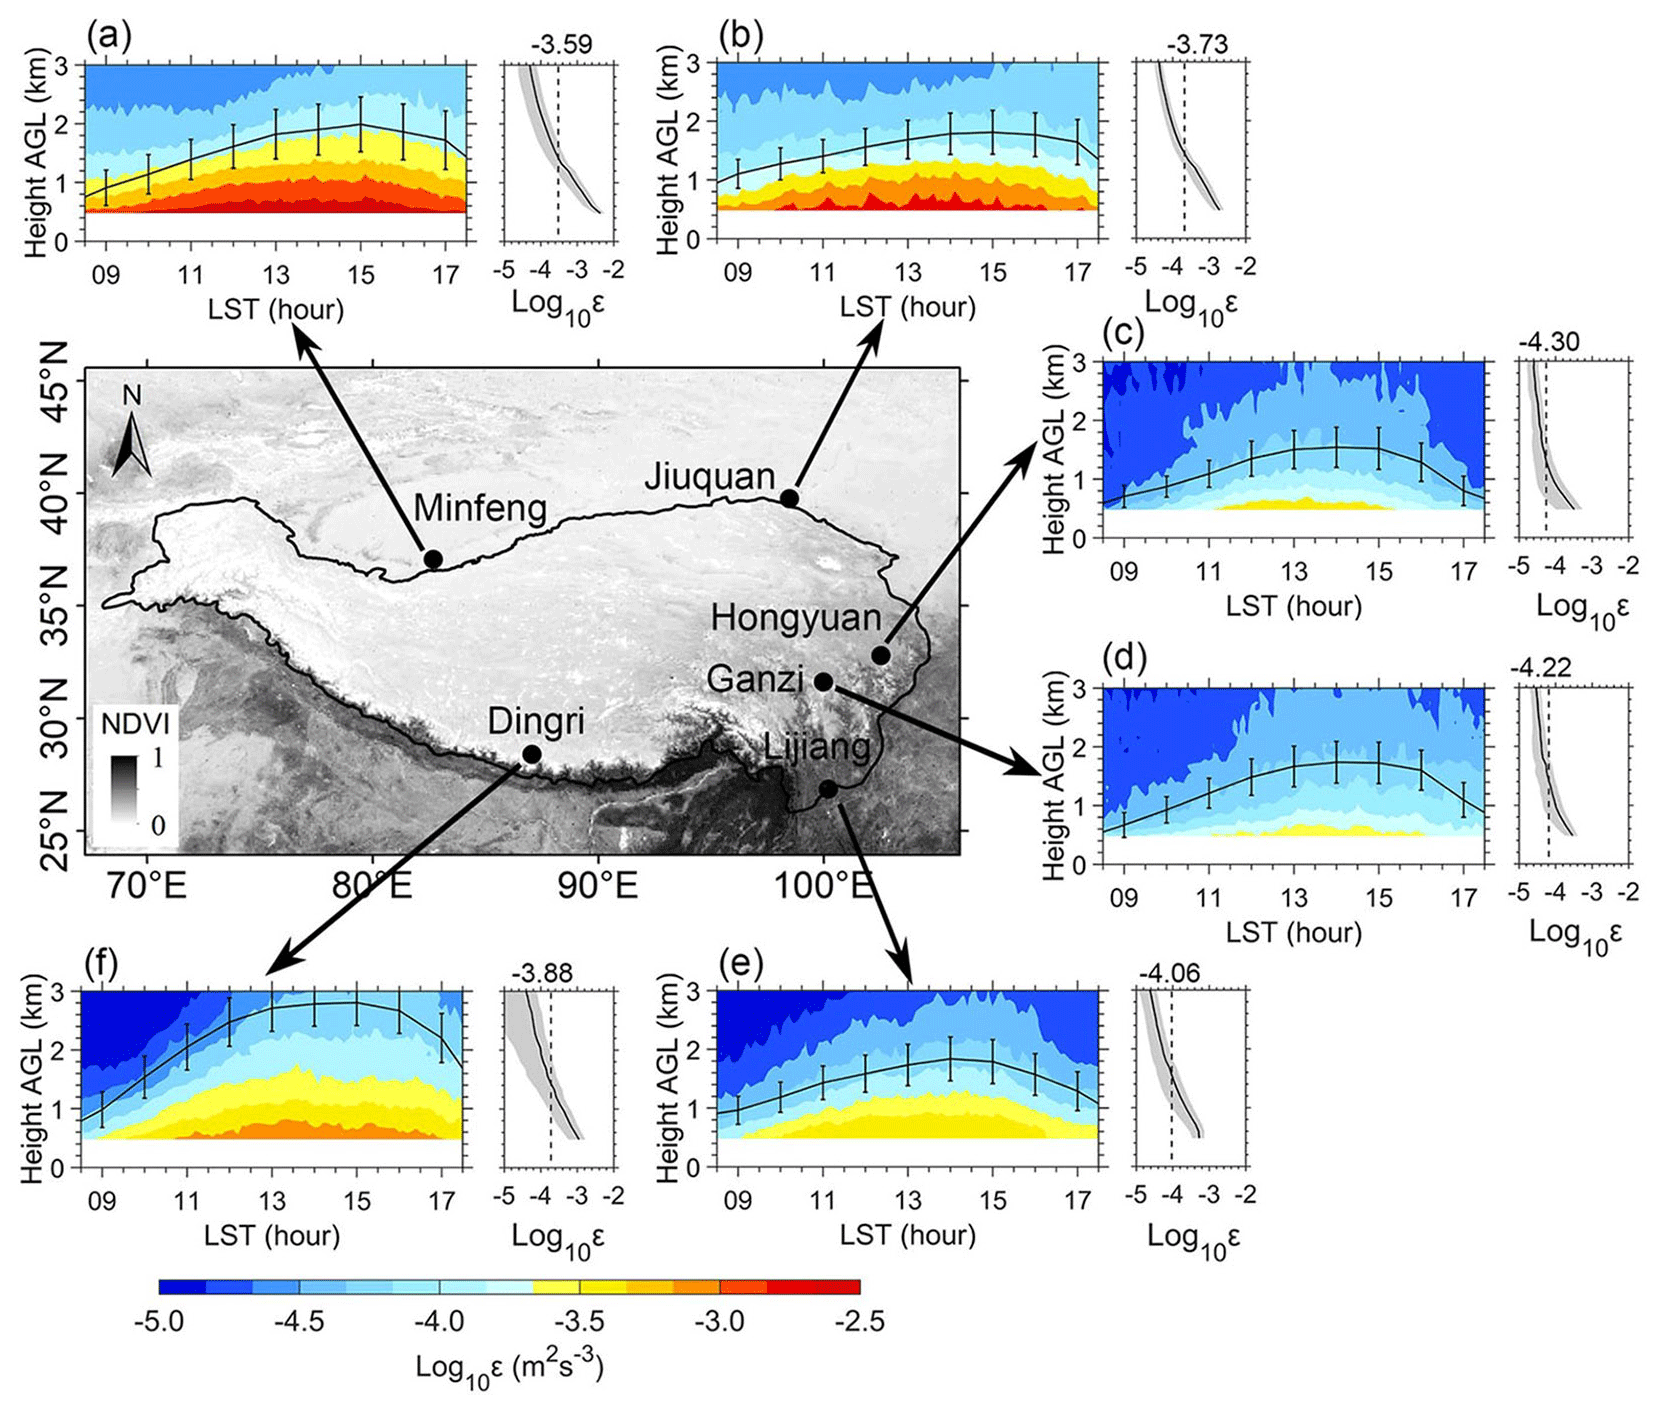
Figure 2Spatial distribution of the diurnal evolution of the vertical profile of the logarithmic turbulence dissipation rate (εLog10 in color shading; unit: m2 s−3) at 120 m vertical resolution and 6 min intervals and hourly mean planetary boundary layer height (zi, black line; unit: km) during the daytime under all-sky conditions from 09:00 to 17:00 LST for the period September 2022 to October 2023 as retrieved from the profiling measurements at six RWP stations over the TP. The vertical bars indicate the 0.5 standard deviations for zi. Also shown in the right-hand-side panels next to each colored panel is the temporally averaged vertical profile of ε (black line) and its corresponding 1 standard deviation (gray shading).
Figure 2 presents a comprehensive overview of the ε profile at 6 min intervals and hourly averaged zi in the lower troposphere at heights from 0.5 to 3.0 km for six RWP stations over the TP during the period from 1 September 2022 to 31 October 2023. As shown in the panels to the right of the colored panels in Fig. 2, ε generally decreases with increased height at all six RWP stations. The magnitude of ε and its vertical structures during the daytime at Minfeng and Jiuquan stations over the northern TP and at Dingri station over the southern TP stand in stark contrast to those at RWP stations (i.e., Lijiang, Ganzi, and Hongyuan) in the eastern TP. It is apparent that ε exhibits a large spatial discrepancy. In terms of the latitudinal variation, the 1-year-averaged ε at the RWP stations in the eastern part of TP is smaller than in the western part of TP. In terms of the meridional variation, ε values at the two RWP stations in the northern TP have a significantly larger magnitude than at the other four stations. In particular, the maximum mean value of daytime ε is found at Minfeng and Jiuquan in the northern TP, reaching values of up to 10−3.59 and 10−3.73 m2 s−3, respectively. By comparison, the lowest value of ε is found in the eastern TP, with mean values of 10−4.06, 10−4.30, and 10−4.22 m2 s−3 at Lijiang, Hongyuan, and Ganzi, respectively. Meanwhile, the mean magnitude of ε at Dingri in the southern TP, which is 10−3.88 m2 s−3, lies between the magnitude of ε in the northern and eastern TP.
Overall, the spatial distribution of zi at all six RWP stations is clearly dependent on the geographical location (Fig. 2) and resembles that of the ε. The geographic pattern of zi from RWPs agrees well with those patterns from radiosonde measurements (Che and Zhao, 2021) and reanalysis (Slättberg et al., 2022). Of the six RWP stations, Dingri is located in the northern foothills of the Himalayas with an altitude of over 4300 m, where the bare-land type results in a large surface sensible heat flux. This, together with the lowest atmospheric density, leads to the highest daytime mean value of zi up to 2.10 km (Wang et al., 2015). The land surfaces at the Minfeng and Jiuquan stations in the northern TP are dominated by barren and relatively homogenous terrain, in sharp contrast to the highly vegetated terrain at the Ganzi and Hongyuan stations in the eastern TP (Fig. 1). The sparse vegetation in the northern TP generally comes with large Bowen ratios during the daytime, which tends to produce larger sensible heat flux compared to that in the eastern TP. The increased turbulence intensity in the PBL is generally associated with larger sensible heat flux, which has been reported by previous studies (Wang et al., 2016; Zhang et al., 2022). Therefore, the spatial and temporal variations in daytime ε over the TP are affected by the underlying surface type and air density.
Regarding the daytime pattern of turbulence (all six panels with color shading in Fig. 2), the turbulence over the TP shows a pronounced signature of single-peak variability. During the period 09:00–11:00 LST, the magnitude of ε at all six RWP stations is relatively weak. From 11:00 LST onward, with the increase in downward solar shortwave radiation, surface sensible heat flux gradually rises, which leads to the acceleration of turbulence mixing processes. Then, ε reaches peak in the early afternoon (13:00–15:00 LST). Afterwards, during the later afternoon (15:00–17:00 LST), ε diminishes gradually. Likewise, zi almost follows the same daytime variation pattern as that of ε.
On the seasonal scale, the turbulence at the six RWP stations is characterized by significant variability, which is shown in Fig. S1 in the Supplement. To be more specific, ε reaches a maximum in summer with the highest zi, while it reaches a minimum in winter at Minfeng and Jiuquan. At the remaining four stations, the strongest ε is found in spring as opposed to the weakest ε in autumn.
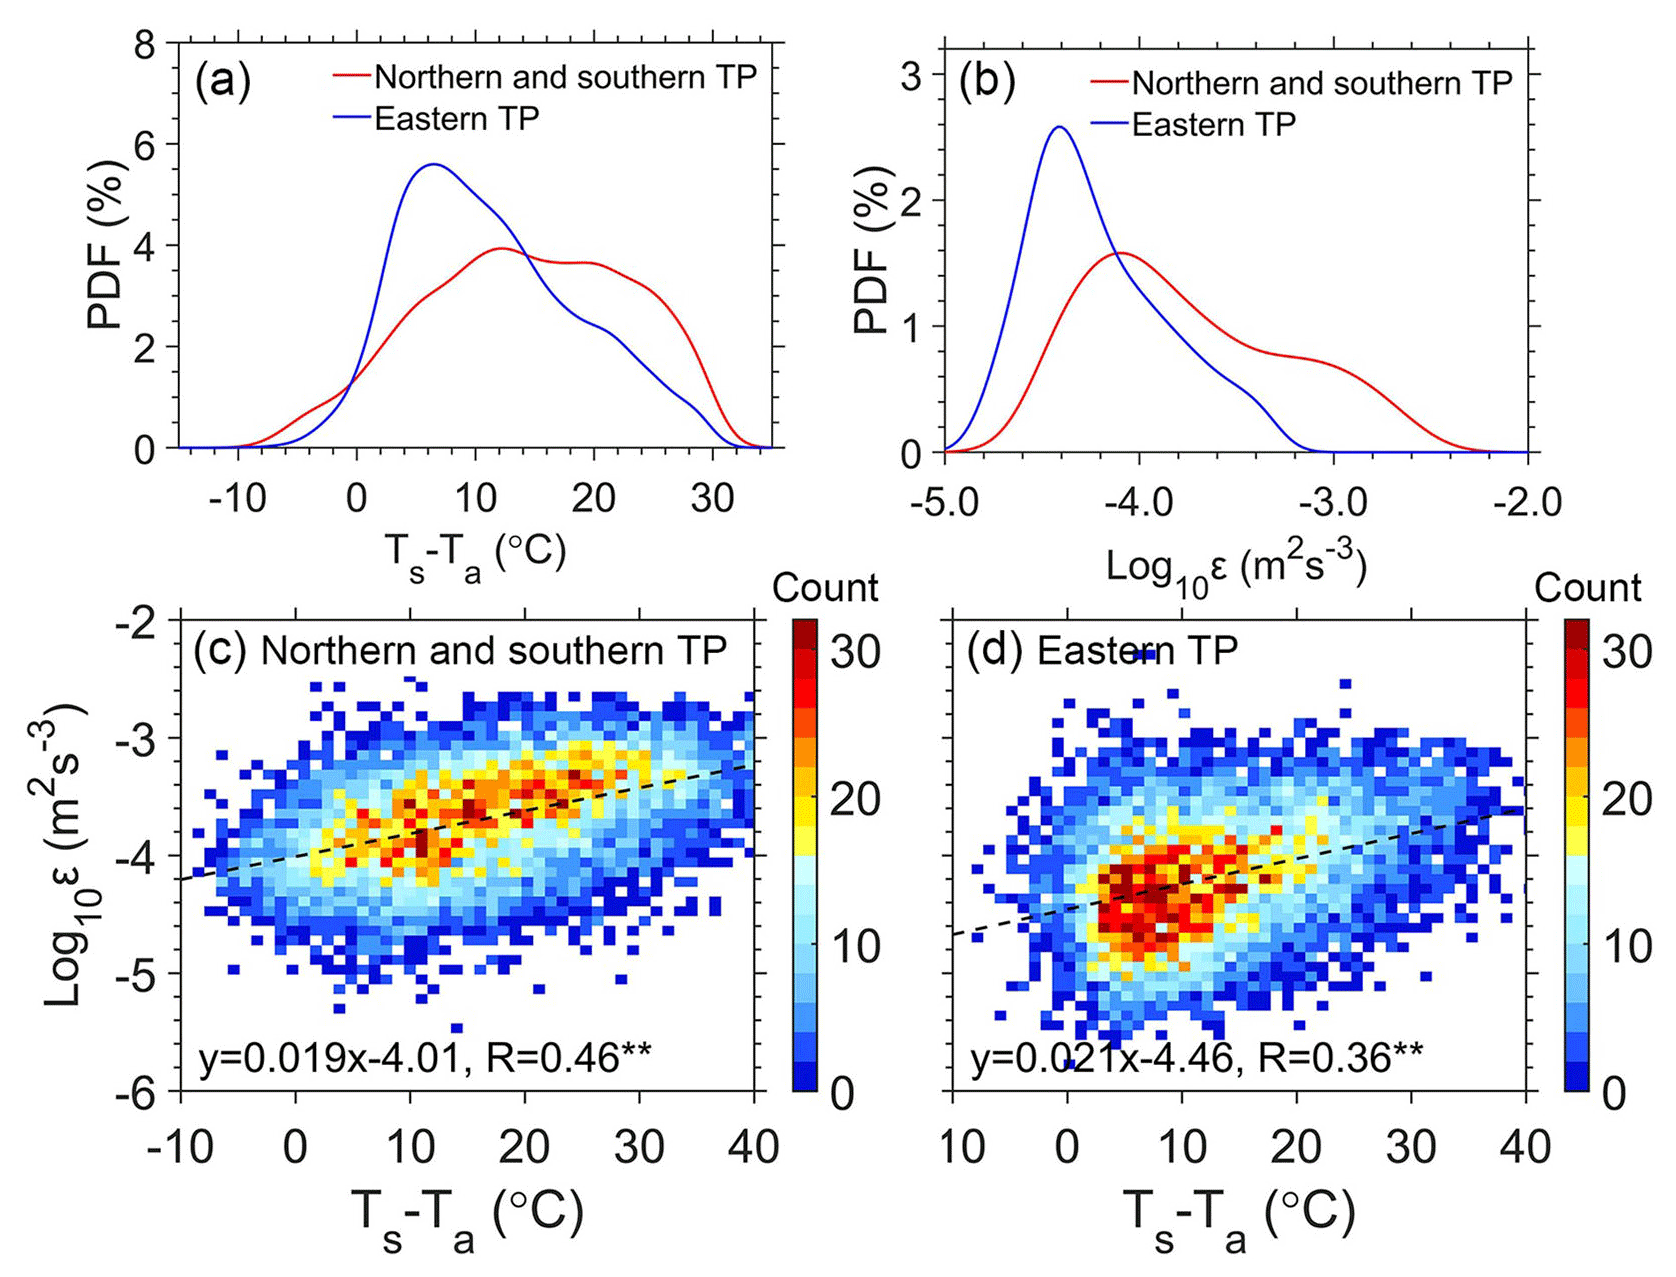
Figure 3(a) The probability density function (PDF) of the surface–air temperature difference (Ts−Ta) for the northern and southern TP (red line) and eastern TP (blue line); (b) the same as (a) but for the PDF of εLog10 estimated from the measurements of radar wind profilers (RWPs) at heights ranging from 0.5 to 3.0 km; (c) scatterplot of εLog10 as a function of Ts−Ta in the northern and southern TP; (d) the same as (c) but for the eastern TP during the daytime under all-sky conditions from 09:00 to 17:00 LST (local standard time) for the period September 2022 to October 2023. The superscript for R indicates that the regression slope is statistically significant at the p<0.01 level.
The abovementioned findings imply that the turbulence intensity at the RWP stations over the northern and western TP is about 1 order of magnitude greater than that in the eastern TP. To further investigate the possible reasons for this significant difference in ε, the relationships between Ts−Ta and ε for different regions are presented in Fig. 3. The mean value of Ts−Ta in the northern and southern TP is 14.29 °C, which is greater than that of the eastern TP with a value of 11.26 °C (Fig. 3a). The mean daytime ε for the two regions reaches up to 10−3.74 and 10−4.20 m2 s−3, respectively (Fig. 3b). Additionally, ε is significantly and positively correlated with Ts−Ta (R > 0.35; p < 0.005), which illustrates that the thermal forcing makes an important contribution to turbulence development in the TP (Fig. 3c and d). As shown in Fig. S2, there is a positive correlation between Ts−Ta and ε, indicating that the thermal effect of Ts−Ta can promote the development of turbulence at heights from 0.5 to 3.0 km under all-sky conditions. However, the relationship varies significantly between each RWP station. The slope values of the regression coefficients for the other five RWP stations, except for Hongyuan, are all greater than 0.015. The maximum slope values are observed at Lijiang (0.029) and Dingri (0.027) in the southern TP, as compared with the minimum slope of 0.007 at Hongyuan. This suggests that near-surface thermal properties have nothing to do with ε at Hongyuan in the eastern TP.
The potential impact of VWS on ε is also examined, which is shown Fig. S3. Overall, VWS is found to positively correlate with ε at heights from 0.5 to 3.0 km under all-sky conditions, differing by RWP station. The maximum slope values are observed at Lijiang (79.34) and Hongyuan (68.56), as compared with the minimum slope of 1.15 at Minfeng. Therefore, it can be inferred that the atmospheric dynamic effect induced by VWS dominates the variability in ε at regions with the same underlying terrain and land cover as Hongyuan.
3.2 Characteristics of the daytime PBL turbulence dissipation rate under clear- and cloudy-sky conditions
The influence of clouds on the PBL properties has been discussed and analyzed in previous studies (e.g., Guo et al., 2016; Huang et al., 2023; Ma et al., 2023; Schumann and Moeng, 1991; Yu et al., 2004). To reveal the potential impact of clouds on the PBL ε over the TP, the comparison analyses between clear- and cloudy-sky conditions are presented in this section. Figure 4 shows the daytime cycle of mean ε profile and zi averaged over the six RWP stations under all-,clear-, and cloudy-sky conditions. Overall, the profiles of both ε and zi under all-sky conditions over the TP present distinct single-peak variations, and their peaks approximately occur at 14:00 LST (Fig. 4a). The daytime-averaged ε below 3.0 is 10−3.95 m2 s−3, and the mean zi is 1.47 km. There is a significant positive correlation between ε and zi during the daytime (R = 0.63; p < 0.01).
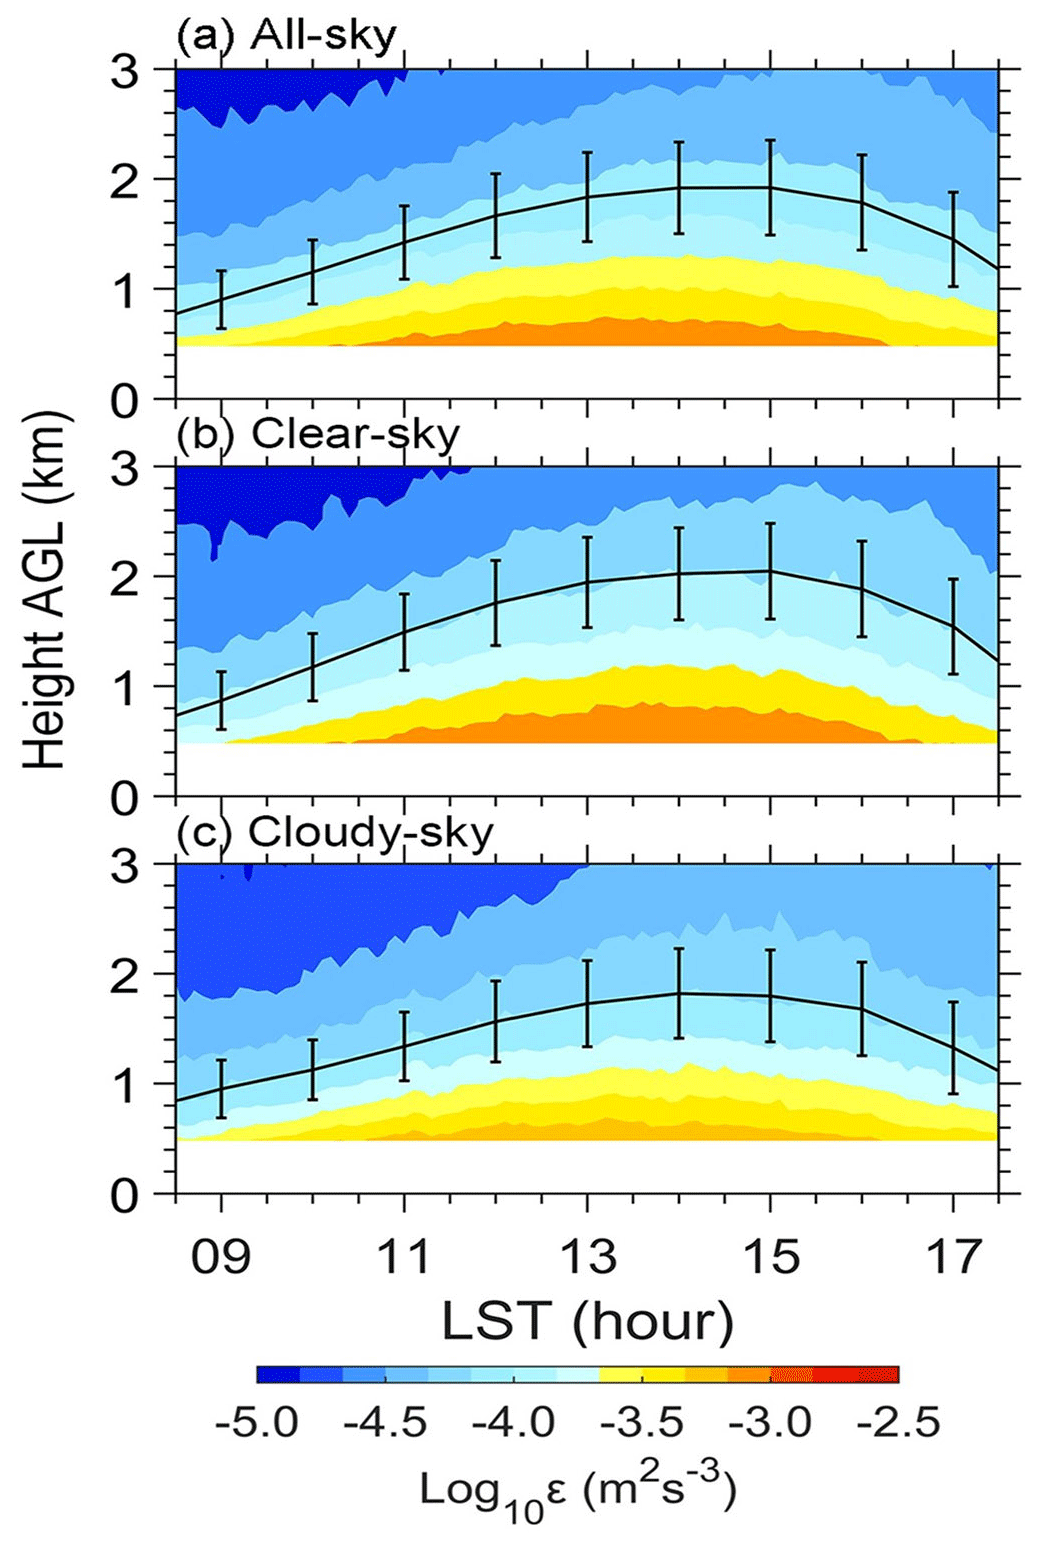
Figure 4Diurnal evolution of the vertical profile of εLog10 (color shading; unit: m2 s−3) and zi (solid line; unit: km) averaged over the six RWP stations over the TP during daytime from 09:00 to 17:00 LST for the period September 2022 to October 2023 for (a) all-sky conditions, (b) clear-sky conditions, and (c) cloudy-sky conditions. The vertical bars indicate the 0.5 standard deviations.
Under clear-sky conditions, the daytime mean ε is 10−3.88 m2 s−3 (Fig. 4b). During the period 13:00–15:00 LST, ε ranges from 10−3.43 to 10−2.82 m2 s−3 (10−4.17 to 10−3.40 m2 s−3) at heights from 0.5 km (1.0 km) to 1.0 km (2.0 km) in the lower (upper) PBL. Thus, the well-mixed turbulence maintains the development of the PBL in the early afternoon. By comparison, under cloudy-sky condition (Fig. 4c), the daytime mean value of zi can reach up to 1.4 km, which is 0.12 km lower than that of clear-sky conditions. This means that clouds suppress the development of the PBL turbulence in the early afternoon, which has been observed by radiosonde observations described in Guo et al. (2016).
It is well known that there exists diurnal variation in the PBL. To better reveal the mechanism of how a myriad of geophysical parameters affect turbulence, the height-resolved ε retrievals are further normalized by the average PBL height. As noted above, the valid minimum altitude of the RWP data is 0.5 km at 120 m vertical resolution, and the maximum zi is approximately 2.0 km (Figs. 2 and 4); z is normalized by zi to provide a nondimensional vertical coordinate for ε. It follows that is great than 0.25, and the range of is set from 0.3 to 2.0 for the following analyses.
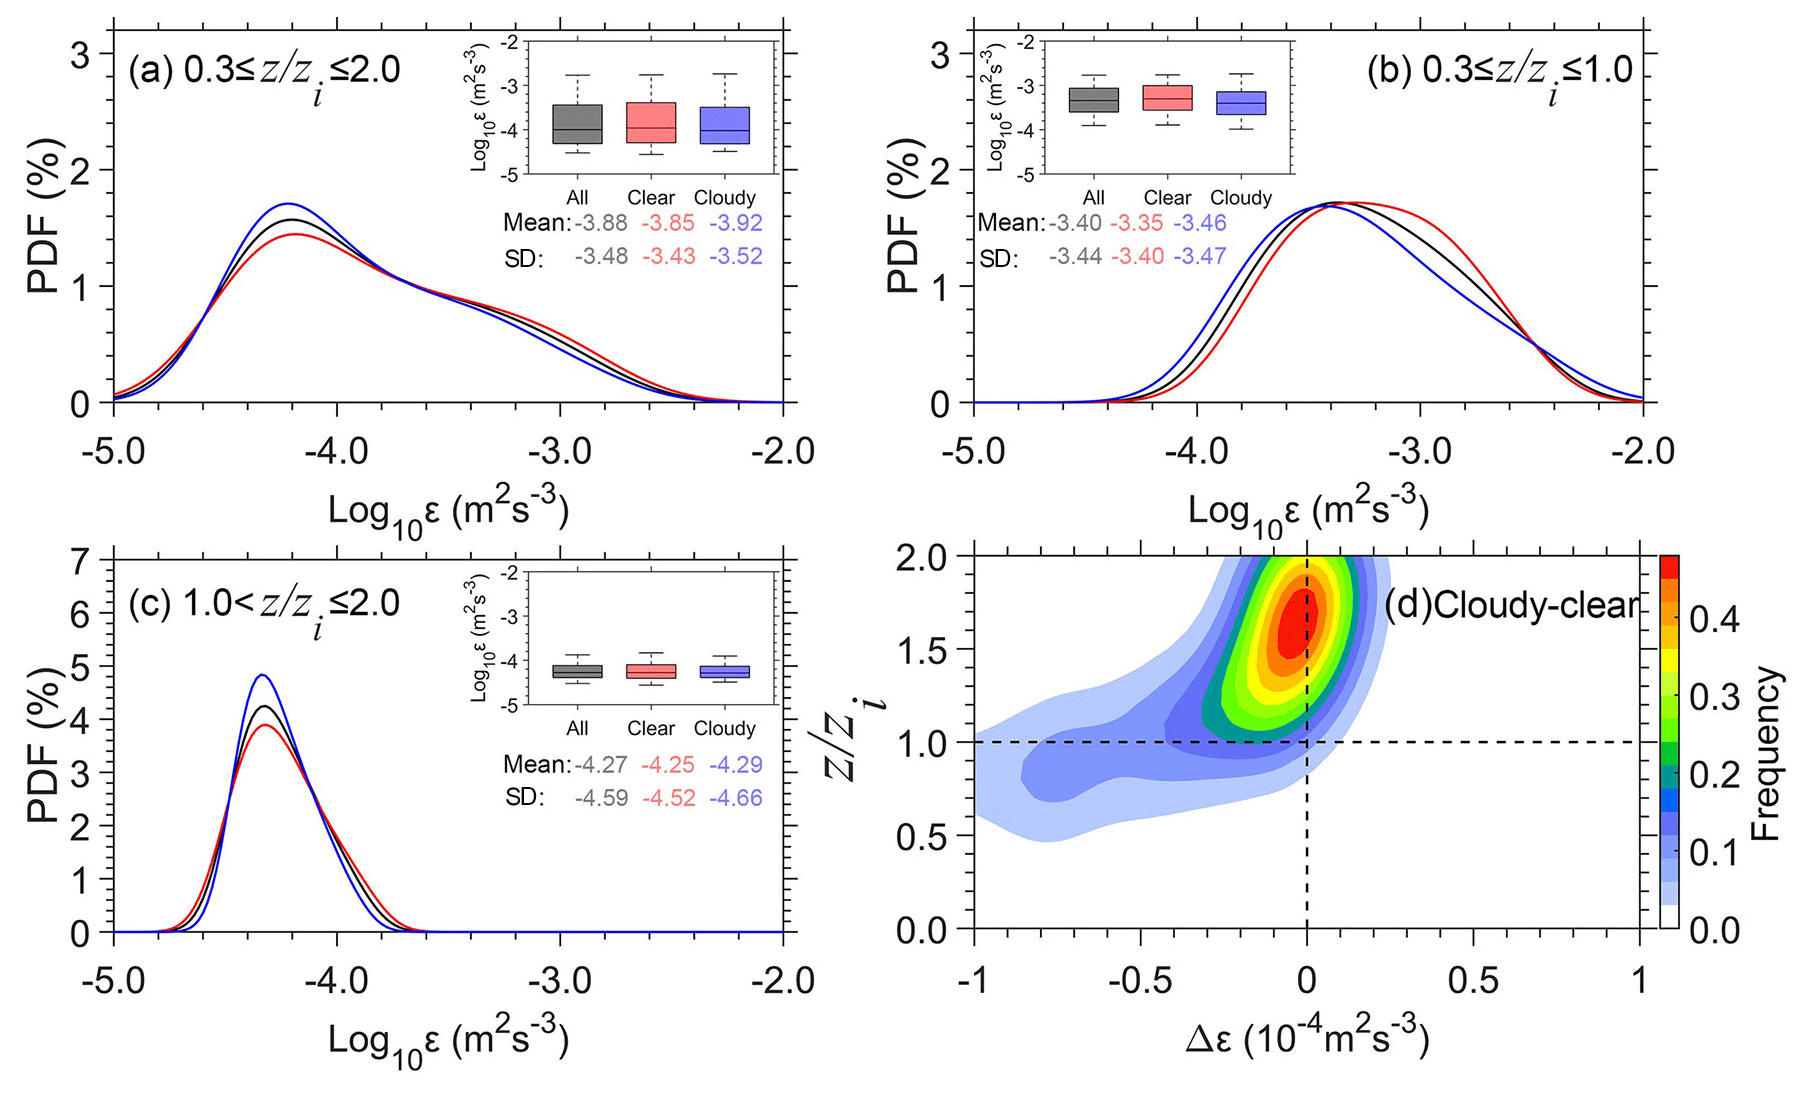
Figure 5PDF of daytime εLog10 (a) in the whole lower troposphere (0.3 ≤ ≤ 2.0), (b) in the PBL (0.3 ≤ ≤ 1.0), and (c) above the PBL (1.0 < ≤ 2.0) over the TP under all-sky (black), clear-sky (red), and cloudy-sky (blue) conditions. (d) Normalized contoured frequency by altitude diagram (NCFAD) for the difference in ε between cloudy-sky and clear-sky conditions (Δε) over the TP. Note that zi denotes the depth of the PBL and the height (z) and turbulence dissipation rate (ε) are normalized by zi in order to give a nondimensional vertical coordinate in the form of .
The probability density function (PDF) of ε in the PBL (0.3 ≤ ≤ 1.0) and above the PBL (1.0 < ≤ 2.0) under all-,clear-, and cloudy-sky conditions is given in Fig. 5. Overall, the mean ε is 10−3.82, 10−3.79, and 10−3.85 m2 s−3 at the height range of 0.3 ≤ ≤ 2.0 under all-,clear-, and cloudy-sky conditions, respectively (Fig. 5a). Within the PBL (Fig. 5b), the mean ε under clear-sky conditions (10−3.27 m2 s−3) is greater than that under cloudy-sky conditions (10−3.36 m2 s−3), and the standard deviation of ε under clear-sky conditions is slightly greater than that under cloudy-sky conditions. This illustrates that clouds can significantly inhibit the turbulence intensity in the PBL, with the value of Δε between clear- and cloudy-sky conditions being m2 s−3. However, above the PBL (Fig. 5c), ε presents normal distribution characteristics, and there is no significant difference between the mean ε values under clear- and cloudy-sky conditions.
To examine the overall impact of clouds on the vertical structure of turbulence within and above the PBL, Fig. 5d shows the normalized contoured frequency by altitude diagram (NCFAD) of the Δε for normalized () profiles of ε between cloudy-sky and clear-sky conditions. Within the PBL, Δε is negative and |Δε| generally decreases with increased , where Δε is −10−4.3 m2 s−3 at = 0.5 and m2 s−3 at = 1.0. This suggests that clouds may weaken turbulence within the PBL (Fig. 4b and c), especially in the lower PBL (z = 820 m; < 0.5). Figure S4 further shows the distinct spatial variability in the cloud effect on ε across the six RWP stations. Particularly, the turbulence is weakened by clouds within the PBL at Minfeng and Jiuquan in the northern TP, as opposed to the enhanced ε within the PBL at Ganzi and Lijiang. This suggests that the cloud impact on ε is much more complicated than expected. One of the reasons for this could concern the cloud life stage, which is not dealt with in this present study. On top of the life stage, the cloud impact on ε, in combination with Ts−Ta and VWS, exhibits a distinct altitude dependence, differing by RWP station (Fig. S5).
3.3 Potential factors influencing the daytime PBL turbulence dissipation rate
3.3.1 Surface–air temperature difference
The vertical structures of PBL ε and zi over the TP show obvious spatial differences in the context of a complex subsurface. The diverse land cover types lead to differences in surface albedo and soil moisture, which in turn lead to distinctions in thermodynamic characteristics such as sensible heat flux (Ma et al., 2023). Buoyant production driven by solar heating from the surface is one of the dominant sources generating turbulence in the convective PBL. The surface sensible heat flux is an important thermodynamic factor that affects the buoyant convective processes (Stull, 1988). Meanwhile, previous studies (e.g., Wang et al., 2022; Yang et al., 2023) have suggested that Ts−Ta can serve as a good proxy for the sensible heat flux. There are no sensible heat flux measurements at the six RWP stations in this study, and thus we directly take Ts−Ta as a proxy thermodynamic variable to analyze its potential connection to variation in PBL turbulence.
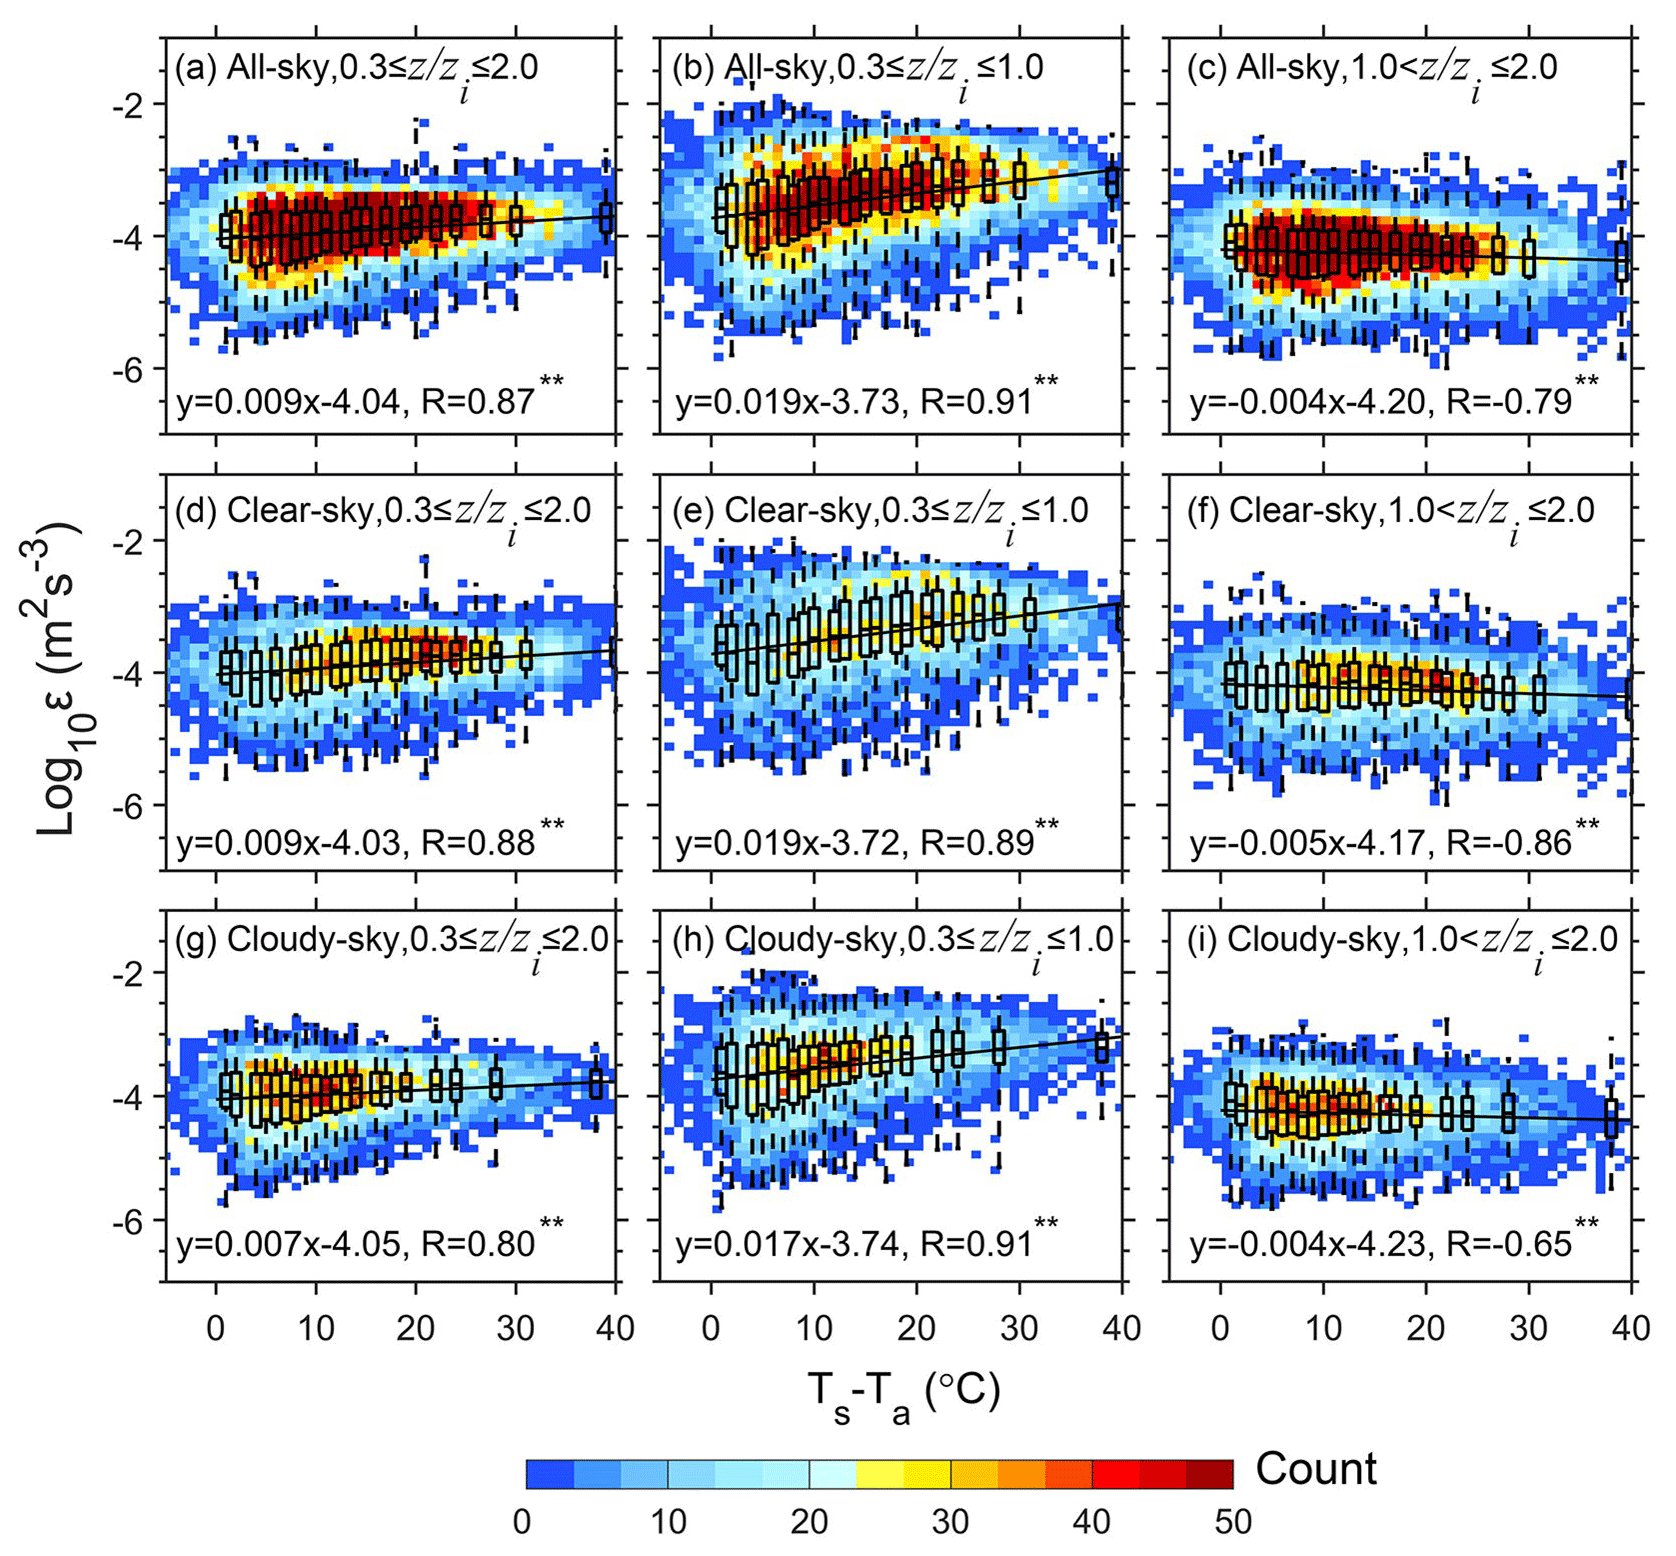
Figure 6Scatterplots (blue dots) of εLog10 estimated from the measurements of RWPs in the whole lower troposphere (0.3 ≤ ≤ 2.0; a, d, g), in the PBL (0.3 ≤ ≤ 1.0; b, e, h), and above the PBL (1.0 < ≤ 2.0; c, f, i) over the TP as a function of Ts−Ta under all-sky (a–c), clear-sky (d–f), and cloudy-sky conditions (g–i). Also overlaid are the corresponding box-and-whisker plots, regression linear equations, and correlation coefficients in each panel, where all Ts−Ta samples are divided into 20 bins, each of which has the same sample size. Note that the median is shown as a line, whereas the outer boundaries of the boxes represent the 25th and 75th percentiles, and the dashed lines represent the interquartile range (IQR). The superscripts for R indicate that the regression slopes are statistically significant (p<0.01).
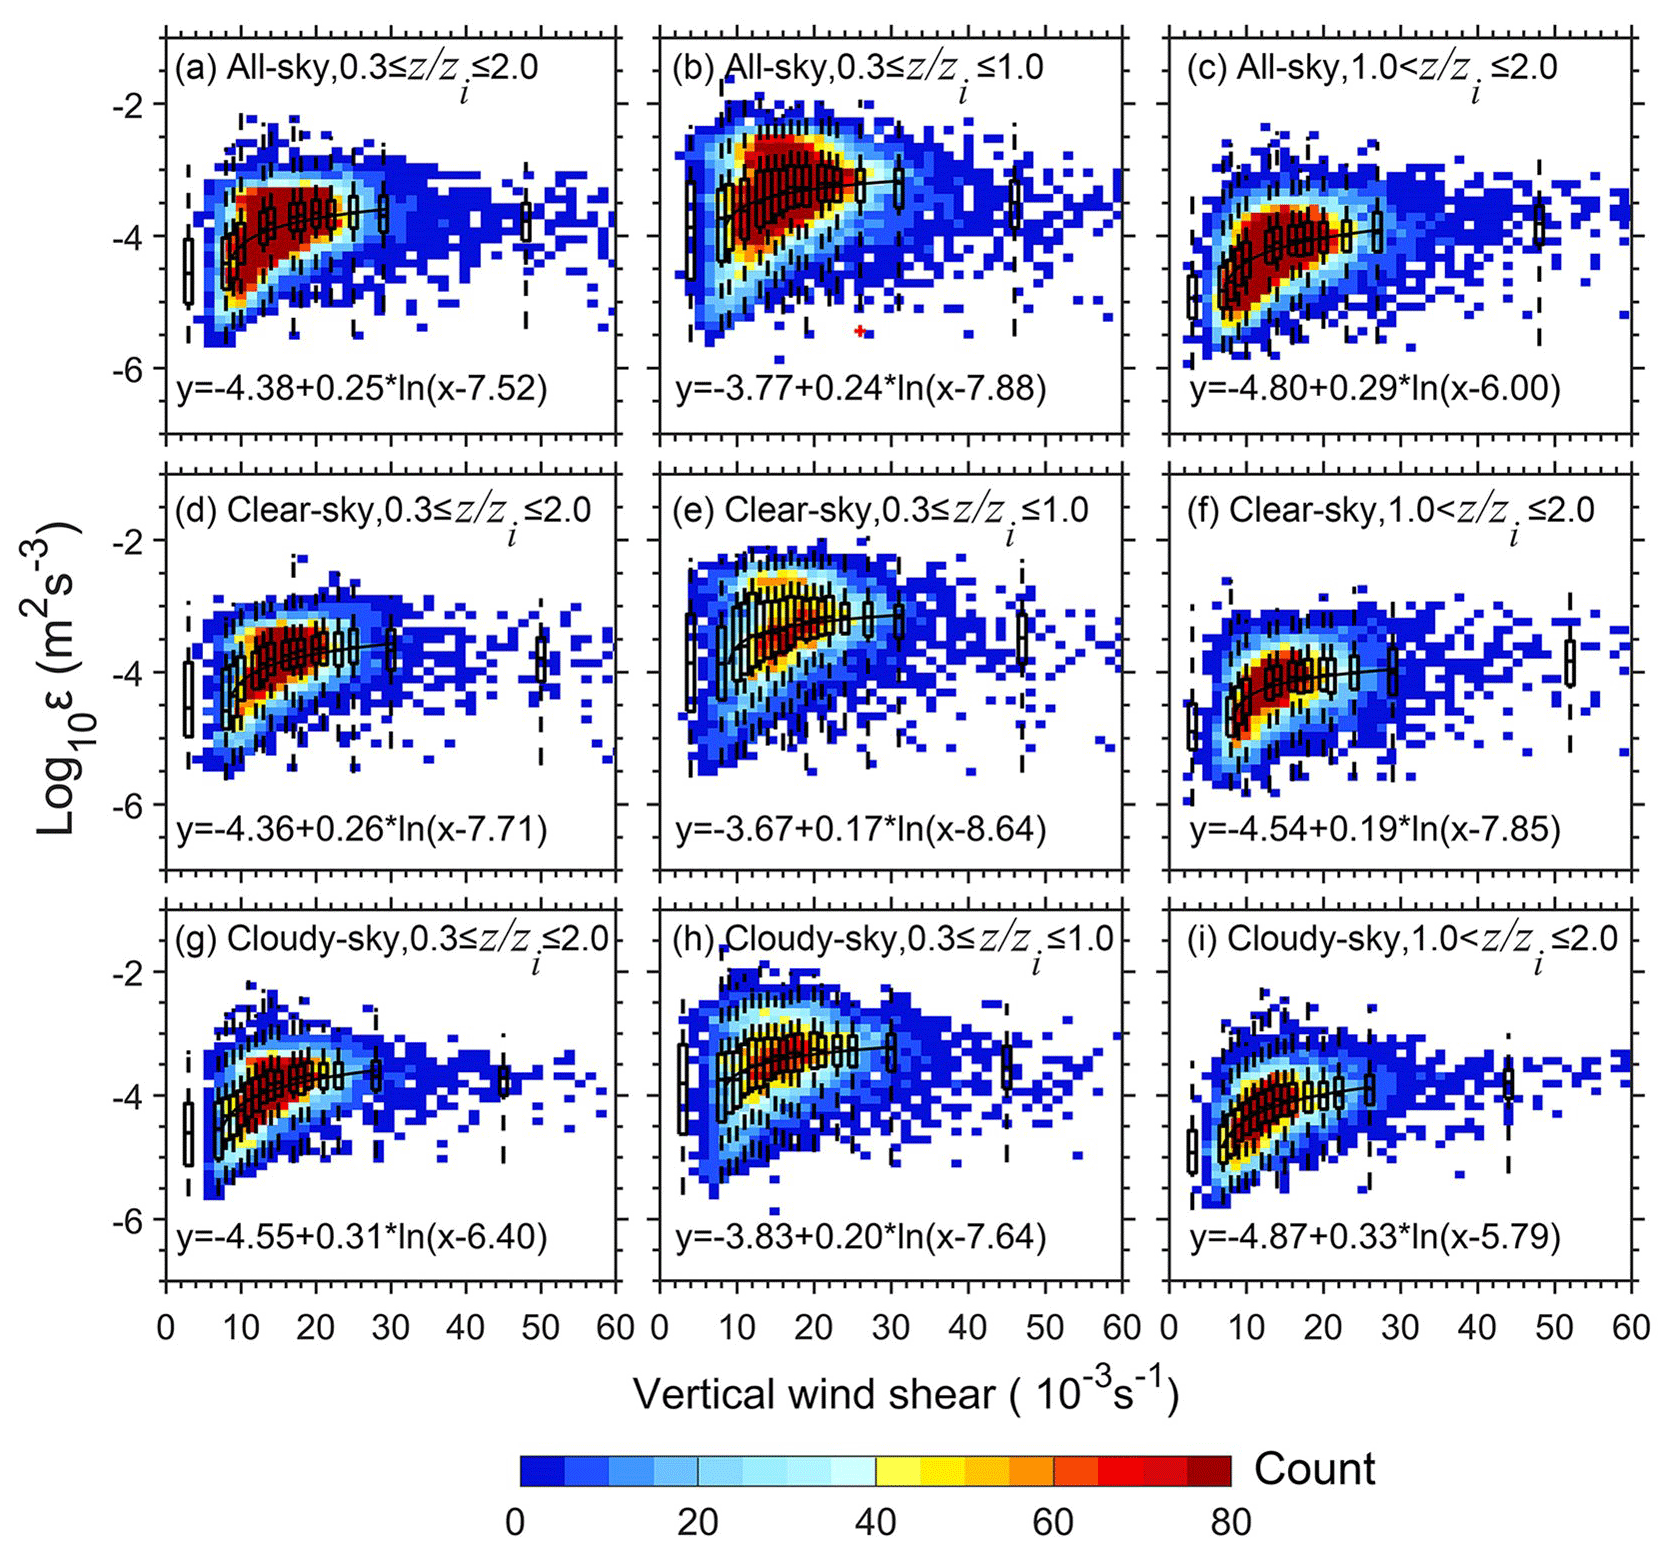
Figure 7Scatterplots of εLog10 estimated from the measurements of RWPs in the whole lower troposphere (0.3 ≤ ≤ 2.0; a, d, g), in the PBL (0.3 ≤ ≤ 1.0; b, e, h), and above the PBL (1.0 < ≤ 2.0; c, f, i) over the TP as a function of vertical wind shear (VWS) under all-sky (a–c), clear-sky (d–f), and cloudy-sky conditions (g–i). Also overlaid are the corresponding box-and-whisker plots and fitting equations in each panel, where all VWS samples are divided into 20 bins, each of which has the same sample size. Note that the median is shown as a line, whereas the outer boundaries of the boxes represent the 25th and 75th percentiles, and the dashed lines represent the interquartile range (IQR).
Table 2A summary of the correlation of εLog10 at different altitude ranges under all-,clear-, and cloudy-sky conditions with Ts−Ta and vertical wind shear (VWS) for all six RWP stations. The superscript ∗ for R indicates that the regression slope is statistically significant at p<0.01.
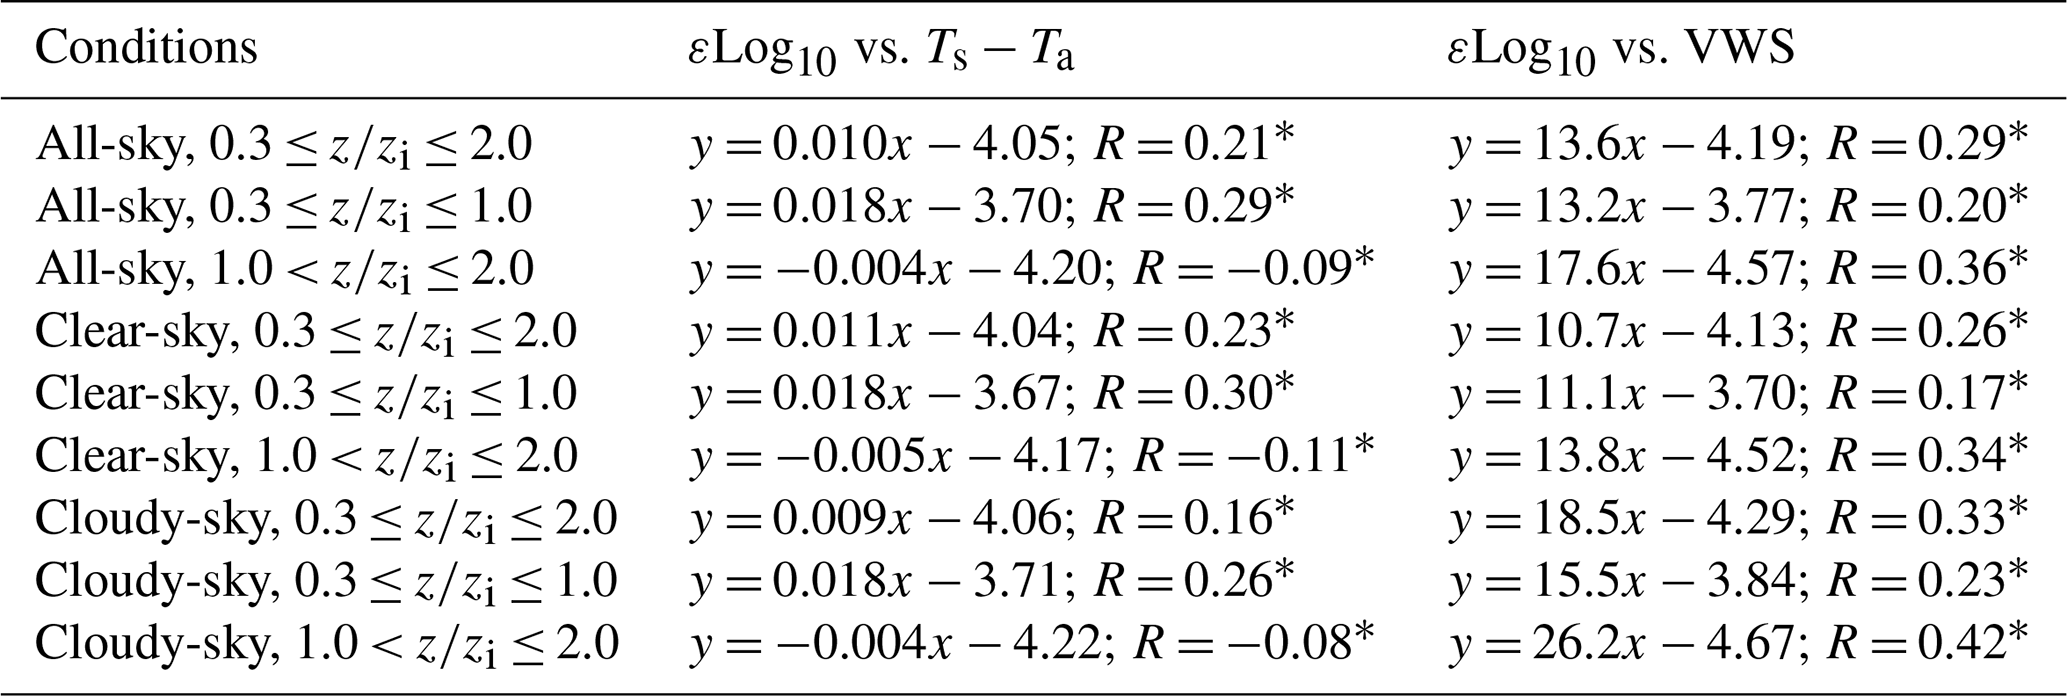
Figure 6 shows that the magnitude of ε varies as a function of Ts−Ta for all six stations, within (0.3 ≤ ≤ 1.0) and above (1.0 < ≤ 2.0) the PBL, under all-,clear-, and cloudy-sky conditions, respectively. Ts−Ta values are first classified into five bins, which are then statistically analyzed against the corresponding ε averaged for values between 0.3 and 2.0 to obtain regression equations incorporating slopes. Further, Table 2 shows details of the scatterplots between εLog10 (Fig. 6) and Ts−Ta (and VWS, Fig. 7) at different altitude ranges under all-,clear-, and cloudy-sky conditions. εLog10 is found to be linearly correlated with Ts−Ta (and VWS) (p < 0.05). The surface sensible heat flux generally increases with increased Ts−Ta; thus the increased Ts−Ta intensifies the turbulence in the PBL (0.3 ≤ ≤ 1.0), which is shown in Fig. 6b, e, and h. Within the PBL, ε is also positively correlated with Ts−Ta, whose slope values are larger than those at 0.3 ≤ ≤ 2.0. As Ts−Ta rises, the larger surface sensible heat flux would lead to enhanced buoyancy process and turbulent motion within the PBL. On the other hand, ε above the PBL is negatively correlated with Ts−Ta (Fig. 6c, f, and i). This suggests that Ts−Ta dramatically affects the development of turbulence within the PBL, whereas it has little effect on the turbulence above the PBL.
Within the PBL, the magnitude of the slope (slope = 0.019) under clear-sky conditions is larger than that under cloudy conditions (slope = 0.015) as shown in Fig. 6e and h. This implies that Ts−Ta rather than cloud cover is the governing parameter affecting the PBL turbulence, particularly under the clear-sky conditions. Given that turbulence in the mixed PBL over the TP is usually driven by convection (Xu et al., 2023), as Ts−Ta decreases when clouds are present, less heat is transferred from the surface to the atmosphere, reducing the buoyancy flux and leading to weaker turbulence in the PBL, especially for the lower PBL (0.3 ≤ ≤ 0.5), as shown in Fig. 4b and c. Consequently, the clouds tend to suppress the development of the PBL (Fig. 5a) and reduce zi.
3.3.2 Vertical wind shear
Besides Ts−Ta, VWS is another crucial dynamic parameter that is related to the mechanical turbulence within the PBL. Similarly to Fig. 6, Fig. 7 presents the relationship between ε and VWS (both normalized by zi) within and above the PBL under all-,clear-, and cloudy-sky conditions. The near-surface clutter significantly increases the uncertainty in RWP data, which leads to an inability to analyze the effect of wind shear on ε below 0.5 () in the following sections.
Regardless of whether it is within or above the PBL, ε is positively correlated with VWS, as shown in Fig. 7a, d, and g and Table 2, which indicates that larger VWS leads to stronger turbulence. This suggests that the dynamic effect of VWS promotes the development of turbulence. Within the PBL (Fig. 7b, e, and h), the slope of ε against VWS is smaller than at 0.3 ≤ ≤ 2.0, with values ranging from 9.5 to 10.3. Above the PBL (Fig. 7c, f, and i), the values of the slope are larger, with values ranging from 10.7 to 18.1, which demonstrates that the dynamical effects of VWS influence the development of turbulence both within the upper PBL and above the PBL.
Under cloudy-sky conditions (Fig. 7h and i), the effect of VWS on turbulence within the upper PBL (slope = 10.3) is significantly weaker than above the PBL (slope = 18.1). Compared to the clear-sky conditions (Fig. 7e and f), the values of the slopes are larger under cloudy-sky conditions (Fig. 7h and i) both within and above the PBL. Remarkably, above the PBL, the effect of clouds on turbulence is more dramatic, as the slope value under cloudy-sky conditions is nearly twice as large as that under clear-sky conditions. These results indicate that the significant mechanical processes driven by VWS are important in the development of turbulence. Larger VWS in the PBL corresponds to stronger turbulence. Besides, above the PBL, the mechanical process of VWS is enhanced under cloudy-sky conditions.
3.3.3 Joint influence of Ts−Ta, VWS, and atmospheric stability on ε
It has been stated that turbulence can be produced by buoyant convective processes (i.e., thermals of warm air rising) and by mechanical processes (i.e., wind shear). From the previous section, it is known that Ts−Ta and VWS both affect the development of PBL turbulence. Figure 8 gives the slope profiles of ε against Ts−Ta and VWS at normalized heights () under all-,clear-, and cloudy-sky conditions.
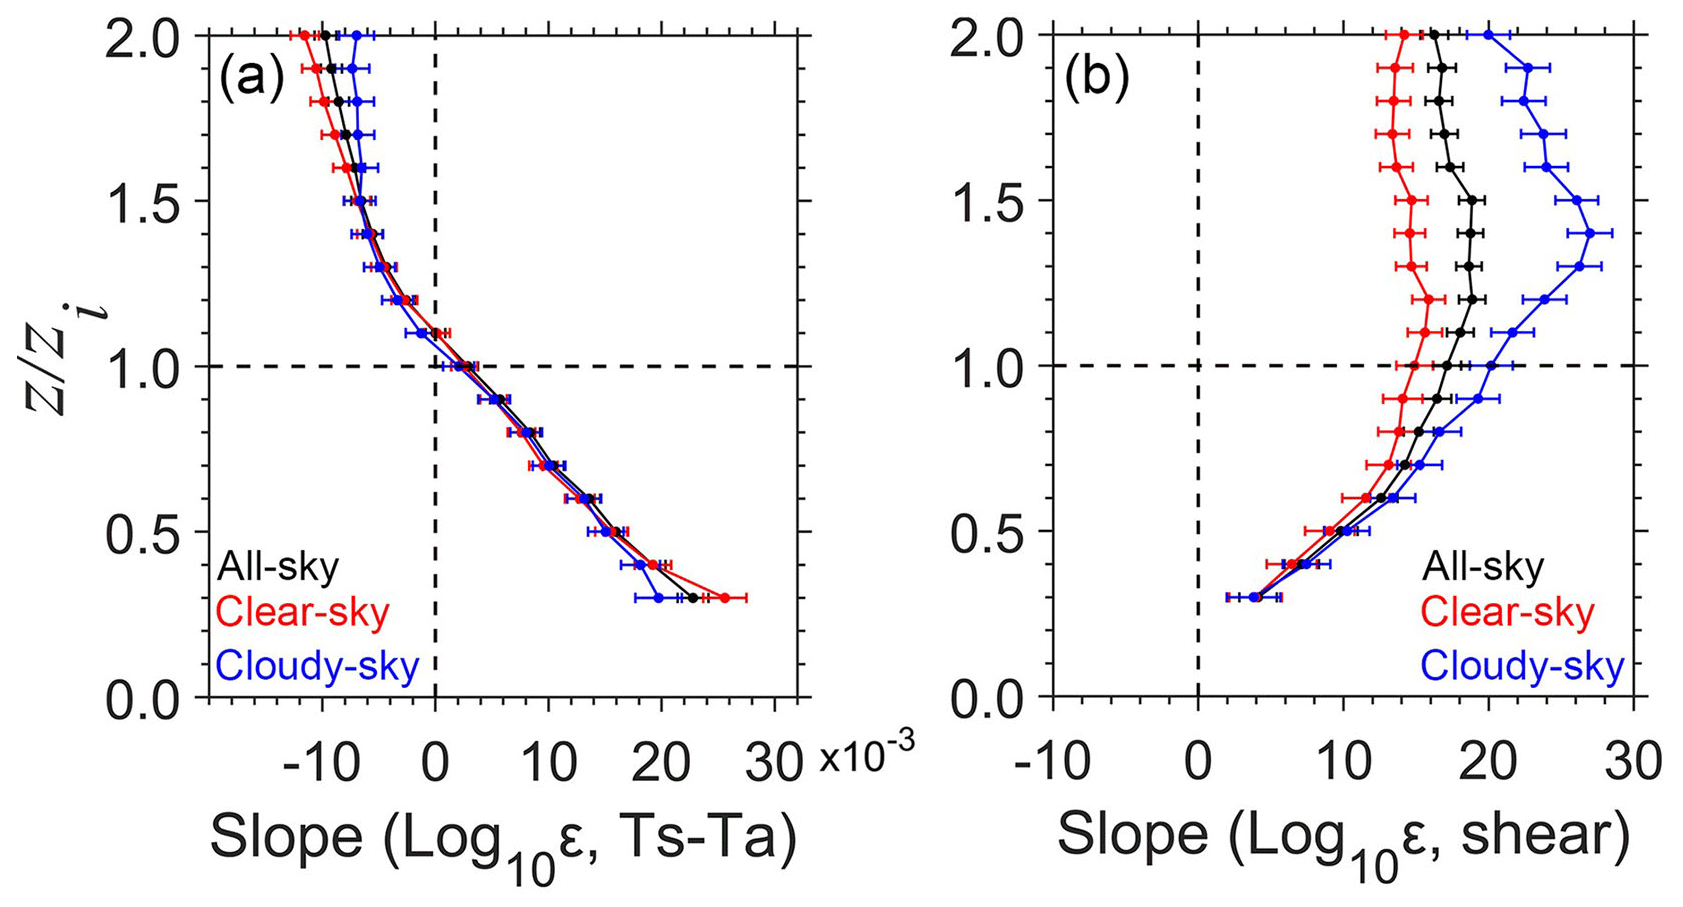
Figure 8The vertical profiles of the least-squares regression slope between εLog10 and Ts−Ta (a) and between εLog10 and VWS (b) over the TP under all-sky (black), clear-sky (red), and cloudy-sky (blue) conditions.
As inferred from the previous findings, Ts−Ta primarily influences turbulence development within the PBL, irrespective of clear-sky and cloudy-sky conditions (Fig. 6). Figure 8a shows that the slope values within the PBL are predominantly positive, and the slope value decreases rapidly with height, which indicates that the influence of Ts−Ta on PBL turbulence decreases with height. Interestingly, there is a nearly linear variation in the slope from the lower PBL to the top of the PBL. Within the PBL, the slope is positive; above the PBL, the slope becomes negative. This may be due to the linear decrease in heat flux transport and the buoyancy term in the convective PBL (Stull, 1988). Therefore, these findings highlight the predominant thermal forcing of Ts−Ta acting on turbulence development within the lower PBL. Figure 8 clearly shows the influence of cloud cover on Ts−Ta and the effect of the surface heating on the turbulence in the lower half of the PBL (0.3 ≤ ≤ 0.5), while there is little difference for the clear-sky and cloudy-sky conditions when > 0.5. Hence, under clear-sky conditions, the thermodynamic effect of Ts−Ta is more pronounced within the lower PBL.
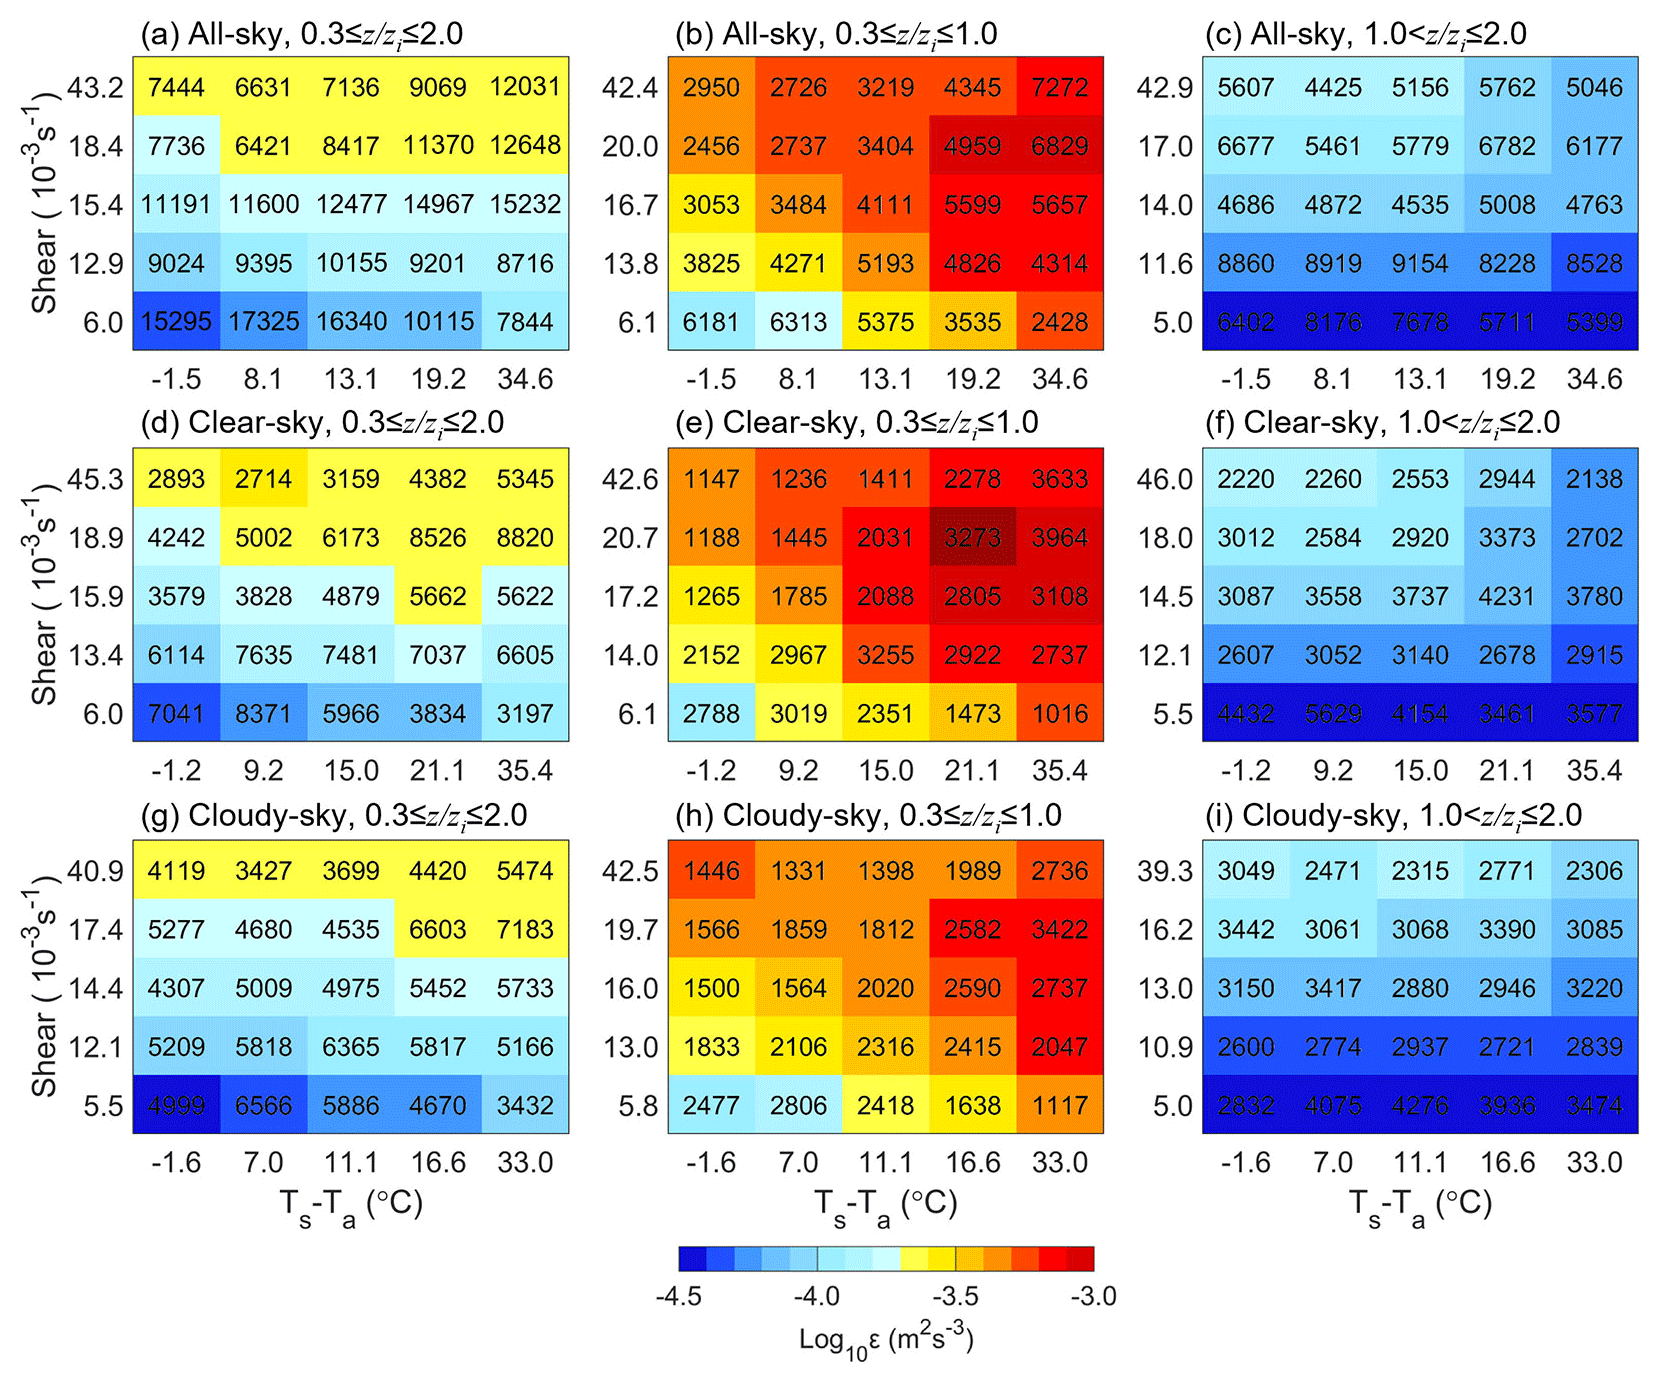
Figure 9Joint dependence of εLog10 (color shading) on the VWS and Ts−Ta within and above the PBL (a, d, g), in the PBL (b, e, h), and above the PBL (c, f, i) over the TP under all-sky (a–c), clear-sky (d–f), and cloudy-sky (g–i) conditions. The number given in each cell is the total number of samples used.
As shown in Fig. 7, it is evident that VWS influences turbulence development within and above the PBL. Figure 8b shows that when 0.3 ≤ ≤ 2.0, the slope values are consistently positive, indicating that VWS predominantly affects turbulence development within the middle and upper PBL and above the PBL. Moreover, when 0.3 ≤ ≤ 1.2, the slope values increase with height. However, when 1.4 < ≤ 2.0, the slope decreases with height, which suggests a diminishing influence of VWS. Additionally, within the PBL (0.3 ≤ ≤ 0.7), the slope values under clear-sky conditions are close to those under cloudy-sky conditions, while the slope values under cloudy-sky conditions are even greater when 0.7 < ≤ 2.0. For instance, when = 1.4, SlopeClear-sky = 14.6, while SlopeCloudy-sky = 27.0, indicating that the latter is 1.8 times larger than the former. These results suggest that clouds are primarily responsible for enhancing mechanical processes from VWS acting on turbulence within the upper PBL and above the PBL.
Furthermore, it can be concluded that Ts−Ta is a thermodynamic factor influencing turbulence development within the lower PBL (0.3 ≤ ≤ 0.5), both Ts−Ta and VWS jointly strengthen turbulence development in the upper PBL (0.6 ≤ ≤ 1.0), and VWS emerges as the predominant factor affecting turbulence development above the PBL (1.0 < ≤ 2.0) (Fig. 8a and b).
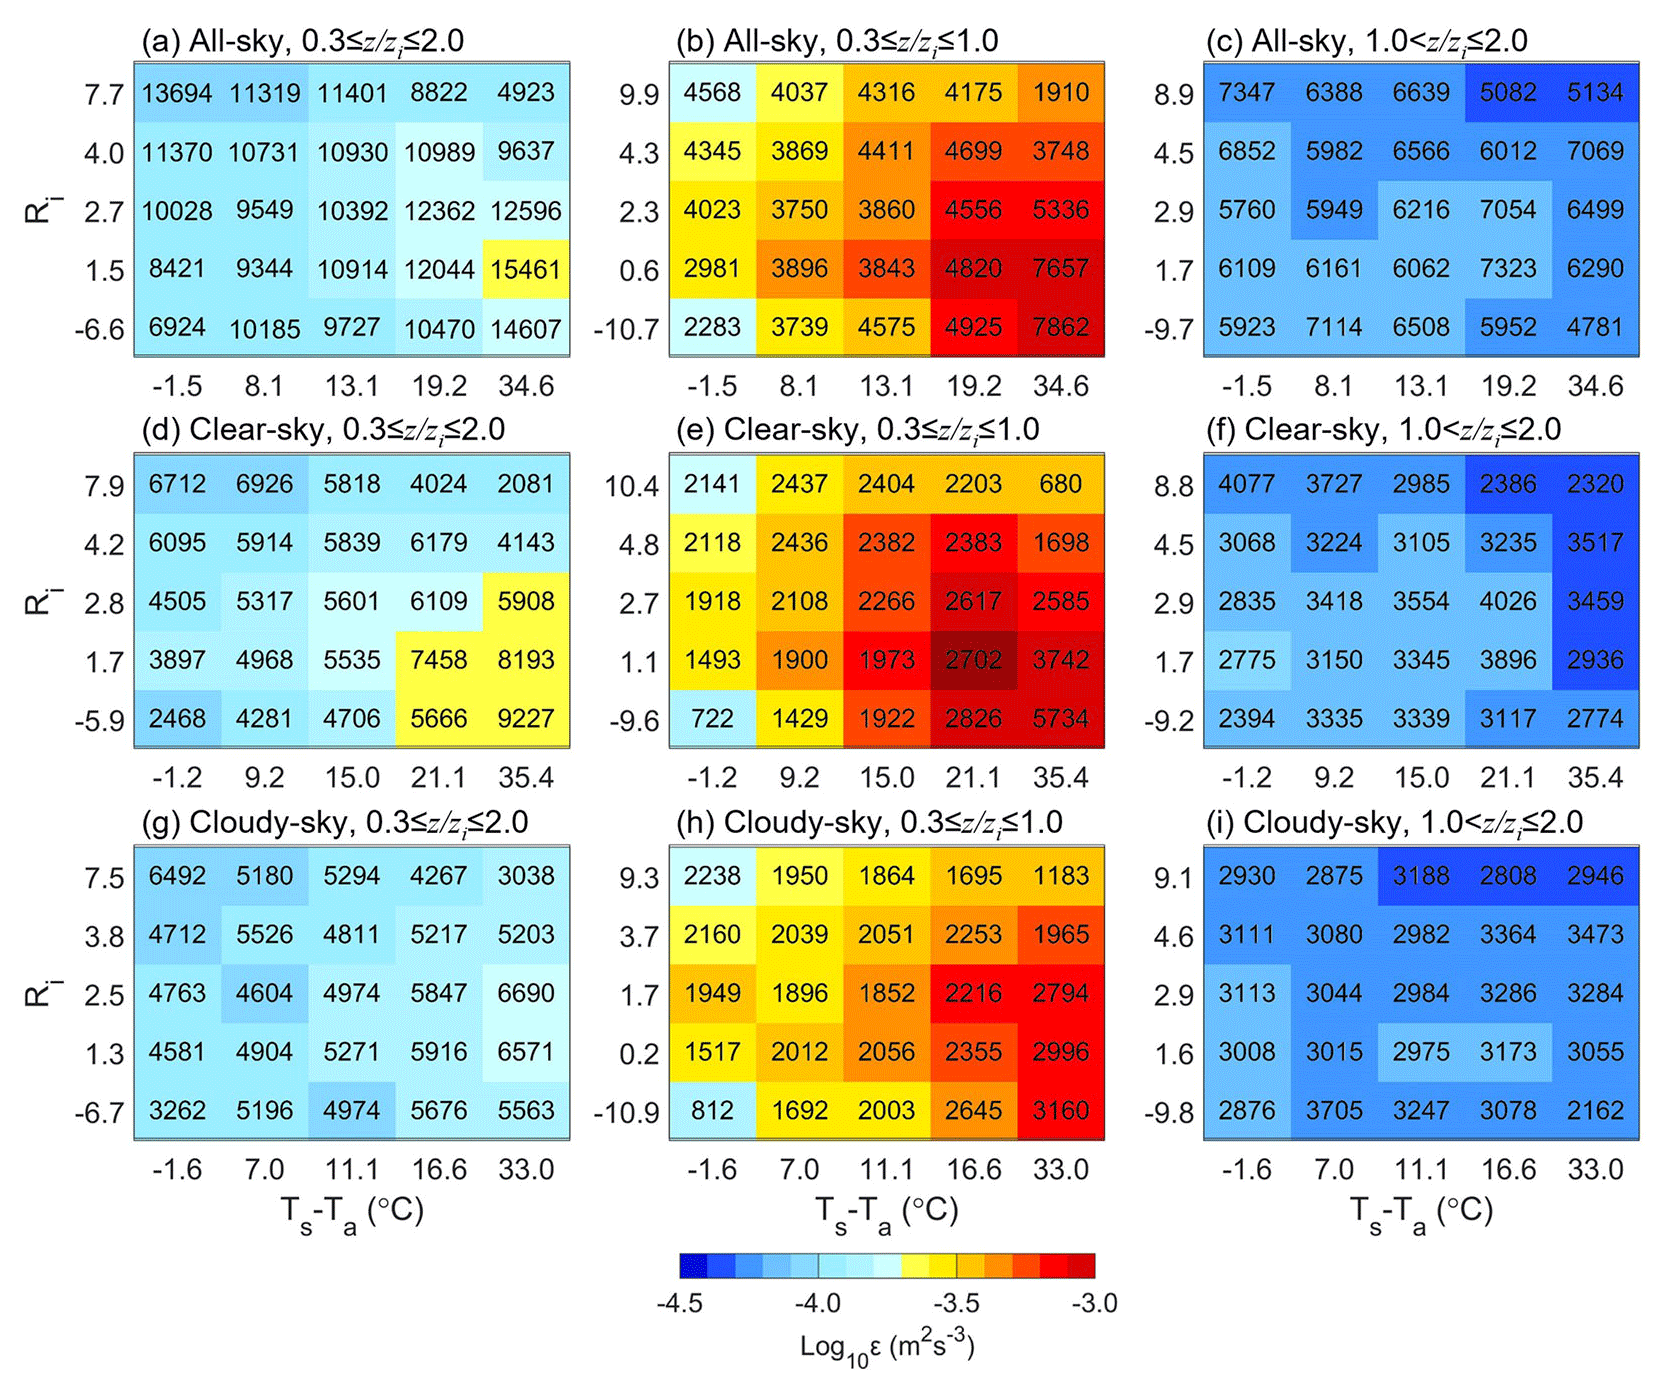
Figure 10Joint dependence of εLog10 (color shading) on the gradient Richardson number (Ri) and Ts−Ta in and above the PBL (a, d, g), in the PBL (b, e, h), and above the PBL (c, f, i) over the TP under all-sky (a–c), clear-sky (d–f), and cloudy-sky (g–i) conditions. The number given in each cell is the total number of samples used.
The previous sections have revealed that hours of both high Ts−Ta and strong wind shear would strengthen the turbulence within the PBL. Therefore, it is necessary to analyze the combined influence of thermodynamic and dynamic factors on the development of turbulence. Figure 9 presents the joint distribution of ε with Ts−Ta and VWS within and above the PBL under all-,clear-, and cloudy-sky conditions. Within the PBL (Fig. 9b, e, and h), higher Ts−Ta and VWS correspond to stronger turbulence (Fig. 8). In contrast, the thermodynamic effect of Ts−Ta on turbulence has diminished and is no longer a dominant factor above the PBL, while the dynamical effect of VWS has become the dominant factor (Fig. 9c, f, and i). Compared to clear-sky conditions, both Ts−Ta and VWS decrease under cloudy-sky conditions (Fig. 9h). This means that the weakening of both thermodynamic and dynamic effects leads to a decrease in turbulence, thereby inhibiting the development of turbulence within the PBL. Therefore, under cloudy-sky conditions, although the VWS is reduced, the dynamical effect of VWS on turbulence is strengthened (Figs. 7i and 8b), which in turn strengthens turbulence.
Since buoyant forcing and mechanic forcing jointly influence the turbulence within the PBL and VWS only represents the dynamic driving effect, VWS cannot accurately portray the effect of thermodynamic and dynamic effects on the PBL turbulence. The gradient Richardson number (Ri), on the other hand, is one of the important parameters characterizing atmospheric stability and can be used to compare the buoyant turbulence production term and the shear production term in the form of a dimensionless ratio.
Similarly to Fig. 9, the joint distribution of ε with Ts−Ta and Ri within and above the PBL under all-sky, clear-sky, and cloudy-sky conditions is given in Fig. 10. As shown in Fig. 10b, e, and h, it is evident that the turbulence in the PBL tends to be enhanced for unstable conditions. Furthermore, under clear-sky conditions (Fig. 10e), the maximum number of samples is found when Ri < 1.0 and Ts−Ta > 21.1 in strongly unstable conditions, which may be caused by the buoyancy forcing driven by the larger Ts−Ta. By comparison, the effect of Ri on turbulence is relatively weakened above the PBL (Fig. 10c, f, and i).
This study investigates the characteristics of the spatio-temporal distribution of the daytime PBL turbulence dissipation rate (ε) based on a record spanning more than 1 year (September 2022–October 2023) of profiling measurements from a radar wind profiler (RWP) network on the Tibetan Plateau (TP). Also analyzed are the evolution of ε in the PBL and possible influential mechanisms.
First of all, ε is retrieved from the vertical wind measurements from RWPs using the spectral width method. Afterwards, the spatial pattern of ε is examined. Results shows that the values of ε at the Minfeng and Jiuquan stations in the northern TP and at Dingri over the southern TP are about 1 order of magnitude greater than those at the RWP stations of Lijiang, Ganzi, and Hongyuan over the eastern TP. Coincidently, Minfeng and Jiuquan are dominated by bare or semiarid land, as opposed to the land surface of high vegetation cover at Lijiang, Ganzi, and Hongyuan. This suggests the spatial discrepancy of ε over the TP is highly relevant to the types of underlying land cover.
Although ε exhibits a variety of magnitudes among the six RWPs, the daytime pattern and vertical structure of ε are similar. Turbulence reaches a peak in the early afternoon (13:00–15:00 LST), coinciding with the highest PBL top. Under cloudy-sky conditions, the daytime mean value of ε is 10−4.02 m2 s−3, and the daytime mean value of the PBL height (zi) can reach up to 1.40 km, which is 0.12 km lower than that of clear-sky conditions, indicating that clouds suppress the development of PBL turbulence.
As far as both the thermodynamic and the dynamic forcings are concerned, surface–air temperature difference (Ts−Ta) and vertical wind shear (VWS) variables are examined by performing correlation analysis with ε. The slope values of ε against Ts−Ta under clear-sky conditions are larger (slope = 0.019) than under cloudy conditions (slope = 0.013) within the PBL, while those values are negative above the PBL. The slope values of ε against VWS are positive regardless of whether they are within or above the PBL, where the largest value of 18.1 is observed above the PBL under cloudy-sky conditions and the smallest value of 9.5 is observed in the PBL under clear-sky conditions.
Both the thermodynamic effect of Ts−Ta and the dynamic effect of VWS enhance the development of turbulence under clear-sky or cloudy-sky conditions in the PBL. In the lower PBL (0.3 ≤ ≤ 0.5), Ts−Ta has a larger positive slope with ε, which suggests that thermal forcing emerges as the dominant factor influencing development of the turbulence and PBL. By comparison, in the upper PBL (0.6 ≤ ≤ 1.0), Ts−Ta and VWS jointly influence the development of turbulence, with larger Ts−Ta values, leading to unstable atmospheric stability and stronger turbulence. Above the PBL (1.0 < ≤ 2.0), VWS becomes the dominant factor influencing the development of turbulence. Compared to clear-sky conditions, on one hand, clouds diminish Ts−Ta, resulting in decreased heat transfer from the surface to the PBL top, thereby weakening turbulence within the lower PBL (0.3 ≤ ≤ 0.5), inhibiting PBL development, and decreasing zi. On the other hand, the stronger wind shear process enhances the turbulence above the PBL under cloudy-sky conditions.
Although the abovementioned findings of the PBL turbulence over the TP are the first results from profiling network observations to the best of our knowledge, the fine-resolution spatial distribution remains unclear, largely due to the sparse distribution of the RWP network on the TP. On top of this, the role of roughness length, vertical velocity, and entrainment remains unknown in terms of the variation in and evolution of atmospheric turbulence, warranting further in-depth studies based on intensive field campaigns in combination with theoretical analysis and numerical simulation experiments in the future.
The meteorological dataset from weather stations and the measurements from radar wind profiler were obtained from the National Meteorological Information Center of the China Meteorological Administration (Guo et al., 2021a), and the hourly ERA5 reanalysis data (https://doi.org/10.24381/cds.bd0915c6, Hersbach et al., 2023) used here are available from the ECMWF in Hersbach et al. (2020).
The supplement related to this article is available online at: https://doi.org/10.5194/acp-24-8703-2024-supplement.
The study was completed with close cooperation between all authors. JG and XG conceived of the idea for this work. DM performed the analysis. DM and JG drafted the original manuscript with contributions from XG, NL, YS, ZZ, and NT. YW, HL, FZ, BT, HX, and TC provided useful suggestions and comments for the study and helped revise the manuscript.
The contact author has declared that none of the authors has any competing interests.
Publisher's note: Copernicus Publications remains neutral with regard to jurisdictional claims made in the text, published maps, institutional affiliations, or any other geographical representation in this paper. While Copernicus Publications makes every effort to include appropriate place names, the final responsibility lies with the authors.
This work was jointly supported by the National Natural Science Foundation of China under grant nos. 42325501, U2142209, and 42105090; the High Impact Weather Key Laboratory of China Meteorological Administration; the CMA Xiong'an Atmospheric Boundary Layer Key Laboratory under grant no. 2023LABL-B06; and the Chinese Academy of Meteorological Sciences under grant nos. 2021KJ008 and 2024Z003. Last but not least, we appreciated tremendously the constructive comments and suggestions made by Gerrit de Leeuw and the anonymous reviewer, which significantly improved the quality of our paper.
This research has been supported by the National Natural Science Foundation of China (grant nos. 42325501 and U2142209).
This paper was edited by Dantong Liu and reviewed by Gerrit de Leeuw and one anonymous referee.
Adler, B. and Kalthoff, N.: Multi-scale transport processes observed in the boundary layer over a mountainous island, Bound.-Lay. Meteorol., 153, 515–537, https://doi.org/10.1007/s10546-014-9957-8, 2014.
Angel, A. C. and Manoj, M. G.: A novel method of estimating atmospheric boundary layer height using a 205 MHz VHF radar. Sci. Total Environ., 907, 168109, https://doi.org/10.1016/j.scitotenv.2023.168109, 2024.
Banerjee, T., Brugger, P., De Roo, F., Kröniger, K., Yakir, D., Rotenberg, E., and Mauder, M.: Turbulent transport of energy across a forest and a semiarid shrubland, Atmos. Chem. Phys., 18, 10025–10038, https://doi.org/10.5194/acp-18-10025-2018, 2018.
Bianco, L., Wilczak, J. M., and White, A. B.: Convective boundary layer depth estimation from wind profilers: Statistical comparison between an automated algorithm and expert estimations, J. Atmos. Ocean. Tech., 25, 1397–1413, https://doi.org/10.1175/2008jtecha981.1, 2008.
Bodenschatz, E., Malinowski, S. P., Shaw, R. A., and Stratmann, F.: Can we understand clouds without turbulence?, Science, 327, 970–971, https://doi.org/10.1126/science.1185138, 2010.
Che, J. and Zhao, P.: Characteristics of the summer atmospheric boundary layer height over the Tibetan Plateau and influential factors, Atmos. Chem. Phys., 21, 5253–5268, https://doi.org/10.5194/acp-21-5253-2021, 2021.
Chechin, D. G., Lüpkes, C., Hartmann, J., Ehrlich, A., and Wendisch, M.: Turbulent structure of the Arctic boundary layer in early summer driven by stability, wind shear and cloud-top radiative cooling: ACLOUD airborne observations, Atmos. Chem. Phys., 23, 4685–4707, https://doi.org/10.5194/acp-23-4685-2023, 2023.
Chen, X. L., Añel, J. A., Su, Z. B., de la Torre, L., Kelder, H., van Peet, J., and Ma, Y. M.: The deep atmospheric boundary layer and its significance to the stratosphere and troposphere exchange over the Tibetan Plateau, PLOS ONE, 8, e56909, https://doi.org/10.1371/journal.pone.0056909, 2013.
Chen, X. L., Skerlak, B., Rotach, M. W., Añel, J. A., Su, Z., Ma, Y. M., and Li, M. S.: Reasons for the extremely high-ranging planetary boundary layer over the western Tibetan Plateau in winter, J. Atmos. Sci., 73, 2021–2038, https://doi.org/10.1175/jas-d-15-0148.1, 2016.
Chen, Z., Tian, Y., Wang, Y., Bi, Y., Wu, X., Huo, J., Pan, L., Wang, Y., and Lü, D.: Turbulence parameters measured by the Beijing mesosphere–stratosphere–troposphere radar in the troposphere and lower stratosphere with three models: comparison and analyses, Atmos. Meas. Tech., 15, 4785–4800, https://doi.org/10.5194/amt-15-4785-2022, 2022.
Collaud Coen, M., Praz, C., Haefele, A., Ruffieux, D., Kaufmann, P., and Calpini, B.: Determination and climatology of the planetary boundary layer height above the Swiss plateau by in situ and remote sensing measurements as well as by the COSMO-2 model, Atmos. Chem. Phys., 14, 13205–13221, https://doi.org/10.5194/acp-14-13205-2014, 2014.
Dai, C., Wang, Q., Kalogiros, J. A., Lenschow, D. H., Gao, Z., and Zhou, M.: Determining boundary-layer height from aircraft measurements, Bound.-Lay. Meteorol., 152, 277–302, https://doi.org/10.1007/s10546-014-9929-z, 2014.
Davis, E. V., Rajeev, K., and Mishra, M. K.: Effect of clouds on the diurnal evolution of the atmospheric boundary-layer height over a tropical coastal station. Bound.-Lay. Meteorol., 175, 135–152, https://doi.org/10.1007/s10546-019-00497-6, 2020.
Dodson, D. S. and Small Griswold, J. D.: Turbulent and boundary layer characteristics during VOCALS-REx, Atmos. Chem. Phys., 21, 1937–1961, https://doi.org/10.5194/acp-21-1937-2021, 2021.
Duncan Jr., J. B., Bianco, L., Adler, B., Bell, T., Djalalova, I. V., Riihimaki, L., Sedlar, J., Smith, E. N., Turner, D. D., Wagner, T. J., and Wilczak, J. M.: Evaluating convective planetary boundary layer height estimations resolved by both active and passive remote sensing instruments during the CHEESEHEAD19 field campaign, Atmos. Meas. Tech., 15, 2479–2502, https://doi.org/10.5194/amt-15-2479-2022, 2022.
Guo, J., Miao, Y., Zhang, Y., Liu, H., Li, Z., Zhang, W., He, J., Lou, M., Yan, Y., Bian, L., and Zhai, P.: The climatology of planetary boundary layer height in China derived from radiosonde and reanalysis data, Atmos. Chem. Phys., 16, 13309–13319, https://doi.org/10.5194/acp-16-13309-2016, 2016.
Guo, J., Liu, B., Gong, W., Shi, L., Zhang, Y., Ma, Y., Zhang, J., Chen, T., Bai, K., Stoffelen, A., de Leeuw, G., and Xu, X.: Technical note: First comparison of wind observations from ESA's satellite mission Aeolus and ground-based radar wind profiler network of China, Atmos. Chem. Phys., 21, 2945–2958, https://doi.org/10.5194/acp-21-2945-2021, 2021a.
Guo, J., Zhang, J., Yang, K., Liao, H., Zhang, S., Huang, K., Lv, Y., Shao, J., Yu, T., Tong, B., Li, J., Su, T., Yim, S. H. L., Stoffelen, A., Zhai, P., and Xu, X.: Investigation of near-global daytime boundary layer height using high-resolution radiosondes: first results and comparison with ERA5, MERRA-2, JRA-55, and NCEP-2 reanalyses, Atmos. Chem. Phys., 21, 17079–17097, https://doi.org/10.5194/acp-21-17079-2021, 2021b.
Guo, J. P., Li, Y., Cohen, J. B., Li, J., Chen, D. D., Xu, H., Liu, L., Yin, J. F., Hu, K. X., and Zhai, P. M.: Shift in the temporal trend of boundary layer height in China using long-term (1979–2016) radiosonde data, Geophys. Res. Lett., 46, 6080–6089, https://doi.org/10.1029/2019gl082666, 2019.
Guo, X. R., Guo, J. P., Zhang, D. L., and Yun, Y. X.: Vertical divergence profiles as detected by two wind-profiler mesonets over East China: Implications for nowcasting convective storms, Q. J. Roy. Meteor. Soc., 149, 1629–1649, https://doi.org/10.1002/qj.4474, 2023.
Hersbach, H., Bell, B., Berrisford, P., Hirahara, S., Horányi, A., Muñoz-Sabater, J., Nicolas, J., Peubey, C., Radu, R., Schepers, D., Simmons, A., Soci, C., Abdalla, S., Abellan, X., Balsamo, G., Bechtold, P., Biavati, G., Bidlot, J., Bonavita, M., De Chiara, G., Dahlgren, P., Dee, D., Diamantakis, M., Dragani, R., Flemming, J., Forbes, R., Fuentes, M., Geer, A., Haimberger, L., Healy, S., Hogan, R. J., Hólm, E., Janisková, M., Keeley, S., Laloyaux, P., Lopez, P., Lupu, C., Radnoti, G., de Rosnay, P., Rozum, I., Vamborg, F., Villaume, S., and Thépaut, J. N.: The ERA5 global reanalysis, Q. J. Roy. Meteor. Soc., 146, 1999–2049, https://doi.org/10.1002/qj.3803, 2020.
Hersbach, H., Bell, B., Berrisford, P., Biavati, G., Horányi, A., Muñoz Sabater, J., Nicolas, J., Peubey, C., Radu, R., Rozum, I., Schepers, D., Simmons, A., Soci, C., Dee, D., and Thépaut, J.-N.: ERA5 hourly data on pressure levels from 1940 to present, Copernicus Climate Change Service (C3S) Climate Data Store (CDS) [data set], https://doi.org/10.24381/cds.bd0915c6, 2023.
Huang, J. P., Zhou, X. J., Wu, G. X., Xu, X. D., Zhao, Q. Y., Liu, Y. M., Duan, A. M., Xie, Y. K., Ma, Y. M., Zhao, P., Yang, S., Yang, K., Yang, H. J., Bian, J. C., Fu, Y. F., Ge, J. M., Liu, Y. Z., Wu, Q. G., Yu, H. P., Wang, B. B., Bao, Q., and Qie, K.: Global climate impacts of land-surface and atmospheric processes over the Tibetan Plateau, Rev. Geophys., 61, 39, https://doi.org/10.1029/2022rg000771, 2023.
Huang, T., Yim, S. H. L., Yang, Y., Lee, O. S. M., Lam, D. H. Y., Cheng, J. C. H., and Guo, J.: Observation of turbulent mixing characteristics in the typical daytime cloud-topped boundary layer over Hong Kong in 2019, Remote Sens.-Basel, 12, 1533, https://doi.org/10.3390/RS12091533, 2020.
Jacoby-Koaly, S., Campistron, B., Bernard, S., Bénech, B., Girard-Ardhuin, F., Dessens, J., Dupont, E., and Carissimo, B.: Turbulent dissipation rate in the boundary layer via UHF wind profiler Doppler spectral width measurements, Bound.-Lay. Meteorol., 103, 361–389, https://doi.org/10.1023/a:1014985111855, 2002.
Kotthaus, S., Bravo-Aranda, J. A., Collaud Coen, M., Guerrero-Rascado, J. L., Costa, M. J., Cimini, D., O'Connor, E. J., Hervo, M., Alados-Arboledas, L., Jiménez-Portaz, M., Mona, L., Ruffieux, D., Illingworth, A., and Haeffelin, M.: Atmospheric boundary layer height from ground-based remote sensing: a review of capabilities and limitations, Atmos. Meas. Tech., 16, 433–479, https://doi.org/10.5194/amt-16-433-2023, 2023.
Lai, Y., Chen, X. L., Ma, Y. M., Chen, D. L., and Zhaxi, S. L.: Impacts of the westerlies on planetary boundary layer growth over a valley on the north side of the Central Himalayas, J. Geophys. Res.-Atmos., 126, 20, https://doi.org/10.1029/2020jd033928, 2021.
Li, Y., Y. Wu, J. Tang, P. Zhu, Z. Gao, and Y. Yang. Quantitative evaluation of wavelet analysis method for turbulent flux calculation of non-stationary series, Geophys. Res. Lett., 50, e2022GL101591, https://doi.org/10.1029/2022GL101591, 2023.
Li, Z. G., Lyu, S. H., Wen, L. J., Zhao, L., Ao, Y. H., and Wang, S. Y.: Effect of a cold, dry air incursion on atmospheric boundary layer processes over a high-altitude lake in the Tibetan Plateau, Atmos. Res., 185, 32–43, https://doi.org/10.1016/j.atmosres.2016.10.024, 2017.
Li, Z. Q., Guo, J. P., Ding, A. J., Liao, H., Liu, J. J., Sun, Y. L., Wang, T. J., Xue, H. W., Zhang, H. S., and Zhu, B.: Aerosol and boundary-layer interactions and impact on air quality, Natl. Sci. Rev., 4, 810–833, https://doi.org/10.1093/nsr/nwx117, 2017.
Liu, B., Guo, J., Gong, W., Shi, L., Zhang, Y., and Ma, Y.: Characteristics and performance of wind profiles as observed by the radar wind profiler network of China, Atmos. Meas. Tech., 13, 4589–4600, https://doi.org/10.5194/amt-13-4589-2020, 2020.
Liu, B. M., Ma, Y. Y., Guo, J. P., Gong, W., Zhang, Y., Mao, F. Y., Li, J., Guo, X. R., and Shi, Y. F.: Boundary layer heights as derived from ground-based radar wind profiler in Beijing, IEEE T. Geosci. Remote, 57, 8095–8104, https://doi.org/10.1109/tgrs.2019.2918301, 2019.
Lv, Y. M., Guo, J. P., Li, J., Cao, L. J., Chen, T. M., Wang, D., Chen, D. D., Han, Y., Guo, X. R., Xu, H., Liu, L., Solanki, R., and Huang, G.: Spatiotemporal characteristics of atmospheric turbulence over China estimated using operational high-resolution soundings, Environ. Res. Lett., 16, 054050, https://doi.org/10.1088/1748-9326/abf461, 2021.
Ma, Y. M., Yao, T. D., Zhong, L., Wang, B. B., Xu, X. D., Hu, Z. Y., Ma, W. Q., Sun, F. L., Han, C. B., Li, M. S., Chen, X. L., Wang, J. M., Li, Y. Q., Gu, L. L., Xie, Z. P., Liu, L., Sun, G. H., Wang, S. J., Zhou, D. G., Zuo, H. C., Xu, C., Liu, X., Wang, Y. J., and Wang, Z. Y.: Comprehensive study of energy and water exchange over the Tibetan Plateau: A review and perspective: From GAME/Tibet and CAMP/Tibet to TORP, TPEORP, and TPEITORP, Earth-Sci. Rev., 237, 104312, https://doi.org/10.1016/j.earscirev.2023.104312, 2023.
McCaffrey, K., Bianco, L., and Wilczak, J. M.: Improved observations of turbulence dissipation rates from wind profiling radars, Atmos. Meas. Tech., 10, 2595–2611, https://doi.org/10.5194/amt-10-2595-2017, 2017.
Muhsin, M., Sunilkumar, S. V., Ratnam, M. V., Parameswaran, K., Murthy, B. V. K., Ramkumar, G., and Rajeev, K.: Diurnal variation of atmospheric stability and turbulence during different seasons in the troposphere and lower stratosphere derived from simultaneous radiosonde observations at two tropical stations, in the Indian Peninsula, Atmos. Res., 180, 12–23, https://doi.org/10.1016/j.atmosres.2016.04.021, 2016.
Muñoz-Esparza, D., Sharman, R. D., and Lundquist, J. K.: Turbulence Dissipation Rate in the Atmospheric Boundary Layer: Observations and WRF Mesoscale Modeling during the XPIA Field Campaign, Mon. Weather Rev., 146, 351–371, https://doi.org/10.1175/mwr-d-17-0186.1, 2018.
Nastrom, G. D.: Doppler radar spectral width broadening due to beamwidth and wind shear, Ann. Geophys., 15, 786–796, https://doi.org/10.1007/s00585-997-0786-7, 1997.
Nicholls, S.: The dynamics of stratocumulus: Aircraft observations and comparisons with a mixed layer model, Q. J. Roy. Meteor. Soc., 110, 783–820, https://doi.org/10.1002/qj.49711046603, 1984.
Ruan, Z., Mu, R. Q., Wei, M., and Ge, R. S.: Spectrum analysis of wind profiling radar measurements, J. Meteorol. Res., 28, 656–667, https://doi.org/10.1007/s13351-014-3171-y, 2014.
Sedlar, J., Riihimaki, L. D., Turner, D. D., Duncan, J., Adler, B., Bianco, L., Lantz, K., and Wilczak, J.: Investigating the impacts of daytime boundary layer clouds on surface energy fluxes and boundary layer structure during CHEESEHEAD19, J. Geophys. Res.-Atmos., 127, e2021JD036060, https://doi.org/10.1029/2021JD036060, 2022.
Schumann, U. and Moeng, C. H.: Plume budgets in clear and cloudy convective boundary layers, J. Atmos. Sci., 48, 1758–1770, https://doi.org/10.1175/1520-0469(1991)048<1758:Pbicac>2.0.Co;2, 1991.
Slättberg, N., Lai, H. W., Chen, X. L., Ma, Y. M., and Chen, D. L.: Spatial and temporal patterns of planetary boundary layer height during 1979-2018 over the Tibetan Plateau using ERA5, Int. J. Climatol., 42, 3360–3377, https://doi.org/10.1002/joc.7420, 2022.
Solanki, R., Guo, J. P., Li, J., Singh, N., Guo, X. R., Han, Y., Lv, Y. M., Zhang, J., and Liu, B. M.: Atmospheric-boundary-layer-height variation over mountainous and urban stations in Beijing as derived from radar wind-profiler measurements, Bound.-Lay. Meteorol., 181, 125–144, https://doi.org/10.1007/s10546-021-00639-9, 2021.
Solanki, R., Guo, J. P., Lv, Y. M., Zhang, J., Wu, J. Y., Tong, B., and Li, J.: Elucidating the atmospheric boundary layer turbulence by combining UHF radar wind profiler and radiosonde measurements over urban area of Beijing, Urban Clim., 43, 101151, https://doi.org/10.1016/j.uclim.2022.101151, 2022.
Stull, R. B.: Mean Boundary Layer Characteristics, in: An Introduction to boundary layer meteorology, edited by: Stull, R. B., Springer Netherlands, Dordrecht, 1–27, https://doi.org/10.1007/978-94-009-3027-8_1, 1988.
Su, T. N., Li, Z. Q., and Zheng, Y. T.: Cloud-Surface Coupling Alters the Morning Transition From Stable to Unstable Boundary Layer, Geophys. Res. Lett., 50, e2022GL102256, https://doi.org/10.1029/2022gl102256, 2023.
Sun, W., Li, L., and Wang, B.: Reducing the biases in shortwave cloud radiative forcing in tropical and subtropical regions from the perspective of boundary layer processes, Sci. China Earth Sci., 59, 1427–1439, https://doi.org/10.1007/s11430-016-5290-z, 2016.
Teixeira, J., Piepmeier, J. R., Nehrir, A. R., Ao, C. O., Chen, S. S., Clayson, C. A., Fridlind, A. M., Lebsock, M., McCarty, W., Salmun, H., Santanello, J. A., Turner, D. D., Wang, Z., and Zeng, X.: Toward a global planetary boundary layer observing system: the NASA PBL incubation study team report, NASA PBL Incubation Study Team, 134 pp., https://ntrs.nasa.gov/citations/20230001633 (last access: 15 November 2021), 2021.
Wan, X., Zheng, J. F., Wan, R., Xu, G. R., Qin, J. F., and Yi, L.: Intercomparison of cloud vertical structures over four different stations of the eastern slope of the Tibetan Plateau in summer using Ka-band millimeter-wave radar measurements, Remote Sens.-Basel, 14, 3702, https://doi.org/10.3390/rs14153702, 2022.
Wang, C. X., Ma, Y. M., and Han, C. B.: Research on the atmospheric boundary layer structure and its development mechanism in the Tibetan Plateau, Adv. Atmos. Sci., 38, 414–428, https://doi.org/10.11867/j.issn.1001-8166.2023.013, 2023.
Wang, M. Z. and Zhang, J. T.: The relationship among summer atmospheric boundary layer height over the Taklimakan Desert, its land surface parameters and Eurasian circulation, Atmos. Sci. Lett., 23, e1122, https://doi.org/10.1002/asl.1122, 2022.
Wang, M. Z., Lu, H., Ming, H., and Zhang, J. T.: Vertical structure of summer clear-sky atmospheric boundary layer over the hinterland and southern margin of Taklamakan Desert, Meteorol. Appl., 23, 438–447, https://doi.org/10.1002/met.1568, 2016.
Wang, S. Q., Guo, J. P., Xian, T., Li, N., Meng, D. L., Li, H. J., and Cheng, W.: Investigation of low-level supergeostrophic wind and Ekman spiral as observed by a radar wind profiler in Beijing, Front. Environ. Sci., 11, 1195750, https://doi.org/10.3389/fenvs.2023.1195750, 2023.
Wang, Y. J., Xu, X. D., Zhao, T. L., Sun, J. H., Yao, W. Q., and Zhou, M. Y.: Structures of convection and turbulent kinetic energy in boundary layer over the southeastern edge of the Tibetan Plateau, Sci. China Earth Sci., 58, 1198–1209, https://doi.org/10.1007/s11430-015-5054-1, 2015.
Wang, Y. J., Zeng, X. B., Xu, X. D., Welty, J., Lenschow, D. H., Zhou, M. Y., and Zhao, Y.: Why are there more summer afternoon low clouds over the Tibetan Plateau compared to eastern China? Geophys. Res. Lett., 47, e2020GL089665, https://doi.org/10.1029/2020gl089665, 2020.
Wang, Y. J., Zeng, X. B., Xu, X. D., Xie, F. Q., and Zhao, Y.: Improving the estimate of summer daytime planetary boundary layer height over land from GPS radio occultation data, Geophys. Res. Lett., 49, e2021GL096304, https://doi.org/10.1029/2021gl096304, 2022.
White, A. B., Lataitis, R. J., and Lawrence, R. S.: Space and time filtering of remotely sensed velocity turbulence, J. Atmos. Ocean. Tech., 16, 1967–1972, https://doi.org/10.1175/1520-0426(1999)016<1967:Satfor>2.0.Co;2, 1999.
Wu, J. Y., Guo, J. P., Yun, Y. X., Yang, R. F., Guo, X. R., Meng, D. L., Sun, Y. P., Zhang, Z., Xu, H., and Chen, T. M.: Can ERA5 reanalysis data characterize the pre-storm environment? Atmos. Res., 297, 107108, https://doi.org/10.1016/j.atmosres.2023.107108, 2024.
Xu, L. J., Liu, H. Z., Du, Q., and Xu, X. D.: The assessment of the planetary boundary layer schemes in WRF over the central Tibetan Plateau, Atmos. Res., 230, 104644, https://doi.org/10.1016/j.atmosres.2019.104644, 2019.
Xu, X., Tang, Y., Wang, Y., Zhang, H., Liu, R., and Zhou, M.: Triggering effects of large topography and boundary layer turbulence on convection over the Tibetan Plateau, Atmos. Chem. Phys., 23, 3299–3309, https://doi.org/10.5194/acp-23-3299-2023, 2023.
Xu, X. D., Zhou, M. Y., Chen, J. Y., Bian, L. G., Zhang, G. Z., Liu, H. Z., Li, S. M., Zhang, H. S., Zhao, Y. J., Suolong, D. J., and Wang, J. Z.: A comprehensive physical pattern of land-air dynamic and thermal structure on the Qinghai-Xizang Plateau, Sci. China Earth Sci., 45, 577–594, https://doi.org/10.1360/02yd9060, 2002.
Yang, B., Qian, Y., Berg, L. K., Ma, P. L., Wharton, S., Bulaevskaya, V., Yan, H. P., Hou, Z. S., and Shaw, W. J.: Sensitivity of Turbine-Height Wind Speeds to Parameters in Planetary Boundary-Layer and Surface-Layer Schemes in the Weather Research and Forecasting Model, Bound.-Lay. Meteorol., 162, 117–142, https://doi.org/10.1007/s10546-016-0185-2, 2017.
Yang, R. F., Guo, J. P., Deng, W. L., Li, N., Fan, J. H., Meng, D. L., Liu, Z., Sun, Y. P., Zhang, G. L., and Liu, L. H.: Investigation of turbulent dissipation rate profiles from two radar wind profilers at plateau and plain stations in the north China plain, Remote Sens.-Basel, 15, 4103, https://doi.org/10.3390/rs15164103, 2023.
Yu, R., Wang, B., and Zhou, T.: Climate effects of the deep continental stratus clouds generated by the Tibetan Plateau, J. Climate, 17, 2702–2713, https://doi.org/10.1175/1520-0442(2004)017<2702:CEOTDC>2.0.CO;2, 2004.
Zhang, L., Zhang, H. S., Li, Q. H., Wei, W., Cai, X. H., Song, Y., Mamtimin, A., Wang, M. Z., Yang, F., Wang, Y., and Zhou, C. L.: Turbulent mechanisms for the deep convective boundary layer in the Taklimakan desert, Geophys. Res. Lett., 49, e2022GL099447, https://doi.org/10.1029/2022gl099447, 2022.
Zhang, Y., Guo, J. P., Yang, Y. J., Wang, Y., and Yim, S. H. L.: Vertica wind shear modulates particulate matter pollutions: a perspective from radar wind profiler observations in Beijing, China, Remote Sens.-Basel, 12, 546, https://doi.org/10.3390/rs12030546, 2020.
Zhao, P., Li, Y. Q., Guo, X. L., Xu, X. D., Liu, Y. M., Tang, S. H., Xiao, W. M., Shi, C. X., Ma, Y. M., Yu, X., Liu, H. Z., Jia, L., Chen, Y., Liu, Y. J., Li, J., Luo, D. B., Cao, Y. C., Zheng, X. D., Chen, J. M., Xiao, A., Yuan, F., Chen, D. H., Pang, Y., Hu, Z. Q., Zhang, S. J., Dong, L. X., Hu, J. Y., Han, S., and Zhou, X. J.: The Tibetan Plateau surface-atmosphere coupling system and its weather and climate effects: the third Tibetan Plateau atmospheric science experiment, J. Meteorol. Res., 33, 375–399, https://doi.org/10.1007/s13351-019-8602-3, 2019.