the Creative Commons Attribution 4.0 License.
the Creative Commons Attribution 4.0 License.
 | 02 Aug 2024
Concentration and source changes of nitrous acid (HONO) during the COVID-19 lockdown in Beijing
Yusheng Zhang
Feixue Zheng
Zemin Feng
Chaofan Lian
Xiaolong Fan
Wei Ma
Zhuohui Lin
Chang Li
Gen Zhang
Ying Zhang
Veli-Matti Kerminen
Federico Bianch
Tuukka Petäjä
Juha Kangasluoma
Markku Kulmala
Nitrous acid (HONO) is an important precursor of OH radicals which affects not only the sinks of primary air pollutants but also the formation of secondary air pollutants, but its source closure in the atmosphere is still controversial due to a lack of experiment validation. In this study, the HONO budget in Beijing has been analyzed and validated through the coronavirus disease (COVID-19) lockdown event, which resulted in a significant reduction in air pollutant emissions, providing a rare opportunity to understand the HONO budget in the atmosphere. We measured HONO and related pollutants from 1 January to 6 March 2020, which covered the Chinese New Year (CNY) and the COVID-19 lockdown. The average concentration of HONO decreased from 0.97 ± 0.74 ppb before CNY to 0.53 ± 0.44 ppb during the COVID-19 lockdown, accompanied by a sharp drop in NOx and the greatest drop in NO (around 87 %). HONO budget analysis suggests that vehicle emissions were the most important source of HONO during the nighttime (53 ± 17 %) before CNY, well supported by the decline in their contribution to HONO during the COVID-19 lockdown. We found that the heterogeneous conversion of NO2 on ground surfaces was an important nighttime source of HONO (31 ± 5 %), while that on aerosol surfaces was a minor source (2 ± 1 %). Nitrate photolysis became the most important daytime source during the COVID-19 lockdown compared with that before CNY, resulting from the combined effect of the increase in nitrate and the decrease in NO. Our results indicate that reducing vehicle emissions should be an effective measure for alleviating HONO in Beijing.
- Article
(2129 KB) - Full-text XML
-
Supplement
(1373 KB) - BibTeX
- EndNote


As the most vital oxidant in the troposphere, OH radicals not only govern the sink of most trace compounds but also affect the production of secondary pollutants by initiating photochemical reactions in the atmosphere. Nitrous acid (HONO) is an important primary precursor of OH radicals (Kulmala and Petäjä, 2011; X. Zhang et al., 2023). Photolysis of HONO can contribute 60 % (Tan et al., 2018) and sometimes even 92 % (Xue et al., 2020) to OH production in the morning. Therefore, HONO can indirectly promote the formation of both secondary aerosols (J. Zhang et al., 2019a) and ozone (J. Zhang et al., 2022). In addition, HONO can react with histamine to form carcinogens, such as nitrosamines, after entering the human body (Farren et al., 2015). Thus, understanding the sources of HONO in the atmosphere has been a hot topic for several decades, but it is still far from closed (Jiang et al., 2022). Intensive studies have been carried out on HONO measurements and source analysis (Y. Liu et al., 2020a, b; Zheng et al., 2020; Zhang et al., 2020; Xue et al., 2020; J. Zhang et al., 2019a; Y. Liu et al., 2019). The concentrations of HONO in the atmosphere range from a few parts per trillion (ppt) in remote areas (Spataro et al., 2016) to several parts per billion (ppb) and even several tens of ppb in heavily polluted areas (Y. Liu et al., 2019, 2020a, b; Zheng et al., 2020).
The sources of atmospheric HONO consist of direct emissions and secondary formation in the atmosphere. Direct emissions include soils, biomass burning, vehicles, indoor air, and livestock farming. Soil emissions, which depend on soil types, microorganisms, water content, temperature, and pH (Kulmala and Petäjä, 2011; Weber et al., 2015; Kim and Or, 2019), are important sources of HONO. Biomass burning often occurs in the summer and autumn when wheat or corn is harvested and wildfires are common (J. Zhang et al., 2019b; Sun et al., 2017, 2018; Peng et al., 2020). Vehicle emissions are considered an important source of HONO in traffic-intensive areas (Kramer et al., 2020; Li et al., 2021). This source is more important at nighttime compared with daytime (L. Zhang et al., 2016; Fu et al., 2019; Y. Liu et al., 2020b). Recently, indoor emissions have also been proposed as a potential HONO source (Xue, 2022), which is related to ventilation from high HONO concentrations in indoor air to low HONO concentrations in outdoor air (J. Zhang et al., 2019b). Livestock farming is a previously overlooked source of HONO, especially in agricultural areas.
Secondary formation of HONO includes gas-phase reaction between NO and OH radicals; photolysis of particulate nitrate; and heterogeneous reaction of NO2 on ground and particulate matter surfaces, including photochemical heterogeneous reaction of NO2. Gas-phase reaction between NO and OH, photolysis of nitrate particles, and light-enhanced conversion of NO2 are the main daytime sources of HONO (Y. Liu et al., 2019, 2020b; X. Zhang et al., 2022). Furthermore, acid replacement processes may be a non-negligible source of daytime HONO in locations affected by soil-borne mineral dust deposition (VandenBoer et al., 2014). The heterogeneous reaction of NO2 on various surfaces is widely regarded as an important source of HONO (Han et al., 2016; J. Liu et al., 2020b).
Table S1 in the Supplement summarizes the sources of HONO at various locations. The type of observation site often has a great impact on the source intensity and contribution proportion of each source of HONO. In natural ecological areas or Antarctic stations with little human activity, the photolysis of nitrate is the main source of HONO during the day, and its contribution is much higher than the homogeneous reaction of NO and OH (Bond et al., 2023; Tang et al., 2024). In the ocean or areas close to the sea, the heterogeneous transformation of NO2 becomes the main source of HONO, and the transformation on the aerosol surface may be more important than that on the ground (Xing et al., 2023). In smoke collected near wildfires, it was found that the heterogeneous conversion contribution of NO2 can reach 85 %, making it the most important source of HONO (Chai et al., 2021). Emissions from soil and biological soil crusts are important in some areas where vegetation and soil are exposed (Meusel et al., 2018). For three different types of observation sites – rural, suburban, and urban – the relative importance of sources is also obviously different. In rural areas, there are usually no traffic activities, and these areas are mainly affected by agricultural activities and animal husbandry, so traffic emissions can be ignored. During periods of intensive agricultural activity, soil emissions are the main source of HONO, accounting for up to 80 % (Y. Liu et al., 2019b), When there is little agricultural activity, the reaction of NO and OH and the heterogeneous transformation of NO2 on the ground become the two main sources in rural areas (Xue et al., 2020; Song et al., 2022), accounting for up to 70 %. In rural areas with developed animal husbandry, its direct emissions can contribute 39 % to 45 % of HONO (Q. Zhang et al., 2023). Suburbs are mostly covered by vegetation, with a small number of villages nearby. The heterogeneous conversion of NO2 is the main source of HONO, which can comprise 70 % of HONO sources (Fu et al., 2019; Ye et al., 2023). For highways, tunnels, and urban areas with heavy traffic, traffic emissions usually dominate HONO sources, accounting for 40 % to 80 % of HONO sources (Xu et al., 2015; W. Zhang et al., 2019; Y. Liu et al., 2020b; Kramer et al., 2020). In some ordinary urban areas where traffic activities are not so intensive, the heterogeneous conversion of NO2 and the reaction of NO and OH are the main sources of HONO in addition to traffic sources. It can be seen that the relative importance of different sources is often affected by the type of emission source near the observation site.
Although intensive studies have been performed on HONO sources, the contributions of different sources are still controversial (Zhou et al., 2011; Liu et al., 2014; Wu et al., 2019; Kramer et al., 2020; Meng et al., 2020). For the same type of observation area, the contribution of each source still diverges in different studies. For example, in mixed residential, commercial, and traffic areas, the importance of traffic emissions varies greatly. In some studies, it accounts for as much as 50 % (Y. Liu et al., 2020b; J. Zhang et al., 2019; Tong et al., 2016), while in some studies, it can be ignored (Zhang et al., 2020). A similar situation exists for the heterogeneous conversion of NO2. Some studies suggest that this process is not important (Tong et al., 2015; W. Zhang et al., 2019; X. Zhang et al., 2022), while some studies indicate that it can contribute at least 70 % of HONO (Meng et al., 2020; Zhang et al., 2020; Jia et al., 2020). It should be noted that the contribution of NO2 heterogeneous reaction to HONO greatly depends on the choice of the NO2 uptake coefficient (), which varies from 10−8 to 10−4 in different studies (Meng et al., 2020; J. Liu et al., 2020b; Ge et al., 2019; Y. Liu et al., 2015, 2020b). Vehicle emissions also have similar characteristics because the HONO emission rate strongly depends on the emission factor, i.e., the ratio of HONO NOx (Kramer et al., 2020; Kurtenbach et al., 2001; W. Zhang et al., 2019), which ranges from 0.03 % to 2.1 % (Liao et al., 2021). For other HONO sources, the relative importance is affected by many parameters, such as reaction kinetics for photolysis of nitrate, OH concentrations for homogeneous reaction between NO and OH, emission fluxes for soil emissions, and so on. Thus, the HONO budget still has large uncertainty. In particular, how to prove the importance of a specific reaction pathway or a source of atmospheric HONO is an open question.
Special events taking place on large spatial scales provide us with an alternative opportunity to disclose the mysteries of the HONO budget because of obvious and potentially large changes in some HONO sources. During the Spring Festival (Chinese New Year) in 2020, the lockdown measures during the new coronavirus disease (COVID-19) pandemic led to a significant reduction in primary emissions from traffic and industries. The magnitude and speed of changes in air pollutant emissions have been considered the largest changes in the history of modern atmospheric chemistry (Kroll et al., 2020). We conducted continuous field observations of HONO and other air pollutants from 1 January to 6 March 2020, in downtown Beijing, aimed at understanding the changes in HONO concentrations and sources during the lockdown period compared to the preceding period.
2.1 Field measurements
Observations were carried out at the Aerosol and Haze Laboratory, Beijing University of Chemical Technology (AHL/BUCT), which has been described in our previous work (Y. Liu et al., 2020b). Briefly, it is located on the west campus of BUCT, around 550 m from the west 3rd Ring Road of Beijing, which is a typical urban observation site. The station is on the rooftop of a five-story building (about 18 m from the ground). HONO was measured with a homemade water-based long-path absorption photometer (LOPAP; Institute of Chemistry, Chinese Academy of Sciences), which has been deployed in field observation studies (Tong et al., 2016; Chen et al., 2020) and has been proven to be a stable and credible instrument for HONO measurements (Crilley et al., 2019). The principle of this instrument is similar to that of a commercial LOPAP (QUMA). Briefly, gas-phase HONO absorbed by deionized water (≥ 18.2 MΩ) in a stripping coil reacts with N-(1-naphthyl)ethylenediamine dihydrochloride (0.077 mmol L−1) in an acidic solution (2 mmol L−1 sulfanilamide in 0.12 mol L−1 HCl) to form an azo dye, which is measured at 550 nm with a spectrometer equipped with an LWCC (liquid waveguide capillary cell, LWCC-3250, WPI, USA). The sampling rate was 1 L min−1, controlled by a flow meter and a diaphragm pump. The flow rate of absorption liquid was 0.5 mL min−1, controlled by a peristaltic pump. The limit of detection of the LOPAP was 0.01 ppb for a sampling duration of 60 s. The instrument was calibrated with nitrite standard solution before and after each measurement about every 3 weeks and calibrated by zero air every 24 h to check zero drift. An overestimation of HONO concentration (6.7 %), calibrated in control experiments with 100 ppb of NO2 at 50 % relatively humidity (RH) due to the interference of NO2 in the sampling inlet (about 30 cm of Teflon tube), was accounted for when we calculating the HONO concentrations in this work.
A set of commercial analyzers for NOx, SO2, CO, and O3 (Thermo Fisher Scientific 42i, 43i, 48i, 49i) were also available. Notably, the NO2 measured by 42i includes HONO, and we have corrected it. PM2.5 was measured using a tapered element oscillating microbalance (TEOM; Thermo Fisher Scientific, 1405). The chemical composition of non-refractory PM2.5 (NR-PM2.5) was measured using a time-of-flight aerosol chemical speciation monitor (ToF-ACSM, Aerodyne). Meteorological parameters including temperature, RH, pressure, wind speed and direction, and ultraviolet radiation (A and B) were measured using an automatic weather station (AWS310 at the AHL/BUCT station, Vaisala). The planetary boundary layer (PBL) height and visibility were measured using a ceilometer (CL51, Vaisala) and a visibility sensor (PWD22, Vaisala), respectively. The photolysis rate () was measured via a continuous measurement of the actinic flux in the wavelength range of 285–375 nm using a filter radiometer (2-pi- radiometer, Metcon). All instruments used in the measurement as well as their detection limits are shown in Table S2.
2.2 HONO budget calculation
Potential sources of HONO include direct emissions (vehicle emissions, soil emissions, indoor emissions, biomass combustion), the gas-phase reaction between NO and OH radicals, the photolysis of nitrate in particulate matter, and the heterogeneous reaction of NO2 on the ground and particulate matter surfaces. The sources include vehicle emissions (Evehicle), soil emissions (Esoil), the reaction of NO and OH (PNO-OH), the photolysis of particulate nitrate (Pnitrate), and the heterogeneous reaction of NO2 (Paerosol and Pground). At present, there are relatively few studies on indoor emissions. Biomass combustion is an unimportant HONO source in downtown Beijing in winter according to a previous study (J. Zhang et al., 2019). Thus, these two sources are not accounted for in this work. The major sinks of HONO, including dry deposition (Ldeposition), the homogeneous reaction with OH radicals (LHONO-OH), photolysis (Lphotolysis), and vertical and horizontal transport (Ttrans), are considered.
The calculation method and details of parameterization are shown in Table 1. Briefly, the budget and estimated concentration of HONO can be calculated according to the following equations:
where is the change rate of HONO mixing ratios (ppb h−1), is the estimated concentration of HONO at time t2, and is the observed concentration of HONO at time t1. Given that the result of the potential source contribution function (PSCF; Fig. S2), the source distribution of HONO from before the Chinese New Year (BCNY) to COVID-19, was highly similar and the trend of HONO was similar (Pearson's r=0.78) between BUCT and the Institute of Atmospheric Physics (IAP; 8 km away from BUCT), the steady-state analysis on HONO is applicable and reasonable even though the lifetime of HONO is several minutes in the atmosphere. In addition, the instrumentation time resolution of LOPAP was 6 s. We calculated the variation coefficient for the datasets with different time resolutions, i.e., 1 h vs. 6 s. A small variation coefficient of ∼ 0.02–0.05 implies that a small uncertainty in the HONO budget might result from the lifetime of HONO. Thus, we think the possible uncertainty should not have a large influence on our conclusions when the budget is compared at a fixed site between two different periods. The input parameters for the parameterization scheme are detailed in Table S3. (M0 represents the base case's parameterized input. M1–M20 correspond to the sensitivity analysis of different parameterization schemes in the HONO budget analysis.)
The emission rates (EHONO, ppb h−1) of soil and vehicles were calculated based on the emission flux (FHONO, g m−2 s−1), the PBL height (H, m), and the conversion factor (α, g m−3 s−1 to ppb h−1). For vehicle emissions, according to our previous research at the same site, the emission factor (EF; HONO NOx) was selected as 1.09 % (Y. Liu et al., 2020b), which is comparable to the actual values in Hong Kong SAR (1.2 ± 0.4 % and 1.24 ± 0.35 %) (Liang et al., 2017; Xu et al., 2015), Guangzhou (1.0 %) (Li et al., 2012), Beijing (1.3 % and 1.41 %) (W. Zhang et al., 2019; Meng et al., 2020), and other places. For secondary formation, the calculation of the production rate (PHONO, ppb h−1) is shown in Table 1, in which k1 is the rate constant of the quasi-first-order reaction (s−1). For the heterogeneous reaction of NO2, we calculated the conversion rate in the light of Eqs. (3)–(5):
where khet is the quasi-first-order rate constant of the transformation to HONO (s−1) and and are the reaction rate constants based on corrected HONO concentrations and those normalized to CO concentrations, respectively (Zhang et al., 2020). To decrease the contribution of boundary layer height variation in the khet calculations, we normalized HONO concentration to CO concentration at the same level as reported in the literature (W. Zhang et al., 2019; Li et al., 2012). and are the mean concentration of NO2 and CO from t1 to t2. COt and NO2,t are mixing ratios of CO and NO2, respectively, at the measuring time t. HONOcorr,t (ppb) is the HONO concentration corrected after subtracting the primary emissions (including vehicle and soil emissions and the HONO produced by the homogeneous reaction of NO and OH and the photolysis of nitrate) at the measuring time t according to Eq. (6):
It is worth noting that “HONOcorr' accounted only for vehicle exhausts in previous HONO budget studies. This may overestimate the contribution of heterogeneous reactions to HONO sources because other emission sources and homogeneous reactions should also contribute to HONO.
Meanwhile, when estimating the upper limit of the contribution of heterogeneous reactions, we take a small conversion factor (HONO NOx) of 0.4 % as the lower limit of vehicle emissions, in contrast to the normal value of 1.09 % (Y. Liu et al., 2020b). We normalize the caused by the vehicle with the measured NOx during the observations. This method has also been widely used in previous studies (Y. Liu et al., 2019a; Li et al., 2018). In addition, soil emissions are calculated using the lower limit (Oswald et al., 2013). The mean value of khet during the BCNY period was 0.0051 h−1, and it was 0.006 h−1 in the COVID-19 lockdown, which is consistent with previous studies, such as in Jinan (0.0068 h−1) (Li et al., 2018) and Shanghai (0.007 h−1) (Wang et al., 2013), while it was less than those in Shijiazhuang (0.016 h−1) (Y. Liu et al., 2020a), Kathmandu (0.014 h−1) (Yu et al., 2009), and Guangzhou (0.016 h−1) (Qin et al., 2009).
Table 1Summary of parameters for HONO sources and sinks.
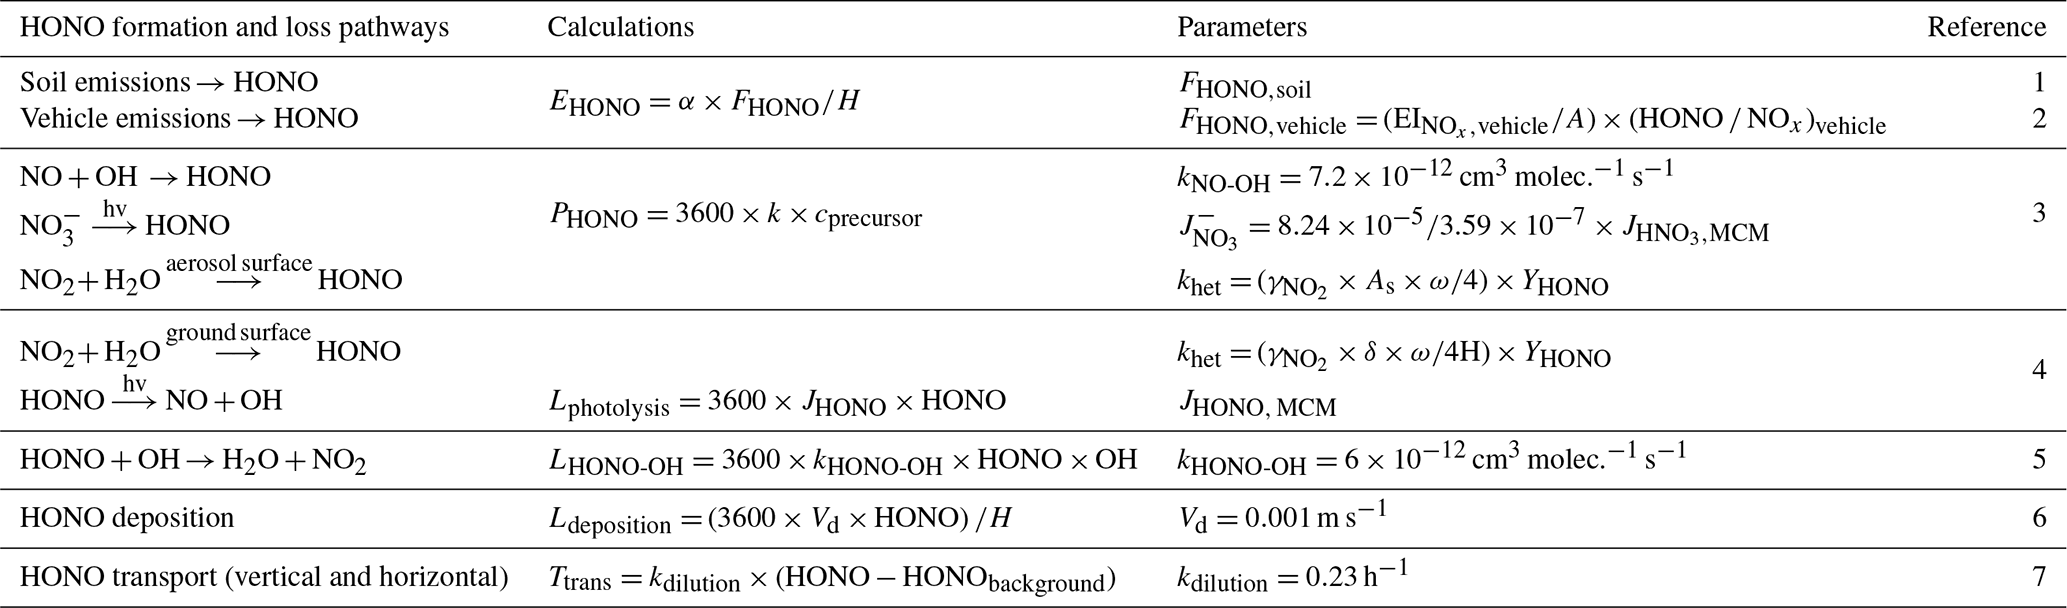
FHONO,soil (soil emission flux) was calculated by the temperature-dependent HONO emission flux on grasslands with a water content of 35 % to 45 %. A is the urban area of Beijing, and EI is the emission inventory of NOx from vehicles (g s−1). The calculation of the HONO emission flux, during the BCNY period, was based on the hourly NOx emission inventory of Beijing vehicles ( × (HONO NOx)vehicle), while during COVID-19, it was combined with the hourly average traffic index (https://jiaotong.baidu.com/congestion/city/urbanrealtime/, last access: 26 July 2024). The (HONO NOx)vehicle value was selected as 1.09 % (Y. Liu et al., 2020b); cprecursor is the concentration of the precursor (ppb). The OH concentration was estimated using the same method as in the previous study (Y. Liu et al., 2020a). The mean photolysis frequency of nitrate () was normalized to the measured UV light intensity. As is the surface area concentration of the reaction surface (m2 m−3); ω is the average molecular velocity (m s−1); γ is the uptake coefficient of the precursor, assumed to be 2 × 10⁻⁶; YHONO is the yield of HONO. δ is the surface roughness; in this study, we used 3.85 for our calculation (Y. Liu et al., 2020b). HONO and HONObackground are the HONO concentrations at the observation site and background site, respectively. JHONO is simulated in a box model using data observed at our site. References: (1) Oswald et al. (2013), (2) Yang et al. (2019), (3) Y. Liu et al. (2020a), (4) Y. Liu et al. (2020b), (5) Kanaya et al. (2007), (6) X. Han et al. (2017), and (7) Dillon et al. (2002).
We further derived the uptake coefficient of NO2 () on both ground and particle surfaces according to Eq. (7).
The calculated ranged from to . Therefore, we chose to calculate the heterogeneous yield of HONO, which is comparable with those values derived in urban environments like Jinan () (Li et al., 2018) and the laboratory experiments (10−7 to 10−6) (Han et al., 2013; Stemmler, 2007; C. Han et al., 2017) on different particles but lower than the uptake coefficient of 10−5 reported in other studies (Zhang et al., 2020; Ge et al., 2019).
The OH concentration was calculated according to Eq. (8), which is based on the function of the photolysis rates (J) of O3 and NO2 and on the NO2 mixing ratio (NO2).
Notably, this parameterization scheme was developed based on measurements at rural sites (Ehhalt and Rohrer, 2000), where NOx concentrations were lower than in urban environments. Alicke et al. (2002) found that OH concentrations estimated with this scheme were in good agreement with those calculated according to a pseudo-steady-state method during the pollution period in urban environments (such as Milan), although some uncertainty was expected. In our previous study (Y. Liu et al., 2020b), we also found that the estimated OH concentrations using this method were comparable with those observed values in the North China Plain (Tan et al., 2019). Thus, daytime OH concentrations estimated using this method should be credible overall although the uncertainty is inevitable. The nocturnal OH concentration in northern China generally varied from 1.0 × 10⁵ molec. cm−3 (Ma et al., 2019; Tan et al., 2018) in winter to 5 × 10⁵ molec. cm−3 in summer (Tan et al., 2017, 2020). We further parameterized the nocturnal OH concentrations according to atmospheric temperature to reflect the seasonal variations in OH concentration. Figure S3 summarizes the observed OH concentrations in the North China Plain. The results estimated in this study are slightly lower than those observed in Wangdu (rural) but almost consistent with those in Beijing (urban) and Huairou (suburb). In summary, we should be optimistic about the estimation of OH concentration. Then a sensitivity analysis was performed to understand the influence of the uncertainty in OH concentration on HONO sources, as discussed in Sect. 3.3.
The loss rate of HONO, including dry deposition (Ldeposition), homogeneous reaction with OH radicals (LHONO-OH), photolysis (Lphotolysis), and vertical and horizontal transport (Ttrans), was calculated using the equations shown in Table 1, where JHONO is the photolysis rate of HONO (s−1), kHONO-OH is the second-order reaction rate constant between HONO and OH, Vd is the dry deposition rate of HONO, and Kdilution is the dilution rate (including both vertical and horizontal transport). The details are described in our previous work (Y. Liu et al., 2020a, b).
Oracle Crystal Ball (version 11.1.2.4, Oracle's software for modeling, prediction, simulation, and optimization) (Rahmani et al., 2023) was used to evaluate the overall uncertainty in the parameterization through Monte Carlo simulations. The details are shown in Sect. S2 in the Supplement.
3.1 Air quality during observations
Figure 1 shows the time series of the concentration and relative proportion of non-refractory components in PM2.5, trace gases (SO2, O3, CO, NO, NO2, and NOx) and meteorological parameters (temperature, RH, and pressure). We divide the sampling period into two sub-periods, i.e., P1 from 1 to 24 January 24 (BCNY, before the Chinese New Year) and P2 from 25 January to 6 March (COVID-19 lockdown).
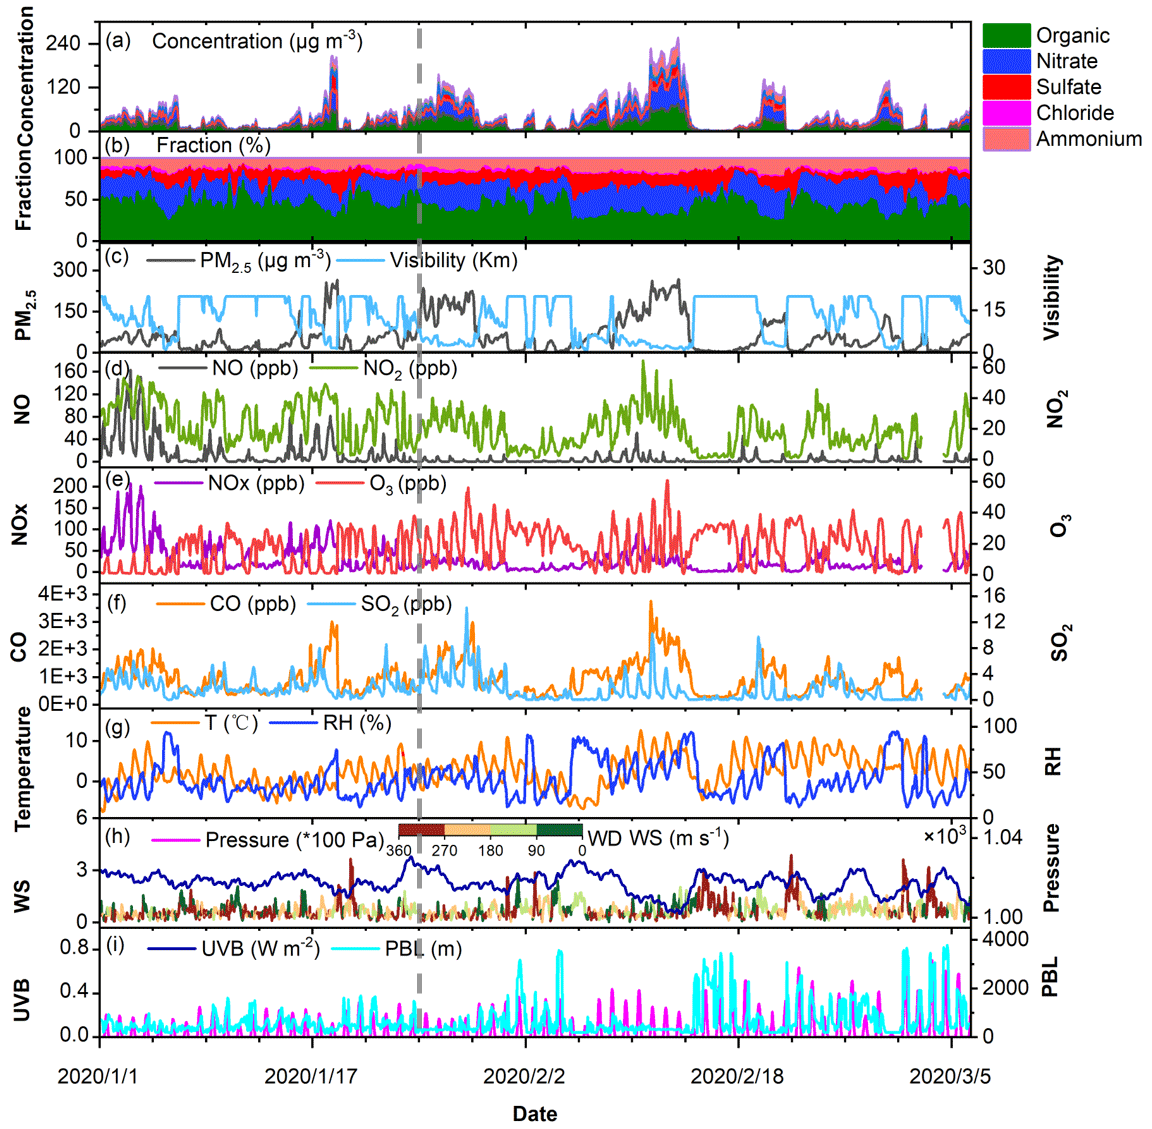
Figure 1An overview of the measurement of the mass concentrations of the different components of non-refractory PM2.5 (NR-PM2.5), the mass fraction of the individual components, PM2.5, meteorological parameters, NOx (NO, NO2), O3, CO, and SO2 with hourly time resolution from 1 January to 6 March 2020. Meteorological parameters consist of visibility, PBL heights, ultraviolet B (UVB), wind speed (WS), wind direction (WD), pressure, RH, and temperature. The observations are divided into two phases (P1: 1–24 January 2020; P2: 25 January–6 March 2020). The date is given in the format year/month/day.
It can be seen from Fig. 1 that during P1, there was only one heavy pollution incident lasting 1 to 2 d, while there were two serious pollution events lasting more than 2 d (PM2.5 >75 µg m−3) in the P2 stage. Table S4 summarizes the statistical results of the wind speed, PM2.5, RH, T, HONO, trace gases, and NR-PM2.5 for the entire measurement period. During P1, the measured concentration of PM2.5 varied between 0.2–288 µg m−3 and the mean concentration was 47.2 ± 44.5 (mean ± 1σ) µg m−3. In contrast, they were 0.3–258 µg m−3 and 69.9 ± 67.2 µg m−3, respectively, during P2. The mean concentrations of NOx decreased significantly (P<0.05) from 45.35 ± 38.86 ppb in P1 to 19.44 ± 14.42 ppb in P2, dropping by about 57 %. This is close to the reduction amplitude (50 %) reported by P. Wang et al. (2020) but lower than that (76 %) proposed by Lv et al. (2020). In particular, the NO mean concentrations dropped from 18.42 ± 29.24 ppb (ranging from 0.03 to 163 ppb) in P1 to 2.4 ± 5.46 ppb (ranging from 0.01 to 51 ppb). The average hourly concentration of NO2 in the P1 phase was 26.9 ± 13.4 ppb, while it was 17.18 ± 11.3 ppb in P2. The NO2 concentration dropped by about 36 % from P1 to P2, which is similar to the recently reported findings (ranging from 36 % to 53 %) (Zhao et al., 2020; Y. Wang et al., 2020; J. Wang et al., 2021). According to the emission inventory of NOx, traffic and industry contributed 46.7 % and 31.3 % to NOx emissions in Beijing, respectively (Zheng et al., 2014). This means the decrease in NOx concentration should be explained by reductions in both traffic and industrial emissions (Lv et al., 2020; P. Wang et al., 2020; Zhao et al., 2020). In particular, traffic emissions during P2 should play an important role in local NO reduction. However, as the temperature and ultraviolet light irradiation increased and the NOx concentration decreased (Kroll et al., 2020; Le et al., 2020), the average concentration of O3 during P2 was 21.31 ± 11.73 ppb, which was significantly (P<0.05) higher than 12.16 ± 10.79 ppb during P1. This result is similar to the 71.4 % increase in O3 in Shijiazhuang during the same period (Y. Liu et al., 2020a). The concentrations of SO2 were in the range of 0.02–8.56 ppb, with a mean value of 2.09 ± 1.35 ppb in P1, while they varied from 0.01 to 14.23 ppb, with a mean concentration of 1.49 ± 1.99 ppb, during P2, suggesting a slightly decreased contribution of coal combustion during P2 (Fig. 1i). This is similar to that reported by Cui et al. (2020) and Shen et al. (2021). In addition, it can be seen from Fig. 1 that the change trends of PM2.5 and CO are synchronized, which also means that both primary emissions and secondary generation contribute to the accumulation of PM2.5 concentration (Y. Liu et al., 2020a).
It is worth noting that changes in atmospheric pollutant concentrations are affected by both emissions and meteorology. Especially during the lockdown period, meteorological conditions in Beijing were not conducive to the dispersion of pollutants, and thus the impact of meteorological conditions on the concentration of these pollutants needs to be assessed. We use the random forest algorithm of machine learning to remove the influence of meteorology from air quality time series data by a deweathering method. The details are present in Sect. S1 in the Supplement. The model performs well in predicting the concentrations of pollutants compared to the observations in both the training and the test datasets (Table S5). The concentrations of and relative changes in each pollutant after deweathering are recorded in Table S6. The PM2.5 concentration after deweathering increased significantly from 45.22 ± 28.56 in P1 to 67.92 ± 57.97 µg m−3 in P2 at a confidence level of 0.05, with an increase of 50.2 %. The mean concentration of HONO was 0.89 ± 0.37 ppb in P1, while it decreased to 0.51 ± 0.25 ppb in P2, with a drop of 42.7 %. The concentrations of NO and NO2 significantly decreased from 15.44 ± 18.40 and 23.28 ± 7.28 ppb in P1 to 3.24 ± 2.05 and 16.43 ± 5.98 ppb in P2, respectively, decreases of 79.0 % and 29.4 %, respectively; SO2 decreased from 2.27 ± 0.69 in P1 to 1.48 ± 1.18 ppb in P2, a decrease of approximately 34.8 %; CO increased from 823.60 ± 318.92 in P1 to 896 ± 488.29 ppb in P2 (an increase of 8.79 %), and O3 increased from 16.98 ± 5.62 to 22.60 ± 4.10 ppb, an increase of about 33.1 %, which was much lower than the change range of observed values (75.1 %). As shown in Table S6, meteorological conditions have a significant impact on O3 concentration. The impact was +39.6 % and +6.2 % in P1 and P2, respectively. The impact of deweathering on NO in the two periods was −16.2 % and +32.8 %, respectively. It was −13.8 % and −4.8 %, respectively, for NO2. However, the changes in other species in the two periods after deweathering fluctuated between 2.3 % and 7.8 %. This implies that meteorological conditions have an important impact on the concentrations of NO and O3, while meteorological factors have little impact on HONO, SO2, CO, and PM2.5.
It can be seen from Fig. 1 combined with Table S4 in Supplement that all the major components of PM2.5, including sulfate, nitrate, ammonium, chloride, and organic aerosol, increased obviously in P2 compared to P1. Throughout the entire observation period, organic matter and nitrate dominated the composition of PM2.5. The proportion of nitrate in inorganic salts increased to 31.2 % in P2, up from 28.1 % in P1. Although the sulfate concentration increased, its proportion within inorganic salts slightly decreased on haze days, from 16.5 % in P1 to 15.2 % in P2. Thus, the ratio of NO to SO during pollution events increased significantly from 1.76 in P1 to 2.10 in P2 (P<0.05). This is similar to previous findings reported by Sun et al. (2020). These findings suggest that the decrease in anthropogenic emissions during P2 resulted in a significant reduction (after the t test, it is significant at a confidence level of 0.01) in gas precursors (Table S4), but it did not lead to a corresponding reduction in secondary aerosol species during periods of pollution. This is supported by the increased potential of secondary aerosol formation under pollution conditions (Sun et al., 2020). For example, higher values of the SOR (sulfur oxidation ratio, i.e., the molar fraction of sulfate in total sulfur including sulfate and SO2) and NOR (nitrogen oxidation ratio, i.e., the molar fraction of nitrate in total nitrogen, including nitrate and NO2), i.e., 0.63 and 0.34, were observed in P2 compared to those (0.48 and 0.14) in P1. Under stagnant weather conditions (wind speed < 2 m s−1), higher temperatures and RH as shown in Table S4 might facilitate the conversion from precursors into particles (Y. Liu et al., 2020b). The above results indicate that the air pollution dominated by secondary formation is much more serious in P2, which is supported by both the increased concentration and the greater number of pollution days in P2 than in P1, even though primary emissions decreased obviously.
3.2 Influence of the Chinese New Year and the COVID-2019 epidemic event on HONO concentration in Beijing
Figure 2 displays the time series of the HONO concentration, the HONO NO2 ratio, and the traffic index (https://jiaotong.baidu.com/congestion/city/urbanrealtime/, last access: 26 Jul 2024). In Fig. 2b, there is a significant decrease in the traffic index (P<0.05), indicating reduced traffic congestion during the COVID-19 lockdown (P2) compared to P1. The HONO NO2 ratio is frequently used to indicate the conversion of NO2 to HONO through heterogeneous reactions (Sun et al., 2013). A higher HONO NO2 ratio indicates that the heterogeneous conversion process plays a more significant role in HONO production. However, as depicted in Fig. 2b, both the traffic index and HONO exhibit a similar decreasing trend, while the HONO NO2 ratio remains relatively stable. Notably, both the traffic index and the NO concentration experienced a steep decline after 24 January, coinciding with a significant decrease (P<0.05) in HONO concentration. Furthermore, as shown in Fig. S4, there is a strong correlation between HONO and NOx in both P1 and P2. However, HONO concentration does not track PM2.5 concentration well. These results imply that HONO might be more influenced by vehicle emissions than by heterogeneous reactions on aerosol surfaces. This contrasts with prior studies indicating that heterogeneous reactions on aerosol surfaces are the primary source of HONO in pollution events in Beijing (Liu et al., 2014; Cui et al., 2018; Meng et al., 2020).
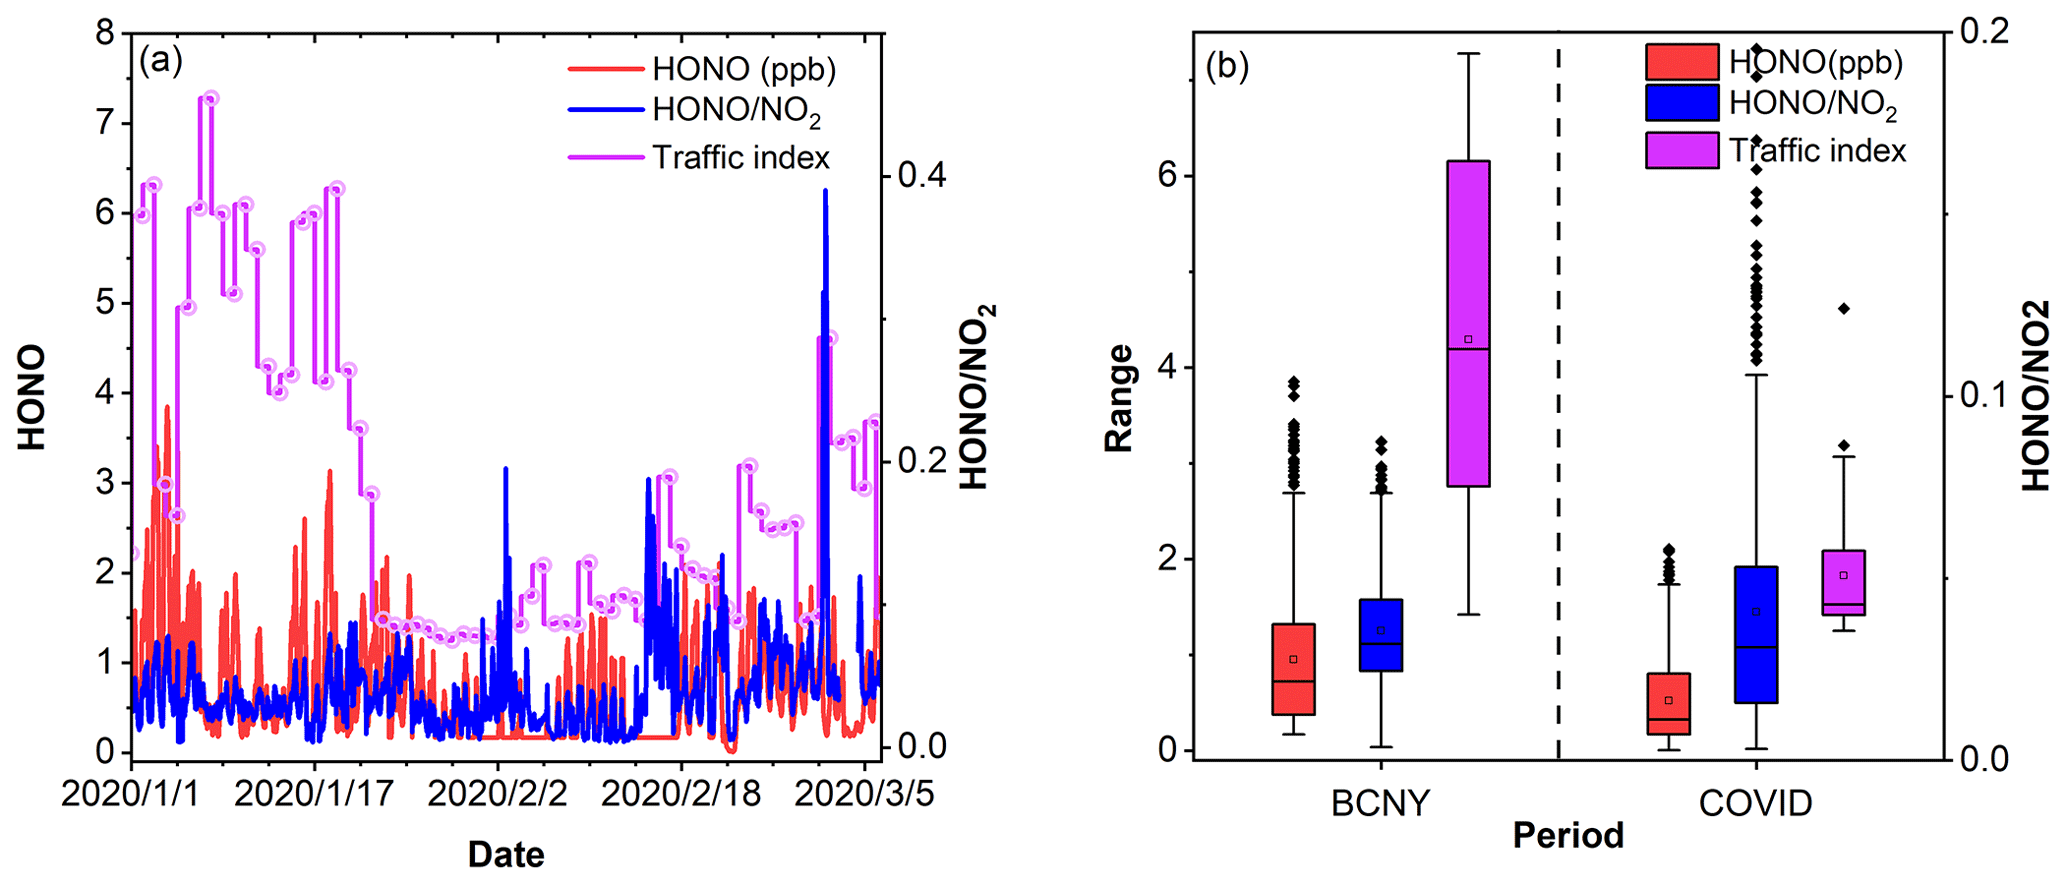
Figure 2(a) Times series of HONO, the traffic index, and HONO NO2. (b) Box plots of HONO, HONO/NO2, and the traffic index in Beijing during different periods (BCNY denotes P1; COVID denotes P2). The date in (a) is given in the format year/month/day.
Table S7 summarizes the mean concentrations of HONO, NO2, NO, and PM2.5 over the two periods in this study as well as the data reported in previous studies. During P1, HONO concentration ranged from 0.17 to 3.85 ppb, with a mean value of 0.97 ± 0.74 ppb. This concentration is similar to previous observations, such as in Beijing, Xi'an, Jinan, Shanghai, Hong Kong SAR, and Rome, which all ranged from 0.95 to 1.15 ppb (Acker et al., 2006; Wang et al., 2013; Xu et al., 2015; Huang et al., 2017; Y. Liu et al., 2020b; Li et al., 2018). However, during the COVID-19 lockdown, the HONO concentration decreased to 0.53 ± 0.44 ppb, representing a drop of 45.3 % compared with that in the BCNY period. After deweathering, the HONO concentration decreased significantly from 0.89 ± 0.37 in P1 to 0.51 ± 0.25 ppb in P2 at a confidence level of 0.05, with a decrease of 42.7 %. This means that meteorology has little impact on HONO. This value is comparable to the concentrations reported in the literature on clean days in December 2016 in Beijing (0.5 ± 0.2 ppb) and in the winter of 2018 in Xiamen (0.52–0.61 ppb). At the same time, as discussed in the previous section, the NO concentration decreased by nearly 87 % from BCNY to the COVID-19 lockdown, and the NO2 concentration dropped by about 36 %. Consequently, we can conclude that the concentrations of HONO, NO, and NO2 were the most affected pollutants during the COVID-19 lockdown period.
Figure 3 shows the diurnal curves of HONO, NOx, NO, NO2, HONO NO2, O3, SO2, and PM2.5 × NO2 during P1 (BCNY) and P2 (COVID-19 lockdown). The black and red lines represent P1 and P2, respectively. HONO shows a similar trend in both periods. After sunset, HONO began to accumulate due to the attenuation of solar radiation and the development of the boundary layer, reaching maximum values of 1.41 ± 0.83 and 0.92 ± 0.64 ppb at around 07:00 local time (times are in local time throughout the work) during P1 and P2, respectively. Subsequently, due to the impact of the boundary layer and rapid photolysis, the HONO concentration gradually decreased and remained at a low level until sunset, with the corresponding minimum value of 0.43 ± 0.24 and 0.27 ± 0.17 ppb at about 15:00. Similarly to HONO, the NO2 concentration shows an upward trend during the morning rush hour. Its peak appeared at 07:00 (BCNY: 31.4 ± 9.23 ppb; COVID-19 lockdown: 23.3 ± 10.74 ppb) and then dropped rapidly and remained at a low level due to photochemical processes and the development of the boundary layer. The minimum concentration occurred at around 14:00 to 15:00 (BCNY: 18.17 ± 10.69 ppb; COVID-19 lockdown: 11.0 ± 7.64 ppb). After sunset, NO2 began to increase again. It is worth noting that during the BCNY period, both NO2 and NO exhibited a prominent evening peak, whereas there was no such evening peak during the COVID-19 lockdown. Thus, NOx and NO2 had similar changing trends, i.e., the morning peak observed in both periods with the highest mean values of 65.93 ± 50.37 and 31.7 ± 21.47 ppb in the BCNY period and COVID-19 lockdown, respectively.
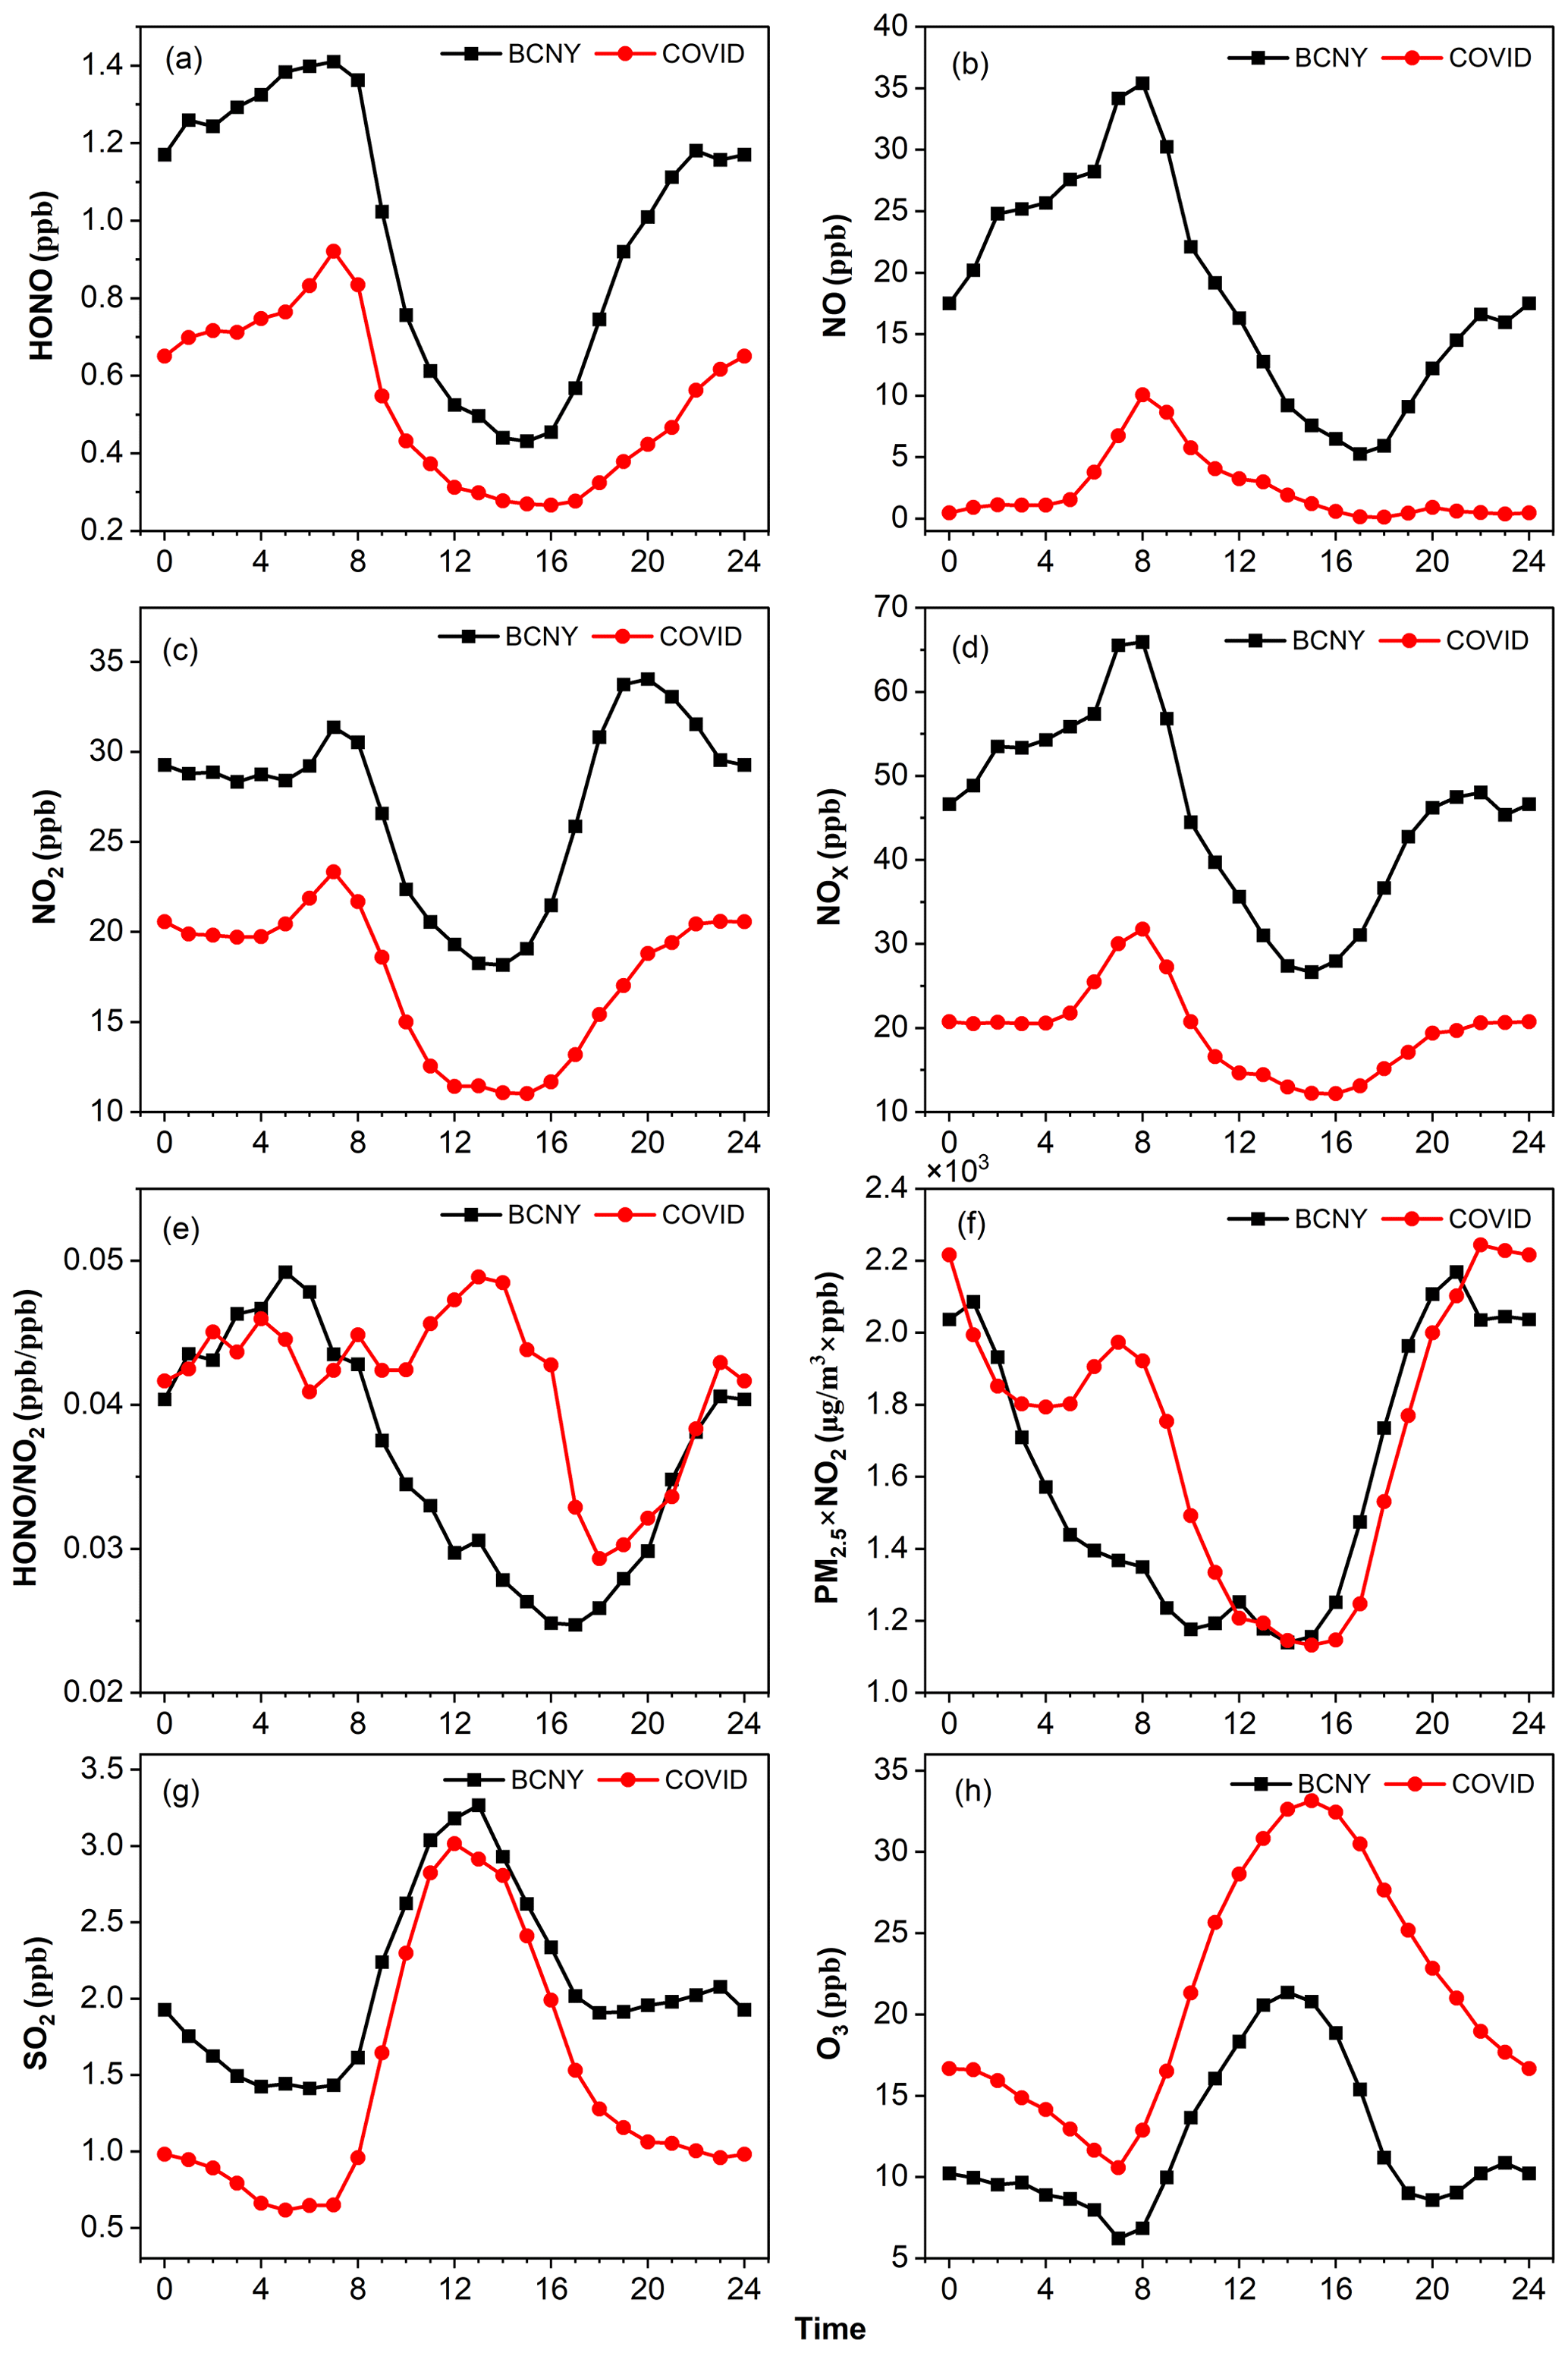
Figure 3Diurnal variation in HONO, NO, NO2, NOx, HONO NO2, PM2.5 × NO2, SO2, and O3. The black lines are the diurnal curves before CNY and the red ones are during the COVID-19 lockdown.
NO and HONO showed a similar trend in P1. They began to decline continuously after sunrise and continued to rise after sunset. The peaks of NO were 35.40 ± 43.55 and 10.0 ± 12.67 ppb in P1 and P2, respectively. It is worth noting that the upward trend of NO concentration in the afternoon of the P2 stage was not obvious, as the absolute concentration of NO was very low. O3 and HONO showed opposite diurnal curves, with the maximum O3 concentrations, which were 21.35 ± 9.31 and 33.14 ± 10.26 ppb in P1 and P2, respectively, occurring in the afternoon. SO2 and O3 exhibited similar trends, with maximum values in P1 and P2 of 3.26 ± 2.19 and 3.01 ± 3.06 ppb at 13:00 and minimum values of 1.41 ± 0.68 and 0.62 ± 0.82 ppb at 05:00 or 06:00.
Previous studies have proposed that the heterogeneous reactions of NO2 on the aerosol surface play an important role in HONO production. Specifically, this pathway has been considered the major source of HONO on polluted days (Cui et al., 2018; Meng et al., 2020; Zhang et al., 2020). PM2.5 × NO2 can be used as an indicator for the heterogeneous reaction of NO2 on the surface of aerosols (Cui et al., 2018). It was found that the value of PM2.5 × NO2 in P2 (1697 ± 2142) was slightly higher than that in P1 (1583 ± 1967). In the early morning, the product of PM2.5 and NO2 in the P2 stage was even higher than that in the P1 stage. On the other hand, the ratio of HONO NO2 is usually used to evaluate the formation of HONO during the conversion of NO2. As shown in Fig. 3e, in the P1 stage, the HONO NO2 ratio shows a similar daily trend to HONO, which began to rise after sunset and reached a peak at night and then decreased in the early morning due to the increase in NO2 concentrations and the photolysis of HONO. In the P2 stage, the variation in HONO NO2 is different from that of the P1. The HONO NO2 ratio in P2 was higher than that in the P1 stage, especially in the daytime, although the values of HONO NO2 in both stages (P1: 0.036 ± 0.016; P2: 0.041 ± 0.038) were lower than those (0.052–0.080) reported by Cui et al. (2018). Subsequently, we further analyzed HONOcorr NO2 (details shown in Sect. 2.2). The HONOcorr NO2 ratio attributed to secondary formation via heterogeneous reactions changed obviously after subtracting other secondary HONO sources. As shown in Fig. S5, the daytime peak of HONOcorr NO2 in P2 became more prominent compared with that shown in Fig. 3e, while the daytime (08:00–18:00) HONOcorr NO2 (0.022 ± 0.014) in P1 was significantly (P<0.05) lower than that in P2 (0.040 ± 0.053). However, the HONO concentration decreased significantly, as discussed above. These results suggest that heterogeneous reactions of NO2 on the aerosol surfaces may not be a major source of HONO because the enhanced potential of heterogeneous reactions indicated by PM2.5 × NO2 and HONOcorr NO2 in P2 contrasts with the decreased HONO concentrations compared to P1. In summary, we propose that during our observation period, heterogeneous reactions of NO2 should make a relatively minor contribution to HONO production.
3.3 Relative change in different sources to HONO budget in Beijing during different periods
Figure 4a–f show the diurnal variation in HONO production or emission rates for these sources at different stages, and Fig. 4g–l show the budget of the HONO sources and sinks during P1 (BCNY) and P2 (COVID-19 lockdown). The HONO production rate via homogeneous reaction between NO and OH in P1 was much higher than that in P2, especially during the daytime. The average rate decreased from 0.145 ± 0.189 ppb h−1 in the P1 stage to 0.047 ± 0.073 ppb h−1 in the P2 stage. The OH concentrations increased slightly from P1 (4.1 × 10⁵ ± 5.8 × 105 cm−3) to P2 (6.7 × 10⁵ ± 1.0 × 106 cm−3). Therefore, the observed decrease in HONO production rate via homogeneous reaction between NO and OH should be ascribed to the substantial reduction in NO concentrations, as discussed above. It can be seen that the homogeneous reaction between NO and OH is indeed an important source of HONO at night. In previous studies, the nocturnal production of HONO via NO and OH has often been ignored because low nighttime OH concentrations were estimated (Fu et al., 2019). However, some studies have shown that the observed nighttime OH concentrations in the Beijing urban area can also be maintained on the order of 105 molec. cm−3 in winter, which also means that the contribution of the reaction channels of NO and OH to HONO cannot be ignored. In the P1 stage, the homogeneous reaction between NO and OH accounted for 13 ± 5 % of the nighttime HONO sources. However, in the daytime, the homogeneous reaction between NO and OH was the most important source of HONO, which accounted for up to 51 ± 32 % of the daytime HONO source. This is consistent with previous studies in urban Beijing (Gu et al., 2021; Jia et al., 2020; J. Liu et al., 2021). Interestingly, a recent study proposed a new mechanism through smog chamber experiments; that is, NOx photooxidation (reaction of NO and adsorbed HNO3) may be an important daytime HONO source (Song et al., 2023), although this has not yet been verified in field observations. In the P2 stage, its proportion in the night was negligible due to the dramatic decrease in NO concentration during the pandemic event, and the maximal proportion of HONO sources in the daytime was also reduced to 25 ± 14 %. It is worth noting that the parameterization of OH concentration will introduce uncertainty into HONO sources. Table S3 shows the sensitivity test for the HONO simulation. An increase of 10 % and 200 % in OH concentration in M3 and M4 results in a 24 %–26 % change in the HONO source. This means that the accuracy of the OH measurement is important for understanding the source–sink balance of HONO.
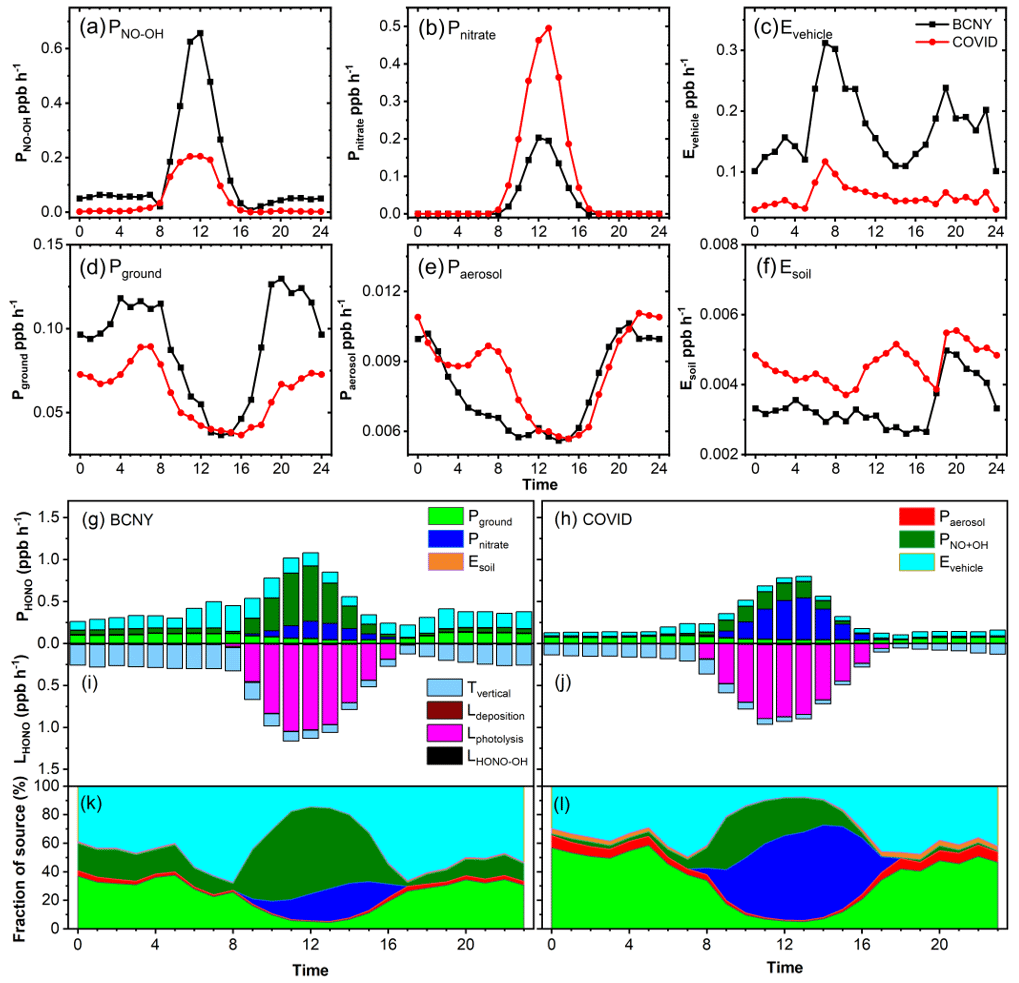
Figure 4(a–f) Diurnal variations in HONO production rate from various sources. The black lines are the diurnal curves before CNY, and the red ones are those during the COVID-19 lockdown. (g–l) Variations in the HONO budget. (g, h) Diurnal production rates of HONO; (i, j) loss rates of HONO (unit: ppb h−1); (k, l) relative contributions of each source. Panels (g), (i), and (k) show the data from BCNY, and panels (h), (j), and (l) show the data from the COVID-19 lockdown.
The daytime HONO source related to photolysis of nitrate (0.223 ± 0.175 ppb h−1) in the P2 stage was much larger than that (0.107 ± 0.068 ppb h−1) in the P1 stage. It contributed 16 ± 10 % to the daytime HONO source in P1. However, it became the most important daytime source of HONO in the P2 stage, accounting for up to 53 ± 41 %, as both the nitrate concentration and the light intensity increased significantly (P<0.05). Ye et al. (2016) reported that the photolysis rate constants of nitrate particles on the surface of different materials were in the range of 6.0 × 10⁻⁶–3.7 × 10⁻⁴ s−1. Thus, we used the lower-limit value of 6.0 × 10⁻⁶ s−1 and the upper-limit value of 3.7 × 10⁻⁴ s−1 for sensitivity tests (M9 and M10), which resulted in a change of 25 % and 95 % of HONO sources, respectively.
The direct emission rate of HONO from vehicles in the P1 stage was much higher than that in the P2 stage. The emission rate of the P1 stage was between 0.135–0.39 ppb h−1, with a mean value of 0.227 ± 0.071 ppb h−1. This is comparable with the value (0.079–0.32 ppb h−1) in the winter of 2018 (Y. Liu et al., 2020b). In the P2 stage, it decreased to 0.062–0.173 ppb h−1, with a mean value of 0.086 ± 0.027 ppb h−1. This value is slightly higher than the lower limit of vehicle emissions of 0.013–0.076 ppb h−1 estimated using an emission factor of 0.18 % in our previous study (Y. Liu et al., 2020b), while it is less than the upper limit reported by Li et al. (2018) in Jinan of 0.13 ± 0.06–0.53 ± 0.23 ppb h−1. During the lockdown, the emission rate of HONO from vehicles was reduced by 53 %–66 % when compared with that before the lockdown. In P1, vehicle emission was an important nighttime source of HONO. It contributed 53 ± 17 % to the HONO sources, much higher than heterogeneous reactions of NO2 on aerosol and ground surfaces (33 %) (Fig. S9). In the P2 stage, due to the reduction in transport, the contribution of vehicle emissions to HONO sources decreased to 40 ± 14 %, while the contribution of heterogeneous reactions of NO2 increased to 53 %. This is consistent with the observed decrease in HONO concentrations. The daytime contributions of vehicle emissions to HONO sources were lower than the corresponding nighttime contributions, while they were still higher in P1 than in P2. These results mean that vehicles should be important contributors to ambient HONO of typical emission patterns in Beijing. In the sensitivity analysis, the emission factors of 0.008 and 0.0186 were considered in M1 and M2, and 8 % and 20 % changes were found in the simulated HONO sources, respectively. The yield of soil emissions in the P2 stage is also higher than that in the P1 stage due to the temperature rise in the P2 stage because the temperature will affect the soil emission flux (Oswald et al., 2013), while the importance of this source is negligible in this study. In M15 and M16, we amplified and shrank the soil emission flux 10-fold, respectively, and the change in the simulated HONO sources was less than 5 %.
As shown in Fig. 4e, the heterogeneous reaction rate of NO2 on aerosols did not change much between the P1 and P2 stages. The average production rate of HONO in the P1 stage was 0.007 ± 0.002 ppb h−1, and it was 0.008 ± 0.002 ppb h−1 in the P2 stage, showing an increase of about 14 %. It is worth noting that the HONO formation rate from the heterogeneous conversion of NO2 on the surface of aerosols does not decrease, which is caused by the increase in PM2.5 concentrations along with a decrease in NO2 concentrations during P2. If the heterogeneous transformation of NO2 on particulate surfaces is important, especially in the case of heavy pollution, increased HONO concentrations should be expected instead of a large decrease, as observed in the P2 stage. This is consistent with the changes in HONOcorr NO2 and PM2.5 × NO2, as discussed in Sect. 3.2. For the heterogeneous transformation of NO2 on the ground and aerosol surfaces, this source is sensitive to the uptake coefficient (γ) of NO2. For the aerosol surfaces, here we assume that the upper limit of γ is 10−5 (M7) and the lower limit is 2 × 10⁻⁷ (M8) (Y. Liu et al., 2019a, 2020b). As shown in Table S3, the change in simulated HONO is less than 5 %. We reduced and magnified the surface area concentrations (As) of particulate matter by a factor of 10 in M11 and M12, respectively, and the resulting change in HONO was still less than 10 %. It should be noted that HONO is sensitive to the uptake coefficient and surface area concentrations. When the uptake coefficient is expanded 5-fold or reduced 10-fold, the absolute HONO flux attributed to heterogeneous reactions increases 5-fold or decreases 10-fold, while the relative contribution is very low due to the small absolute value of heterogeneous reactions compared with other sources.
Regarding the heterogeneous reaction of NO2 on ground surfaces, the average formation rate of HONO in the P1 stage was 0.09 ± 0.03 ppb h−1, while it was 0.06 ± 0.02 ppb h−1 in the P2 stage. This is ascribed to the significant drop (P<0.05) in NO2 concentrations during the COVID-19 lockdown. Figure 4k shows that the heterogeneous reaction of NO2 on ground surfaces is also an important nighttime source of HONO. In the P1 stage, heterogeneous reactions on both aerosol and ground surfaces explained 33 % of the nighttime HONO source. In the daytime, however, the contribution of heterogeneous reactions to HONO sources dropped rapidly. In the P2 stage, the heterogeneous reaction became the most important nighttime source, contributing up to 53 % of HONO (Fig. S9). This can be explained by the significant decrease (P<0.05) in NO and direct emissions of HONO from traffic. Similarly to heterogeneous reactions on aerosol surfaces, we assumed that the upper limit of on ground surfaces was 10−5 (M5) and the lower limit was 2 × 10⁻⁷ (M6) and that the changes in simulated HONO source were 40 % and 9 %, respectively, indicating that HONO is sensitive to the NO2 uptake coefficient on the ground surfaces. In M13 and M14, we set the surface roughness (δ) to 1 and 2.2 as reported in the literature, respectively (X. Zhang et al., 2022; Y. Liu et al., 2020a), and the simulated changes in HONO were less than 8 %.
During P1 and P2, the mean values of Tvertical were 0.195 ± 0.076 and 0.102 ± 0.048 ppb h−1, respectively. Tvertical was the main sink of HONO at night. The mean Lphotolysis, which was the main daytime sink of HONO, was 0.563 ± 0.375 and 0.442 ± 0.324 ppb h−1, respectively. The average loss rate of LHONO-OH during P1 and P2 was 0.005 and 0.004 ppb h−1, respectively. Ldeposition was 0.009 ± 0.005 ppb h−1 during P1, while it was 0.004 ± 0.003 ppb h−1 during P2. In M17 and M18, we set the lower limit of the deposition rate (Vd) to 0.00077 and the upper limit to 0.025 (W. Zhang et al., 2023), causing a change of 1 % and 24 % in the simulated HONO, respectively. In M19 and M20 at the same time, we set the dilution rate (Kdilution) to 0.1 and 0.44, resulting in a 12 % and 19 % change, respectively.
It should be noted that each source is sensitive to the corresponding parameter, as discussed above. Thus, a more restrictive criterion is required to evaluate the reasonableness of the parameterization. We further estimated the HONO concentrations according to Eq. (2) and the parameters described in Sect. 2.2 to verify these calculated sources and sinks of HONO. Figure S6 shows the time series of estimated HONO concentrations. The observed HONO concentrations are also shown for comparison. The estimated HONO concentrations were well correlated with the observed values from the perspective of both diurnal curves and the scattering point plot during the whole period (Figs. S7 and S8) although the estimated HONO concentrations were slightly lower than the observed values at noon, as shown in Fig. S7. This means that our parametric scheme is reasonable overall but still underestimates the daytime HONO source due to some unknown daytime sources. This unknown source may be related to the photochemical reactions related to NO2 and nitroaromatic compounds mentioned in recent studies (J. Liu et al., 2020a). J. Liu et al. (2019a, 2020b) have found the photoenhanced effect of the conversion from NO2 to HONO on real urban grime and glass windows simulated in laboratory studies. Yang et al. (2021) have also proposed that photolysis of nitroaromatic compounds may be a daytime source of HONO. Considering the uncertainty in parameterization, we used Oracle Crystal Ball (version 11.1.2.4, Oracle's software for modeling, prediction, simulation, and optimization) (Rahmani et al., 2023) to evaluate the overall uncertainty in the parameterization through Monte Carlo simulations. The relative standard deviation is 27.2 % for the HONO budget (details are in the Supplement).
In summary, heterogeneous reactions of NO2 (including ground and aerosol surfaces) contributed 33 % to the nocturnal HONO sources in the P1 stage, while they increased to 53 % in the P2 stage. Ground surfaces, as opposed to aerosol surfaces, were the main interfaces for heterogeneous reactions. At the same time, vehicle emissions accounted for 53 ± 17 % and 40 ± 14 % of nighttime HONO sources in the P1 and P2 stages, respectively. To explore whether meteorological factors have an impact on the sources of HONO, we conducted the budget analysis of HONO using the deweathered pollutant concentrations. The results are shown in Fig. S10. When compared with the sources of HONO calculated using the raw concentration dataset (Fig. S9), it can be seen that deweathering has little effect on the daytime sources of HONO. For the nighttime source of HONO, however, deweathering caused the proportion of traffic emissions during the BCNY period and the COVID-19 lockdown to increase from 53 % to 63 % and from 40 % to 45 %, respectively. The contribution of heterogeneous reactions of NO2 on ground surfaces decreased from 31 % to 19 % before the CNY and from 47 % to 42 % during the COVID-19 lockdown. These results further highlight the importance of vehicle emissions to nocturnal HONO sources in Beijing.
Therefore, regardless of whether the impact of meteorological conditions on the source of HONO is considered, we can conclude that traffic-related emissions, rather than heterogeneous reactions of NO2, were the main HONO source at night in Beijing in the typical emission patterns of air pollutants.
During the COVID-19 pandemic at the beginning of 2020, the concentrations of many air pollutants decreased significantly (P<0.05) due to the emission reduction in factories and transportation. The average concentration of NOx decreased by about 57 %, of which NO decreased by about 87 % and NO2 decreased by about 36 %. The average concentration of HONO decreased by about 45.3 % compared with that before the pandemic control measures. The average concentration of O3 and PM2.5 increased by approximately 75 % and 50 %, respectively. It is worth noting that in addition to primary emissions, meteorological changes also affect changes in atmospheric pollutant concentrations. After removing meteorological factors, the change proportions of PM2.5 concentration in the two stages were −4.3 % and −2.3 %, respectively. The HONO changes were −8.3 % and −3.8 %, respectively; the CO changes were −9.3 % and −6.2 %, respectively; and the SO2 changes were +8.6 % and +0.7 %, respectively. The change proportions are all less than 10 %, which means that the impact of changes in meteorological factors on PM2.5, HONO, CO, and SO2 is very weak. However, the change proportions of NO in the two stages were −16.2 % and +32.8 %, respectively, and those of O3 were +39.6 % and +6.2 %, respectively. The change ratio is greater than 30 %, indicating that NO and O3 are greatly affected by meteorology. In addition, the changes in NO2 were −13.8 % and −4.8 %, respectively, implying that NO2 is also affected by meteorological factors. From the entire observation period, except for O3, the changes in other species in the two periods fluctuated between 2.3 % and 7.8 % after deweathering and were always less than 8 %. In general, after removing the meteorological effects, NO increased by 79 %, NO2 increased by approximately 29 %, HONO decreased by approximately 43 %, and PM2.5 increased by approximately 50 %. It is worth noting that O3 increased by about 33 %, which is much lower than the change in observed values (75.1 %) (as shown in Table S6). Although we have tried to assess the impact of meteorological factors quantitatively, there is still some uncertainty. In particular, uncertainty is inevitable for the source assessment of substances such as HONO that are affected by a large number of parameters.
In this study, the parameters of HONO sources were optimized. The balance of sources and sinks is well supported by a relatively high correlation between observed and estimated HONO concentrations. During the observation period, we used lockdown during COVID-19 as a disturbance factor and compared the concentration and source changes of HONO before and during COVID-19 lockdown to determine whether heterogeneous reactions on the surface of particulate matter and vehicle emissions were important HONO sources. We found that vehicle-related emissions were the most important nighttime HONO source in Beijing, contributing 50 %–60 % to the nighttime HONO sources. The homogeneous reaction between NO and OH and the heterogeneous reaction of NO2 on the aerosol surfaces were not important for the contribution of nocturnal HONO, accounting for 13 ± 5 % and 2 ± 1 %, respectively. The heterogeneous reaction of NO2 on ground surfaces was also found to be an important source of HONO at night, accounting for 31 ± 5 % of the nighttime HONO sources. Nitrate photolysis became the most important source of HONO during the daytime compared with the situation before the pandemic control measures because of the combined effect of the increase in the average concentration of nitrate and the decrease in the NO concentration during the pandemic. We conducted a potential source contribution function (PSCF, Fig. S2) analysis in different periods, i.e., BCNY and COVID-19, at the BUCT station and further compared the PSCF of HONO at the BUCT station with that at the Institute of Atmospheric Physics (IAP) station, which is around 8 km from the BUCT station, from 24 to 31 January 2022, which is when the data were available. The PSCF patterns were highly similar in different periods and locations. These results mean that the air mass should have been consistent during the COVID-19 lockdown and BCNY period and that HONO should have been evenly distributed in Beijing. Thus, the impact of meteorological changes on the accuracy of observations cannot be ruled out, which is also a limitation of this study, but its influence should be comparable between the BCNY period and the COVID-19 lockdown. Furthermore, the conclusions drawn based on the observations at BUCT should represent the situation in Beijing. Through uncertainty assessment, it was found that the assumption of had the greatest uncertainty, with a standard deviation of ± 19 %. Nevertheless, this study confirms that reducing anthropogenic emissions can indeed reduce the concentration of HONO in the atmosphere. However, such a reduction does not have a simple linear relation with the reduction in human activities, but it also depends on meteorological conditions and complex chemical transformation processes taking place in the atmosphere.
As a megacity in China, Beijing has a large population and intensive traffic emissions, resulting in frequent air pollution. Although concentrations of HONO are usually lower than those of other major pollutants, HONO efficiently triggers the formation of secondary pollutants acting as an important primary source of OH radicals. Therefore, the sources of HONO deserve to be investigated for air pollution control in Beijing. Our results suggest that motor vehicle emissions are an important HONO source, while the contribution of the heterogeneous conversion of NO2 to HONO on aerosol surfaces still needs to be further evaluated; in particular, the kinetic parameters for ambient aerosol should be determined. In future research, it is necessary to combine field observations, laboratory studies, and model simulations to quantify the contribution of traffic-related emissions to HONO and finally obtain an accurate budget of HONO.
Data are available upon request to Yongchun Liu (liuyc@buct.edu.cn).
The supplement related to this article is available online at: https://doi.org/10.5194/acp-24-8569-2024-supplement.
YZ contributed to the methodology, data curation, and writing of the original draft. ZF and FZ contributed to the methodology, investigation, and data curation. CL contributed to the methodology, investigation, and data curation. WW contributed to the conceptualization, investigation, reviewing and editing of the text, and supervision. XF contributed to the methodology and reviewing and editing the text. YZ and WM contributed to the methodology, investigation, data curation, and reviewing and editing of the text. ZL and CL contributed to the methodology, investigation, and data curation. GZ contributed to the methodology, investigation, resources, and data curation. CY contributed to the methodology, data curation, and reviewing and editing of the text. VMK, FB, TP, and JK contributed to the acquisition of resources and reviewing and editing of the text. MK contributed to the methodology and reviewing of the text. YL contributed to the conceptualization, investigation, data curation, writing, reviewing and editing, supervision, and funding acquisition.
At least one of the (co-)authors is a member of the editorial board of Atmospheric Chemistry and Physics. The peer-review process was guided by an independent editor, and the authors also have no other competing interests to declare.
Publisher’s note: Copernicus Publications remains neutral with regard to jurisdictional claims made in the text, published maps, institutional affiliations, or any other geographical representation in this paper. While Copernicus Publications makes every effort to include appropriate place names, the final responsibility lies with the authors.
This research was financially supported by the Beijing Municipal Natural Science Foundation (8232041), Beijing National Laboratory for Molecular Sciences (BNLMS-CXXM-202011), and the National Natural Science Foundation of China (42275117 and 41931287). This research was supported in part by Hebei Technological Innovation Center for Volatile Organic Compounds Detection and Treatment in Chemical Industry (ZXJJ20220406) and the Natural Science Foundation of Hebei Province (D2023209012). The work is partially supported by the Academy of Finland “Atmosphere and Climate Competence Center (ACCC)” flagship program, project number 337549, and the European Union's Horizon 2020 Research and Innovation Programme under grant agreement nos. 101036245 (RI-URBANS) and 101056783 (FOCI) as well as the Technology Industries of Finland Centennial Foundation via the “Urbaani ilmanlaatu 2.0” project. The authors would like to thank Zirui Liu from the Institute of Atmospheric Physics, Chinese Academy of Sciences, for providing the HONO dataset for comparison.
This research has been supported by the the Beijing Municipal Natural Science Foundation (grant no. 8232041) and Beijing National Laboratory for Molecular Sciences (grant no. BNLMS-CXXM-202011).
This paper was edited by Andreas Hofzumahaus and reviewed by Yang Zeng and one anonymous referee.
Acker, K., Febo, A., Trick, S., Perrino, C., Bruno, P., Wiesen, P., Möller, D., Wieprecht, W., Auel, R., Giusto, M., Geyer, A., Platt, U., and Allegrini, I.: Nitrous acid in the urban area of Rome, Atmos. Environ., 40, 3123–3133, https://doi.org/10.1016/j.atmosenv.2006.01.028, 2006.
Alicke, B.: Impact of nitrous acid photolysis on the total hydroxyl radical budget during the Limitation of Oxidant Production/Pianura Padana Produzione di Ozono study in Milan, J. Geophys. Res., 107, LOP 9-1–LOP 9-17, https://doi.org/10.1029/2000jd000075, 2002.
Bond, A. M. H., Frey, M. M., Kaiser, J., Kleffmann, J., Jones, A. E., and Squires, F. A.: Snowpack nitrate photolysis drives the summertime atmospheric nitrous acid (HONO) budget in coastal Antarctica, Atmos. Chem. Phys., 23, 5533–5550, https://doi.org/10.5194/acp-23-5533-2023, 2023.
Chai, J., Dibb, J. E., Anderson, B. E., Bekker, C., Blum, D. E., Heim, E., Jordan, C. E., Joyce, E. E., Kaspari, J. H., Munro, H., Walters, W. W., and Hastings, M. G.: Isotopic evidence for dominant secondary production of HONO in near-ground wildfire plumes, Atmos. Chem. Phys., 21, 13077–13098, https://doi.org/10.5194/acp-21-13077-2021, 2021.
Chen, Y., Wang, W., Lian, C., Peng, C., Zhang, W., Li, J., Liu, M., Shi, B., Wang, X., and Ge, M.: Evaluation and impact factors of indoor and outdoor gas-phase nitrous acid under different environmental conditions, J. Environ. Sci., 95, 165–171, https://doi.org/10.1016/j.jes.2020.03.048, 2020.
Crilley, L. R., Kramer, L. J., Ouyang, B., Duan, J., Zhang, W., Tong, S., Ge, M., Tang, K., Qin, M., Xie, P., Shaw, M. D., Lewis, A. C., Mehra, A., Bannan, T. J., Worrall, S. D., Priestley, M., Bacak, A., Coe, H., Allan, J., Percival, C. J., Popoola, O. A. M., Jones, R. L., and Bloss, W. J.: Intercomparison of nitrous acid (HONO) measurement techniques in a megacity (Beijing), Atmos. Meas. Tech., 12, 6449–6463, https://doi.org/10.5194/amt-12-6449-2019, 2019.
Cui, L., Li, R., Zhang, Y., Meng, Y., Fu, H., and Chen, J.: An observational study of nitrous acid (HONO) in Shanghai, China: The aerosol impact on HONO formation during the haze episodes, Sci. Total Environ., 630, 1057–1070, https://doi.org/10.1016/j.scitotenv.2018.02.063, 2018.
Cui, Y., Ji, D., Maenhaut, W., Gao, W., Zhang, R., and Wang, Y.: Levels and sources of hourly PM2.5-related elements during the control period of the COVID-19 pandemic at a rural site between Beijing and Tianjin, Sci. Total Environ., 744, 140840, https://doi.org/10.1016/j.scitotenv.2020.140840, 2020.
Dillon, M. B., Lamanna, M. S., Schade, G. W., Goldstein, A. H., and Cohen, R. C.: Chemical evolution of the Sacramento urban plume: Transport and oxidation, J. Geophys. Res.-Atmos., 107, ACH 3-1–ACH 3-15, https://doi.org/10.1029/2001jd000969, 2002.
Ehhalt, D. H. and Rohrer, F.: Dependence of the OH concentration on solar UV, J. Geophys. Res.-Atmos., 105, 3565–3571, https://doi.org/10.1029/1999jd901070, 2000.
Farren, N. J., Ramirez, N., Lee, J. D., Finessi, E., Lewis, A. C., and Hamilton, J. F.: Estimated Exposure Risks from Carcinogenic Nitrosamines in Urban Airborne Particulate Matter, Environ. Sci. Technol., 49, 9648–9656, https://doi.org/10.1021/acs.est.5b01620, 2015.
Fu, X., Wang, T., Zhang, L., Li, Q., Wang, Z., Xia, M., Yun, H., Wang, W., Yu, C., Yue, D., Zhou, Y., Zheng, J., and Han, R.: The significant contribution of HONO to secondary pollutants during a severe winter pollution event in southern China, Atmos. Chem. Phys., 19, 1–14, https://doi.org/10.5194/acp-19-1-2019, 2019.
Ge, S., Wang, G., Zhang, S., Li, D., Xie, Y., Wu, C., Yuan, Q., Chen, J., and Zhang, H.: Abundant NH3 in China Enhances Atmospheric HONO Production by Promoting the Heterogeneous Reaction of SO2 with NO2, Environ. Sci. Technol., 53, 14339–14347, https://doi.org/10.1021/acs.est.9b04196, 2019.
Gu, R., Shen, H., Xue, L., Wang, T., Gao, J., Li, H., Liang, Y., Xia, M., Yu, C., Liu, Y., and Wang, W.: Investigating the sources of atmospheric nitrous acid (HONO) in the megacity of Beijing, China, Sci. Total Environ., 812, 152270, https://doi.org/10.1016/j.scitotenv.2021.152270, 2021.
Han, C., Liu, Y., and He, H.: Role of organic carbon in heterogeneous reaction of NO2 with soot, Environ. Sci. Technol., 47, 3174–3181, https://doi.org/10.1021/es304468n, 2013.
Han, C., Liu, Y., and He, H.: Heterogeneous reaction of NO2 with soot at different relative humidity, Environ. Sci. Pollut. Res. Int., 24, 21248–21255, https://doi.org/10.1007/s11356-017-9766-y, 2017a.
Han, C., Yang, W., Wu, Q., Yang, H., and Xue, X.: Heterogeneous Photochemical Conversion of NO2 to HONO on the Humic Acid Surface under Simulated Sunlight, Environ. Sci. Technol., 50, 5017–5023, https://doi.org/10.1021/acs.est.5b05101, 2016.
Han, X., Zhang, M., Skorokhod, A., and Kou, X.: Modeling dry deposition of reactive nitrogen in China with RAMS-CMAQ, Atmos. Environ., 166, 47–61, https://doi.org/10.1016/j.atmosenv.2017.07.015, 2017b.
Huang, R. J., Yang, L., Cao, J., Wang, Q., Tie, X., Ho, K. F., Shen, Z., Zhang, R., Li, G., Zhu, C., Zhang, N., Dai, W., Zhou, J., Liu, S., Chen, Y., Chen, J., and O'Dowd, C. D.: Concentration and sources of atmospheric nitrous acid (HONO) at an urban site in Western China, Sci. Total Environ., 593/594, 165–172, https://doi.org/10.1016/j.scitotenv.2017.02.166, 2017.
Jia, C., Tong, S., Zhang, W., Zhang, X., Li, W., Wang, Z., Wang, L., Liu, Z., Hu, B., Zhao, P., and Ge, M.: Pollution characteristics and potential sources of nitrous acid (HONO) in early autumn 2018 of Beijing, Sci. Total Environ., 735, 139317, https://doi.org/10.1016/j.scitotenv.2020.139317, 2020.
Jiang, Y., Xue, L., Shen, H., Dong, C., Xiao, Z., and Wang, W.: Dominant Processes of HONO Derived from Multiple Field Observations in Contrasting Environments, Environ. Sci. Technol. Lett., 9, 258–264, https://doi.org/10.1021/acs.estlett.2c00004, 2022.
Kanaya, Y., Cao, R., Akimoto, H., Fukuda, M., Komazaki, Y., Yokouchi, Y., Koike, M., Tanimoto, H., Takegawa, N., and Kondo, Y.: Urban photochemistry in central Tokyo: 1. Observed and modeled OH and HO2 radical concentrations during the winter and summer of 2004, J. Geophys. Res., 112, D21312, https://doi.org/10.1029/2007jd008670, 2007.
Kim, M. and Or, D.: Microscale pH variations during drying of soils and desert biocrusts affect HONO and NH3 emissions, Nat. Commun., 10, 3944, https://doi.org/10.1038/s41467-019-11956-6, 2019.
Kramer, L. J., Crilley, L. R., Adams, T. J., Ball, S. M., Pope, F. D., and Bloss, W. J.: Nitrous acid (HONO) emissions under real-world driving conditions from vehicles in a UK road tunnel, Atmos. Chem. Phys., 20, 5231–5248, https://doi.org/10.5194/acp-20-5231-2020, 2020.
Kroll, J. H., Heald, C. L., Cappa, C. D., Farmer, D. K., Fry, J. L., Murphy, J. G., and Steiner, A. L.: The complex chemical effects of COVID-19 shutdowns on air quality, Nat. Chem., 12, 777–779, https://doi.org/10.1038/s41557-020-0535-z, 2020.
Kulmala, M. and Petäjä, T.: Soil Nitrites Influence Atmospheric Chemistry, Science, 333, 1586–1587, 2011.
Le, T., Wang, Y., Liu, L., Yang, J., Yung, Y. L., Li, G., and Seinfeld, J. H.: Unexpected air pollution with marked emission reductions during the COVID-19 outbreak in China, Science, 369, 702–706, https://doi.org/10.1126/science.abb7431, 2020.
Li, D., Xue, L., Wen, L., Wang, X., Chen, T., Mellouki, A., Chen, J., and Wang, W.: Characteristics and sources of nitrous acid in an urban atmosphere of northern China: Results from 1-yr continuous observations, Atmos. Environ., 182, 296–306, https://doi.org/10.1016/j.atmosenv.2018.03.033, 2018.
Li, S., Song, W., Zhan, H., Zhang, Y., Zhang, X., Li, W., Tong, S., Pei, C., Wang, Y., Chen, Y., Huang, Z., Zhang, R., Zhu, M., Fang, H., Wu, Z., Wang, J., Luo, S., Fu, X., Xiao, S., Huang, X., Zeng, J., Zhang, H., Chen, D., Gligorovski, S., Ge, M., George, C., and Wang, X.: Contribution of Vehicle Emission and NO2 Surface Conversion to Nitrous Acid (HONO) in Urban Environments: Implications from Tests in a Tunnel, Environ. Sci. Technol., 55, 15616–15624, https://doi.org/10.1021/acs.est.1c00405, 2021.
Li, X., Brauers, T., Häseler, R., Bohn, B., Fuchs, H., Hofzumahaus, A., Holland, F., Lou, S., Lu, K. D., Rohrer, F., Hu, M., Zeng, L. M., Zhang, Y. H., Garland, R. M., Su, H., Nowak, A., Wiedensohler, A., Takegawa, N., Shao, M., and Wahner, A.: Exploring the atmospheric chemistry of nitrous acid (HONO) at a rural site in Southern China, Atmos. Chem. Phys., 12, 1497–1513, https://doi.org/10.5194/acp-12-1497-2012, 2012.
Liang, Y., Zha, Q., Wang, W., Cui, L., Lui, K. H., Ho, K. F., Wang, Z., Lee, S. C., and Wang, T.: Revisiting nitrous acid (HONO) emission from on-road vehicles: A tunnel study with a mixed fleet, J. Air Waste Manag. Assoc., 67, 797–805, https://doi.org/10.1080/10962247.2017.1293573, 2017.
Liao, S., Zhang, J., Yu, F., Zhu, M., Liu, J., Ou, J., Dong, H., Sha, Q., Zhong, Z., Xie, Y., Luo, H., Zhang, L., and Zheng, J.: High Gaseous Nitrous Acid (HONO) Emissions from Light-Duty Diesel Vehicles, Environ. Sci. Technol., 55, 200–208, https://doi.org/10.1021/acs.est.0c05599, 2021.
Liu, J., Li, S., Mekic, M., Jiang, H., Zhou, W., Loisel, G., Song, W., Wang, X., and Gligorovski, S.: Photoenhanced Uptake of NO2 and HONO Formation on Real Urban Grime, Environ. Sci. Technol. Lett., 6, 413–417, https://doi.org/10.1021/acs.estlett.9b00308, 2019.
Liu, J., Deng, H., Lakey, P. S. J., Jiang, H., Mekic, M., Wang, X., Shiraiwa, M., and Gligorovski, S.: Unexpectedly High Indoor HONO Concentrations Associated with Photochemical NO2 Transformation on Glass Windows, Environ. Sci. Technol., 54, 15680–15688, https://doi.org/10.1021/acs.est.0c05624, 2020a.
Liu, J., Deng, H., Li, S., Jiang, H., Mekic, M., Zhou, W., Wang, Y., Loisel, G., Wang, X., and Gligorovski, S.: Light-enhanced heterogeneous conversion of NO2 to HONO on solid films consisted of fluorene and fluorene Na2SO4: An impact on urban and indoor atmosphere, Environ. Sci. Technol., 54, 11079–11086, https://doi.org/10.1021/acs.est.0c02627, 2020b.
Liu, J., Liu, Z., Ma, Z., Yang, S., Yao, D., Zhao, S., Hu, B., Tang, G., Sun, J., Cheng, M., Xu, Z., and Wang, Y.: Detailed budget analysis of HONO in Beijing, China: Implication on atmosphere oxidation capacity in polluted megacity, Atmos. Environ., 244, 117957, https://doi.org/10.1016/j.atmosenv.2020.117957, 2021.
Liu, Y., Han, C., Ma, J., Bao, X., and He, H.: Influence of relative humidity on heterogeneous kinetics of NO2 on kaolin and hematite, Phys. Chem. Chem. Phys., 17, 19424–19431, https://doi.org/10.1039/c5cp02223a, 2015.
Liu, Y., Nie, W., Xu, Z., Wang, T., Wang, R., Li, Y., Wang, L., Chi, X., and Ding, A.: Semi-quantitative understanding of source contribution to nitrous acid (HONO) based on 1 year of continuous observation at the SORPES station in eastern China, Atmos. Chem. Phys., 19, 13289–13308, https://doi.org/10.5194/acp-19-13289-2019, 2019a.
Liu, Y., Lu, K., Li, X., Dong, H., Tan, Z., Wang, H., Zou, Q., Wu, Y., Zeng, L., Hu, M., Min, K. E., Kecorius, S., Wiedensohler, A., and Zhang, Y.: A Comprehensive Model Test of the HONO Sources Constrained to Field Measurements at Rural North China Plain, Environ. Sci. Technol., 53, 3517–3525, https://doi.org/10.1021/acs.est.8b06367, 2019b.
Liu, Y., Ni, S., Jiang, T., Xing, S., Zhang, Y., Bao, X., Feng, Z., Fan, X., Zhang, L., and Feng, H.: Influence of Chinese New Year overlapping COVID-19 lockdown on HONO sources in Shijiazhuang, Sci. Total Environ., 745, 141025, https://doi.org/10.1016/j.scitotenv.2020.141025, 2020a.
Liu, Y., Zhang, Y., Lian, C., Yan, C., Feng, Z., Zheng, F., Fan, X., Chen, Y., Wang, W., Chu, B., Wang, Y., Cai, J., Du, W., Daellenbach, K. R., Kangasluoma, J., Bianchi, F., Kujansuu, J., Petäjä, T., Wang, X., Hu, B., Wang, Y., Ge, M., He, H., and Kulmala, M.: The promotion effect of nitrous acid on aerosol formation in wintertime in Beijing: the possible contribution of traffic-related emissions, Atmos. Chem. Phys., 20, 13023–13040, https://doi.org/10.5194/acp-20-13023-2020, 2020b.
Liu, Z., Wang, Y., Costabile, F., Amoroso, A., Zhao, C., Huey, L. G., Stickel, R., Liao, J., and Zhu, T.: Evidence of aerosols as a media for rapid daytime HONO production over China, Environ. Sci. Technol., 48, 14386–14391, https://doi.org/10.1021/es504163z, 2014.
Lv, Z., Wang, X., Deng, F., Ying, Q., Archibald, A. T., Jones, R. L., Ding, Y., Cheng, Y., Fu, M., Liu, Y., Man, H., Xue, Z., He, K., Hao, J., and Liu, H.: Source-Receptor Relationship Revealed by the Halted Traffic and Aggravated Haze in Beijing during the COVID-19 Lockdown, Environ. Sci. Technol., 54, 15660–15670, https://doi.org/10.1021/acs.est.0c04941, 2020.
Ma, X., Tan, Z., Lu, K., Yang, X., Liu, Y., Li, S., Li, X., Chen, S., Novelli, A., Cho, C., Zeng, L., Wahner, A., and Zhang, Y.: Winter photochemistry in Beijing: Observation and model simulation of OH and HO2 radicals at an urban site, Sci. Total Environ., 685, 85–95, https://doi.org/10.1016/j.scitotenv.2019.05.329, 2019.
Meng, F., Qin, M., Tang, K., Duan, J., Fang, W., Liang, S., Ye, K., Xie, P., Sun, Y., Xie, C., Ye, C., Fu, P., Liu, J., and Liu, W.: High-resolution vertical distribution and sources of HONO and NO2 in the nocturnal boundary layer in urban Beijing, China, Atmos. Chem. Phys., 20, 5071–5092, https://doi.org/10.5194/acp-20-5071-2020, 2020.
Meusel, H., Tamm, A., Kuhn, U., Wu, D., Leifke, A. L., Fiedler, S., Ruckteschler, N., Yordanova, P., Lang-Yona, N., Pöhlker, M., Lelieveld, J., Hoffmann, T., Pöschl, U., Su, H., Weber, B., and Cheng, Y.: Emission of nitrous acid from soil and biological soil crusts represents an important source of HONO in the remote atmosphere in Cyprus, Atmos. Chem. Phys., 18, 799–813, https://doi.org/10.5194/acp-18-799-2018, 2018.
Oswald, R., Behrendt, T., Ermel, M., Wu, D., Su, H., Cheng, Y., Breuninger, C., Moravek, A., Mougin, E., Delon, C., Loubet, B., Pommerening-Roser, A., Sorgel, M., Poschl, U., Hoffmann, T., Andreae, M. O., Meixner, F. X., and Trebs, I.: HONO emissions from soil bacteria as a major source of atmospheric reactive nitrogen, Science, 341, 1233–1235, https://doi.org/10.1126/science.1242266, 2013.
Peng, Q., Palm, B. B., Melander, K. E., Lee, B. H., Hall, S. R., Ullmann, K., Campos, T., Weinheimer, A. J., Apel, E. C., Hornbrook, R. S., Hills, A. J., Montzka, D. D., Flocke, F., Hu, L., Permar, W., Wielgasz, C., Lindaas, J., Pollack, I. B., Fischer, E. V., Bertram, T. H., and Thornton, J. A.: HONO Emissions from Western U.S. Wildfires Provide Dominant Radical Source in Fresh Wildfire Smoke, Environ. Sci. Technol., 54, 5954–5963, https://doi.org/10.1021/acs.est.0c00126, 2020.
Qin, M., Xie, P., Su, H., Gu, J., Peng, F., Li, S., Zeng, L., Liu, J., Liu, W., and Zhang, Y.: An observational study of the HONO–NO2 coupling at an urban site in Guangzhou City, South China, Atmos. Environ., 43, 5731–5742, https://doi.org/10.1016/j.atmosenv.2009.08.017, 2009.
Kurtenbach, R., Becker, K. H., Gomes, J. A. G., Kleffmann, J., Lörzer, J. C., Spittler, M., Wiesen, P., Ackermann, R., Geyer, A., and Platt, U.: Investigations of emissions and heterogeneous formation of HONO in a road traffic tunnel, Atmos. Environ., 35, 3385–3394, https://doi.org/10.1016/S1352-2310(01)00138-8, 2001.
Rahmani, A., Khamutian, S., Doosti-Irani, A., Saatchi, O., and Shokoohizadeh, M. J.: Arsenic level in drinking water, its correlation with water quality parameters, and associated health risks, Environ. Monit. Assess., 195, 899, https://doi.org/10.1007/s10661-023-11486-1, 2023.
Shen, N., Zhao, X., Li, L., Zhou, B., Duan, F., and Zhao, W.: Spatial and temporal variation characteristics of atmospheric NO2 and SO2 in the Beijing-Tianjin-Hebei region before and after the COVID-19 outbreak, Air Qual. Atmos. Health, 14, 1175–1188, https://doi.org/10.1007/s11869-021-01016-8, 2021.
Song, M., Zhao, X., Liu, P., Mu, J., He, G., Zhang, C., Tong, S., Xue, C., Zhao, X., Ge, M., and Mu, Y.: Atmospheric NOx oxidation as major sources for nitrous acid (HONO), npj Clim. Atmos. Sci., 6, 30, https://doi.org/10.1038/s41612-023-00357-8, 2023.
Song, Y., Zhang, Y., Xue, C., Liu, P., He, X., Li, X., and Mu, Y.: The seasonal variations and potential sources of nitrous acid (HONO) in the rural North China Plain, Environ. Pollut., 311, 119967, https://doi.org/10.1016/j.envpol.2022.119967, 2022.
Spataro, F., Ianniello, A., Salvatori, R., Nardino, M., Esposito, G., and Montagnoli, M.: Sources of atmospheric nitrous acid (HONO) in the European High Arctic, Rendiconti. Lincei., 28, 25–33, https://doi.org/10.1007/s12210-016-0568-9, 2016.
Stemmler, K., Ndour, M., Elshorbany, Y., Kleffmann, J., D'Anna, B., George, C., Bohn, B., and Ammann, M.: Light induced conversion of nitrogen dioxide into nitrous acid on submicron humic acid aerosol, Atmos. Chem. Phys., 7, 4237–4248, https://doi.org/10.5194/acp-7-4237-2007, 2007.
Sun, J., Shen, Z., Zeng, Y., Niu, X., Wang, J., Cao, J., Gong, X., Xu, H., Wang, T., Liu, H., and Yang, L.: Characterization and cytotoxicity of PAHs in PM2.5 emitted from residential solid fuel burning in the Guanzhong Plain, China, Environ. Pollut., 241, 359–368, https://doi.org/10.1016/j.envpol.2018.05.076, 2018.
Sun, J., Shen, Z., Cao, J., Zhang, L., Wu, T., Zhang, Q., Yin, X., Lei, Y., Huang, Y., Huang, R. J., Liu, S., Han, Y., Xu, H., Zheng, C., and Liu, P.: Particulate matters emitted from maize straw burning for winter heating in rural areas in Guanzhong Plain, China: Current emission and future reduction, Atmos. Res., 184, 66–76, https://doi.org/10.1016/j.atmosres.2016.10.006, 2017.
Sun, Y., Lei, L., Zhou, W., Chen, C., He, Y., Sun, J., Li, Z., Xu, W., Wang, Q., Ji, D., Fu, P., Wang, Z., and Worsnop, D. R.: A chemical cocktail during the COVID-19 outbreak in Beijing, China: Insights from six-year aerosol particle composition measurements during the Chinese New Year holiday, Sci. Total Environ., 742, 140739, https://doi.org/10.1016/j.scitotenv.2020.140739, 2020.
Sun, Y. L., Wang, Z. F., Fu, P. Q., Yang, T., Jiang, Q., Dong, H. B., Li, J., and Jia, J. J.: Aerosol composition, sources and processes during wintertime in Beijing, China, Atmos. Chem. Phys., 13, 4577-4592, https://doi.org/10.5194/acp-13-4577-2013, 2013.
Tan, Z., Lu, K., Jiang, M., Su, R., Wang, H., Lou, S., Fu, Q., Zhai, C., Tan, Q., Yue, D., Chen, D., Wang, Z., Xie, S., Zeng, L., and Zhang, Y.: Daytime atmospheric oxidation capacity in four Chinese megacities during the photochemically polluted season: a case study based on box model simulation, Atmos. Chem. Phys., 19, 3493–3513, https://doi.org/10.5194/acp-19-3493-2019, 2019.
Tan, Z., Hofzumahaus, A., Lu, K., Brown, S. S., Holland, F., Huey, L. G., Kiendler-Scharr, A., Li, X., Liu, X., Ma, N., Min, K. E., Rohrer, F., Shao, M., Wahner, A., Wang, Y., Wiedensohler, A., Wu, Y., Wu, Z., Zeng, L., Zhang, Y., and Fuchs, H.: No Evidence for a Significant Impact of Heterogeneous Chemistry on Radical Concentrations in the North China Plain in Summer 2014, Environ. Sci. Technol., 54, 5973–5979, https://doi.org/10.1021/acs.est.0c00525, 2020.
Tan, Z., Fuchs, H., Lu, K., Hofzumahaus, A., Bohn, B., Broch, S., Dong, H., Gomm, S., Häseler, R., He, L., Holland, F., Li, X., Liu, Y., Lu, S., Rohrer, F., Shao, M., Wang, B., Wang, M., Wu, Y., Zeng, L., Zhang, Y., Wahner, A., and Zhang, Y.: Radical chemistry at a rural site (Wangdu) in the North China Plain: observation and model calculations of OH, HO2 and RO2 radicals, Atmos. Chem. Phys., 17, 663–690, https://doi.org/10.5194/acp-17-663-2017, 2017.
Tan, Z., Rohrer, F., Lu, K., Ma, X., Bohn, B., Broch, S., Dong, H., Fuchs, H., Gkatzelis, G. I., Hofzumahaus, A., Holland, F., Li, X., Liu, Y., Liu, Y., Novelli, A., Shao, M., Wang, H., Wu, Y., Zeng, L., Hu, M., Kiendler-Scharr, A., Wahner, A., and Zhang, Y.: Wintertime photochemistry in Beijing: observations of ROx radical concentrations in the North China Plain during the BEST-ONE campaign, Atmos. Chem. Phys., 18, 12391–12411, https://doi.org/10.5194/acp-18-12391-2018, 2018.
Tang, M. X., He, L. Y., Xia, S. Y., Jiang, Z., He, D. Y., Guo, S., Hu, R. Z., Zeng, H., and Huang, X. F.: Coarse particles compensate for missing daytime sources of nitrous acid and enhance atmospheric oxidation capacity in a coastal atmosphere, Sci Total Environ., 915, 170037, https://doi.org/10.1016/j.scitotenv.2024.170037, 2024
Tong, S., Hou, S., Zhang, Y., Chu, B., Liu, Y., He, H., Zhao, P., and Ge, M.: Comparisons of measured nitrous acid (HONO) concentrations in a pollution period at urban and suburban Beijing, in autumn of 2014, Sci. China Chem., 58, 1393–1402, https://doi.org/10.1007/s11426-015-5454-2, 2015.
Tong, S., Hou, S., Zhang, Y., Chu, B., Liu, Y., He, H., Zhao, P., and Ge, M.: Exploring the nitrous acid (HONO) formation mechanism in winter Beijing: direct emissions and heterogeneous production in urban and suburban areas, Faraday Discuss., 189, 213–230, https://doi.org/10.1039/c5fd00163c, 2016.
VandenBoer, T. C., Young, C. J., Talukdar, R. K., Markovic, M. Z., Brown, S. S., Roberts, J. M., and Murphy, J. G.: Nocturnal loss and daytime source of nitrous acid through reactive uptake and displacement, Nat. Geosci., 8, 55–60, https://doi.org/10.1038/ngeo2298, 2014.
Wang, J., Xu, X., Wang, S., He, S., Li, X., and He, P.: Heterogeneous effects of COVID-19 lockdown measures on air quality in Northern China, Appl. Energ., 282, 116179, https://doi.org/10.1016/j.apenergy.2020.116179, 2021.
Wang, P., Chen, K., Zhu, S., Wang, P., and Zhang, H.: Severe air pollution events not avoided by reduced anthropogenic activities during COVID-19 outbreak, Resour. Conserv. Recycl., 158, 104814, https://doi.org/10.1016/j.resconrec.2020.104814, 2020a.
Wang, S., Zhou, R., Zhao, H., Wang, Z., Chen, L., and Zhou, B.: Long-term observation of atmospheric nitrous acid (HONO) and its implication to local NO2 levels in Shanghai, China, Atmos. Environ., 77, 718–724, https://doi.org/10.1016/j.atmosenv.2013.05.071, 2013.
Wang, Y., Wen, Y., Wang, Y., Zhang, S., Zhang, K. M., Zheng, H., Xing, J., Wu, Y., and Hao, J.: Four-Month Changes in Air Quality during and after the COVID-19 Lockdown in Six Megacities in China, Environ. Sci. Technol. Lett., 7, 802–808, https://doi.org/10.1021/acs.estlett.0c00605, 2020b.
Weber, B., Wu, D., Tamm, A., Ruckteschler, N., Rodriguez-Caballero, E., Steinkamp, J., Meusel, H., Elbert, W., Behrendt, T., Sorgel, M., Cheng, Y., Crutzen, P. J., Su, H., and Poschl, U.: Biological soil crusts accelerate the nitrogen cycle through large NO and HONO emissions in drylands, P. Natl. Acad. Sci. USA, 112, 15384–15389, https://doi.org/10.1073/pnas.1515818112, 2015.
Wu, D., Horn, M. A., Behrendt, T., Muller, S., Li, J., Cole, J. A., Xie, B., Ju, X., Li, G., Ermel, M., Oswald, R., Frohlich-Nowoisky, J., Hoor, P., Hu, C., Liu, M., Andreae, M. O., Poschl, U., Cheng, Y., Su, H., Trebs, I., Weber, B., and Sorgel, M.: Soil HONO emissions at high moisture content are driven by microbial nitrate reduction to nitrite: tackling the HONO puzzle, ISME J., 13, 1688–1699, https://doi.org/10.1038/s41396-019-0379-y, 2019.
Xing, C., Xu, S., Song, Y., Liu, C., Liu, Y., Lu, K., Tan, W., Zhang, C., Hu, Q., Wang, S., Wu, H., and Lin, H.: A new insight into the vertical differences in NO2 heterogeneous reaction to produce HONO over inland and marginal seas, Atmos. Chem. Phys., 23, 5815–5834, https://doi.org/10.5194/acp-23-5815-2023, 2023.
Xu, Z., Wang, T., Wu, J., Xue, L., Chan, J., Zha, Q., Zhou, S., Louie, P. K. K., and Luk, C. W. Y.: Nitrous acid (HONO) in a polluted subtropical atmosphere: Seasonal variability, direct vehicle emissions and heterogeneous production at ground surface, Atmos. Environ., 106, 100–109, https://doi.org/10.1016/j.atmosenv.2015.01.061, 2015.
Xue, C.: Substantially Growing Interest in the Chemistry of Nitrous Acid (HONO) in China: Current Achievements, Problems, and Future Directions, Environ. Sci. Technol., 56, 7375–7377, https://doi.org/10.1021/acs.est.2c02237, 2022.
Xue, C., Zhang, C., Ye, C., Liu, P., Catoire, V., Krysztofiak, G., Chen, H., Ren, Y., Zhao, X., Wang, J., Zhang, F., Zhang, C., Zhang, J., An, J., Wang, T., Chen, J., Kleffmann, J., Mellouki, A., and Mu, Y.: HONO Budget and Its Role in Nitrate Formation in the Rural North China Plain, Environ. Sci. Technol., 54, 11048–11057, https://doi.org/10.1021/acs.est.0c01832, 2020.
Yang, D., Zhang, S., Niu, T., Wang, Y., Xu, H., Zhang, K. M., and Wu, Y.: High-resolution mapping of vehicle emissions of atmospheric pollutants based on large-scale, real-world traffic datasets, Atmos. Chem. Phys., 19, 8831–8843, https://doi.org/10.5194/acp-19-8831-2019, 2019.
Yang, W., You, D., Li, C., Han, C., Tang, N., Yang, H., and Xue, X.: Photolysis of Nitroaromatic Compounds under Sunlight: A Possible Daytime Photochemical Source of Nitrous Acid?, Environ. Sci. Technol. Lett., 8, 747–752, https://doi.org/10.1021/acs.estlett.1c00614, 2021.
Ye, C., Gao, H., Zhang, N., and Zhou, X.: Photolysis of Nitric Acid and Nitrate on Natural and Artificial Surfaces, Environ. Sci. Technol., 50, 3530–3536, https://doi.org/10.1021/acs.est.5b05032, 2016.
Ye, C., Lu, K., Ma, X., Qiu, W., Li, S., Yang, X., Xue, C., Zhai, T., Liu, Y., Li, X., Li, Y., Wang, H., Tan, Z., Chen, X., Dong, H., Zeng, L., Hu, M., and Zhang, Y.: HONO chemistry at a suburban site during the EXPLORE-YRD campaign in 2018: formation mechanisms and impacts on O3 production, Atmos. Chem. Phys., 23, 15455–15472, https://doi.org/10.5194/acp-23-15455-2023, 2023.
Yu, Y., Galle, B., Panday, A., Hodson, E., Prinn, R., and Wang, S.: Observations of high rates of NO2-HONO conversion in the nocturnal atmospheric boundary layer in Kathmandu, Nepal, Atmos. Chem. Phys., 9, 6401–6415, https://doi.org/10.5194/acp-9-6401-2009, 2009.
Zhang, J., An, J., Qu, Y., Liu, X., and Chen, Y.: Impacts of potential HONO sources on the concentrations of oxidants and secondary organic aerosols in the Beijing-Tianjin-Hebei region of China, Sci. Total Environ., 647, 836–852, https://doi.org/10.1016/j.scitotenv.2018.08.030, 2019a.
Zhang, J., Chen, J., Xue, C., Chen, H., Zhang, Q., Liu, X., Mu, Y., Guo, Y., Wang, D., Chen, Y., Li, J., Qu, Y., and An, J.: Impacts of six potential HONO sources on HOx budgets and SOA formation during a wintertime heavy haze period in the North China Plain, Sci. Total Environ., 681, 110–123, https://doi.org/10.1016/j.scitotenv.2019.05.100, 2019b.
Zhang, J., Lian, C., Wang, W., Ge, M., Guo, Y., Ran, H., Zhang, Y., Zheng, F., Fan, X., Yan, C., Daellenbach, K. R., Liu, Y., Kulmala, M., and An, J.: Amplified role of potential HONO sources in O3 formation in North China Plain during autumn haze aggravating processes, Atmos. Chem. Phys., 22, 3275–3302, https://doi.org/10.5194/acp-22-3275-2022, 2022.
Zhang, L., Wang, T., Zhang, Q., Zheng, J., Xu, Z., and Lv, M.: Potential sources of nitrous acid (HONO) and their impacts on ozone: A WRF-Chem study in a polluted subtropical region, J. Geophys. Res.-Atmos., 121, 3645–3662, https://doi.org/10.1002/2015jd024468, 2016.
Zhang, Q., Liu, P., George, C., Chen, T., Ren, Y., Mu, Y., Song, M., Herrmann, H., Mellouki, A., Chen, J., Zhao, X., and Zeng, Y.: Unveiling the underestimated direct emissions of nitrous acid (HONO), P. Natl. Acad. Sci. USA, 120, e2302048120, https://doi.org/10.1073/pnas.2302048120, 2023.
Zhang, W., Tong, S., Ge, M., An, J., Shi, Z., Hou, S., Xia, K., Qu, Y., Zhang, H., Chu, B., Sun, Y., and He, H.: Variations and sources of nitrous acid (HONO) during a severe pollution episode in Beijing in winter 2016, Sci. Total Environ., 648, 253–262, https://doi.org/10.1016/j.scitotenv.2018.08.133, 2019.
Zhang, W., Tong, S., Jia, C., Wang, L., Liu, B., Tang, G., Ji, D., Hu, B., Liu, Z., Li, W., Wang, Z., Liu, Y., Wang, Y., and Ge, M.: Different HONO Sources for Three Layers at the Urban Area of Beijing, Environ. Sci. Technol., 54, 12870–12880, https://doi.org/10.1021/acs.est.0c02146, 2020.
Zhang, W., Ren, Y., Zhang, C., Liu, P., Xue, C., Ye, C., Liu, C., Wang, J., Zhang, Y., Liu, J., Song, Y., Feng, Y., and Mu, Y.: Aging of pollution air parcels acts as the dominant source for nocturnal HONO, Sci. Total Environ., 881, 163438, https://doi.org/10.1016/j.scitotenv.2023.163438, 2023.
Zhang, X., Tong, S., Jia, C., Zhang, W., Li, J., Wang, W., Sun, Y., Wang, X., Wang, L., Ji, D., Wang, L., Zhao, P., Tang, G., Xin, J., Li, A., and Ge, M.: The Levels and Sources of Nitrous Acid (HONO) in Winter of Beijing and Sanmenxia, J. Geophys. Res.-Atmos., 127, e2021JD036278, https://doi.org/10.1029/2021jd036278, 2022.
Zhang, X., Tong, S., Jia, C., Zhang, W., Wang, Z., Tang, G., Hu, B., Liu, Z., Wang, L., Zhao, P., Pan, Y., and Ge, M.: Elucidating HONO formation mechanism and its essential contribution to OH during haze events, npj Clim. Atmos. Sci., 6, 55, https://doi.org/10.1038/s41612-023-00371-w, 2023.
Zhao, Y., Zhang, K., Xu, X., Shen, H., Zhu, X., Zhang, Y., Hu, Y., and Shen, G.: Substantial Changes in Nitrogen Dioxide and Ozone after Excluding Meteorological Impacts during the COVID-19 Outbreak in Mainland China, Environ. Sci. Technol. Lett., 7, 402–408, https://doi.org/10.1021/acs.estlett.0c00304, 2020.
Zheng, B., Huo, H., Zhang, Q., Yao, Z. L., Wang, X. T., Yang, X. F., Liu, H., and He, K. B.: High-resolution mapping of vehicle emissions in China in 2008, Atmos. Chem. Phys., 14, 9787–9805, https://doi.org/10.5194/acp-14-9787-2014, 2014.
Zheng, J., Shi, X., Ma, Y., Ren, X., Jabbour, H., Diao, Y., Wang, W., Ge, Y., Zhang, Y., and Zhu, W.: Contribution of nitrous acid to the atmospheric oxidation capacity in an industrial zone in the Yangtze River Delta region of China, Atmos. Chem. Phys., 20, 5457–5475, https://doi.org/10.5194/acp-20-5457-2020, 2020.
Zhou, X., Zhang, N., TerAvest, M., Tang, D., Hou, J., Bertman, S., Alaghmand, M., Shepson, P. B., Carroll, M. A., Griffith, S., Dusanter, S., and Stevens, P. S.: Nitric acid photolysis on forest canopy surface as a source for tropospheric nitrous acid, Nat. Geosci., 4, 440–443, https://doi.org/10.1038/ngeo1164, 2011.