the Creative Commons Attribution 4.0 License.
the Creative Commons Attribution 4.0 License.
 | 25 Jul 2024
Why did ozone concentrations remain high during Shanghai's static management? A statistical and radical-chemistry perspective
Shanshan Wang
Chuanqi Gu
Zhiwen Jiang
Sanbao Zhang
Ruibin Xue
Yuhao Yan
Bin Zhou
During the period of April and May 2022, Shanghai implemented city-wide static management measures to control the spread of the Omicron variant. Compared to the lockdown in early 2020, the static management in 2022 occurred during the high-ozone season and lasted for a longer duration. It can be considered a “large-scale field experiment” to study the response of ambient ozone levels to emission reductions. During this period, we conducted comprehensive observations at Fudan University, Jiangwan Campus, in the northeast corner of Shanghai. Similar experiments were also conducted during the same period in 2020 and 2021. Despite the significant reduction of approximately 30 % in VOCs and around 50 % in NO2 due to static management in 2022, the average ozone level increased by nearly 23 % compared to 2020 and 2021. This suggests that the reduction in ozone precursors and other pollutants did not lead to a corresponding decrease in ozone concentrations as expected. Cluster analysis of diurnal patterns of ozone concentration revealed four distinct types of diurnal ozone variations. Cluster 3 and cluster 4, with high ozone levels, experienced significant increases in their shares during static management, ultimately leading to an overall increase in average ozone levels in 2022. According to the observation-based model (OBM) simulation analysis, the average peak concentrations of OH, HO2, and RO2 in 2022 were estimated to be 5.1×10⁶, 4.7×10⁸, and 2.6×10⁸ , respectively, representing an increase of about 30 % compared to the levels in 2020 and 2021. Although HONO photolysis was the main contributor to the primary source of ROx radicals, the radical-cycling process remained dominant for the overall production of ROx radicals. Due to a significant decrease in NO2 concentration relative to VOCs, the average VOC NO2 ratio increased from 1.6 in 2020 to 3.0 in 2022, which is also reflected in the radical cycling. The ratio of OH radical propagation (OH + VOCs) to termination (OH + NO2) was 2.37, higher than 1.18 in 2020 and 1.78 in 2021, indicating that the different reduction proportions of precursors led to a higher VOC NO2 ratio, strengthening the radical cycling. The differential reduction in precursor VOCs and NO2 levels due to static management is the underlying cause of the increase in ozone concentration in Shanghai.
- Article
(5215 KB) - Full-text XML
-
Supplement
(4923 KB) - BibTeX
- EndNote


To curb the spread of the Omicron variant in Shanghai, China, the local government decided to implement city-wide static management in early April 2022. The strict 2-month lockdown severely impacted the economic activities and human life of this megacity. According to official statistics (https://tjj.sh.gov.cn/sjfb/index.html, last access: 20 April 2024), in April and May 2022, Shanghai experienced a year-on-year decrease of 42 % in its total industrial output value. Moreover, the total volume of transported goods decreased by 30 % year-on-year, with road transport witnessing a significant drop of 64 %. Additionally, the port cargo throughput decreased by 31 % year-on-year. The direct effect of such lockdown policies on air quality is a significant reduction in anthropogenic emissions, which can be considered an ideal experiment on emissions control in a megacity to explore the reduction potential and response of air quality. It makes sense to take advantage of this rare yet regrettable window to study the causes and management of air pollution, especially in countries like China that face complex air pollution issues.
Prior to this, China had implemented a series of nationwide lockdown measures to combat the occurrence and spread of the virus in early 2020. This reduction in human activity was expected to significantly reduce air pollutant emissions, as confirmed by many studies on the lockdown in 2020 (Bao and Zhang, 2020; Huang et al., 2021; R. Li et al., 2021; Liu et al., 2020; Tian et al., 2021; Wang et al., 2021; K. Zhang et al., 2022). Reports on the impact of the lockdown on air quality most commonly focus on measuring nitrogen dioxide (NO2) and fine particulate matter (PM2.5; Agarwal et al., 2020; Hua et al., 2021; Chu et al., 2021). According to satellite data, tropospheric nitrogen oxide (NOx) emissions have decreased by 30 %–60 % compared to pre-lockdown levels (Feng et al., 2020; Ding et al., 2020; Venter et al., 2020). Similarly, surface PM2.5 levels in northern China have also decreased by approximately 35 %. Meanwhile, the average O3 concentration has increased 1.5–2 times (Shi and Brasseur, 2020). In Wuhan, the urban area that implemented stringent measures to limit the spread of the Coronavirus, concentrations of PM2.5, NO2, and ozone also exhibited similar changes (Shi and Brasseur, 2020). Among these pollutants, NO2 from traffic sources has shown the most significant reduction, with traffic-related NO2 exhibiting the largest decrease (Rana et al., 2021; Wang et al., 2020). Huang et al. (2021) suggest that an increase in O3 enhances atmospheric oxidation capacity, providing favorable conditions for the formation of secondary particulate matter. Due to the lockdown taking place during winter, which is a season of high particulate matter pollution in China, reports on the impact of the lockdown on air quality have focused more on the changes in particulate matter. The lockdown in Shanghai in 2022 was implemented in April and May during the high-ozone (O3) season and lasted for a longer duration, providing an opportunity to study atmospheric pollution primarily caused by O3.
Previous extensive research has demonstrated that the formation of O3 in response to its precursors is highly nonlinear rather than linear, which presents a challenge in ozone control (Liu and Shi, 2021; Wang et al., 2017; Sillman, 1999). The COVID-19 pandemic provided a costly experiment to validate this. During the static management period in Shanghai, despite a reduction in precursor emissions, the ozone levels increased compared to the previous year. The cause of this increase is attributed to an imbalance in the reduction ratio of nitrogen oxides (NOx) and volatile organic compounds (VOCs) rather than meteorological conditions, according to satellite observation results (Tan and Wang, 2022; Xue et al., 2022). In this current study, the aim is to elucidate the reasons behind the increase in ozone levels in Shanghai through a comprehensive approach involving in situ observations, mathematical analysis, and modeling. Benefitting from our routine observational campaigns, we have obtained comprehensive observational data for both the static management period and the corresponding historical periods. We initiated our analysis by comparing pollutant levels and diurnal variations during the static management period with those from historical reference periods. Subsequently, by clustering diurnal ozone profile patterns, we examined the reasons behind the elevated ozone levels from a statistical perspective. Furthermore, we discuss changes in radical chemistry compared to historical periods, shedding light on the increase in ozone concentrations from a photochemical process standpoint. It is worth mentioning that based on previous research and on our analysis, meteorological conditions are not considered to be the primary cause of the ozone increase during the static management period, even though we acknowledge that meteorological conditions are indeed important factors influencing ozone levels. The in-depth comparison of meteorological conditions is presented in Sect. S1 in the Supplement.
2.1 Location and experimental setup
During the static management period in April and May of 2022, we conducted comprehensive observational experiments at Fudan University's Jiangwan Campus (31.34° N, 121.51° E), located in an urban area in northeastern Shanghai, China. Similar experiments were also conducted during the corresponding periods in 2020 and 2021. The ambient concentrations of O3, NO2, SO2, HONO, and HCHO were measured using the differential optical absorption spectroscopy (DOAS) system located on the rooftop of the Environmental Science Building (Zhu et al., 2020, 2022; Guo et al., 2021). Based on the given optical path length and integration time, the detection limits for O3, NO2, SO2, HONO, and HCHO were approximately 1.3, 0.5, 0.1, 0.1, and 0.5 ppbv, respectively. The measurements were carried out with a time resolution of 5–6 min and detailed fitting configurations are available in Table S1 in the Supplement. Non-methane volatile organic compounds (NMVOCs) were monitored in real-time using the TH-300B online monitoring instrument, which has been described in detail in previous reports (Gu et al., 2022; Zhu et al., 2020). The photolysis rate of NO2 (j(NO2)) was measured using a filter radiometer (Meteorologieconsult Gmbh, Germany). The meteorological parameter data such as pressure (P), temperature (TEMP), relative humidity (RH), wind speed (WS), wind direction (WD), and boundary layer height (BLH) were derived from the European Center for Medium-Range Weather Forecasts (ECMWF) atmospheric reanalysis product ERA5 and extracted from the nest where the measurement site is located. The PM2.5 data were obtained from the Yangpu environment monitoring station (31.53° N, 121.25° E) near the measurement site.
2.2 Observation-based model (OBM)
The open-source zero-dimensional box model tool AtChem2, which was specifically designed for use with the Master Chemical Mechanism (MCM; Sommariva et al., 2020), was used to simulate atmospheric chemical processes. The MCM, one of most widely used chemical mechanisms for chemistry, is a near-explicit chemical mechanism that describes the degradation of methane; 142 non-methane VOCs; and over 17 000 elementary reactions of 6700 primary, secondary, and radical species (http://mcm.york.ac.uk/, last access: 16 January 2023; Jenkin et al., 2003; Saunders et al., 2003). AtChem2 software and documentation can be found on https://github.com/AtChem/ (last access: 16 January 2023).
In this study, the observed data of O3, NO2, SO2, HONO, HCHO, NMVOCs, j(NO2), P, T, RH, and BLH were used as inputs to constrain the model calculations. The photolysis rates of other molecules such as O3, HCHO, HONO, and OVOCs can be calculated in this model platform with the basic principle driven by the solar zenith angle and scaled by the measured j(NO2) (Sommariva et al., 2020). The removal of all unconstrained and simulated species caused by the deposition is determined by a parameterization approach and is determined by the accumulation of the deposition velocity of 0.01 m s−1 within the boundary layer (Santiago et al., 2017). The sensitivity of simulation results to the deposition velocity has been studied in previous research, and the impact is limited (Zhu et al., 2020). The model outputs include the concentration of the hydroxyl radical (OH) and hydroperoxy radical (HO2), as well as the reaction rates at each step of the simulation process.
2.3 Machine learning
Two machine learning methods, k-means clustering and the stacking model, were utilized in this study. In order to investigate the reasons for the overall increase in ozone levels during the static management period from the perspective of its diurnal variation, the k-means clustering method was applied to cluster 24 h time series of O3 concentration (Zhang et al., 2004). Time series clustering is a specific application of curve clustering, which is similar to trajectory clustering in the transport of air masses (Darby, 2005; Suris et al., 2022). The procedure for k-means clustering is as follows: (i) randomly initialize k clusters and then calculate the cluster centroid or mean, (ii) assign each data point to the nearest cluster using an appropriate distance measure, (iii) re-calculate the cluster centroids based on the current cluster members, and (iv) repeat steps ii and iii until there is no further change.
Additionally, the stacking model was applied to address missing values in DOAS observations caused by uncontrollable factors, ensuring the continuity and variation characteristics of the data. This step was deemed necessary for two main reasons. Firstly, the clustering analysis of O3 diurnal variation demands a continuous time series without any missing values. Secondly, compared to the conventional method of handling missing data in the input of the OBM model through simple linear interpolation, the stacking model preserves the diurnal variation characteristics of the data, ensuring the correct constraints on the OBM model. The stacked model is an ensemble machine learning algorithm that consists of two levels, with two or more base models at level 0 and one meta-model at level 1. The meta-model is trained using predictions made by the base models on out-of-sample data. In other words, data that were not used to train the base models are fed into them to make predictions. These predictions, along with the corresponding expected outputs, form the input and output pairs of the training dataset used to fit the meta-model. The stacking model has been previously described in detail and demonstrated good performance in Zhu et al. (2022), and the architecture of the stacking model can also be found in Fig. S1 in the Supplement. In this study, the models for O3, NO2, SO2, HONO, and HCHO demonstrated good performance, as shown in Figs. S2–S6.
3.1 Year-on-year changes in air quality
Figure 1 compares the average levels of the meteorological parameters and air pollutants during the period from April to May of 2020 to 2022, while Fig. 2 compares the diurnal variations. In terms of meteorological parameters, the temperature and relative humidity and j(NO2) during the static management period in 2022 were almost unchanged compared to the same period in 2020 and 2021. The average temperature difference in 2022 was 6.5 °C, which was similar to that in 2020 and slightly higher than that in 2021, while the average relative humidity at noon in 2022 was also comparable to that in 2020 and was 5 % lower than that in 2021. Furthermore, we also ruled out the contribution of transport from the surrounding areas to the increase in ozone concentration in Shanghai during the 2022 static management period (see Figs. S7–S10). The abrupt reduction in emissions across the entire industry led to a significant decrease in primary pollutant concentrations. The average concentrations of PM2.5 in April and May from 2020 to 2022 were 36.8 ± 24.1, 30.0 ± 23.1, and 21.8 ± 14.0 ug m−3, respectively, showing a decreasing trend over the years. Additionally, the diurnal variation profile in Fig. 2d shows that PM2.5 levels decreased proportionally throughout the entire 24 h period without any particularly prominent periods of decrease. VOCs and NO2 declined by 29 % and 55 %, respectively, compared to 2020 and by 35 % and 51 %, respectively, compared to 2021. Due to the significant decrease in NO2 concentration compared to VOCs, the average ratio of VOCs NO2 has increased from 1.6 in 2020 to 3.0 in 2022. However, the precursor reduction at different magnitudes has led to an increase of approximately 23 % in the average level of ozone. The photochemical production of ozone is controlled by the non-linear chemistry of the precursor VOCs and NOx (NO2 + NO). The literature has shown that Shanghai in the spring largely operates under a VOC-limited regime (D. Li et al., 2021; Xue et al., 2022). Therefore, the reduction in VOCs during the static management period may not have been enough to counteract the titration effect of NOx and may have even altered the ozone formation regime in Shanghai. From the perspective of diurnal variation (see Fig. 2), the period with a significant difference in the magnitude of the decrease between VOCs and NO2 occurred during the strong photochemical process in the morning until noon. Therefore, the VOC NO2 ratio during the static management period was significantly higher in the morning compared to the same period in 2020 and 2021. The weakening of the titration of nitrogen oxides on ozone during nighttime led to significantly higher nighttime average levels during the static management period compared to 2020 and 2021. Due to the higher O3 baseline concentration and higher VOC NO2 ratio, there was a significant increase in overall ozone levels.
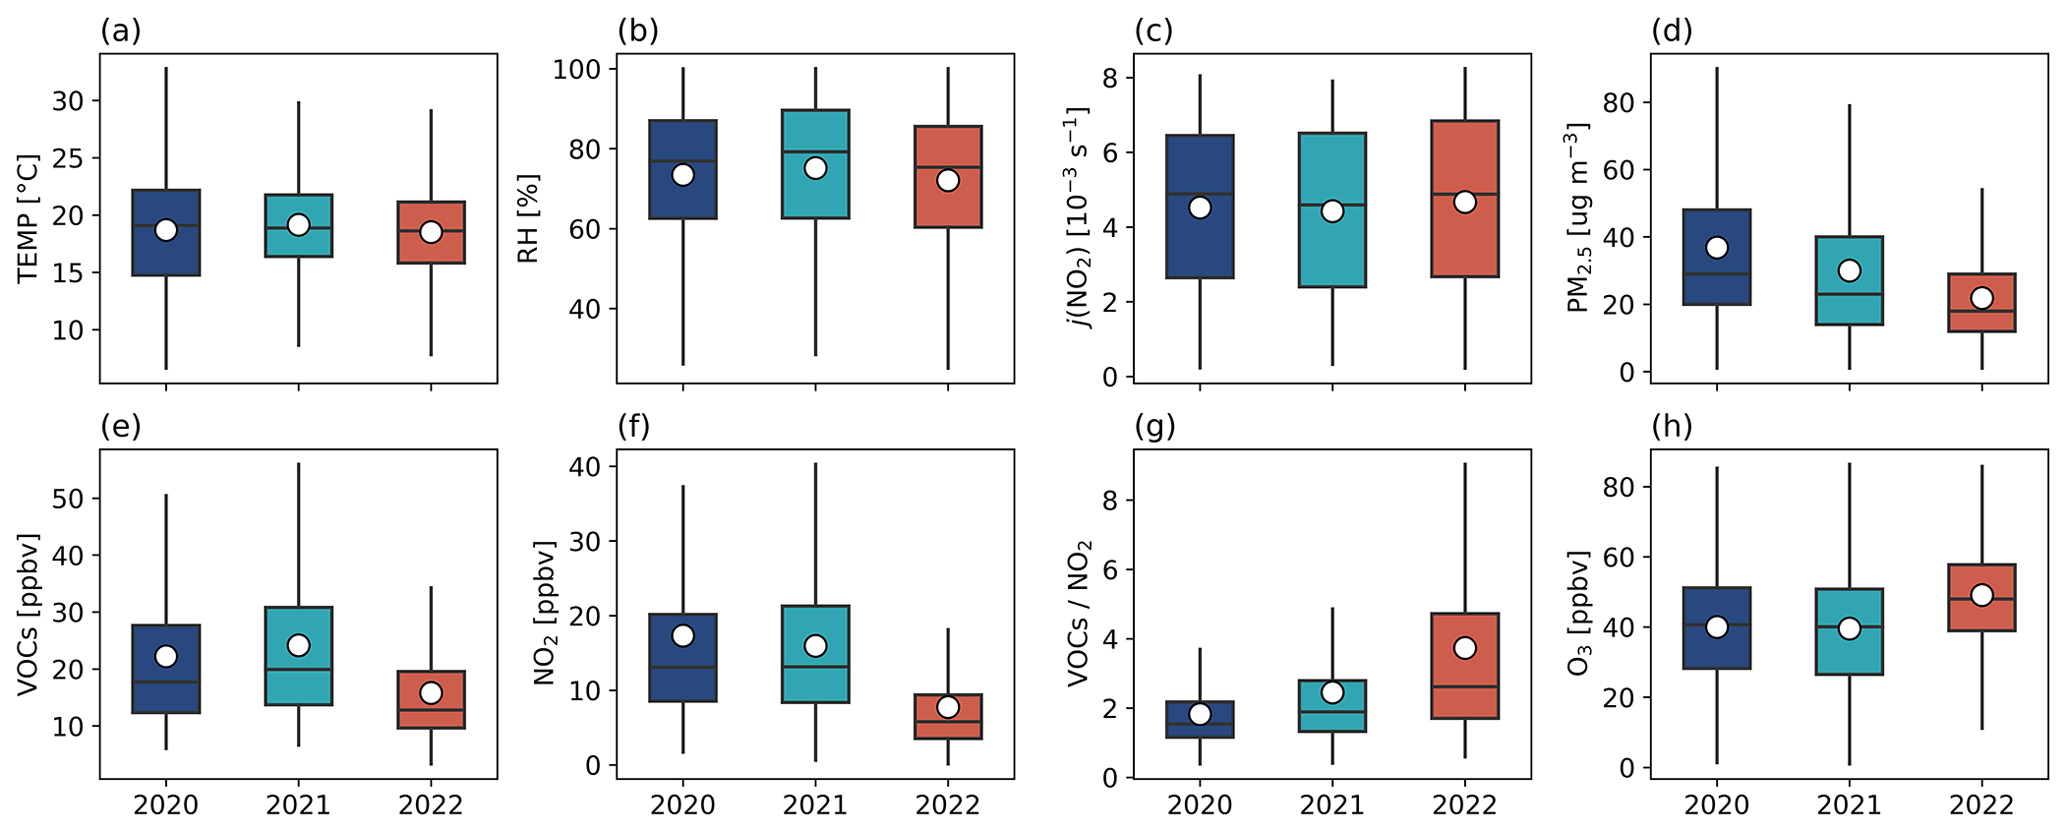
Figure 1Comparison of meteorological parameters (TEMP, RH, and j(NO2)) and air pollutants (PM2.5, VOCs, NO2, VOCs NO2, and O3) during the periods of April to May in 2020, 2021, and 2022. The whiskers for each box correspond to the 95th and 5th percentiles, respectively. The dots represent the averages, and the top, middle, and bottom lines of the boxes mark the 75th, 50th, and 25th percentiles, respectively.
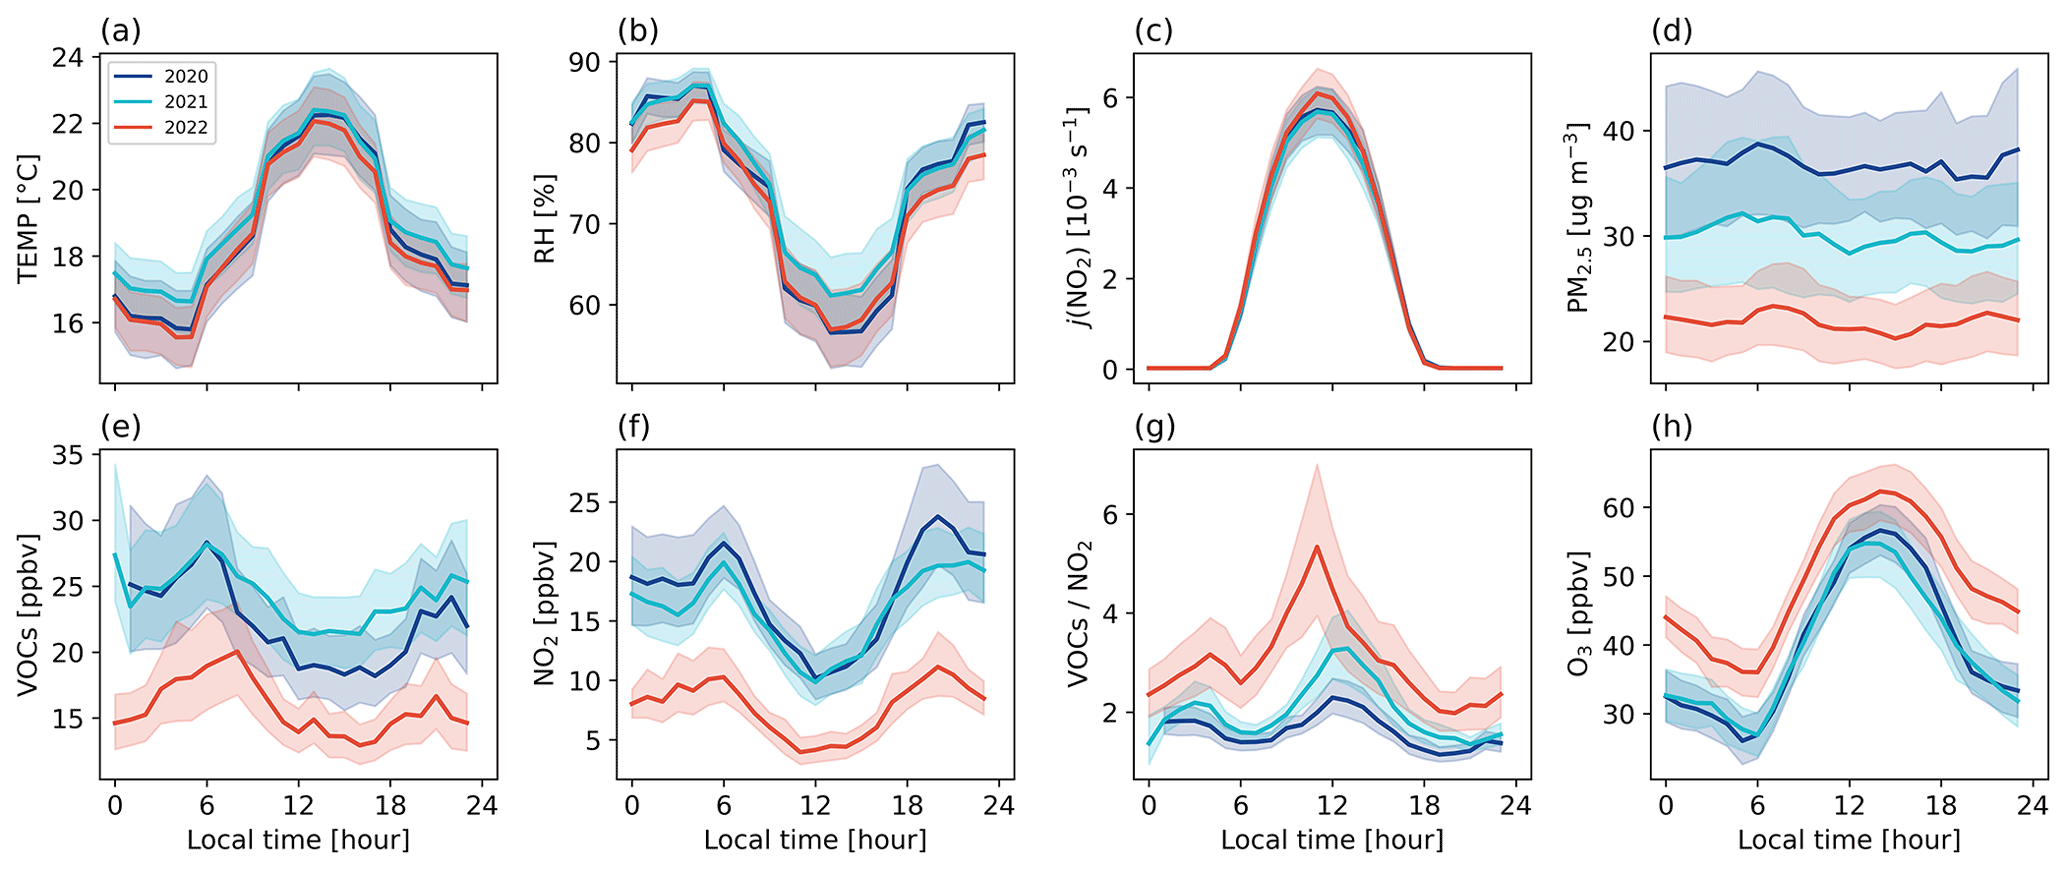
Figure 2The mean diurnal profiles of meteorological parameters and air pollutants during the periods of April to May in 2020, 2021, and 2022. Shaded areas denote 95 % confidence intervals.
As VOCs are crucial precursors for ozone formation, we conducted a comparison of each VOC component during the 2022 static management period with those of the same period in 2020 and 2021, as shown in Fig. 3. We classified the 103 VOCs into six categories based on functional groups, including alkanes, alkenes, alkynes, aromatics, oxygenated VOCs (OVOCs), and halohydrocarbons. The detailed classification is available in Table S2. The results revealed that aromatics experienced the most significant year-over-year reduction in absolute terms. The chemical raw materials and chemical products manufacturing industry, which is the main source of aromatics (Liu et al., 2019), accounts for 10 % of the total industrial output value, and this industry experienced a 32 % year-on-year decrease in total output value during the static management period (https://tjj.sh.gov.cn/sjfb/index.html. last access:20 April 2024). In contrast, OVOCs remained relatively stable, primarily because they are sourced from biogenic compounds (Liu et al., 2019) and thus were less impacted by lockdown measures relative to other VOCs. From the perspective of ozone formation potential (OFP) in the years 2020 and 2021, the primary contributors were aromatics followed by alkenes, while in 2022, the primary contributors shifted to alkenes with OVOCs coming in second (see Sect. S4 and Fig. S11).
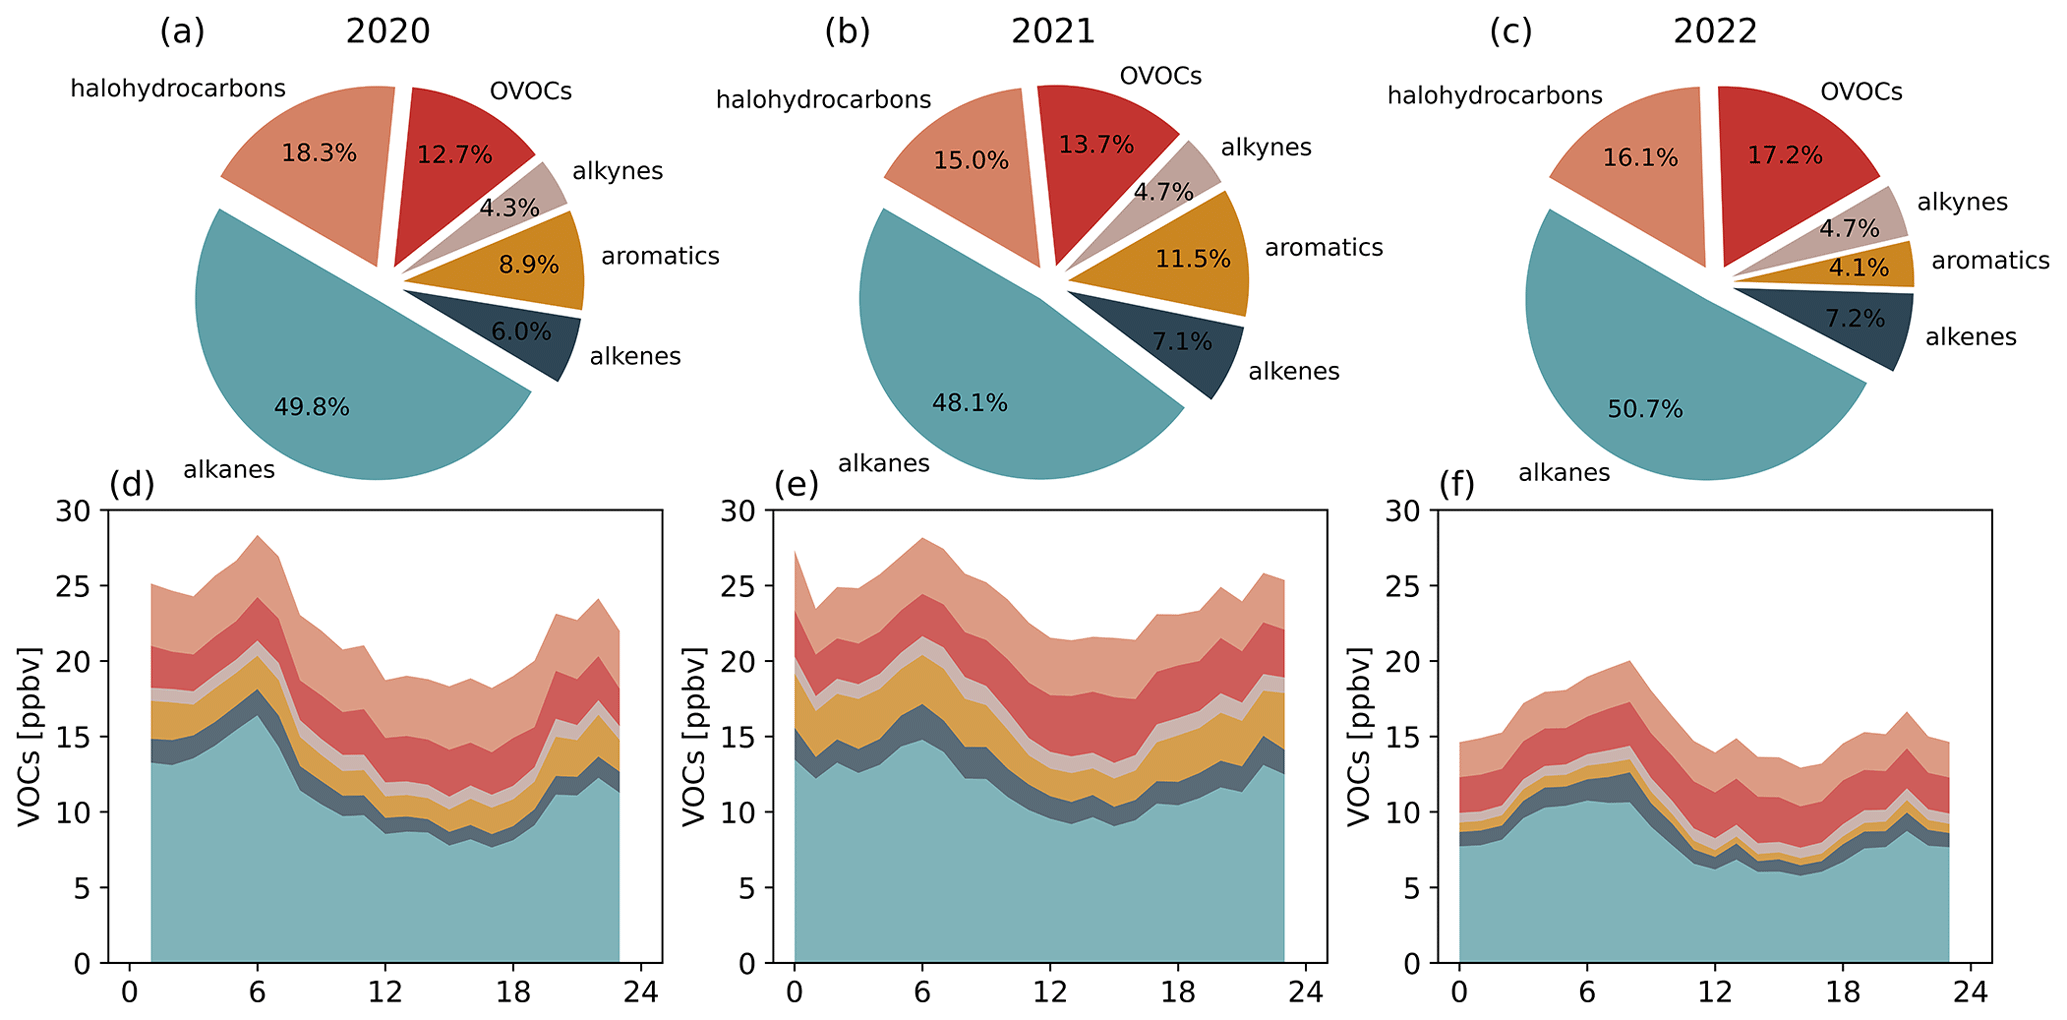
Figure 3The proportions (a–c) and the mean diurnal profiles (d–f) of different VOC components during the periods of April to May in 2020, 2021, and 2022.
The reduction in the imbalance of VOCs has altered the average proportion of each component. Specifically, the proportion of aromatics decreased from 8.9 % and 11.5 % to 4.1 %, while the proportion of OVOCs increased from 12.7 % and 13.7 % to 17.2 %. The photolysis of OVOCs is a major source of the important radical ROx (OH + HO2 + RO2) in the photochemical cycle, with a daily average contribution rate of over 30 % (Xue et al., 2016). In the radical-chemistry section, the photolysis of OVOCs as well as the reactions of O3 and NO3 with VOCs have been quantified for their contributions to the radicals. Additionally, the role of VOCs in the propagation of radicals has been quantified. The mean diurnal profiles of the VOCs indicated that the daily average concentration ranges in 2020, 2021, and 2022 were 18–28, 21–28, and 13–20 ppbv, respectively.
In 2022, the peak time of VOCs was observed at 08:00 LT, which exhibited a delay compared to the peak times observed in 2020 and 2021 at 06:00 LT, resembling the previously reported “weekend effect” on VOCs – that the peak time of VOCs is delayed on weekends in comparison to weekdays (Cai et al., 2010). In Fig. S12, after the lifting of restrictions, we observe that the peak of the VOC diurnal profile in June 2023 returned to 06:00 LT. This finding indicates that the reduced human activities during the 2022 period, similar to weekends, led to a decline in anthropogenic VOC emissions in the morning.
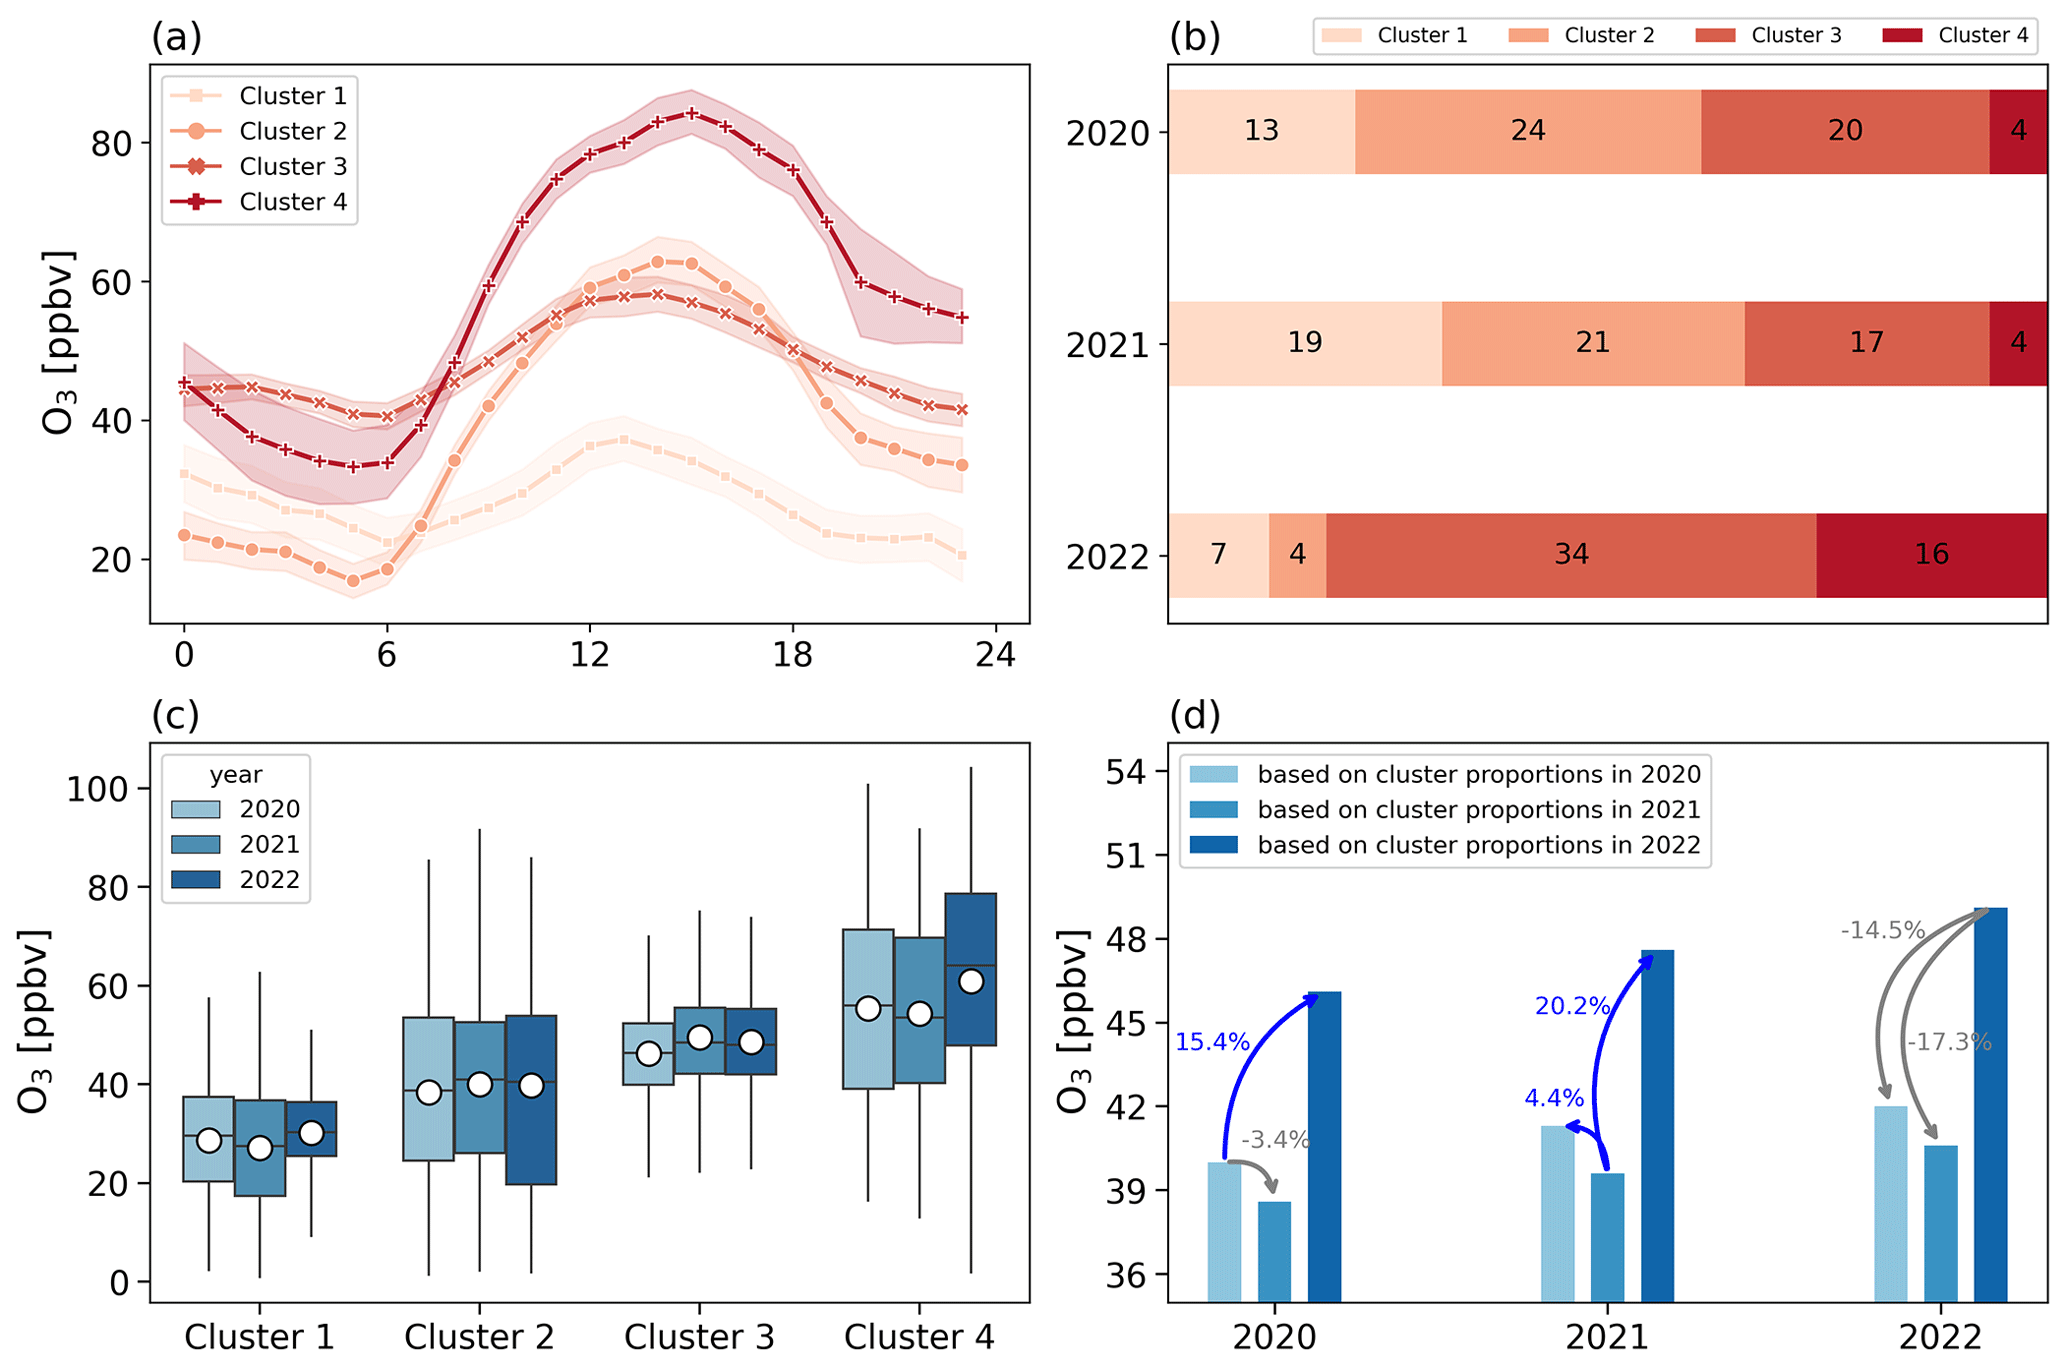
Figure 4(a) Comparison of the mean diurnal profiles of the four types of O3 after clustering. Shaded areas denote 95 % confidence intervals. (b) The proportions of the four clusters in 2020, 2021 and 2022. (c) Comparison of the O3 levels of the four clusters in 2020, 2021 and 2022. The whiskers for each box correspond to the 95th and 5th percentiles, respectively. The dots represent the averages, and the top, middle, and bottom lines of the box mark the 75th, 50th, and 25th percentiles, respectively. (d) Comparison of the average ozone concentrations in 2020, 2021, and 2022 for different ratios of the four clusters.
3.2 Clustering of O3 diurnal profiles
The k-means algorithm clustered the ozone diurnal profiles over the 3 years into four types, as shown in Fig. 4a. We define the minimum concentration in the ozone diurnal profile as the background concentration, and the difference between the midday peak and the morning trough represents the net ozone production. These four types of profiles can be described as follows: cluster 1, with low background concentration (22.4 ppbv) and low net production (14.8 ppbv); cluster 2, with low background concentration (16.9 ppbv) and high net production (45.9 ppbv); cluster 3, with high background concentration (40.6 ppbv) and low net production (17.5 ppbv); and cluster 4, with high background concentration (33.3 ppbv) and high net production (50.9 ppbv). The background concentration of ozone is mainly determined by the nighttime loss of ozone and the titration of nitrogen oxides in the morning, while the net production depends on the intensity of the photochemical reactions. In Fig. 4b, the four ozone profiles occurred for 13, 24, 20, and 4 d in 2020 and for comparable time periods of 19, 21, 17, and 4 d in 2021. During the static management period of 2022 when the nitrogen oxide titration effect weakened, the number of days on which cluster 3 and cluster 4 appeared increased to 34 and 16, respectively. The average ozone levels for the four types were comparable across 2020, 2021, and 2022, ranging from 27–30 ppbv for cluster 1, 38–40 ppbv for cluster 2, 46–49 ppbv for cluster 3, and 54–61 ppbv for cluster 4 (Fig. 4c). As depicted in Fig. 4d, assuming that the proportions of the four types in 2022 were the same as those in 2020 and 2021, the average ozone levels in 2022 would have decreased by 14.5 % and 17.3 %, respectively, remaining comparable to the levels in 2020 and 2021. Alternatively, if the proportions of the four types in 2020 and 2021 were the same as those in 2022, the average ozone levels in 2020 and 2021 would have increased by 15.4 % and 20.2 %, respectively, which would be very close to the levels in 2022. Purely statistical analysis indicated that the significant high and stable level of ozone in 2022 was due to higher proportions of cluster 3 and cluster 4, which had higher ozone concentrations during the static management period.
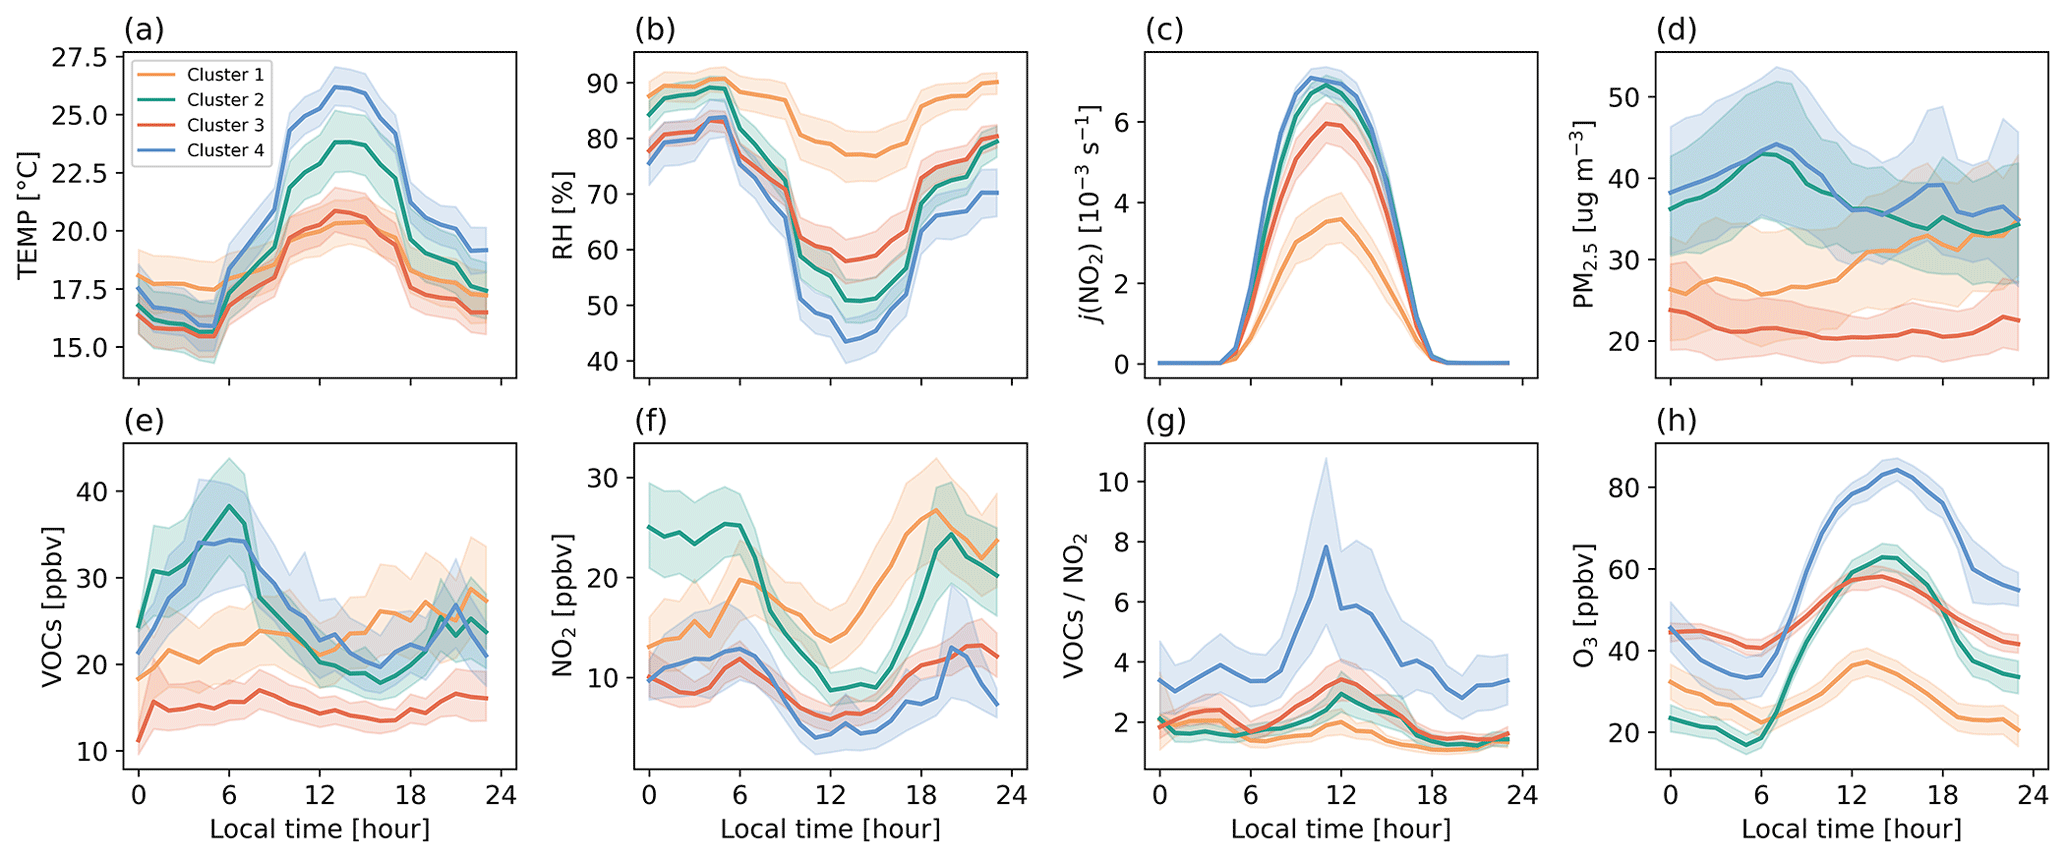
Figure 5The mean diurnal profiles of meteorological parameters and air pollutants for four clusters over 3 years. Shaded areas denote 95 % confidence intervals.
Different types of ozone profiles are formed under different meteorological conditions and pollution environments with distinctive diurnal variations. As shown in Fig. 5, the meteorological conditions during the periods of cluster 2 and cluster 4, with high net ozone production, were characterized by high temperature, low relative humidity, and high radiation compared to those during the cluster 1 and cluster 3 periods. This is consistent with the well-known favorable condition promoting ozone production. The valley values of ozone profiles are closely related to the titration of nitrogen oxides, as shown in Fig. 5f and h, where the valley values of ozone are inversely related to the peak values of NO2 during the morning rush hour. Indeed, it is these meteorological conditions and titration that result in the formation of the corresponding four clusters of ozone profiles. During periods of cluster 2 and cluster 4, a large amount of VOCs accumulated before sunrise and were rapidly consumed after sunrise. Similarly, the precursor NO2 was also rapidly consumed after sunrise, with the difference being that the NO2 level during cluster 4 was lower than that during cluster 2. The diurnal profiles of PM2.5 during the four clusters exhibit similar patterns to those of VOCs, with cluster 2 and cluster 4 exhibiting a distinct morning peak. The VOC NO2 ratio in cluster 4 was significantly higher than that in the other clusters, which may explain the substantial net ozone production despite the relatively high ozone background levels. The differences among the clusters are also reflected in the photochemical processes. In the following sections, we investigate the reasons for the increase in ozone levels during the static management period from the perspective of the atmospheric oxidizing capacity and free-radical chemistry.
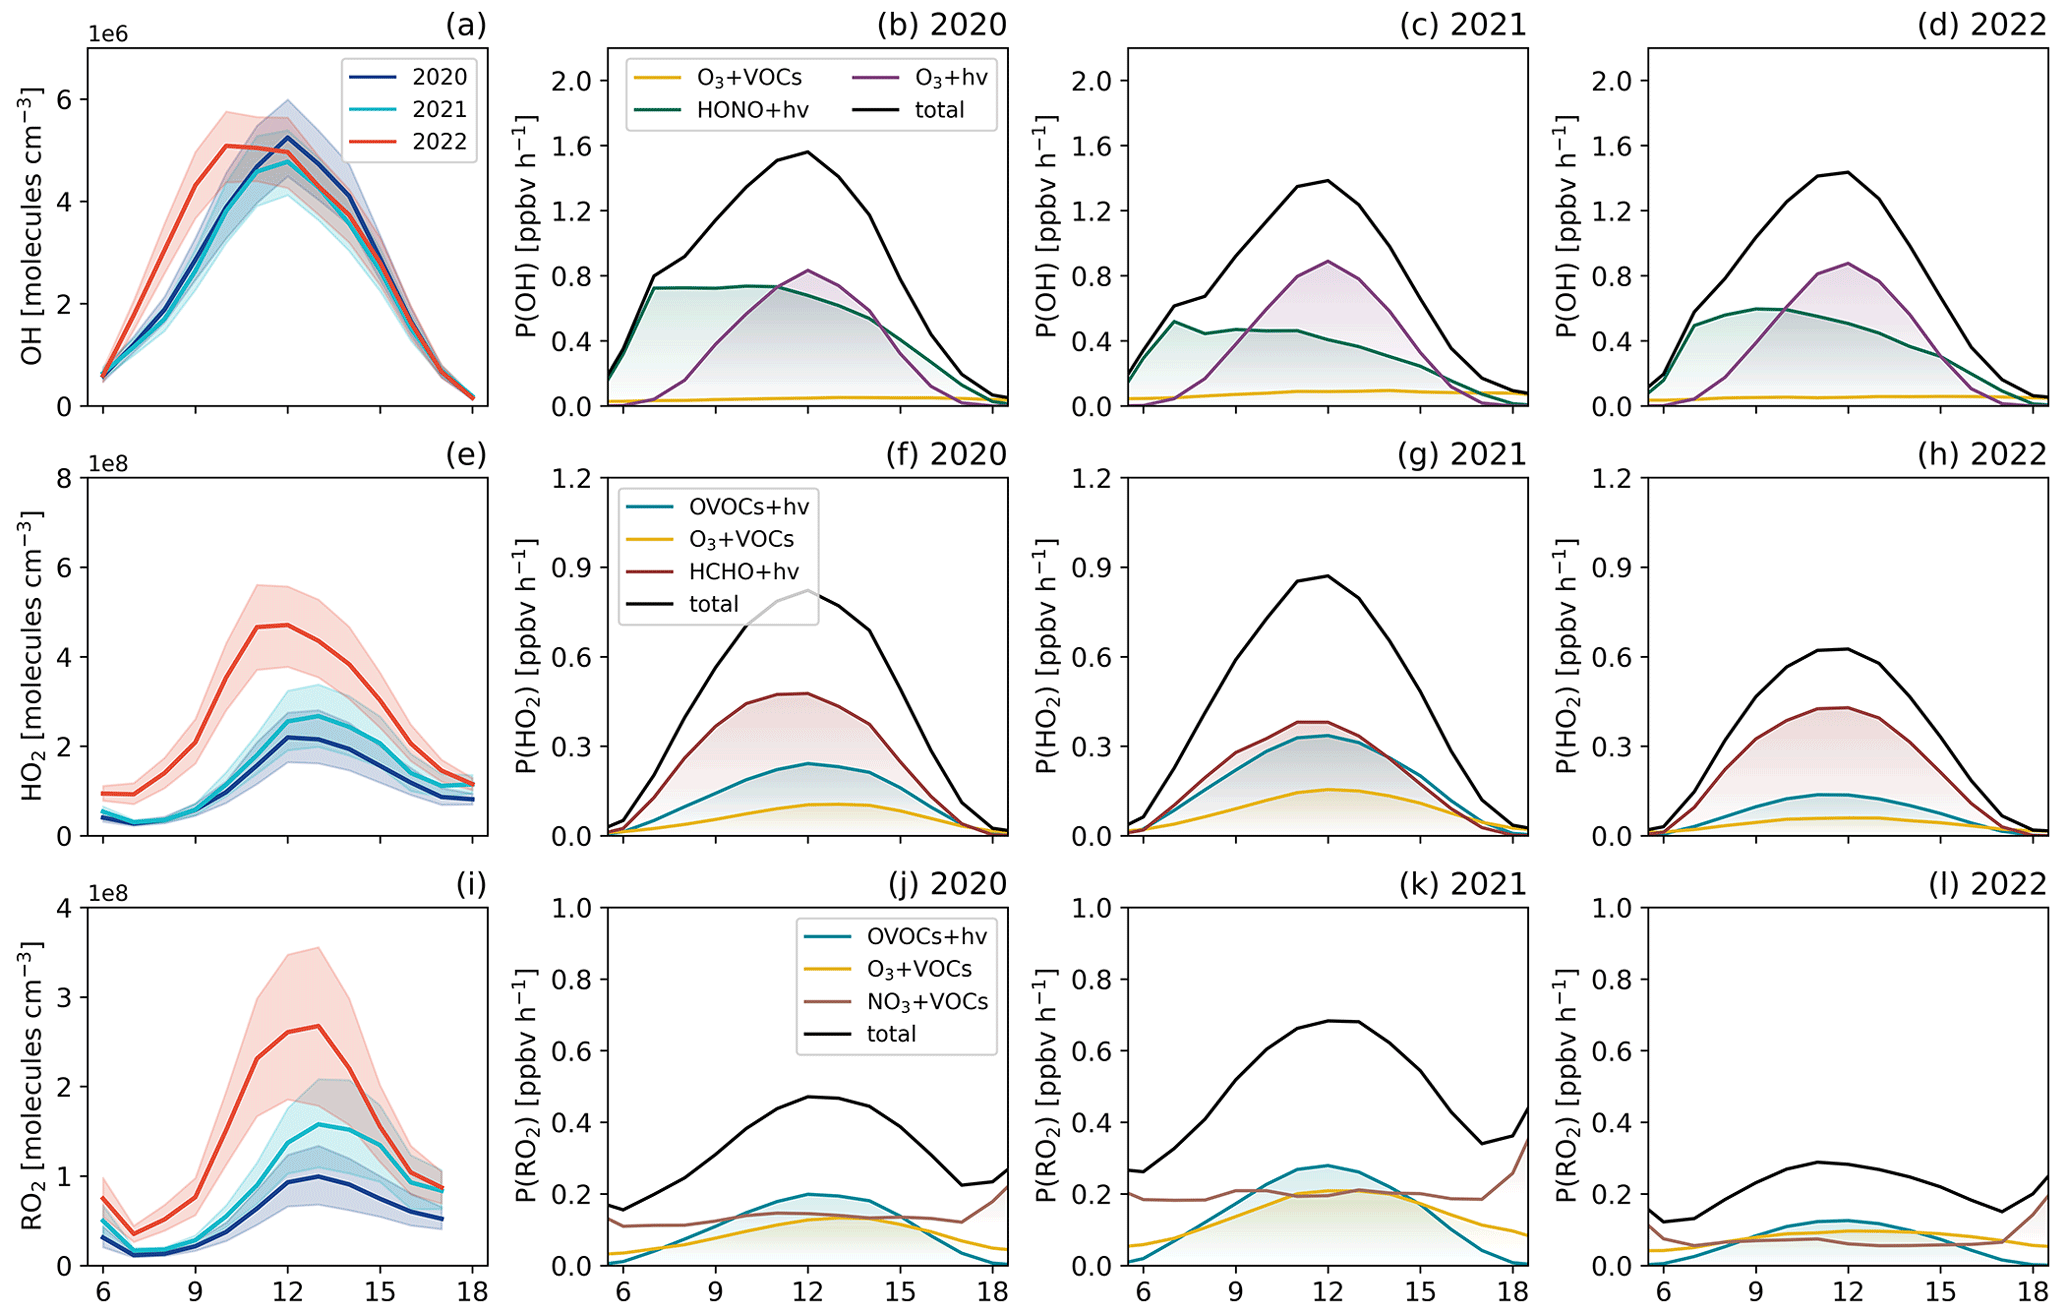
Figure 6The mean diurnal profiles of simulated OH (a), HO2 (e), and RO2 (i) concentrations in 2020, 2021, and 2022. Shaded areas denote 95 % confidence intervals. The mean diurnal profiles of primary sources of OH radicals (b–d), HO2 radicals (f–h), and RO2 radicals (j–l) from model calculations in 2020, 2021, and 2022.
3.3 Radical chemistry
Figure 6a, e, and i show the mean diurnal profiles of simulated OH, HO2, and RO2 radical concentrations for the years 2020, 2021, and 2022. These radicals exhibit clear diurnal variations with peaks occurring at midday. The mean diurnal profiles show that the average peak concentrations of OH were 5.2×10⁶, 4.8×10⁶, and 5.1×10⁶ ; those of HO2 were 2.2×10⁸, 2.7×10⁸, and 4.7×10⁸ ; and those of RO2 were 0.9×10⁸, 1.6×10⁸ and 2.6×10⁸ in 2020, 2021, and 2022, respectively. The differences in radical concentration levels were mainly reflected in the HO2 and RO2 radicals. The average peak values of the HO2 and RO2 radicals in 2022 were about 1 to 3 times higher than those in the same periods in 2020 and 2021. Reviewing previous observational results, peak concentrations of OH and HO2 were observed at various locations and times (see Table S3): (4–17) ×106 and (2–24) ×108 at a suburban site in Yufa from 18–31 August 2006 (Lu et al., 2013), (5–15) ×106 and (3–14) ×108 at a rural site in Wangdu from 8 June to 8 July 2014 (Tan et al., 2017), 4.5×10⁶ and 3×10⁸ at a suburban in Heshan from 22 October to 5 November 2014 (Tan et al., 2019), (2–9) ×106 and (2–14) ×108 at urban sites in Shenzhen from 5–28 October 2018 (Yang et al., 2022), (8–24) ×106 and (4–28) ×108 at a suburban site in Taizhou from 23 May to 18 June 2018 (Ma et al., 2022), and (10–20) ×106 and (6–18) ×108 at a suburban site in Chengdu from 10–25 August 2019 (Yang et al., 2021). The simulated concentrations of OH and HO2 in this study were comparable to the observed levels during autumn in Shenzhen, which is also an urban site, however, were generally lower than those observed at non-urban sites. This difference can be attributed to the site types but more importantly to the fact that most observations were conducted during periods of stronger radiation. For RO2, the average maximum concentration was simulated as 4.5×10⁸ at an urban site in Beijing in August 2007 (Liu et al., 2012). At a coastal site in Xiamen, the simulated average daily peak reached 4.7×10⁸ in September 2019, while at a coastal site in Ningde, the simulated value was 0.9×10⁸ in spring 2019 (Liu et al., 2022). Overall, our ROx concentrations fell within the range of observations and simulated results in other regions of China. During the static management period in 2022, the levels of ROx were significantly higher compared to the same period in 2020 and 2021, indicating an enhanced atmospheric oxidation capacity in Shanghai in 2022.
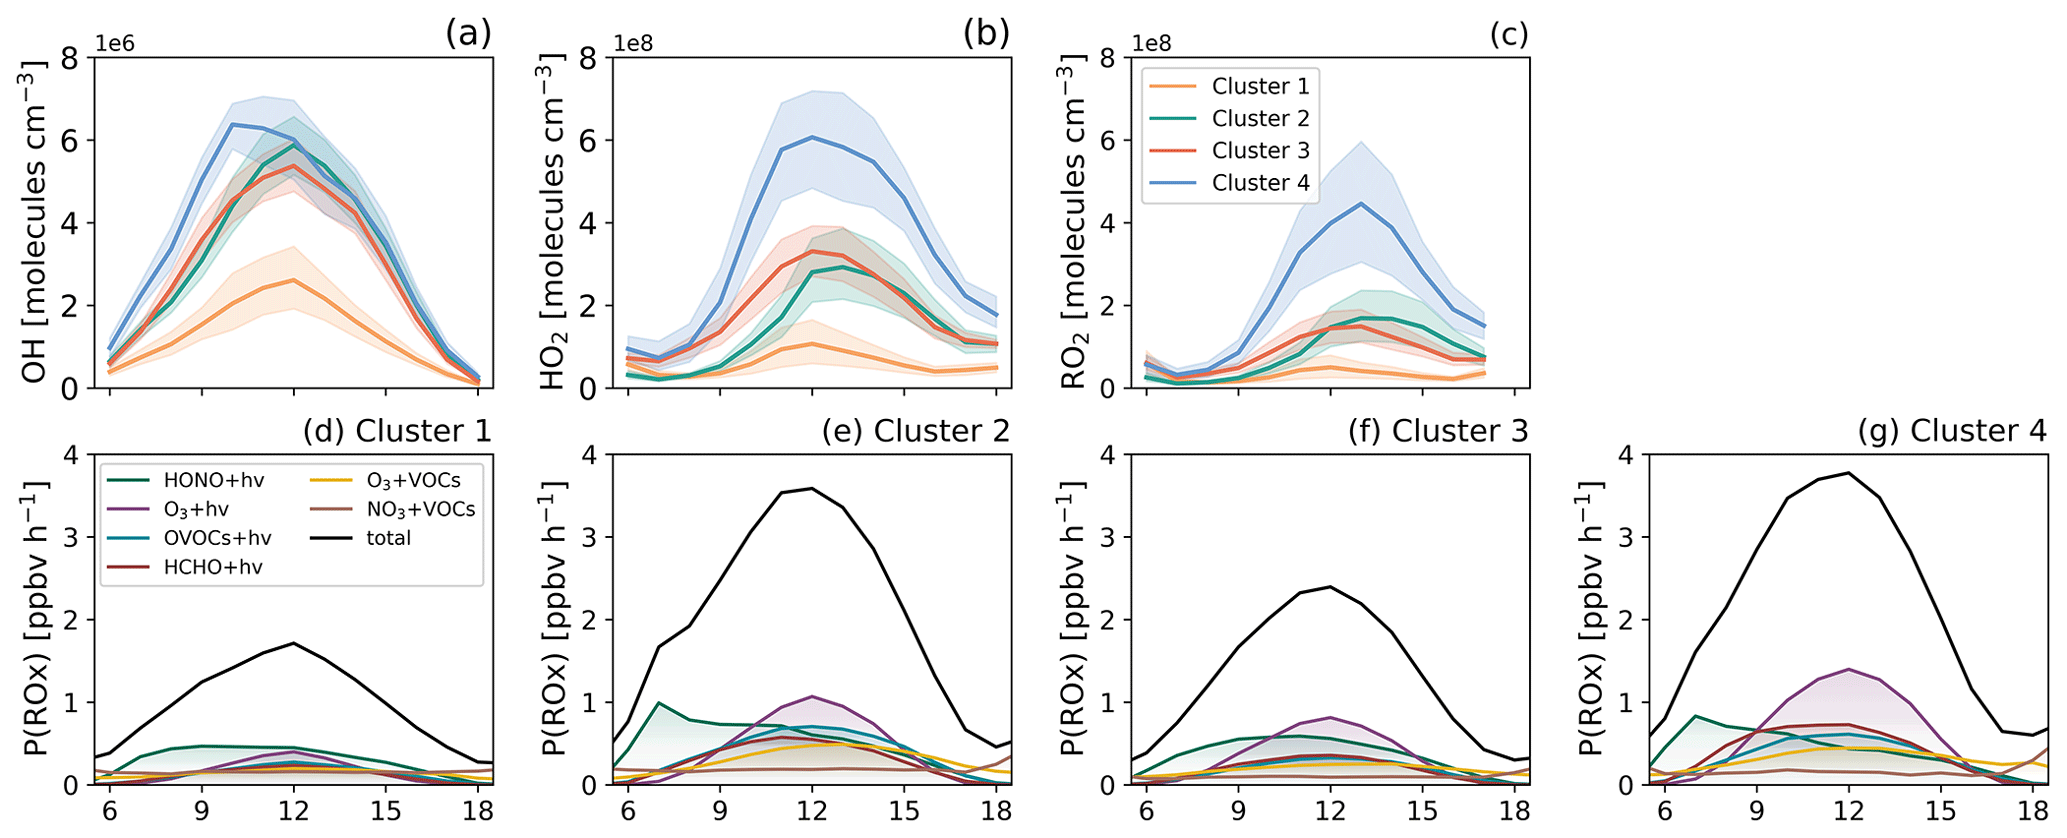
Figure 7The mean diurnal profiles of simulated OH (a), HO2 (b), and RO2 (c) concentrations for cluster 1, cluster 2, cluster 3, and cluster 4. Shaded areas denote 95 % confidence intervals. The mean diurnal profiles of primary sources of ROx radicals (d–g) from model calculations for cluster 1, cluster 2, cluster 3, and cluster 4, respectively.
Figure 6b–d, f–h, and j–l illustrate the mean diurnal variation in primary OH, HO2, and RO2 sources for the years 2020, 2021, and 2022. For OH, HONO photolysis peaked at around 07:00 LT and remained high until around 12:00 LT, with peak values reaching approximately 0.72, 0.52, and 0.60 ppbv h−1 in 2020, 2021, and 2022, respectively. Meanwhile, ozone photolysis peaked at noon, with peak values reaching around 0.83, 0.89, and 0.88 ppbv h−1, respectively. In addition, the ozonolysis of unsaturated VOCs was another source of OH radicals, with an average production rate of less than 0.10 ppbv h−1, while other sources such as the photolysis of H2O2, HNO3, and OVOCs were generally negligible. Overall, HONO photolysis for the daytime accounted for 57 %, 43 %, and 48 % of the total OH primary production rates in 2020, 2021, and 2022, respectively, with O3 photolysis accounting for 39 %, 48 %, and 46 % in the corresponding years. For HO2 radicals, the most important source was HCHO photolysis, with average production rates during daytime of 0.28, 0.21, and 0.25 ppbv h−1 in the corresponding years. The secondary source was OVOC photolysis, which produces HO2 at an average rate of 0.14, 0.20, and 0.08 ppbv h−1, respectively. Another source to consider was reactions of O3 and unsaturated VOCs, which had an average rate of around 0.07 ppbv h−1 for the 3 years. For RO2 radicals, the daytime average peak of primary production rates contributed by OVOC photolysis from 2020 to 2022 were 0.12, 0.16, and 0.07 ppbv h−1, respectively. The reactions of O3 and NO3 with VOCs were also important primary sources of RO2 radicals. The average daily contributions of O3 + VOC reactions from 2020 to 2022 were 0.09, 0.15, and 0.08 ppbv h−1, respectively, while the contributions of NO3 + VOC reactions were 0.13, 0.20, and 0.06 ppbv h−1. The primary production rate of RO2 in 2022 was lower compared to the years 2020 and 2021. This can be attributed to the fact that the primary sources of RO2 are the reactions involving VOCs, which significantly decreased during the static management period and further led to decreased sources of RO2.
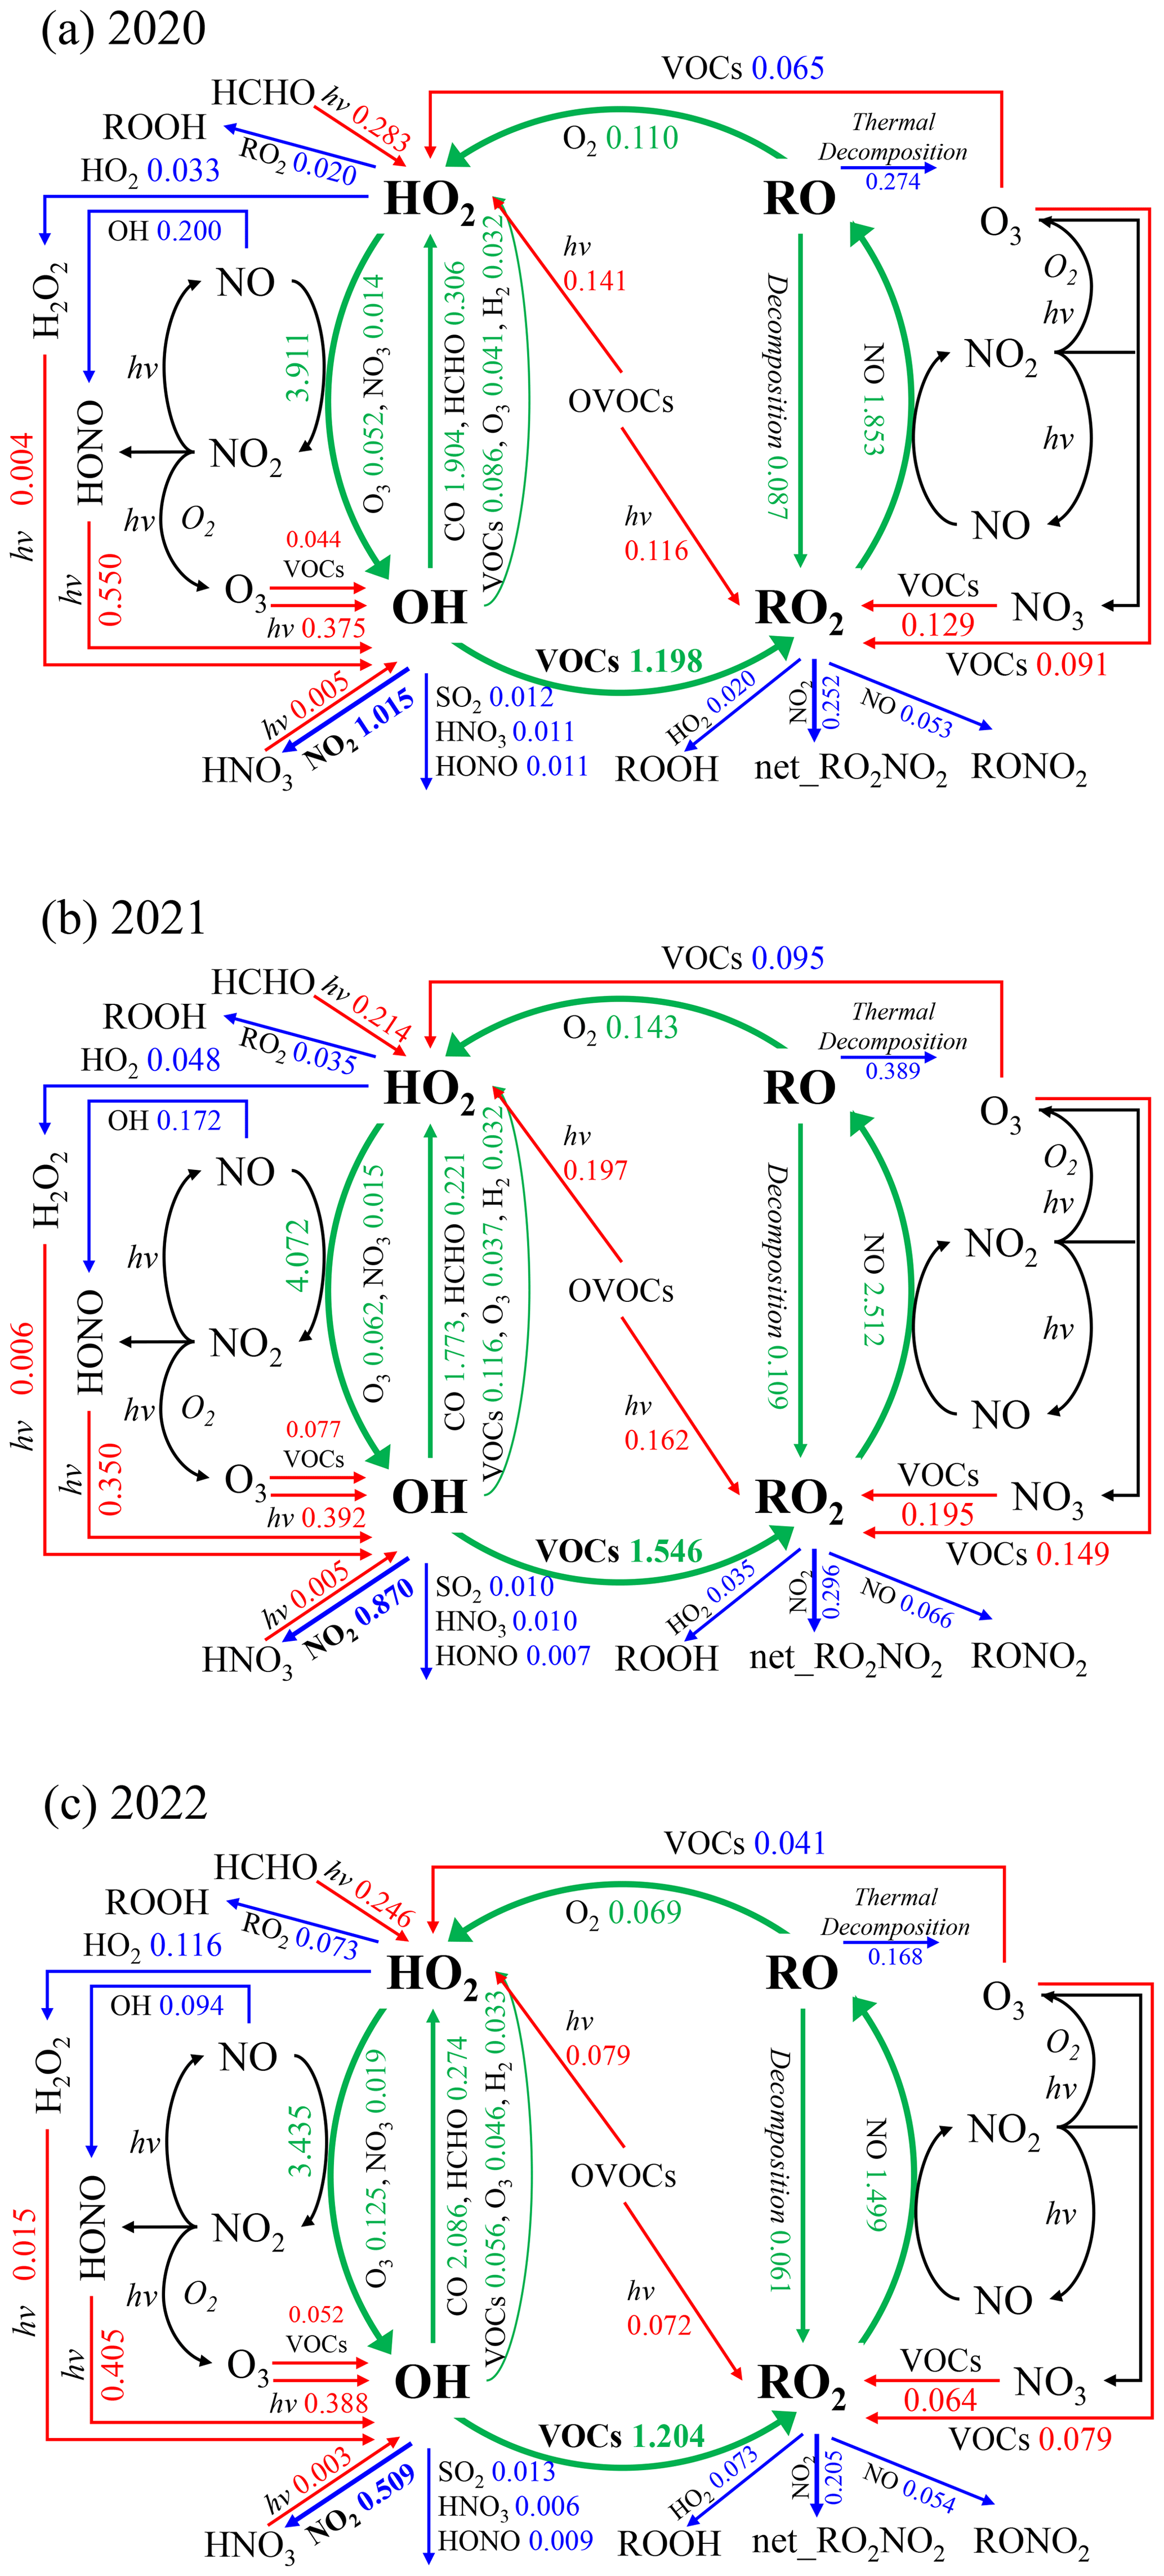
Figure 8Averaged budgets (in ppbv h−1) of ROx radicals in daytime (06:00–18:00 LT) during the periods of April to May in 2020, 2021, and 2022. The red, blue, and green lines and values indicate the primary production, termination, and recycling pathways of radicals, respectively.
Overall, the total primary production rate of ROx in 2022 was 2.34 ppbv h−1, which is lower than 2.94 and 2.85 ppbv h−1 in 2021, as shown in Fig. S13. These values are higher than the simulated value of 1.56 ppbv h−1 in November 2019 in downtown Shanghai (G. Zhang et al., 2022) but close to the value of 2.55 ppbv h−1 during the ozone episode in suburban Shanghai in 2018 (Zhang et al., 2021). During these 3 years, reactions involving VOCs (excluding HCHO) accounted for 18.3 %, 28.1 %, and 26.5 %, respectively, which is correlated with the observed VOC abundances. In 2020 and 2022, HONO photolysis accounted for 30.7 % and 28.4 % of the total primary production rates, respectively, with O3 photolysis following at 20.9 % and 27.2 %. In 2021, the dominant contribution was from O3 photolysis, reaching 21.4 %, followed by HONO photolysis at 19.6 %. Radical chemistry exhibits heterogeneity across different cities, with HONO photolysis being a primary source in New York (Ren et al., 2003), Paris (Michoud et al., 2012), Wangdu (Tan et al., 2017), and Taizhou (Ma et al., 2022). OVOC photolysis dominated in Mexico City (Sheehy et al., 2010), Hong Kong (Xue et al., 2016), and Beijing (Liu et al., 2012). Milan saw HCHO photolysis as a major source (Alicke et al., 2002), while ozone photolysis was prominent in Nashville (Martinez et al., 2003).
We also investigated radical chemistry under different ozone profile clusters (Fig. 7). The average peaks of OH in cluster 1, cluster 2, cluster 3, and cluster 4 were 2.6×10⁶, 5.9×10⁶, 5.4×10⁶, and 6.4×10⁶ ; those of HO2 were 1.1×10⁸, 2.9×10⁸, 3.3×10⁸, and 6.1×10⁸ ; and those of RO2 were 0.5×10⁸, 1.7×10⁸, 1.5×10⁸, and 4.5×10⁸ , in the respective years. Clearly, cluster 4 had the highest levels of OH, HO2, and RO2 radicals among all clusters, with HO2 and RO2 radicals being particularly prominent. The average peaks of P(ROx) for clusters 1 to 4 were 1.71, 3.58, 2.39, and 3.77 ppbv h−1, respectively. Cluster 2 and cluster 4, characterized by significant net ozone production, exhibit distinct features in radical chemistry. The daily average of P(ROx) was 2.28 ppbv h−1 in cluster 2 and 2.37 ppbv h−1 in cluster 4, which are higher than the values of 1.08 ppbv h−1 in cluster 1 and 1.44 ppbv h−1 in cluster 3. In addition, HONO photolysis during the morning rush hour was particularly prominent in cluster 2 and cluster 4, with peak values reaching 0.99 and 0.83 ppbv h−1, respectively. In cluster 2, HONO photolysis was the dominant source, with a daily average of 0.56 ppbv h−1 accounting for 25 % of the total, and ozone photolysis followed, with 0.47 ppbv h−1 accounting for 21 %. On the other hand, in cluster 4, ozone photolysis took the lead with 0.65 ppbv h−1, representing 27 % of the total, and HONO photolysis came next with 0.47 ppbv h−1, accounting for 20 %. Additionally, OVOC photolysis (including HCHO) in cluster 2 and cluster 4 showed a significant increase compared to cluster 1 and cluster 3. The correlation analysis between the each primary source of radicals and the net ozone production reveals a significant correlation (see Fig. S15), which shows that a large amount of net ozone production implies the presence of active photochemical processes. Cluster 4 is characterized by higher concentrations of HO2 and RO2 radicals and a higher primary source of radicals. Cluster 3 has moderate levels of radical concentrations and primary sources of radicals, but it features a high ozone background value. The increase in the number of days associated with these two clusters in 2022 contributed to the elevated ozone levels.
In tropospheric chemistry, radical initiation, which involves the breakdown of closed-shell species to generate new radicals, plays a crucial role in initiating the formation of secondary pollutants. However, in highly polluted atmospheric environments, radical cycling becomes the dominant process, with the amplification of new radicals in the ROx cycle playing a crucial role. Volkamer et al. (2010) quantified the production of new radicals and found that approximately 20 % of radical production is attributed to the breakdown of closed-shell species, while 80 % is derived from radical cycling. Therefore, in addition to understanding the sources of radicals, it is essential to comprehend the impacts of radical cycling and recycling processes on ozone formation. Figure 8 demonstrates the daytime average of ROx radical budgets during the periods of April to May in 2020, 2021, and 2022. Taking the simulation of 2022 as an example, OH oxidation of CO and VOCs produces HO2 and RO2, with daytime average rates of 2.09 ppbv h−1 (1.90 ppbv h−1 in 2020 and 1.77 ppbv h−1 in 2021) and 1.20 ppbv h−1 (1.20 ppbv h−1 in 2020 and 1.55 ppbv h−1 in 2021), respectively. The reactions of RO2 + NO and HO2 + NO further lead to the strong production of RO with a rate of 1.50 ppbv h−1 (1.85 ppbv h−1 in 2020 and 2.51 ppbv h−1 in 2021) and OH with a rate of 3.44 ppbv h−1 (3.91 ppbv h−1 in 2020 and 4.07 ppbv h−1 in 2021) while generating O3 as a by-product. Clearly, these recycling processes dominate the overall production of ROx radicals compared to the primary sources. The OH–HO2 cycle is an important process in ozone formation. According to the statistics in Table S3, no evidence was found to suggest that the cycle in 2022 was more efficient than in 2020 or 2021. In terms of termination processes, the loss of ROx radicals was primarily dominated by their reactions with NOx. Specifically, the reactions of OH + NO2 and RO2 + NO2 accounted for approximately 0.51 ppbv h−1 (1.01 ppbv h−1 in 2020 and 0.87 ppbv h−1 in 2021) and 0.21 ppbv h−1 (0.25 ppbv h−1 in 2020 and 0.30 ppbv h−1 in 2021) of the daytime average ROx radical loss, respectively. This is in line with the understanding that reactions involving NOx typically play a dominant role in the removal of radicals in high-NOx environments (Zhang et al., 2021; Xue et al., 2016; Volkamer et al., 2010; Tan et al., 2019; Liu et al., 2012). To sum up, the changes resulting from the approximately 55 % reduction in NO2 and 30 % reduction in VOCs due to static management are reflected in both the radical-propagation process and termination process. The ratio of OH radical propagation (OH + VOCs) to termination (OH + NO2) reached 2.37, which is higher than 1.18 in 2020 and 1.78 in 2021. It can be inferred that the different proportions of NO2 and VOC reduction did not weaken the radical cycling. On the contrary, a higher VOC NO2 ratio promotes radical recycling efficiency in the reaction chain of radicals.
The 2-month city-wide static management was implemented in April and May 2022 in Shanghai. Aiming to control the spread of the Omicron variant, it provided a valuable opportunity to study the causes of ozone pollution. Comprehensive observations during the static management and the same period in 2020 and 2021 show that there was a decrease of 29 %–35 % in VOCs and 51 %–55 % in NO2 concentrations, while the average ozone level increased by nearly 23 %. According to statistics, the ozone profiles were classified into four clusters: cluster 1, characterized by low background concentration and low net production; cluster 2, characterized by low background concentration and high net production; cluster 3, characterized by high background concentration and low net production; and cluster 4, characterized by high background concentration and high net production. The average O3 concentration relationship among these clusters is cluster 4 > cluster 3 > cluster 2 > cluster 1. The significant increase in the proportion of cluster 4 and cluster 3 during the period of static management led to an overall increase in average ozone levels. Secondly, from the perspective of radical chemistry, we explored the changes in photochemical processes due to the reduction in precursor species. The OBM model simulated the levels of radicals and their processes of initiation, propagation, and termination. The average peak concentrations of OH, HO2, and RO2 in 2022 were 5.1×10⁶, 4.7×10⁸, and 2.6×10⁸ , respectively, which were higher than those in the same periods in 2020 and 2021. HONO photolysis was the main contributor to the primary source of ROx, accounting for about 30 % of the total. However, in terms of the overall production of ROx radicals, the radical-recycling process remained dominant. The different proportions of NO2 and VOC reduction during static management led to an increased OH radical propagation (OH + VOCs) to termination (OH + NO2) ratio, reaching 2.37, higher than 1.18 in 2020 and 1.78 in 2021. This enhanced ratio indicates a strengthened radical cycling as a result of a higher VOC NO2 ratio.
The important lesson from the static management “large-scale field experiment” is that Shanghai operates in a VOC-limited regime. When the reduction in VOCs is not able to catch up with or exceed the reduction in nitrogen oxides, it is not sufficient to curb the formation of secondary pollutants. In terms of ozone control strategies, it is necessary to strengthen the regulation and control of VOCs.
The observed and predicted hourly time series data in the study are presented in Figs. S16–S18 in the Supplement, and the code and data used for our analyses are available at https://doi.org/10.17632/3kmhg7r2df.1 (Zhu, 2023).
The supplement related to this article is available online at: https://doi.org/10.5194/acp-24-8383-2024-supplement.
JZ: conceptualization, methodology, software, validation, investigation, writing the original draft, and visualization. SW: conceptualization, methodology, supervision, and funding acquisition. CG, ZJ, SZ, RX, and YY: methodology, validation, and investigation. BZ: conceptualization, methodology, supervision, and funding acquisition.
The contact author has declared that none of the authors has any competing interests.
Publisher's note: Copernicus Publications remains neutral with regard to jurisdictional claims made in the text, published maps, institutional affiliations, or any other geographical representation in this paper. While Copernicus Publications makes every effort to include appropriate place names, the final responsibility lies with the authors.
This work was supported by the National Natural Science Foundation of China (grant nos. 22176037, 42075097, 22376030, 42375089, and 21976031) and the National Key Research and Development Program of China (grant no. 2022YFC3700101).
This research has been supported by the National Natural Science Foundation of China (grant nos. 22176037, 42075097, 22376030, 42375089, and 21976031) and the National Key Research and Development Program of China (grant no. 2022YFC3700101).
This paper was edited by Rob MacKenzie and reviewed by two anonymous referees.
Agarwal, A., Kaushik, A., Kumar, S., and Mishra, R. K.: Comparative study on air quality status in Indian and Chinese cities before and during the COVID-19 lockdown period, Air Qual. Atmos. Hlth., 13, 1167–1178, https://doi.org/10.1007/s11869-020-00881-z, 2020.
Alicke, B., Platt, U., and Stutz, J.: Impact of nitrous acid photolysis on the total hydroxyl radical budget during the Limitation of Oxidant Production/Pianura Padana Produzione di Ozono study in Milan, J. Geophys. Res.-Atmos., 107, LOP 9-1–LOP 9-17, https://doi.org/10.1029/2000JD000075, 2002.
Bao, R. and Zhang, A.: Does lockdown reduce air pollution? Evidence from 44 cities in northern China, Sci. Total Environ., 731, 139052, https://doi.org/10.1016/j.scitotenv.2020.139052, 2020.
Cai, C., Geng, F., Tie, X., Yu, Q., and An, J.: Characteristics and source apportionment of VOCs measured in Shanghai, China, Atmos. Environ., 44, 5005–5014, https://doi.org/10.1016/j.atmosenv.2010.07.059, 2010.
Chu, B., Zhang, S., Liu, J., Ma, Q., and He, H.: Significant concurrent decrease in PM2.5 and NO2 concentrations in China during COVID-19 epidemic, J. Environ. Sci., 99, 346–353, https://doi.org/10.1016/j.jes.2020.06.031, 2021.
Darby, L. S.: Cluster analysis of surface winds in Houston, Texas, and the impact of wind patterns on ozone, J. Appl. Meteorol. Clim., 44, 1788–1806, https://doi.org/10.1175/JAM2320.1, 2005.
Ding, J., van der A, R. J., Eskes, H., Mijling, B., Stavrakou, T., Van Geffen, J., and Veefkind, J.: NOx emissions reduction and rebound in China due to the COVID-19 crisis, Geophys. Res. Lett., 47, e2020GL089912, https://doi.org/10.1029/2020GL089912, 2020.
Feng, S., Jiang, F., Wang, H., Wang, H., Ju, W., Shen, Y., Zheng, Y., Wu, Z., and Ding, A.: NOx emission changes over China during the COVID-19 epidemic inferred from surface NO2 observations, Geophys. Res. Lett., 47, e2020GL090080, https://doi.org/10.1029/2020GL090080, 2020.
Gu, C., Wang, S., Zhu, J., Wu, S., Duan, Y., Gao, S., and Zhou, B.: Investigation on the urban ambient isoprene and its oxidation processes, Atmos. Environ., 270, 118870, https://doi.org/10.1016/j.atmosenv.2021.118870, 2022.
Guo, Y., Wang, S., Zhu, J., Zhang, R., Gao, S., Saiz-Lopez, A., and Zhou, B.: Atmospheric formaldehyde, glyoxal and their relations to ozone pollution under low-and high-NOx regimes in summertime Shanghai, China, Atmos. Res., 258, 105635, https://doi.org/10.1016/j.atmosres.2021.105635, 2021.
Hua, J., Zhang, Y., de Foy, B., Shang, J., Schauer, J. J., Mei, X., Sulaymon, I. D., and Han, T.: Quantitative estimation of meteorological impacts and the COVID-19 lockdown reductions on NO2 and PM2.5 over the Beijing area using Generalized Additive Models (GAM), J. Environ. Manage., 291, 112676, https://doi.org/10.1016/j.jenvman.2021.112676, 2021.
Huang, X., Ding, A., Gao, J., Zheng, B., Zhou, D., Qi, X., Tang, R., Wang, J., Ren, C., and Nie, W.: Enhanced secondary pollution offset reduction of primary emissions during COVID-19 lockdown in China, Natl. Sci. Rev., 8, nwaa137, https://doi.org/10.1093/nsr/nwaa137, 2021.
Jenkin, M. E., Saunders, S. M., Wagner, V., and Pilling, M. J.: Protocol for the development of the Master Chemical Mechanism, MCM v3 (Part B): tropospheric degradation of aromatic volatile organic compounds, Atmos. Chem. Phys., 3, 181–193, https://doi.org/10.5194/acp-3-181-2003, 2003.
Li, D., Wang, S., Xue, R., Zhu, J., Zhang, S., Sun, Z., and Zhou, B.: OMI-observed HCHO in Shanghai, China, during 2010–2019 and ozone sensitivity inferred by an improved ratio, Atmos. Chem. Phys., 21, 15447–15460, https://doi.org/10.5194/acp-21-15447-2021, 2021.
Li, R., Zhao, Y., Fu, H., Chen, J., Peng, M., and Wang, C.: Substantial changes in gaseous pollutants and chemical compositions in fine particles in the North China Plain during the COVID-19 lockdown period: anthropogenic vs. meteorological influences, Atmos. Chem. Phys., 21, 8677–8692, https://doi.org/10.5194/acp-21-8677-2021, 2021.
Liu, C. and Shi, K.: A review on methodology in O3-NOx-VOC sensitivity study, Environ. Pollut., 291, 118249, https://doi.org/10.1016/j.envpol.2021.118249, 2021.
Liu, T., Wang, X., Hu, J., Wang, Q., An, J., Gong, K., Sun, J., Li, L., Qin, M., and Li, J.: Driving forces of changes in air quality during the COVID-19 lockdown period in the Yangtze River Delta Region, China, Environ. Sci. Tech. Let., 7, 779–786, https://doi.org/10.1021/acs.estlett.0c00511, 2020.
Liu, T., Hong, Y., Li, M., Xu, L., Chen, J., Bian, Y., Yang, C., Dan, Y., Zhang, Y., Xue, L., Zhao, M., Huang, Z., and Wang, H.: Atmospheric oxidation capacity and ozone pollution mechanism in a coastal city of southeastern China: analysis of a typical photochemical episode by an observation-based model, Atmos. Chem. Phys., 22, 2173–2190, https://doi.org/10.5194/acp-22-2173-2022, 2022.
Liu, Y., Wang, H., Jing, S., Gao, Y., Peng, Y., Lou, S., Cheng, T., Tao, S., Li, L., and Li, Y.: Characteristics and sources of volatile organic compounds (VOCs) in Shanghai during summer: Implications of regional transport, Atmos. Environ., 215, 116902, https://doi.org/10.1016/j.atmosenv.2019.116902, 2019.
Liu, Z., Wang, Y., Gu, D., Zhao, C., Huey, L. G., Stickel, R., Liao, J., Shao, M., Zhu, T., Zeng, L., Amoroso, A., Costabile, F., Chang, C.-C., and Liu, S.-C.: Summertime photochemistry during CAREBeijing-2007: ROx budgets and O3 formation, Atmos. Chem. Phys., 12, 7737–7752, https://doi.org/10.5194/acp-12-7737-2012, 2012.
Lu, K. D., Hofzumahaus, A., Holland, F., Bohn, B., Brauers, T., Fuchs, H., Hu, M., Häseler, R., Kita, K., Kondo, Y., Li, X., Lou, S. R., Oebel, A., Shao, M., Zeng, L. M., Wahner, A., Zhu, T., Zhang, Y. H., and Rohrer, F.: Missing OH source in a suburban environment near Beijing: observed and modelled OH and HO2 concentrations in summer 2006, Atmos. Chem. Phys., 13, 1057–1080, https://doi.org/10.5194/acp-13-1057-2013, 2013.
Ma, X., Tan, Z., Lu, K., Yang, X., Chen, X., Wang, H., Chen, S., Fang, X., Li, S., Li, X., Liu, J., Liu, Y., Lou, S., Qiu, W., Wang, H., Zeng, L., and Zhang, Y.: OH and HO2 radical chemistry at a suburban site during the EXPLORE-YRD campaign in 2018, Atmos. Chem. Phys., 22, 7005–7028, https://doi.org/10.5194/acp-22-7005-2022, 2022.
Martinez, M., Harder, H., Kovacs, T., Simpas, J., Bassis, J., Lesher, R., Brune, W., Frost, G., Williams, E., and Stroud, C.: OH and HO2 concentrations, sources, and loss rates during the Southern Oxidants Study in Nashville, Tennessee, summer 1999, J. Geophys. Res.-Atmos., 108, 4617, https://doi.org/10.1029/2003JD003551, 2003.
Michoud, V., Kukui, A., Camredon, M., Colomb, A., Borbon, A., Miet, K., Aumont, B., Beekmann, M., Durand-Jolibois, R., Perrier, S., Zapf, P., Siour, G., Ait-Helal, W., Locoge, N., Sauvage, S., Afif, C., Gros, V., Furger, M., Ancellet, G., and Doussin, J. F.: Radical budget analysis in a suburban European site during the MEGAPOLI summer field campaign, Atmos. Chem. Phys., 12, 11951–11974, https://doi.org/10.5194/acp-12-11951-2012, 2012.
Rana, R. H., Keramat, S. A., and Gow, J.: A systematic literature review of the impact of COVID-19 lockdowns on air quality in China, Aerosol Air Qual. Res., 21, 200614, https://doi.org/10.4209/aaqr.200614, 2021.
Ren, X., Harder, H., Martinez, M., Lesher, R. L., Oliger, A., Shirley, T., Adams, J., Simpas, J. B., and Brune, W. H.: HOx concentrations and OH reactivity observations in New York City during PMTACS-NY2001, Atmos. Environ., 37, 3627–3637, https://doi.org/10.1016/S1352-2310(03)00460-6, 2003.
Santiago, J.-L., Martilli, A., and Martin, F.: On dry deposition modelling of atmospheric pollutants on vegetation at the microscale: Application to the impact of street vegetation on air quality, Bound.-Lay. Meteorol., 162, 451–474, https://doi.org/10.1007/s10546-016-0210-5, 2017.
Saunders, S. M., Jenkin, M. E., Derwent, R. G., and Pilling, M. J.: Protocol for the development of the Master Chemical Mechanism, MCM v3 (Part A): tropospheric degradation of non-aromatic volatile organic compounds, Atmos. Chem. Phys., 3, 161–180, https://doi.org/10.5194/acp-3-161-2003, 2003.
Sheehy, P. M., Volkamer, R., Molina, L. T., and Molina, M. J.: Oxidative capacity of the Mexico City atmosphere – Part 2: A ROx radical cycling perspective, Atmos. Chem. Phys., 10, 6993–7008, https://doi.org/10.5194/acp-10-6993-2010, 2010.
Shi, X. and Brasseur, G. P.: The response in air quality to the reduction of Chinese economic activities during the COVID-19 outbreak, Geophys. Res. Lett., 47, e2020GL088070, https://doi.org/10.1029/2020GL088070, 2020.
Sillman, S.: The relation between ozone, NOx and hydrocarbons in urban and polluted rural environments, Atmos. Environ., 33, 1821–1845, https://doi.org/10.1016/S1352-2310(98)00345-8, 1999.
Sommariva, R., Cox, S., Martin, C., Borońska, K., Young, J., Jimack, P. K., Pilling, M. J., Matthaios, V. N., Nelson, B. S., Newland, M. J., Panagi, M., Bloss, W. J., Monks, P. S., and Rickard, A. R.: AtChem (version 1), an open-source box model for the Master Chemical Mechanism, Geosci. Model Dev., 13, 169–183, https://doi.org/10.5194/gmd-13-169-2020, 2020.
Suris, F. N. A., Bakar, M. A. A., Ariff, N. M., Mohd Nadzir, M. S., and Ibrahim, K.: Malaysia PM10 air quality time series clustering based on dynamic time warping, Atmosphere, 13, 503, https://doi.org/10.3390/atmos13040503, 2022.
Tan, Y. and Wang, T.: What caused ozone pollution during the 2022 Shanghai lockdown? Insights from ground and satellite observations, Atmos. Chem. Phys., 22, 14455–14466, https://doi.org/10.5194/acp-22-14455-2022, 2022.
Tan, Z., Fuchs, H., Lu, K., Hofzumahaus, A., Bohn, B., Broch, S., Dong, H., Gomm, S., Häseler, R., He, L., Holland, F., Li, X., Liu, Y., Lu, S., Rohrer, F., Shao, M., Wang, B., Wang, M., Wu, Y., Zeng, L., Zhang, Y., Wahner, A., and Zhang, Y.: Radical chemistry at a rural site (Wangdu) in the North China Plain: observation and model calculations of OH, HO2 and RO2 radicals, Atmos. Chem. Phys., 17, 663–690, https://doi.org/10.5194/acp-17-663-2017, 2017.
Tan, Z., Lu, K., Hofzumahaus, A., Fuchs, H., Bohn, B., Holland, F., Liu, Y., Rohrer, F., Shao, M., Sun, K., Wu, Y., Zeng, L., Zhang, Y., Zou, Q., Kiendler-Scharr, A., Wahner, A., and Zhang, Y.: Experimental budgets of OH, HO2, and RO2 radicals and implications for ozone formation in the Pearl River Delta in China 2014, Atmos. Chem. Phys., 19, 7129–7150, https://doi.org/10.5194/acp-19-7129-2019, 2019.
Tian, J., Wang, Q., Zhang, Y., Yan, M., Liu, H., Zhang, N., Ran, W., and Cao, J.: Impacts of primary emissions and secondary aerosol formation on air pollution in an urban area of China during the COVID-19 lockdown, Environ. Int., 150, 106426, https://doi.org/10.1016/j.envint.2021.106426, 2021.
Venter, Z. S., Aunan, K., Chowdhury, S., and Lelieveld, J.: COVID-19 lockdowns cause global air pollution declines, P. Natl. Acad. Sci. USA, 117, 18984–18990, https://doi.org/10.1073/pnas.2006853117, 2020.
Volkamer, R., Sheehy, P., Molina, L. T., and Molina, M. J.: Oxidative capacity of the Mexico City atmosphere – Part 1: A radical source perspective, Atmos. Chem. Phys., 10, 6969–6991, https://doi.org/10.5194/acp-10-6969-2010, 2010.
Wang, N., Xu, J., Pei, C., Tang, R., Zhou, D., Chen, Y., Li, M., Deng, X., Deng, T., and Huang, X.: Air quality during COVID-19 lockdown in the Yangtze River Delta and the Pearl River Delta: Two different responsive mechanisms to emission reductions in China, Environ. Sci. Technol., 55, 5721–5730, https://doi.org/10.1021/acs.est.0c08383, 2021.
Wang, P., Chen, K., Zhu, S., Wang, P., and Zhang, H.: Severe air pollution events not avoided by reduced anthropogenic activities during COVID-19 outbreak, Resour. Conserv. Recy., 158, 104814, https://doi.org/10.1016/j.resconrec.2020.104814, 2020.
Wang, T., Xue, L., Brimblecombe, P., Lam, Y. F., Li, L., and Zhang, L.: Ozone pollution in China: A review of concentrations, meteorological influences, chemical precursors, and effects, Sci. Total Environ., 575, 1582–1596, https://doi.org/10.1016/j.scitotenv.2016.10.081, 2017.
Xue, L., Gu, R., Wang, T., Wang, X., Saunders, S., Blake, D., Louie, P. K. K., Luk, C. W. Y., Simpson, I., Xu, Z., Wang, Z., Gao, Y., Lee, S., Mellouki, A., and Wang, W.: Oxidative capacity and radical chemistry in the polluted atmosphere of Hong Kong and Pearl River Delta region: analysis of a severe photochemical smog episode, Atmos. Chem. Phys., 16, 9891–9903, https://doi.org/10.5194/acp-16-9891-2016, 2016.
Xue, R., Wang, S., Zhang, S., Zhan, J., Zhu, J., Gu, C., and Zhou, B.: Ozone Pollution of Megacity Shanghai during City-Wide Lockdown Assessed Using TROPOMI Observations of NO2 and HCHO, Remote Sens.-Basel, 14, 6344, https://doi.org/10.3390/rs14246344, 2022.
Yang, X., Lu, K., Ma, X., Liu, Y., Wang, H., Hu, R., Li, X., Lou, S., Chen, S., and Dong, H.: Observations and modeling of OH and HO2 radicals in Chengdu, China in summer 2019, Sci. Total Environ., 772, 144829, https://doi.org/10.1016/j.scitotenv.2020.144829, 2021.
Yang, X., Lu, K., Ma, X., Gao, Y., Tan, Z., Wang, H., Chen, X., Li, X., Huang, X., He, L., Tang, M., Zhu, B., Chen, S., Dong, H., Zeng, L., and Zhang, Y.: Radical chemistry in the Pearl River Delta: observations and modeling of OH and HO2 radicals in Shenzhen in 2018, Atmos. Chem. Phys., 22, 12525–12542, https://doi.org/10.5194/acp-22-12525-2022, 2022.
Zhang, G., Hu, R., Xie, P., Lou, S., Wang, F., Wang, Y., Qin, M., Li, X., Liu, X., and Wang, Y.: Observation and simulation of HOx radicals in an urban area in Shanghai, China, Sci. Total Environ., 810, 152275, https://doi.org/10.1016/j.scitotenv.2021.152275, 2022.
Zhang, H., Ho, T.-B., and Lin, M.-S.: An evolutionary K-means algorithm for clustering time series data, in: Proceedings of 2004 International Conference on Machine Learning and Cybernetics (IEEE Cat. No. 04EX826), Shanghai, China, 26–29 August 2004, 1282–1287, IEEE, https://doi.org/10.1109/ICMLC.2004.1382390, 2004.
Zhang, K., Huang, L., Li, Q., Huo, J., Duan, Y., Wang, Y., Yaluk, E., Wang, Y., Fu, Q., and Li, L.: Explicit modeling of isoprene chemical processing in polluted air masses in suburban areas of the Yangtze River Delta region: radical cycling and formation of ozone and formaldehyde, Atmos. Chem. Phys., 21, 5905–5917, https://doi.org/10.5194/acp-21-5905-2021, 2021.
Zhang, K., Liu, Z., Zhang, X., Li, Q., Jensen, A., Tan, W., Huang, L., Wang, Y., de Gouw, J., and Li, L.: Insights into the significant increase in ozone during COVID-19 in a typical urban city of China, Atmos. Chem. Phys., 22, 4853–4866, https://doi.org/10.5194/acp-22-4853-2022, 2022.
Zhu, J.: Why Did Ozone Concentrations Increase During Shanghai's Static Management? A Statistical and Radical Chemistry Perspective, Version 1, Mendeley Data [data set], https://doi.org/10.17632/3kmhg7r2df.1, 2023.
Zhu, J., Wang, S., Wang, H., Jing, S., Lou, S., Saiz-Lopez, A., and Zhou, B.: Observationally constrained modeling of atmospheric oxidation capacity and photochemical reactivity in Shanghai, China, Atmos. Chem. Phys., 20, 1217–1232, https://doi.org/10.5194/acp-20-1217-2020, 2020.
Zhu, J., Wang, S., Zhang, S., Xue, R., Gu, C., and Zhou, B.: Changes of NO3 Radical and its Nocturnal Chemistry in Shanghai from 2014 to 2021 Revealed by Long-term observation and a Stacking Model: Impact of China's Clean Air Action Plan, J. Geophys. Res.-Atmos., 127, e2022JD037438, https://doi.org/10.1029/2022JD037438, 2022.