the Creative Commons Attribution 4.0 License.
the Creative Commons Attribution 4.0 License.
 | 19 Jul 2024
Tracking precipitation features and associated large-scale environments over southeastern Texas
Yun Qian
Larry K. Berg
Jianfeng Li
Jingyi Chen
Zhao Yang
Deep convection initiated under different large-scale environmental conditions exhibits different precipitation features and interacts with local meteorology and surface properties in distinct ways. Here, we analyze the characteristics and spatiotemporal patterns of different types of convective systems over southeastern Texas using 13 years of high-resolution observations and reanalysis data. We find that mesoscale convective systems (MCSs) contribute significantly to both mean and extreme precipitation in all seasons, while isolated deep convection (IDC) plays a role in intense precipitation during summer and fall. Using self-organizing maps (SOMs), we found that convection can occur under unfavorable conditions without large-scale lifting or moisture convergence. In spring, fall, and winter, front-related large-scale meteorological patterns (LSMPs) characterized by low-level moisture convergence act as primary triggers for convection, while the remaining storms are associated with an anticyclonic pattern and orographic lifting. In summer, IDC events are mainly associated with front-related and anticyclonic LSMPs, while MCSs occur more in front-related LSMPs. We further tracked the life cycle of MCS and IDC events using the Flexible Object Tracker algorithm over southeastern Texas. MCSs frequently initiate west of Houston, traveling eastward for around 8 h to southeastern Texas, while IDC events initiate locally. The average duration of MCSs in southeastern Texas is 6.1 h, approximately 4.1 times the duration of IDC events. Diurnally, the initiation of convection associated with favorable LSMPs peaks at 11:00 UTC, 3 h earlier than that associated with anticyclones.
- Article
(17245 KB) - Full-text XML
- BibTeX
- EndNote


Deep convection is a major contributor to annual total precipitation and a source of very high intensity rainfall over coastal Texas (Feng et al., 2021; Li et al., 2021a; Houze, 2004). Deep convection can form as isolated deep convection (IDC) or grow into mesoscale convective systems (MCSs) under favorable thermodynamic and dynamic environmental conditions. IDC events are typical convective storms that can reach on the order of tens of kilometers in horizontal scale, whereas MCSs are convective systems with a contiguous precipitation feature area on the order of 100 km or more in horizontal scale (Houze, 2004). Generally, MCSs have a longer duration, broader spatial coverage, and stronger precipitation. Rowe et al. (2012) reported that MCSs produce, on average, approximately 3 times the total precipitation amount of IDC events over northwestern Mexico. The MCS mean precipitation intensity is over 7 times higher than the precipitation intensity of non-MCS events during the warm season over the central US (Hu et al., 2021). Moreover, strong seasonal variations have been found in both the frequency and intensity of convective precipitation due to the varying large-scale and local environmental conditions (Rowe et al., 2012; Feng et al., 2019).
Located in southeastern Texas, Houston is the fifth most populous metropolitan area in the US. The city has been frequently threatened by severe floods and hail associated with convective storms (e.g., Brody et al., 2018; Collins et al., 2018; Nielsen and Schumacher, 2019; Valle-Levinson et al., 2020; Pryor et al., 2023). The predominant synoptic processes that affect convection initiation over southeastern Texas include the Bermuda High and Great Plains low-level jet (GPLLJ) (Zhu and Liang, 2013; Wang et al., 2016; Whiteman et al., 1997). The Bermuda High is a semipermanent high-pressure system forming over the Atlantic Ocean, often in late spring. The GPLLJ refers to the climatological southerly wind that brings moisture from the Gulf of Mexico to the Great Plains, featuring a maximum wind speed in the lowest 1 km of the atmosphere (Whiteman et al., 1997; Berg et al., 2015; Yang et al., 2020). On the one hand, the GPLLJ can be enhanced by the strong pressure gradient created by the west flank of the Bermuda High during its westward extension (Hodges and Pu, 2019; Wimhurst and Greene, 2019), which is favorable for convection development; on the other hand, the westward extension of the Bermuda High can create subsidence over southeastern Texas, suppressing convection (Small and De Szoeke, 2007).
Southeastern Texas is characterized by high annual precipitation, attributable to its abundant moisture from the Gulf of Mexico, with significant seasonal variation (Statkewicz et al., 2021). This area is prone to intense convective storms in summer; these events are driven by sea breeze and daytime surface heating as well as the impacts of tropical cyclones during the hurricane season (Caicedo et al., 2019; Darby, 2005). The winter season is typically marked by rainfall from cold fronts, while spring can see severe weather events like thunderstorms and, occasionally, tornadoes (Prat and Nelson, 2014). Nocturnal thunderstorms are common due to the warm, moist air transported by the GPLLJ from the Gulf of Mexico (Day et al., 2010). Meanwhile, urban development in the Houston metropolitan area exacerbates flooding risks by reducing the natural land absorption capacity (Van Oldenborgh et al., 2017; Chang et al., 2007; Burian and Shepherd, 2005). Precipitation patterns are influenced by both large-scale and local factors, such as urbanization and sea breezes. The primary aim of this study is to isolate the impact of large-scale circulations on various convective systems, distinguishing the aforementioned impact from other contributing factors, and to pinpoint the large-scale conditions that promote the development of sea-breeze circulations. To understand the role of large-scale and local factors that impact convection initiation and development, Wang et al. (2022) isolated the influence of large-scale meteorology from microphysical and mesoscale influences, with a focus on summer climate over southeastern Texas. They identified four large-scale meteorological patterns (LSMPs), namely pre-trough, post-trough, anticyclone, and transitional regimes, characterized by the location and strength of the Bermuda High and GPLLJ. Both the Bermuda High and GPLLJ are seasonally varying systems that exert different impacts on different type of convection.
In this study, we extend the analysis from summer to all four seasons and separate LSMPs associated with MCSs and IDC. Using a convection dataset (Li et al., 2021a), we investigate the track trajectories under various LSMPs, as the track properties are influenced by the land surface and meteorological conditions along their pathways. Moreover, we apply a cell-tracking method (Feng et al., 2022) to the Next-Generation Radar (NEXRAD) system to obtain fine-scale (500 m) track features (e.g., initiation location and timing) over Houston. We then assess the variation in these fine-scale features with LSMPs. Specifically, we address the following questions in this study:
-
How much do various precipitation types contribute to the seasonal rainfall in southeastern Texas?
-
How do different LSMPs affect various types of convective precipitation across different seasons?
-
How do LSMPs influence the trajectories and associated MCS and IDC statistical properties?
The rest of the paper is organized as follows: Sect. 2 describes the dataset and methodology, including the application of a convection dataset; Sect. 3 presents the results on the features of different types of convection over southeastern Texas, linking convection to corresponding LSMPs, and the tracking of convective systems; Sect. 3 also outlines an analysis that focuses on the Houston metropolitan area to study fine-scale characteristics; Sect. 4 presents the summaries the conclusions.
This study utilizes a suite of existing datasets to investigate the nature of convective systems over southeastern Texas, including a convection dataset and NEXRAD to characterize convective systems and a reanalysis dataset to identify LSMPs.
2.1 Convection dataset over the US
The convection dataset used in this study is a high-resolution (4 km, hourly) observational product that covers the US east of the Rocky Mountains from 2004 to 2017. This dataset contains the detailed classification, tracking, and characteristics of MCS and IDC events (Li et al., 2021a) and is available at https://doi.org/10.25584/1632005. The dataset is developed by utilizing the Storm Labeling in Three Dimensions (SL3D) algorithm (Starzec et al., 2017) and an updated flexible object tracker (Feng et al., 2023; Li et al., 2021a) algorithm based on various datasets, including the National Centers for Environmental Prediction (NCEP)/Climate Prediction Center (CPC) L3 4 km Global Merged IR V1 brightness temperature dataset (Janowiak et al., 2017), the three-dimensional (3D) Gridded NEXRAD dataset (Bowman and Homeyer, 2017), and the NCEP Stage IV precipitation dataset (Du, 2011). Cold-cloud systems (CCSs) are first identified at each hour by searching for cold-cloud cores (regions with a cloud-base temperature Tb < 225 K). The cold-cloud cores are augmented with contiguous areas satisfying Tb < 241 K. Cloud systems with 225 K < Tb < 241 K are also labeled as CCSs if they form a contiguous area of at least 64 km2. Then, the CCSs identified in 2 consecutive hours are linked if their spatial overlaps are greater than 50 %. The resultant CCSs, precipitation features (PFs), and convective core features (CCFs) are used to categorize precipitating systems into MCS, IDC, and non-convective systems (Feng et al., 2023; Li et al., 2021a). An MCS event is defined if it satisfies the following criteria: (1) there is at least one pixel of cold-cloud core during the whole life cycle of the track, (2) CCS areas associated with the track surpass 60 000 km2 for more than 6 continuous hours, and (3) a PF major axis length exceeding 100 km and intense convective cell areas of at least 16 km2 exist for more than 5 consecutive hours. For the non-MCS tracks, an IDC event is defined with the following two criteria: (1) a CCS with at least 64 km2 is detected, and (2) there is at least 1 h during the life cycle of the track when PFs and CCFs are present (PF and CCF major axis lengths ≥ 4 km). Li et al. (2021a) discussed the impact of the chosen threshold in separating MCSs and long-lasting IDC events, and they concluded that the current criteria capture the spatial distribution and essential characteristics of MCS/IDC precipitation well. This dataset provides 3D information on the life cycle of each MCS/IDC event, including its spatial coverage, radar echo-top heights, precipitation characteristics, convective core area, and propagation speed. Following Li et al. (2021b), this study further separates tropical cyclones (TCs) and associated precipitation from the convection dataset using the historical and most recent TCs obtained from the IBTrACS (International Best Track Archive for Climate Stewardship) version 4.0 dataset (Knapp et al., 2010) with the following approach:
- a.
MCS/IDC tracks with their cold clouds overlapping with a TC at any time during its life cycle are considered parts of the TC.
- b.
Any non-MCS/IDC clouds overlapping with a TC are included as parts of the TC.
- c.
All grid cells overlapping with a TC at any given time are parts of the TC at that specific time. Finally, we can distinguish the precipitation type of each precipitating grid cell based on the combined dataset – MCS, IDC, TC, or non-convective systems.
2.2 NEXRAD data at KHGX
The 4 km and hourly convection dataset can potentially overlook many isolated convective events with a lifetime and spatial extent smaller than these scales. We track and characterize fine-scale convection using a radar located in Houston (KHGX). The original Level-II reflectivity is obtained from Amazon Web Services (https://registry.opendata.aws/noaa-nexrad, last access: October 2022) from 2004 to 2017 at approximately 5 min intervals and is interpolated from antenna coordinates to Cartesian coordinates at 500 m × 500 m × 500 m (x × y × z) grid spacing using Py-ART (https://arm-doe.github.io/pyart, last access: 5 January 2024). Then, we apply the open-source Python Flexible Object Tracker (PyFLEXTRKR, available from https://github.com/FlexTRKR/PyFLEXTRKR, last access: 5 January 2024) algorithm (Feng et al., 2023) to identify and track convective cells from the gridded radar data.
Convective cells are identified in PyFLEXTRKR using a modified Steiner et al. (1995) algorithm based on horizontal radar reflectivity texture. We used composite (column maximum) radar reflectivity to compute horizontal peakedness (i.e., the difference between a grid point reflectivity and its surrounding background reflectivity) and identify convective cells, similar to the approach described by Feng et al. (2022). Radar reflectivities less than 500 m above terrain are removed to reduce clutter contamination. The various thresholds used to define convective cells for tracking are the same as those used in Feng et al. (2022). A convective grid point is defined as its difference in composite reflectivity (ΔZ) from the background reflectivity (Zbkg, horizontal mean reflectivity within 11 km radius), which is described below:
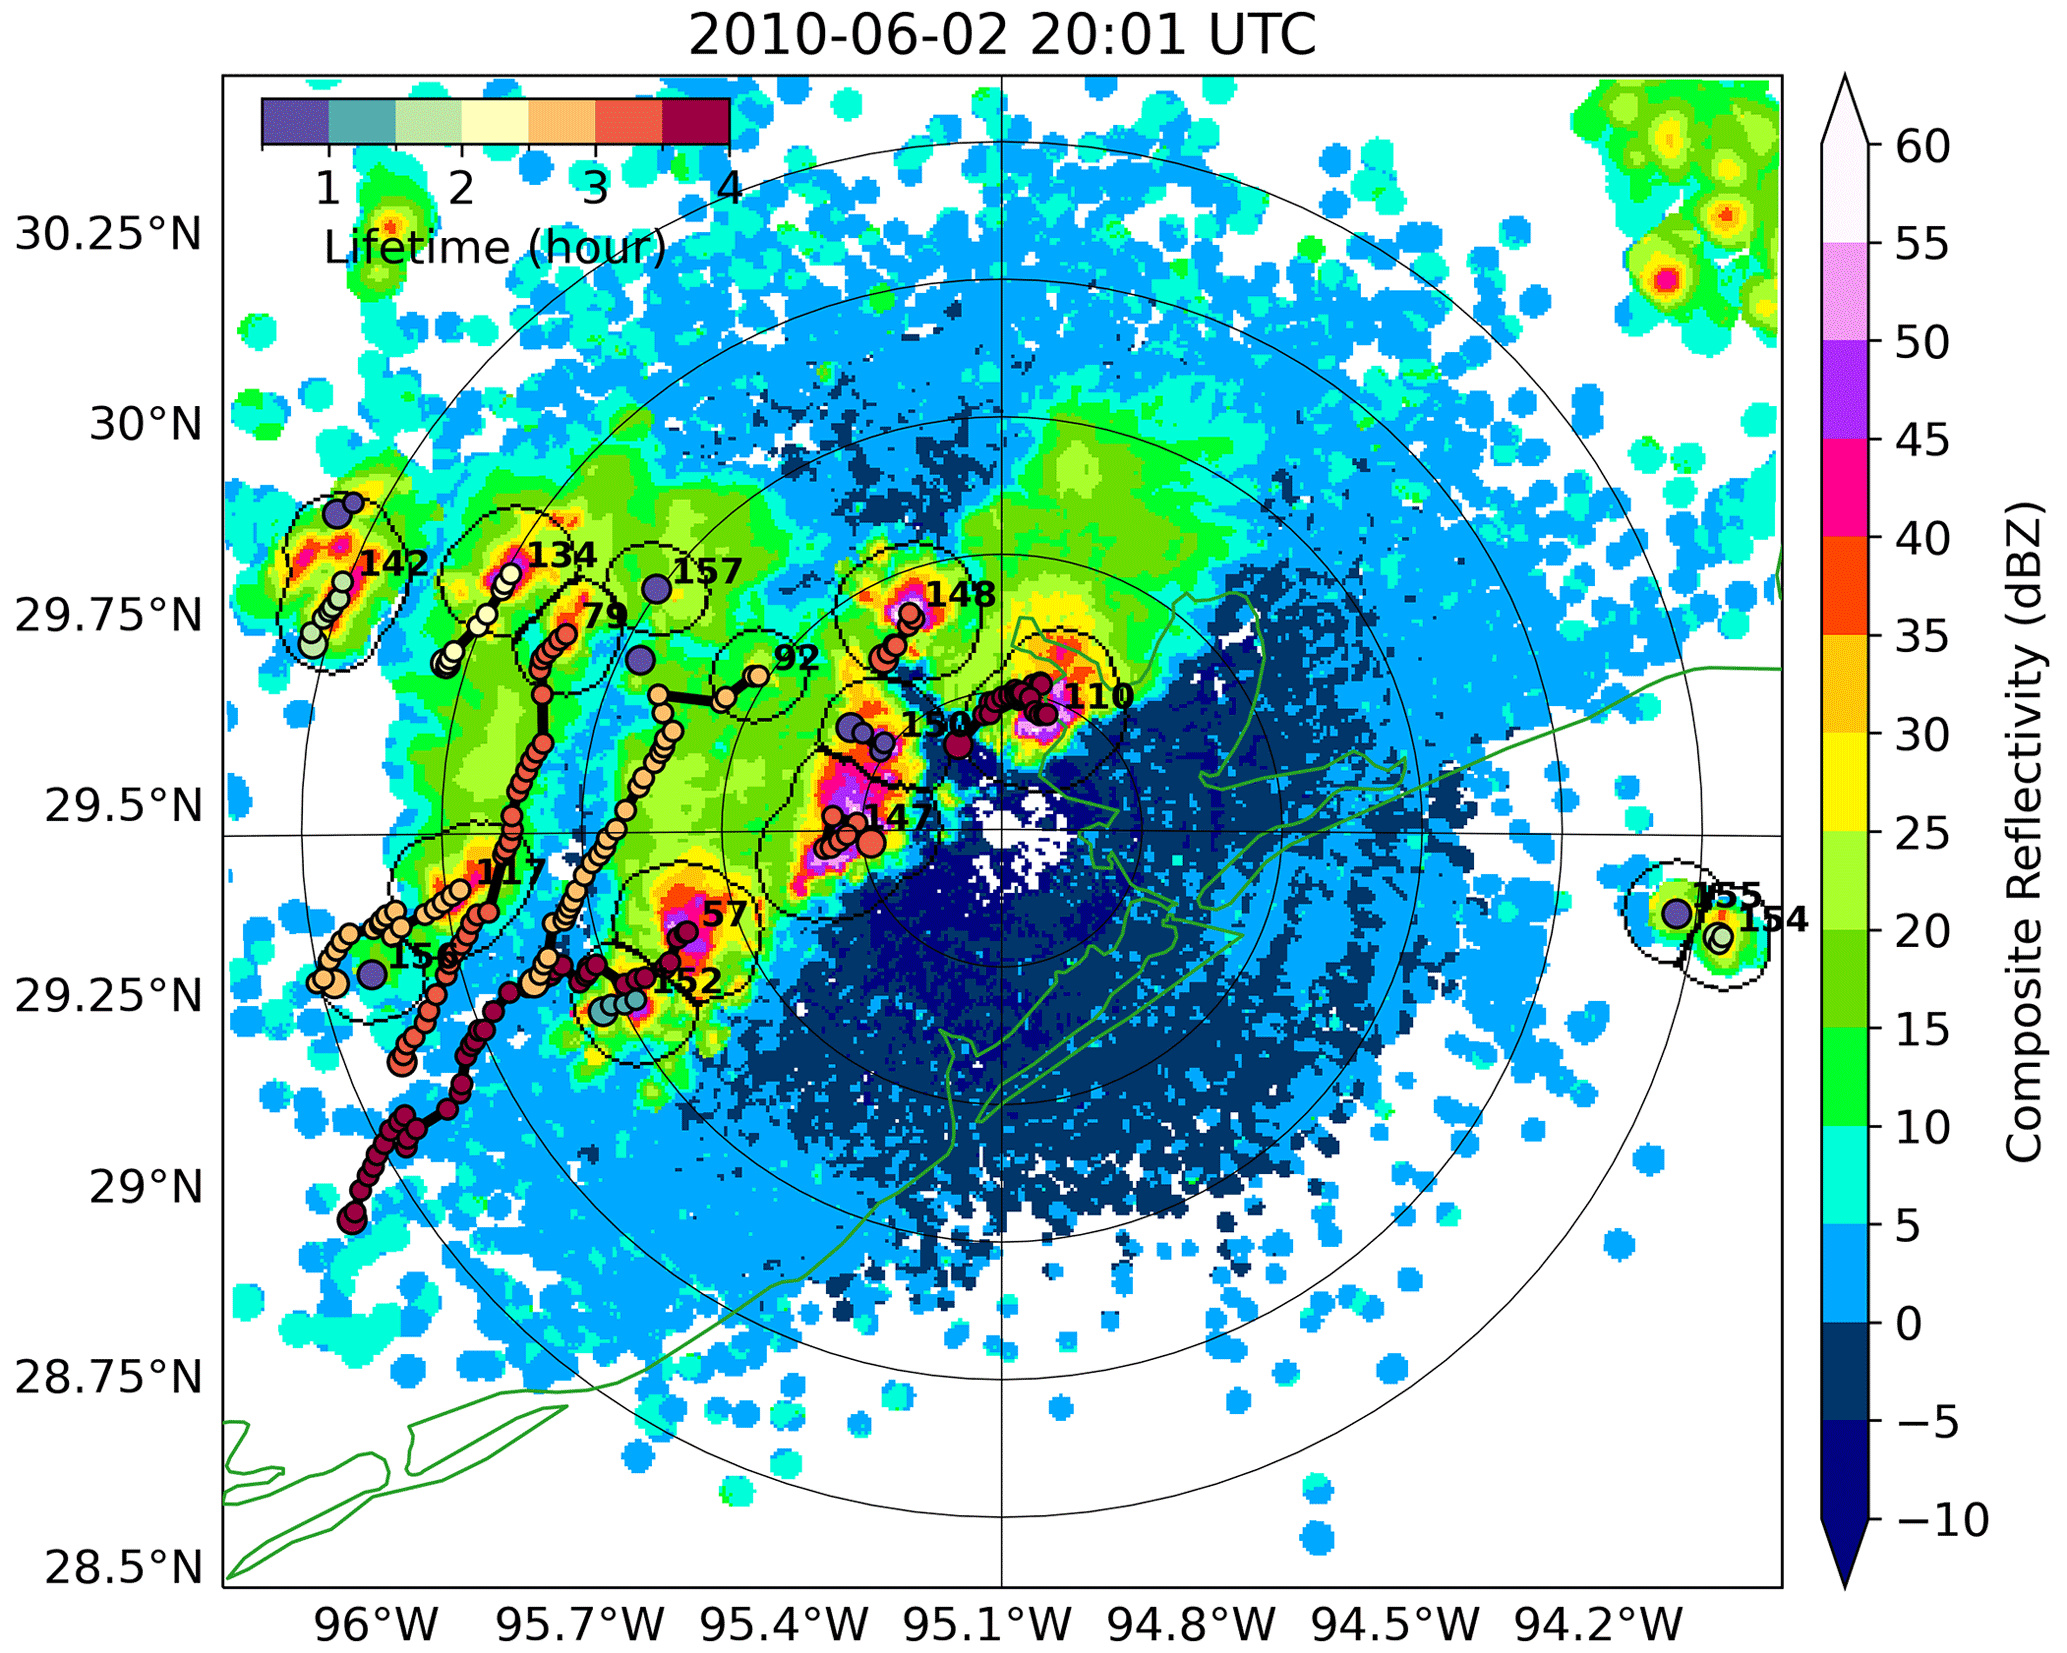
Figure 1Example of cell tracking. Shadings are radar reflectivity, circles are the areas of CCSs, dots indicate the center of the CCSs, and numbers are the cell IDs.
The main purpose of the adjusted thresholds is to better identify individual deep convective cell initiation in a variety of situations (e.g., isolated convection in summer, convective cells embedded in MCSs) compared with those used in Steiner et al. (1995). Such adjustments are similar to those used for the study of convective cell growth observed during the CACTI (Cloud, Aerosol, and Complex Terrain Interactions) field campaign in central Argentina (Feng et al., 2022; Varble et al., 2021). The 500 m grid spacing of the Cartesian NEXRAD radar data is the same as the attenuation-corrected C-band radar data used in CACTI. The convective grid points are then expanded outward into surrounding grids using a Zbkg-dependent radius step function to define convective cells. Lastly, each convective cell is expanded outward by a 5 km radius from the center of the cell to increase the footprints for the convective cells for tracking. While the step function influences the area of the convection cell, we only use KHGX radar to study the location and time of convection initiation. Figure 1 shows an example of cell tracking based on KHGX radar reflectivity.
2.3 ERA5 reanalysis
The European Centre for Medium-Range Weather Forecasting fifth-generation reanalysis (ERA5; Hersbach et al., 2020) is utilized to perform the large-scale meteorological pattern classification. The hourly variables for the period of 2004–2017 at a horizontal resolution of 0.25° × 0.25° are obtained from https://www.ecmwf.int/en/forecasts/dataset/ecmwf-reanalysis-v5 (last access: October 2022). The horizontal wind fields (u, v) and specific humidity (q) at 925 hPa are used to classify LSMPs, following Song et al. (2019). We also tested using the vertically integrated moisture convergence instead of specific humidity, which shows consistent results. Once the LSMPs have been identified, other fields, including 2 m temperature, geopotential height, and vertical velocity, are used to characterize the overall environmental conditions for the LSMPs.
2.4 Self-organizing maps (SOMs)
An SOM is an artificial neural network employed for cluster analysis that projects the high-dimensional data to a visually comprehensible 2D map (Vesanto and Alhoniemi, 2000; Song et al., 2019). Hourly u, v, and q values are normalized by removing the long-term mean and standard deviation at each hour to give each variable equal weights. In the SOM training phase, the initial nodes for SOM clustering are selected from the leading four empirical orthogonal functions of the input vector (u, v, and q). Then, input vectors are presented on the map to find the best-matching unit (BMU), which is the node with the smallest Euclidean distance to the input vector. The BMU and its neighboring nodes are adjusted toward the input vector to better represent the data distribution. A neighborhood function is applied to determine the number of neighborhood nodes to be adjusted and the strength of adaption, depending on the order number of the current iteration and the distance between the neighborhood node and the BMU.
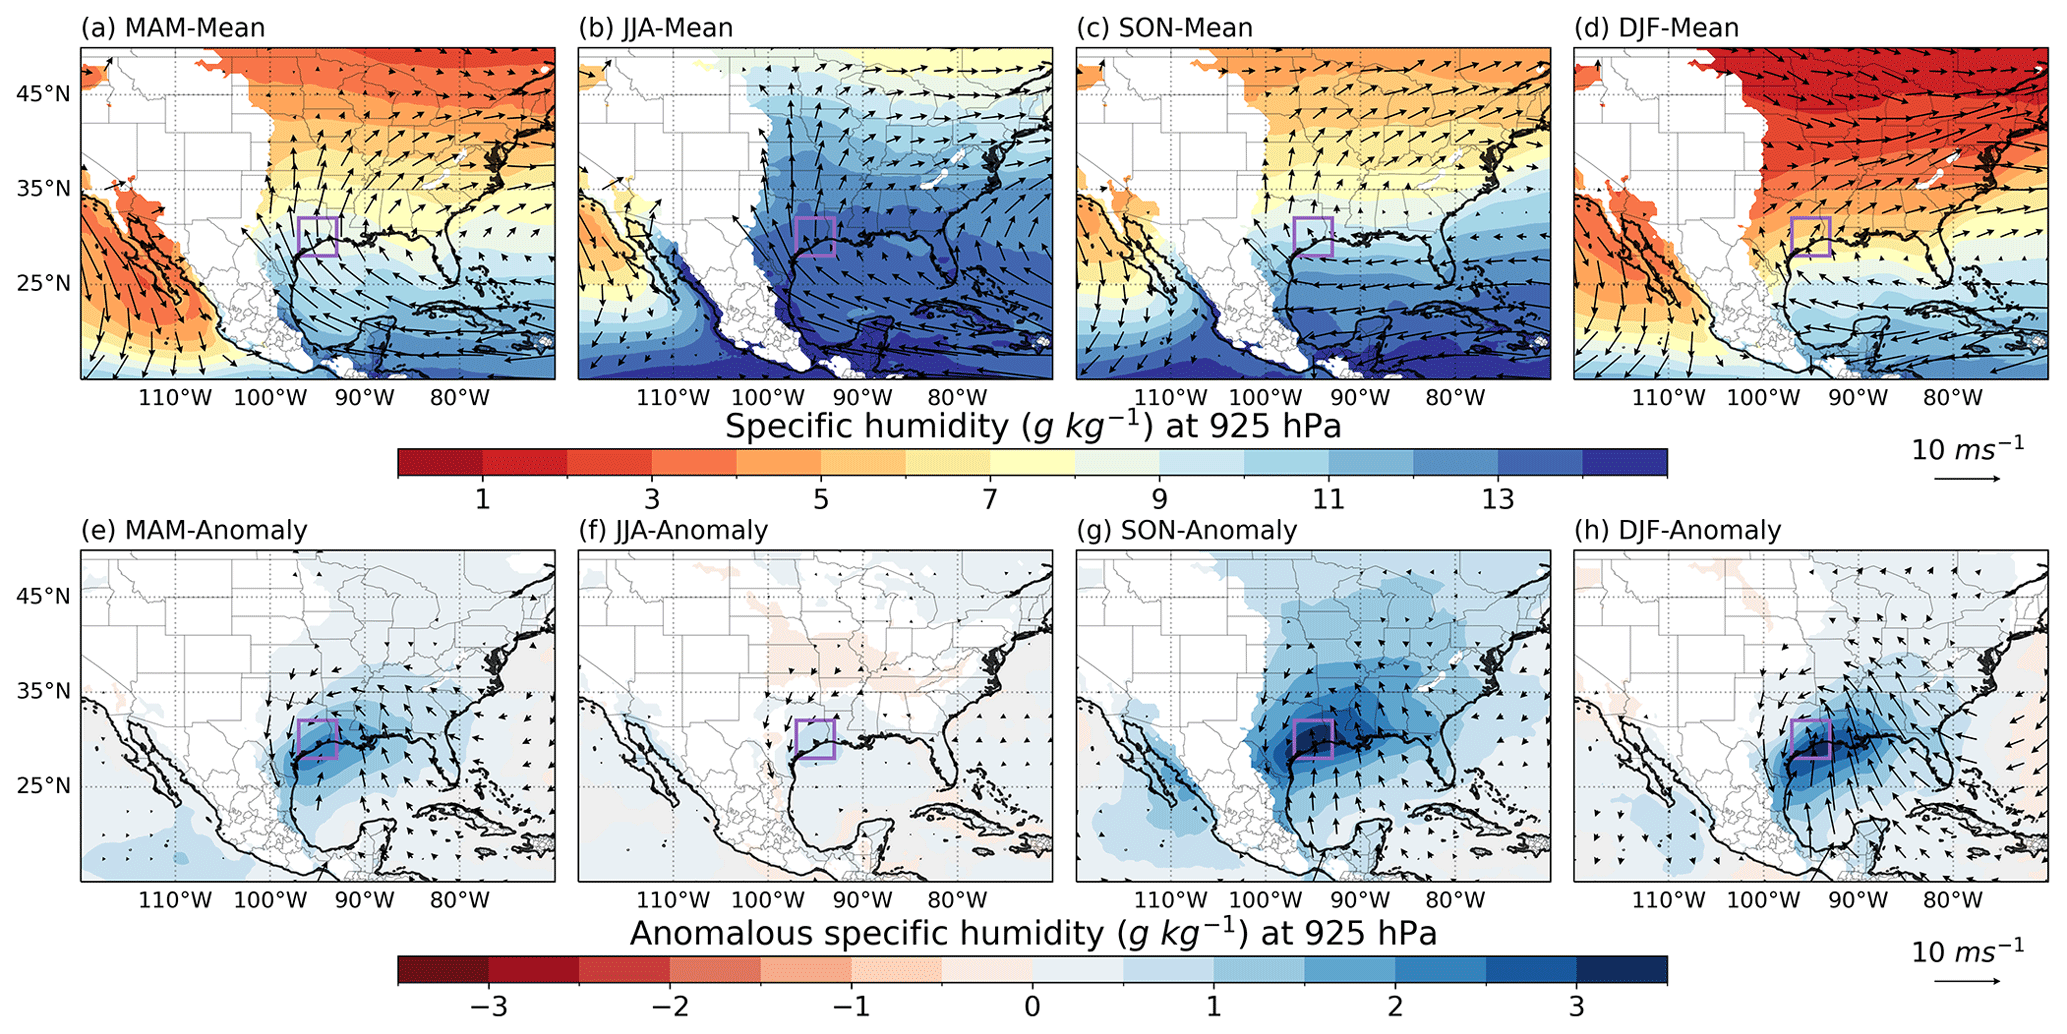
Figure 2Mean (a–d) and anomalous (e–h) wind vector (m s−1) and specific humidity (g kg−1) at 925 hPa for each season. Wind vectors and specific humidity below the terrain are masked out. The anomaly is the difference between the hours with MCS- or IDC-associated precipitation in southeastern Texas and the climatology. The southeastern Texas area is marked by the purple box (28–32° N, 97–93°W).
The SOM analysis is performed over the 15–50° N, 120–70° W domain using the ERA5 data. In contrast to Wang et al. (2022), who used all hours to train the SOM model, we only use the first hour of MCS/IDC tracks that produce precipitation in the southeastern Texas area (28–32° N, 97–93° W) to focus only on the large-scale environmental conditions that are associated with convection initiation in that region. The environment at the initiation is targeted to minimize the effect of convection feedback to the large-scale environment (Song et al., 2019). The convection initiation hours are then grouped into two sets – one only with IDC initiation and another with MCS initiation – so that the large-scale environmental conditions associated with IDC and MCS initiation are separated. We consider the periods of March–May (MAM), June–August (JJA), September–November (SON), and December–February (DJF) to construct a training dataset for each season. Choosing an appropriate number of SOM nodes to prescribe requires balancing the trade-off between distinctiveness and robustness (Liu et al., 2023, 2022; Huang et al., 2022). Song et al. (2019) found that clustering the convection-associated weather patterns over the Great Plains using four nodes resulted in distinct large-scale environments while minimizing redundant nodes. They also discovered that the results were not sensitive to the domain size. In this study, a similar domain to that employed in Song et al. (2019) is used to conduct SOM analysis in order to capture the interaction between the Bermuda High, GPLLJ, and midlatitude atmospheric waves. Therefore, we chose four nodes for each season. Lastly, the KHGX radar data are projected onto the four LSMPs by matching the hours in each LSMP in summer to investigate the fine-scale convection. For each SOM cluster, the meteorological patterns are determined by a composite average of the hours within that cluster. Each cluster is named according to the characteristics of the large-scale circulation and those from previous studies (e.g., Wang et al., 2022).
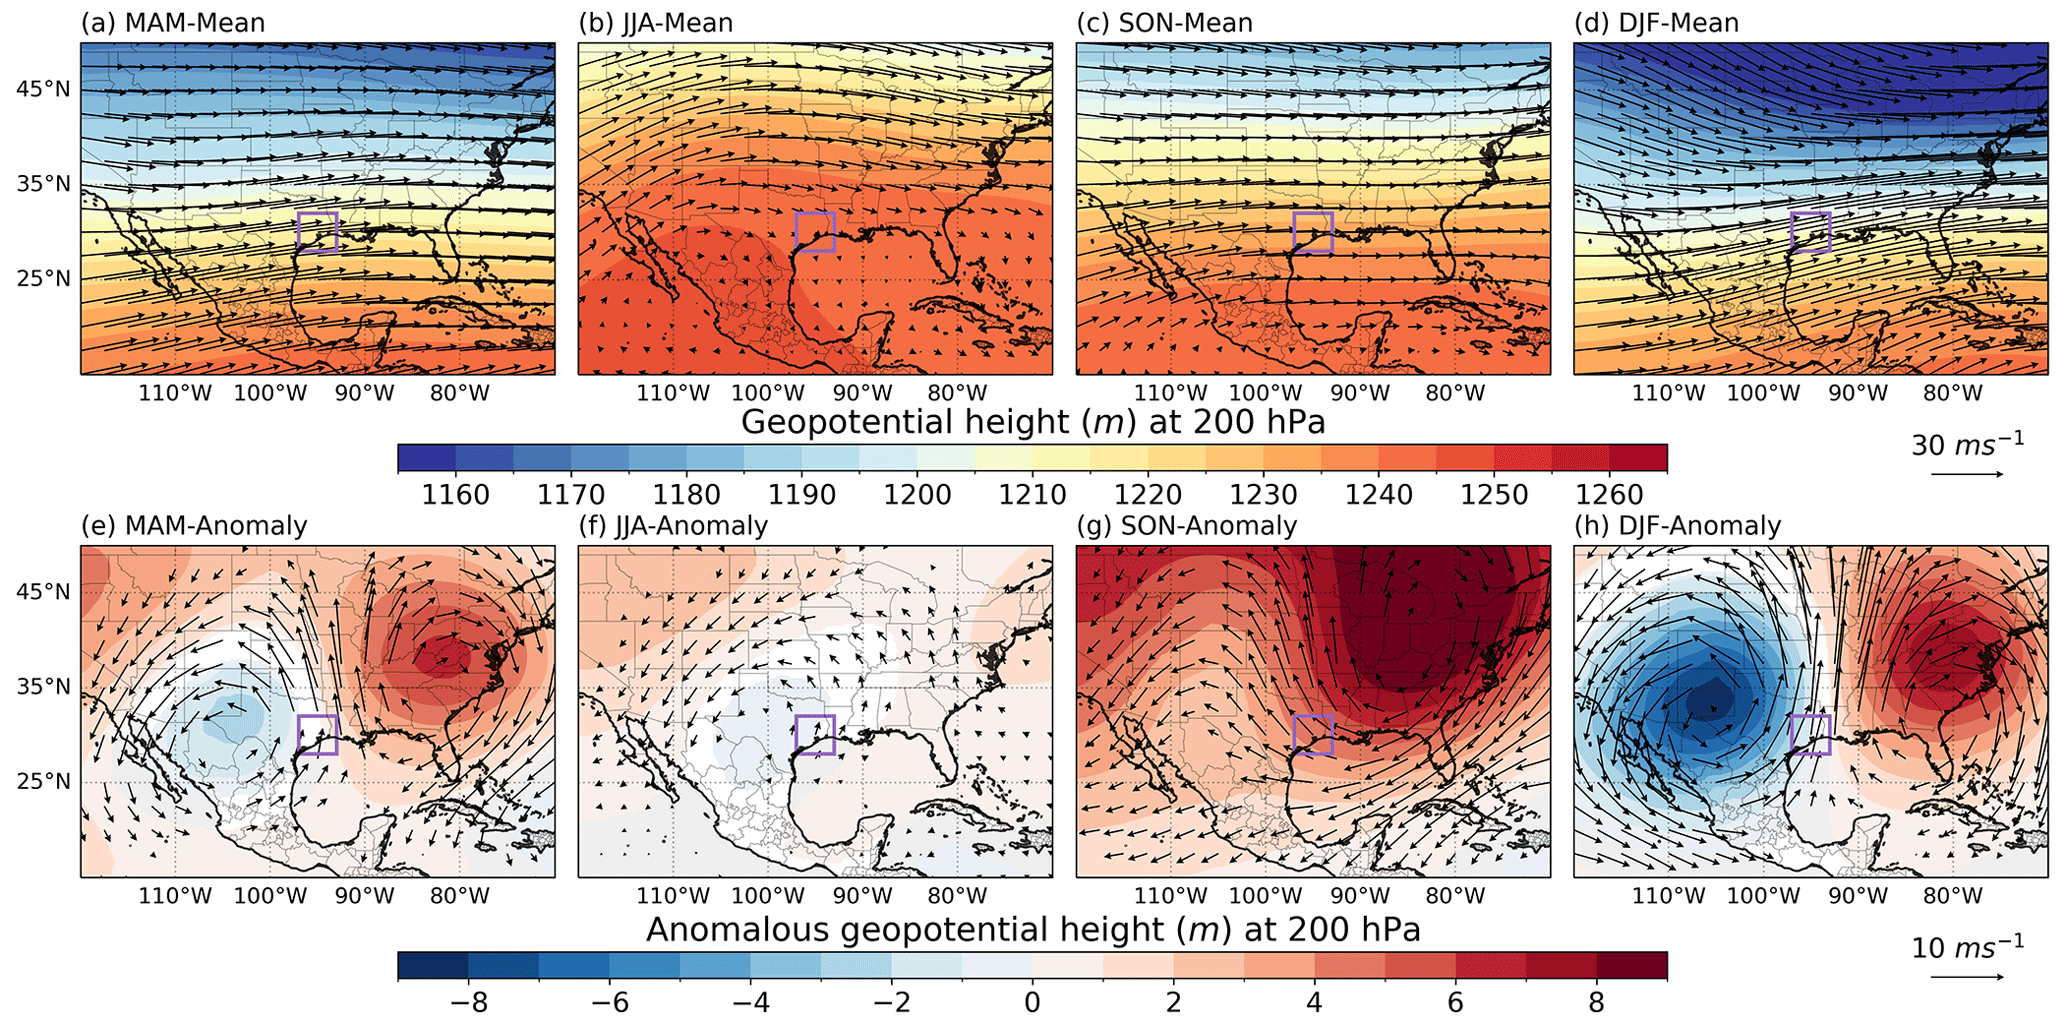
Figure 3The same as Fig. 2 but for the wind vector (m s−1) and geopotential height (m) at 200 hPa.
3.1 Precipitation features and associated large-scale environments
To elucidate the role of the large-scale environment on precipitation over southeastern Texas (indicated by the purple box in Fig. 2), the climatological mean and anomalies (deviation from the climatology) in wind and moisture at 925 hPa are shown in Fig. 2. The GPLLJ, transporting a substantial amount of moisture from the Gulf of Mexico to the southern Great Plains, is a seasonal feature that varies throughout the year, affected by factors including pressure and temperature gradients, upper-level wave patterns, and land surface properties (Bonner, 1968; Weaver and Nigam, 2008; Yang et al., 2020). During spring and summer, the gradient between the high pressure over the Rocky Mountains and the low pressure over the Gulf of Mexico combined with the warm surface temperature enhances the GPLLJ (Fig. 2a, b). In fall, the GPLLJ tends to weaken even further as the temperature difference between the Gulf of Mexico and Great Plains decreases (Fig. 2c). In winter, the GPLLJ is typically weakest, but it can still affect the weather patterns in southeastern Texas (Fig. 2d) (Weaver and Nigam, 2008). At the upper levels (200 hPa), southeastern Texas is located southeast of a large-scale trough during spring, fall, and winter that is favorable to upward motion (Fig. 3a, c, d). In contrast, the region is occupied by a high-pressure ridge in summer that contributes to convection inhibition (Fig. 3b).
When precipitation occurs, anomalous cyclonic flow roughly centered over southeastern Texas is observed. The magnitude of moisture anomaly varies and is found to be weakest in summer and strongest in fall and winter (Fig. 2), consistent with previous studies (Feng et al., 2016; Geerts et al., 2016; Haberlie and Ashley, 2018). Furthermore, southeastern Texas is situated between an anomalous upper-level trough and ridge, suggestive of mid-level upward motion. The upper-level anomalies are strongest in fall and winter, followed by spring, but insignificant in summer (Fig. 3). Local thermodynamic factors become important in driving summertime convection because of the absence of large-scale anomalies (Wang et al., 2022).
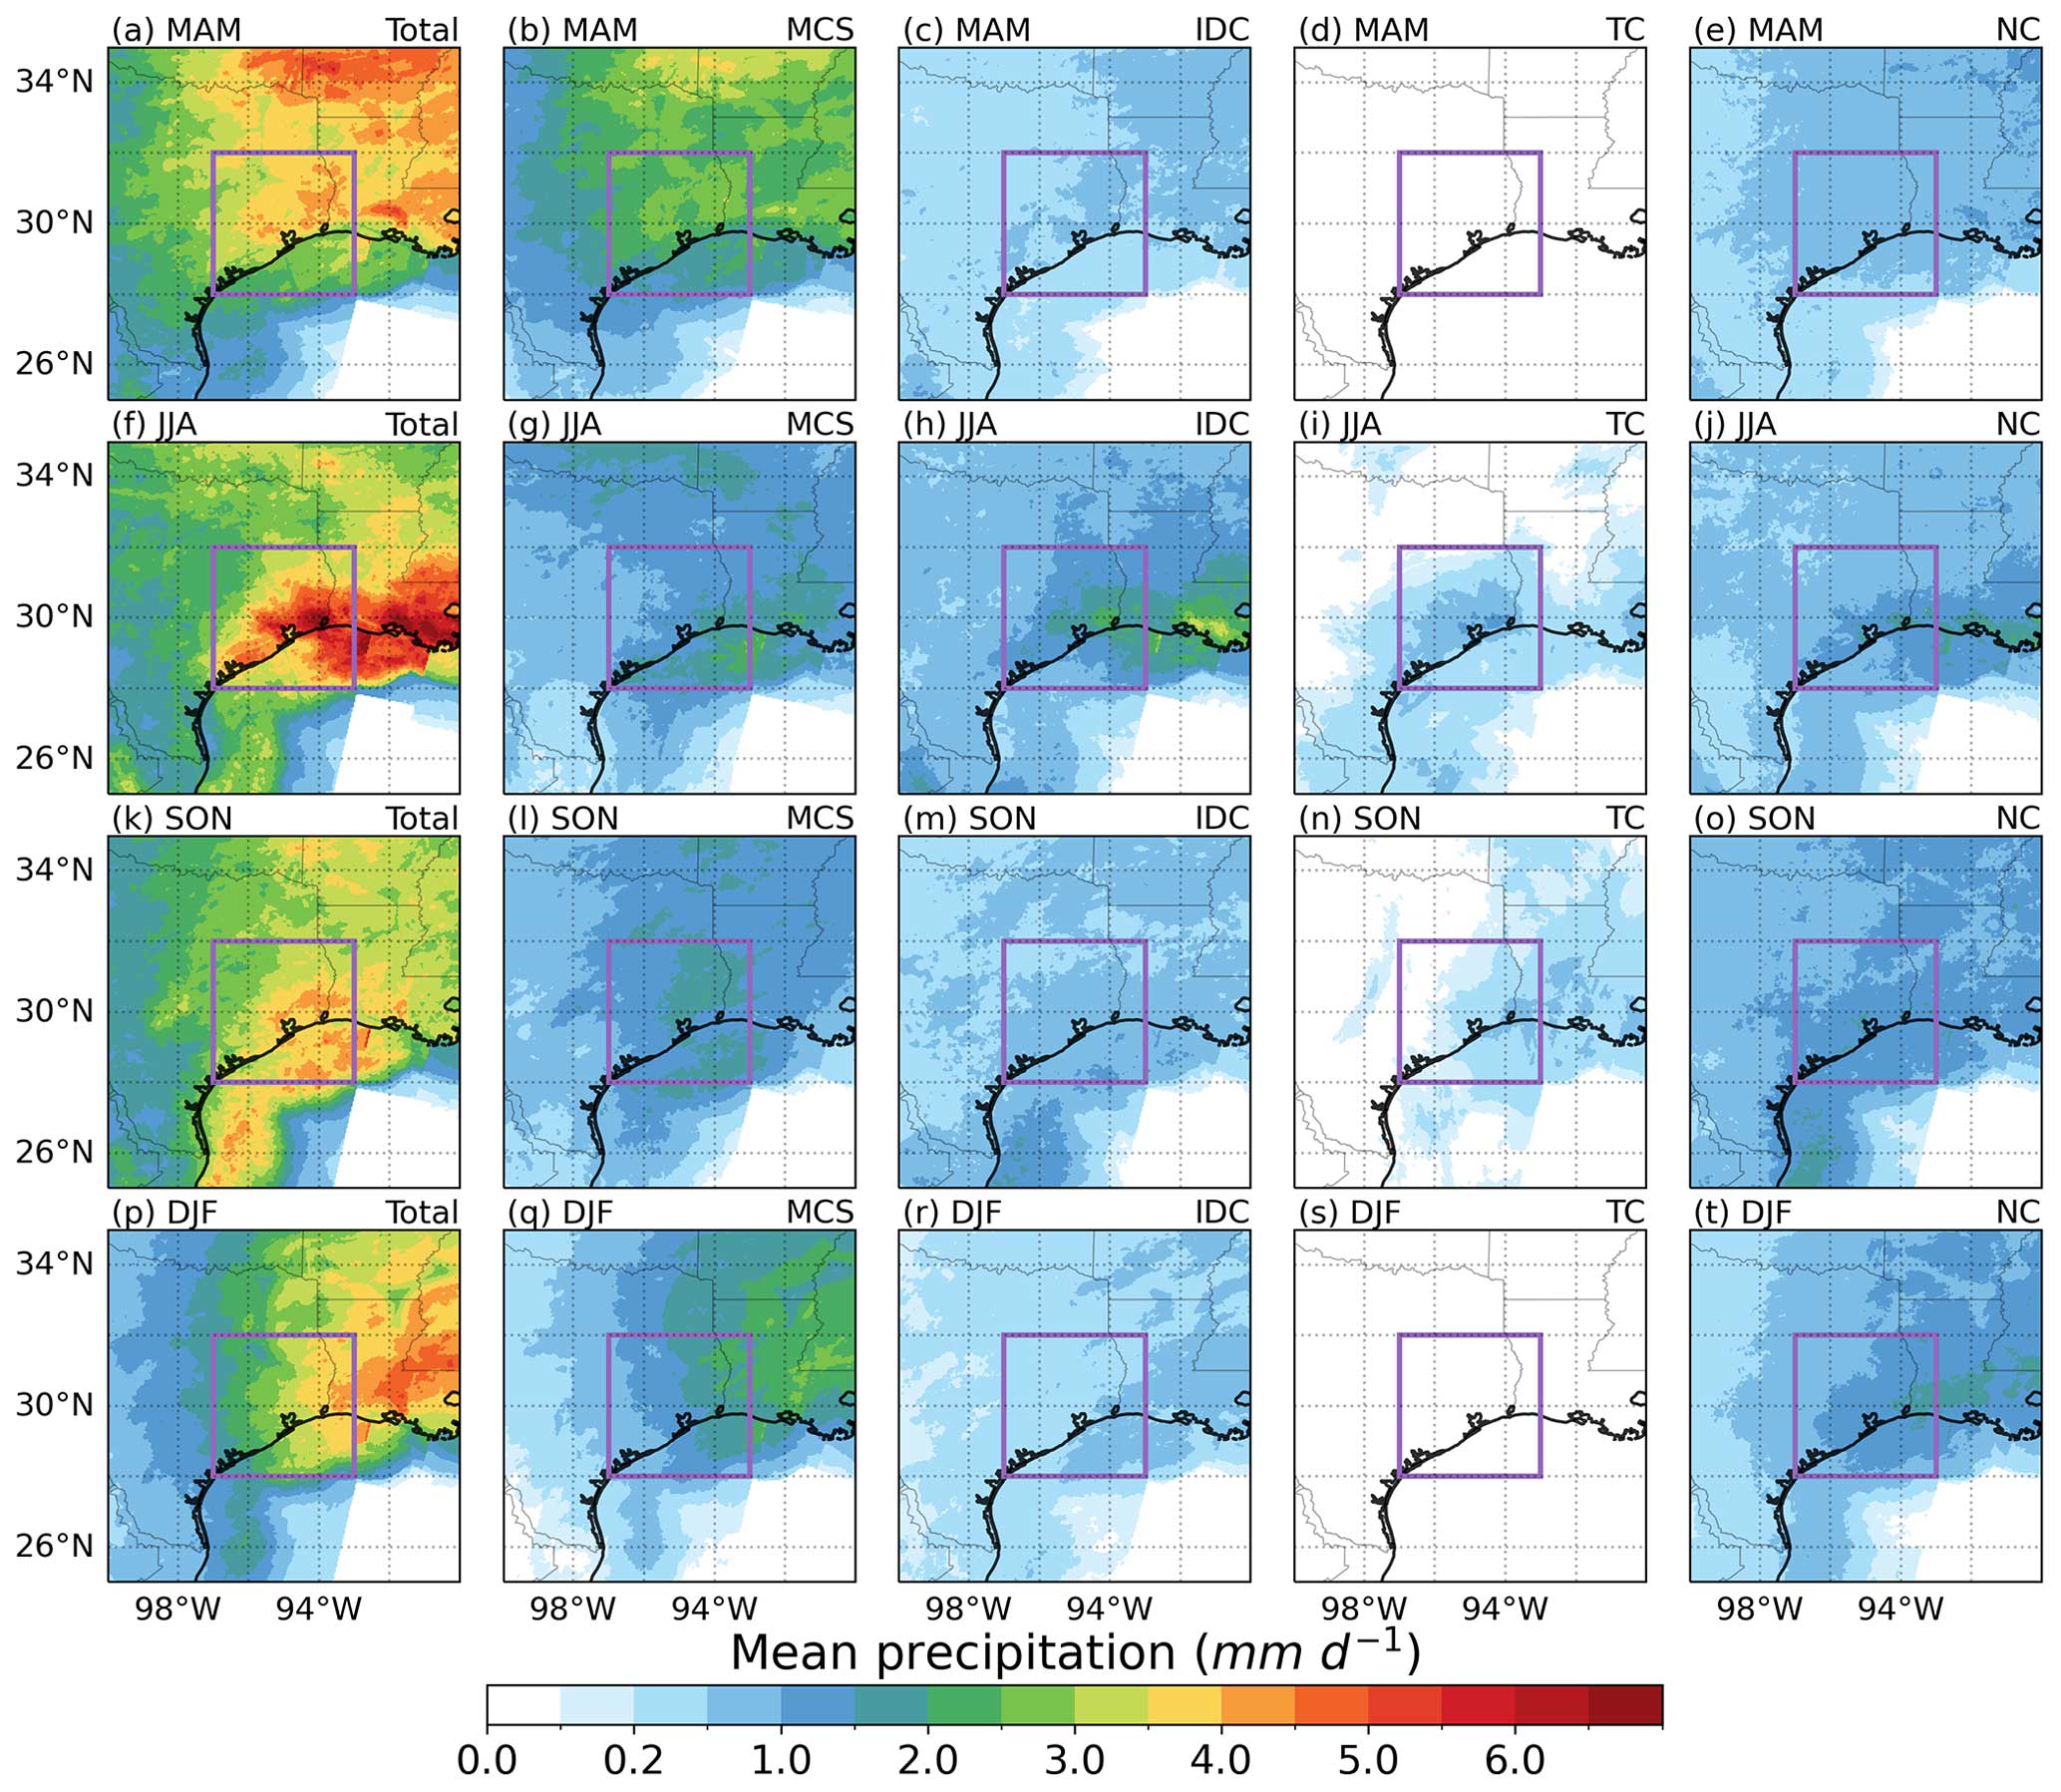
Figure 4Mean precipitation amount (mm d−1) in each season and for each precipitation type. The purple rectangle indicates the southeastern Texas area to calculate the statistics. MCS, IDC, TC, and NC stand for mesoscale convective system, isolated deep convection, tropical cyclone, and non-convection, respectively.
Table 1Statistics of precipitation features including the mean precipitation, precipitation intensity, and the contribution of different precipitation types.
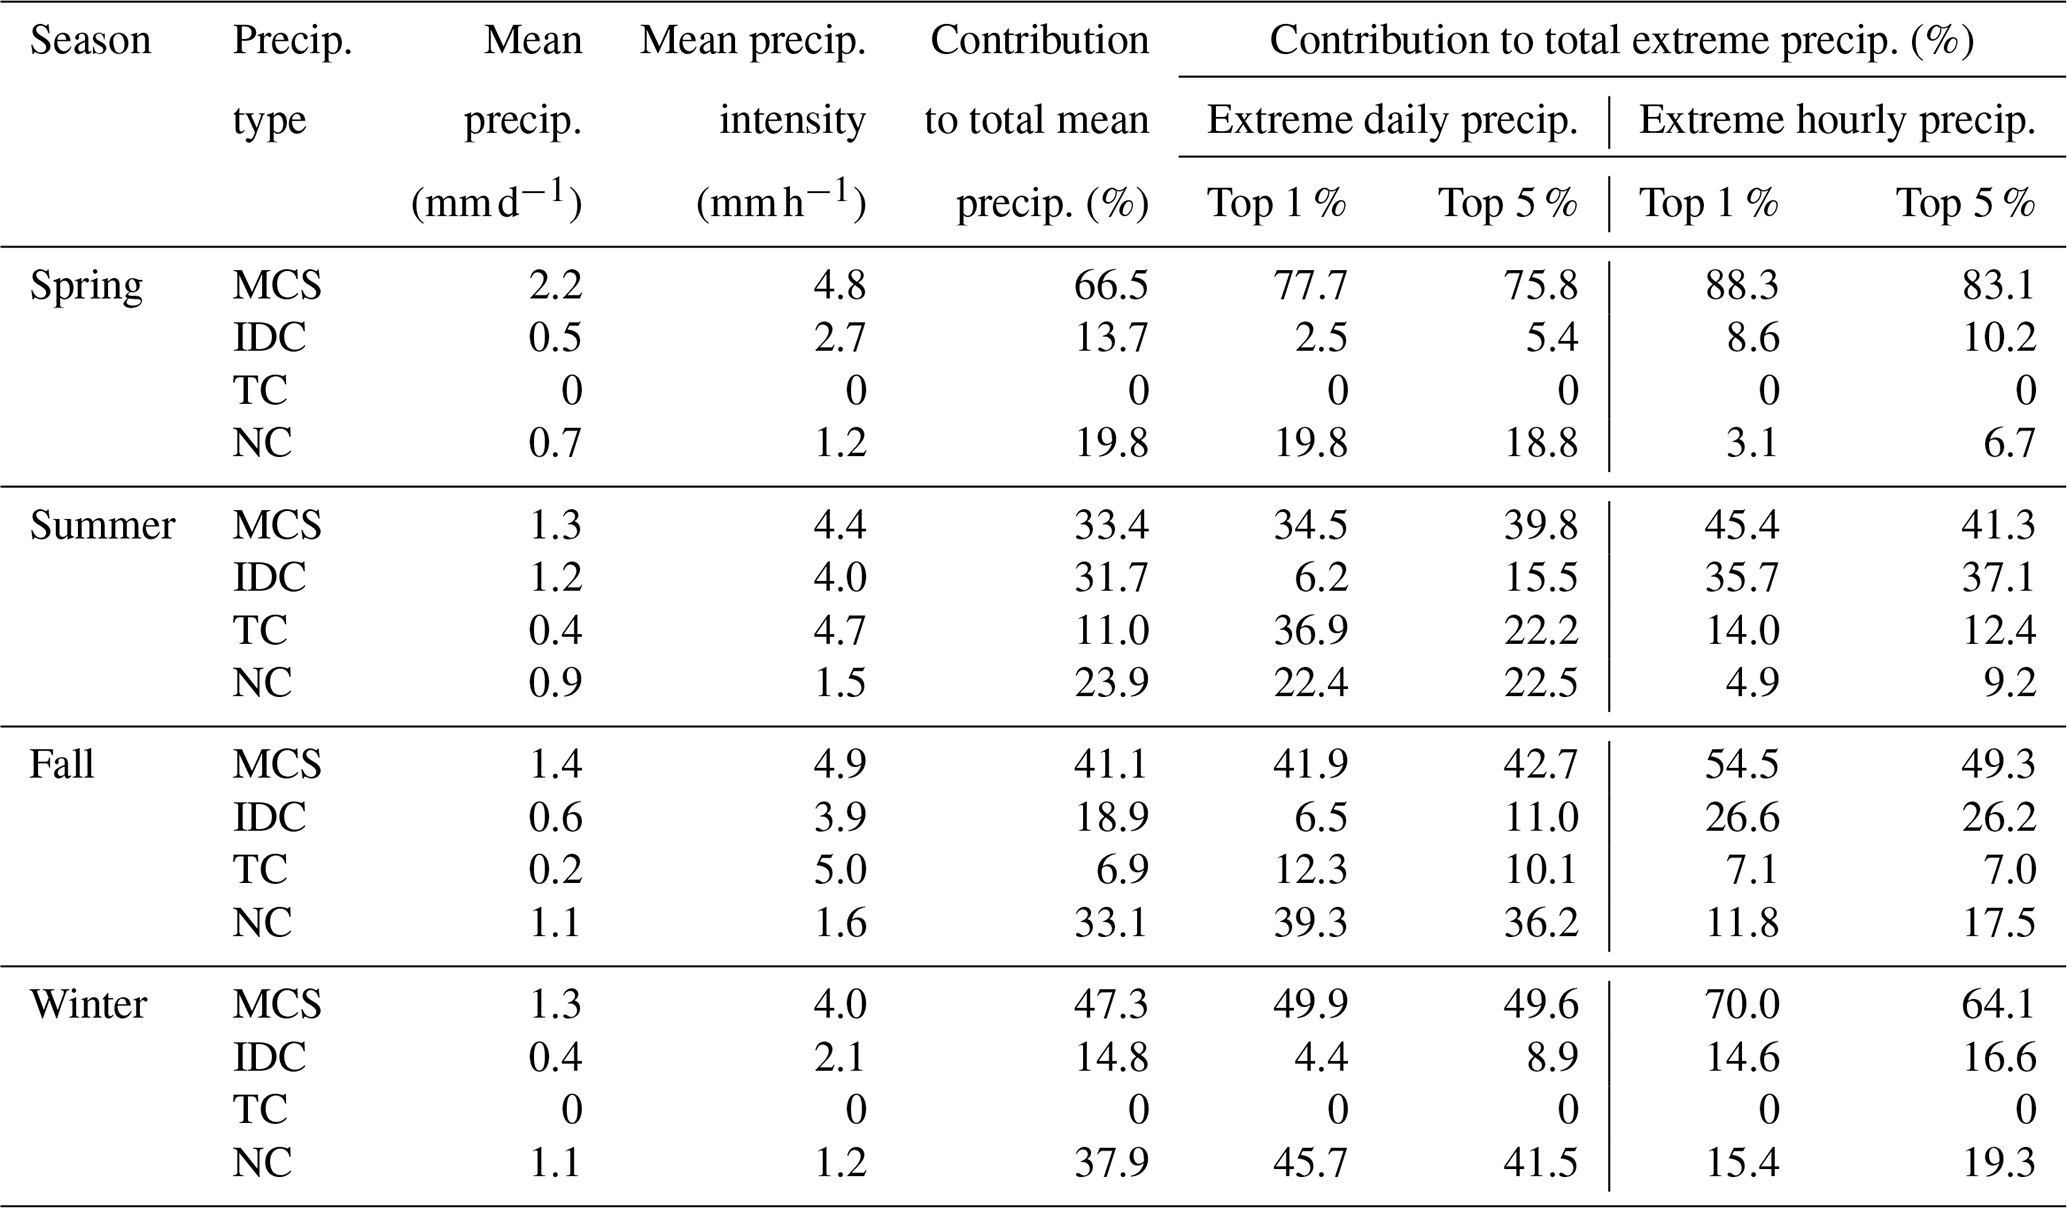
Note: precip. stands for precipitation. MCS, IDC, TC, and NC stand for mesoscale convective system, isolated deep convection, tropical cyclone, and non-convection, respectively. The top 1 % and 5 % of daily and hourly precipitation are calculated as precipitation greater than 99th and 95th percentiles on the respective timescales.
We analyze the statistical precipitation features during four seasons (Fig. 4, Table 1). The largest precipitation rate (over the entire period) is observed in summer (3.9 mm d−1), followed by fall (3.4 mm d−1), spring (3.3 mm d−1), and winter (2.8 mm d−1). MCSs are the primary contributor to the mean precipitation in all seasons, accounting for 66.5 %, 33.4 %, 41.1 %, and 47.3 % of the precipitation amount, in spring, summer, fall, and winter, respectively. In general, the relative amount of MCS-associated precipitation over southeastern Texas in each season is consistent with the findings over the southern Great Plains in a previous study focusing on long-lived MCSs east of the Rocky Mountains (Feng et al., 2019). In addition to MCSs, IDC events contribute 31.7 % of summer precipitation, and non-convection (NC) contributes 23.9 %, 33.1 %, and 37.9 % of precipitation in summer, fall, and winter, respectively, especially in the eastern part of the coastal region. TCs contribute around 10 % of total precipitation in summer and fall but are rarely observed in spring and winter.
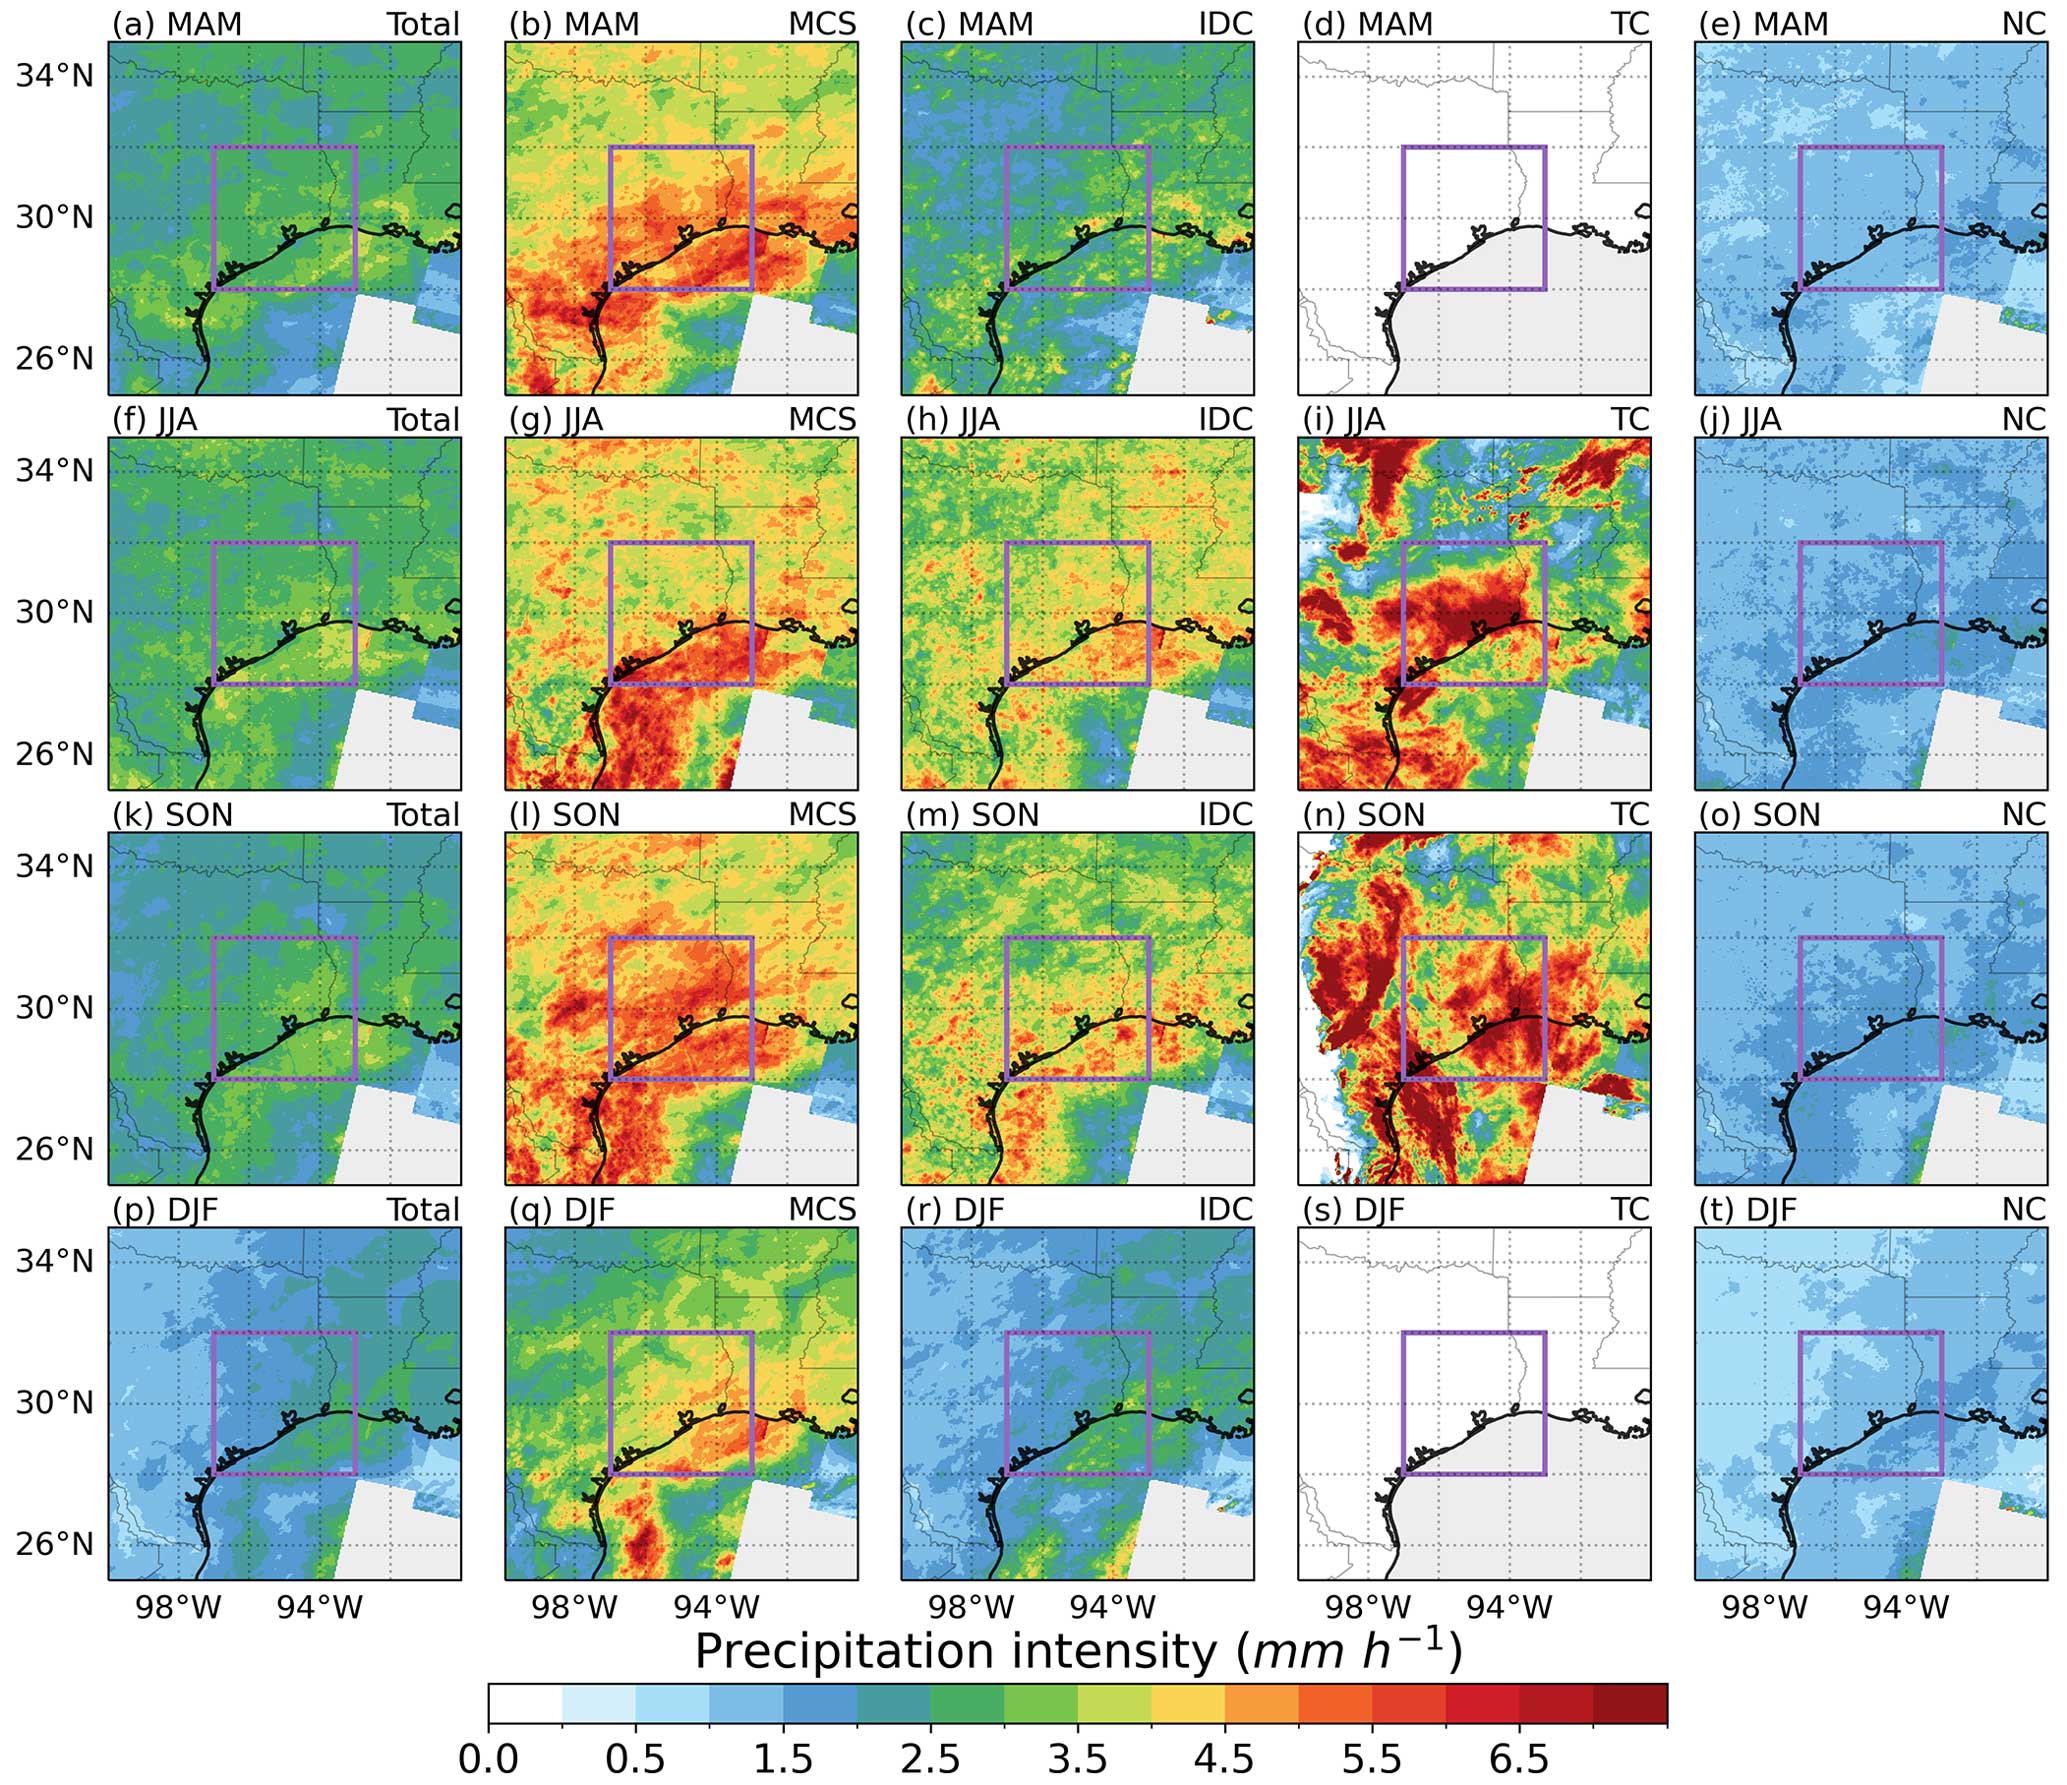
Figure 5The same as Fig. 4 but for precipitation intensity (mm h−1).
The coastal region experiences more intense precipitation than inland areas. Precipitation intensities are similar in spring, fall, and summer (ranging from 2.8 to 3.0 mm h−1) but weaker in winter (2 mm h−1) (Fig. 5, Table 1). Of the four precipitation types, MCSs bring intense precipitation in all seasons (ranging from 4.0 to 4.9 mm h−1). IDC events produce intense precipitation in both summer and fall (mean precipitation intensities of 4.0 and 3.9 mm h−1, respectively). NC events, with lowest precipitation intensity among the four precipitation types, have a larger contribution to total precipitation in winter compared with other seasons, resulting in the weakest mean precipitation during winter. TCs generate the most intense precipitation in summer and fall, with an average precipitation intensity exceeding 4.7 mm h−1, but make a small contribution to the total precipitation amount.
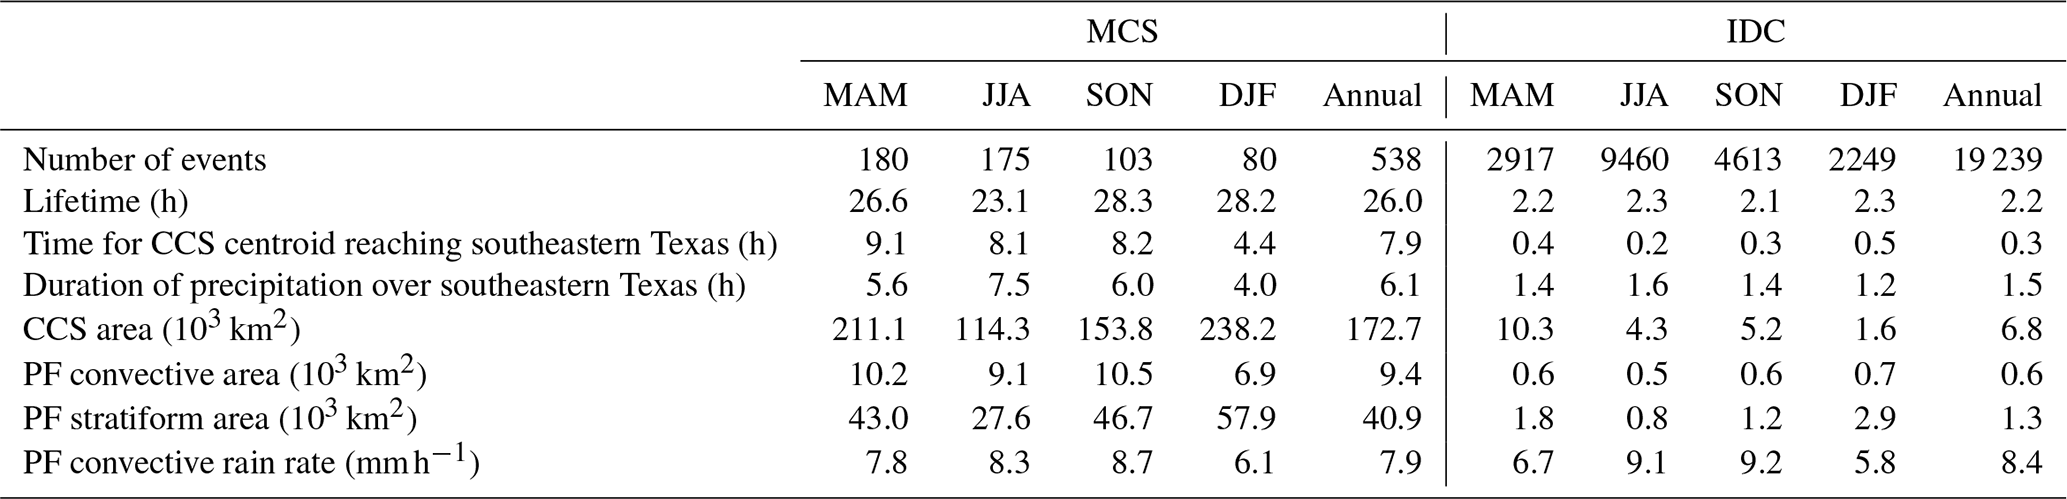
Table 2Statistics of the track features of MCS and IDC events in the four seasons.
To identify seasonal extreme precipitation events, we adopt a definition based on daily or hourly precipitation greater than the 99th and 95th percentiles of all days or hours with rainfall using all grid points within the southeastern Texas region, representing the top 1 % and top 5 %, respectively (Li et al., 2021b). We find consistent statistics using these definitions (top 1 % and top 5 %; Table 1). MCSs contribute the majority of extreme precipitation, particularly in spring, accounting for 77.7 % to 88.3 % of both daily and hourly extremes. In comparison, IDC events have a more significant impact on hourly extremes than daily extremes, whereas NC events have greater contributions to the daily metric. The differences in the lifetime of the three precipitation types could explain the differences found between the daily and hourly metrics (Table 2). MCSs commonly have a lifetime of 20 h with heavy precipitation, causing extremes on both daily and hourly timescales. In contrast, IDC events produce intense precipitation for an average of 2 h, leading to a moderate contribution to the daily average. NC events produce light to moderate precipitation for a few hours to days; therefore, they have a significant contribution to the daily metrics. Moreover, TCs in fall and summer can produce intense precipitation from hours to a day, contributing 7.0 % to 36.9 % of the daily and hourly extremes, respectively.
3.2 Large-scale environments associated with MCS and IDC initiation in different seasons
In this section, we dive into the connection between the large-scale environmental conditions and MCS and IDC events. Overall, MCSs more frequently occur in spring and summer than in fall and winter, whereas IDC occurrences are concentrated in summer and early fall (Table 2). LSMPs associated with MCS initiation comprise three frontal system patterns and an anticyclone pattern in all seasons. These LSMPs are similar in spring, fall, and winter, but they are much weaker in summer. The similar four LSMPs are found to be associated with IDC initiation, but different patterns are found in summer. Therefore, we focus on comparisons of LSMPs in spring and summer and between MCS and IDC events.
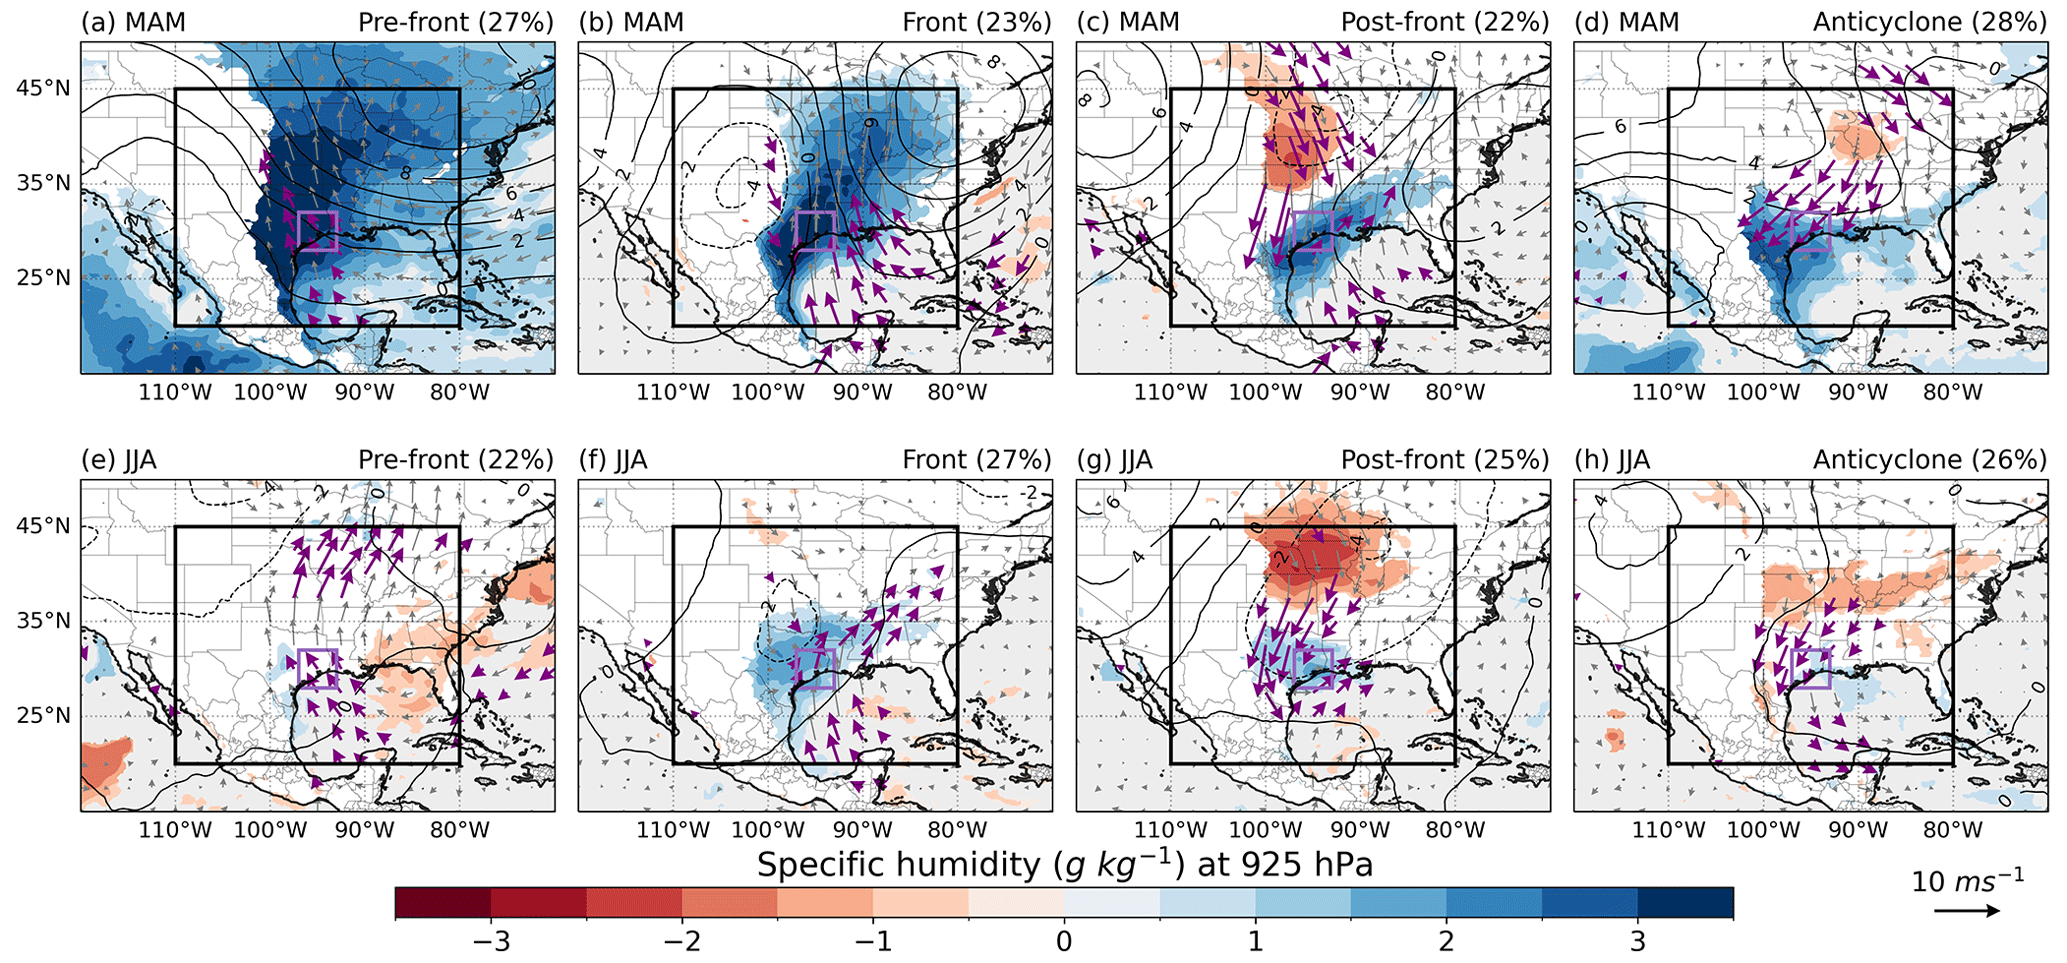
Figure 6Anomalous wind vector (m s−1) and specific humidity (g kg−1) at 925 hPa for spring (a–d) and summer (e–h) associated with MCS initiation. Contours are the 500 hPa geopotential height (gpm) anomalies. Numbers in the parentheses indicate the frequency of each LSMP. The wind vector and specific humidity below terrain are masked out. Significant vectors at the 5 % level according to a Student t test are shown in purple. Only significant specific humidity anomalies are shown. The black box indicates the region for SOM analysis.
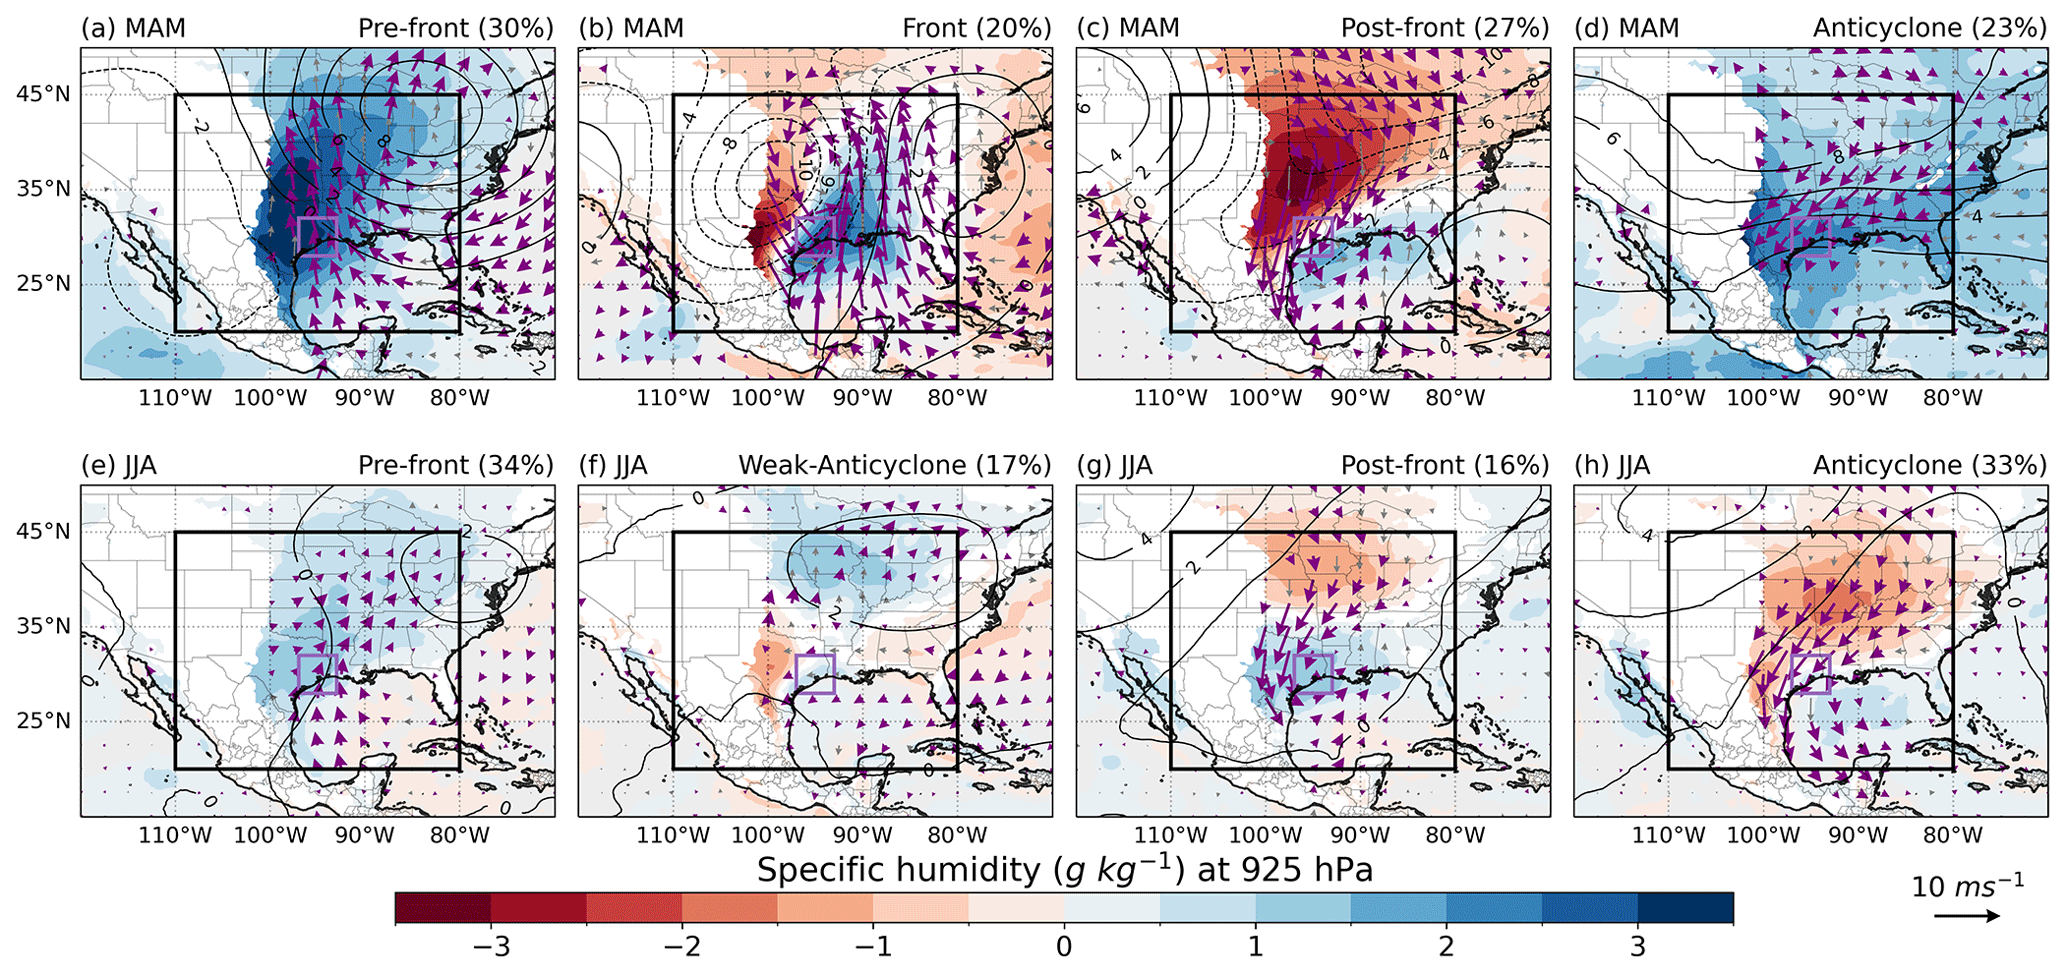
Figure 7The same as Fig. 6 but for IDC events.

Figure 8The same as Fig. 6 but for the 500 hPa vertical velocity (× −100 Pa s−1). Only significant anomalies at the 5 % level according to a Student t test are shown.
In spring, three LSMPs associated with frontal systems, namely, pre-front, front, and post-front LSMPs, account for 27 %, 23 %, and 22 % of MCS occurrences, respectively, and 30 %, 20 %, and 27 % of IDC occurrences (Figs. 6a–c, 7a–c), respectively. During the pre-front LSMP, anomalous southerly winds dominate the southern Great Plains and extend inland, while weak anomalous winds dominate east of the Rocky Mountains (Fig. 6a). This resembles a synoptic front (or trough when the front is absent) between the Rocky Mountains and southeastern Texas, accompanied by a strong moisture gradient across the front (Figs. 6a, 7a). The strong moisture gradient is also known as the “dryline”, which often favors convective storm initiation (e.g., Hoch and Markowski, 2005). During the front LSMP, wet anomalies shift southeast, with a slightly clockwise tilt, coinciding with anomalous northwesterly winds and low moisture west of southeastern Texas (Figs. 6b, 7b). As a result, an intensified front resides over southeastern Texas, with converging moisture and enhanced mid-level lifting (Fig. 8b). During the post-front LSMP, the anomalous frontal system is further east, positioning the front to the southeastern edge of southeastern Texas (Figs. 6c, 7c). The three frontal LSMPs depict different locations of the front and dryline. The baroclinic forcing near the front lifts moist parcels and favors convection initiation.
The fourth LSMP, the anticyclone, does not appear in the anomalous patterns that were selected to include all convective events (Fig. 2e), although it accounts for 28 % and 23 % of all MCS and IDC occurrences, respectively. The anticyclone LSMP exhibits distinct circulations compared with front-related LSMPs, with anomalous high pressure dominating southeastern Texas (not shown). The anomalous northeasterly winds transport moist air over the eastern slope of the Rocky Mountains, which could trigger convection through orographic lifting (Figs. 6d, 7d).
During the summer months, the four LSMPs occur with almost equal frequency, display similar patterns to those observed during spring, but are smaller in magnitude (Fig. 6e–h). The frontal lifting mechanism can easily trigger MCS initiation in a moist and warm summer environment. The anticyclone LSMP is also present in the summer, although without the significant moisture anomalies and air stacking that are seen in spring. Regarding IDC initiation, two groups of LSMPs are identified: two front-related and two anticyclone-related patterns. The pre-front and post-front LSMPs account for 34 % and 15 % of the IDC events, respectively (Fig. 7e, g). The remaining 34 % and 17 % of IDC initiations are associated with anticyclonic or weakly anticyclonic conditions, respectively.
The frontal system and orographic forcing mainly provide the lifting force in spring, which can be observed from the middle-atmosphere large-scale upward motion. The anomalies in the 500 hPa vertical velocity are greater than −0.2 Pa s−1, suggesting a strong upward motion (Fig. 8). The upward motion area also shifts eastward and rotates clockwise from pre-front to post-front LSMPs, whereas the upward motion area is confined over the eastern slope of the Rocky Mountains to the west of southeastern Texas under anticyclonic conditions. In contrast, significant mid-tropospheric upward motion is only found during front-related LSMPs in summer. No large-scale lifting mechanism is observed during anticyclone LSMPs, when mesoscale and local factors, such as sea-breeze forcing, may trigger convection.
The composite analysis of the four LSMPs in fall and winter is generally similar to those in spring, except there are less-significant anomalies for winter MCSs. It is worth noting that the mid-tropospheric ascent anomalies are strongest in winter, which is possibly needed to support deep convection in an environment with the lowest moisture and instability.
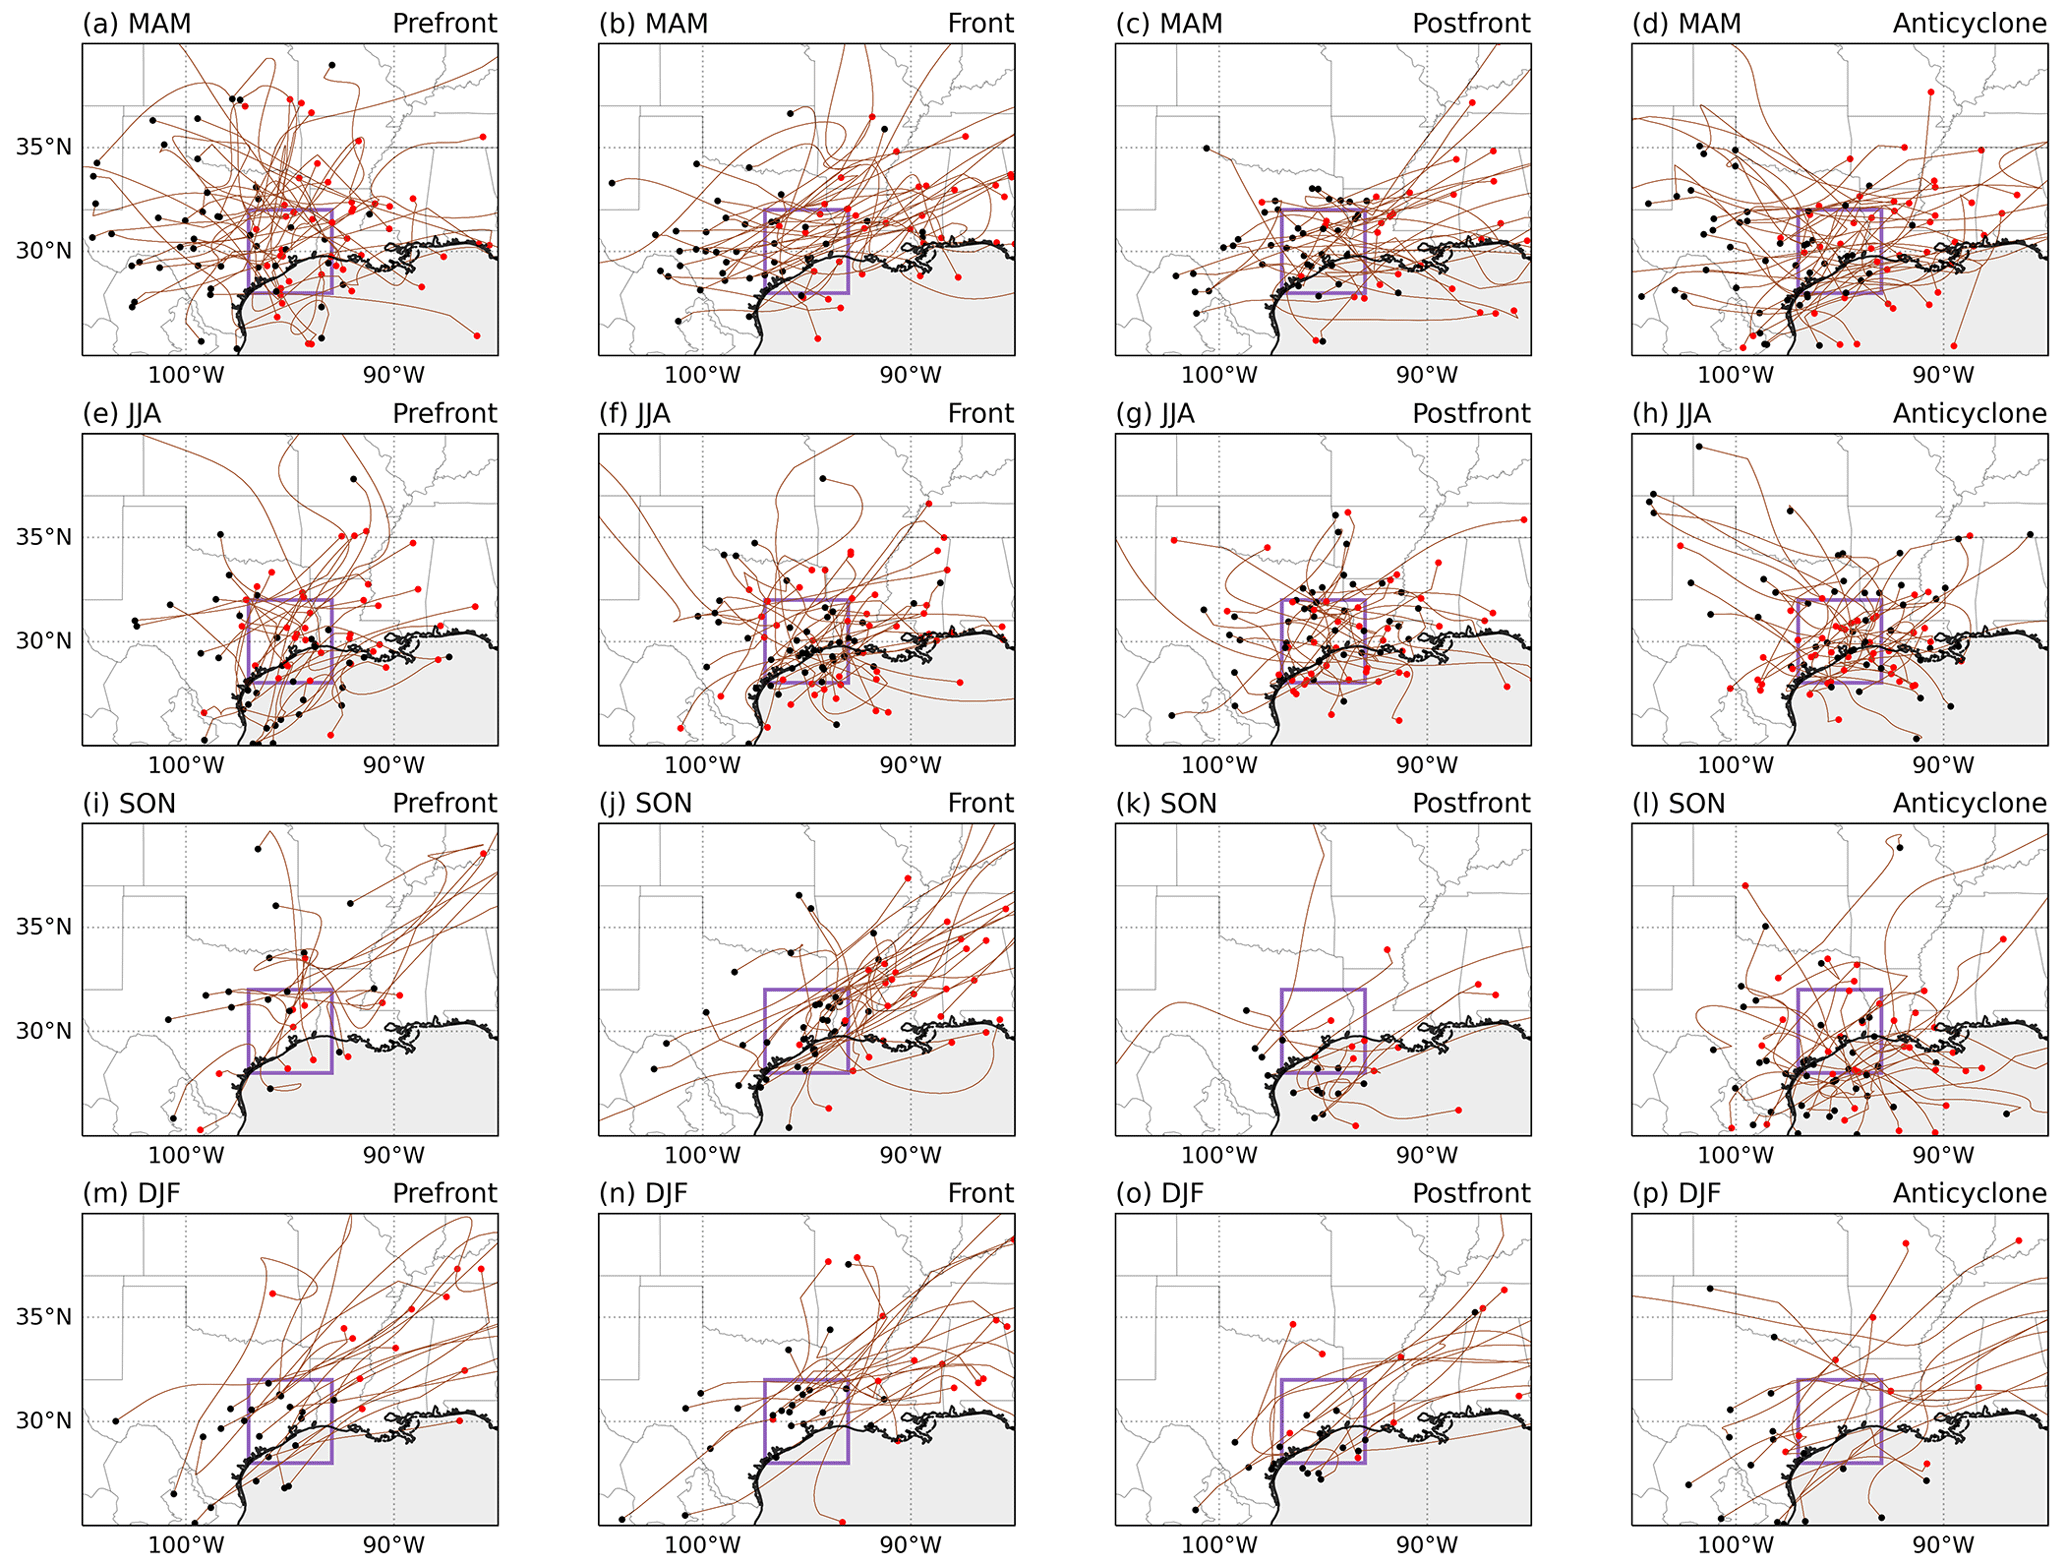
Figure 9Track path of MCSs. Black and red dots indicate the location of initiation and decay, respectively. The purple box indicates the southeastern Texas region. MAM, JJA, SON, and DJF represent the boreal spring, summer, fall, and winter, respectively.
3.3 Tracking the convective systems
In this section, we examine the characteristics of convection affecting southeastern Texas, including initiation location, travel path, lifetime, precipitation duration, cold-cloud-system area, and rain rate. This analysis includes 180, 175, 103, and 80 MCS events and 2917, 9460, 4613, and 2249 IDC events in spring, summer, fall, and winter, respectively. All of these track features are included in the convection dataset developed by Li et al. (2021a). In spring, a significant proportion of MCSs, ranging from 59 % to 82 % depending on the LSMP, initiate outside of southeastern Texas and propagate into the region, whereas the remaining systems initiate locally (Fig. 9a–d). With spring front-related LSMPs, the preferred location for MCS initiation shifts from central and western Texas to the southeastern coast as the frontal system progresses. We observe a shift in the MCS travel direction from southeastward under pre-frontal conditions to northeastward or eastward under frontal or post-frontal conditions, consistent with the clockwise tilting of the steering-level winds associated with the frontal systems. Consequently, MCSs tend to decay in an area close to southeastern Texas in the west–east direction during the pre-frontal LSMP, whereas they decay farther eastward during the frontal and post-frontal LSMPs. Over 90 % of the spring MCSs travel eastward, even under anticyclone conditions, aligning with the mean background wind direction. In summer, MCSs initiate in a narrow longitude band (100–90° W) on both the western and eastern sides of southeastern Texas. Depending on the season, 50 %–85 % of MCSs initiate outside of southeastern Texas and propagate westwards or eastwards to the region. Over 70 % of the front-related MCSs and 55 % of anticyclone-related MCSs travel eastward. In fall and winter, MCSs initiate close to southeastern Texas and travel further east, especially under front-related conditions, resembling the characteristics of both spring and summer except with lower occurrence.
The travel time for MCSs to reach southeastern Texas varies across seasons, with approximately 9 h in spring, 8 h in summer and fall, and 4 h in winter (Table 2). Apart from the initiation location, the travel time can also be influenced by the faster background wind speeds during cold seasons compared with warm seasons. The difference in movement speed also contributes to the longest duration of precipitation over southeastern Texas in summer, while the shortest duration is in winter. Comparing LSMPs within each season, MCSs associated with pre-frontal and front LSMPs move more quickly through southeastern Texas than post-frontal and anticyclone LSMPs. This behavior can be attributed to the fact that the former LSMPs are associated with southerly anomalies that are superposed on prevailing southerly winds, whereas the latter LSMPs involve northerly anomalies that decrease the speed of storm advection.
Strong seasonal variations are observed in the size of CCSs and precipitation features (PFs) associated with MCSs. Summer and fall have the smallest CCSs, which are nearly twice as large, on average, in the spring and winter. The PFs of MCSs, predominantly the stratiform area, are smallest in summer, comparably larger in spring and fall, and largest in winter (Table 2). In summer, local factors play a more important role in MCS initiation and, consequently, creating relatively larger convective area (7400–107 000 km2 across LSMPs) and smaller stratiform area (243 000–309 000 km2) as well as smaller differences in CCS area across the LSMPs. Conversely, in winter, the large-scale environment becomes the predominant driver with respect to triggering MCSs, resulting in relatively small convective area (ranging in 51 000–84 000 km2 across LSMPs) and large stratiform area (489 000–863 000 km2). Under winter anticyclonic conditions, the stratiform area is approximately twice as large as other LSMPs. In spring and fall, both the convective and stratiform precipitation areas are generally larger during pre-front and front LSMPs compared with during post-front and anticyclone LSMPs.
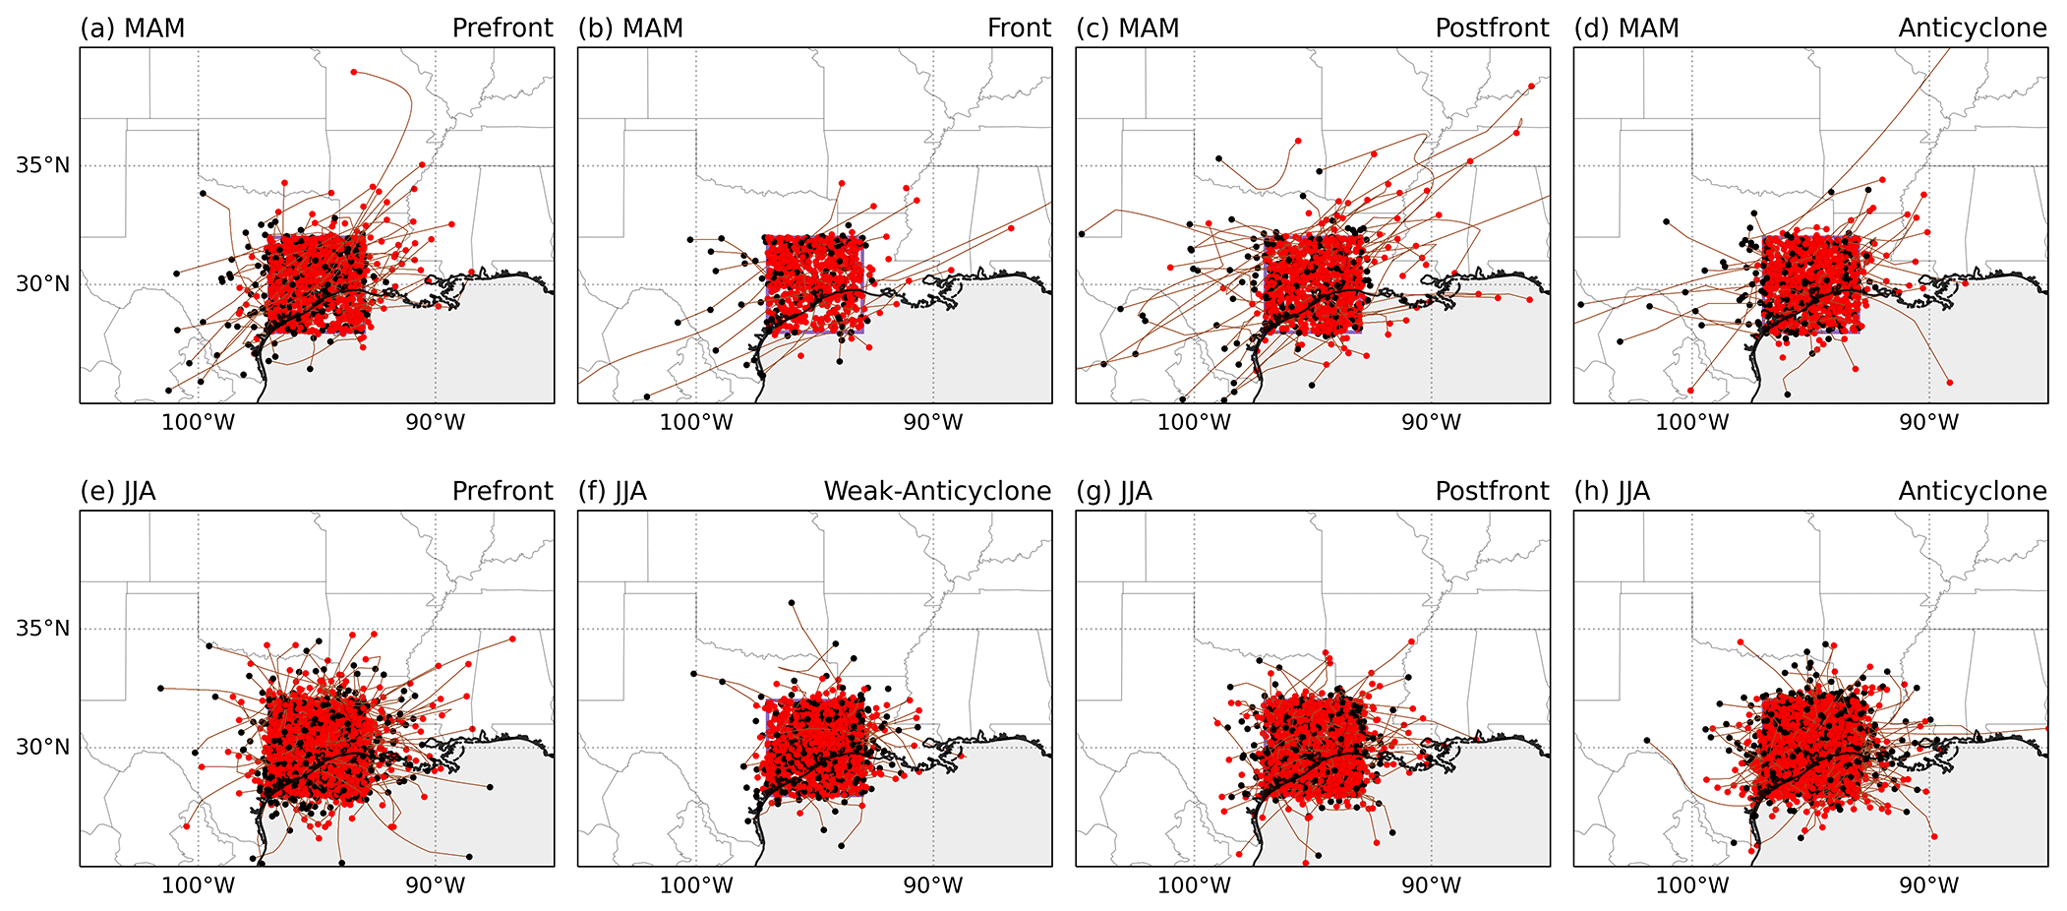
Figure 10The same as Fig. 9 but for IDC events.
Over 94 % of IDC events initiate and end locally within southeastern Texas (Fig. 10). Although the red and black dots are paired in Fig. 10, the red dots are plotted last, making the box look more red. Across all seasons, the average travel time to southeastern Texas ranges from 0.21 to 0.45 h, while the duration of precipitation over southeastern Texas spans from 1.23 to 1.57 h. IDC events have a much smaller spatial extent than MCSs, in terms of convective and stratiform precipitation area, but produce a comparable mean convective rain rate compared to MCSs (Table 2). Across LSMPs, post-front-associated IDC events have the largest CCS area in spring, fall, and winter as well as the largest stratiform cloud area in all seasons.
3.4 Houston metropolitan area
Many of the isolated convective systems have short lifetime and small spatial extent, the scale of which is not fully resolved by the 4 km and hourly convection dataset. The ∼ 5 min and 500 m resolution convective-cell-tracking data at the KHGX site are used to study the fine-scale features of IDC events near Houston. We project the radar-based tracking data onto the four LSMPs by matching the hours belonging to each LSMP. Almost all MCSs initiate outside of the small area covered by radar. Therefore, the hours with MCS initiation are excluded to avoid cells that advected into this area. Among different seasons, summer stands out due to the highest frequency of IDC events, primarily driven by local factors. Therefore, we select summer as an example to explore the initiation location and hour of IDC events near Houston. The percentage of IDC event initiation associated with each LSMP slightly differs from values based on the hourly dataset, as the KHGX data include convection that persists for less than 1 h and within a smaller area. We find that 40 % of IDC events occurred during a pre-frontal LSMP, 15 % during weak-anticyclone LSMP, 21 % during post-frontal LSMP, and 24 % during anticyclone LSMP.
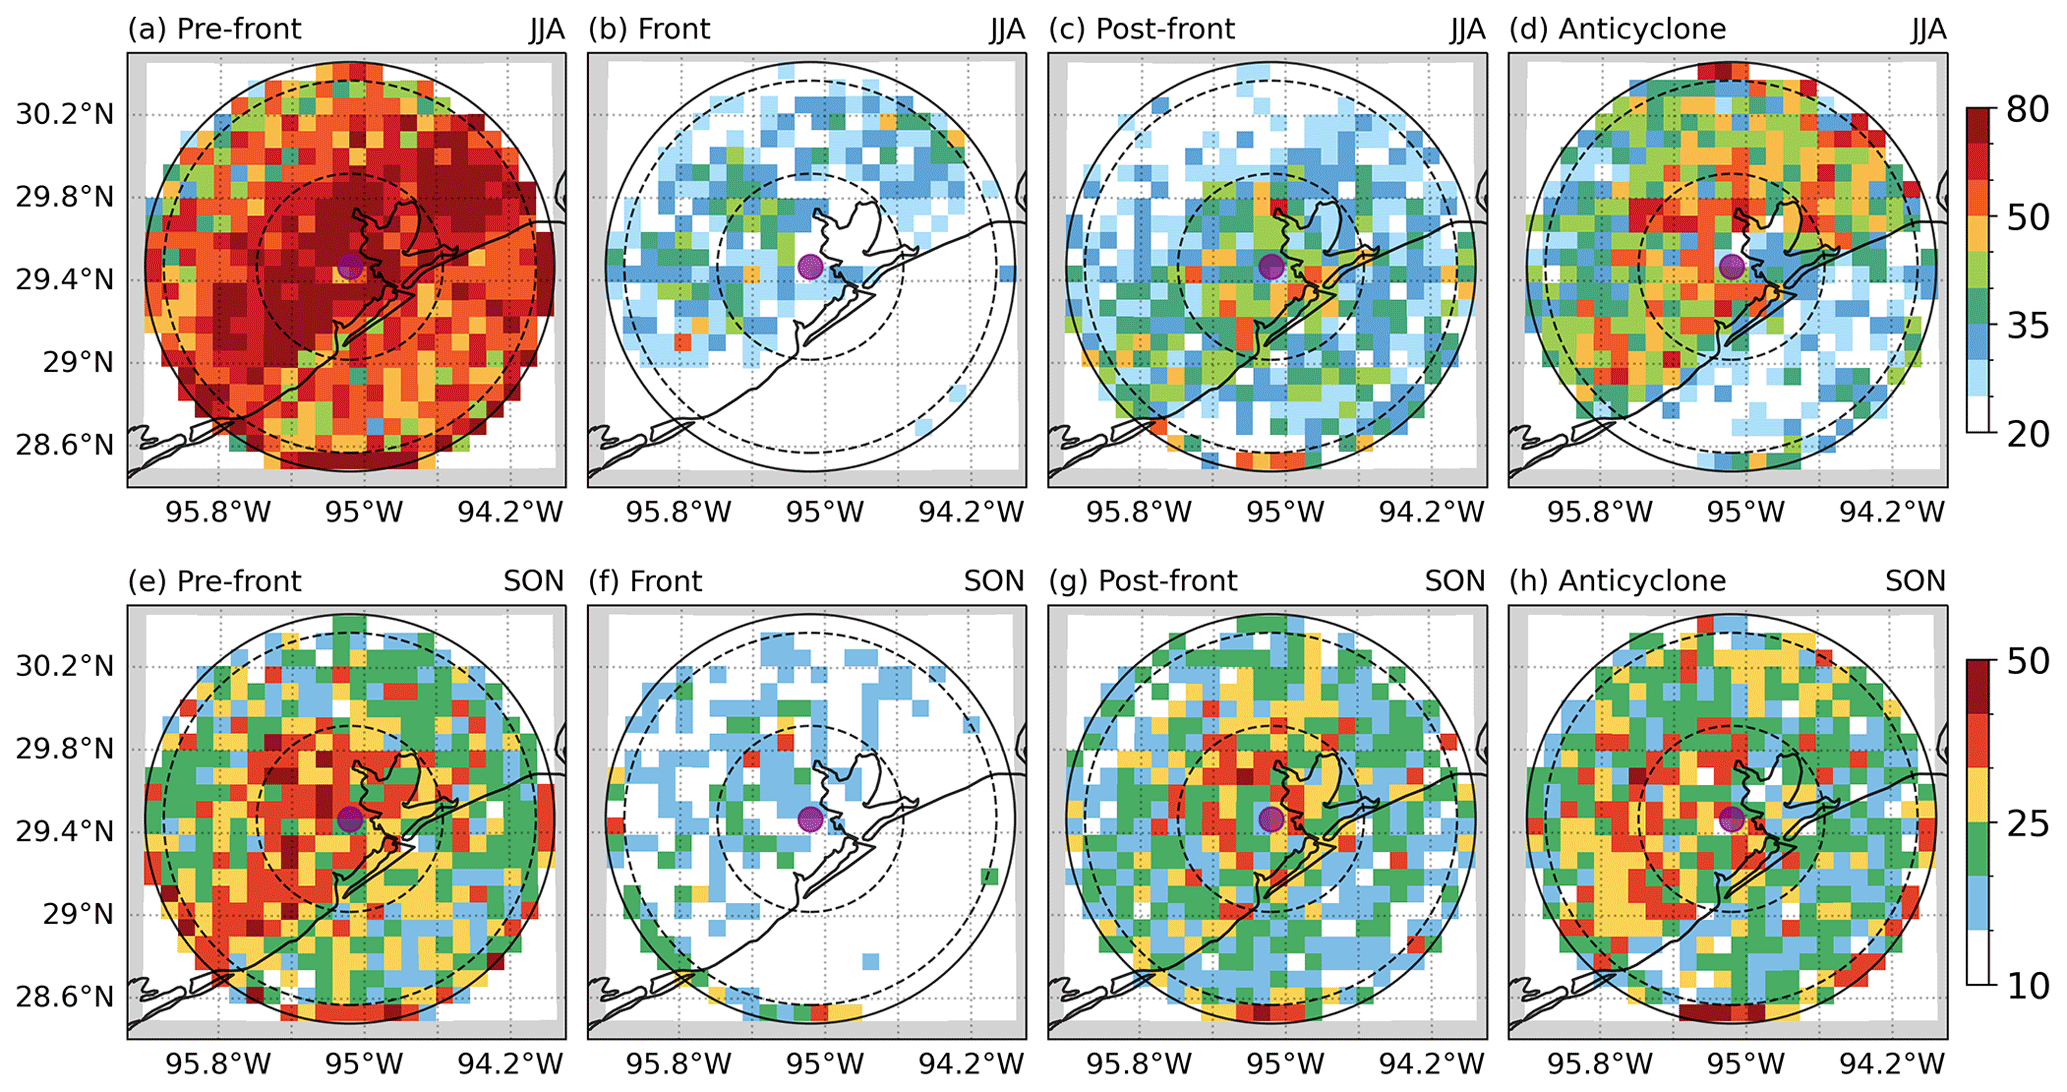
Figure 11Number of IDC events initiated during each LSMP in summer (a–d) and fall (e–h). The purple dot indicates the location of the KHGX site. The solid and dashed circles, from the outside in, indicate radii of 110, 100, and 50 km.
During pre-frontal and post-frontal LSMPs, the combination of warm surface temperatures, abundant low-level moisture, and large-scale lifting creates favorable conditions to trigger convection both offshore and onshore (Fig. 11a, c). The anomalous southerly winds during a pre-front LSMP bring the moist flow further inland, whereas the northerly anomalies during a post-front LSMP restrict convection to the coastline (Fig. 6e, g). In contrast, when an anticyclone dominates the area, convection is primarily triggered by the sea-breeze circulation, during which the onshore branch of the circulation initiates convection. Consequently, we find higher occurrences of IDC events initiating onshore, rather than offshore (Fig. 11b, d). A significant number of IDC events also occur in fall. The spatial distribution of IDC initiation locations in fall generally aligns with that in summer (Fig. 11e–h); however, fall is characterized by a front LSMP rather than the weak-anticyclone LSMP identified in the summer. The front LSMP favors IDC initiation over land, although this LSMP contributes minimally to the total number of IDC events. Under anticyclonic conditions, the occurrence of IDC initiation over the ocean slightly increases in fall compared with summer, due to the relatively weaker sea-breeze circulation in fall.
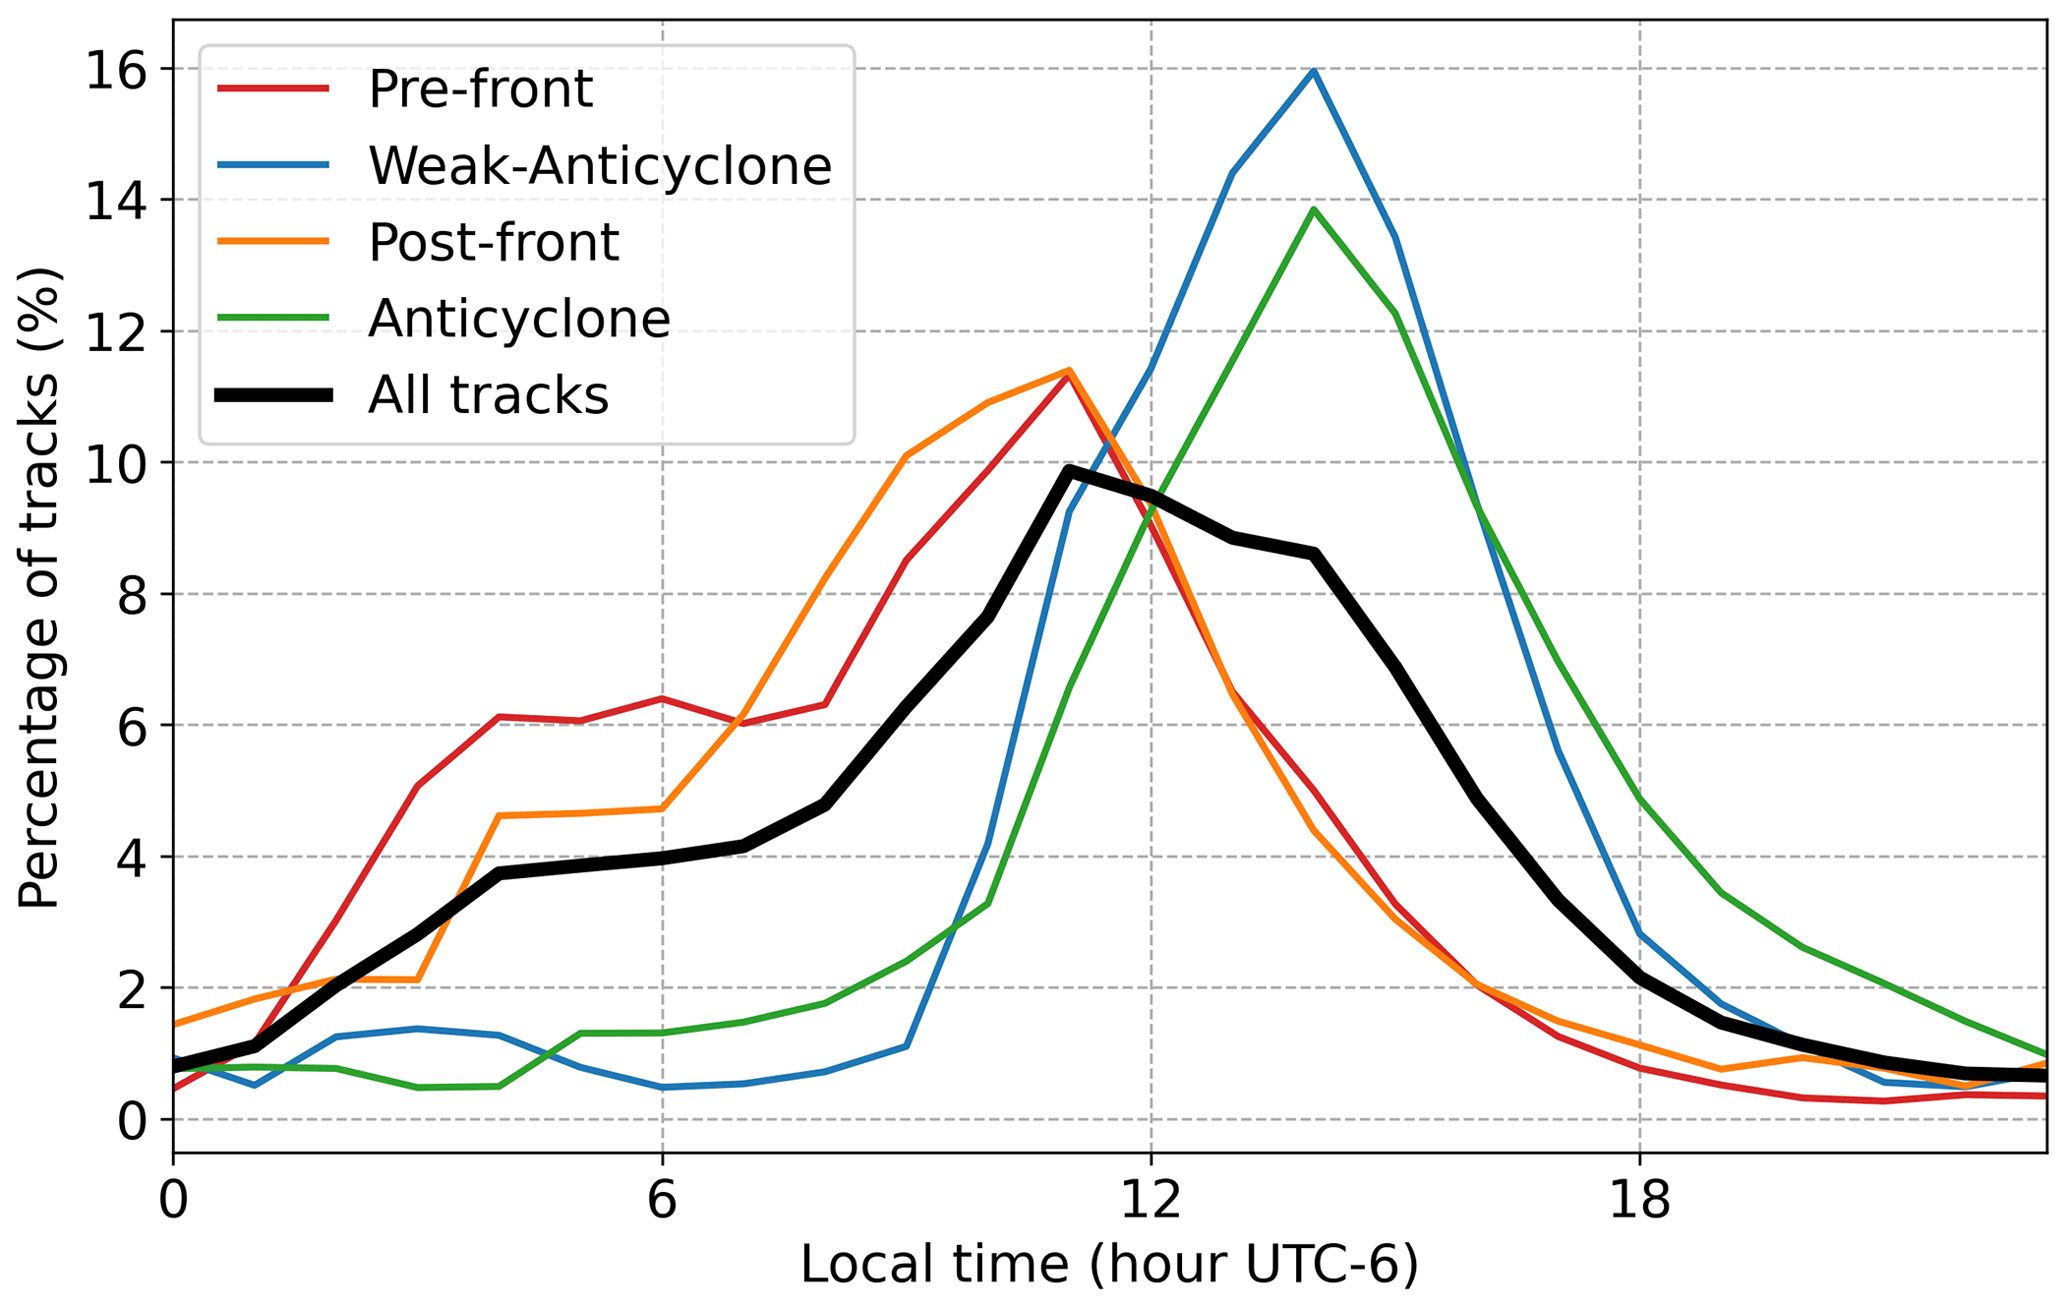
Figure 12Convection initiation (as a percentage) at each hour of a day in summer. The percentage is related to the number of tracks for each LSMP.
The frontal systems move eastward along with the baroclinic wave passing over southeastern Texas, which can occur at any time of day (Feng et al., 2019). However, the local thermodynamic factors show a strong diurnal cycle. Consequently, IDC events more frequently initiate between 10:00 and 15:00 LT (local time; Fig. 12), which is likely due to increased surface heating during the early afternoon. When a baroclinic frontal zone dominates southeastern Texas, even small amounts of convective available potential energy (CAPE) can trigger convection, resulting in a peak IDC initiation near noon. In contrast, when an anticyclone dominates southeastern Texas, IDC initiation requires a higher CAPE to overcome convective inhibition (CIN), leading to a peak occurrence in the afternoon. As a result, IDC events associated with more favorable large-scale environmental conditions occur approximately 3 h earlier than those associated with anticyclones.
The diurnal variation in IDC initiation in spring, fall, and winter shows a lower amplitude than summer (not shown). While IDC events also frequently initiate in the afternoon during spring and winter, more IDC events occur at night and in the early morning compared with summer. The large-scale environment has a more important role in triggering IDC events by providing favorable lifting and low-level moisture convergence that can trigger convection outside of local afternoon hours. The diurnally varying thermodynamic forcing slightly increases convection occurrence in the early afternoon.
In this study, the characteristics of convection that produce precipitation over southeastern Texas are analyzed using 13 years of high-resolution observations and reanalysis. The results reveal that MCSs make significant contributions to both mean and extreme precipitation, with IDC and TC events also playing a role in generating intense precipitation during the summer and fall seasons. The contribution of MCSs to seasonal precipitation over the southeastern Texas area is consistent with statistics reported in previous studies focusing on the southern Great Plains (Feng et al., 2019; Song et al., 2019; Li et al., 2021a). Our findings also highlight that IDC events contribute 33 % of the summer precipitation and over 35 % of the hourly extreme precipitation over the coastal Houston metropolitan area.
The analysis linking convection initiation to weather pattern reveals that the initiation of both MCS and IDC is predominantly influenced by large-scale lifting and low-level moisture convergence during spring, fall, and winter. In contrast, summer convection can even be triggered under weak large-scale circulation anomalies, as the strong surface instability and abundant moisture provide favorable convective conditions.
Through a breakdown of the convection-associated large-scale environment using SOM analysis, we find that the initiation of convection is associated with front-related weather patterns and an anticyclone pattern. The front-related patterns are more profound in spring, fall, and winter than in summer, and they are further differentiated by the stage of frontal passages. The circulation patterns of the front-related LSMPs are consistent with those based on all forms of convection (Feng et al., 2019). These patterns are characterized by low-level moisture convergence, which serves as a primary trigger for convection. Additionally, we find that deep convection can even occur under unfavorable large-scale meteorological conditions. The northeasterly anomalies associated with the anticyclone push moist air towards the eastern slope of the Rocky Mountains, creating an orographic lifting mechanism. In summer, the SOM analysis reveals two groups of weather patterns associated with either favorable or unfavorable circulations for convection initiation. The opposite circulation anomalies in these groups offset each other, resulting in a weak overall anomaly when considering all convections.
The large-scale environment impacts the distinct spatial distribution of MCS initiation. In spring, MCSs affecting southeastern Texas frequently originate between the Rocky Mountain and southeastern Texas and travel eastwards, whereas MCS initiation concentrates close to Houston in summer. During front-related conditions, the MCS initiation location shifts from central and western Texas to southeastern Texas. Even under anticyclone conditions, MCSs initiate in the west and decay after moving eastward, aligning with the mean background wind direction. Fall and winter exhibit reduced MCS occurrence but share similar path features with spring and summer. On average, MCSs initiated remotely require approximately 8 h of travel time before reaching southeastern Texas, whereas IDC events predominantly initiate locally and have a significantly shorter travel time of around 15 min.
By analyzing the NEXRAD radar data near Houston, we find that IDC events show a higher frequency of occurrence along the Texas coast, with the highest level of occurrence under pre-frontal conditions. Furthermore, IDC events exhibit a distinct diurnal pattern, with a peak frequency during the early afternoon. IDC events associated with more favorable front-related LSMPs occur approximately 3 h earlier in the diurnal cycle, peaking at local noon, compared with those associated with anticyclones.
This study provides insights into the characteristics and spatiotemporal patterns of convective systems under different large-scale environmental conditions over southeastern Texas. Understanding the role of the large-scale environment helps tease out the impact of local factors. Our results also offer guidance for selecting cases in which local factors play a dominate role in the initiation of different types of convection.
Scripts for generating the results and figures in this study are publicly available at https://github.com/liuye923/Houston_SOM.git (Liu, 2024).
The datasets used in this study are all publicly available. The MCS and IDC dataset is available at https://doi.org/10.25584/1632005 (Li et al., 2024). ERA5 data were downloaded from https://doi.org/10.24381/cds.adbb2d47 (Hersbach et al., 2023). The Level-II Radar reflectivity at the KHGX site is downloaded from https://registry.opendata..aws/noaa-nexrad (NOAA, 2022).
Research conceptualization, paper preparation, and analysis were performed by YL. Research conceptualization and team management were performed by YQ. MCS and IDC data were obtained by JL and ZF. All authors contributed to the paper edits and technical review.
At least one of the (co-)authors is a member of the editorial board of Atmospheric Chemistry and Physics. The peer-review process was guided by an independent editor, and the authors also have no other competing interests to declare.
Publisher's note: Copernicus Publications remains neutral with regard to jurisdictional claims made in the text, published maps, institutional affiliations, or any other geographical representation in this paper. While Copernicus Publications makes every effort to include appropriate place names, the final responsibility lies with the authors.
The authors would like to thank the anonymous reviewers and the editor, Jianping Huang, for comments that improved the paper. We would also like to thank Jerome D. Fast and Colleen M. Kaul for reviewing earlier versions of this paper. Finally, computing resources for the simulations were provided by the Environmental Molecular Science Laboratory (EMSL) on its Deception cluster.
This study was supported by the US Department of Energy's Office of Biological and Environmental Research as part of the Atmospheric System Research (ASR) program. The Pacific Northwest National Laboratory is operated by Battelle for the US Department of Energy under contract no. DE-AC05-76RLO1830.
This paper was edited by Jianping Huang and reviewed by three anonymous referees.
Berg, L. K., Riihimaki, L. D., Qian, Y., Yan, H. P., and Huang, M. Y.: The Low-Level Jet over the Southern Great Plains Determined from Observations and Reanalyses and Its Impact on Moisture Transport, J. Climate, 28, 6682–6706, https://doi.org/10.1175/Jcli-D-14-00719.1, 2015.
Bonner, W. D.: Climatology of the low level jet, Mon. Weather Rev., 96, 833–850, https://doi.org/10.1175/1520-0493(1968)096<0833:cotllj>2.0.co;2, 1968.
Bowman, K. P. and Homeyer, C. R.: GridRad – Three-Dimensional Gridded NEXRAD WSR-88D Radar Data. Research Data Archive at the National Center for Atmospheric Research, Computational and Information Systems Laboratory, https://doi.org/10.5065/D6NK3CR7, 2017.
Brody, S. D., Sebastian, A., Blessing, R., and Bedient, P. B.: Residential location impact on flood risk and loss, J. Flood Risk Manag., 11, S110-S120, https://doi.org/10.1111/jfr3.12184, 2018.
Burian, S. J. and Shepherd, J. M.: Effect of urbanization on the diurnal rainfall pattern in Houston, Hydrol. Process., 19, 1089–1103, https://doi.org/10.1002/hyp.5647, 2005.
Caicedo, V., Rappenglueck, B., Cuchiara, G., Flynn, J., Ferrare, R., Scarino, A., Berkoff, T., Senff, C., Langford, A., and Lefer, B.: Bay breeze and sea breeze circulation impacts on the planetary boundary layer and air quality from an observed and modeled DISCOVER-AQ Texas case study, J. Geophys. Res.-Atmos., 124, 7359–7378, 2019.
Chang, S. E., McDaniels, T. L., Mikawoz, J., and Peterson, K.: Infrastructure failure interdependencies in extreme events: power outage consequences in the 1998 Ice Storm, Nat. Hazards, 41, 337–358, 2007.
Collins, T. W., Grineski, S. E., and Chakraborty, J.: Environmental injustice and flood risk: a conceptual model and case comparison of metropolitan Miami and Houston, USA, Reg. Environ. Change, 18, 311–323, https://doi.org/10.1007/s10113-017-1121-9, 2018.
Darby, L. S.: Cluster analysis of surface winds in Houston, Texas, and the impact of wind patterns on ozone, J. Appl. Meteorol. Clim., 44, 1788–1806, 2005.
Day, B. M., Rappenglück, B., Clements, C. B., Tucker, S. C., and Brewer, W. A.: Nocturnal boundary layer characteristics and land breeze development in Houston, Texas during TexAQS II, Atmos. Environ., 44, 4014–4023, 2010.
Du, J.: NCEP/EMC 4KM Gridded Data (GRIB) Stage IV Data, Version 1.0. UCAR/NCAR – Earth Observing Laboratory, https://doi.org/10.5065/D6PG1QDD, 2011.
Feng, Z., Leung, L. R., Hagos, S., Houze, R. A., Burleyson, C. D., and Balaguru, K.: More frequent intense and long-lived storms dominate the springtime trend in central US rainfall, Nat. Commun., 7, 13429, https://doi.org/10.1038/ncomms13429, 2016.
Feng, Z., Houze, R. A., Leung, L. R., Song, F. F., Hardin, J. C., Wang, J. Y., Gustafson, W. I., and Homeyer, C. R.: Spatiotemporal Characteristics and Large-Scale Environments of Mesoscale Convective Systems East of the Rocky Mountains, J. Climate, 32, 7303–7328, https://doi.org/10.1175/Jcli-D-19-0137.1, 2019.
Feng, Z., Leung, L. R., Liu, N., Wang, J., Houze, R. A., Li, J., Hardin, J. C., Chen, D., and Guo, J.: A Global High-Resolution Mesoscale Convective System Database Using Satellite-Derived Cloud Tops, Surface Precipitation, and Tracking, J. Geophys. Res.-Atmos., 126, e2020JD034202, https://doi.org/10.1029/2020jd034202, 2021.
Feng, Z., Varble, A., Hardin, J., Marquis, J., Hunzinger, A., Zhang, Z., and Thieman, M.: Deep Convection Initiation, Growth, and Environments in the Complex Terrain of Central Argentina during CACTI, Mon. Weather Rev., 150, 1135–1155, https://doi.org/10.1175/mwr-d-21-0237.1, 2022.
Feng, Z., Hardin, J., Barnes, H. C., Li, J., Leung, L. R., Varble, A., and Zhang, Z.: PyFLEXTRKR: a flexible feature tracking Python software for convective cloud analysis, Geosci. Model Dev., 16, 2753–2776, https://doi.org/10.5194/gmd-16-2753-2023, 2023.
Geerts, B., Parsons, D., Ziegler, C. L., Weckwerth, T. M., Biggerstaff, M. I., Clark, R. D., Coniglio, M. C., Demoz, B. B., Ferrare, R. A., Gallus, W. A., Haghi, K., Hanesiak, J. M., Klein, P. M., Knupp, K. R., Kosiba, K., McFarquhar, G. M., Moore, J. A., Nehrir, A. R., Parker, M. D., Pinto, J. O., Rauber, R. M., Schumacher, R. S., Turner, D. D., Wang, Q., Wang, X., Wang, Z., and Wurman, J.: The 2015 Plains Elevated Convection At Night (PECAN) field project, B. Am. Meteorol. Soc., 98, 767–786, https://doi.org/10.1175/bams-d-15-00257.1, 2016.
Haberlie, A. M. and Ashley, W. S.: A Radar-based Climatology of Mesoscale Convective Systems in the United States A Radar-based Climatology of Mesoscale Convective Systems in the United States, J. Climate, 32, 1591–1606, https://doi.org/10.1175/jcli-d-18-0559.1, 2018.
Hersbach, H., Bell, B., Berrisford, P., Hirahara, S., Horányi, A., Muñoz-Sabater, J., Nicolas, J., Peubey, C., Radu, R., Schepers, D., Simmons, A., Soci, C., Abdalla, S., Abellan, X., Balsamo, G., Bechtold, P., Biavati, G., Bidlot, J., Bonavita, M., Chiara, G., Dahlgren, P., Dee, D., Diamantakis, M., Dragani, R., Flemming, J., Forbes, R., Fuentes, M., Geer, A., Haimberger, L., Healy, S., Hogan, R. J., Hólm, E., Janisková, M., Keeley, S., Laloyaux, P., Lopez, P., Lupu, C., Radnoti, G., Rosnay, P., Rozum, I., Vamborg, F., Villaume, S., and Thépaut, J. N.: The ERA5 global reanalysis, Q. J. Roy. Meteor. Soc., 146, 1999–2049, https://doi.org/10.1002/qj.3803, 2020.
Hersbach, H., Bell, B., Berrisford, P., Biavati, G., Horányi, A., Muñoz Sabater, J., Nicolas, J., Peubey, C., Radu, R., Rozum, I., Schepers, D., Simmons, A., Soci, C., Dee, D., and Thépaut, J.-N.: ERA5 hourly data on single levels from 1940 to present, Copernicus Climate Change Service (C3S) Climate Data Store (CDS) [data set], https://doi.org/10.24381/cds.adbb2d47, 2023.
Hoch, J. and Markowski, P.: A Climatology of Springtime Dryline Position in the U. S. Great Plains Region, J. Climate, 18, 2132–2137, https://doi.org/10.1175/jcli3392.1, 2005.
Hodges, D. and Pu, Z.: Characteristics and Variations of Low-Level Jets and Environmental Factors Associated with Summer Precipitation Extremes Over the Great Plains Characteristics and Variations of Low-Level Jets and Environmental Factors Associated with Summer Precipitation Extremes Over the Great Plains, J. Climate, 32, 5123–5144, https://doi.org/10.1175/jcli-d-18-0553.1, 2019.
Houze, R. A.: Mesoscale convective systems, Rev. Geophys., 42, RG4003, https://doi.org/10.1029/2004rg000150, 2004.
Hu, H., Feng, Z., and Leung, L.-Y. R.: Linking flood frequency with mesoscale convective systems in the US, Geophys. Res. Lett., 48, e2021GL092546, https://doi.org/10.1029/2021GL092546, 2021.
Huang, H., Qian, Y., Liu, Y., He, C., Zheng, J., Zhang, Z., and Gkikas, A.: Where does the dust deposited over the Sierra Nevada snow come from?, EGUsphere [preprint], https://doi.org/10.5194/egusphere-2022-588, 2022.
Janowiak, J. E., Joyce, B., and Xie, P.: NCEP/CPC L3 Half Hourly 4 km Global (60° S–60° N) Merged IR V1, Edited by Andrey Savtchenko, Greenbelt, MD, Goddard Earth Sciences Data and Information Services Center (GES DISC), https://doi.org/10.5067/P4HZB9N27EKU, 2017.
Knapp, K. R., Kruk, M. C., Levinson, D. H., Diamond, H. J., and Neumann, C. J.: The International Best Track Archive for Climate Stewardship (IBTrACS), B. Am. Meteorol. Soc., 91, 363–376, https://doi.org/10.1175/2009bams2755.1, 2010.
Li, J., Feng, Z., Qian, Y., and Leung, L. R.: A high-resolution unified observational data product of mesoscale convective systems and isolated deep convection in the United States for 2004–2017, Earth Syst. Sci. Data, 13, 827–856, https://doi.org/10.5194/essd-13-827-2021, 2021a.
Li, J., Qian, Y., Leung, L. R., and Feng, Z.: Summer Mean and Extreme Precipitation Over the Mid-Atlantic Region: Climatological Characteristics and Contributions From Different Precipitation Types, J. Geophys. Res.-Atmos., 126, e2021JD035045, https://doi.org/10.1029/2021jd035045, 2021b.
Li, J., Feng, Z., Qian, Y., and Leung, L. R.: MCSs and IDC in the US for 2004–2017, DataHub [data set], https://doi.org/10.25584/1632005, 2024.
Liu, Y: Scripts supporting “Tracking precipitation features and associated large-scale environments over southeastern Texas”, Github [code], https://github.com/liuye923/Houston_SOM.git, last access: 17 July 2024.
Liu, Y., Qian, Y., and Berg, L. K.: Local-thermal-gradient and large-scale-circulation impacts on turbine-height wind speed forecasting over the Columbia River Basin, Wind Energ. Sci., 7, 37–51, https://doi.org/10.5194/wes-7-37-2022, 2022.
Liu, Y., Feng, S., Qian, Y., Huang, H., and Berg, L. K.: How do North American weather regimes drive wind energy at the sub-seasonal to seasonal timescales?, npj Climate and Atmospheric Science, 6, 100, https://doi.org/10.1038/s41612-023-00403-5, 2023.
Nielsen, E. R. and Schumacher, R. S.: Dynamical Mechanisms Supporting Extreme Rainfall Accumulations in the Houston “Tax Day” 2016 Flood Dynamical Mechanisms Supporting Extreme Rainfall Accumulations in the Houston “Tax Day” 2016 Flood, Mon. Weather Rev., 148, 83–109, https://doi.org/10.1175/mwr-d-19-0206.1, 2019.
Prat, O. P. and Nelson, B. R.: Characteristics of annual, seasonal, and diurnal precipitation in the Southeastern United States derived from long-term remotely sensed data, Atmos. Res., 144, 4–20, 2014.
Pryor, S. C., Letson, F., Shepherd, T., and Barthelmie, R. J.: Evaluation of WRF Simulation of Deep Convection in the U. S. Southern Great Plains, J. Appl. Meteorol. Clim., 62, 41–62, https://doi.org/10.1175/jamc-d-22-0090.1, 2023.
Rowe, A. K., Rutledge, S. A., and Lang, T. J.: Investigation of Microphysical Processes Occurring in Organized Convection during NAME, Mon. Weather Rev., 140, 2168–2187, https://doi.org/10.1175/mwr-d-11-00124.1, 2012.
Small, R. J. O. and De Szoeke, S. P.: The Central American midsummer drought: Regional aspects and large-scale forcing, J. Climate, 20, 4853–4873, https://doi.org/10.1175/Jcli4261.1, 2007.
Song, F., Feng, Z., Leung, L. R., Jr, R. A. H., Wang, J., Hardin, J., and Homeyer, C. R.: Contrasting spring and summer large-scale environments associated with mesoscale convective systems over the U. S. Great Plains Contrasting spring and summer large-scale environments associated with mesoscale convective systems over the U. S. Great Plains, J. Climate, 32, 6749–6767, https://doi.org/10.1175/jcli-d-18-0839.1, 2019.
Starzec, M., Homeyer, C. R., and Mullendore, G. L.: Storm Labeling in Three Dimensions (SL3D): A Volumetric Radar Echo and Dual-Polarization Updraft Classification Algorithm, Mon. Weather Rev., 145, 1127–1145, https://doi.org/10.1175/mwr-d-16-0089.1, 2017.
Statkewicz, M. D., Talbot, R., and Rappenglueck, B.: Changes in precipitation patterns in Houston, Texas, Environmental Advances, 5, 100073, https://doi.org/10.1016/j.envadv.2021.100073, 2021.
Steiner, M., Houze, R. A., and Yuter, S. E.: Climatological Characterization of Three-Dimensional Storm Structure from Operational Radar and Rain Gauge Data, J. Appl. Meteor. Climatol., 34, 1978–2007, https://doi.org/10.1175/1520-0450(1995)034<1978:CCOTDS>2.0.CO;2, 1995.
Valle-Levinson, A., Olabarrieta, M., and Heilman, L.: Compound flooding in Houston–Galveston Bay during Hurricane Harvey, Sci. Total Environ., 747, 141272, https://doi.org/10.1016/j.scitotenv.2020.141272, 2020.
Varble, A. C., Nesbitt, S. W., Salio, P., et al.: Utilizing a Storm-Generating Hotspot to Study Convective Cloud Transitions: The CACTI Experiment, Bull. Am. Meteor. Soc., 102, E1597–E1620, https://doi.org/10.1175/BAMS-D-20-0030.1, 2021.
Van Oldenborgh, G. J., Van Der Wiel, K., Sebastian, A., Singh, R., Arrighi, J., Otto, F., Haustein, K., Li, S., Vecchi, G., and Cullen, H.: Attribution of extreme rainfall from Hurricane Harvey, August 2017, Environ. Res. Lett., 12, 124009, https://doi.org/10.1088/1748-9326/aa9ef2, 2017.
Vesanto, J. and Alhoniemi, E.: Clustering of the self-organizing map, IEEE T. Neural Networ., 11, 586–600, https://doi.org/10.1109/72.846731, 2000.
Wang, D., Jensen, M. P., Taylor, D., Kowalski, G., Hogan, M., Wittemann, B. M., Rakotoarivony, A., Giangrande, S. E., and Park, J. M.: Linking Synoptic Patterns to Cloud Properties and Local Circulations Over Southeastern Texas, J. Geophys. Res.-Atmos., 127, e2021JD035920, https://doi.org/10.1029/2021jd035920, 2022.
Wang, Y., Jia, B., Wang, S.-C., Estes, M., Shen, L., and Xie, Y.: Influence of the Bermuda High on interannual variability of summertime ozone in the Houston–Galveston–Brazoria region, Atmos. Chem. Phys., 16, 15265–15276, https://doi.org/10.5194/acp-16-15265-2016, 2016.
Weaver, S. J. and Nigam, S.: Variability of the Great Plains Low-Level Jet: Large-Scale Circulation Context and Hydroclimate Impacts, J. Climate, 21, 1532–1551, https://doi.org/10.1175/2007jcli1586.1, 2008.
Whiteman, C. D., Bian, X. D., and Zhong, S. Y.: Low-level jet climatology from enhanced rawinsonde observations at a site in the southern Great Plains, J. Appl. Meteorol., 36, 1363–1376, https://doi.org/10.1175/1520-0450(1997)036<1363:Lljcfe>2.0.Co;2, 1997.
Wimhurst, J. J. and Greene, J. S.: Oklahoma's future wind energy resources and their relationship with the Central Plains low-level jet, Renew. Sust. Energ. Rev., 115, 109374, https://doi.org/10.1016/j.rser.2019.109374, 2019.
Yang, Z., Qian, Y., Liu, Y., Berg, L. K., Gustafson, W. I., Feng, Z., Sakaguchi, K., Fast, J. D., Tai, S. L., Yang, B., Huang, M., and Xiao, H.: Understanding irrigation impacts on low-level jets over the Great Plains, Clim. Dynam., 55, 925–943, https://doi.org/10.1007/s00382-020-05301-7, 2020.
Zhu, J. and Liang, X.-Z.: Impacts of the Bermuda High on Regional Climate and Ozone over the United States, J. Climate, 26, 1018–1032, https://doi.org/10.1175/jcli-d-12-00168.1, 2013.