the Creative Commons Attribution 4.0 License.
the Creative Commons Attribution 4.0 License.
 | 19 Jul 2024
Ammonia in the upper troposphere–lower stratosphere (UTLS): GLORIA airborne measurements for CAMS model evaluation in the Asian monsoon and in biomass burning plumes above the South Atlantic
Michael Höpfner
Felix Friedl-Vallon
Norbert Glatthor
Thomas Gulde
Vincent Huijnen
Anne Kleinert
Erik Kretschmer
Guido Maucher
Tom Neubert
Hans Nordmeyer
Christof Piesch
Peter Preusse
Martin Riese
Björn-Martin Sinnhuber
Jörn Ungermann
Gerald Wetzel
Wolfgang Woiwode
Ammonia (NH3) is the major alkaline species in the atmosphere and plays an important role in aerosol formation, which affects local air quality and the radiation budget. NH3 in the upper troposphere and lower stratosphere (UTLS) is difficult to detect, and only limited observations are available. We present two-dimensional trace gas measurements of NH3 obtained by the airborne infrared imaging limb sounder GLORIA (Gimballed Limb Observer for Radiance Imaging of the Atmosphere) that was operated on board the research aircraft Geophysica within the Asian monsoon anticyclone during the StratoClim campaign (July 2017) and on board HALO (the High Altitude and LOng Range research aircraft) above the South Atlantic during the SouthTRAC campaign (September–November 2019). We compare these GLORIA measurements in the UTLS with results of the CAMS (Copernicus Atmosphere Monitoring Service) reanalysis and forecast model to evaluate its performance. The GLORIA observations reveal large enhancements of NH3 of more than 1 ppbv in the Asian monsoon upper troposphere but no clear indication of NH3 in biomass burning plumes in the upper troposphere above the South Atlantic above the instrument's detection limit of around 20 pptv. In contrast, CAMS reanalysis and forecast simulation results indicate strong enhancements of NH3 in both measured scenarios. Comparisons of other retrieved pollution gases, such as peroxyacetyl nitrate (PAN), show the ability of CAMS models to generally reproduce the biomass burning plumes above the South Atlantic. However, NH3 concentrations are largely overestimated by the CAMS models within these plumes. We suggest that emission strengths used by CAMS models are of lower accuracy for biomass burning in comparison to agricultural sources in the Asian monsoon. Further, we suggest that loss processes of NH3 during transport to the upper troposphere may be underestimated for the biomass burning cases above the South Atlantic. Since NH3 is strongly undersampled, in particular at higher altitudes, we hope for regular vertically resolved measurements of NH3 from the proposed CAIRT (Changing-Atmosphere Infra-Red Tomography Explorer) mission to strengthen our understanding of this important trace gas in the atmosphere.
- Article
(5448 KB) - Full-text XML
-
Supplement
(4797 KB) - BibTeX
- EndNote


Ammonia (NH3) is the major alkaline trace gas of the atmosphere and part of total reactive nitrogen. Sources of atmospheric NH3 are not only livestock and fertilizer in agriculture, but also industry and combustion processes (e.g., Bouwman et al., 1997). Further, NH3 has been measured in biomass burning plumes in the vicinity of fires (e.g., Hegg et al., 1988; Coheur et al., 2007; Tomsche et al., 2023). It is expected that total emissions of NH3 will rise strongly, due to increased livestock, usage of fertilizers, and combustion (Szopa et al., 2021, and references therein). Atmospheric sinks of NH3 are washout due to the high water solubility of NH3 and formation of aerosols, like ammonium sulfate (in presence of sulfuric acid) or ammonium nitrate (in the presence of nitric acid). The importance of NH3 in the atmosphere for the initial formation of new particles has been corroborated by various studies (e.g., Kirkby et al., 2023, and references therein). As aerosols are of importance for local air quality and for climate through their direct and indirect radiative impact (e.g., Szopa et al., 2021), it is necessary to observe and understand the distribution of NH3 in the atmosphere from the boundary layer up to the lower stratosphere.
In situ measurements of NH3 are, however, challenging due to the wide range of ambient levels (5 pptv to 500 ppbv) and the interaction of NH3 with surfaces of the instrument (“sticky”; e.g., von Bobrutzki et al., 2010). Still, there are various in situ measurements at boundary layer altitudes but only very few in the free troposphere and very sparse measurements with high uncertainties in the upper troposphere (e.g., Ziereis and Arnold, 1986; Nowak et al., 2010; Tomsche et al., 2023).
Due to its specific spectral lines in the thermal infrared region, remote sounding spectrometers are suited to quantifying NH3 in a “contact-free” manner. In that way, NH3 has been observed by infrared sounders from satellite and aircraft in nadir and limb geometry. From satellite instruments measuring in nadir, such as TES (Tropospheric Emission Spectrometer), IASI (Infrared Atmospheric Sounding Interferometer), CrIS (Cross-track Infrared Sounder), or AIRS (Atmospheric Infrared Sounder), global observations of NH3 in the lower troposphere are available (e.g., Beer et al., 2008; Clarisse et al., 2010; van Damme et al., 2015; Shephard and Cady-Pereira, 2015; Warner et al., 2016). The first observations of NH3 in the upper troposphere (in particular of the Asian summer monsoon) have been achieved by the MIPAS (Michelson Interferometer for Passive Atmospheric Sounding) instrument from Envisat (Environmental Satellite; Höpfner et al., 2016) and by the GLORIA (Gimballed Limb Observer for Radiance Imaging of the Atmosphere) instrument on board the Geophysica research aircraft (Höpfner et al., 2019). The connection of large amounts of NH3 reaching the upper troposphere through convection with the formation of solid ammonium nitrate (AN) particles as secondary aerosols was also shown during these flights (Höpfner et al., 2019; Wagner et al., 2020; Appel et al., 2022).
In the present work, we utilize observations of mid- to upper-tropospheric NH3 obtained within two aircraft campaigns of the GLORIA instrument to evaluate the ability of the Copernicus Atmosphere Monitoring Service (CAMS) atmospheric model to describe the distribution of NH3 under two different scenarios: within the Asian summer monsoon and within biomass burning plumes. Besides the direct comparison of NH3, we further use peroxyacetyl nitrate (PAN) as a long-lived (τ≈3 months) pollution tracer, which has been shown to be useful for identifying biomass burning plumes in GLORIA and CAMS data (e.g., Johansson et al., 2022).
2.1 GLORIA measurements
The GLORIA instrument has been deployed on various airborne campaigns with the M55 Geophysica and the HALO (High Altitude and LOng Range) research aircraft. In this study, GLORIA measurements from the M55 Geophysica StratoClim campaign (July/August 2017, base in Kathmandu, Nepal) and from the HALO SouthTRAC campaign (September–November 2019 with bases in Oberpfaffenhofen, Germany, and Rio Grande, Argentina) are discussed. Flight paths and the location of GLORIA tangent points are summarized in Fig. 1. For this study, StratoClim flights on 29 and 31 July 2017 have been selected because of high measured NH3 (Höpfner et al., 2019), while SouthTRAC flights on 8 September, 7 October, and 4 November 2019 have been chosen because of large measured pollution plumes above the South Atlantic (Johansson et al., 2022). Both StratoClim flights were conducted from and to Kathmandu, Nepal, and the three selected SouthTRAC flights were directed from Sal, Cabo Verde, to Buenos Aires, Argentina, and vice versa, as part of the transfer flights between Germany and Argentina.
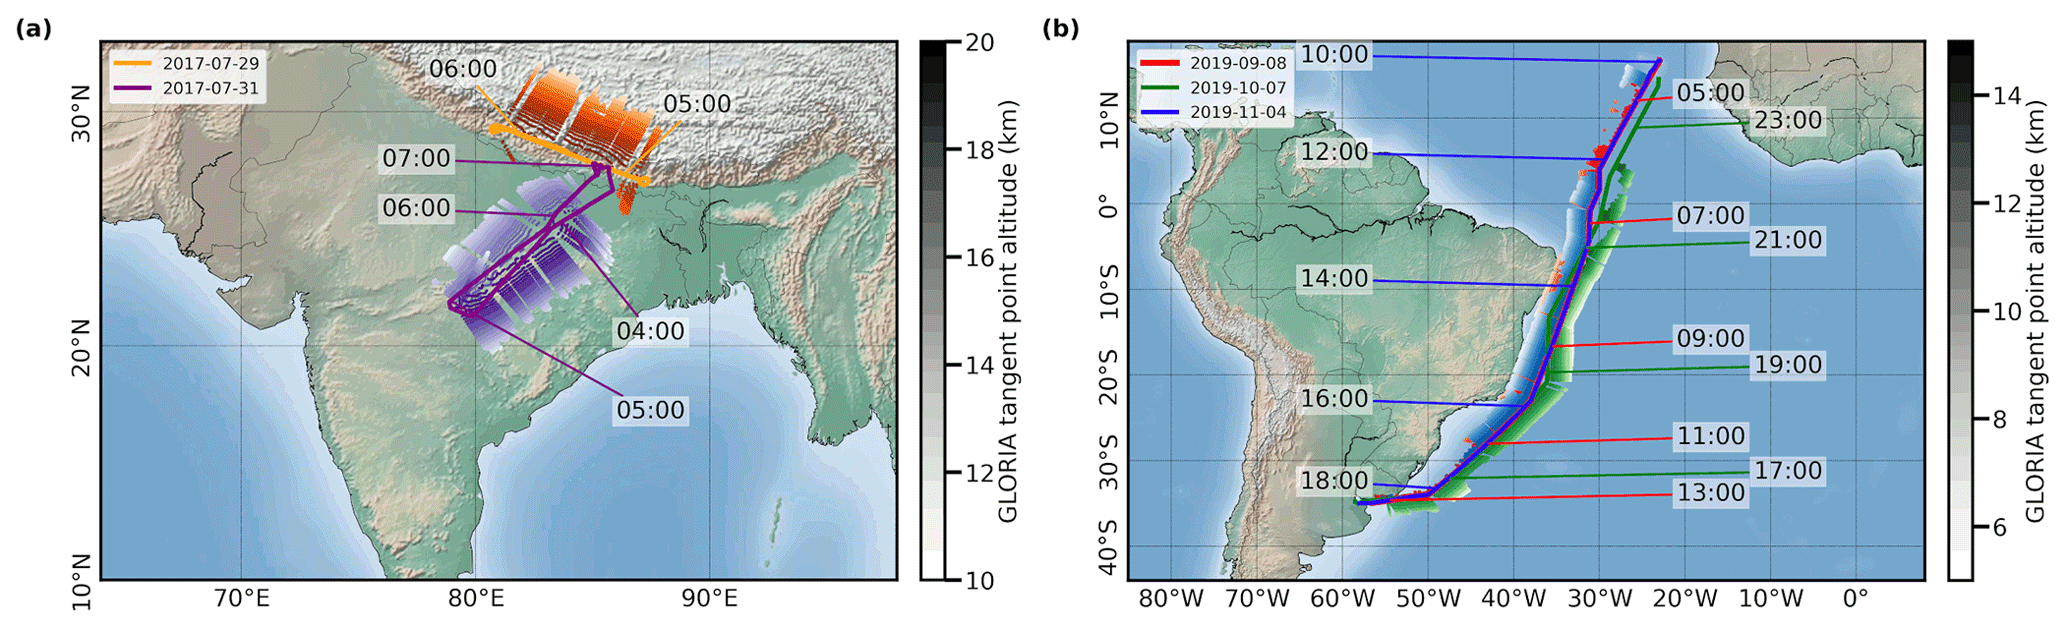
Figure 1Flight paths and locations of GLORIA tangent points for the discussed flights of (a) the StratoClim campaign and (b) the SouthTRAC campaign. Tangent points affected by clouds are not used in the retrieval process and result in gaps in the plotted geolocations. Note the different color bar ranges and map scales for each panel. The flight path of the flight on 8 September 2019 is identical to the flight path of the flight on 4 November 2019, which hides large parts of the earlier flight. Times are given in UTC (coordinated universal time).
The GLORIA instrument (Friedl-Vallon et al., 2014; Riese et al., 2014) combines an imaging detector working in the thermal infrared with a Fourier-transform spectrometer in an actively controlled gimbal frame. This combination allows for simultaneous observations of 128×48 (vertical × horizontal) atmospheric spectra, high spectral sampling up to 0.0625 cm−1, and compensation of aircraft movements and active targeted line-of-sight control. Further, two external blackbodies are used for in-flight radiometric calibration measurements, together with upward-looking atmospheric “deep-space” observations. For the measurements discussed in this work, interferograms, which were obtained with a maximum optical path difference (MOPD) of 8.0 cm (spectral sampling of 0.0625 cm−1), are used. Only during the StratoClim flight on 29 July 2017, due to operational restrictions, were interferograms with 2.5 cm MOPD recorded, resulting in a spectral sampling of 0.2 cm−1. Within GLORIA level 1 processing, the interferograms are Fourier-transformed and radiometrically and spectrally calibrated. The resulting calibrated spectra at each detector pixel are screened, filtered, and finally horizontally binned into 127 spectra per recorded measurement sampled in the vertical direction (with one horizontal line of spectra being disregarded completely due to detector artifacts; Kleinert et al., 2014; Ungermann et al., 2022). All GLORIA retrievals in this study are based on version v03.02 of GLORIA level 1 data (calibrated spectral radiances).
Based on these binned calibrated spectra, profiles of atmospheric temperature and trace gases are retrieved perpendicularly to the flight track (Johansson et al., 2018). The retrieval uses a nonlinear least-squares fit with Tikhonov regularization of the retrieval software KOPRAFIT together with the radiative transfer model KOPRA (Stiller, 2000). For NH3, the overall retrieval strategy from Höpfner et al. (2019) is applied; for PAN, retrievals as described by Johansson et al. (2020, 2022) are utilized; and for AN, retrievals as described by Höpfner et al. (2019) are utilized. Due to the reduced spectral sampling on the flight of 29 July 2017, spectral windows and regularization have been adjusted slightly (see Table S1 in the Supplement). For NH3 retrievals of StratoClim flights, vertical resolutions between 0.8 and 1.3 km and estimated errors between 10 and 50 pptv have been achieved, and for the SouthTRAC flights discussed in this work, vertical resolutions between 0.5 and 0.7 km and estimated errors between 6 and 12 pptv have been achieved (10th- to 90th-percentile ranges each).
In addition, for cloud information, the so-called cloud index is calculated as a ratio of spectral windows (see Spang et al., 2004). Please note that lower cloud index values mean higher contamination of clouds along the line of sight.
2.2 CAMS global atmospheric composition model configurations
As part of CAMS, two data products are publicly available: first, the ECMWF (European Centre for Medium-Range Weather Forecasts) Atmospheric Composition Reanalysis version 4 (EAC4; Flemming et al., 2015; Inness et al., 2019) and, second, the CAMS global atmospheric composition operational near-real-time forecasts. Both atmospheric model configurations use the ECMWF Integrated Forecasting System (IFS) model and assimilate multiple observations of atmospheric state and composition. In this study, CAMS model output is linearly interpolated in space and time onto GLORIA measurement geolocations to ensure optimal comparisons between observations and model output.
For this work, we compare GLORIA data to both CAMS configurations to achieve two goals: first, we want to compare GLORIA NH3 obtained during two different campaigns 2017 and 2019 with a consistent data set that did not change for the time ranges of both campaigns. For this purpose, the reanalysis configuration is suited best. Second, we want to compare GLORIA NH3 to the most recent CAMS configuration that is publicly available, which is the CAMS forecast configuration, in order to check for improvements for more recent model versions.
2.2.1 CAMS reanalysis
The CAMS reanalysis is currently available between 2003 and 2021, uses 60 vertical levels between 0.1 and 1000 hPa, and has a horizontal resolution of 0.75°×0.75° latitude × longitude. Data are provided every 3 h and include meteorological parameters and concentrations of chemical trace gases, as well as aerosols. They are based on IFS cycle 42r1 and employ data assimilation of trace gases O3, CO, and NO2, along with aerosol optical depth (Inness et al., 2019). Chemistry is handled by a module named IFS(CB05) (Flemming et al., 2015), with its tropospheric chemistry as inherited from the TM5 model (Huijnen et al., 2010), and aerosols are treated as described by Morcrette et al. (2009). Anthropogenic emissions are prescribed from MACCity (MACC/CityZen; Granier et al., 2011), biogenic emissions from MEGAN2.1 (Model of Emissions of Gases and Aerosols from Nature; Guenther et al., 2012), and biomass burning emissions from GFAS v1.2 (Global Fire Assimilation System; Kaiser et al., 2012). CAMS reanalysis has been evaluated by various aircraft measurements: Wang et al. (2020) compared tropospheric trace gas profiles over the Arctic, the North American landmass, and Hawaii to CAMS reanalysis and showed that simulated PAN is in agreement with observations. Further, Johansson et al. (2020, 2022) and Wetzel et al. (2021) compared GLORIA PAN and other pollution trace gases to CAMS reanalysis data in the upper troposphere above the Asian monsoon, the North Atlantic, and the South Atlantic, respectively. They found an overall agreement for the measured plume structures and for biomass burning plumes above the South Atlantic (including SouthTRAC flights that are discussed in this study). In these plumes especially the trace gas PAN was, even in quantitative terms, described well by the model. To our knowledge, there are no studies available evaluating NH3 for CAMS reanalysis. However, since NH3 and PAN can both be emitted from biomass burning events, it is important to know that CAMS is able to reproduce biomass burning PAN plumes.
2.2.2 CAMS forecast
The CAMS global atmospheric composition near-real-time forecast has been operationally available since 2015, and in contrast to the reanalysis, this data product receives a version upgrade approximately once a year. For this reason, the CAMS forecast data for StratoClim measurements in 2017 (cycle 43r1) are different to those for SouthTRAC measurements in 2019 (cycle 46r1). Both forecast model results are based on a newer model version compared to CAMS reanalysis (cycle 42r1). The model utilizes 60 vertical levels for simulations for 2017 and 137 model levels for 2019, and in both cases a horizontal resolution of 0.4°×0.4° latitude × longitude is used. New forecasts are started every day at 00:00 and 12:00 UTC, and output is provided every 3 h for vertically resolved parameters. In this work, model output of the shortest possible lead times of 0, 3, 6, and 9 h is used for interpolation as mentioned above.
Besides changes in resolution, the CAMS forecast for the measurements in 2017 differs compared to CAMS reanalysis in, among other things, the following aspects: additional observational data sets are considered for assimilation (e.g., vertical ozone profiles of the Ozone Mapping and Profiler Suite). Further, a new source scheme for secondary organic aerosols, which is based on scaled CO emissions, is introduced (Eskes et al., 2016). Additionally, CAMS forecasts for the measurements in 2019 differs in, among other things, the following aspects: now, CAMS makes use of CAMS-GLOB-ANT v2.1 anthropogenic and CAMS-GLOB-BIO v1.1 biogenic emissions. Biomass burning plume injection height from GFAS is introduced, along with a diurnal cycle in its emissions. Further, separate ammonium and nitrate aerosol species are introduced and interaction between chemistry and aerosol schemes is established, which implies a change in the modeled NH3 life cycle. Also a selection of chemical reaction rates are updated (Eskes et al., 2017, 2018; Basart et al., 2019).
In order to compare CAMS forecast ammonium aerosol to GLORIA AN, the CAMS ammonium aerosol mass mixing ratio is scaled according to the molar mass ratio of ammonium nitrate to ammonium, and then it is converted to mass density. This approach may overestimate AN if not all of the ammonium aerosol in the model is present in the form of AN.
In this section, GLORIA measurements of NH3 are presented and compared to CAMS reanalysis and forecast simulation results. In addition, as an indicator for the pollution plumes, GLORIA measurements of PAN are shown. First, the two flights from the StratoClim campaign within the Asian monsoon air are presented, followed by three SouthTRAC flights concentrating on biomass burning situations.
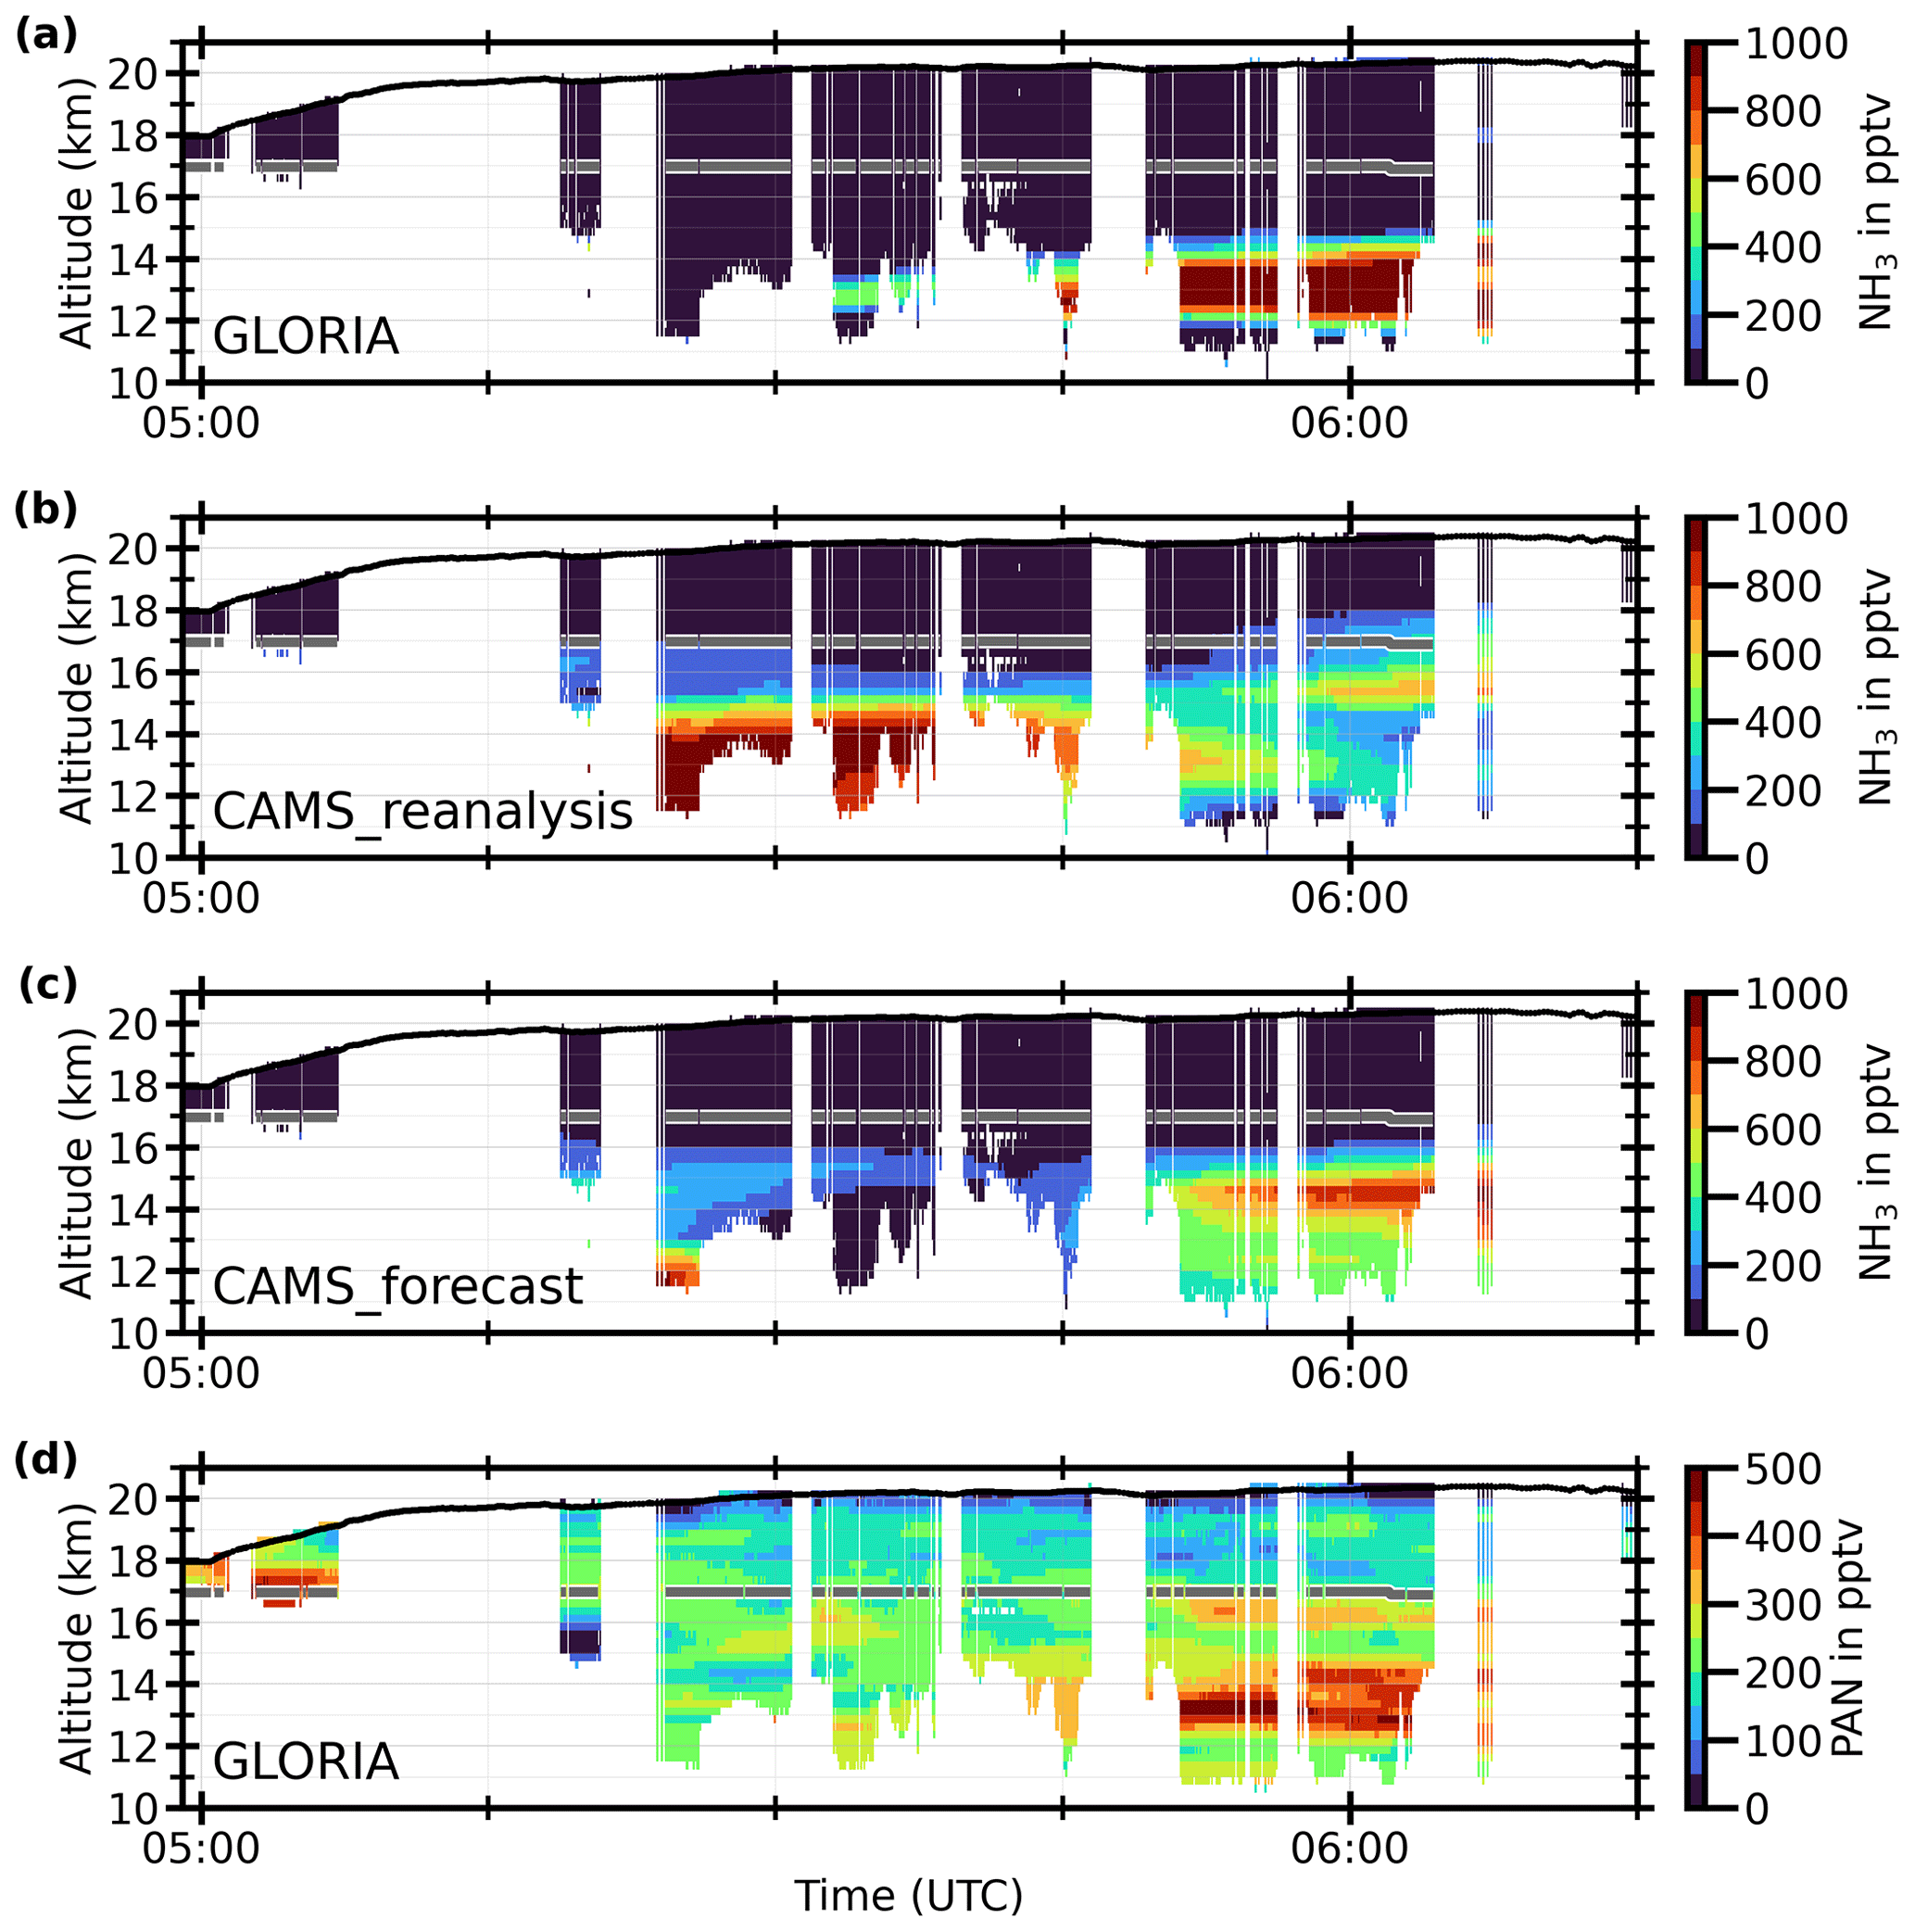
Figure 2The StratoClim flight on 29 July 2017 from and to Kathmandu, Nepal: GLORIA time–altitude cross sections of (a) NH3 and (d) PAN together with CAMS reanalysis (b) and CAMS forecast (c) simulation results, interpolated onto GLORIA geolocations. GLORIA data are horizontally averaged to match lower horizontal resolutions of the CAMS forecast of ≈44 km. The black line indicates flight altitudes, and the gray line shows the ECMWF analysis 380 K potential temperature as an indication of the tropopause location in the Asian monsoon. Blank spaces indicate regions of high cloud tops, calibration measurements, or aircraft movements (like curves). Maximum NH3 VMRs are measured up to 1500 pptv and thus exceed the color bar maximum.
3.1 Asian monsoon
From spaceborne infrared nadir and limb observations it is known that elevated concentrations of NH3 are present in the atmosphere above the Indian subcontinent at lower levels (van Damme et al., 2015) and even in the upper troposphere during the time of the Asian monsoon (Höpfner et al., 2016). For the GLORIA airborne measurements on 31 July 2017, strongly enhanced abundances of NH3 of up to about 1000 pptv were reported (Höpfner et al., 2019). The current analysis of the flight on 29 July 2017 above Nepal shows even higher concentrations of up to 1500 pptv, as presented in Fig. 2a. This maximum is part of a larger horizontal structure between 05:30 and 06:15 UTC and 12 to 14 km altitude. Peak values of NH3 volume mixing ratios (VMRs) coincide with maximum PAN VMRs (Fig. 2d). CAMS reanalysis (Fig. 2b) indicates a similar NH3 enhancement at the same altitude range but shifted to earlier measurement times (eastwards). In addition, a thin maximum of up to 700 pptv NH3 is present at 15 km altitude, which is at a similar location to a second smaller observed PAN maximum (see Fig. 2d) but does not correspond to a measured NH3 maximum. The CAMS forecast also shows two plumes, but these are spatially shifted and of a different intensity. This model indicates a major NH3 maximum around 06:00 UTC peaking at approximately 14 km altitude. Maximum VMRs are up to 900 pptv and thus smaller than observed, which may be caused by NH production that is too fast in the model. Another maximum is forecasted at approximately 05:30 UTC and 12 to 16 km altitude with maximum VMRs of up to 1000 pptv at 12 km altitude.
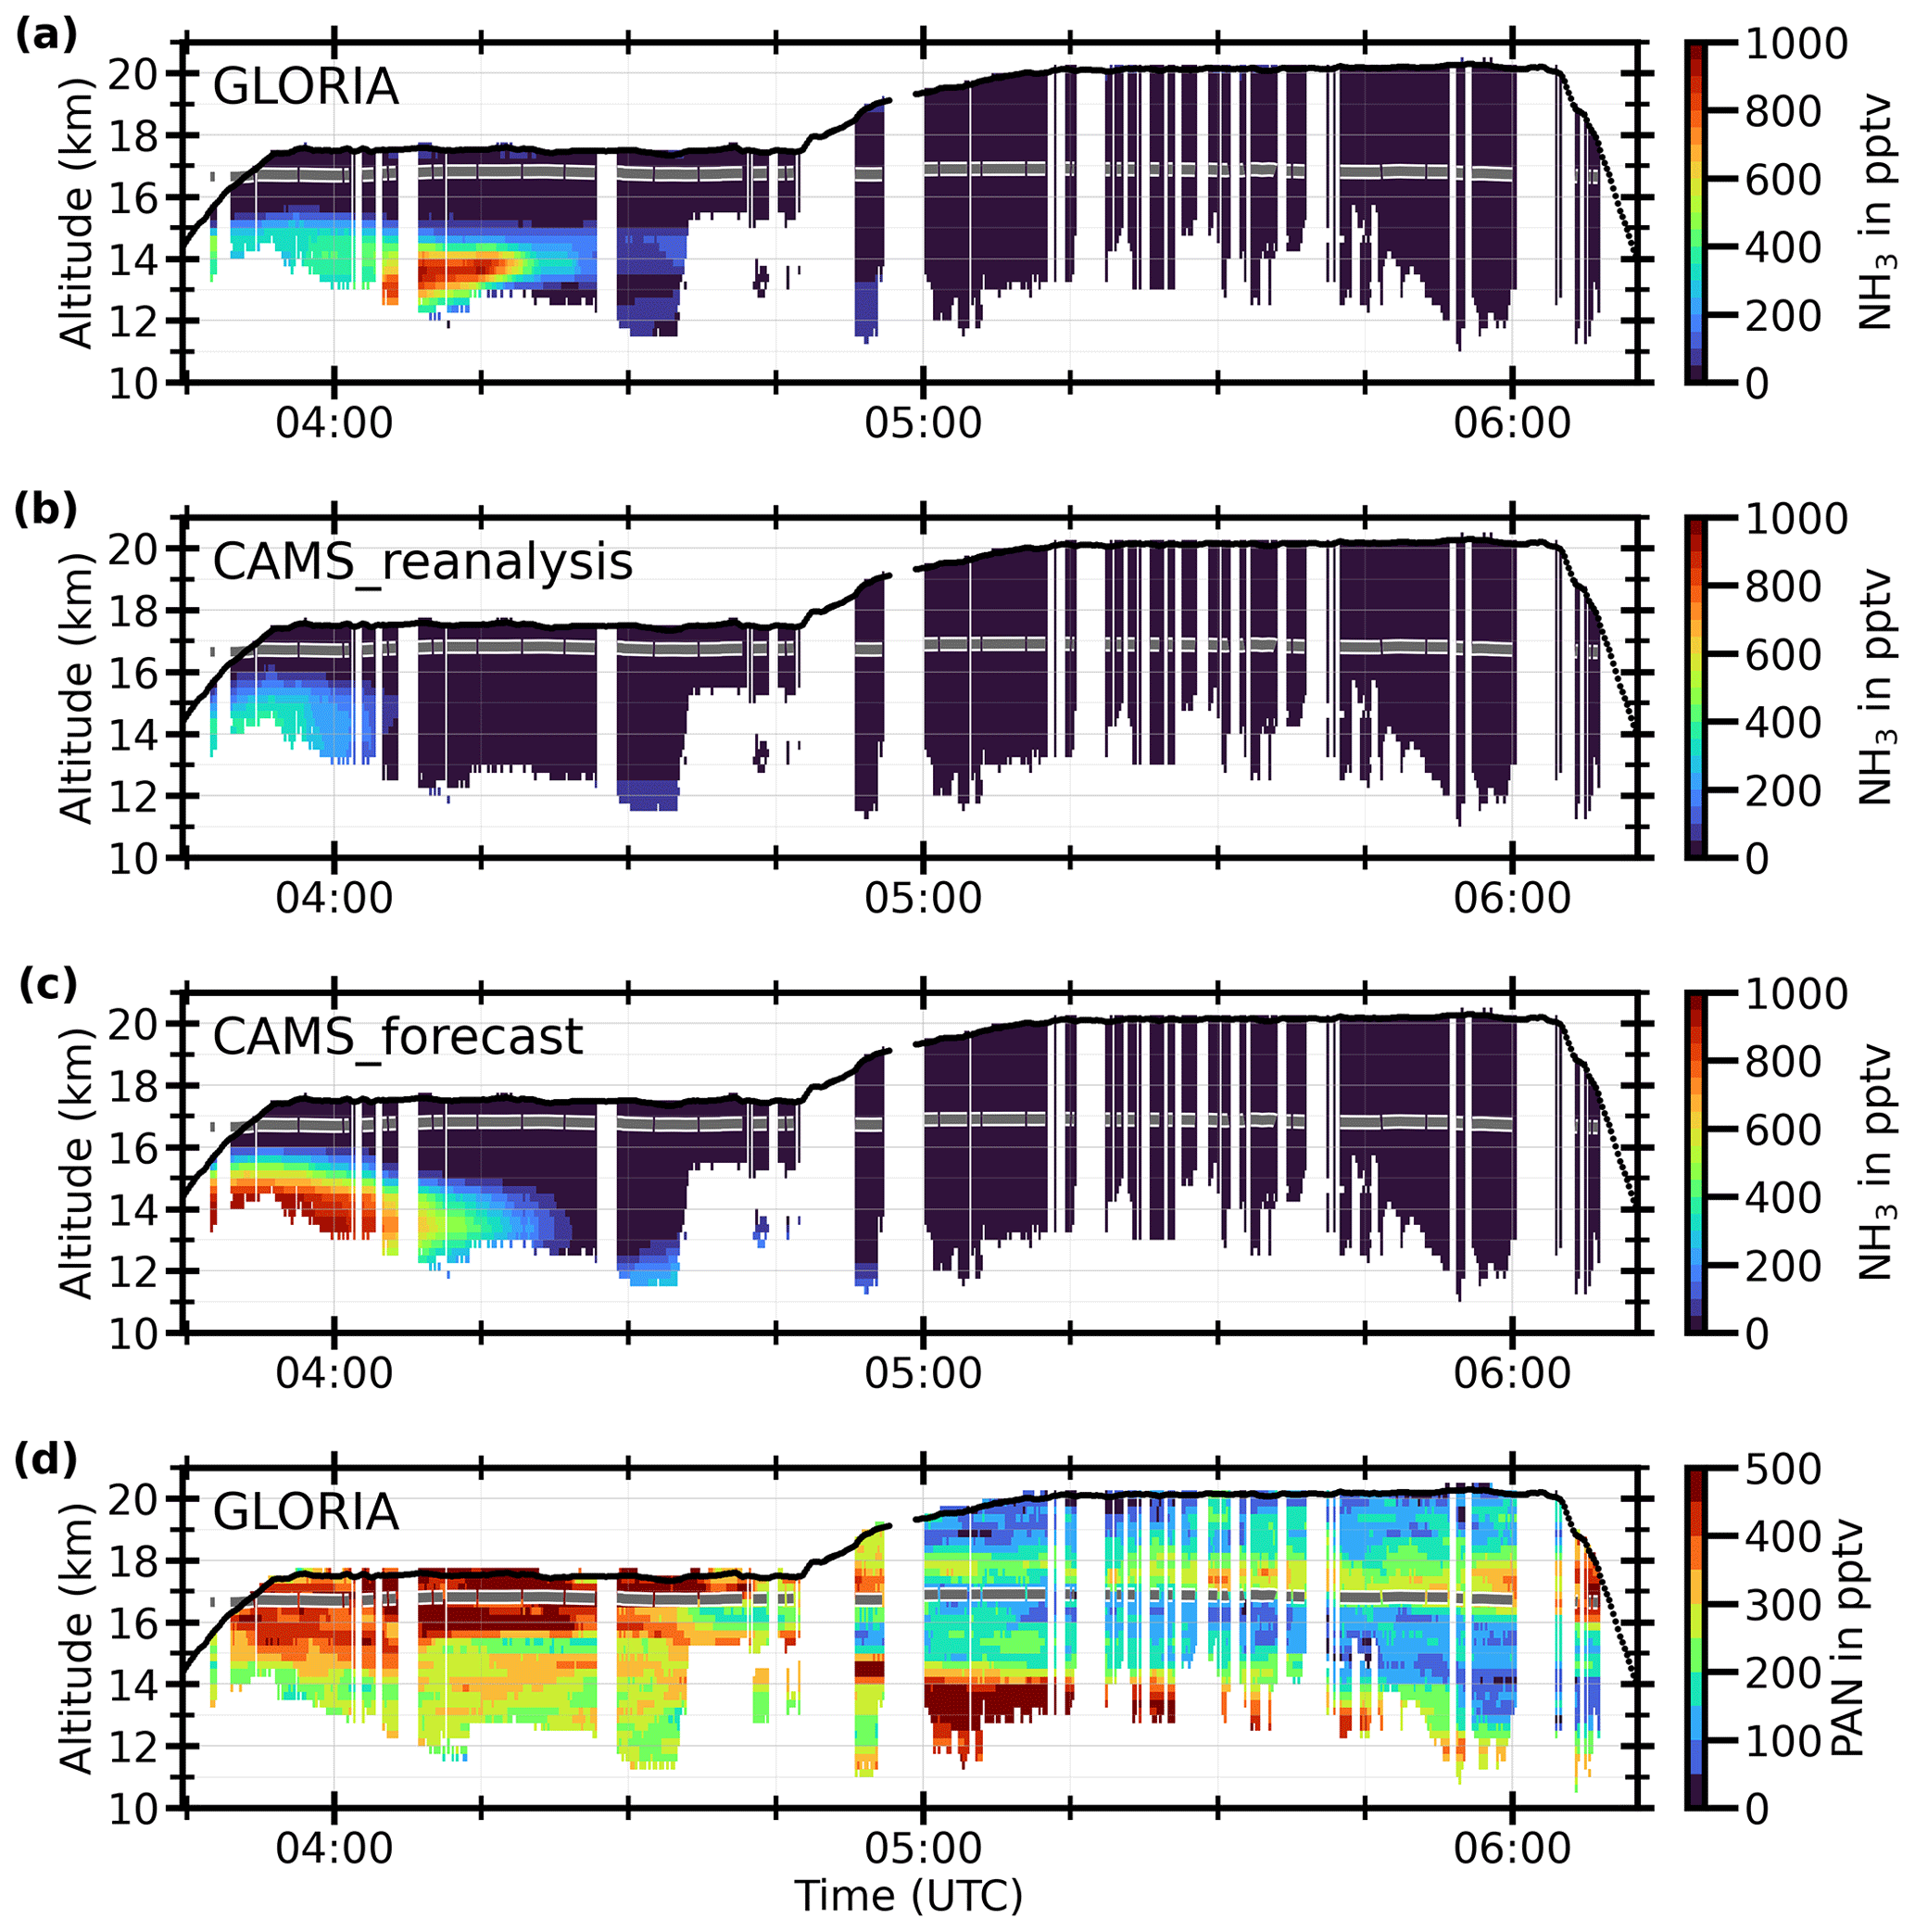
The StratoClim flight on 31 July 2017 reveals one large enhancement of NH3, peaking at 04:15 UTC and 14 km altitude with VMRs of up to 1000 pptv (Fig. 3a). A second faint maximum (04:30–04:50 UTC, 12 km altitude) indicates lower VMRs of up to 100 pptv. For the second part of the flight (later than 05:00 UTC), GLORIA measurements show no enhanced NH3. This contrast in NH3 distributions between both parts of the flight is remarkable, since the flight region of the second part of the flight is relatively close to the flight region of the first part of the flight, and mainly the viewing direction of GLORIA has changed from southeastwards to northwestwards (see Fig. 1a). Hence, our GLORIA measurements indicate strong horizontal variability in NH3 in the Asian monsoon upper troposphere. However, PAN observations also indicate polluted air masses for this second part of the flight. These PAN pollution plumes in the second part of the flight are reproduced by CAMS reanalysis and forecast (see Johansson et al., 2020, and Figs. S1 and S2 in the Supplement). The CAMS reanalysis and forecast successfully reproduce the approximate position of the observed NH3 plumes, as well as the absence of NH3 plumes in the second part of the flight (see Fig. 3b and c). However, CAMS reanalysis does not simulate the major plume later than 04:10 UTC, and maximum VMRs are also simulated below 400 pptv and are thus considerably lower than the measured ones. The CAMS forecast also simulates the largest VMRs of the major plume earlier than measured, but maximum VMRs are comparable to the GLORIA measurements.
3.2 Biomass burning plumes above the South Atlantic
All three of the transfer flights between Sal, Cabo Verde, and Buenos Aires, Argentina, and vice versa, have been influenced by pollution plumes, originating from biomass burning events (Johansson et al., 2022). In the following we will discuss the observations of NH3 by GLORIA within these plumes in comparison to both CAMS reanalysis and forecast model configurations.
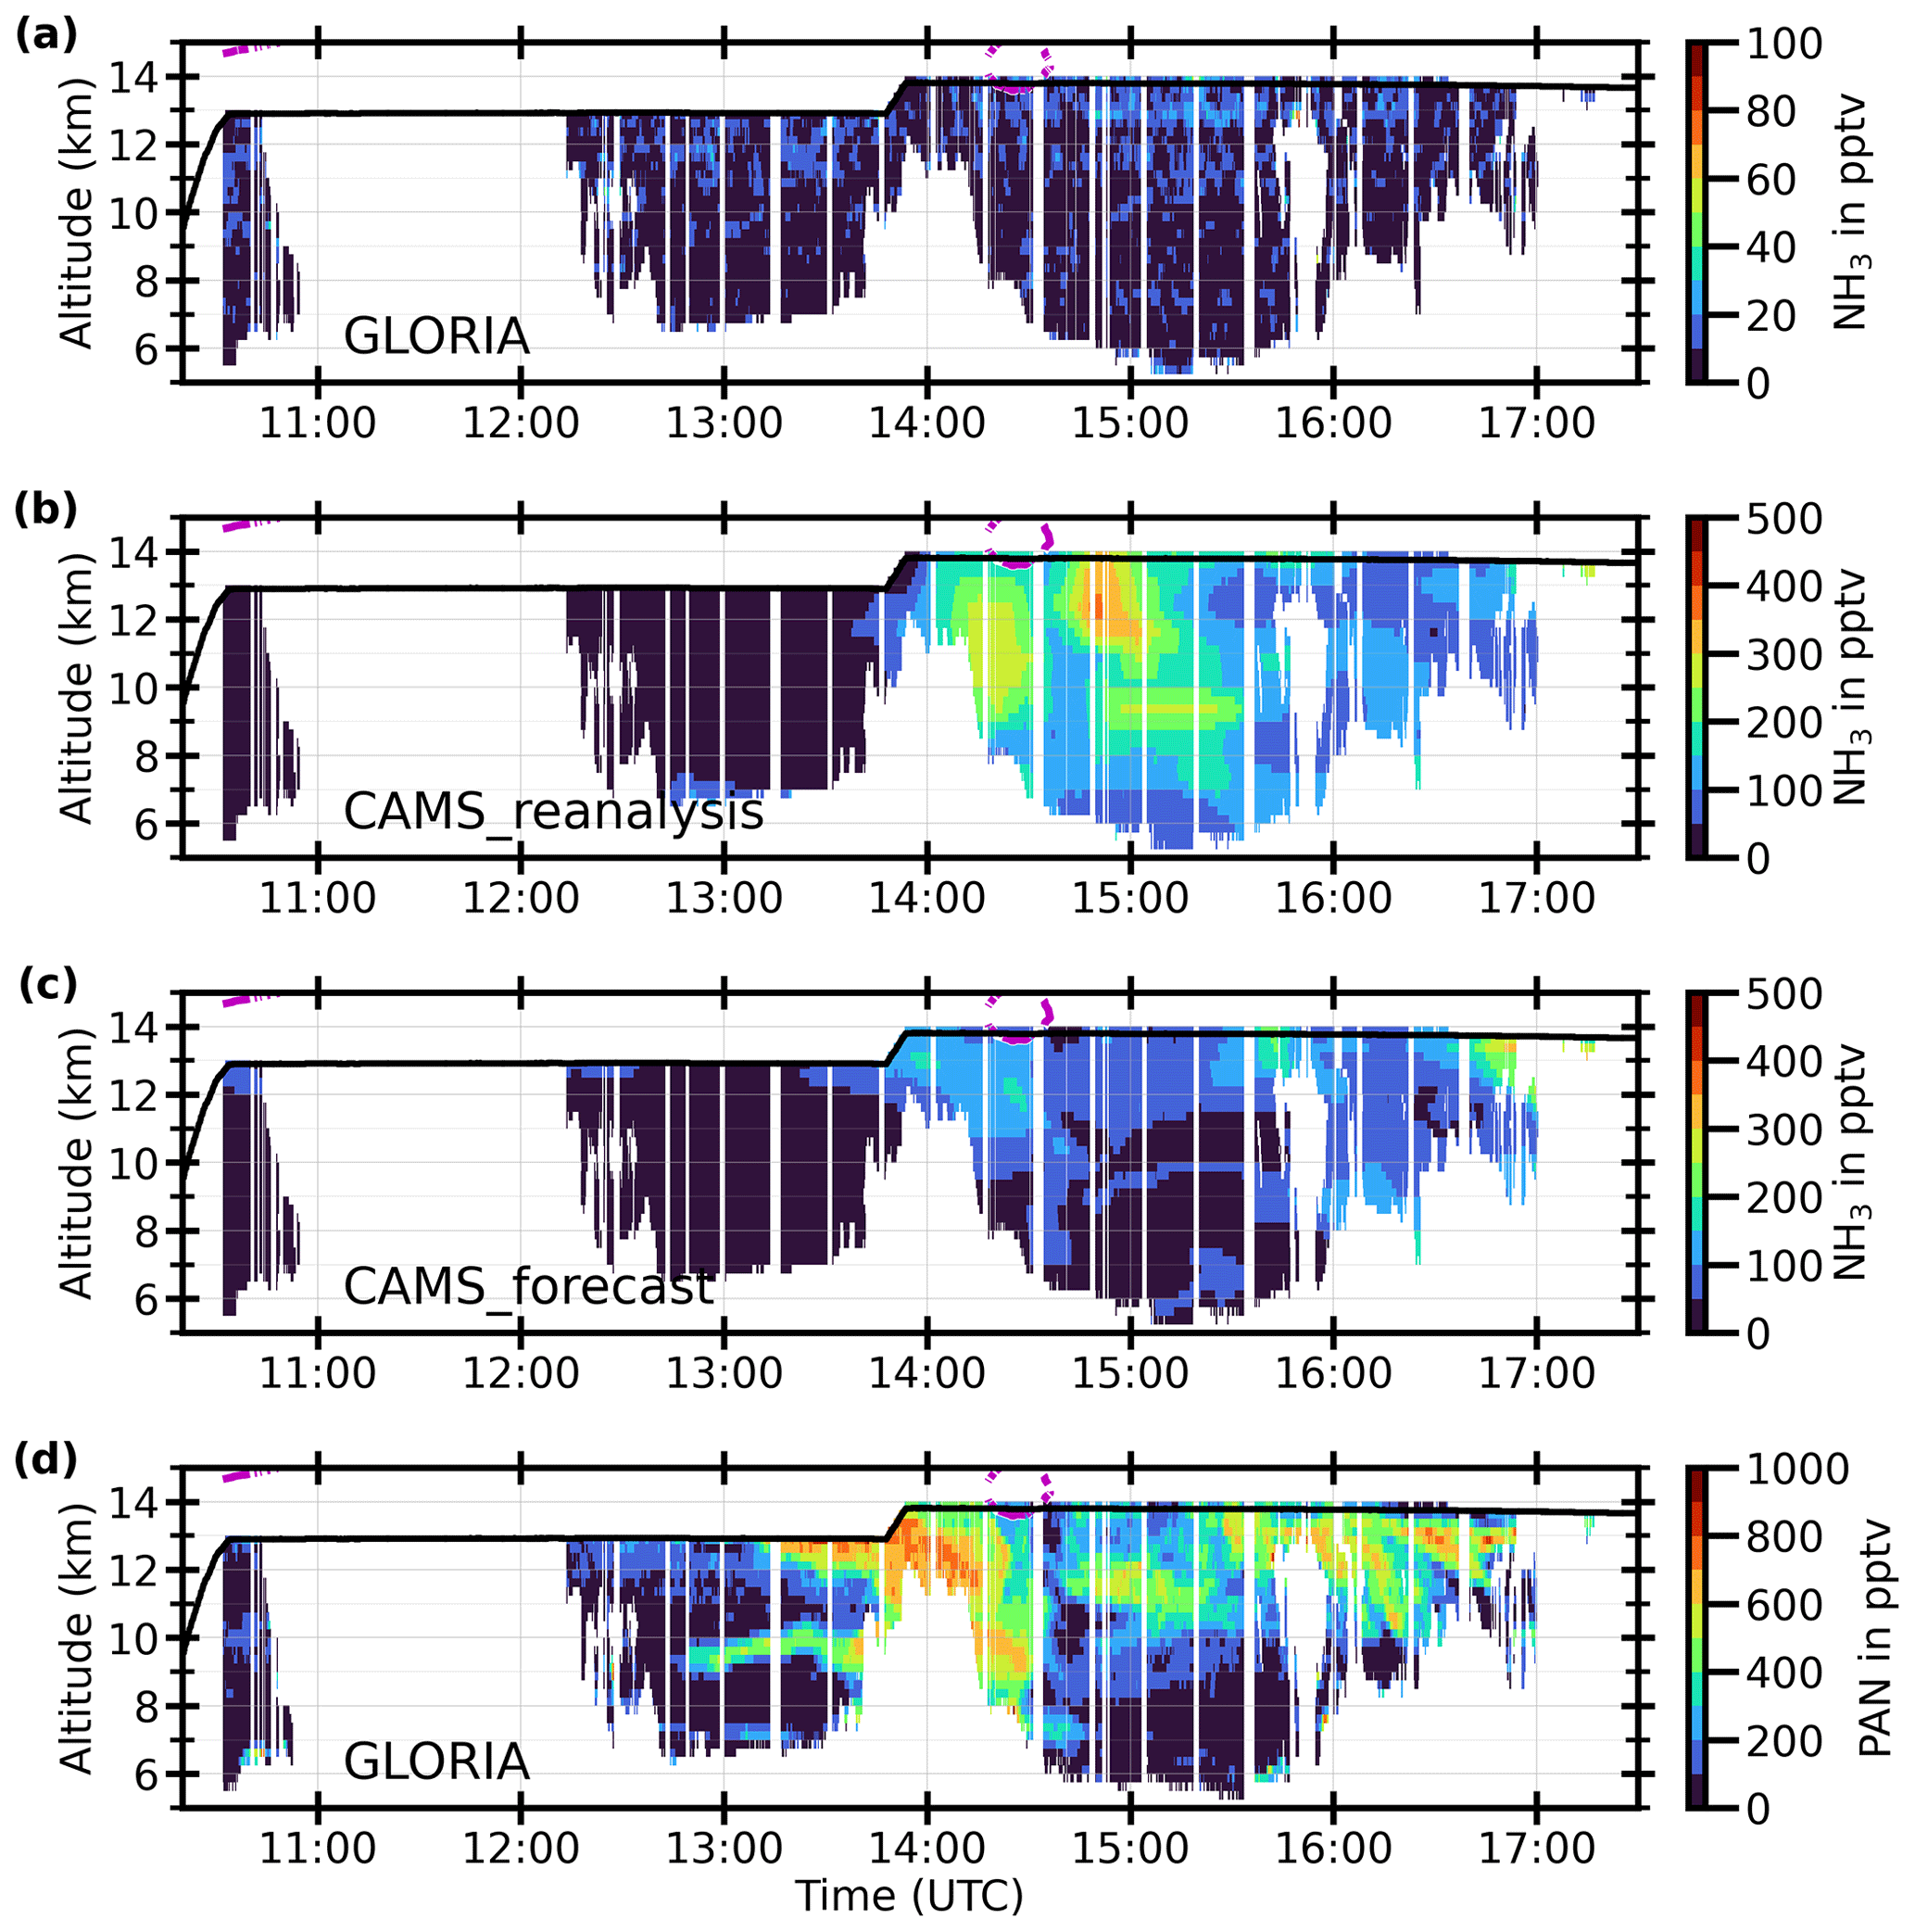
For the SouthTRAC flight on 8 September 2019 (Fig. 4a), GLORIA measured less than 20 pptv NH3 over large parts of the flight, despite clear biomass burning plume structures observed in PAN (Fig. 4d). Very small enhancements below 60 pptv are indicated at approximately 10:15 UTC and 13 km altitude, surrounding the filtered air masses, where no retrieval has been possible due to cloud or aerosol contamination. In such close proximity, the cloud or aerosol feature, however, could have affected the NH3 retrieval quality. The CAMS reanalysis (Fig. 4b) and forecast (Fig. 4c) simulate enhanced concentrations of NH3 within extended areas, which are correlated with the PAN biomass burning plumes. CAMS reanalysis shows two horizontal plumes with VMRs of up to 250 pptv, between 09:30 and 11:00 UTC and at 8 and 11 km altitude. This structure corresponds to the measured biomass burning plumes. Using backward trajectories, it has been shown that these air masses likely entered the upper troposphere above central South America (see Fig. 3 of Johansson et al., 2022), while other air masses with enhanced PAN originated from Africa. Further, GLORIA measured C2H4 (upper-tropospheric lifetime of ≈1.2 d) exclusively at these spots, which indicates a young age of these air masses (see Fig. 1 of Johansson et al., 2022). Similarly, the CAMS forecast indicates maximum VMRs of up to 400 pptv for these plumes. In addition, the CAMS forecast also simulates enhancements of lower VMRs of up to 100 pptv for air masses associated with PAN plumes in the first part of the flight (e.g., 06:15 to 08:30 UTC and 9 km altitude and 08:00 UTC and 12 km altitude). No similar enhancements of NH3 are visible in the GLORIA observations.
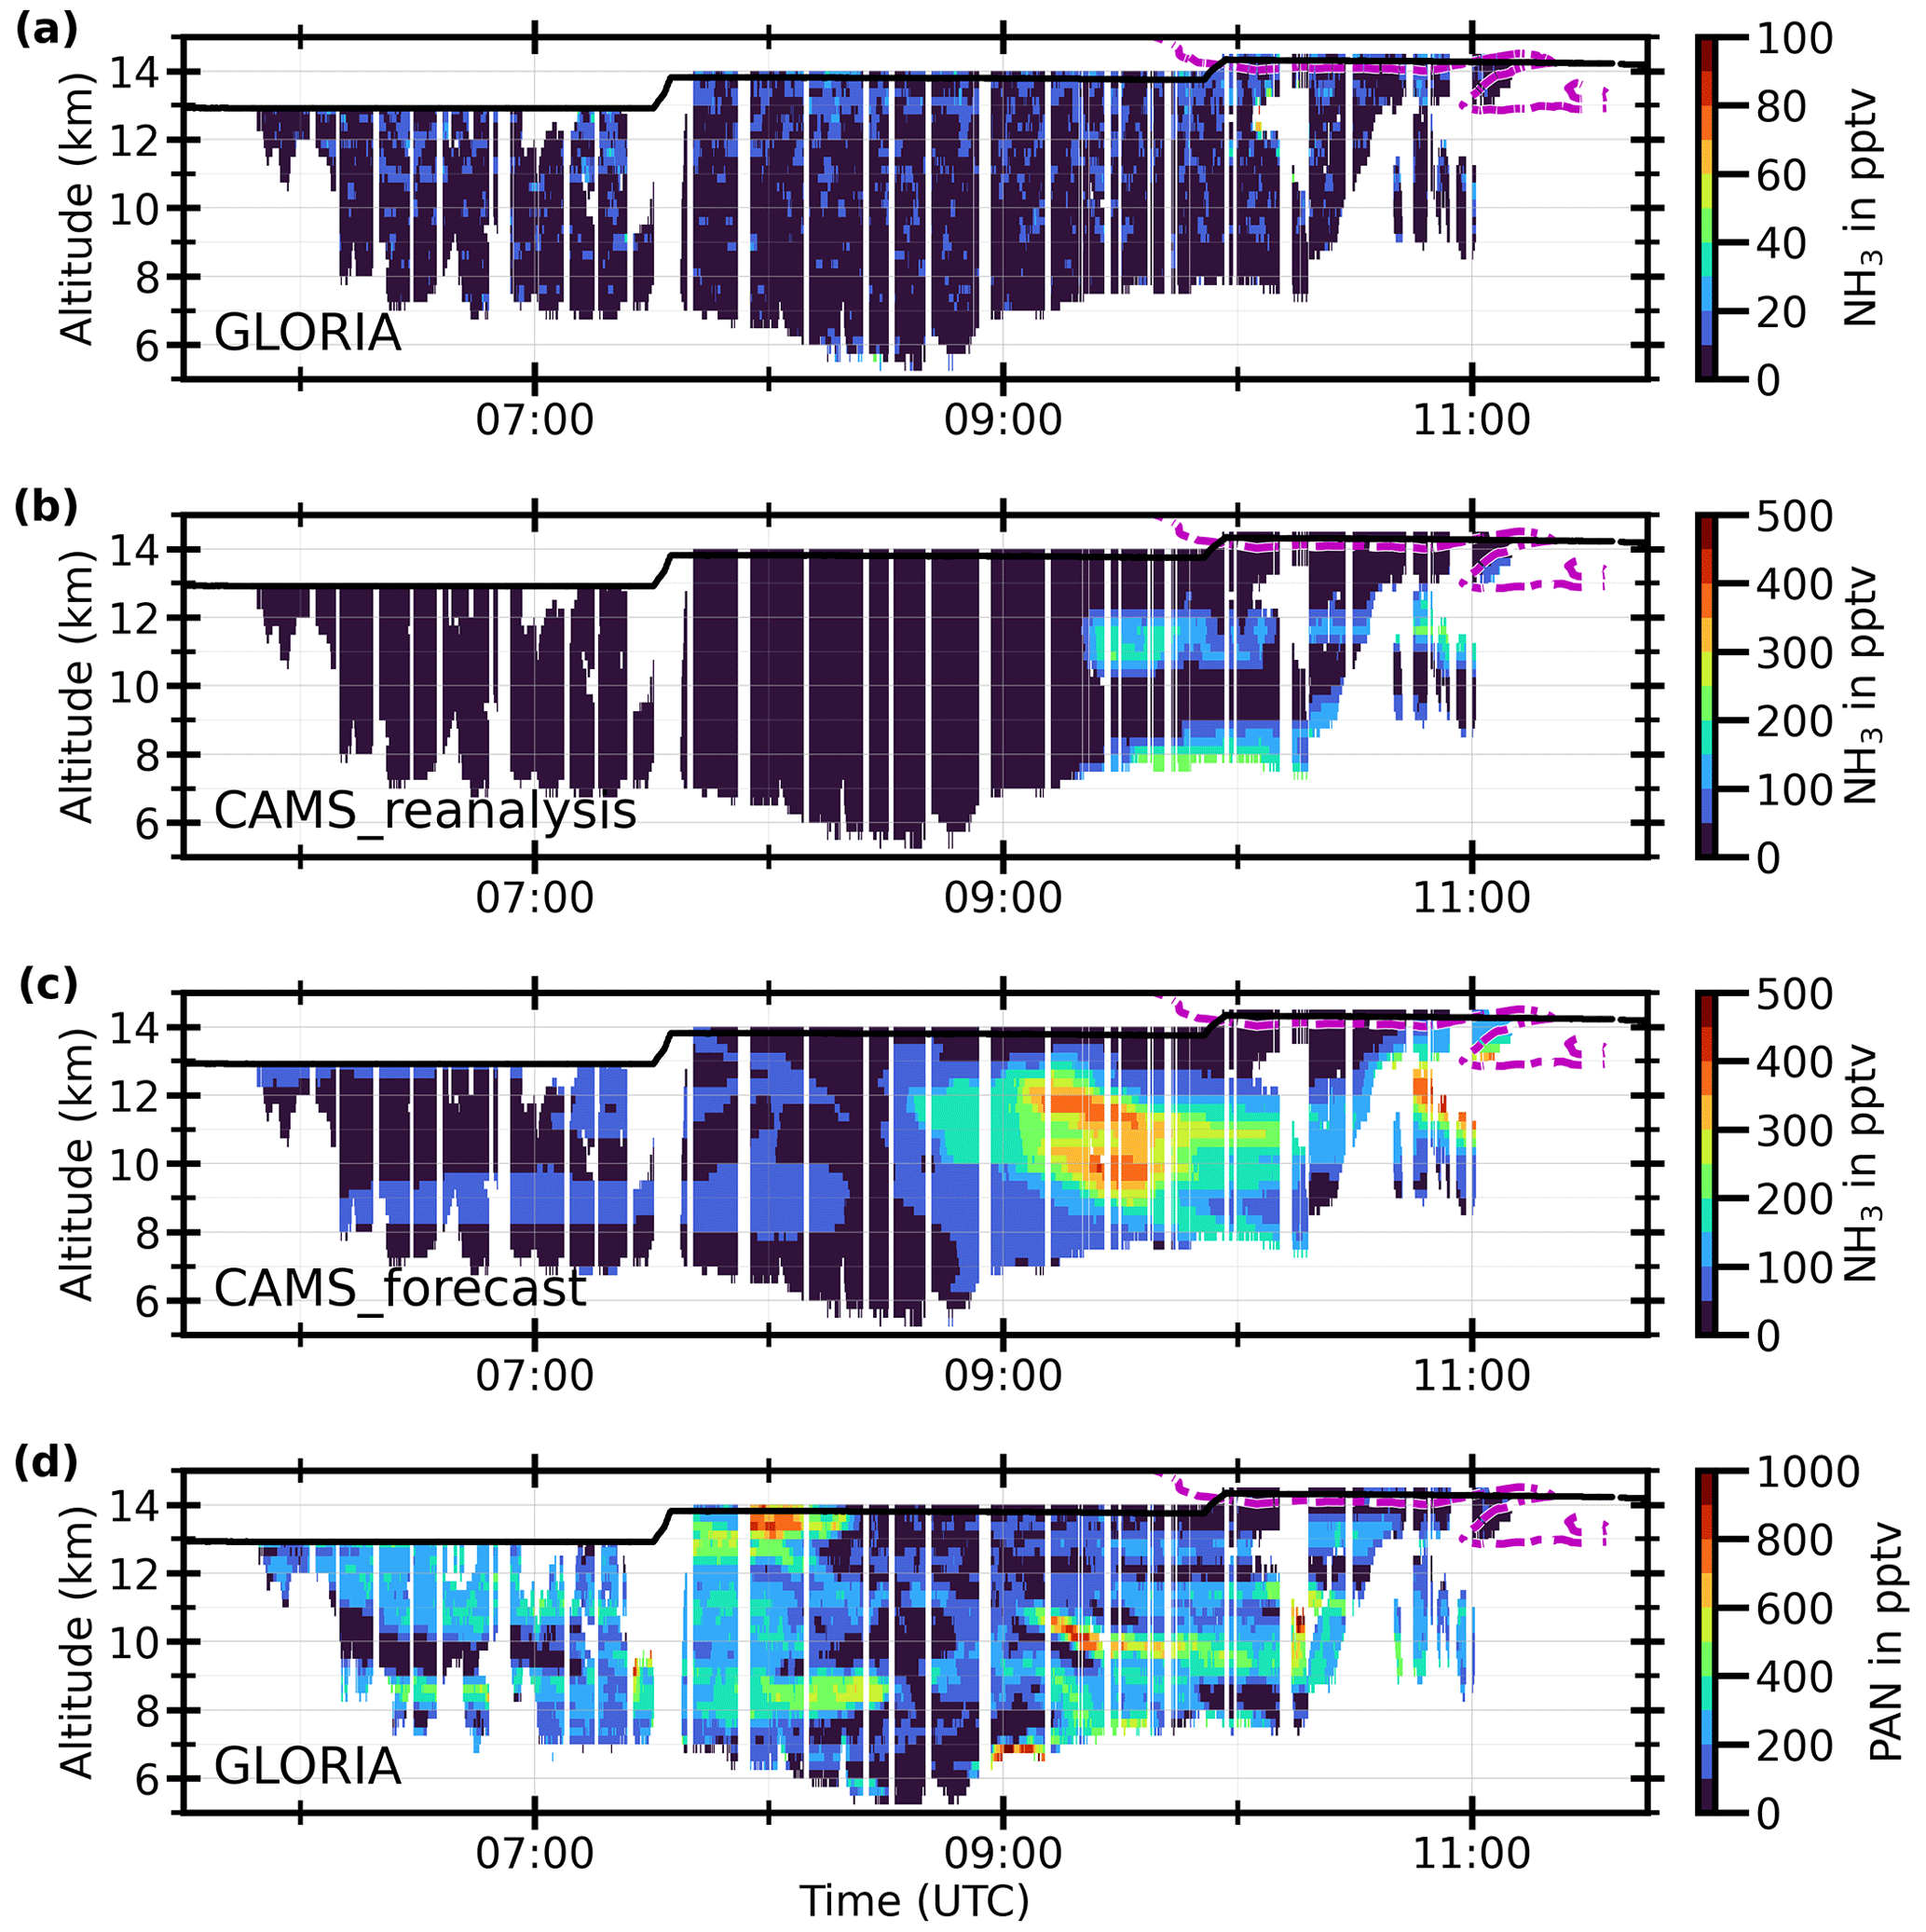
Figure 4The SouthTRAC flight on 8 September 2019 from Sal, Cabo Verde, to Buenos Aires, Argentina: GLORIA time–altitude cross sections of (a) NH3 and (d) PAN together with CAMS reanalysis (b) and the CAMS forecast (c) simulation results, interpolated onto GLORIA geolocations. GLORIA data are horizontally averaged to match lower horizontal resolutions of the CAMS forecast of ≈44 km. The black line indicates flight altitudes, and the dashed magenta line shows the ECMWF ±2.4 PVU isolines as an indication of the tropopause. Due to tropopause heights, which are partially located above flight altitude, these magenta lines are not always present, and sometimes only the ±2 PVU line is present. Blank spaces indicate regions of high cloud tops, calibration measurements, or aircraft movements. Note that color bars for NH3 change between GLORIA measurements (a) and both CAMS simulation results (b, c). Further, color bars have been adjusted to generally lower NH3 VMRs compared to Figs. 2 and 3.
The SouthTRAC flight on 7 October 2019 was characterized by a large, nose-like plume of PAN (and other pollution species) with high VMRs of up to 1000 pptv (17:30 to 20:15 UTC and 8 to 12 km altitude; Fig. 5d). This plume is reproduced by both CAMS model configurations, and trajectories indicate central South America as the source of these air masses (see Johansson et al., 2022, and figures in the Supplement). Further, background PAN VMRs between 19:00 and 21:00 UTC are up to 350 pptv and thus considerably larger than tropospheric background concentrations at the beginning of the flight, which indicates further pollution outside the major PAN plume. NH3 as measured by GLORIA (Fig. 5a) does not show any plume-like structure but background VMRs below 30 pptv. Again, close to possible aerosol or cloud contamination at 21:00 UTC and 13 km altitude, larger NH3 VMRs of up to 70 pptv are observed. As mentioned for measurements of the SouthTRAC flight on 8 September 2019, this NH3 enhancement might be an artifact due to the challenging conditions for the retrieval in the presence of clouds and aerosols.
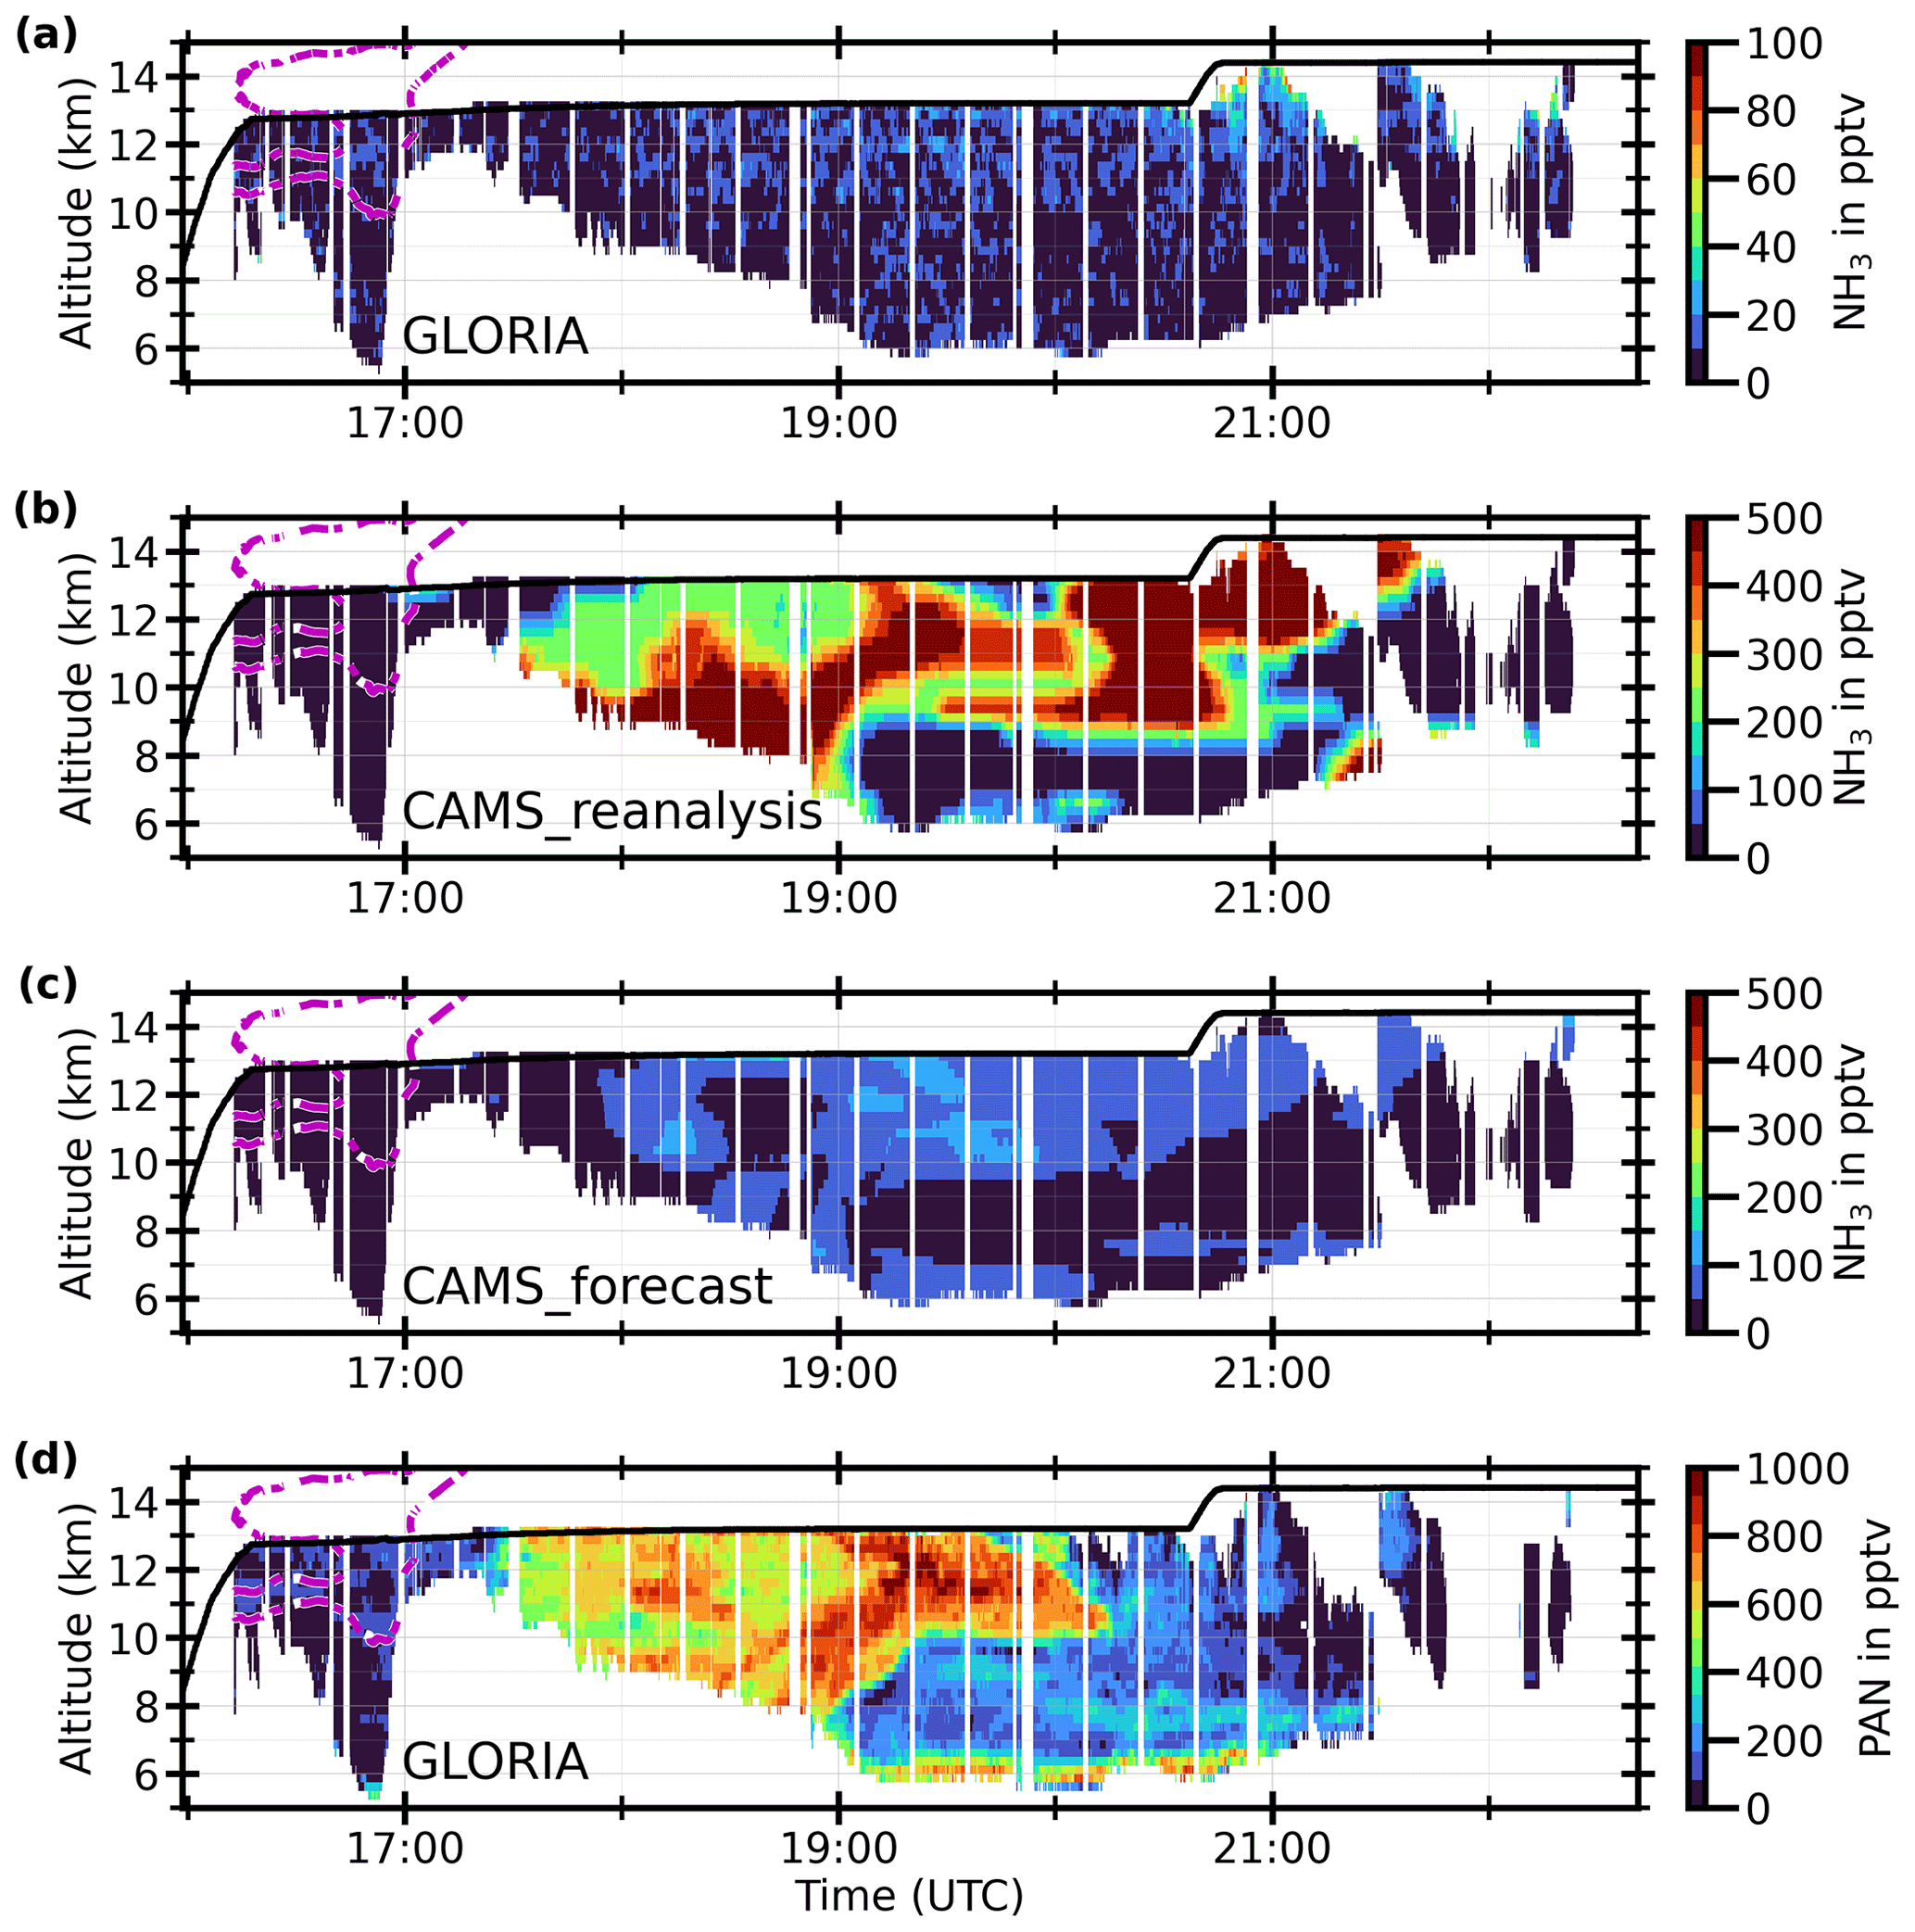
Figure 5The same as Fig. 4 but for the flight on 7 October 2019 from Buenos Aires, Argentina, to Sal, Cabo Verde.
In contrast to the observations, the CAMS reanalysis simulates large amounts of NH3 of more than 1500 pptv. Parts of the simulated NH3 plume resemble the large nose-like PAN plume, as measured by GLORIA. Other parts of the plume include the air masses of the elevated background PAN VMRs and also the region of enhanced measured NH3 but more than an order of magnitude higher than observed. The CAMS forecast does not simulate NH3 VMRs that are as high as those of the reanalysis, but it still simulates maximum VMRs of up to 150 pptv, which is considerably more than measured by GLORIA. The structure of maximum simulated NH3 VMRs coincides with measured PAN maxima and thus indicates that the CAMS forecast also simulates large NH3 VMRs within biomass burning plumes.
Similarly to both presented SouthTRAC flights, the GLORIA observations on 4 November 2019 do not show enhanced NH3 concentrations, despite PAN plumes measured in these air masses (see Fig. 6a and d). Between 14:30 and 16:00 UTC, small enhancements of NH3 are observed at 13 km altitude, just below flight altitude. Otherwise, NH3 VMRs are below 20 pptv. Again, the CAMS reanalysis and forecast largely overestimate NH3 for this flight: CAMS reanalysis (Fig. 6b) simulates up to 400 pptv of NH3 at measurement times with enhanced PAN observations. However, simulated NH3 structures are not directly comparable to the observed PAN distributions. Still, simulated PAN patterns, in particular at 15:00 UTC, are similar to this NH3 distribution (see Fig. S5). This indicates an overall displacement of the simulated plumes compared to the GLORIA observations. The CAMS forecast (Fig. 6c) again shows lower NH3 concentrations compared to the reanalysis but still values of up to 150 pptv. In this case, simulated NH3 patterns resemble more the structures observed in PAN.
3.3 Discussion
The GLORIA NH3 observations show very different situations for the atmosphere above the Asian monsoon and above the South Atlantic. While GLORIA measured plumes of strongly enhanced NH3 VMRs in the upper troposphere within the Asian summer monsoon, biomass burning plumes above the South Atlantic do not show detectable enhancements of NH3. Comparisons with both CAMS models for the StratoClim measurements during the Asian monsoon show reasonable agreement in quantitative terms as well as in the location of the plumes (within the expected performance of the model). In particular the better representation of the major plume during the flight on 31 July 2017 in the CAMS forecast (compared to the CAMS reanalysis) may be due to the higher horizontal resolution and upgraded model properties of the forecast (see Sect. 2.2.2).
For the SouthTRAC flights above the South Atlantic, the CAMS reanalysis and forecast both simulate NH3 plumes of several hundred parts per trillion by volume, which are correlated with biomass burning plumes but which are not observed by GLORIA. The simulated biomass burning plumes (in particular the PAN plumes) show reasonable agreement with the GLORIA PAN measurements, which excludes a mismatch of the plume locations between the model and observation as a reason for the disagreement in NH3. In particular, the spatial resolution employed by CAMS has been shown to be useful for reproducing the biomass burning plumes that are discussed in this work.
This difference in the ability of CAMS models to reproduce measured NH3 VMRs may have various reasons: sources for NH3 may be of different quality for different regions on Earth and also for different emission types. While the enhancements of NH3 measured in the Asian monsoon on 31 July 2017 likely stem from anthropogenic (agricultural) activities (see Supplementary Figs. 10 and 11 of Höpfner et al., 2019), plumes above the South Atlantic, in which CAMS models show enhanced NH3, are likely to come from biomass burning events, as was shown by Johansson et al. (2022) by employing backward trajectories and analyses of different pollutants for these air masses. These two types of emissions, anthropogenic and biomass burning, are prescribed by different emission data sets in CAMS model simulations (see Sect. 2.2), and both data sets may vary in their accuracy and precision regarding NH3.
When comparing the amount of NH3 in the lower atmosphere near the surface (Figs. S6 and S7), the CAMS reanalysis data set shows comparable values on the order of 10 ppbv in the Asian monsoon over northern India and Pakistan by the end of July 2017 as well as over the burning regions in the Amazonian region in October 2019. The concentrations in the monsoon region are in broad agreement with the total column amounts of NH3 as observed by IASI (Clarisse et al., 2023). Regarding the biomass burning cases, the near-surface concentrations of the model appear consistent with observations of NH3 within fire plumes of tens to a few hundreds of parts per billion by volume (Tomsche et al., 2023). However, IASI total column amounts in the region of the South American plume origin in autumn 2019 are less abundant compared to the ones inside the monsoon by a factor of around 5. This would indicate an overestimation of the model with respect to the Amazonian fire sources. In addition, NH3 emissions of fire plumes are highly variable and strongly depend on factors such as fire size, soil composition, fuel composition, or fire weather (e.g., Tomsche et al., 2023).
Further, atmospheric sinks, such as wet deposition or the formation of ammonium (NH)-containing aerosols, may be underestimated by CAMS model configurations within biomass burning plumes above the South Atlantic. In order to evaluate the ability of the model to reproduce the formation of NH aerosols, we compared the GLORIA AN for the SouthTRAC flights with CAMS forecast ammonium aerosol (Figs. S8–S10). Similarly to the NH3 comparisons, AN is not notably enhanced in the GLORIA measurements (besides small enhancements, which correlate with enhanced cloud contamination), but it is considerably enhanced in the CAMS forecast. Since the formation of AN is expected to happen in the upper troposphere, the absence of AN in GLORIA data, together with the presence of AN in CAMS forecast, suggests that the model had already transported too much NH3 into the upper troposphere for the biomass burning plumes. This overestimation of AN is in line with recent comparisons of different CAMS model configurations, where older configurations (such as the 2019 CAMS forecast configuration) tend to overestimate ammonium (Rémy et al., 2024).
In order to find hints of missing wet deposition, the GLORIA cloud index is compared to the CAMS forecast cloud fraction (Figs. S8–S10). For all three examined SouthTRAC flights, it seems like the model underestimates the presence of clouds in the measured air masses. However, this comparison is potentially misleading, since the GLORIA cloud index could potentially be influenced by aerosols, or by clouds, which are along the line of sight but not necessarily on the tangent point on which the CAMS forecast cloud fraction was sampled.
In addition, it is still under discussion how NH3 is efficiently transported into the upper troposphere in the Asian monsoon without being washed out by the strong precipitation within thunderstorms. For example, Ge et al. (2018) explain large NH3 VMRs by deep convective vertical transport of NH3 being dissolved in liquid cloud droplets, from which NH3 would be released during the freezing process of the cloud particles. However, this transport mechanism may be imitated by the CAMS models by a lower washout, which is helpful for the Asian monsoon but not for biomass burning above the South Atlantic.
In this work, we have tested different CAMS model configurations with respect to their capability to simulate NH3 mixing ratios in the upper troposphere. Knowledge about NH3 in the atmosphere is important due to the influence of NH3 on aerosol formation in an altitude region that strongly influenced Earth's radiative budget.
We have selected two general scenarios where enhanced concentrations of NH3 can be expected to be transported from ground sources to high altitudes: the Asian monsoon and strong biomass burning in South America and Africa. In both cases, the CAMS model configurations simulated elevated amounts of NH3 in the upper troposphere.
Comparing these model data with observations of NH3 obtained by the GLORIA infrared remote sounding instrument during two aircraft measurement campaigns reveals that the model configurations broadly reproduce the observations of elevated NH3 concentrations within the Asian summer monsoon well. However, they strongly overestimate NH3 within the biomass burning plumes in the middle–upper tropical troposphere, where no clear enhancement is visible in our measurements.
Clarifying the reason for this model overestimation is beyond the scope our analysis. However, we suggest that the emission of NH3 through biomass burning might be overestimated. It is known that NH3 emissions are challenging to simulate due to their large variability, which is, among others things, influenced by fire size, soil and fuel composition, and fire weather. Still there exist large uncertainties about the losses of NH3 through different processes like particle formation and wash out on its way from its source region to the measurement location in the upper troposphere. By comparing measurements of GLORIA AN with an estimation of CAMS forecast AN, we suggest that conversion of NH3 into AN is not responsible for the overestimation of NH3 by the model.
In terms of measurements, NH3 is strongly undersampled, especially at higher altitudes of our atmosphere, which means that there is a need for more vertically resolved observations. Here we have shown that, using vertically highly resolved observations from spectroscopic infrared limb observations, it is possible to judge the skills of atmospheric models to describe this trace gas correctly. With hopefully upcoming satellite missions, like ESA's Earth Explorer 11 candidate CAIRT (Changing-Atmosphere Infra-Red Tomography Explorer; Sinnhuber et al., 2023), it will be possible to obtain daily global and altitude-resolved vertical distributions of NH3 from the mid-troposphere to the lower stratosphere. In combination with infrared nadir sounders, like IASI, it will be possible to gain much more insight into the processes governing the distribution of NH3 in our atmosphere.
GLORIA measurements are available in the database HALO-DB (https://halo-db.pa.op.dlr.de/mission/101, HALO consortium, 2016a and https://halo-db.pa.op.dlr.de/mission/116, HALO consortium, 2016b) and are available on the KITopen repository (https://doi.org/10.35097/btwqkKRszRMeSLTm, Johansson et al., 2024). The CAMS model data are available from the Copernicus Atmosphere Data Store (https://ads.atmosphere.copernicus.eu/cdsapp#!/dataset/cams-global-atmospheric-composition-forecasts?tab=overview, Copernicus Programme, 2024a and https://ads.atmosphere.copernicus.eu/cdsapp#!/dataset/cams-global-reanalysis-eac4?tab=overview Copernicus Programme, 2024b). IASI NH3 v4 columns are available online: https://iasi.aeris-data.fr/NH3/ (AERIS, 2024).
The supplement related to this article is available online at: https://doi.org/10.5194/acp-24-8125-2024-supplement.
SJ initiated the study, performed the analyses, and wrote the manuscript together with MH. GW, MH, JU, AK, NG, PP, and SJ performed the GLORIA data processing. FFV, EK, TG, CP, GM, HN, TN, and coworkers operated GLORIA during the StratoClim and SouthTRAC campaigns. MH, MR, JU, BMS, WW, and SJ participated in scientific flight planning during the campaigns. VH provided insights into the CAMS simulations. All authors commented on and improved the manuscript.
The contact author has declared that none of the authors has any competing interests.
This work contains Copernicus Atmosphere Monitoring Service information from 2023. Neither the European Commission nor ECMWF is responsible for any use that may be made of the information it contains.
Publisher's note: Copernicus Publications remains neutral with regard to jurisdictional claims made in the text, published maps, institutional affiliations, or any other geographical representation in this paper. While Copernicus Publications makes every effort to include appropriate place names, the final responsibility lies with the authors.
We gratefully thank the SouthTRAC coordination team, in particular DLR-FX for successfully conducting the field campaign, and local support from Argentina and Chile. For the successful campaign from Kathmandu, we thank the StratoClim coordination team as well as the Geophysica team and local support from Nepal. The results are based on the efforts of all members of the GLORIA team, including the technology institutes ZEA-1 and ZEA-2 at Forschungszentrum Jülich and the Institute for Data Processing and Electronics at the Karlsruhe Institute of Technology. We thank ECMWF for providing CAMS data. We thank AERIS for providing IASI NH3 data, and we particularly appreciate helpful comments from Lieven Clarisse. The participating Helmholtz institutes contributed to the HALO operation costs based on their program-oriented funding.
This research has been supported by the Deutsche Forschungsgemeinschaft (DFG; grant nos. HO 4120/4-1 and HALO SPP 1294) and by the European Community's Seventh Framework Programme for Environment (FP 7, grant no. 603557). The participating Helmholtz institutes contributed to the HALO operation costs based on their program-oriented funding.
The article processing charges for this open-access publication were covered by the Karlsruhe Institute of Technology (KIT).
This paper was edited by Holger Tost and reviewed by two anonymous referees.
AERIS consortium: AERIS Data and Services for the Atmosphere, https://iasi.aeris-data.fr/ (last access: 18 July 2024), 2024. a
Appel, O., Köllner, F., Dragoneas, A., Hünig, A., Molleker, S., Schlager, H., Mahnke, C., Weigel, R., Port, M., Schulz, C., Drewnick, F., Vogel, B., Stroh, F., and Borrmann, S.: Chemical analysis of the Asian tropopause aerosol layer (ATAL) with emphasis on secondary aerosol particles using aircraft-based in situ aerosol mass spectrometry, Atmos. Chem. Phys., 22, 13607–13630, https://doi.org/10.5194/acp-22-13607-2022, 2022. a
Basart, S., Benedictow, A., Bennouna, Y., Blechschmidt, A.-M., Chabrillat, S., Christophe, Y., Cuevas, E., Eskes, H. J., Hansen, K. M., Jorba, O., Kapsomenakis, J., Langerock, B., Pay, T., Richter, A., Sudarchikova, N., Schulz, M., Wagner, A., and Zerefos, C.: Upgrade verification note for the CAMS real-time global atmospheric composition service: Evaluation of the e-suite for the CAMS upgrade of July 2019, ECMWF, https://doi.org/10.24380/fcwq-yp50, 2019. a
Beer, R., Shephard, M. W., Kulawik, S. S., Clough, S. A., Eldering, A., Bowman, K. W., Sander, S. P., Fisher, B. M., Payne, V. H., Luo, M., Osterman, G. B., and Worden, J. R.: First satellite observations of lower tropospheric ammonia and methanol, Geophys. Res. Lett., 35, L09801, https://doi.org/10.1029/2008GL033642, 2008. a
Bouwman, A. F., Lee, D. S., Asman, W. A. H., Dentener, F. J., van der Hoek, K. W., and Olivier, J. G. J.: A global high-resolution emission inventory for ammonia, Global Biogeochem. Cy., 11, 561–587, https://doi.org/10.1029/97GB02266, 1997. a
Clarisse, L., Shephard, M. W., Dentener, F., Hurtmans, D., Cady-Pereira, K., Karagulian, F., van Damme, M., Clerbaux, C., and Coheur, P.-F.: Satellite monitoring of ammonia: A case study of the San Joaquin Valley, J. Geophys. Res., 115, D13302, https://doi.org/10.1029/2009JD013291, 2010. a
Clarisse, L., Franco, B., Van Damme, M., Di Gioacchino, T., Hadji-Lazaro, J., Whitburn, S., Noppen, L., Hurtmans, D., Clerbaux, C., and Coheur, P.: The IASI NH3 version 4 product: averaging kernels and improved consistency, Atmos. Meas. Tech., 16, 5009–5028, https://doi.org/10.5194/amt-16-5009-2023, 2023. a
Coheur, P.-F., Herbin, H., Clerbaux, C., Hurtmans, D., Wespes, C., Carleer, M., Turquety, S., Rinsland, C. P., Remedios, J., Hauglustaine, D., Boone, C. D., and Bernath, P. F.: ACE-FTS observation of a young biomass burning plume: First reported measurements of C2H4, C3H6O, H2CO and PAN by infrared occultation from space, Atmos. Chem. Phys., 7, 5437–5446, https://doi.org/10.5194/acp-7-5437-2007, 2007. a
Copernicus Programme: CAMS global atmospheric composition forecasts, Copernicus Programme [data set], https://ads.atmosphere.copernicus.eu/cdsapp#!/dataset/cams-global-atmospheric-composition-forecasts?tab=overview (last access: 18 July 2024), 2024a. a
Copernicus Programme: CAMS global reanalysis (EAC4), Copernicus Programme https://ads.atmosphere.copernicus.eu/cdsapp#!/dataset/cams-global-reanalysis-eac4?tab=overview (last access: 18 July 2024), 2024b. a
Eskes, H. J., Antonakaki, T., Basart, S., Benedictow, A., Blechschmidt, A.-M., Chabrillat, S., Christophe, Y., Clark, H., Cuevas, E., Hansen, K. M., Im, U., Kapsomenakis, J., Langerock, B., Richter, A., Schulz, M., Sudarchikova, N., Thouret, V., Wagner, A., and Zerefos, C.: Upgrade Verification Note for the CAMS Near-Real Time Global Atmospheric Composition Service, https://atmosphere.copernicus.eu/sites/default/files/2018-06/CAMS84_2015SC1_D84.3.2_201611_esuite_v1_0.pdf (last access: 18 July 2024), 2016. a
Eskes, H. J., Antonakaki, T., Basart, S., Benedictow, A., Blechschmidt, A.-M., Chabrillat, S., Christophe, Y., Clark, H., Cuevas, E., Hansen, K. M., Im, U., Kapsomenakis, J., Langerock, B., Petersen, K., Richter, A., Schulz, M., Sudarchikova, N., Thouret, V., Wagner, A., and Zerefos, C.: Upgrade Verification Note for the CAMS Near-Real Time Global Atmospheric Composition Service, https://atmosphere.copernicus.eu/sites/default/files/2018-06/CAMS84_2015SC2_D84.3.1.3_201706_esuite_v1_0.pdf (last access: 18 July 2024), 2017. a
Eskes, H. J., Basart, S., Benedictow, A., Bennouna, Y., Blechschmidt, A.-M., Chabrillat, S., Christophe, Y., Clark, H., Cuevas, E., Hansen, K. M., Im, U., Kapsomenakis, J., Langerock, B., Petersen, K., Schulz, M., Wagner, A., and Zerefos, C.: Upgrade Verification Note for the CAMS Near-Real Time Global Atmospheric Composition Service, https://atmosphere.copernicus.eu/sites/default/files/2019-02/CAMS84_2015SC2_D84.3.1.5_201802_esuite_v1_0.pdf (last access: 18 July 2024), 2018. a
Flemming, J., Huijnen, V., Arteta, J., Bechtold, P., Beljaars, A., Blechschmidt, A.-M., Diamantakis, M., Engelen, R. J., Gaudel, A., Inness, A., Jones, L., Josse, B., Katragkou, E., Marecal, V., Peuch, V.-H., Richter, A., Schultz, M. G., Stein, O., and Tsikerdekis, A.: Tropospheric chemistry in the Integrated Forecasting System of ECMWF, Geosci. Model Dev., 8, 975–1003, https://doi.org/10.5194/gmd-8-975-2015, 2015. a, b
Friedl-Vallon, F., Gulde, T., Hase, F., Kleinert, A., Kulessa, T., Maucher, G., Neubert, T., Olschewski, F., Piesch, C., Preusse, P., Rongen, H., Sartorius, C., Schneider, H., Schönfeld, A., Tan, V., Bayer, N., Blank, J., Dapp, R., Ebersoldt, A., Fischer, H., Graf, F., Guggenmoser, T., Höpfner, M., Kaufmann, M., Kretschmer, E., Latzko, T., Nordmeyer, H., Oelhaf, H., Orphal, J., Riese, M., Schardt, G., Schillings, J., Sha, M. K., Suminska-Ebersoldt, O., and Ungermann, J.: Instrument concept of the imaging Fourier transform spectrometer GLORIA, Atmos. Meas. Tech., 7, 3565–3577, https://doi.org/10.5194/amt-7-3565-2014, 2014. a
Ge, C., Zhu, C., Francisco, J. S., Zeng, X. C., and Wang, J.: A molecular perspective for global modeling of upper atmospheric NH3 from freezing clouds, P. Natl. Acad. Sci. USA, 115, 6147–6152, https://doi.org/10.1073/pnas.1719949115, 2018. a
Granier, C., Bessagnet, B., Bond, T., D'Angiola, A., van der Denier Gon, H., Frost, G. J., Heil, A., Kaiser, J. W., Kinne, S., Klimont, Z., Kloster, S., Lamarque, J.-F., Liousse, C., Masui, T., Meleux, F., Mieville, A., Ohara, T., Raut, J.-C., Riahi, K., Schultz, M. G., Smith, S. J., Thompson, A., van Aardenne, J., van der Werf, G. R., and van Vuuren, D. P.: Evolution of anthropogenic and biomass burning emissions of air pollutants at global and regional scales during the 1980–2010 period, Climatic Change, 109, 163–190, https://doi.org/10.1007/s10584-011-0154-1, 2011. a
Guenther, A. B., Jiang, X., Heald, C. L., Sakulyanontvittaya, T., Duhl, T., Emmons, L. K., and Wang, X.: The Model of Emissions of Gases and Aerosols from Nature version 2.1 (MEGAN2.1): an extended and updated framework for modeling biogenic emissions, Geosci. Model Dev., 5, 1471–1492, https://doi.org/10.5194/gmd-5-1471-2012, 2012. a
HALO consortium: HALO database, Registry of Research Data Repositories [data set], https://doi.org/10.17616/R39Q0T (data available at: https://halo-db.pa.op.dlr.de/mission/101, last access: 18 July 2024), 2016a. a
HALO consortium: HALO database, Registry of Research Data Repositories [data set], https://doi.org/10.17616/R39Q0T (data available at: https://halo-db.pa.op.dlr.de/mission/116, last access: 18 July 2024), 2016b. a
Hegg, D. A., Radke, L. F., Hobbs, P. V., and Riggan, P. J.: Ammonia emissions from biomass burning, Geophys. Res. Lett., 15, 335–337, https://doi.org/10.1029/gl015i004p00335, 1988. a
Höpfner, M., Volkamer, R., Grabowski, U., Grutter, M., Orphal, J., Stiller, G., Clarmann, T. V., and Wetzel, G.: First detection of ammonia (NH3) in the Asian summer monsoon upper troposphere, Atmos. Chem. Phys., 16, 14357–14369, https://doi.org/10.5194/acp-16-14357-2016, 2016. a, b
Höpfner, M., Ungermann, J., Borrmann, S., Wagner, R., Spang, R., Riese, M., Stiller, G., Appel, O., Batenburg, A. M., Bucci, S., Cairo, F., Dragoneas, A., Friedl-Vallon, F., Hünig, A., Johansson, S., Krasauskas, L., Legras, B., Leisner, T., Mahnke, C., Möhler, O., Molleker, S., Müller, R., Neubert, T., Orphal, J., Preusse, P., Rex, M., Saathoff, H., Stroh, F., Weigel, R., and Wohltmann, I.: Ammonium nitrate particles formed in upper troposphere from ground ammonia sources during Asian monsoons, Nat. Geosci., 12, 608–612, https://doi.org/10.1038/s41561-019-0385-8, 2019. a, b, c, d, e, f, g
Huijnen, V., Williams, J., Van Weele, M., Van Noije, T., Krol, M., Dentener, F., Segers, A., Houweling, S., Peters, W., De Laat, J., Boersma, F., Bergamaschi, P., Van Velthoven, P., Le Sager, P., Eskes, H., Alkemade, F., Scheele, R., Nédélec, P., and Pätz, H.-W.: The global chemistry transport model TM5: description and evaluation of the tropospheric chemistry version 3.0, Geosci. Model Dev., 3, 445–473, https://doi.org/10.5194/gmd-3-445-2010, 2010. a
Inness, A., Flemming, J., Heue, K.-P., Lerot, C., Loyola, D., Ribas, R., Valks, P., van Roozendael, M., Xu, J., and Zimmer, W.: Monitoring and assimilation tests with TROPOMI data in the CAMS system: Near-real-time total column ozone, Atmos. Chem. Phys., 19, 3939–3962, https://doi.org/10.5194/acp-19-3939-2019, 2019. a, b
Johansson, S., Woiwode, W., Höpfner, M., Friedl-Vallon, F., Kleinert, A., Kretschmer, E., Latzko, T., Orphal, J., Preusse, P., Ungermann, J., Santee, M. L., Jurkat-Witschas, T., Marsing, A., Voigt, C., Giez, A., Krämer, M., Rolf, C., Zahn, A., Engel, A., Sinnhuber, B.-M., and Oelhaf, H.: Airborne limb-imaging measurements of temperature, HNO3, O3, ClONO2, H2O and CFC-12 during the Arctic winter 2015/2016: Characterization, in situ validation and comparison to Aura/MLS, Atmos. Meas. Tech., 11, 4737–4756, https://doi.org/10.5194/amt-11-4737-2018, 2018. a
Johansson, S., Höpfner, M., Kirner, O., Wohltmann, I., Bucci, S., Legras, B., Friedl-Vallon, F., Glatthor, N., Kretschmer, E., Ungermann, J., and Wetzel, G.: Pollution trace gas distributions and their transport in the Asian monsoon upper troposphere and lowermost stratosphere during the StratoClim campaign 2017, Atmos. Chem. Phys., 20, 14695–14715, https://doi.org/10.5194/acp-20-14695-2020, 2020. a, b, c
Johansson, S., Wetzel, G., Friedl-Vallon, F., Glatthor, N., Höpfner, M., Kleinert, A., Neubert, T., Sinnhuber, B.-M., and Ungermann, J.: Biomass burning pollution in the South Atlantic upper troposphere: GLORIA trace gas observations and evaluation of the CAMS model, Atmos. Chem. Phys., 22, 3675–3691, https://doi.org/10.5194/acp-22-3675-2022, 2022. a, b, c, d, e, f, g, h, i
Johansson, S., Höpfner, M., Friedl-Vallon, F., Glatthor, N., Gulde, T. Kleinert, A., Kretschmer, E., Maucher, G., Neubert, T., Nordmeyer, H., Piesch, C., Preusse, P., Riese, M., Sinnhuber, B.-M., Ungermann, J., Wetzel, G., and Woiwode, W.: Data for: Ammonia in the UTLS: GLORIA airborne measurements for CAMS model evaluation in the Asian Monsoon and in biomass burning plumes above the South Atlantic, Karlsruher Institut für Technologie (KIT) [data set], https://doi.org/10.35097/btwqkKRszRMeSLTm, 2024 a
Kaiser, J. W., Heil, A., Andreae, M. O., Benedetti, A., Chubarova, N., Jones, L., Morcrette, J.-J., Razinger, M., Schultz, M. G., Suttie, M., and van der Werf, G. R.: Biomass burning emissions estimated with a global fire assimilation system based on observed fire radiative power, Biogeosciences, 9, 527–554, https://doi.org/10.5194/bg-9-527-2012, 2012. a
Kirkby, J., Amorim, A., Baltensperger, U., Carslaw, K. S., Christoudias, T., Curtius, J., Donahue, N. M., Haddad, I. E., Flagan, R. C., Gordon, H., Hansel, A., Harder, H., Junninen, H., Kulmala, M., Kürten, A., Laaksonen, A., Lehtipalo, K., Lelieveld, J., Möhler, O., Riipinen, I., Stratmann, F., Tomé, A., Virtanen, A., Volkamer, R., Winkler, P. M., and Worsnop, D. R.: Atmospheric new particle formation from the CERN CLOUD experiment, Nat. Geosci., 16, 948–957, https://doi.org/10.1038/s41561-023-01305-0, 2023. a
Kleinert, A., Friedl-Vallon, F., Guggenmoser, T., Höpfner, M., Neubert, T., Ribalda, R., Sha, M. K., Ungermann, J., Blank, J., Ebersoldt, A., Kretschmer, E., Latzko, T., Oelhaf, H., Olschewski, F., and Preusse, P.: Level 0 to processing of the imaging Fourier transform spectrometer GLORIA: Generation of radiometrically and spectrally calibrated spectra, Atmos. Meas. Tech., 7, 4167–4184, https://doi.org/10.5194/amt-7-4167-2014, 2014. a
Morcrette, J., Boucher, O., Jones, L., Salmond, D., Bechtold, P., Beljaars, A., Benedetti, A., Bonet, A., Kaiser, J. W., Razinger, M., Schulz, M., Serrar, S., Simmons, A. J., Sofiev, M., Suttie, M., Tompkins, A. M., and Untch, A.: Aerosol analysis and forecast in the European Centre for Medium‐Range Weather Forecasts Integrated Forecast System: Forward modeling, J. Geophys. Res.-Atmospheres, 114, D06206, https://doi.org/10.1029/2008JD011235, 2009. a
Nowak, J. B., Neuman, J. A., Bahreini, R., Brock, C. A., Middlebrook, A. M., Wollny, A. G., Holloway, J. S., Peischl, J., Ryerson, T. B., and Fehsenfeld, F. C.: Airborne observations of ammonia and ammonium nitrate formation over Houston, Texas, J. Geophys. Res., 115, D22304, https://doi.org/10.1029/2010JD014195, 2010. a
Rémy, S., Metzger, S., Huijnen, V., Williams, J. E., and Flemming, J.: An improved representation of aerosol acidity in the ECMWF IFS-COMPO 49R1 through the integration of EQSAM4Climv12, EGUsphere [preprint], https://doi.org/10.5194/egusphere-2023-3072, 2024. a
Riese, M., Oelhaf, H., Preusse, P., Blank, J., Ern, M., Friedl-Vallon, F., Fischer, H., Guggenmoser, T., Höpfner, M., Hoor, P., Kaufmann, M., Orphal, J., Plöger, F., Spang, R., Suminska-Ebersoldt, O., Ungermann, J., Vogel, B., and Woiwode, W.: Gimballed Limb Observer for Radiance Imaging of the Atmosphere (GLORIA) scientific objectives, Atmos. Meas. Tech., 7, 1915–1928, https://doi.org/10.5194/amt-7-1915-2014, 2014. a
Shephard, M. W. and Cady-Pereira, K. E.: Cross-track Infrared Sounder (CrIS) satellite observations of tropospheric ammonia, Atmos. Meas. Tech., 8, 1323–1336, https://doi.org/10.5194/amt-8-1323-2015, 2015. a
Sinnhuber, B.-M., Chipperfield, M., Errera, Q., Friedl-Vallon, F., Funke, B., Hoffmann, A., Malavart, A., Osprey, S., Polichtchouk, I., Preusse, P., Raspolini, P., Schüttemeyer, D., Ungermann, J., Verronen, P., and Walker, K.: Changing-Atmosphere Infra-Red Tomography Explorer, https://www.cairt.eu/ (last access: 28 November 2023), 2023. a
Spang, R., Remedios, J. J., and Brarkley, M. P.: Colour indices for the detection and differentiation of cloud types in infra-red limb emission spectra, Adv. Space Res., 33, 1041–1047, https://doi.org/10.1016/S0273-1177(03)00585-4, 2004. a
Stiller, G. P., ed.: The Karlsruhe Optimized and Precise Radiative transfer Algorithm (KOPRA), in: vol. FZKA 6487 of Wissenschaftliche Berichte, Forschungszentrum Karlsruhe, Karlsruhe, https://www.imk-asf.kit.edu/english/312.php (last access: 18 July 2024), 2000. a
Szopa, S., Naik, V., Adhikary, B., Artaxo, P., Berntsen, T. K., Collins, W. D., Fuzzi, S., Gallardo, L., Kiendler-Scharr, A., and Klimont, Z.: Short-lived Climate Forcers, in: Climate Change 2021 – The Physical Science Basis, Cambridge University Press, Cambridge, UK and New York, NY, USA, 817–922, https://doi.org/10.1017/9781009157896.008, 2021. a, b
Tomsche, L., Piel, F., Mikoviny, T., Nielsen, C. J., Guo, H., Campuzano-Jost, P., Nault, B. A., Schueneman, M. K., Jimenez, J. L., Halliday, H., Diskin, G., DiGangi, J. P., Nowak, J. B., Wiggins, E. B., Gargulinski, E., Soja, A. J., and Wisthaler, A.: Measurement report: Emission factors of NH3 and NHx for wildfires and agricultural fires in the United States, Atmos. Chem. Phys., 23, 2331–2343, https://doi.org/10.5194/acp-23-2331-2023, 2023. a, b, c, d
Ungermann, J., Kleinert, A., Maucher, G., Bartolomé, I., Friedl-Vallon, F., Johansson, S., Krasauskas, L., and Neubert, T.: Quantification and mitigation of the instrument effects and uncertainties of the airborne limb imaging FTIR GLORIA, Atmos. Meas. Tech., 15, 2503–2530, https://doi.org/10.5194/amt-15-2503-2022, 2022. a
van Damme, M., Clarisse, L., Dammers, E., Liu, X., Nowak, J. B., Clerbaux, C., Flechard, C. R., Galy-Lacaux, C., Xu, W., Neuman, J. A., Tang, Y. S., Sutton, M. A., Erisman, J. W., and Coheur, P. F.: Towards validation of ammonia (NH3) measurements from the IASI satellite, Atmos. Meas. Tech., 8, 1575–1591, https://doi.org/10.5194/amt-8-1575-2015, 2015. a, b
von Bobrutzki, K., Braban, C. F., Famulari, D., Jones, S. K., Blackall, T., Smith, T. E. L., Blom, M., Coe, H., Gallagher, M., Ghalaieny, M., McGillen, M. R., Percival, C. J., Whitehead, J. D., Ellis, R., Murphy, J., Mohacsi, A., Pogany, A., Junninen, H., Rantanen, S., Sutton, M. A., and Nemitz, E.: Field inter-comparison of eleven atmospheric ammonia measurement techniques, Atmos. Meas. Tech., 3, 91–112, https://doi.org/10.5194/amt-3-91-2010, 2010. a
Wagner, R., Bertozzi, B., Höpfner, M., Höhler, K., Möhler, O., Saathoff, H., and Leisner, T.: Solid Ammonium Nitrate Aerosols as Efficient Ice Nucleating Particles at Cirrus Temperatures, J. Geophys. Res.-Atmos., 125, https://doi.org/10.1029/2019JD032248, 2020. a
Wang, Y., Ma, Y.-F., Eskes, H., Inness, A., Flemming, J., and Brasseur, G. P.: Evaluation of the CAMS global atmospheric trace gas reanalysis 2003–2016 using aircraft campaign observations, Atmos. Chem. Phys., 20, 4493–4521, https://doi.org/10.5194/acp-20-4493-2020, 2020. a
Warner, J. X., Wei, Z., Strow, L. L., Dickerson, R. R., and Nowak, J. B.: The global tropospheric ammonia distribution as seen in the 13-year AIRS measurement record, Atmos. Chem. Phys., 16, 5467–5479, https://doi.org/10.5194/acp-16-5467-2016, 2016. a
Wetzel, G., Friedl-Vallon, F., Glatthor, N., Grooß, J.-U., Gulde, T., Höpfner, M., Johansson, S., Khosrawi, F., Kirner, O., Kleinert, A., Kretschmer, E., Maucher, G., Nordmeyer, H., Oelhaf, H., Orphal, J., Piesch, C., Sinnhuber, B.-M., Ungermann, J., and Vogel, B.: Pollution trace gases C2H6, C2H2, HCOOH, and PAN in the North Atlantic UTLS: observations and simulations, Atmos. Chem. Phys., 21, 8213–8232, https://doi.org/10.5194/acp-21-8213-2021, 2021. a
Ziereis, H. and Arnold, F.: Gaseous ammonia and ammonium ions in the free troposphere, Nature, 321, 503–505, https://doi.org/10.1038/321503a0, 1986. a