the Creative Commons Attribution 4.0 License.
the Creative Commons Attribution 4.0 License.
 | 16 Jul 2024
Evidence of a dual African and Australian biomass burning influence on the vertical distribution of aerosol and carbon monoxide over the southwest Indian Ocean basin in early 2020
Nelson Bègue
Alexandre Baron
Gisèle Krysztofiak
Gwenaël Berthet
Corinna Kloss
Fabrice Jégou
Sergey Khaykin
Marion Ranaivombola
Tristan Millet
Thierry Portafaix
Valentin Duflot
Philippe Keckhut
Hélène Vérèmes
Guillaume Payen
Mahesh Kumar Sha
Pierre-François Coheur
Cathy Clerbaux
Michaël Sicard
Tetsu Sakai
Richard Querel
Ben Liley
Dan Smale
Isamu Morino
Osamu Uchino
Tomohiro Nagai
Penny Smale
John Robinson
Hassan Bencherif
During the 2020 austral summer, the pristine atmosphere of the southwest Indian Ocean (SWIO) basin experienced significant perturbations. This study examines the variability of aerosols and carbon monoxide (CO) over this remote oceanic region and investigates the underlying processes in the upper troposphere–lower stratosphere (UT-LS). Aerosol profiles in January and February 2020 revealed a multi-layer structure in the tropical UT-LS. Numerical models – the FLEXible PARTicle dispersion model (FLEXPART) and the Modèle Isentropique de transport Mésoéchelle de l'Ozone Stratosphérique par Advection (MIMOSA) – indicated that the lower-stratospheric aerosol content was influenced by the intense and persistent stratospheric aerosol layer generated during the 2019–2020 extreme Australian bushfire events. A portion of this layer was transported eastward by prevailing easterly winds, leading to increased aerosol extinction profiles over Réunion on 27 and 28 January. Analysis of advected potential vorticity revealed isentropic transport of air masses containing Australian biomass burning aerosols from extratropical latitudes to Réunion at the 400 K isentropic level on 28 January. Interestingly, we found that biomass burning (BB) activity in eastern Africa, though weak during this season, significantly influenced (contributed up to 90 % of) the vertical distribution of CO and aerosols in the upper troposphere over the SWIO basin. Ground-based observations at Réunion confirmed the simultaneous presence of African and Australian aerosol layers. This study provides the first evidence of African BB emissions impacting the CO and aerosol distribution in the upper troposphere over the SWIO basin during the convective season.
- Article
(3954 KB) - Full-text XML
- BibTeX
- EndNote


Significant quantities of aerosols and trace gases, such as carbon monoxide (CO), are released into the atmosphere during biomass burning (BB) events in the Southern Hemisphere, particularly in South America and southern Africa from July to November (Bencherif et al., 2020; Garstang et al., 1996; Holanda et al., 2020). These activities disrupt the vertical distribution of gases and aerosols such that they potentially reach the stratosphere (Andreae and Merlet, 2001; Héron et al., 2020). Under specific meteorological conditions, pyro-convection events can directly inject soot and smoke into the stratosphere (Dowdy and Pepler, 2018; Fromm et al., 2010). The radiative impact of these particles and gases depends on their abundance, vertical distribution, and residence time, which influence their dispersion (Darbyshire et al., 2019; Morgan et al., 2020). Transported over long distances, these aerosols and gases can affect the atmospheric composition in traditionally aerosol-free regions.
The southwest Indian Ocean (SWIO) basin stands out as one of the Earth's pristine regions, where the aerosol concentration is predominantly governed by sea salts (Duflot et al., 2022). Characterized by a wet season (December to April) and a dry season (May to November), the SWIO region's atmospheric composition during the dry season is significantly influenced by Southern Hemisphere BB activity (Clain et al., 2009; Edwards et al., 2006; Kaufman et al., 2003; Swap et al., 2003). Studies have highlighted that BB plumes cross South Africa during the dry season, with southern African BB emissions primarily reaching the SWIO basin via five identified transportation modes (Edwards et al., 2006; Garstang et al., 1996). Situated in the subtropical southern Indian Ocean at the convergence of air masses from southern Africa, Réunion Island (21.0° S, 55.5° E) provides an ideal location to study the impact of regional transport on atmospheric composition over the SWIO basin. Ozone radiosonde and ground-based lidar observations at Réunion have revealed a significant annual increase in tropospheric ozone during the August–November period, which is aligned with the BB season in southern Africa and Madagascar (Clain et al., 2009).
Additionally, the long-range transport of BB plumes from South America can influence the tropical tropospheric composition over the SWIO basin (Duflot et al., 2010, 2022; Zhou et al., 2018). By combining ground-based observations of carbon monoxide (CO) from a Fourier-transform infrared (FTIR) spectrometer installed at Réunion with FLEXible PARTicle dispersion model (FLEXPART) model simulations, Duflot et al. (2010) demonstrated the potential of southern African and South American BB events to inject substantial quantities of ozone precursors such as CO and aerosols throughout the troposphere over the SWIO basin. This synergy of CO and aerosol observations aids in understanding the influence of BB events on aerosol burden evolution (Bègue et al., 2021; Bencherif et al., 2020; Jones et al., 2001). A recent analysis of aerosol optical depth (AOD) from sun-photometer data at Réunion over 12 years by Duflot et al. (2022) revealed that BB activity explains 67 % of the AOD variability, with southern Africa and South America contributing 22 % and 20 %, respectively. Despite Australia's reputation for intense BB events (Fromm et al., 2006, 2010; De Laat et al., 2012), their contribution to the observed AOD variability over Réunion is relatively low (4.7 %).
The Australian BB activity primarily occurs in the northern part of the continent between September and January, although the most severe fires typically occur in southeastern Australia. Extreme fires in this region during the austral summer can lead to pyro-convection events, with a significant impact on the stratosphere at regional and global scales. The unprecedented 2019–2020 fire season, known as the “Black Summer”, witnessed numerous pyro-convection outbreaks, injecting approximately 0.9 Tg of smoke into the stratosphere (Yu et al., 2021). This smoke mass, containing 2.5 % black carbon, induced a 1 K warming in the stratosphere of the Southern Hemisphere mid-latitude for more than 6 months following its injection. The smoke layer was advected by westerly winds that dispersed across all extratropical latitudes in the Southern Hemisphere. The optical characteristics of the stratospheric smoke layer were measured by lidar systems in Chile and Argentina, with the smoke layer extending from 9 to over 30 km in height (Ohneiser et al., 2022). The presence of this smoke layer significantly impacted the record-breaking ozone hole over Antarctica in September–November 2020, as reported by Tencé et al. (2022). Despite the extensive research on the impact of Australian fires on the stratospheric composition and circulation over extratropical latitudes, relatively little attention has been paid to their influence over tropical and subtropical latitudes.
This study aims to document the transport of the Australian smoke layer in the southern subtropics over the Indian Ocean during the January–February period, corresponding to the wet season in the SWIO basin. The intensity of convective activity during this season, with the presence of the Inter-tropical Convergence Zone (ITCZ) over the entire basin, often leads to tropical depressions that reach the stage of tropical cyclones (Lashkari et al., 2017; Barthe et al., 2021; Neumann et al., 1993). The Regional Specialized Meteorological Centre (RSMC) at Réunion reported the development of six tropical cyclones and four tropical storms in the SWIO basin during the 2019–2020 cyclone season.
The study is structured as follows: Sect. 2 outlines the observations and the model employed to investigate aerosol layer transport. Section 3 reviews the formation and transport of the Australian aerosol layer across the Southern Hemisphere. Section 4 analyses the impact of the Australian BB plume on aerosol and CO variability over the SWIO basin. Section 5 discusses the influence of convective activity on aerosol smoke layer transport over the SWIO basin. Finally, Sect. 6 provides a summary and future perspectives of the study.
2.1 Aerosol datasets
The aerosol datasets used in this study resulted mainly from two ground-based observation sites from the Network for the Detection of Atmospheric Composition Change (NDACC, https://www.ndacc.org, last access: 10 April 2024) as well as a suite of spaceborne sensor products.
2.1.1 Lauder ground-based lidar
Measurements of aerosol optical properties at Lauder (45.0° S; 169.7° E) have been performed using lidars since 1992. The lidar system, detailed by Sakai et al. (2016), utilizes a Nd : YAG laser beam at 532 nm with linear polarization. The lidar detects Rayleigh–Mie backscattering at 532 nm with parallel and perpendicular components. Extinction and backscatter coefficients were derived using the methodology outlined by Fernald (1984), incorporating an aerosol extinction-to-backscatter ratio known as the lidar ratio (LR). LR values for January–May 2020 are 88 and 60 sr for altitudes above and below 23 km, respectively, as determined through a signal attenuation methodology described by Uchino et al. (1983) and Young (1995). Aerosol depolarization was computed from the backscatter ratio and the total linear volume depolarization ratio (Sakai et al., 2003), calculated as the ratio of the perpendicular to parallel components of the backscattered signal at 532 nm. To analyse the aerosol variability attributed to Australian fires, a background profile was defined using measurements taken during periods without significant atmospheric disturbances, such as volcanic eruptions or pyro-convection outbreaks. In this study, the background extinction profile at Lauder was constructed from measurements made between 1997 and 2004.
2.1.2 Réunion Island ground-based lidars
The Atmospheric Physics Observatory of La Réunion (OPAR) serves as a permanent station for long-term atmospheric observations (Baray et al., 2013). Two lidar systems operating at Maïdo Observatory, situated 2200 m above mean sea level (a.m.s.l.), retrieve ozone and aerosol profiles in the UV (355 nm) and visible (532 nm) parts of the light spectrum. These systems, LiO3T (532 nm) and LiO3S (355 nm), are described by Baray et al. (2006). Extending from approximately 15 km to the middle stratosphere (∼35 km), these lidars provide high-resolution aerosol optical property measurements (extinction and the backscatter ratio) with a vertical resolution of 15 m. By employing two distinct wavelengths, the Réunion lidar profiles facilitate the assessment of the Ångström exponent of aerosols between 355 and 532 nm, providing insight into the aerosol's extinction behaviour and microphysical properties, particularly particle size. A small Ångström exponent typically indicates that a coarse mode is driving the aerosol's optical properties. Further details on the Ångström exponent, aerosol size, and their relative error concerning extinction properties are elaborated in the study by Baron et al. (2023) and its supplementary information. The inversion process performed in this study utilized the Klett method (Klett, 1985), assuming a lidar ratio of 60 sr, typical of aged BB aerosols (Müller et al., 2007). Nine lidar profiles recorded during the January–March 2020 period were employed, with the background extinction profile at Réunion constructed from measurements taken between 2017 and 2019, excluding the perturbation induced by the Calbuco eruption in April 2015 (Bègue et al., 2017).
2.1.3 CALIOP
Cloud–Aerosol Lidar with Orthogonal Polarization (CALIOP) is a nadir-pointing lidar that has been orbiting the Earth on board the Cloud–Aerosol Lidar and Infrared Pathfinder Satellite Observation (CALIPSO) satellite since 2006. CALIOP operates at two wavelengths (532 and 1064 nm) and measures total attenuated backscatter vertical profiles with vertical (30–300 m) and horizontal (300–5000 m) resolutions that vary with altitude. In the present study, we used the CALIOP product version 3.3 level 1B, which includes calibrated attenuated backscatter along with collocated meteorological information provided by NASA's Global Modeling and Assimilation Office (GMAO). These data undergo postprocessing using a treatment described and validated by Vernier et al. (2009). Scattering ratio (SR) profiles used for the detection of the smoke plume are calculated following the methodology described by Khaykin et al. (2018). Initially, the collocated GMAO data correct the backscatter profiles of molecular attenuation and ozone absorption. Subsequently, the SR was calculated as the ratio of the total and molecular backscatter coefficients, with the latter derived from the GMAO air density. SR profiles were recalibrated at 36–39 km following the methodology given by Vernier et al. (2009). Data with a depolarization of larger than 30 % were discarded from the treatment in order to avoid aliasing cirrus clouds above the thermal tropopause. CALIOP data were obtained from the Atmospheric Composition Data and Information Services Center (ACDISC) data archive (https://asdc.larc.nasa.gov/project/CALIPSO, last access: 29 June 2024) hosted by NASA's Goddard Space Flight Center.
2.1.4 OMPS-LP
The Ozone Mapper and Profiler Suite Limb Profiler (OMPS-LP) has been operational on the Suomi National Polar-orbiting Partnership (NPP) satellite platform since October 2011. In this study, we utilized aerosol extinction profiles from the NASA OMPS data product version 2.0 (Taha et al., 2021). These profiles were retrieved from the limb-scattered solar radiation measurements at wavelengths of 510, 600, 675, 745, 869, and 997 nm, chosen to minimize the impact of gaseous absorption. Aerosol extinction measurements are provided from 10 to 40 km altitude on a 1 km vertical grid, resulting in near-global coverage every 3–4 d. The OMPS data were employed to investigate the global transport of aerosol BB plumes and their influence on the aerosol variability over Réunion. Following the recommendation of Taha et al. (2021), we used aerosol extinction measurements at 745 nm. The background extinction profile was constructed using measurements obtained from 2012 to 2014 and from 2016 to 2018, excluding periods affected by the Calbuco eruption (Bègue et al., 2015). The OMPS data can be downloaded from https://ozoneaq.gsfc.nasa.gov/ (last access: 10 April 2024).
Additionally, we utilized aerosol absorbing index (AAI) data from OMPS to characterize the transport of the aerosol BB plume. The AAI enables the detection of absorbing aerosols by quantifying the spectral difference between specific pairs of UV wavelengths. Positive AAI values indicate the presence of UV-absorbing aerosols such as dust and smoke, while negative values suggest non-absorbing aerosols. Values close to zero typically correspond to the presence of clouds. The AAI data used in this work are available on the NASA Earth Data platform: https://earthdata.nasa.gov/earth-observation-data (last access: 10 April 2024).
2.2 CO and water vapour measurements
2.2.1 FTIR
Ground-based Fourier-transform infrared (FTIR) spectrometers enable the retrieval of total columns and volume mixing ratio profiles of trace gases like CO with high accuracy and precision (Clerbaux et al., 2008; Vigouroux et al., 2015; Zhou et al., 2019). In the present study, FTIR observations from Lauder and Réunion conducted as part of the framework of the NDACC and Total Carbon Column Observing Network (TCCON), respectively, are utilized. The FTIR systems and data retrieval methods are extensively described by de Mazière et al. (2018) and Wunch et al. (2015).
At Lauder, CO measurements have been made since the early 1990s using a Bruker high-resolution spectrometer over a wide spectral range (around 600–4500 cm−1). The CO dataset used in this study aligns with that used by Bègue et al. (2021) and Kloss et al. (2019) and provides details on spectral measurements, the CO retrieval strategy, and derived CO column abundances. CO total columns and volume mixing ratio profiles for the Lauder site, spanning a 48-layer atmosphere (0.37–100 km a.s.l.), were obtained from the NDACC website (http://www.ndacc.org, last access: 10 April 2024).
At Réunion, FTIR measurements have been routinely conducted since 2011 within TCCON using a Bruker high-resolution spectrometer. The GGG2014 code (Wunch et al., 2015) was employed to simultaneously retrieve CO and O2 total columns. The column-averaged dry-air mole fraction of CO was then determined as the ratio between the retrieved CO total columns and the total columns of dry air, leveraging the O2 total columns provided by TCCON. CO abundance data for Réunion were sourced from the TCCON database (https://tccondata.org, last access: 5 April 2024). For this study, the background evolution of CO is established using measurements obtained between 2015 and 2018 (De Mazière et al., 2017).
2.2.2 IASI
The Infrared Atmospheric Sounding Interferometer (IASI) utilizes a Fourier-transform spectrometer to measure chemical species like CO (Clerbaux et al., 2009; Coheur et al., 2009). Operating aboard the three MetOp satellites, IASI retrieves CO total and partial columns in near-real time from the nadir radiances measured by the instrument in the thermal infrared, covering wavelengths from 6.62 to 15.5 µm. This enables the generation of global distributions for both day and night measurements covering the troposphere and lower stratosphere. Fast Optimal Retrievals on Layers for IASI (FORLI-CO; Hurtmans et al., 2012) was employed to retrieve total and partial CO columns while also flagging data contaminated by clouds. For this study, CO columns from IASI instruments on MetOp-A (operating since 2006) and MetOp-B (operating since 2012) are utilized. The IASI products used in this study can be accessed through the AERIS platform: https://iasi.aeris-data.fr/CO (last access: 10 April 2024).
2.2.3 MLS
The Microwave Limb Sounder (MLS) on board the Aura satellite has been conducting vertical profile measurements of various trace gases in the upper troposphere–lower stratosphere (UT-LS) since 2004 (Waters et al., 2006). For this study, CO and water vapour observations (version 5) from January 2017 to January 2020 were utilized, covering a global domain spanning between 10 and 25° S in latitude and 30 and 60° E in longitude. All MLS version 5 retrieval quality flags (quality, status, convergence, and precision) were meticulously followed for all analyses (Livesey et al., 2022). The recommended pressure levels for science applications with CO and water vapour MLS data range from 0.0215 to 215 hPa (see the version 5.0x level 2 and 3 data quality and description document at https://www.nasa.gov, last access: 10 April 2024). The CO and water vapour profiles from MLS were obtained from the ACDISC archive (ftp://acdisc.gsfc.nasa.gov, last access: 1 April 2024) hosted by the NASA Goddard Space Flight Center.
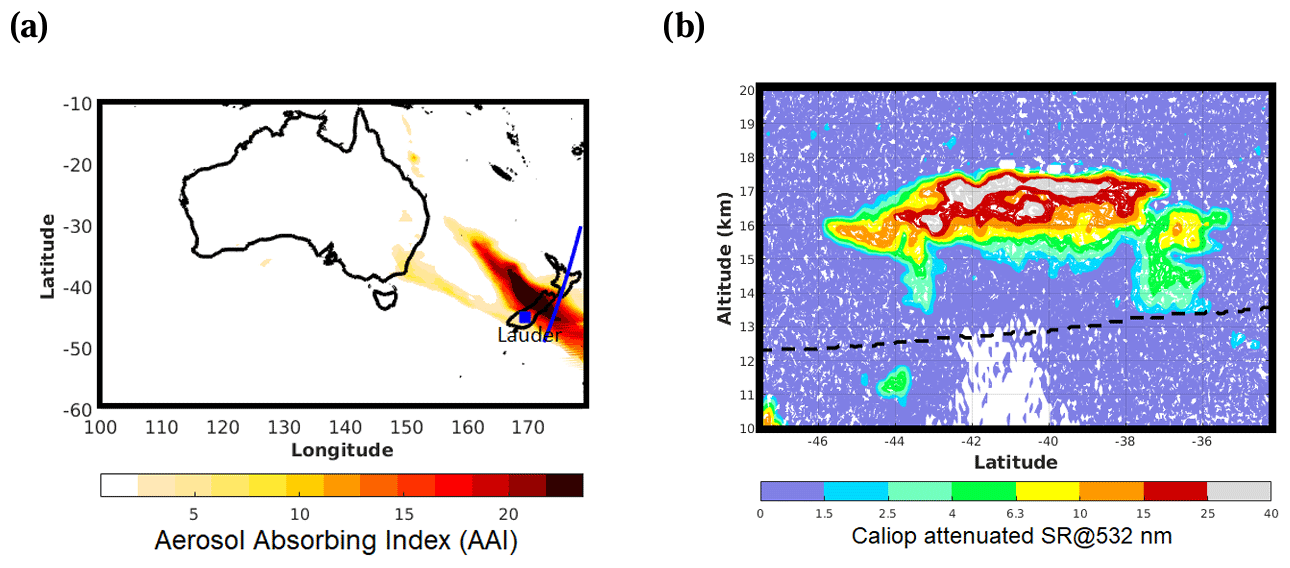
Figure 1(a) Map of aerosol absorbing index obtained from OMPS observations and (b) scattering ratio profiles at 532 nm obtained from CALIOP observations on 1 January 2020. In panel (a), the orbit overpass of CALIOP is indicated by the blue curve, while the blue square corresponds to the Lauder site. The dashed black line in (b) corresponds to the 380 K isentropic level calculated from CALIOP observations.
2.3 Numerical modelling
2.3.1 FLEXPART model
The Lagrangian transport and diffusion model FLEXPART version 10.4 is utilized in this study to simulate the long-range transport of atmospheric tracers (Pisso et al., 2019; Stohl et al., 2005). This version of FLEXPART incorporates improvements in various aspects, including microphysical and chemical parameterizations (Pisso et al., 2019). Source identification was achieved by releasing particles from a receptor location and simulating backward trajectories (Seibert and Frank, 2004). Model calculations rely on ERA5 reanalysis meteorological observations from ECMWF, extracted at 3-hourly intervals with a horizontal resolution of 0.5°×0.5° and a vertical resolution of 137 hybrid model levels (Hersbach et al., 2020).
The model simulations involved aerosol – black carbon (BC) and organic carbon (OC) – and CO tracers and considered removal mechanisms such as dry and wet deposition for aerosols and OH reactions for CO. The parameterization (default values for the scavenging coefficient and the nucleation efficiency and size) for the BC was found in the paper by Grythe et al. (2017), and the chemical parameterization for CO was not found in FLEXPART data but can be found in the International Union of Pure and Applied Chemistry (IUPAC) reference kinetics database (Atkinson et al., 2006). Each simulation consists of 20 000 particles released over Réunion daily at altitudes between 15 and 19 km every 0.5 km, and it traces them backward in time over 1 month. Simulations of backward trajectories over long periods (1–2 months) have been explored in previous studies (Aliaga et al., 2021; Eckhardt et al., 2017; Xu et al., 2021). The simulations included turbulence parameterization and convection activation (Forster et al., 2007).
Model outputs were distributed over a regular vertical grid from ground level to 25 km in altitude. These outputs were used to assess the residence times of the BB aerosols and CO, as well as their contributions to the variability of aerosol optical properties and CO over the SWIO basin. Discussions were based on emission sensitivity analysis using backward simulations. The residence time of particles was integrated over the entire atmospheric column and latitude to create averaged maps and longitudinal cross-sections, providing insights into the geographical and vertical dispersion of BB aerosols.
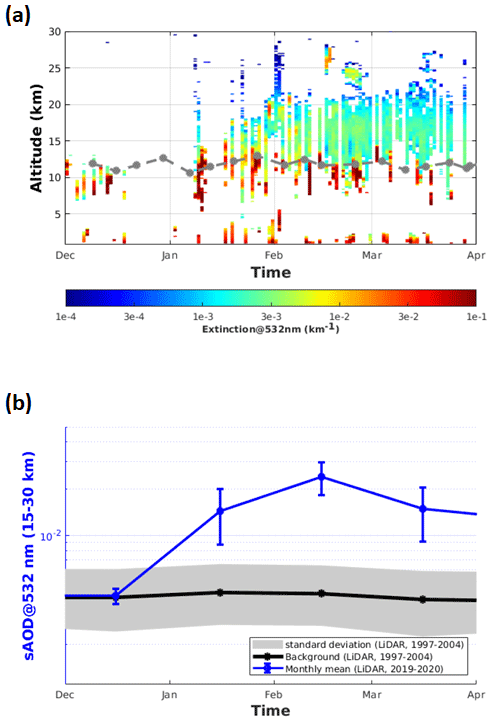
Figure 2Time series of (a) daily profiles of aerosol extinction and (b) monthly means of the stratospheric AOD (sAOD; between 15 and 30 km) at 532 nm obtained from lidar observations made between 1 December 2019 and 1 April 2020. In order to screen non-aerosol contributors (such as clouds) to the extinction measurements, a mask based on the method reported by Nicolae et al. (2013), which considers plausible aerosol properties, was used. Specifically, we only kept profile parts with positive depolarization values, and the Ångström exponent ranges from 0.1 to 4. The grey line indicates the tropopause height obtained from radiosonde measurements. The background evolution of aerosol data and the associated standard deviation are shown by the black line and grey area, respectively.
The BB contributions to the vertical distribution of CO and the aerosol optical properties were calculated by combining the potential emission sensitivity (PES) with an emission inventory, as explained in Stohl et al. (2003). The PES represents FLEXPART particles injected at the layer or altitude of emissions. Pyro-convection was not considered in the model. BB aerosol and CO mass concentration profiles were obtained by summing all output grid points. For BB emissions, the layer between 0 and 3 km was used for Africa and the layer between 9 and 16 km was used for Australian fires.
The Global Fire Assimilation System (GFAS) version 1.2 emission inventory (Kaiser et al., 2012) and the Global Air Pollutant Emissions – EDGAR v6.1 (Emission Database for Global Atmospheric Research) emission inventory (http://edgar.jrc.ec.europa.eu, last access: 10 April 2024) for CO were utilized. These emissions represent the total CO emissions from anthropogenic activities, excluding large-scale BB. Multiplying the CO emission flux from this inventory by the FLEXPART emission sensitivity for a layer between 0 and 1 km provides the contribution of anthropogenic sources to the total CO abundance. Finally, aerosol mass concentration profiles are converted into extinction profiles using the Mie scattering model, considering spherical particles with a density of 2 g cm−3 and a refractive index of 2.0+0.64i for optically absorbing aerosols.
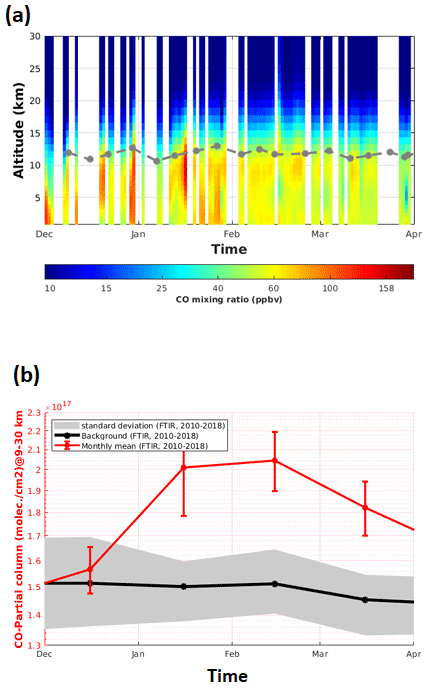
Figure 3Time series of (a) daily profiles of CO mixing ratio and (b) monthly means of the partial column of CO (between 9 and 30 km) obtained from FTIR at Lauder between 1 December 2019 and 1 April 2020. The background evolution of the partial column of CO and the associated standard deviation are shown as the black line and grey area, respectively.
2.3.2 MIMOSA model
The Modèle Isentropique de transport Mésoéchelle de l'Ozone Stratosphérique par Advection (MIMOSA) is a potential vorticity (PV) advection model designed to run on isentropic surfaces with a resolution of 0.3°×0.3° (Hauchecorne et al., 2002). Its advection scheme is semi-Lagrangian with a time step of 1 h and is driven by ERA5 reanalysis meteorological observations. The model can be continuously run to track the evolution of PV filaments over several months. The accuracy of the MIMOSA model has been evaluated and validated in previous studies. Hauchecorne et al. (2002) assessed its accuracy, and it was validated against airborne lidar ozone measurements using a correlation between PV and ozone, as ozone behaves as a quasi-conserved chemical tracer on timescales of a week or so within most of the lower stratosphere (Heese et al., 2001). Moreover, the MIMOSA model can be used to determine the origin of the air masses influencing a given site, similar to an isentropic Lagrangian trajectory model. This capability has been demonstrated in various studies (Bencherif et al., 2011; Hauchecorne et al., 2002; Portafaix et al., 2003; Bègue et al., 2017).
Figure 1 shows the AAI obtained from OMPS on board CALIOP over New Zealand on 1 January. Following the strongest outbreak during New Year's Eve, a wide plume of BB aerosol with large values of AAI (higher than 12) is transported toward the Tasman Sea on 1 January 2020 (Fig. 1a). The CALIOP attenuated SR profiles are calculated along the CALIOP track (blue line in Fig. 1a) that crosses the absorbing aerosol plume above New Zealand. The CALIOP observations reveal a broad region of high values (ranging from 10 to 25) between 36 and 46° S that are centred at 16.5 km altitude (Fig. 1b).
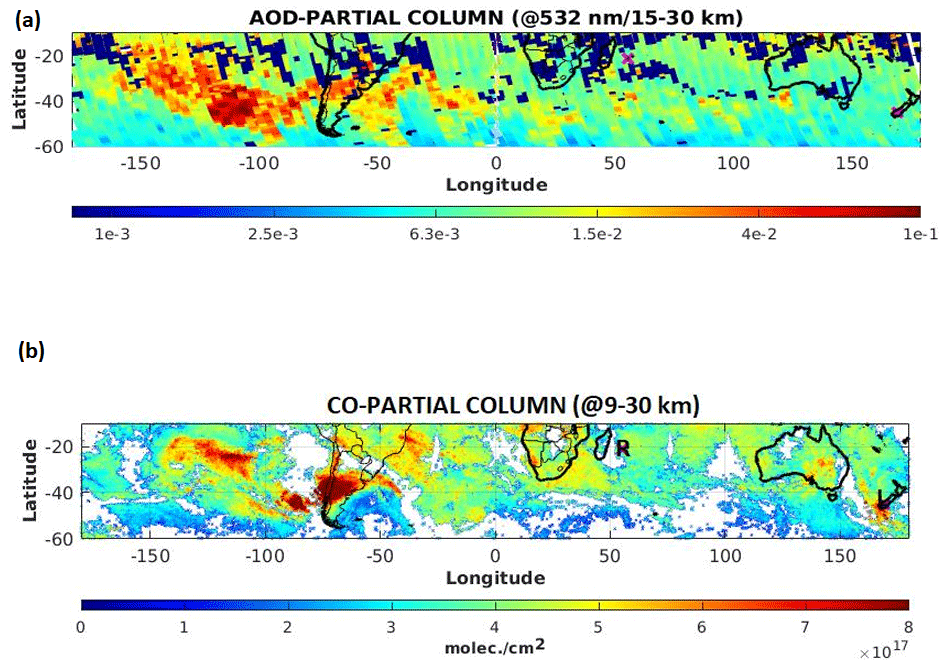
Figure 4Time-averaged (from 9 to 16 January 2020) maps of (a) sAOD (between 15 and 30 km at 532 nm) obtained from OMPS observations and (b) the partial column of CO (averaged between 9 and 30 km) obtained from IASI observations. The locations of the Réunion and Lauder sites are indicated by “R” and “L”, respectively.
Figure 2a illustrates the daily extinction profiles at 532 nm derived from lidar measurements over Lauder (New Zealand) between 1 December 2019 and 1 April 2020. Note that strong convective activity prevented lidar operations between mid-December 2019 and 1 January 2020. Figure 2a reveals high values for the extinction in the stratosphere over Lauder starting in mid-January 2020 (from to km−1) that are 1 order of magnitude above the typical stratospheric aerosol background (Sakai et al., 2016). The vertical extent of the plume increased significantly between mid-January and 1 April 2020, with the aerosol layer spanning from 11.5 to 20 km. The ascent of the BB aerosol could be due to an adiabatic heating effect (De Laat et al., 2012). A statistically significant increase in sAOD (between 15 and 30 km) is observed in January 2020 (2.5 times higher than background value) and is still visible in April 2020 with same amplitude (Fig. 2b).
The same observation can be made for the carbon monoxide in the UT-LS over New Zealand, as shown in Fig. 3, based on observations made by the FTIR spectrometer at Lauder. Prior to the convective period, the maximum CO mixing ratio (120–130 ppbv) is observed in the troposphere (Fig. 3a). An increase in the CO mixing ratio in the lower stratosphere is visible from mid-December 2019, with the maximum (50–90 ppbv) observed in the UT-LS (9–13 km). The partial column of CO (between 9 and 30 km), calculated from the FTIR data, reaches its maximum values (∼33 % higher than the background value) in January 2020 and slightly decreases in April 2020 (∼24 % higher than the background value) (Fig. 3b). Above the lower stratosphere, the CO mixing ratio decreases significantly due to photochemical reactions which are more efficient with altitude (Brasseur and Solomon, 2005).
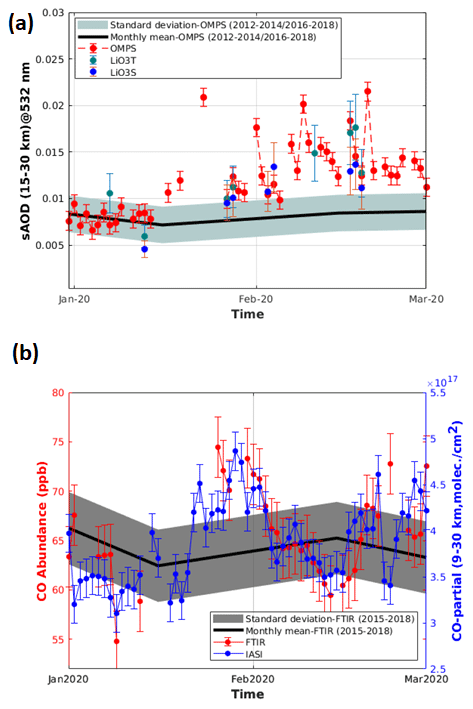
Figure 5Daily mean evolution of aerosol (a) and CO (b) abundances obtained from ground-based and satellite observations at Réunion between 1 January and 1 March 2020. The partial column () and abundance (ppb) of CO obtained from IASI (blue line) and FTIR (red line) data, respectively, are given in the lower panel (b), while the sAOD obtained from OMPS (red line) and lidar (blue and green dots) is given in the upper panel (a). The black line and shaded region correspond to the monthly mean and the associated standard deviation calculated for the background period, respectively.
Our works suggest that the injected CO and absorbent aerosols end up de-correlated in altitude, given their different properties. In order to extend this discussion, the spatial dispersion of the Australian BB plume in the Southern Hemisphere will be discussed in the next section.
4.1 Aerosol and CO variability over a subtropical site: Réunion
Figure 4 shows time-averaged maps of AOD from OMPS and CO partial column (9–30 km) from IASI observations. The transport of the aerosol (with values ranging from to km−1) and CO (with values ranging from 6 to 8×10¹⁷ ) plume over the southern Pacific occurred mainly within the 18–60° S latitudinal band. One can observe an aerosol band (with values ranging from to km−1) across the Southern Hemisphere between 40 and 60° S during the period from 9–16 January 2020 (Fig. 4a). The Australian aerosol plume circled the Southern Hemisphere during the first 2 weeks of January 2020. The same conclusion cannot be made for CO from spaceborne observations (Fig. 4b). One can observe weak values of CO (less than 5×10¹⁷ ) over the southern Atlantic that are not significantly linked with the large plume observed over the southern Pacific (Fig. 4b).
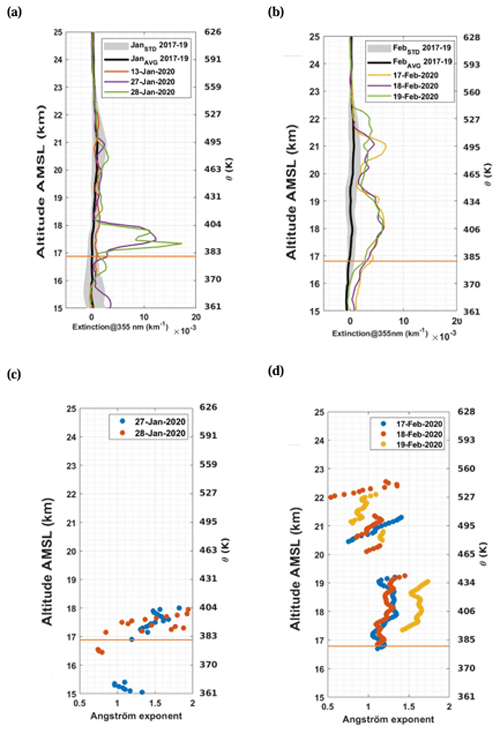
Figure 6Aerosol extinction (at 355 nm) (a, b) and the Ångström exponent (355–532 nm) (c, d) obtained from lidar observations at Réunion in the months of January and February 2020. The tropopause height is indicated by the horizontal orange lines.
Figure 5a depicts the evolution of the sAOD (between 15 and 30 km) at 532 nm calculated from ground-based lidar and OMPS observations over Réunion from 1 January to 1 March 2020. OMPS extinctions are converted to 532 nm using an Ångström exponent for the 532–745 nm wavelength pair of 1.9, as prescribed by Taha et al. (2021). Réunion witnessed an abrupt increase in the aerosol loading (3 times the typical background) as of 16 January 2020, according to satellite observations. The sAOD values observed between 16 January and 1 March 2020 are higher than those observed during the passage of the Calbuco plume over the Réunion site, which did not exceed 0.013 (Bègue et al., 2017). The increase in sAOD in mid-January coincided with an increase in CO, as shown in Fig. 5b based on the use of partial columns (between 9 and 30 km) and the CO abundance from IASI and FTIR data at the same site over the same period. The ground-based observations show that the CO abundance observed during this increased phase is on average 20 % higher than the values observed during the background period (Fig. 5b). The evolution of the sAOD and CO observations in mid-January suggests that Réunion and its surroundings were influenced by the transport of the Australian BB plume.
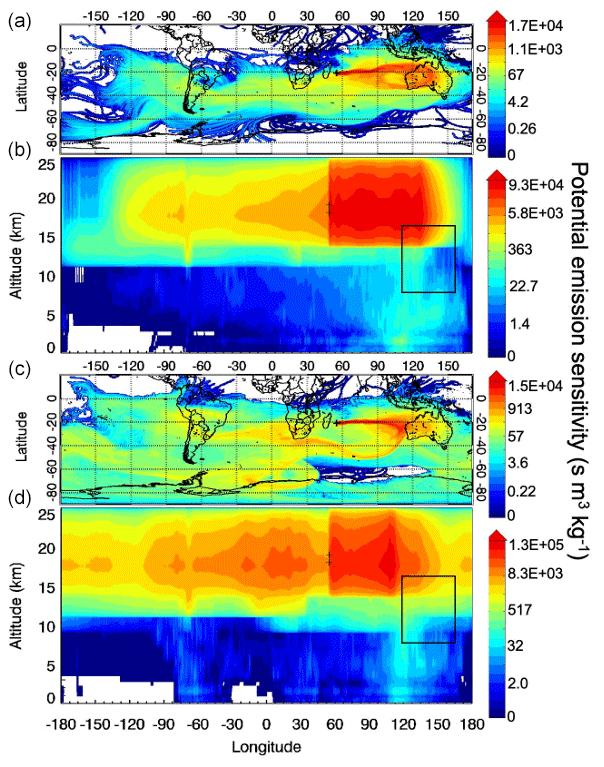
Figure 7FLEXPART 30 d back trajectories initialized from Réunion (black cross) at 18 km on 27 January 2020 (a, b) and 28 January 2020 (c, d). Panels (a) and (c) correspond to the integration of the trajectory positions over the whole altitude range. Panels (b) and (c) show the vertical views integrated over the whole latitude ranges of the back trajectories in (a) and (c), respectively. The black rectangle represents the injection height of the BB aerosols.
Figure 6 shows aerosol extinction profiles at 355 nm over Réunion for selected days in January or February compared to the January or February background profiles. The first 2 weeks of January 2020 are representative of the typical background in January (shaded area), as illustrated for 13 January 2020 (Fig. 6a). Conversely, the extinction profiles at the end of January 2020 (27 and 28 January) are marked by a significant increase (4 times higher than the background values) in the lower stratosphere between 16.8 and 18 km altitude (equivalent to potential temperature levels of 380–404 K). On 28 January, the extinction profile exhibits a sudden increase at 17.4 km (∼400 K) but quickly decreases afterwards to values observed the previous day (Fig. 6a). The values of extinction (10 to km−1) observed in the lower stratosphere on these 2 d are of the same order as those observed at Lauder a few days after the pyro-convective event (Fig. 2). In February, the extinction profiles clearly exhibit two significant aerosol layers, with the first one located between 16 and 19.5 km (370–440 K) and the second one between 20 and 22.5 km (465–500 K) (Fig. 6b).
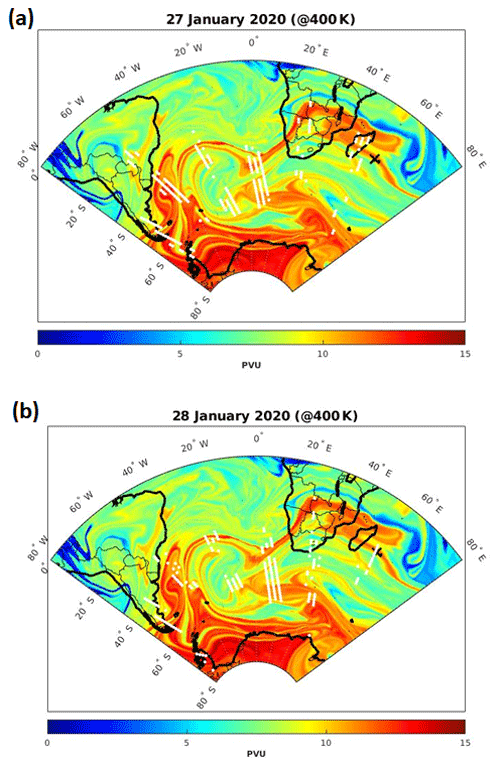
Figure 8Advected PV map at the 400 K level obtained from the MIMOSA model (a) for 27 January 2022 and (b) for 28 January 2022. The white dots represent the localization of the aerosol plume at 400 ± 5 K obtained from OMPS observations, while the black cross indicates Réunion.
To further discuss the optical properties of these aerosol layers, the Ångström exponent has been calculated between 355 and 532 nm from the ground-based lidar measurements (Fig. 6c and d). In February, the Ångström exponent values reveal that the two aerosol layers consist mainly of small aerosol particles (Fig. 6d), consistent with a stratospheric smoke layer (Haarig et al., 2018; Hu et al., 2019; Ohneiser et al., 2021). In January, the profile of the Ångström exponent exhibits more variability in the UT-LS (Fig. 6c), with values ranging from 0.6 to 1.9 on 27 and 28 January. The wide range of Ångström exponent values suggests that the aerosol layer is not homogeneously distributed at this stage and might be interpreted as a mixture of fresh and aged smoke layers (Fig. 6c). Indeed, Müller et al. (2007) showed that the ageing of transported smoke translates into a decrease in the Ångström exponent. This may indicate growth and removal processes (e.g. coagulation, condensation, and sedimentation) which can modulate the morphology and mixing state of the aerosol layer during its transport (Burton et al., 2015; Hamil et al., 1997).
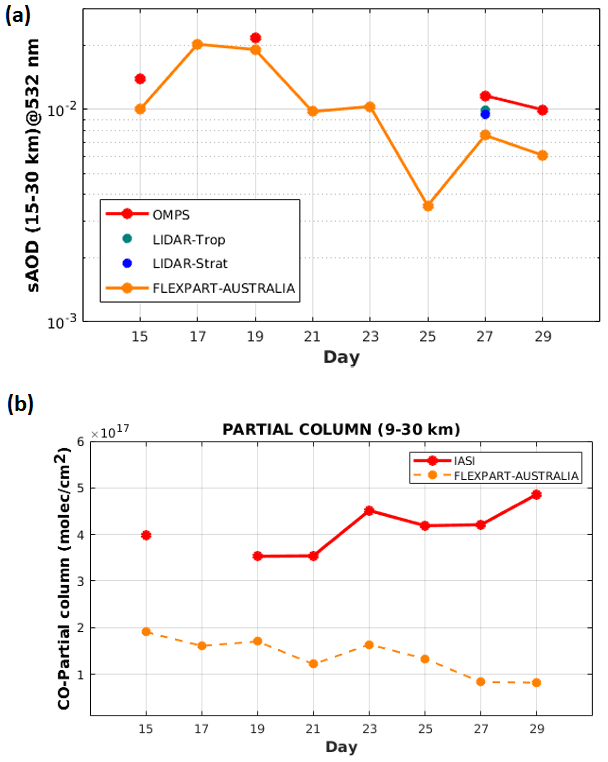
Figure 9(a) Daily evolution of sAOD (calculated between 15 and 30 km at 532 nm) obtained from OMPS-LP (red line) and lidar (blue dots) and simulated by FLEXPART (orange line) over Réunion from 15 to 29 January 2020. (b) Daily evolution of the partial column (calculated between 9 and 30 km) of CO observed by IASI (red line) and simulated by FLEXPART (orange line) over Réunion from 15 to 29 January 2020. The CO evolution is simulated by FLEXPART, with only the CO emissions (including BB and anthropogenic activity) considered from among the Australian emissions. The simulated sAOD is calculated by considering only the aerosol emissions (BC and OC) from among the Australian emissions.
4.2 Origin of the air masses
To analyse the origin of the air masses at Réunion on 27 and 28 January, 1-month backward trajectories were calculated using FLEXPART (Aliaga et al., 2021; Eckhardt et al., 2017; Xu et al., 2021). A period of 1 month was chosen because it refers to the time lapse separating the pyro-convective outbreak event and the day of the measurement at Réunion. The representation of the potential emission sensitivity (PES) from back-trajectory simulations initialized at 18 km and originating from Réunion on 27 and 28 January 2020 is presented in Fig. 7.
Figure 7a and c display the horizontal trajectories, whereas vertical movement is shown in Fig. 7b and d, respectively. The vertical transect of FLEXPART back trajectories in Fig. 7b confirms a high probability of an air mass contribution from Australia if the fire emissions are directly injected into the stratosphere by convection (black rectangle in the figure), i.e. injection into the layer from 9 to 16 km is used for the PES; see Sect. 2.3.1. According to the FLEXPART results, part of the Australian smoke layer is advected zonally by the prevailing easterly winds and is observed over Réunion on 27 and 28 January 2020 at 18 km. The FLEXPART simulations also suggest that Réunion is influenced by eastward transport of air masses. This pathway is clearly visible on 28 January 2020 (Fig. 7c and d). Air masses from high latitudes seem to cross the subtropical latitudes along a wave-shaped path and reach the SWIO basin by passing over the Cape of Good Hope (Fig. 7c).
In order to delve further into this eastward transport of air masses over the SWIO basin, the MIMOSA model has been used to produce a continuous evolution of PV fields for the period from 1 to 31 January 2020 for the 400 K isentropic level. The localization of the aerosol plume obtained from OMPS observations at the 400 ± 5 K isentropic level is also superimposed (Fig. 8). The 400 K isentropic level is chosen according to the layers observed in the extinction profiles over Réunion between the 390 and 404 K isentropic levels on 27 and 28 January 2020 (Fig. 6a). Air masses from mid-latitudes (40–60° S) cross the subtropical latitudes (20–40° S) and are advected eastward between South Africa and Madagascar along a wave-shaped path (Fig. 8). Given that the Australian BB aerosol is mainly located in the mid-latitudes (Fig. 4a), we can reasonably conclude that the filament reaching the SWIO basin contains aerosol from the Australian BB event. On 27 January, air masses containing aerosol are observed at Madagascar and its surroundings (Fig. 8a). These air masses are advected eastward and reach Réunion on 28 January (Fig. 8b).
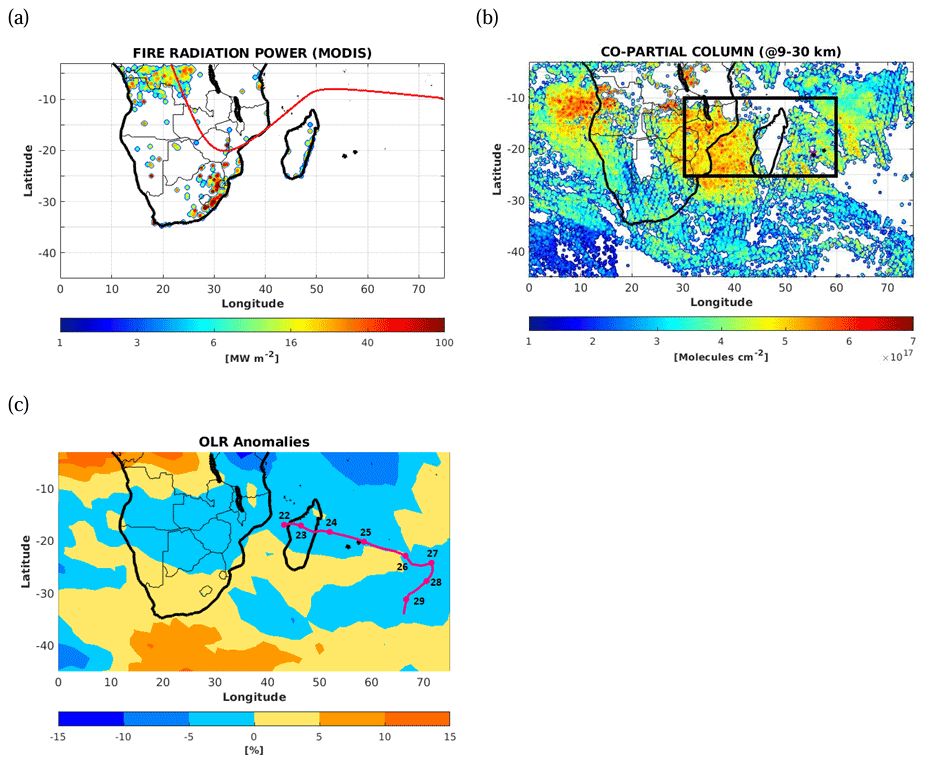
Figure 10(a) The total number of fire pixels and the associated fire radiative power obtained from MODIS observations made between 16 and 29 January 2020. The red line indicates the average position of the ITCZ (from Lashkari et al., 2017). (b) Time-average map of the partial column of CO (calculated between 9 and 30 km) obtained from IASI observations averaged between 16 and 29 January 2020. The black square corresponds to the study domain where the vertical cross-section of CO and the water vapour mixing ratio are calculated and reported in Fig. 11. (c) Time-average map of outgoing longwave radiation anomalies obtained from the National Centers for Environmental Prediction (NCEP) between 16 and 29 January 2020. The red curve corresponds to the trajectory followed by the strong tropical storm Diane from 22 to 29 January 2020. This trajectory was obtained from the RSMC (Regional Specialized Meteorological Center) of Réunion best-track database.
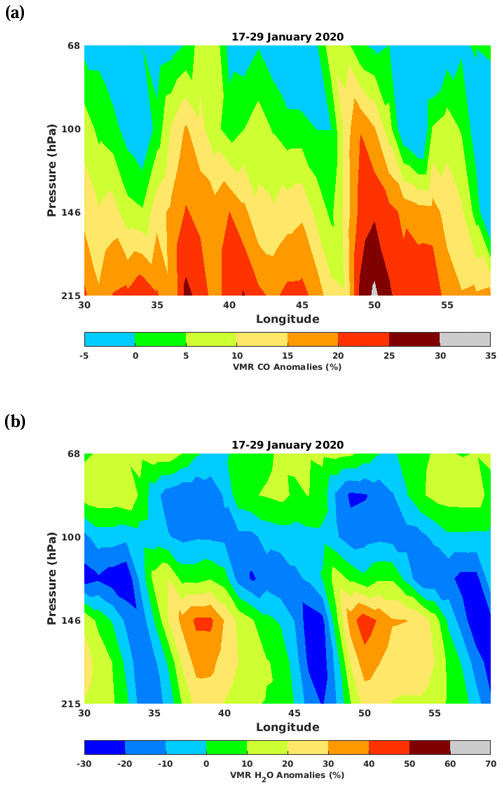
Figure 11Vertical cross-sections of (a) CO and (b) water vapour mixing ratio anomalies obtained from MLS observations over southern Africa and the SWIO basin (black box in Fig. 10b) between 16 and 29 January 2020.
Our analysis demonstrated that the Australian BB plume was transported over the SWIO basin along two distinct pathways.
4.3 Contribution of the Australian BB plume to the CO and aerosol variability
Because a significant simultaneous increase in CO and sAOD is observed over Réunion and its surroundings from 16 to 29 January 2020, the investigation will focus on this period. The emission sensitivity from FLEXPART at the altitude where the emissions are injected is combined with the CO and aerosol (BC and OC) emission inventory. The CO emissions due to anthropogenic activity are also taken into account by coupling the FLEXPART model with the EDGAR inventory information. The simulated sAOD compares fairly well with the available satellite observations during the 15–29 January period, and the peak observed in mid-January is acceptably well reproduced. Conversely, the partial column of CO seems less consistent with the observations made by IASI.
The discrepancies between FLEXPART and observations may be attributable to several possible caveats. One could be the lack of the vertical motion induced by pyro-convection in FLEXPART. We tested this issue by applying an injection height in agreement with CALIOP observations (9–16 km, Fig. 1) for the Australian plume (Khaykin et al., 2020). The injection height of the plume plays a key role in its long-range transport (Sofiev et al., 2012). An inappropriate or unrealistic injection height can lead to either a dilution or an overestimation of the plume. The injection height depends on the intensity of the fire as well as on the meteorological conditions. Another possible explanation for these differences could come from the duration of the backward calculation (1 month) and an underestimation of the emission by GFAS (Brocchi et al., 2018). Using FLEXPART simulations, Brocchi et al. (2018) revealed that an amplification factor of 2 can be applied to CO emissions from GFAS to obtain CO quantities comparable with observations. The other source of difference between the model and the observations stems mainly from whether or not FLEXPART takes several regions into account as a source of pollution. The results shown in Fig. 9 target emissions from Australia only. The contribution of other regions is discussed in Sect. 5.
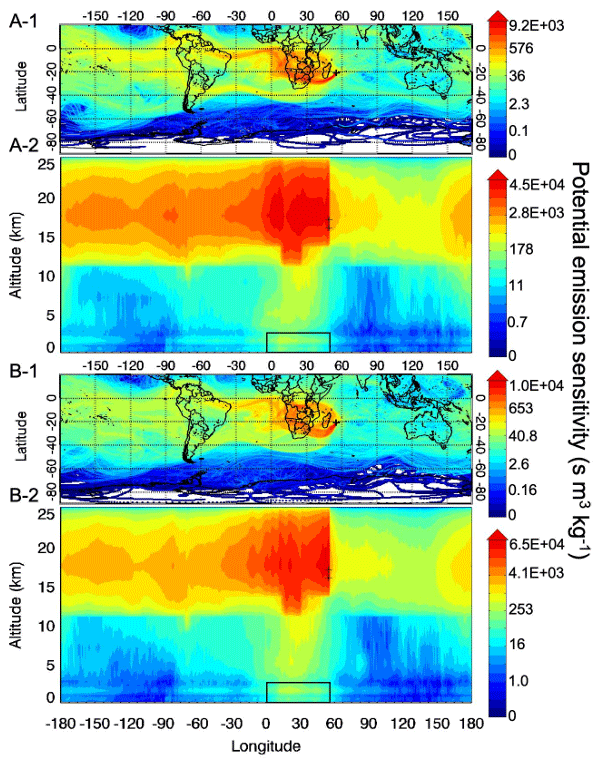
Figure 12Same as Fig. 7 but with the injection height initialized at 16 km.
On average, the aerosol emissions from Australia contributed up to 95 % of the sAOD variability over Réunion from 15 to 29 January (Fig. 9a). Conversely, the CO emissions from Australia contributed up to 10 % of the enhancement of the partial column of CO from 15 to 29 January (Fig. 9b). Therefore, the CO plume induced by Australian sources is not efficiently transported over the SWIO basin. The variability in CO over the SWIO basin in January is therefore not significantly driven by emissions from Australian fires.
The fire radiation power (FRP) gives quantitative information on the combustion rate and intensity (Fig. 10a). The sparse activity of African fires in January is clearly illustrated in Fig. 11a, with moderate values of FRP ranging from 20 to 200 MW m−2. These values are 10 times lower than those observed over southeastern Australia between 30 December 2019 and 12 January 2020 (Bègue et al., 2021). The off-season African BB activity in January 2020 is mainly located over the northwestern (near the Equator) and southeastern sides of southern Africa. The most intense values (100–200 MW m−2) are observed over the southeastern side.
Despite this sparse activity of BB, the amount of CO injected into the atmosphere is fairly significant (from 5 to 6×10¹⁷ ), as shown in Fig. 10b. The partial column of CO (between 9 and 30 km) over southern Africa from 16 and 29 January is characterized by two regions of high values (higher than 5×10¹⁷ ; Fig. 10b). The first region stretches between the eastern side of southern Africa and the western side of Madagascar, which corresponds to a domain extending between 10 and 25° S in latitude and between 30 and 45° E in longitude (Fig. 10b). The second region is located on the opposite side, over a domain extending between latitudes 10 and 15° S and longitudes 5 and 15° E.
The main convective regions presenting negative outgoing longwave radiation anomalies are located in mainland Africa between 12 and 25° S and on the northern side of the SWIO basin between 16 and 29 January, as shown in Fig. 10c, based on observations obtained from the National Centers for Environmental Prediction (NCEP). The daily brightness temperature values obtained from MODIS during the same period (not shown) range from 195 to 210 K over the eastern side of southern Africa and the northern tip of Madagascar. These values of brightness temperature can be attributed to deep convection clouds (Héron et al., 2020; Young et al., 2013).
On average, the motion of the ITCZ over southern Africa in January is characterized by southward motion from 5° N to 20° S in latitude and between 20 and 35° E in longitude (Fig. 10a; Lashkari et al., 2017). A tropical depression formed near the northwestern side of Madagascar between 20 and 22 January 2020. This tropical depression reached the stage of a strong tropical storm on 24 January 2020 and was named Diane by the RSMC of Réunion. The tropical depression intensified into a strong tropical storm around the northern tip of Madagascar. Diane passed near Réunion on 25 January 2020 (Fig. 10c). The convective activity over southern Africa and the SWIO basin may hence be due to both the proximity of the ITCZ and the activity of Diane.
To further investigate the convection-driven pathway, the vertical cross-sections of the CO and water vapour mixing ratio anomalies calculated from MLS observations between 16 and 29 January 2020 are analysed (Fig. 11a and b). The CO and water vapour mixing ratio anomalies are calculated as relative differences by considering the monthly background means as the reference values. The calculations are performed over a domain extending between 10 and 25° S in latitude and 30 and 60° E in longitude (the black box in Fig. 10b). This domain includes both the region of deep convection and the first region of high values of CO. The monthly background is calculated from available MLS observations in January between 2017 and 2019. Figure 12a exhibits two regions of high values of CO mixing ratio anomalies (higher than 15 %) centred at 37 and 50° E in longitude at 146 hPa (∼15 km) and 100 hPa (∼17 km). These regions of CO mixing ratio anomalies are coincident with two regions of high values (higher than 20 %) of water vapour mixing ratio anomalies (Fig. 11b). This is consistent with the FLEXPART simulations shown in Fig. 12, which highlight a lifting of air masses from the lower troposphere to the lower stratosphere between 25 and 55° E in longitude. The convective activity induced by Diane near Madagascar may have contributed to the lifting of air masses enriched in CO from the lower troposphere.
Figure 9 also depicts the evolution of the contribution of African emissions to CO partial columns obtained from satellite observations and simulated by FLEXPART from 15 to 29 January over Réunion. An injection height ranging up to 3 km was chosen for the African fires (Labonne et al., 2007). The Australian contribution to the observed partial column was also plotted (as in Fig. 9). On average, the CO emissions from Africa contribute up to 90 % of the enhancement of the partial column of CO from 15 to 29 January (Fig. 13b). The total CO contribution from Africa and Australia reproduces the observations fairly well.
Our results suggest that the variability in the CO over the SWIO basin can be explained by the influence of regional transport from southern Africa enhanced by convective activity due to the passage of a tropical storm.
The complex aerosol and CO variabilities over the SWIO basin during the 2020 austral summer have been investigated. The meteorological context and the extensive fires over southeastern Australia were favourable for triggering pyro-convective events between 29 December 2019 and 12 January 2020. These pyro-convective events led to a massive injection of combustion products into the stratosphere. The ground-based and spaceborne lidars revealed the presence of an intense stratospheric aerosol layer over the southeastern Australia region. Over the Lauder site in New Zealand, this smoke layer was detected in the stratosphere (centred at 16 km) until at least April. The analysis of the spatial and temporal dispersion of the Australian BB plume highlighted that it was quickly transported – it circled the entire Southern Hemisphere in less than 2 weeks. Furthermore, the satellite observations revealed that the transport of the Australian smoke layer occurred mainly within an extratropical latitudinal band.
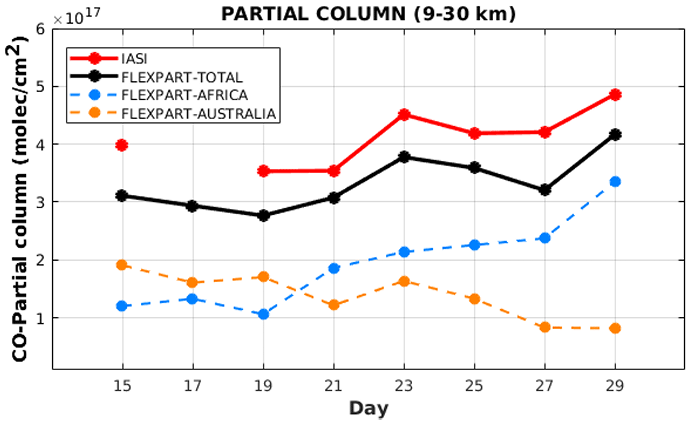
Figure 13Daily evolution of the partial column (calculated between 9 and 30 km) of CO observed by IASI (red line) and simulated by FLEXPART (black line) over Réunion from 15 to 29 January 2020. The CO evolution was simulated by FLEXPART considering only the CO emissions (including BB and anthropogenic activity). The contributions from the African and Australian emissions are shown as a cyan line and an orange line, respectively.
Nevertheless, the numerical models clearly showed the influence of the Australian smoke layer on the variability of aerosol over the SWIO basin. Over Réunion, the aerosol extinction profiles exhibited a significant increase in the lower stratosphere during the end of January. The MIMOSA simulations highlighted the isentropic transport of the Australian BB aerosol from extratropical latitudes to Réunion at the 400 K isentropic level on 28 January. As a consequence, the corresponding aerosol extinction profile exhibited a sudden increase, leading to a structure similar to laminae, at the 400 K isentropic level. The aerosol extinction profiles also exhibited a moderate increase in the upper troposphere.
According to our simulations, the CO variability over the SWIO cannot be explained by the Australian Black Summer. Rather, the CO in the UT-LS is likely driven by African BB emissions during the convective season. The analysis of satellite observations and FLEXPART simulations suggests that, because of the convective activity, air masses enriched in CO were lifted from the lower troposphere to the lower stratosphere. Air masses from Africa contributed up to 90 % of the variability in the partial column (between 9 and 30 km) of CO over Réunion and its surroundings. The simulations show that the modulation of the CO and aerosol extinction in the upper troposphere and the lower stratosphere over Réunion was driven by the transport of air masses from Africa and Australia, respectively.
The data used for this study are open-access and available on request from particular authors or through specific links: the lidar measurements can be requested via tetsu@mri-jma.go.jp and nelson.begue@univ-reunion.fr, the FTIR measurements from TCCON can be requested via mahesh.sha@aeronomie.be, the Lauder FTIR data are available from the NDACC public-access database at https://www-air.larc.nasa.gov/missions/ndacc/data.html (NASA, 2024), and the satellite observations and the emissions inventory used are available online from the sources stated in the manuscript. The FLEXPART and MIMOSA codes are available on the FLEXPART (https://www.flexpart.eu/, ZAMG, 2024) and AERIS (http://espri.aeris-data.fr/, ESPRI, 2017) websites, respectively.
Conceptualization, NB; methodology and software, NB, AB, and GK; validation and data curation, NB, AB, GK, SK, CC, PFC, DS, JR, RQ, BL, TS, and PS; original draft preparation and writing, NB. The FLEXPART and MIMOSA simulations were performed by GK and NB, respectively. All authors have read and agreed to the published version of the paper.
The contact author has declared that none of the authors has any competing interests.
Publisher's note: Copernicus Publications remains neutral with regard to jurisdictional claims made in the text, published maps, institutional affiliations, or any other geographical representation in this paper. While Copernicus Publications makes every effort to include appropriate place names, the final responsibility lies with the authors.
Data used in this publication were obtained from the NDACC network and are available through its website (http://www.ndacc.org/, last access: 10 April 2024).
The work of Sergey Khaykin was supported by the Agence Nationale de la Recherche project PyroStrat (grant no. 21-CE01-335 0007-01). The French research infrastructure of ACTRIS-FR and CNES is also acknowledged for their support in the upgrade and operation of the Maïdo Observatory lidars. Lauder observations are funded by the New Zealand Government's Strategic Science Investment Fund (SSIF), administered by the Ministry of Business, Innovation and Employment (MBIE). The TCCON site at Réunion Island is operated by the Royal Belgian Institute for Space Aeronomy, with financial support from the EU project ICOS-Inwire since 2014, the ministerial decree for ICOS (grant nos. FR/35/IC1 to FR/35/C6), and the ESFRI-FED ICOS-BE project, with local activities supported by the Université de La Réunion (grant nos. LACy/UMR8105 and OSU-R/UMS3365). The lidar measurements at Lauder are supported by funding from the GOSAT series project. This study is integrated and supported by the CNES project Extra-Sat.
This paper was edited by Suvarna Fadnavis and reviewed by two anonymous referees.
Aliaga, D., Sinclair, V. A., Andrade, M., Artaxo, P., Carbone, S., Kadantsev, E., Laj, P., Wiedensohler, A., Krejci, R., and Bianchi, F.: Identifying source regions of air masses sampled at the tropical high-altitude site of Chacaltaya using WRF-FLEXPART and cluster analysis, Atmos. Chem. Phys., 21, 16453–16477, https://doi.org/10.5194/acp-21-16453-2021, 2021.
Andreae, M. O. and Merlet, P.: Emission of trace gases and aerosols from biomass burning, Global Biogeochem. Cy., 15, 955–966, 2001.
Atkinson, R., Baulch, D. L., Cox, R. A., Crowley, J. N., Hampson, R. F., Hynes, R. G., Jenkin, M. E., Rossi, M. J., Troe, J., and IUPAC Subcommittee: Evaluated kinetic and photochemical data for atmospheric chemistry: Volume II – gas phase reactions of organic species, Atmos. Chem. Phys., 6, 3625–4055, https://doi.org/10.5194/acp-6-3625-2006, 2006.
Baray, J.-L., Leveau, J., Baldy, S., Jouzel, J., Keckhut, P., Bergametti, G., Ancellet, G., Bencherif, H., Cadet, B., Carleer, M., David, C., De Mazière, M., Faduilhe, D., Godin-Beekmann, S., Goloub, P., Goutail, F., Metzger, J.-M., Morel, B., Pommereau, J.-P., Porteneuve, J., Portafaix, T., Posny, F., Robert, L., and Van Roozendael, M.: An instrumented station for the survey of ozone and climate change in the southern tropics, J. Environ. Monit., 8, 1020–1028, https://doi.org/10.1039/b607762e, 2006.
Baray, J.-L., Courcoux, Y., Keckhut, P., Portafaix, T., Tulet, P., Cammas, J.-P., Hauchecorne, A., Godin Beekmann, S., De Mazière, M., Hermans, C., Desmet, F., Sellegri, K., Colomb, A., Ramonet, M., Sciare, J., Vuillemin, C., Hoareau, C., Dionisi, D., Duflot, V., Vérèmes, H., Porteneuve, J., Gabarrot, F., Gaudo, T., Metzger, J.-M., Payen, G., Leclair de Bellevue, J., Barthe, C., Posny, F., Ricaud, P., Abchiche, A., and Delmas, R.: Maïdo observatory: a new high-altitude station facility at Reunion Island (21° S, 55° E) for long-term atmospheric remote sensing and in situ measurements, Atmos. Meas. Tech., 6, 2865–2877, https://doi.org/10.5194/amt-6-2865-2013, 2013.
Baron, A., Chazette, P., Khaykin, S., Payen, G., Marquestaut, N., Bègue, N., and Duflot, V.: Early Evolution of the Stratospheric Aerosol Plume Following the 2022 Hunga Tonga-Hunga Ha'apai Eruption: Lidar Observations From Reunion (21° S, 55° E), Geophys. Res. Lett., 50, e2022GL101751, https://doi.org/10.1029/2022GL101751, 2023.
Barthe, C., Bousquet, O., Bielli, S., Tulet, P., Pianezze, J., Claeys, M., and Zucule, J.: Impact of tropical cyclones on inhabited areas of the swio basin at present and future horizons. Part 2: Modeling component of the research program renovrisk-cyclone, Atmosphere, 12, 689, https://doi.org/10.3390/atmos12060689, 2021.
Bègue, N., Tulet, P., Pelon, J., Aouizerats, B., Berger, A., and Schwarzenboeck, A.: Aerosol processing and CCN formation of an intense Saharan dust plume during the EUCAARI 2008 campaign, Atmos. Chem. Phys., 15, 3497–3516, https://doi.org/10.5194/acp-15-3497-2015, 2015.
Bègue, N., Vignelles, D., Berthet, G., Portafaix, T., Payen, G., Jégou, F., Benchérif, H., Jumelet, J., Vernier, J.-P., Lurton, T., Renard, J.-B., Clarisse, L., Duverger, V., Posny, F., Metzger, J.-M., and Godin-Beekmann, S.: Long-range transport of stratospheric aerosols in the Southern Hemisphere following the 2015 Calbuco eruption, Atmos. Chem. Phys., 17, 15019–15036, https://doi.org/10.5194/acp-17-15019-2017, 2017.
Bègue, N., Bencherif, H., Jegou, F., Vérèmes, H., Khaykin, S., Krysztofiak, G., Portafaix, T., Duflot, V., Baron, A., Berthet, G., Kloss, C., Payen, G., Keckhut, P., Coheur, P.-F., Clerbeaux, C., Smale, D., Robinson, J., Querel, R., and Smale, P.: Transport and variability of tropospheric ozone over Oceania and southern pacific during the 2019–20 Australian bushfires, Remote Sens.-Basel, 13, 3092, https://doi.org/10.3390/rs13163092, 2021.
Bencherif, H., El Amraoui, L., Kirgis, G., Leclair De Bellevue, J., Hauchecorne, A., Mzé, N., Portafaix, T., Pazmino, A., and Goutail, F.: Analysis of a rapid increase of stratospheric ozone during late austral summer 2008 over Kerguelen (49.4° S, 70.3° E), Atmos. Chem. Phys., 11, 363–373, https://doi.org/10.5194/acp-11-363-2011, 2011.
Bencherif, H., Bègue, N., Kirsch Pinheiro, D., Du Preez, D. J., Cadet, J. M., da Silva Lopes, F. J., and Clerbaux, C.: Investigating the long-range transport of aerosol plumes following the Amazon fires (August 2019): a multi-instrumental approach from ground-based and satellite observations, Remote Sens.-Basel, 12, 3846, https://doi.org/10.3390/rs12223846, 2020.
Brasseur, G. and Solomon, S.: Aeronomy of the Middle Atmosphere: Chemistry and Physics of the Stratosphere and Mesosphere, 3rd edn., Springer-Verlag, 644 pp., ISBN 978-1-4020-3284-4, 2005.
Brocchi, V., Krysztofiak, G., Catoire, V., Guth, J., Marécal, V., Zbinden, R., El Amraoui, L., Dulac, F., and Ricaud, P.: Intercontinental transport of biomass burning pollutants over the Mediterranean Basin during the summer 2014 ChArMEx-GLAM airborne campaign, Atmos. Chem. Phys., 18, 6887–6906, https://doi.org/10.5194/acp-18-6887-2018, 2018.
Burton, S. P., Hair, J. W., Kahnert, M., Ferrare, R. A., Hostetler, C. A., Cook, A. L., Harper, D. B., Berkoff, T. A., Seaman, S. T., Collins, J. E., Fenn, M. A., and Rogers, R. R.: Observations of the spectral dependence of linear particle depolarization ratio of aerosols using NASA Langley airborne High Spectral Resolution Lidar, Atmos. Chem. Phys., 15, 13453–13473, https://doi.org/10.5194/acp-15-13453-2015, 2015.
Clain, G., Baray, J. L., Delmas, R., Diab, R., Leclair de Bellevue, J., Keckhut, P., Posny, F., Metzger, J. M., and Cammas, J. P.: Tropospheric ozone climatology at two Southern Hemisphere tropical/subtropical sites, (Reunion Island and Irene, South Africa) from ozonesondes, LIDAR, and in situ aircraft measurements, Atmos. Chem. Phys., 9, 1723–1734, https://doi.org/10.5194/acp-9-1723-2009, 2009.
Clerbaux, C., Boynard, A., Clarisse, L., George, M., Hadji-Lazaro, J., Herbin, H., Hurtmans, D., Pommier, M., Razavi, A., Turquety, S., Wespes, C., and Coheur, P.-F.: Monitoring of atmospheric composition using the thermal infrared IASI/MetOp sounder, Atmos. Chem. Phys., 9, 6041–6054, https://doi.org/10.5194/acp-9-6041-2009, 2009.
Coheur, P.-F., Clarisse, L., Turquety, S., Hurtmans, D., and Clerbaux, C.: IASI measurements of reactive trace species in biomass burning plumes, Atmos. Chem. Phys., 9, 5655–5667, https://doi.org/10.5194/acp-9-5655-2009, 2009.
Darbyshire, E., Morgan, W. T., Allan, J. D., Liu, D., Flynn, M. J., Dorsey, J. R., O'Shea, S. J., Lowe, D., Szpek, K., Marenco, F., Johnson, B. T., Bauguitte, S., Haywood, J. M., Brito, J. F., Artaxo, P., Longo, K. M., and Coe, H.: The vertical distribution of biomass burning pollution over tropical South America from aircraft in situ measurements during SAMBBA, Atmos. Chem. Phys., 19, 5771–5790, https://doi.org/10.5194/acp-19-5771-2019, 2019.
De Laat, A. T. J., Stein Zweers, D. C., Boers, R., and Tuinder, O. N.: A solar escalator: Observational evidence of the self-lifting of smoke and aerosols by absorption of solar radiation in the February 2009 Australian Black Saturday plume, J. Geophys. Res.-Atmos., 117, https://doi.org/10.1029/2011JD017016, 2012.
De Mazière, M., Sha, M. K., Desmet, F., Hermans, C., Scolas, F., Kumps, N., Metzger, J.-M., Duflot, V., and Cammas, J.-P.: TCOON data from Réunion Island 5RE), Release GG2014.R1, Version R1, CaltechDATA [data set], https://doi.org/10.14291/TCCON.GGG2014.REUNION01.R1, 2017.
De Mazière, M., Thompson, A. M., Kurylo, M. J., Wild, J. D., Bernhard, G., Blumenstock, T., Braathen, G. O., Hannigan, J. W., Lambert, J.-C., Leblanc, T., McGee, T. J., Nedoluha, G., Petropavlovskikh, I., Seckmeyer, G., Simon, P. C., Steinbrecht, W., and Strahan, S. E.: The Network for the Detection of Atmospheric Composition Change (NDACC): history, status and perspectives, Atmos. Chem. Phys., 18, 4935–4964, https://doi.org/10.5194/acp-18-4935-2018, 2018.
Dowdy, A. J. and Pepler, A.: Pyroconvection risk in Australia: Climatological changes in atmospheric stability and surface fire weather conditions, Geophys. Res. Lett., 45, 2005–2013, https://doi.org/10.1002/2017GL076654, 2018.
Duflot, V., Dils, B., Baray, J. L., De Mazière, M., Attié, J. L., Vanhaelewyn, G., and Delmas, R.: Analysis of the origin of the distribution of CO in the subtropical southern Indian Ocean in 2007, J. Geophys. Res.-Atmos., 115, https://doi.org/10.1029/2010JD013994, 2010.
Duflot, V., Bègue, N., Pouliquen, M. L., Goloub, P., and Metzger, J. M.: Aerosols on the Tropical Island of La Réunion (21° S, 55° E): Assessment of Climatology, Origin of Variability and Trend, Remote Sens.-Basel, 14, 4945, https://doi.org/10.3390/rs14194945, 2022.
Eckhardt, S., Cassiani, M., Evangeliou, N., Sollum, E., Pisso, I., and Stohl, A.: Source–receptor matrix calculation for deposited mass with the Lagrangian particle dispersion model FLEXPART v10.2 in backward mode, Geosci. Model Dev., 10, 4605–4618, https://doi.org/10.5194/gmd-10-4605-2017, 2017.
Edwards, D. P., Emmons, L. K., Gille, J. C., Chu, A., Attié, J. L., Giglio, L., and Drummond, J. R.: Satellite-observed pollution from Southern Hemisphere biomass burning, J. Geophys. Res.-Atmos., 111, https://doi.org/10.1029/2005JD006655, 2006.
ESPRI: ESPRI Data Centre, ESPRI, http://espri.aeris-data.fr/ (last access: 10 April 2024), 2017.
Fernald, F. G.: Analysis of atmospheric lidar observations: some comments, Appl. Opt., 23, 652–653, 1984.
Forster, C., Stohl, A., and Seibert, P.: Parameterization of convective transport in a Lagrangian particle dispersion model and its evaluation, J. Appl. Meteorol. Clim., 46, 403–422, 2007.
Fromm, M., Tupper, A., Rosenfeld, D., Servranckx, R., and McRae R.: Violent pyro-convective storm devastates Australia’s capital and pollutes the stratosphere, Geophys. Res. Lett., 33, L05815, https://doi.org/10.1029/2005GL025161, 2006.
Fromm, M., Lindsey, D. T., Servranckx, R., Yue, G., Trickl, T., and Sica, R.: The untold story of pyro-cumulonimbus, B. Am. Meteorol. Soc., 91, https://doi.org/10.1175/2010BAMS3004.1, 2010.
Garstang, M., Tyson, P. D., Browell, E., and Swap, R. J.: Large scale transport of biogenic and biomass burning products, JBiomass Burning and Global Change J. S. Levine, 389–395, MIT Press, Cambridge, Mass., ISBN 9780262122016, 1996.
Grythe, H., Kristiansen, N. I., Groot Zwaaftink, C. D., Eckhardt, S., Ström, J., Tunved, P., Krejci, R., and Stohl, A.: A new aerosol wet removal scheme for the Lagrangian particle model FLEXPART v10, Geosci. Model Dev., 10, 1447–1466, https://doi.org/10.5194/gmd-10-1447-2017, 2017.
Haarig, M., Ansmann, A., Baars, H., Jimenez, C., Veselovskii, I., Engelmann, R., and Althausen, D.: Depolarization and lidar ratios at 355, 532, and 1064 nm and microphysical properties of aged tropospheric and stratospheric Canadian wildfire smoke, Atmos. Chem. Phys., 18, 11847–11861, https://doi.org/10.5194/acp-18-11847-2018, 2018.
Hamill, P., Jensen, E. J., Russell, P. B., and Bauman, J. J.: The life cycle of stratospheric aerosol particles, B. Am. Meteorol. Soc., 78, 1395–1410, https://doi.org/10.1175/1520-0477(1997)078E2.0.CO;2, 1997.
Hauchecorne, A., Godin, S., Marchand, M., Heese, B., and Souprayen, C.: Quantification of the transport of chemical constituents from the polar vortex to midlatitudes in the lower stratosphere using the high-resolution advection model MIMOSA and effective diffusivity, J. Geophys. Res.-Atmos., 107, 1–13, 2002.
Heese, B., Godin, S., and Hauchecorne, A.: Airborne lidar measurements of ozone filaments during METRO–A validation of PV advection model MIMOSA, J. Geophys. Res., 106, 20011–20024, 2001.
Héron, D., Evan, S., Brioude, J., Rosenlof, K., Posny, F., Metzger, J.-M., and Cammas, J.-P.: Impact of convection on the upper-tropospheric composition (water vapor and ozone) over a subtropical site (Réunion island; 21.1° S, 55.5° E) in the Indian Ocean, Atmos. Chem. Phys., 20, 8611–8626, https://doi.org/10.5194/acp-20-8611-2020, 2020.
Hersbach, H., Bell, B., Berrisford, P., Hirahara, S., Horányi, A., Muõz‐Sabater, J., Nicolas, J., Peubey, C., Radu, R., Schepers, D., Simmons, A., Soci, C., Abdalla, S., Abellan, X., Balsamo, G., Bechtold, P., Biavati, G., Bidlot, J., and Villaume, S.: The ERA5 global reanalysis, Q. J. Roy. Meteorol. Soc., 146, 1999–2049, https://doi.org/10.1002/qj.3803, 2020
Holanda, B. A., Pöhlker, M. L., Walter, D., Saturno, J., Sörgel, M., Ditas, J., Ditas, F., Schulz, C., Franco, M. A., Wang, Q., Donth, T., Artaxo, P., Barbosa, H. M. J., Borrmann, S., Braga, R., Brito, J., Cheng, Y., Dollner, M., Kaiser, J. W., Klimach, T., Knote, C., Krüger, O. O., Fütterer, D., Lavrič, J. V., Ma, N., Machado, L. A. T., Ming, J., Morais, F. G., Paulsen, H., Sauer, D., Schlager, H., Schneider, J., Su, H., Weinzierl, B., Walser, A., Wendisch, M., Ziereis, H., Zöger, M., Pöschl, U., Andreae, M. O., and Pöhlker, C.: Influx of African biomass burning aerosol during the Amazonian dry season through layered transatlantic transport of black carbon-rich smoke, Atmos. Chem. Phys., 20, 4757–4785, https://doi.org/10.5194/acp-20-4757-2020, 2020.
Hu, Q., Goloub, P., Veselovskii, I., Bravo-Aranda, J.-A., Popovici, I. E., Podvin, T., Haeffelin, M., Lopatin, A., Dubovik, O., Pietras, C., Huang, X., Torres, B., and Chen, C.: Long-range-transported Canadian smoke plumes in the lower stratosphere over northern France, Atmos. Chem. Phys., 19, 1173–1193, https://doi.org/10.5194/acp-19-1173-2019, 2019.
Hurtmans, D., Coheur, P. F., Wespes, C., Clarisse, L., Scharf, O., Clerbaux, C., Hadji-Lazaro, J., George, M., and Turquety, S.: FORLI radiative transfer and retrieval code for IASI, J. Quant. Spectrosc. Ra., 113, 1391–1408, 2012.
Jones, N. B., Rinsland, C. P., Liley, J. B., and Rosen, J.: Correlation of aerosol and carbon monoxide at 45 S: Evidence of BB emissions, Geophys. Res. Lett., 28, 709–712, 2001.
Kaiser, J. W., Heil, A., Andreae, M. O., Benedetti, A., Chubarova, N., Jones, L., Morcrette, J.-J., Razinger, M., Schultz, M. G., Suttie, M., and van der Werf, G. R.: Biomass burning emissions estimated with a global fire assimilation system based on observed fire radiative power, Biogeosciences, 9, 527–554, https://doi.org/10.5194/bg-9-527-2012, 2012.
Kaufman, Y. J., Ichoku, C., Giglio, L., Korontzi, S., Chu, D. A., Hao, W. M., and Justice, C. O.: Fire and smoke observed from the Earth Observing System MODIS instrument–products, validation, and operational use, Int. J. Remote Sens., 24, 1765–1781, 2003.
Khaykin, S., Legras, B., Bucci, S., Sellitto, P., Isaksen, L., Tence, F., and Godin-Beekmann, S.: The 2019/20 Australian wildfires generated a persistent smoke-charged vortex rising up to 35 km altitude, Communications Earth & Environment, 1, 1–12, 2020.
Khaykin, S. M., Godin-Beekmann, S., Hauchecorne, A., Pelon, J., Ravetta, F., and Keckhut, P.: Stratospheric smoke with unprecedentedly high backscatter observed by lidars above southern France, Geophys. Res. Lett., 1944, 8007, https://doi.org/10.1002/2017GL076763, 2018.
Klett, J. D.: Lidar inversion with variable backscatter/extinction ratios, Appl. Optics, 24, 1638–1643, https://doi.org/10.1364/AO.24.001638, 1985.
Kloss, C., Berthet, G., Sellitto, P., Ploeger, F., Bucci, S., Khaykin, S., Jégou, F., Taha, G., Thomason, L. W., Barret, B., Le Flochmoen, E., von Hobe, M., Bossolasco, A., Bègue, N., and Legras, B.: Transport of the 2017 Canadian wildfire plume to the tropics via the Asian monsoon circulation, Atmos. Chem. Phys., 19, 13547–13567, https://doi.org/10.5194/acp-19-13547-2019, 2019.
Labonne, M., Bréon, F. M., and Chevallier, F.: Injection height of biomass burning aerosols as seen from a spaceborne lidar, Geophys. Res. Lett., 34, https://doi.org/10.1029/2007GL029311, 2007.
Lashkari, H., Mohammadi, Z., and Keikhosravi, G.: Annual fluctuations and displacements of inter tropical convergence zone (ITCZ) within the range of Atlantic Ocean-India, Open Journal of Ecology, 7, 12–33, 2017.
Livesey, N. J., Read, W. G., Wagner, P. A., Froidevaux, L., Santee, M. L., Schwartz, M. J., Lambert, A., Valle, L. F. M., Pumphrey, H. C., Manney, G. L., Fuller, R. A., Jarnot, R. F., Knosp, B. W., and Lay, R. R.: Version 5.0x Level 2 and 3 data quality and description document, https://mls.jpl.nasa.gov/data/v5-0_data_quality_document.pdf (last access: 1 July 2023), 2022.
Morgan, W. T., Allan, J. D., Bauguitte, S., Darbyshire, E., Flynn, M. J., Lee, J., Liu, D., Johnson, B., Haywood, J., Longo, K. M., Artaxo, P. E., and Coe, H.: Transformation and ageing of biomass burning carbonaceous aerosol over tropical South America from aircraft in situ measurements during SAMBBA, Atmos. Chem. Phys., 20, 5309–5326, https://doi.org/10.5194/acp-20-5309-2020, 2020.
Müller, D., Ansmann, A., Mattis, I., Tesche, M., Wandinger, U., Althausen, D., and Pisani, G.: Aerosol-type-dependent lidar ratios observed with Raman lidar, J. Geophys. Res., 112, D16202, https://doi.org/10.1029/2006JD008292, 2007.
NASA: NDACC Public Data Access, NASA, https://www-air.larc.nasa.gov/missions/ndacc/data.html (last access: 10 April 2024), 2024.
Neumann, C.: Global guide to tropical cyclone forecasting, WMO Trop. Cyclone Program Rep. TCP-31, chap. Global Overview, World Meteorol. Organ., Geneva, Switzerland, 43 pp., 1993.
Nicolae, D., Nemuc, A., Müller, D., Talianu, C., Vasilescu, J., Belegante, L., and Kolgotin, A.: Characterization of fresh and aged BB events using multiwavelength Raman lidar and mass spectrometry, J. Geophys. Res.-Atmos., 118, 2956–2965, 2013.
Ohneiser, K., Ansmann, A., Chudnovsky, A., Engelmann, R., Ritter, C., Veselovskii, I., Baars, H., Gebauer, H., Griesche, H., Radenz, M., Hofer, J., Althausen, D., Dahlke, S., and Maturilli, M.: The unexpected smoke layer in the High Arctic winter stratosphere during MOSAiC 2019–2020, Atmos. Chem. Phys., 21, 15783–15808, https://doi.org/10.5194/acp-21-15783-2021, 2021.
Ohneiser, K., Ansmann, A., Kaifler, B., Chudnovsky, A., Barja, B., Knopf, D. A., Kaifler, N., Baars, H., Seifert, P., Villanueva, D., Jimenez, C., Radenz, M., Engelmann, R., Veselovskii, I., and Zamorano, F.: Australian wildfire smoke in the stratosphere: the decay phase in 2020/2021 and impact on ozone depletion, Atmos. Chem. Phys., 22, 7417–7442, https://doi.org/10.5194/acp-22-7417-2022, 2022.
Pisso, I., Sollum, E., Grythe, H., Kristiansen, N. I., Cassiani, M., Eckhardt, S., Arnold, D., Morton, D., Thompson, R. L., Groot Zwaaftink, C. D., Evangeliou, N., Sodemann, H., Haimberger, L., Henne, S., Brunner, D., Burkhart, J. F., Fouilloux, A., Brioude, J., Philipp, A., Seibert, P., and Stohl, A.: The Lagrangian particle dispersion model FLEXPART version 10.4, Geosci. Model Dev., 12, 4955–4997, https://doi.org/10.5194/gmd-12-4955-2019, 2019.
Portafaix, T., Morel, B., Bencherif, H., Baldy, S., Godin-Beekmann, S., and Hauchecorne, A.: Fine-scale study of a thick stratospheric ozone lamina at the edge of the southern subtropical barrier, J. Geophys. Res.-Atmos., 108, D64196, https://doi.org/10.1029/2002JD002741, 2003.
Sakai, T., Nagai, T., Nakazato, M., Mano, Y., and Matsumura, T.: Ice clouds and Asian dust studied with lidar measurements of particle extinction-to-backscatter ratio, particle depolarization, and water vapor mixing ration over Tsukuba, Appl. Optics, 42, 7103–7116, 2003.
Sakai, T., Uchino, O., Nagai, T., Liley, B., Morino, I., and Fujimoto, T.: Long-term variation of stratospheric aerosols observed with lidars over Tsukuba, Japan, from 1982 and Lauder, New Zealand, from 1992 to 2015, J. Geophys. Res.-Atmos., 121, 10283–10293, https://doi.org/10.1002/2016JD025132, 2016.
Seibert, P. and Frank, A.: Source-receptor matrix calculation with a Lagrangian particle dispersion model in backward mode, Atmos. Chem. Phys., 4, 51–63, https://doi.org/10.5194/acp-4-51-2004, 2004.
Sofiev, M., Ermakova, T., and Vankevich, R.: Evaluation of the smoke-injection height from wild-land fires using remote-sensing data, Atmos. Chem. Phys., 12, 1995–2006, https://doi.org/10.5194/acp-12-1995-2012, 2012.
Stohl, A., Forster, C., Eckhardt, S., Spichtinger, N., Huntrieser, H., Heland, J., Schlager, H., Wilhelm, S., Arnold, F., and Cooper, O.: A backward modeling study of intercontinental pollution transport using aircraft measurements, J. Geophys. Res., 108, 4370, https://doi.org/10.1029/2002JD002862, 2003.
Stohl, A., Forster, C., Frank, A., Seibert, P., and Wotawa, G.: Technical note: The Lagrangian particle dispersion model FLEXPART version 6.2, Atmos. Chem. Phys., 5, 2461–2474, https://doi.org/10.5194/acp-5-2461-2005, 2005.
Swap, R. J., Annegarn, H. J., Suttles, J. T., King, M. D., Platnick, S., Privette, J. L., and Scholes, R. J.: Africa burning: a thematic analysis of the Southern African Regional Science Initiative (SAFARI 2000), J. Geophys. Res.-Atmos., 108, https://doi.org/10.1029/2003JD003747, 2003.
Taha, G., Loughman, R., Zhu, T., Thomason, L., Kar, J., Rieger, L., and Bourassa, A.: OMPS LP Version 2.0 multi-wavelength aerosol extinction coefficient retrieval algorithm, Atmos. Meas. Tech., 14, 1015–1036, https://doi.org/10.5194/amt-14-1015-2021, 2021.
Tencé, F., Jumelet, J., Bekki, S., Khaykin, S., Sarkissian, A., and Keckhut, P.: Australian Black Summer smoke observed by lidar at the French Antarctic station Dumont d'Urville, J. Geophys. Res.-Atmos., 127, e2021JD035349, https://doi.org/10.1029/2021JD035349, 2022.
Uchino, O., Tokunaga, M., Seki, K., Maeda, M., Naito, K., and Takahashi, K.: Lidar measurement of stratospheric transmission at a wavelength of 340 nm after the eruption of El Chichon, J. Atmos. Terr. Phys., 45, 849–850, 1983.
Vernier, J. P., Pommereau, J. P., Garnier, A., Pelon, J., Larsen, N., Nielsen, J., and McDermid, I. S.: Tropical stratospheric aerosol layer from CALIPSO lidar observations, J. Geophys. Res.-Atmos., 114, D00H10, https://doi.org/10.1029/2009JD011946, 2009.
Vigouroux, C., Blumenstock, T., Coffey, M., Errera, Q., García, O., Jones, N. B., Hannigan, J. W., Hase, F., Liley, B., Mahieu, E., Mellqvist, J., Notholt, J., Palm, M., Persson, G., Schneider, M., Servais, C., Smale, D., Thölix, L., and De Mazière, M.: Trends of ozone total columns and vertical distribution from FTIR observations at eight NDACC stations around the globe, Atmos. Chem. Phys., 15, 2915–2933, https://doi.org/10.5194/acp-15-2915-2015, 2015.
Waters, J. W., Froidevaux, L., Harwood, R. S., Jarnot, R. F., Pickett, H. M., Read, W. G., and Walch, M. J.: The earth observing system microwave limb sounder (EOS MLS) on the Aura satellite, IEEE Trans. Geosci. Remote Sens., 44, 1075–1092, https://doi.org/10.1109/TGRS.2006.873771, 2006
Wunch, D., Toon, G. C., Sherlock, V., Deutscher, N. M., Liu, C., Feist, D. G., and Wennberg, P. O.: The Total Carbon Column Observing Network, Phil. Trans. R. Soc. A, 369, 2087–2112, https://doi.org/10.1098/rsta.2010.0240, 2015.
Xu, Y., Wang, W., Chen, B., Chang, M., and Wang, X.: Identification of ventilation corridors using backward trajectory simulations in Beijing, Sustain. Cities Soc., 70, 102889, https://doi.org/10.1016/j.scs.2021.102889, 2021.
Young, A. H., Bates, J. J., and Curry, J. A.: Application of cloud vertical structure from CloudSat to investigate MODIS‐derived cloud properties of cirriform, anvil, and deep convective clouds, J. Geophys. Res.-Atmos., 118, 4689–4699, 2013.
Young, S. A.: Analysis of lidar backscatter profiles in optically thin clouds, Appl. Optics, 34, 7019–7031, 1995.
Yu, P., Davis, S. M., Toon, O. B., Portmann, R. W., Bardeen, C. G., Barnes, J. E., and Rosenlof, K. H.: Persistent stratospheric warming due to 2019–2020 Australian wildfire smoke, Geophys. Res. Lett., 48, e2021GL092609, https://doi.org/10.1029/2021GL092609, 2021.
ZAMG: Flexpart, Welcome to the official FLEXPART web site, ZAMG, https://www.flexpart.eu/ (last access: 20 January 2023), 2024.
Zhou, M., Langerock, B., Vigouroux, C., Sha, M. K., Ramonet, M., Delmotte, M., Mahieu, E., Bader, W., Hermans, C., Kumps, N., Metzger, J.-M., Duflot, V., Wang, Z., Palm, M., and De Mazière, M.: Atmospheric CO and CH4 time series and seasonal variations on Reunion Island from ground-based in situ and FTIR (NDACC and TCCON) measurements, Atmos. Chem. Phys., 18, 13881–13901, https://doi.org/10.5194/acp-18-13881-2018, 2018.
Zhou, M., Langerock, B., Vigouroux, C., Sha, M. K., Hermans, C., Metzger, J.-M., Chen, H., Ramonet, M., Kivi, R., Heikkinen, P., Smale, D., Pollard, D. F., Jones, N., Velazco, V. A., García, O. E., Schneider, M., Palm, M., Warneke, T., and De Mazière, M.: TCCON and NDACC XCO measurements: difference, discussion and application, Atmos. Meas. Tech., 12, 5979–5995, https://doi.org/10.5194/amt-12-5979-2019, 2019.
- Abstract
- Introduction
- Instrumentation and model description
- Formation of an intense stratospheric BB plume over Australia
- Transport of the Australian BB plume over the SWIO basin
- Discussion of the influence of regional sources
- Summary and conclusion
- Data availability
- Author contributions
- Competing interests
- Disclaimer
- Acknowledgements
- Financial support
- Review statement
- References