the Creative Commons Attribution 4.0 License.
the Creative Commons Attribution 4.0 License.
 | 10 Jul 2024
Decomposing the effective radiative forcing of anthropogenic aerosols based on CMIP6 Earth system models
Alkiviadis Kalisoras
Aristeidis K. Georgoulias
Dimitris Akritidis
Robert J. Allen
Vaishali Naik
Chaincy Kuo
Sophie Szopa
Pierre Nabat
Dirk Olivié
Twan van Noije
Philippe Le Sager
David Neubauer
Naga Oshima
Jane Mulcahy
Larry W. Horowitz
Prodromos Zanis
Anthropogenic aerosols play a major role in the Earth–atmosphere system by influencing the Earth's radiative budget and precipitation and consequently the climate. The perturbation induced by changes in anthropogenic aerosols on the Earth's energy balance is quantified in terms of the effective radiative forcing (ERF). In this work, the present-day shortwave (SW), longwave (LW), and total (i.e., SW plus LW) ERF of anthropogenic aerosols is quantified using two different sets of experiments with prescribed sea surface temperatures (SSTs) from Earth system models (ESMs) participating in the Coupled Model Intercomparison Project Phase 6 (CMIP6): (a) time-slice pre-industrial perturbation simulations with fixed SSTs (piClim) and (b) transient historical simulations with time-evolving SSTs (histSST) over the historical period (1850–2014). ERF is decomposed into three components for both piClim and histSST experiments: (a) ERFARI, representing aerosol–radiation interactions; (b) ERFACI, accounting for aerosol–cloud interactions (including the semi-direct effect); and (c) ERFALB, which is due to temperature, humidity, and surface albedo changes caused by anthropogenic aerosols. We present spatial patterns at the top-of-atmosphere (TOA) and global weighted field means along with inter-model variability (1 standard deviation) for all SW, LW, and total ERF components (ERFARI, ERFACI, and ERFALB) and for every experiment used in this study. Moreover, the inter-model agreement and the robustness of our results are assessed using a comprehensive method as utilized in the IPCC Sixth Assessment Report. Based on piClim experiments, the total present-day (2014) ERF from anthropogenic aerosol and precursor emissions is estimated to be −1.11 ± 0.26 W m−2, mostly due to the large contribution of ERFACI to the global mean and to the inter-model variability. Based on the histSST experiments for the present-day period (1995–2014), similar results are derived, with a global mean total aerosol ERF of −1.28 ± 0.37 W m−2 and dominating contributions from ERFACI. The spatial patterns for total ERF and its components are similar in both the piClim and histSST experiments. Furthermore, implementing a novel approach to determine geographically the driving factor of ERF, we show that ERFACI dominates over the largest part of the Earth and that ERFALB dominates mainly over the poles, while ERFARI dominates over certain reflective surfaces. Analysis of the inter-model variability in total aerosol ERF shows that SW ERFACI is the main source of uncertainty predominantly over land regions with significant changes in aerosol optical depth (AOD), with eastern Asia contributing mostly to the inter-model spread of both ERFARI and ERFACI. The global spatial patterns of total ERF and its components from individual aerosol species, such as sulfates, organic carbon (OC), and black carbon (BC), are also calculated based on piClim experiments. The total ERF caused by sulfates (piClim-SO2) is estimated at −1.11 ± 0.31 W m−2, and the OC ERF (piClim-OC) is −0.35 ± 0.21 W m−2, while the ERF due to BC (piClim-BC) is 0.19 ± 0.18 W m−2. For sulfates and OC perturbation experiments, ERFACI dominates over the globe, whereas for BC perturbation experiments ERFARI dominates over land in the Northern Hemisphere and especially in the Arctic. Generally, sulfates dominate ERF spatial patterns, exerting a strongly negative ERF especially over industrialized regions of the Northern Hemisphere (NH), such as North America, Europe, and eastern and southern Asia. Our analysis of the temporal evolution of ERF over the historical period (1850–2014) reveals that ERFACI clearly dominates over ERFARI and ERFALB for driving the total ERF temporal evolution. Moreover, since the mid-1980s, total ERF has become less negative over eastern North America and western and central Europe, while over eastern and southern Asia there is a steady increase in ERF magnitude towards more negative values until 2014.
- Article
(20781 KB) - Full-text XML
-
Supplement
(59215 KB) - BibTeX
- EndNote


Anthropogenic aerosols are suspended particles with radii ranging from a few nanometers to a few micrometers (Myhre et al., 2013; Bellouin et al., 2020; Gulev et al., 2021) that are spatially heterogeneously distributed in the atmosphere due to their relatively short lifetime (Lund et al., 2018b; Szopa et al., 2021). Aerosols modify the Earth's radiative budget through direct and indirect processes. Directly, they scatter and absorb incoming solar shortwave (SW), and to a lesser extent they absorb, scatter, and re-emit terrestrial longwave (LW) radiation (Boucher et al., 2013; Bellouin et al., 2020). These processes are denoted as aerosol–radiation interactions (ARI). The net total radiative effect of anthropogenic aerosols partially masks the radiative effect of well-mixed greenhouse gases by cooling the atmosphere (Ming and Ramaswamy, 2009; Szopa et al., 2021); however, where the absorbing aerosol fraction is high, they may exert substantial atmospheric warming (Li et al., 2022). Indirectly, tropospheric aerosols alter the radiative and microphysical properties of clouds affecting their reflectivity (or albedo), lifetime, and size, as aerosols can serve as cloud condensation nuclei (CCN) for cloud droplets and ice-nucleating particles (INPs) for ice crystals (Haywood and Boucher, 2000; Lohmann and Feichter, 2005; Boucher et al., 2013; Rosenfeld et al., 2014; Bellouin et al., 2020). These processes are denoted as aerosol–cloud interactions (ACI). The aerosol indirect effect is typically divided into two effects. The first indirect effect, also known as the cloud albedo effect or Twomey effect, suggests that increased aerosol concentrations in the atmosphere cause increases in droplet concentration and cloud optical thickness due to the presence of more available CCN, with a subsequent decrease in droplet size and an increase in cloud albedo (Twomey, 1974, 1977). The second indirect effect, more commonly known as the cloud lifetime effect or Albrecht effect, proposes that a reduction in cloud droplet size due to increased aerosol concentrations affects precipitation efficiency, with a tendency to increase liquid water content, cloud lifetime (Albrecht, 1989), and cloud thickness (Pincus and Baker, 1994). In addition, a semi-direct effect of aerosols can be observed. The term “semi-direct effect” usually refers to the atmospheric heating, with a consequent reduction in relative humidity and therefore cloud amount (i.e., cloud evaporation or cloud burn-off), induced by aerosol absorption locally (Hansen et al., 1997; Ackerman et al., 2000; Allen and Sherwood, 2010). When absorbing aerosols reside above or below clouds, they may enhance cloud cover under some circumstances (Koch and Del Genio, 2010). Nevertheless, in a more general sense, the term semi-direct effect can be used to express the thermodynamic effect of absorbing aerosols on meteorological conditions (atmospheric pressure, temperature profile, cloudiness, etc.) (Tsikerdekis et al., 2019).
The intensities of the direct, semi-direct, and indirect effects of aerosols differ among aerosol species. These effects may interact with each other and with other local, regional, or global processes, complicating their impacts on precipitation and clouds (Bartlett et al., 2018). Anthropogenic aerosols predominantly scatter SW radiation (Myhre et al., 2013) and produce a net cooling effect globally (Liu et al., 2018). More specifically, sulfate (SO4) particles strongly scatter incoming solar radiation, thus increasing the Earth's albedo and cooling the surface. Sulfate particles also act as CCN, nucleating additional cloud droplets under supersaturated conditions, a process that increases cloud albedo and again has a cooling effect on the Earth–atmosphere system (Wild, 2009, 2012; Kasoar et al., 2016). Organic aerosols (OAs) generally reflect SW radiation, whereas black carbon (BC) is the most absorbing aerosol particle and strongly absorbs light at all visible wavelengths (Bond et al., 2013; Myhre et al., 2013). Although BC and organic carbon (OC) are co-emitted and have quite similar atmospheric lifetimes, OC scatters sunlight to a much greater degree than BC, thus cooling the atmosphere–surface system (Boucher et al., 2013; Hodnebrog et al., 2016). On the other hand, BC directly absorbs sunlight, heating the surrounding air and reducing the amount of sunlight that reaches the Earth's surface and is reflected back to space (Chen et al., 2010; Bond et al., 2013). Furthermore, when BC is located above a reflective surface, such as snow or clouds, it absorbs the solar radiation reflected from that surface, a process with potentially significant effects over the Arctic (Sand et al., 2013; Stjern et al., 2019). Black carbon interactions with solar radiation depend on the altitude of BC within the troposphere, its position relative to clouds, and the type of the underlying surface (Ramanathan and Carmichael, 2008; Bond et al., 2013).
The aerosol effects discussed above are competing, and the calculation of the forcing that aerosols exert on the Earth's climate includes many uncertainties. Difficulties in modeling the radiative forcing of aerosols arise from their complex nature, as their chemical composition and size distribution can rapidly change, and also from the complicated interactions between aerosols, radiation, and clouds (Bauer et al., 2020). Climate models lack the resolution to capture small-scale processes that affect the hygroscopic growth of aerosols and the amount of light scattered by them (uncertainties in ARI), coarsely parameterize clouds and precipitation, and inaccurately represent turbulent mixing (leading to uncertainties in ACI) (e.g., Neubauer et al., 2014), along with many imperfectly known parameters remaining unresolved (Bellouin et al., 2020). Additionally, aerosol emissions and their evolution over the course of time, which influences their spatiotemporal atmospheric distribution, are still large sources of uncertainty (Bauer et al., 2020). Although Earth system models (ESMs) participating in the Coupled Model Intercomparison Project Phase 6 (CMIP6; Eyring et al., 2016) have increased their level of sophistication regarding processes that drive ACI (Meehl et al., 2020; Gliß et al., 2021), their representation of ACI remains a challenge because of limitations in their representation of significant subgrid-scale processes (Bellouin et al., 2020; Forster et al., 2021). The Sixth Assessment Report (AR6) of the WGI of the Intergovernmental Panel on Climate Change (IPCC) states that (a) aerosol interactions with mixed-phase, (deep) convective, and ice clouds; (b) contributions from aerosols serving as INPs to radiative forcing; and (c) adjustments in liquid water path and cloud cover in response to perturbations caused by aerosols are major sources of uncertainty in ACI simulated by climate models (Forster et al., 2021). Diversity in the representation of aerosol emissions, atmospheric transport, horizontal and vertical distributions, production rates, atmospheric removal processes, optical properties, hygroscopicity, ability to act as CCN or INPs, chemical composition, aging, mixing state, and morphology (Samset et al., 2013; Kristiansen et al., 2016; Peng et al., 2016; Wang et al., 2016; Zanatta et al., 2016; Myhre et al., 2017; Lund et al., 2018a, b; Allen et al., 2019; Yang et al., 2019; Zelinka et al., 2020; Brown et al., 2021; Gliß et al., 2021; Szopa et al., 2021) affect ARI and ACI, with consequent effects on calculations of aerosol radiative forcing (Ghan et al., 2016; Forster et al., 2021). Moreover, the magnitude of the radiative forcing due to ACI could also depend on dynamic backgrounds (Zhang et al., 2016) and large-scale circulation adjustments (Dagan et al., 2023).
Radiative forcing offers a metric for quantifying how human activities and natural agents alter the energy flow into and out of the Earth's climate system (Ramaswamy et al., 2019). The effective radiative forcing (ERF; measured in W m−2) was recommended as a metric of climate change in the IPCC Fifth Assessment Report (AR5) WGI (Boucher et al., 2013; Myhre et al., 2013) and quantifies the energy that is gained or lost by the Earth–atmosphere system after an imposed perturbation, rendering it a basic driver of changes in the top-of-atmosphere (TOA) energy budget of Earth (Forster et al., 2021). The total ERF due to anthropogenic aerosols over the industrial era (1750–2011) in AR5 was estimated at −0.9 (−1.9 to −0.1) W m−2 (uncertainty values in parentheses represent the 5 %–95 % confidence range), with the ERF due to aerosol–radiation interactions (ERFARI) being −0.45 (−0.95 to 0.05) W m−2 and the ERF caused by aerosol–cloud interactions (ERFACI) being −0.45 (−1.2 to 0.0) W m−2 (Boucher et al., 2013; Myhre et al., 2013). It should be stressed that, in AR5, ERFACI was defined as ERFARI+ACI minus ERFARI (Myhre et al., 2013). Since AR5, there have been improvements in ERF estimation due to a greater understanding of processes and advances in observational and modeling analyses, which have led to an increase in the estimated total aerosol ERF magnitude, along with a reduction in its uncertainty (Forster et al., 2021). As reported in AR6, the total ERF due to aerosols is estimated at −1.3 (−2.0 to −0.6) W m−2 over the industrial era (1750–2014), with ERFARI being estimated at −0.3 (−0.6 to 0.0) W m−2 and ERFACI having a value of −1.0 (−1.7 to −0.3) W m−2 (Forster et al., 2021). It should be noted that substantial uncertainty remains concerning the adjustment contribution to ERFACI and processes not represented by current ESMs (particularly the effects of aerosols on convective, mixed-phase, and ice clouds) (Forster et al., 2021).
Table 1Estimates of present-day aerosol effective radiative forcing (in W m−2) from recent papers. ERF values were calculated for all aerosols, sulfates, black carbon, and organic aerosols (organic carbon, primary organic matter, and secondary organic aerosols).
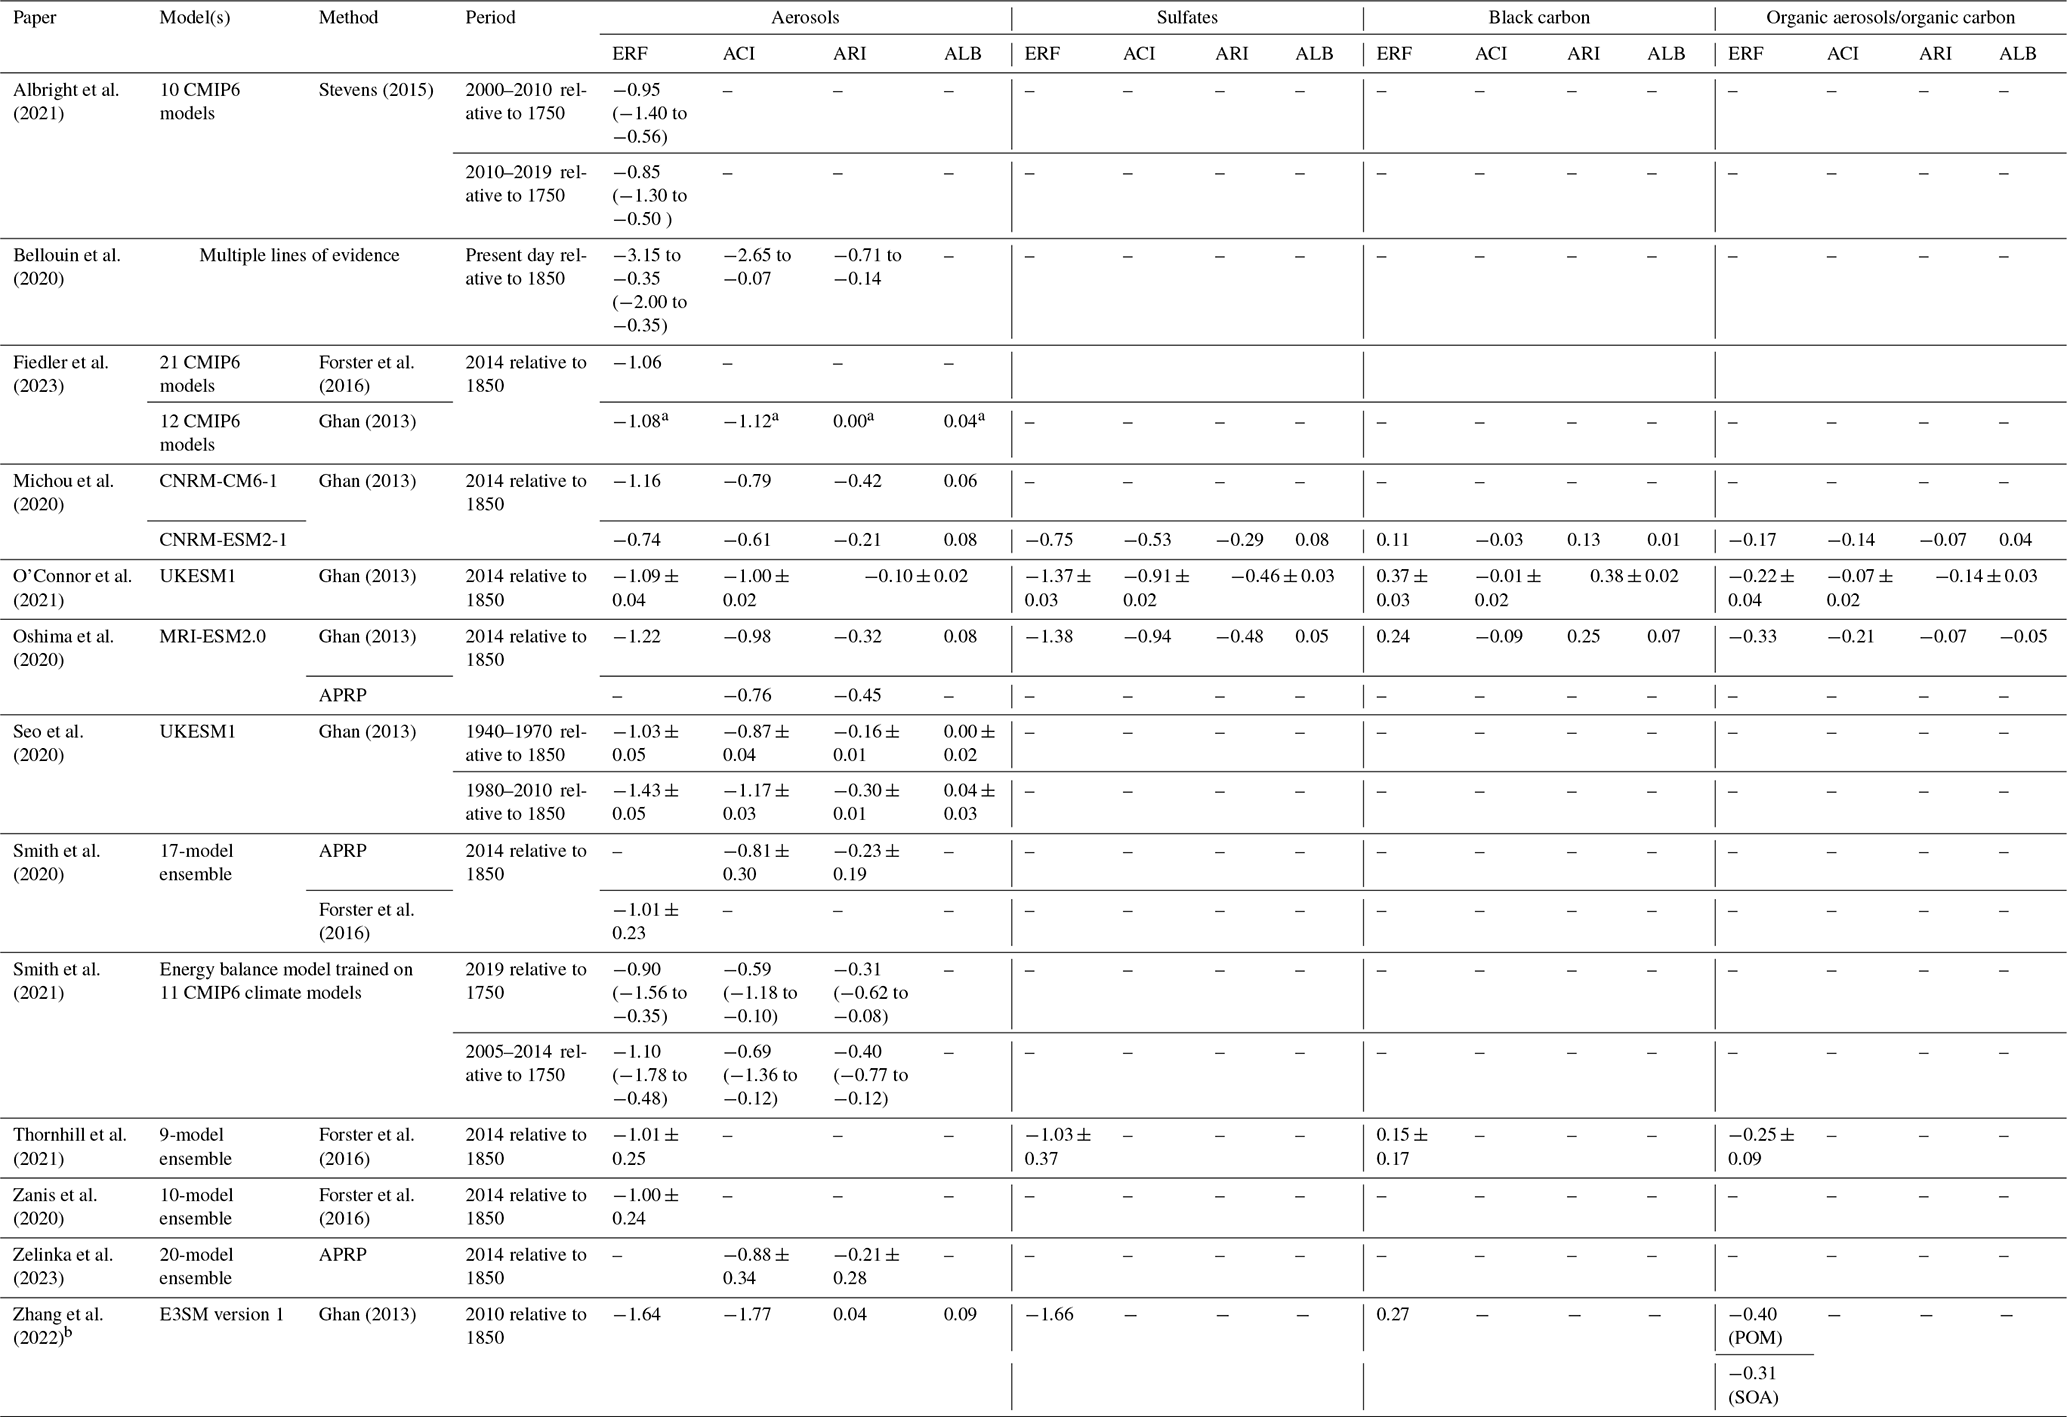
a As calculated from the values given in Table S3 within the Supporting Information of Fiedler et al. (2023; https://agupubs.onlinelibrary.wiley.com/action/downloadSupplement?doi=10.1029%2F2023GL104848&file=2023GL104848-sup-0001-Supporting+Information+SI-S01.pdf, last access: 20 October 2023). b Zhang et al. (2022) also calculated the ERF due to primary organic matter (POM) and secondary organic aerosols (SOAs) using the E3SM version 1 model.
A number of recent studies examined the ERF that aerosols exert on the climate system using simulations from CMIP6 models (summarized in Table 1). However, there are several gaps as in many cases their results are based on a single model (e.g., Michou et al., 2020; Oshima et al., 2020), and in other cases the ERF patterns are missing (e.g., Thornhill et al., 2021), while in some studies ERF is not further decomposed (e.g., Zanis et al., 2020). This study fills those gaps and builds on existing studies by analyzing the spatial and temporal variability in ERF from a multi-model ensemble, comprised of seven CMIP6 ESMs that produced all diagnostics needed to implement the ERF decomposition method proposed by Ghan (2013). The present-day anthropogenic aerosol ERF is examined at the top-of-atmosphere using two different sets of experiments with prescribed sea surface temperatures (SSTs) and sea ice cover (SIC) for comparison purposes. Moreover, the evolution of transient ERF during the historical period (1850–2014) is investigated globally and over certain emission regions of the Northern Hemisphere (NH), focusing on the last 20 years of the historical period (1995–2014) in order to mitigate the effects of the negative ERF peak around the late 1970s (Szopa et al., 2021). Apart from the full decomposition of ERF into its ARI, ACI, and ALB (Ghan's other forcing term; see Sect. 2.3) components for all the aerosols and each anthropogenic sub-type separately (SO4, OC, and BC), the robustness of the ERF results is calculated with a new method based on their statistical significance and inter-model agreement on the sign of ERF. Additionally, the relative contribution of each ERF component geographically is also presented using a novel approach to our knowledge. In brief, this paper is structured as follows. Details about the CMIP6 ESMs and the corresponding simulations used, along with a description of the applied methodology, are given in Sect. 2. The results of this study are presented, discussed, and compared with the results of other studies in Sect. 3, while at the end of the paper (Sect. 4) the main conclusions of this research are summarized.
Table 2Information on model resolution (horizontal and vertical), variant label, and references for each ESM used in this work. Each experiment (see Table 3) has a variant label raibpcfd, where a is the realization index, b is the initialization index, c is the physics index, and d is the forcing index.
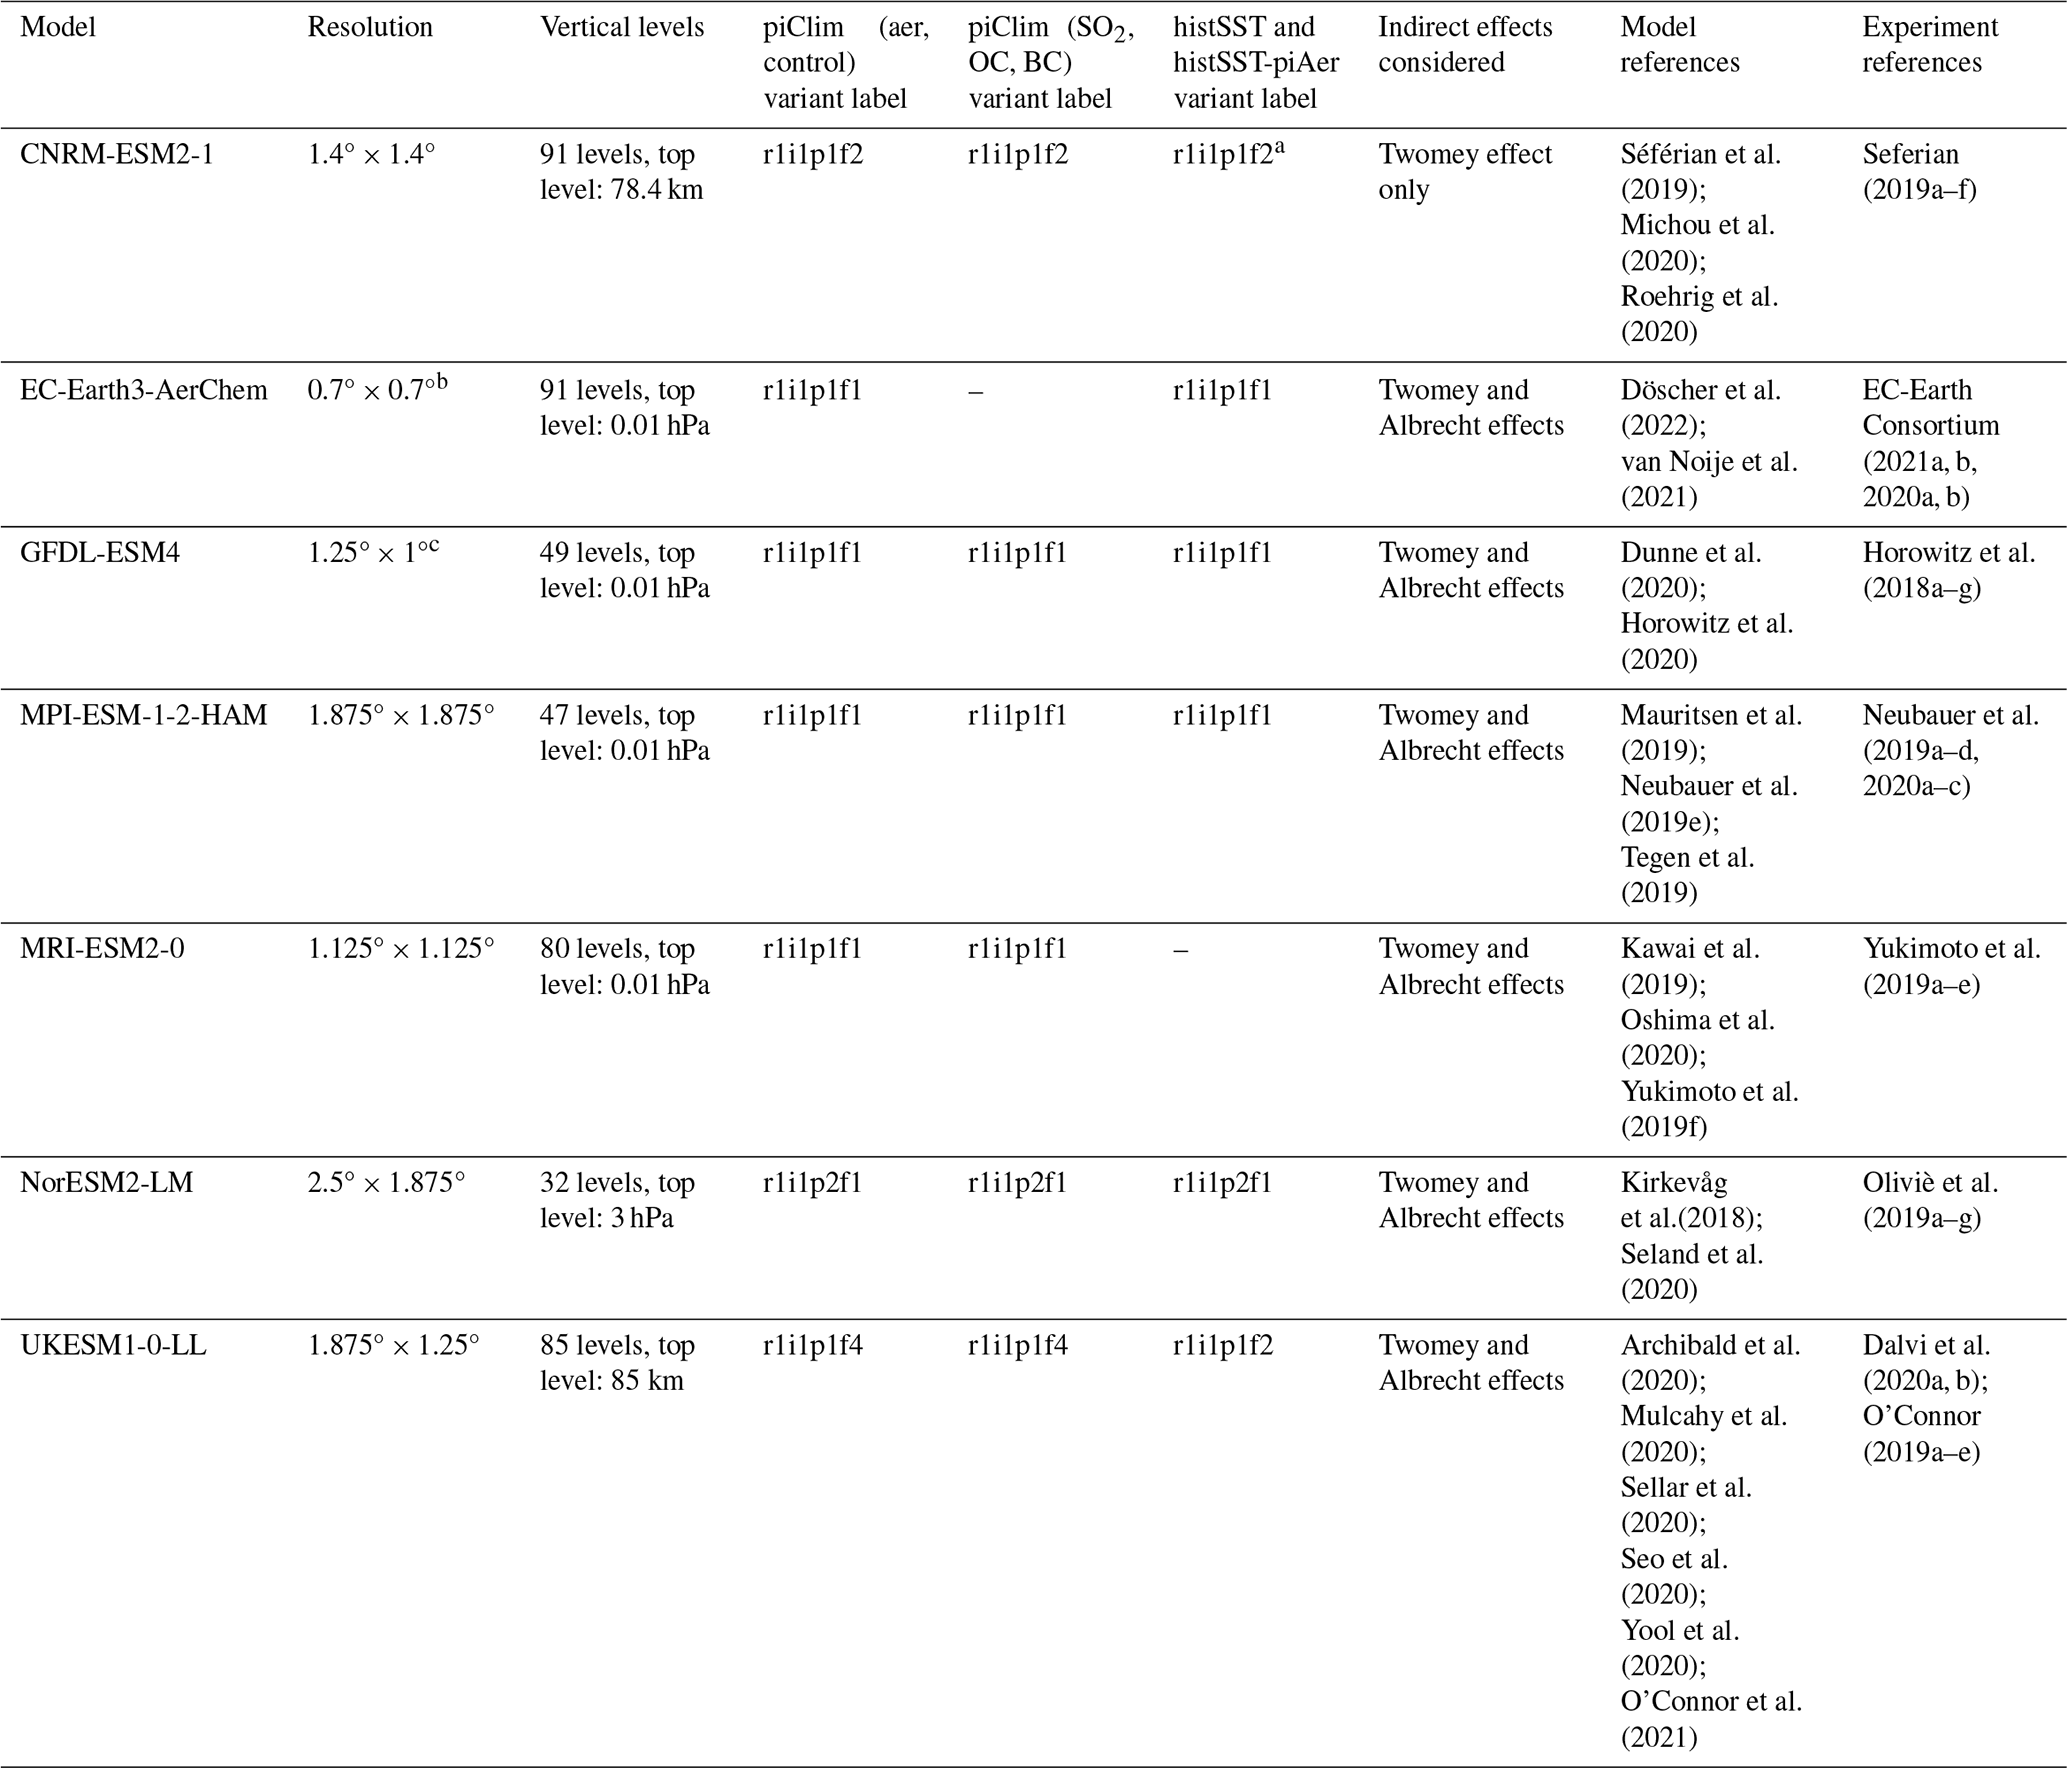
a The histSST-piAer simulation is identical to the histSST-piNTCF simulation as CNRM-ESM2-1 has no tropospheric chemistry and therefore no ozone precursors, which means that the two configurations (histSST-piAer and histSST-piNTCF) are identical. b The 0.7° × 0.7° is approximate for the TL255 grid of IFS. Aerosols and atmospheric chemistry are simulated with the Tracer Model version 5 (TM5) with horizontal resolution 3° × 2° (lon x lat), with 34 levels in the vertical and a model top at about 0.1 hPa. c GFDL-ESM4 uses a cubed-sphere grid with ∼ 100 km resolution. Results are regridded to a 1.25° × 1° (lon × lat) grid for analysis.
2.1 Model description
The ERF of anthropogenic aerosols was estimated using simulations from seven different ESMs (Table 2) carried out within the framework of RFMIP (Pincus et al., 2016) and AerChemMIP (Collins et al., 2017), which were endorsed by CMIP6 (Eyring et al., 2016). Anthropogenic emissions of aerosols and precursors of aerosols and ozone (excluding methane) used by climate models are from van Marle et al. (2017) and Hoesly et al. (2018), while each model uses its own natural emissions (Eyring et al., 2016).
The CNRM-ESM2-1 model (Séférian et al., 2019; Michou et al., 2020) uses the Reactive Processes Ruling the Ozone Budget in the Stratosphere Version 2 (REPRO-BUS-C_v2) atmospheric chemistry scheme, in which chemical evolution is calculated only above the 560 hPa level. Below that level, the concentrations of the species are relaxed either toward the yearly evolving global mean abundances (Meinshausen et al., 2017) or toward the 560 hPa value. The Tropospheric Aerosols for ClimaTe In CNRM (TACTIC_v2) interactive tropospheric aerosol scheme is also used in CNRM-ESM2-1, which implements a sectional representation of BC, organic matter, sulfates, sea salt, and desert dust. The SO4 precursors evolve in sulfate aerosols with dependence on latitude (Séférian et al., 2019). The cloud droplet number concentration is dependent on the concentrations of sea salt, sulfate, and organic matter, thus representing the cloud albedo (or Twomey) effect but not any other aerosol–cloud effects.
EC-Earth3-AerChem (van Noije et al., 2021) is an extended version of EC-Earth3 (Döscher et al., 2022) that can simulate tropospheric aerosols, methane, ozone, and atmospheric chemistry. It utilizes the McRad radiation package, which includes an SW and LW radiation scheme that is based on the Rapid Radiative Transfer Model for General Circulation Models (RRTMG) (van Noije et al., 2021). It treats the radiative transfer in clouds using the Monte Carlo independent column approximation (McICA) (Morcrette et al., 2008). Atmospheric chemistry and aerosols are simulated with the Tracer Model version 5 release 3.0 (TM5-mp 3.0), which includes sulfate, black carbon, organic aerosols, mineral dust, and sea salt (van Noije et al., 2021). The modal aerosol microphysical scheme M7 (Vignati et al., 2004) describes the aforementioned aerosol species and is made up of four water-soluble modes (nucleation, Aitken, accumulation, and coarse) and three insoluble modes (Aitken, accumulation, and coarse), with each mode being described by a lognormal size distribution that has a fixed geometric standard deviation. M7 describes the evolution of the total mass and particle number of each species for each mode and accounts for water uptake, new particle formation, and aging through coalescence and condensation (Vignati et al., 2004).
The GFDL-ESM4 model (Dunne et al., 2020; Horowitz et al., 2020) consists of the Geophysical Fluid Dynamics Laboratory's (GFDL's) Atmosphere Model version 4.1 (AM4.1), which includes an interactive tropospheric and stratospheric gas-phase and aerosol chemistry scheme. In contrast to the previous model version (AM4.0), nitrate and ammonium aerosols are treated explicitly, the rate of aging of BC and OC from hydrophobic to hydrophilic forms changes depending on the calculated concentrations of the hydroxyl radical (OH), and the oxidation of SO2 and dimethyl sulfide to produce sulfate aerosols is driven by the gas-phase oxidant concentrations (OH, ozone, and H2O2) and cloud pH (Horowitz et al., 2020). Aerosols are represented as bulk concentrations of sulfate, nitrate, ammonium, and hydrophilic and hydrophobic BC and OC, plus five bins each for sea salt and mineral dust. Sulfate and hydrophilic black carbon aerosols are regarded as being internally mixed by the radiation code.
The MPI-ESM-1-2-HAM model (Lohmann and Neubauer, 2018; Mauritsen et al., 2019; Neubauer et al., 2019e; Tegen et al., 2019) is the latest version of the Max Planck Institute for Meteorology Earth System Model (MPI-ESM1.2) coupled with the Hamburg Aerosol Model version 2.3 (HAM2.3). It contains the atmospheric general circulation model ECHAM6.3 developed by the Max Planck Institute for Meteorology. ECHAM6.3–HAM2.3 uses a two-moment cloud microphysics scheme to study aerosol–cloud interactions and improve the simulation of clouds. The aerosol–cloud interactions are simulated in liquid, mixed-phase, and ice clouds (Neubauer et al., 2019e). The aerosol microphysics module HAM calculates the evolution of aerosol particles considering the species BC, OC, sulfate, sea salt, and mineral dust. In its default version, HAM simulates the aerosol spectrum as the superposition of seven lognormal modes (nucleation, Aitken, accumulation, and coarse modes) (Tegen et al., 2019). For aerosol activation the scheme by Abdul-Razzak and Ghan (2000) (implemented by Stier, 2016) is used, and for autoconversion of cloud droplets to rain the scheme by Khairoutdinov and Kogan (2000) is used.
The MRI-ESM2 model (Kawai et al., 2019; Yukimoto et al., 2019f; Oshima et al., 2020) includes the MRI Chemistry Climate Model version 2.1 (MRI-CCM2.1) atmospheric chemistry model, which computes the evolution and distribution of ozone and other trace gases in the troposphere and middle atmosphere, and the Model of Aerosol Species in the Global Atmosphere mark-2 revision 4-climate (MASINGAR mk-2r4c) aerosol model, which contains BC, OC, non-sea-salt sulfate, mineral dust, sea salt, and aerosol precursor gases (e.g., SO2 and dimethyl sulfide), assuming external mixing for all aerosol species (Yukimoto et al., 2019f). In MASINGAR mk-2r4c the conversion rate of hydrophobic to hydrophilic BC depends on the rate at which condensable materials cover hydrophobic BC, an approach that could reproduce the seasonal variations in BC mass concentrations that are observed over the Arctic region (Oshima et al., 2020).
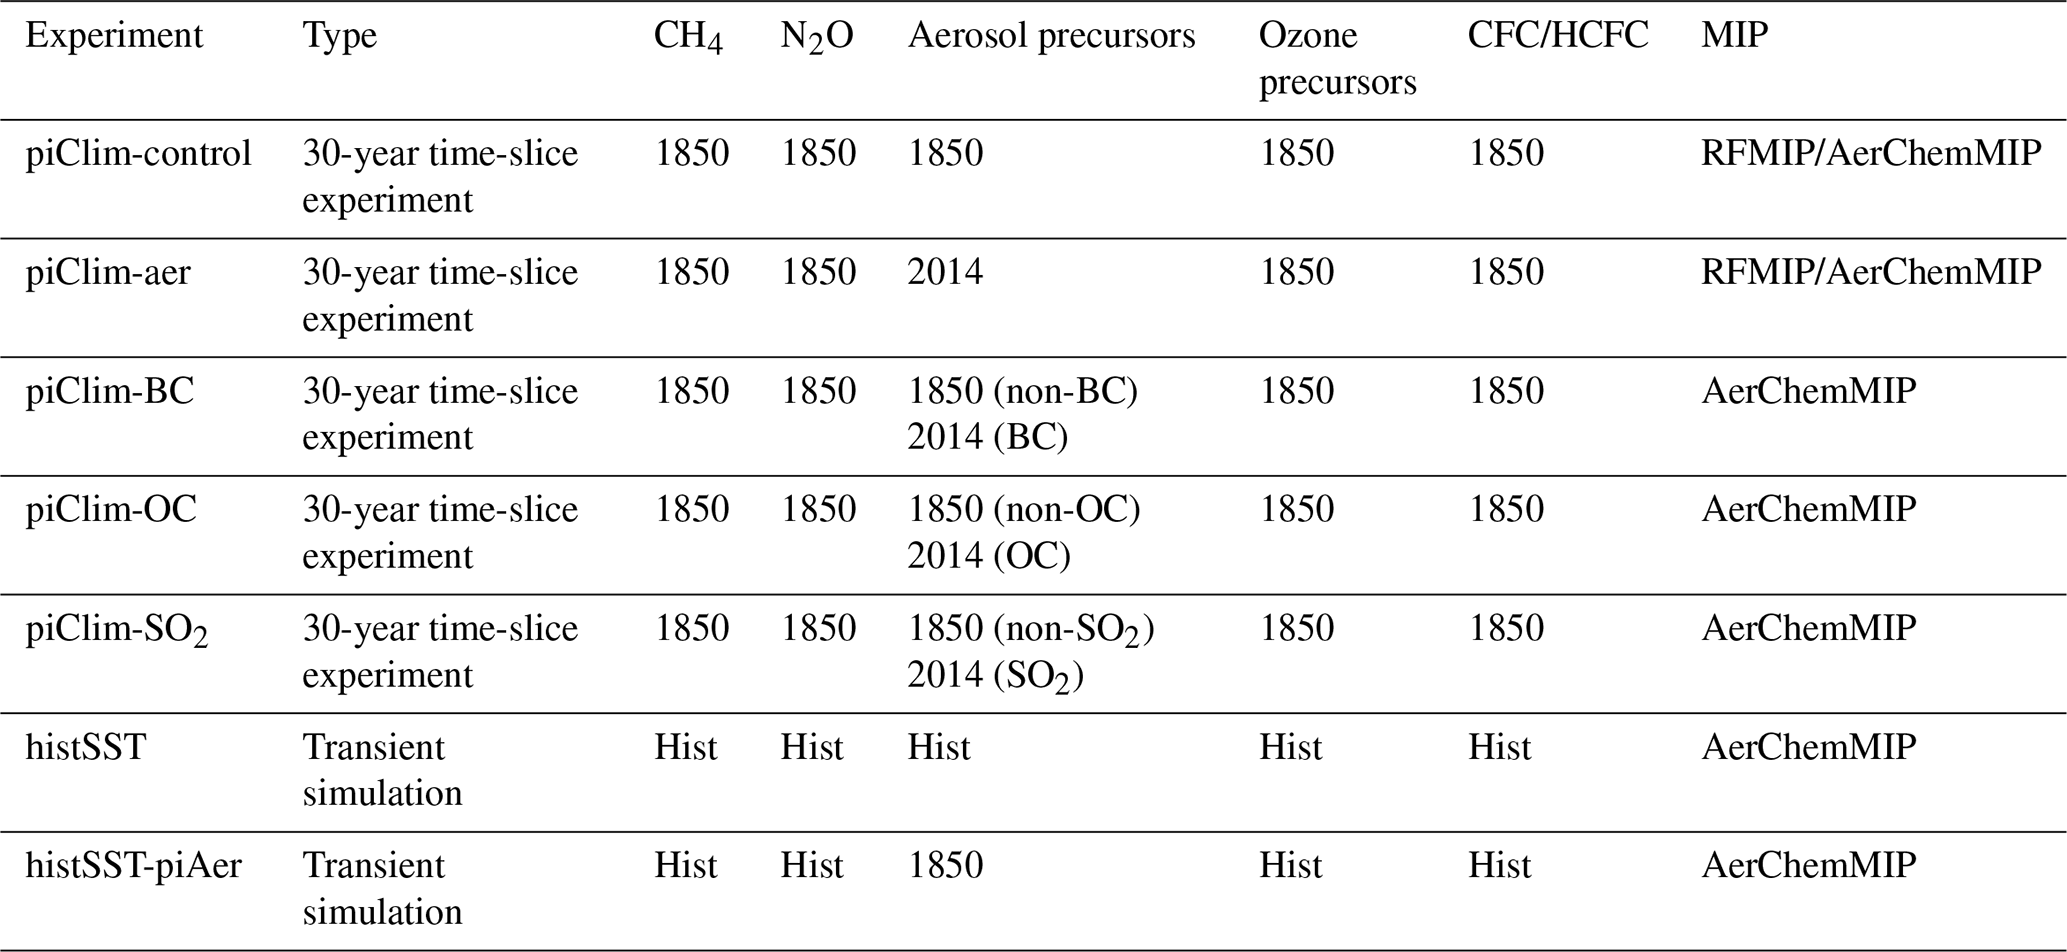
Table 3List of prescribed-SST simulations used in this study. The histSST and histSST-piAer experiments cover the historical period (1850–2014). The piClim experiments are time-slice experiments covering 30 years in total and use pre-industrial climatological average SST and SIC. The year indicates that the emissions or concentrations are fixed to that year, while “Hist” means that the concentrations or emissions evolve as for the CMIP6 “historical” experiment (more information in Collins et al., 2017).
NorESM2-LM (Kirkevåg et al., 2018; Seland et al., 2020) is the “low-resolution” version of the second version of the coupled Norwegian Earth System Model (NorESM2). It employs the CAM6-Nor atmosphere model, which uses parameterization schemes for aerosols and aerosol–radiation–cloud interactions, and the OsloAero6 atmospheric aerosol module, which describes the formation and evolution of BC, OC, sulfate, dust, sea salt, and secondary organic aerosols. The oxidant concentrations of OH, ozone, NO3, and HO2 are prescribed by 3D monthly mean fields (Seland et al., 2020).
The UKESM1 model (Sellar et al., 2020) uses the UK Chemistry and Aerosol (UKCA) interactive stratosphere–troposphere chemistry scheme (UKCA StratTrop) (Archibald et al., 2020) and the GLOMAP microphysical aerosol scheme (Mann et al., 2010). GLOMAP is a two-moment modal aerosol microphysics scheme that simulates the sources, evolution and sinks of black carbon, sulfates, organic matter, and sea salt across five lognormal size modes (Mulcahy et al., 2020). Mineral dust is simulated independently using the CLASSIC dust scheme (Bellouin et al., 2011) and can therefore be regarded as being externally mixed with the aerosols of GLOMAP (Mulcahy et al., 2020).
2.2 CMIP6 simulation description
To quantify the pre-industrial to present-day ERF due to anthropogenic aerosols, ESMs that performed time-slice experiments (Table 3) covering a period of at least 30 years of simulation with a fixed monthly averaged climatology of SSTs and SIC corresponding to the year 1850 were used. Each model performed five time-slice experiments: one control experiment (piClim-control) and four perturbation experiments (piClim-aer, piClim-BC, piClim-OC, and piClim-SO2). Albeit not truly pre-industrial, the year 1850 is regarded as a pre-industrial period in an attempt to create a stable near-equilibrium climate state that represents the period before the beginning of large-scale industrialization (Eyring et al., 2016). The number of simulation years chosen for the aforementioned experiments is the minimum value in order to account for internal variability, which generates substantial interannual variability in the ERF estimates (Collins et al., 2017), and to constrain global forcing to within 0.1 W m−2 (Forster et al., 2016). In cases where simulations were longer than 30 years, only the final 30-year period was chosen. The piClim-control simulation uses fixed 1850 values for concentrations of well-mixed greenhouse gases including CO2, methane, nitrous oxide, aerosols and aerosol precursors, ozone precursors and halocarbon emissions or concentrations, and land use and solar irradiance. Each perturbation simulation is run similarly for the same 30-year period as the control simulation, keeping the SSTs and SIC fixed to pre-industrial levels (1850) but setting one or more of the specified species (concentrations or emissions) to present-day (2014) values (Collins et al., 2017). Consequently, piClim-BC, piClim-OC, and piClim-SO2 experiments use precursor emissions of 2014 for BC, OC, and SO2 (which is the precursor of sulfates), respectively, while all other forcings are set to 1850 values. In the piClim-aer simulation, all anthropogenic aerosol precursor emissions are set to 2014 values with all other forcings set to 1850 values.
In order to calculate the transient aerosol ERF over the historical period, ESMs which performed transient historical experiments for the period between 1850 and 2014 with prescribed SSTs and sea ice were considered. The histSST and histSST-piAer experiments share the same forcings as the “historical” experiment (see also Eyring et al., 2016), and both use the monthly mean time-evolving SST and sea ice values from one ensemble member of the historical simulations (the same SSTs and sea ice values are used for both the control and perturbation experiments), but the latter uses aerosol precursor emissions of the year 1850 (Collins et al., 2017). While this is technically not an ERF (since SSTs and SIC are evolving), the impact of transient SSTs and sea ice on ERF diagnosis is regarded as being small (Forster et al., 2016; Collins et al., 2017). For the purpose of comparing the present-day ERF of anthropogenic aerosols between the piClim and the histSST experiments, the last 20 years of the historical period (1995–2014) were chosen because it is the most recent period available in CMIP6 histSST simulations while mitigating the effects of the negative ERF peak around 1980 (Szopa et al., 2021). We performed this comparison to show the consistency between the all-anthropogenic-aerosol ERFs calculated using two different sets of experiments.
2.3 Methodology
ERF is regarded as the change in net downward TOA radiative flux after allowing both tropospheric and stratospheric temperatures, water vapor, and clouds, and some surface properties that are not coupled to any global surface air temperature change, to adjust (Smith et al., 2018; Forster et al., 2021). By fixing SSTs and SIC at climatological values, all other parts of the system are allowed to respond until reaching steady state (Hansen, 2005). This allows for ERF to be diagnosed as the difference in the net flux at the TOA between the perturbed experiments and the control simulation (Hansen, 2005; Sherwood et al., 2015). The fixed-SST method is less sensitive to internal climate variability as it benefits from the long averaging times and the absence of interannual ocean variability in the perturbed and control simulations (Sherwood et al., 2015), and it can reduce the 5 %–95 % confidence range of ERF estimations up to 0.1 W m−2 (Forster et al., 2016). The ERF of anthropogenic aerosols was analyzed here following the method of Ghan (2013), which is also known as the “double call” method, meaning that the ESM radiative flux diagnostics are calculated a second time, neglecting aerosol scattering and absorption (Ghan, 2013). In order to distinguish and quantify the magnitude of different processes to the total ERF, the effective radiative forcing was split into three main components: (a) ERFARI, which represents the aerosol–radiation interactions (i.e., scattering and absorption of radiation by aerosol particles; Eq. 1); (b) ERFACI, which accounts for all changes in clouds and aerosol–cloud interactions (i.e., the effects of aerosols on cloud radiative forcing; Eq. 2); and (c) ERFALB, which is Ghan's other forcing term and is mostly the contribution of surface albedo changes in the SW that are caused by aerosols (Eq. 3) (Ghan, 2013). Consequently, the sum of ERFARI, ERFACI, and ERFALB gives an approximation of the overall ERF of aerosol species (Eq. 4):
where F is the net (downward minus upward) radiative flux at the TOA; Faf (af: aerosol-free) is the flux calculated ignoring the scattering and absorption by aerosols, despite their presence in the atmosphere (i.e., aerosol-free forcing); Fcsaf (csaf: clear-sky, aerosol-free) is the flux calculated neglecting the scattering and absorption by both aerosols and clouds; and Δ denotes the difference between the perturbation and the control experiment. The ERFACI term is an estimate of anthropogenic aerosol effects on cloud radiative forcing, which is the sum of aerosol indirect effects and semi-direct effects (Ghan et al., 2012; Ghan, 2013; Zelinka et al., 2023). The term ERFALB is not only influenced by aerosol-induced changes in surface albedo (Zelinka et al., 2023), but it is used here for compatibility purposes with the respective term used in the paper of Ghan (2013). As shown in the work of Zelinka et al. (2023), the SW ERFALB includes the change in net radiation caused by surface albedo changes, the aerosol-free clear-sky radiative contributions from humidity changes, and a masking term which represents the radiative impact of surface albedo changes that is attenuated by the presence of both aerosols and clouds. On the other hand, the LW component of ERFALB includes the aerosol-free clear-sky radiative contributions from changes in temperature and humidity (Zelinka et al., 2023).
In this work, piClim-control was subtracted from piClim-aer, piClim-BC, piClim-OC, and piClim-SO2 in order to calculate the present-day anthropogenic aerosol ERF (from all aerosols, BC, OC, and sulfates, respectively) on a global scale, and histSST-piAer was subtracted from histSST to estimate the transient anthropogenic aerosol ERF during the 1995–2014 period. Moreover, the time evolution of the total ERF and its decomposition into ERFARI, ERFACI, and ERFALB during the historical period (1850–2014) was examined globally and over certain reference regions. The approach described above was implemented for both the SW and LW radiation, with their sum providing an estimation of the total ERF for each component (Eqs. 5–8):
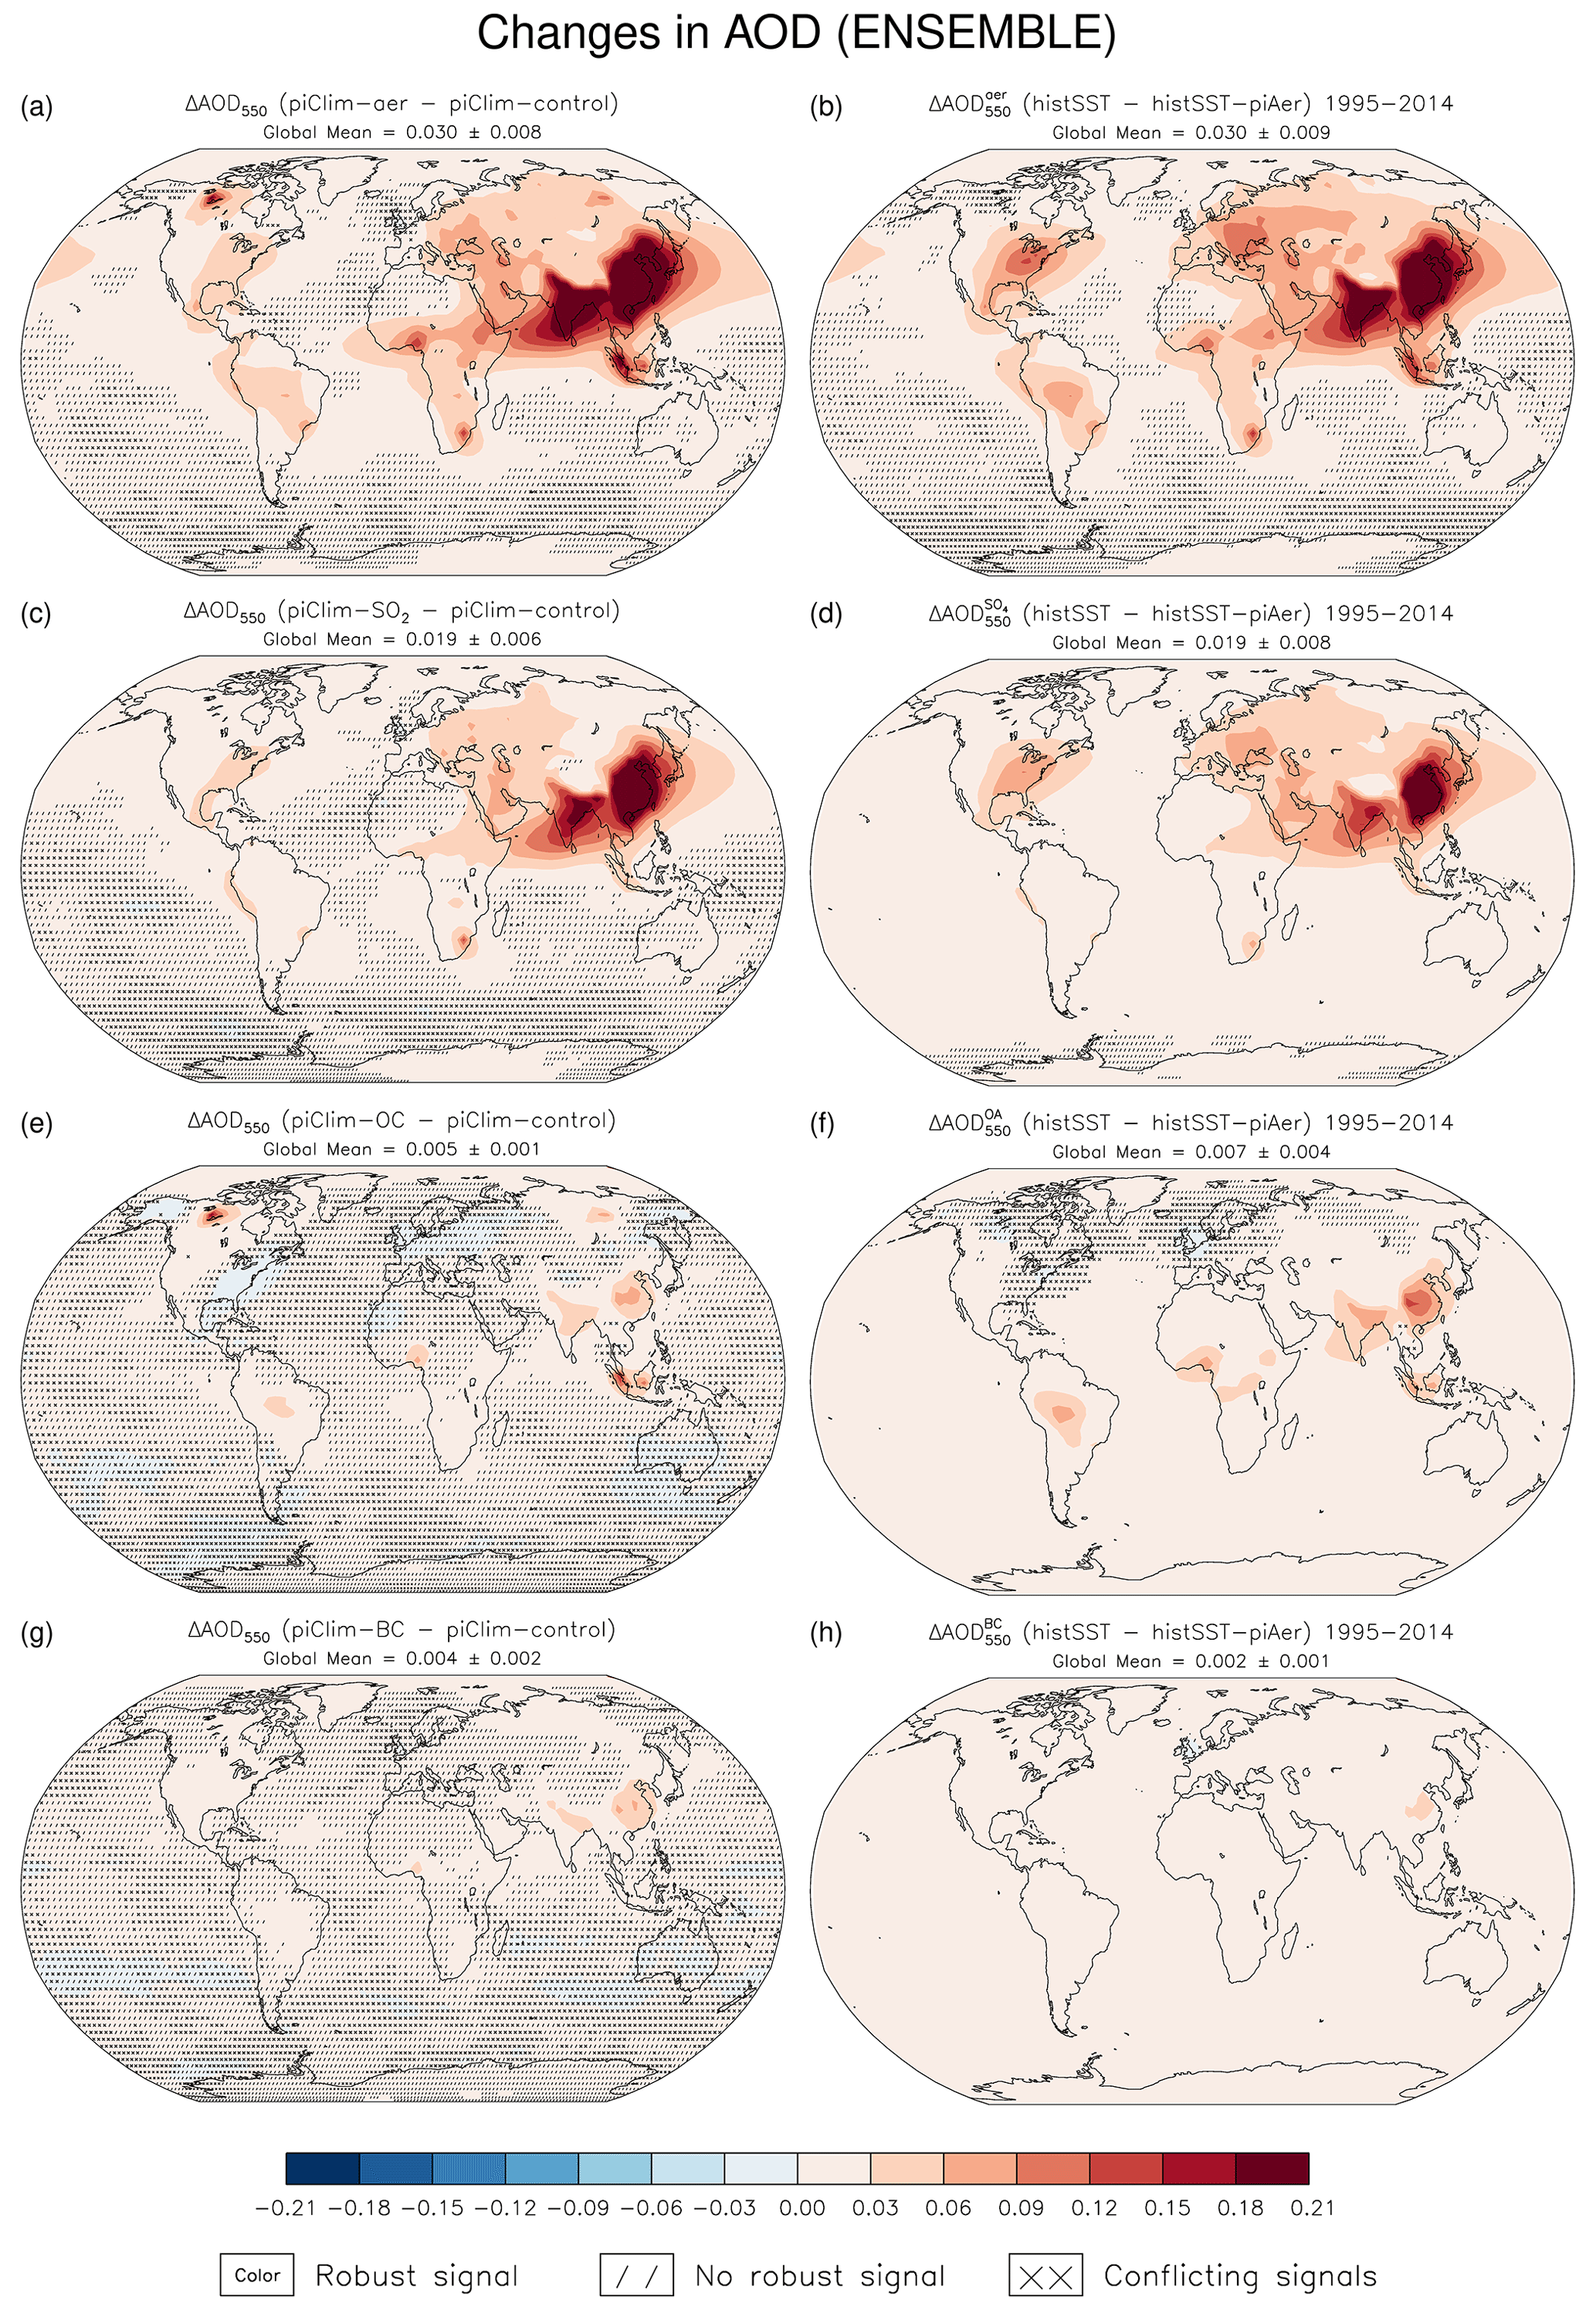
Figure 1Changes in AOD at 550 nm due to all anthropogenic aerosols (a, b), SO2 and sulfates (c, d), OC and anthropogenic organic aerosols (e, f), and BC (g, h) relative to the pre-industrial era. The spatial distribution is shown for the multi-model ensembles of the piClim (a, c, e, g) and histSST (averaged over 1995–2014; b, d, f, h) experiments, respectively. The global mean ΔAOD is presented along with the inter-model variability (1 standard deviation). Colored areas devoid of markings indicate robust changes, while hatched (/) and cross-hatched (X) areas indicate non-robust changes and conflicting signals, respectively. In panels (d), (f), and (h) only a subset of the models was analyzed (see main text).
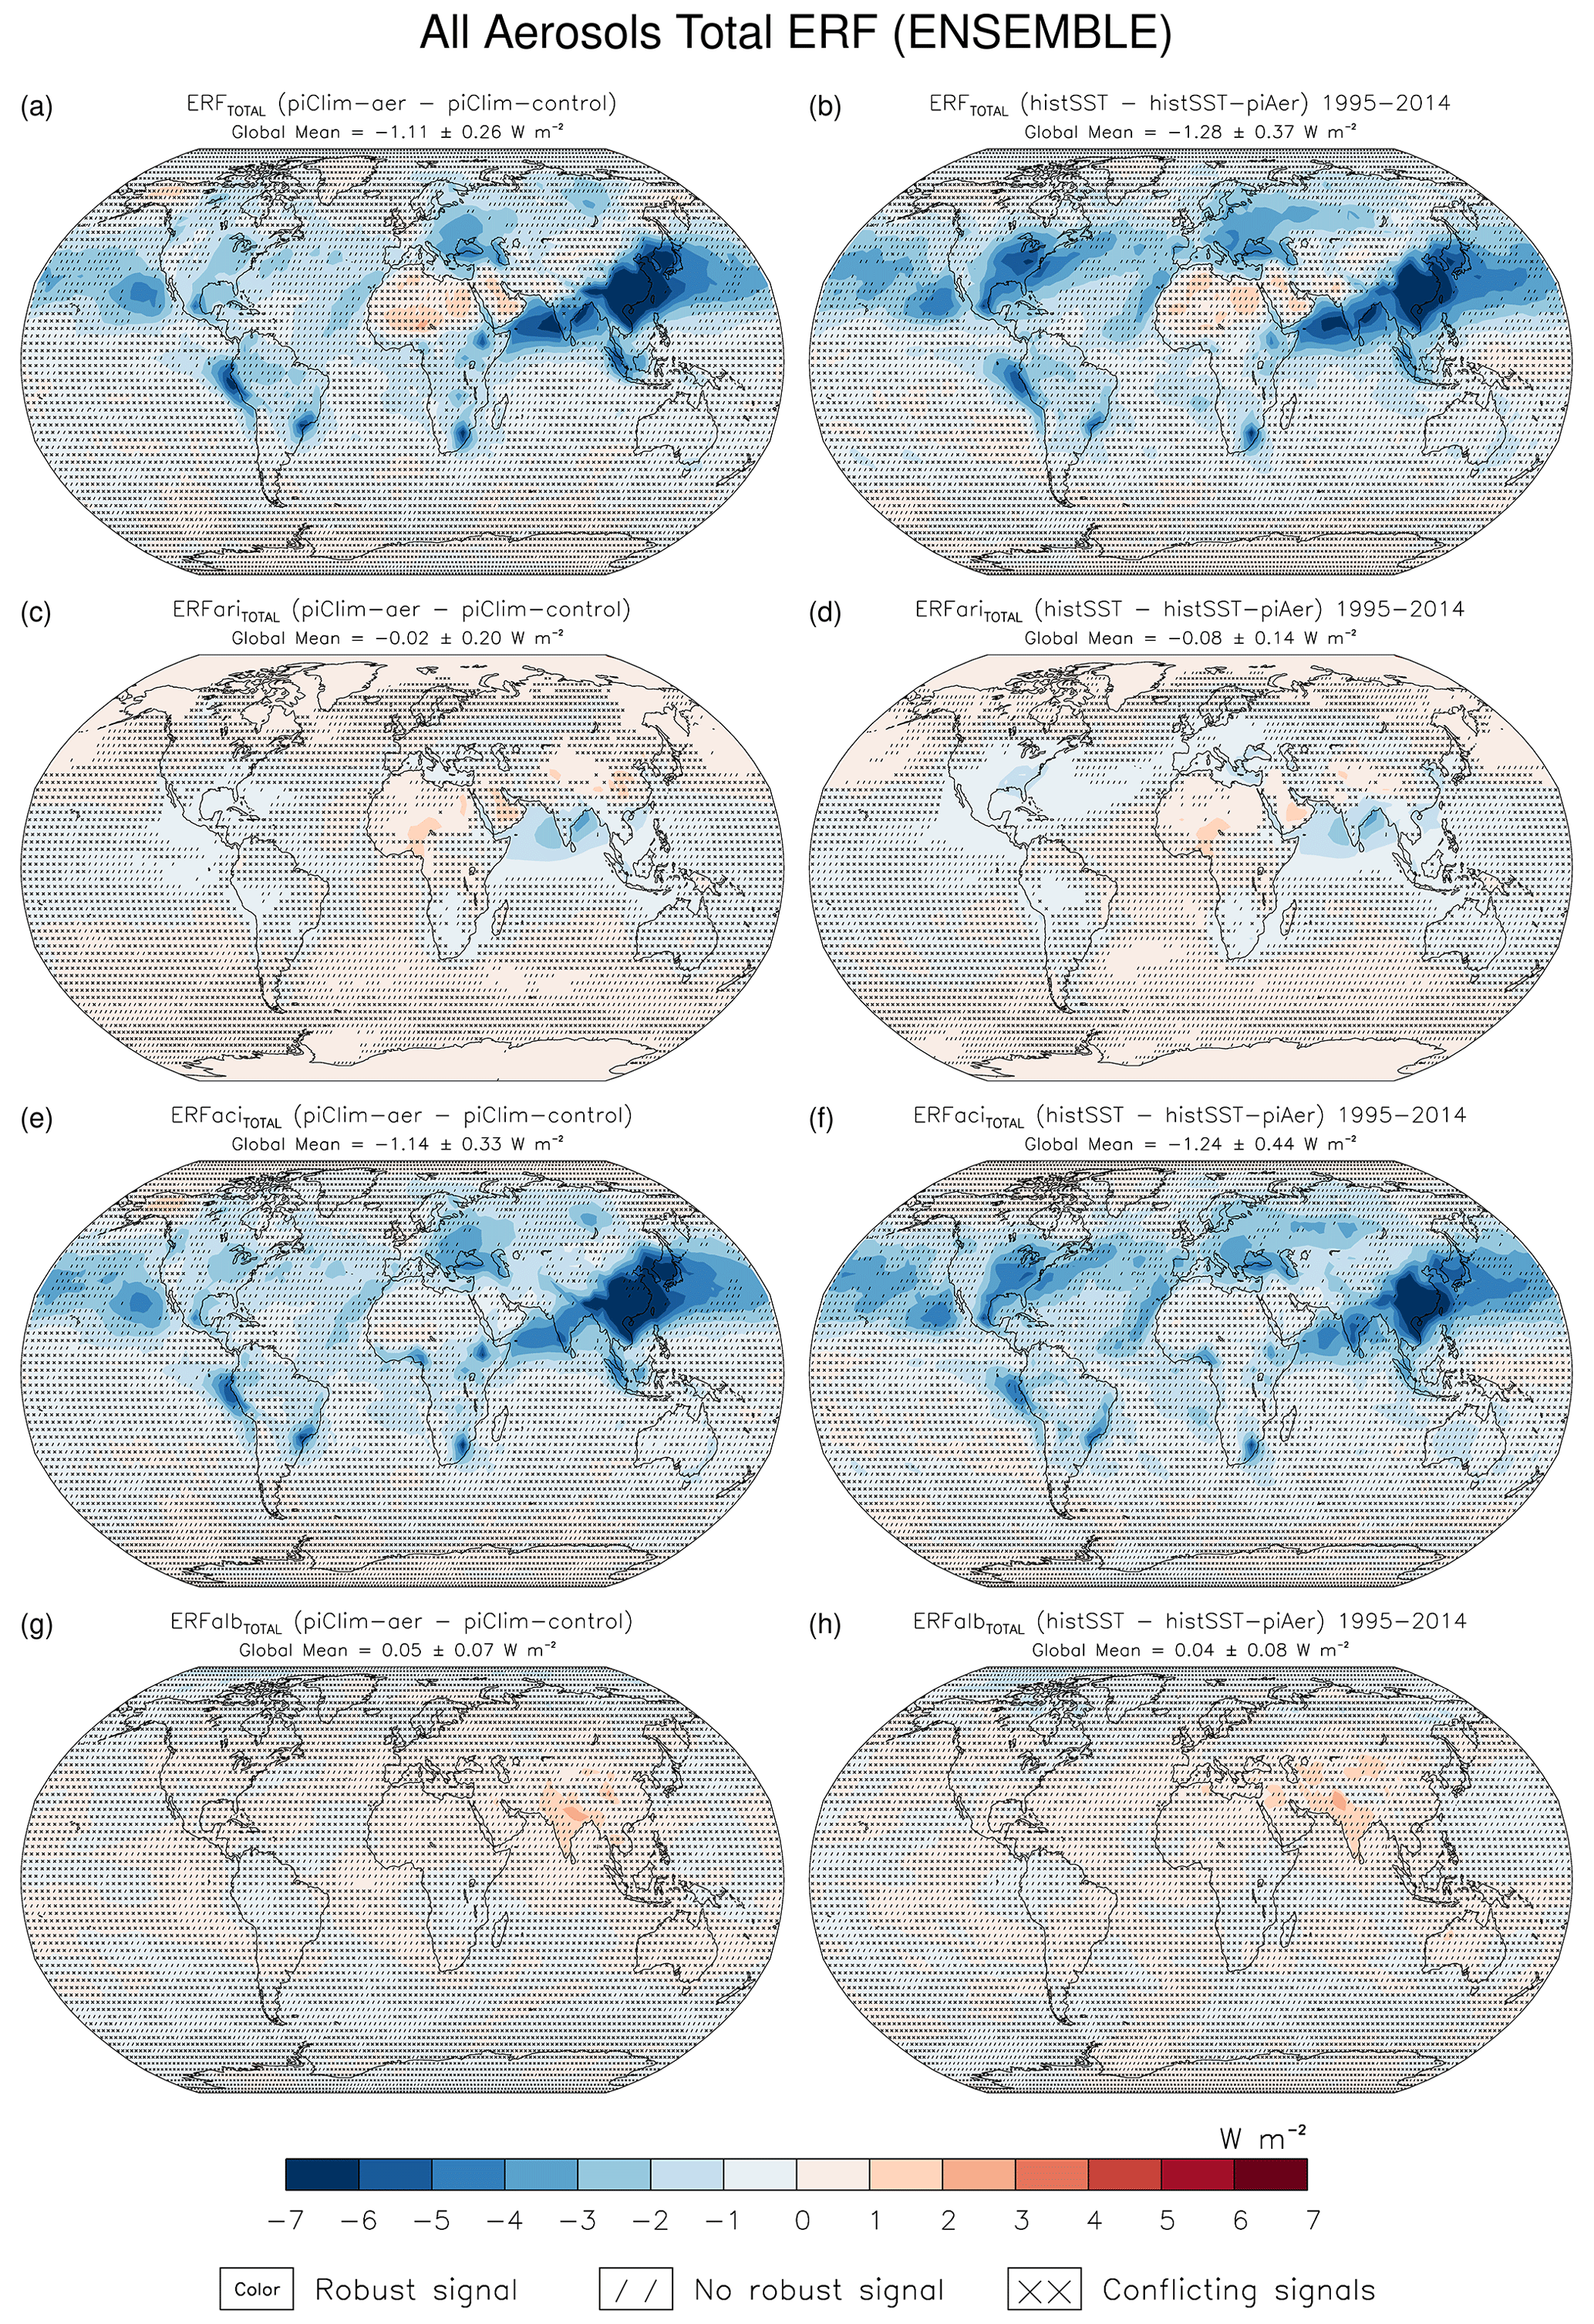
Figure 2The total (SW + LW) ERF due to all anthropogenic aerosols relative to the pre-industrial era. The TOA spatial distribution is presented for the multi-model ensembles of the piClim (a, c, e, g) and histSST (averaged over 1995–2014; b, d, f, h) experiments, respectively. The global mean total ERF (a, b), ERFARI (c, d), ERFACI (e, f), and ERFALB (g, h) are shown along with the inter-model variability (1 standard deviation). Colored areas devoid of markings indicate robust changes, while hatched (/) and cross-hatched (X) areas indicate non-robust changes and conflicting signals, respectively.

Figure 3As in Fig. 2 but for piClim-SO2 (a, d, g, j), piClim-OC (b, e, h, k), and piClim-BC (c, f, i, l).
Due to differences in the spatial horizontal resolution of the ESMs (Table 2), all data were regridded to a common spatial grid (2.8125° × 2.8125°) by applying bilinear interpolation prior to processing. Due to a lack of aerosol-free diagnostics (see Table A1 in Appendix A for the description of the CMIP6 variables used in this study), EC-Earth3-AerChem was not included in the piClim-BC, piClim-OC, and piClim-SO2 analyses, while MRI-ESM2-0 was not included in the histSST analysis. Along with ERF, the differences in aerosol optical depth (AOD) at 550 nm due to present-day anthropogenic aerosols were also calculated for both the piClim and histSST sets of experiments for comparison purposes. The statistical significance of both ERF and ΔAOD results was tested at the 95 % confidence level using a paired sample t-test that was conducted to the results of each model. The robustness of the multi-model ensemble results in Figs. 1–3 was estimated based on the statistical significance of each model's results and the agreement on the sign of change between ESMs. The exact criteria for determining the robustness of the results are described in Table A2 within Appendix A.
3.1 AOD changes in piClim and histSST experiments
The magnitude of ERF is affected by aerosol concentrations in the atmosphere. Thus, the differences in pre-industrial to present-day ambient aerosol optical depth (ΔAOD) at 550 nm due to aerosols are presented in Fig. 1, serving as an indicator of the amount of aerosols in the atmosphere. AOD is the column-integrated measure of solar intensity extinction caused by aerosols at a given wavelength also being related to aerosol mass concentrations (Szopa et al., 2021). The multi-model annual mean ΔAOD between piClim-aer and piClim-control simulations (which represents the change in AOD over the 1850–2014 period) is 0.0299 ± 0.0082 (all ranges are given as 1 standard deviation across models), a value that is very close to the mean annual difference between histSST and histSST-piAer for the period 1995–2014 (the period closest to the end of the historical period, hereafter denoted as EHP), which is calculated to be 0.0302 ± 0.0088. The ΔAOD for all aerosols is positive over most of the globe, with the highest values found primarily over southern and eastern Asia and secondarily over Indonesia, Europe, and the eastern United States (Fig. 1a and b). Four ΔAOD regimes can be distinguished: (a) high-to-medium ΔAOD over land (eastern and southern Asia, eastern Europe, Middle East, and eastern North America), (b) medium-to-low ΔAOD over land (North and South America, western Europe, Greenland, Oceania, Antarctica, and the Arctic), (c) high-to-medium ΔAOD over ocean (northwestern Pacific and northernmost Indian), and (d) medium-to-low ΔAOD over ocean (Atlantic, South Pacific, and southern Indian).
Spatial distribution of the ambient ΔAOD is notably influenced by the pattern of sulfates, with the mean global SO4 AOD difference being 0.0191 ± 0.0057 and 0.0191 ± 0.0077 for the piClim and histSST experiment sets, respectively, which is almost equal to two-thirds of the ambient AOD difference (Fig. 1c and d). Organic aerosols exhibit quite a different pattern to sulfates, as their peak positive AOD differences are confined to biomass burning regions. The global mean AOD difference between piClim-OC and piClim-control is 0.0046 ± 0.0011 and 0.0073 ± 0.0039 between that of histSST and histSST-piAer corresponding to EHP (Fig. 1e and f). The highest positive changes between pre-industrial and present-day AOD for black carbon are over eastern and southern Asia, with an annual global value of 0.0040 ± 0.0018 for the piClim experiments and 0.0018 ± 0.0005 for the EHP in histSST experiments (Fig. 1g and h). Note that the AOD changes for sulfates (Fig. 1d), organic aerosols (Fig. 1f), and black carbon (Fig. 1h) were calculated only for a subset of models (CNRM-ESM2-1, EC-Earth3-AerChem, GFDL-ESM4, and NorESM2-LM), which were the only ones that provided the necessary CMIP6 variables (od550so4, od550oa, and od550bc, respectively; Table A1). The global mean values of AOD changes for each model and each experiment can be found in Table S1 in the Supplement.
3.2 Decomposition of ERF for all anthropogenic aerosols
Following Ghan (2013), the TOA radiative flux difference between the control and perturbation simulations in both shortwave (SW) and longwave (LW) was calculated for each of the models to estimate the total (SW + LW) aerosol ERF. The multi-model global mean values for the total ERF and its decomposition into ERFARI, ERFACI, and ERFALB are presented in Table 4 and in Figs. 2–5. The global mean values of SW and LW ERF for each model and each experiment are provided in Tables S2–S4, while the SW and LW ERF patterns at TOA for the multi-model ensemble are shown in Figs. S1 and S2 in the Supplement, respectively.
As seen in Fig. 2, the global mean ERF due to pre-industrial to present-day changes in all anthropogenic aerosols is −1.11 ± 0.26 W m−2, while the mean total ERF value during EHP is calculated to be −1.28 ± 0.37 W m−2 (Fig. 2a and b). There are small differences in ERF for EHP calculated in this study versus that shown by Szopa et al. (2021), which are related to a weighting issue in the global mean net ERF in Fig. 6.11 in IPCC WGI AR6 Chapter 6 that accounts for an excess of −0.25 W m−2 at the peak. The authors of Szopa et al. (2021) are working to remedy this record. In the current analysis, the global mean total ERF during that period (1965–1984) is calculated to be −1.27 ± 0.43 W m−2. Although there are slight differences over certain regions, quite a common spatial TOA pattern for ERF emerges between piClim-aer and histSST experiments: anthropogenic aerosols induce a negative total ERF over the globe, especially over the NH, with the most negative values mainly over eastern Asia, followed by southern Asia, Europe, and North America, while the most positive values are found over reflective continental surfaces, such as the Sahara, Alaska, Greenland, and the Arabian Peninsula (Fig. 2a and b). The high surface albedo of the latter regions decreases (increases) the effect of scattering (absorbing) aerosols, thus leading to a positive ERF (Myhre et al., 2013; Shindell et al., 2013; Zanis et al., 2020). The areas with peak negative ERF values are a robust feature among all ESMs included in this study, despite any differences in ERF magnitude (Figs. S3 and S4).
Clearly, ERFACI dominates the total ERF on a global scale, as it exhibits a pattern almost identical to that of the total ERF (Fig. 2e and f). The multi-model mean ERFACI in piClim-aer is −1.14 ± 0.33 W m−2, while the histSST ERFACI is estimated at −1.24 ± 0.44 W m−2 during EHP. The impact of aerosol–cloud interactions on the total ERF is highlighted, as peak negative ERFACI regions coincide with the ones of total ERF for both experiments. The mean ERFARI is slightly negative globally, although not statistically significant, with a mean value of −0.02 ± 0.20 W m−2 for piClim-aer and −0.08 ± 0.14 W m−2 for histSST experiments. In both cases, peak positive values of ERFARI, which can be attributed to absorbing aerosol particles, are found over parts of central Africa, the Arabian Desert, and continental eastern Asia, whereas the most negative values are detected over the oceanic regions surrounding India. Interestingly, ERFARI is positive over the Arctic and Antarctica (Fig. 2c and d). On the other hand, ERFALB is slightly positive on a global scale and is calculated to be 0.05 ± 0.07 W m−2 and 0.04 ± 0.08 W m−2 for the piClim-aer and histSST (1995–2014) simulations, respectively. The highest ERFALB values appear particularly over the Himalayas and the adjacent regions in southern Asia, while mostly negative values are seen over the poles (Fig. 2g and h).
It should be noted that the global mean ERF values show significant differences among the ESMs (Tables S2–S4 and Figs. S3 and S4). The CNRM-ESM2-1 and GFDL-ESM4 models produce the weakest total ERF due to their small ERFACI. The decreased ERF magnitude of GFDL-ESM4 compared with their previous-generation AM3 model can be attributed to a reduction in the strength of the aerosol indirect effect due to changes in the model's horizontal resolution and modifications in representations of certain aerosol processes (Zhao et al., 2018; Horowitz et al., 2020), while CNRM-ESM2-1 only represents the first indirect (i.e., cloud albedo) effect without the inclusion of any secondary aerosol indirect effects (impacts on precipitation; Michou et al., 2020). On the other hand, EC-Earth3-AerChem, MPI-ESM-1-2-HAM, and NorESM2-LM exhibit a strongly negative ERFACI. In the case of MPI-ESM-1-2-HAM, the strongly negative ERFACI probably results from an overestimation of cloud-top cloud droplet number concentrations, leading to a subsequent overestimation of SW cloud radiative effect in regions where shallow convective clouds are common (Neubauer et al., 2019e). Another reason for the strongly negative ERFACI in MPI-ESM-1-2-HAM could be the highly negative liquid water path adjustments calculated in ECHAM6.3-HAM2.3, on which MPI-ESM-1-2-HAM is based (Gryspeerdt et al., 2020).
3.3 Decomposition of ERF for different anthropogenic aerosol types
To quantify the effect of different aerosol species on the total radiative forcing induced by anthropogenic aerosols, ERF was calculated for piClim-BC, piClim-OC, and piClim-SO2 (there are no equivalent transient historical simulations of single-aerosol species with prescribed SSTs for comparison) in the same manner as in Sect. 3.2 (Table 4 and Fig. 3). The global mean values of SW and LW ERF for experiments of each model and each aerosol type can be found in Tables S2–S3, while the SW and LW ERF patterns at TOA for the multi-model ensemble are shown in Figs. S5 and S6, respectively. The ERF decomposition for each model for piClim-SO2, piClim-OC, and piClim-BC are presented in Figs. S7–S9, respectively.
Table 4Global mean ERF values (in W m−2) for the piClim experiments (piClim-aer, piClim-SO2, piClim-OC, and piClim-BC), and the transient (histSST) experiment averaged over the 1995–2014 period. The total ERF and its decomposition into ERFARI, ERFACI, and ERFALB are presented for each ESM, along with the multi-model ensemble mean and the inter-model variability (SD: 1 standard deviation).

There is a pronounced similarity between piClim-aer and piClim-SO2 in both the global means and the spatial TOA pattern of the total ERF (Fig. 3), consistent with the dominant contribution of sulfate AOD to ambient AOD changes. Sulfate particles highly scatter incoming SW solar radiation, causing a negative ERF over the NH, in general, and over the emission sources (i.e., continental eastern and southern Asia, followed by Europe and North America) and downwind regions, in particular, thus playing a dominant role in the overall TOA radiative forcing. The global mean total ERF due to SO4 is −1.11 ± 0.31 W m−2 (Fig. 3a), nearly equal to the total ERF in the combined-aerosol experiment (piClim-aer). However, there is a larger contribution to the total sulfate ERF from its ARI component, which is almost entirely negative over the globe (Fig. 3d), with peak negative values over eastern and southern Asia, and a global mean value of −0.32 ± 0.12 W m−2. Furthermore, sulfate ERFACI is almost 30 % less negative than the respective ERFACI in piClim-aer, with a multi-model mean value of −0.83 ± 0.23 W m−2, peaking over eastern Asia and driving the bulk of total ERF from SO4 (Fig. 3g). The global mean ERFALB of piClim-SO2 is 0.03 ± 0.09 W m−2, showing a positive peak over the northern part of the Middle East, which is not statistically significant (Fig. 3j).
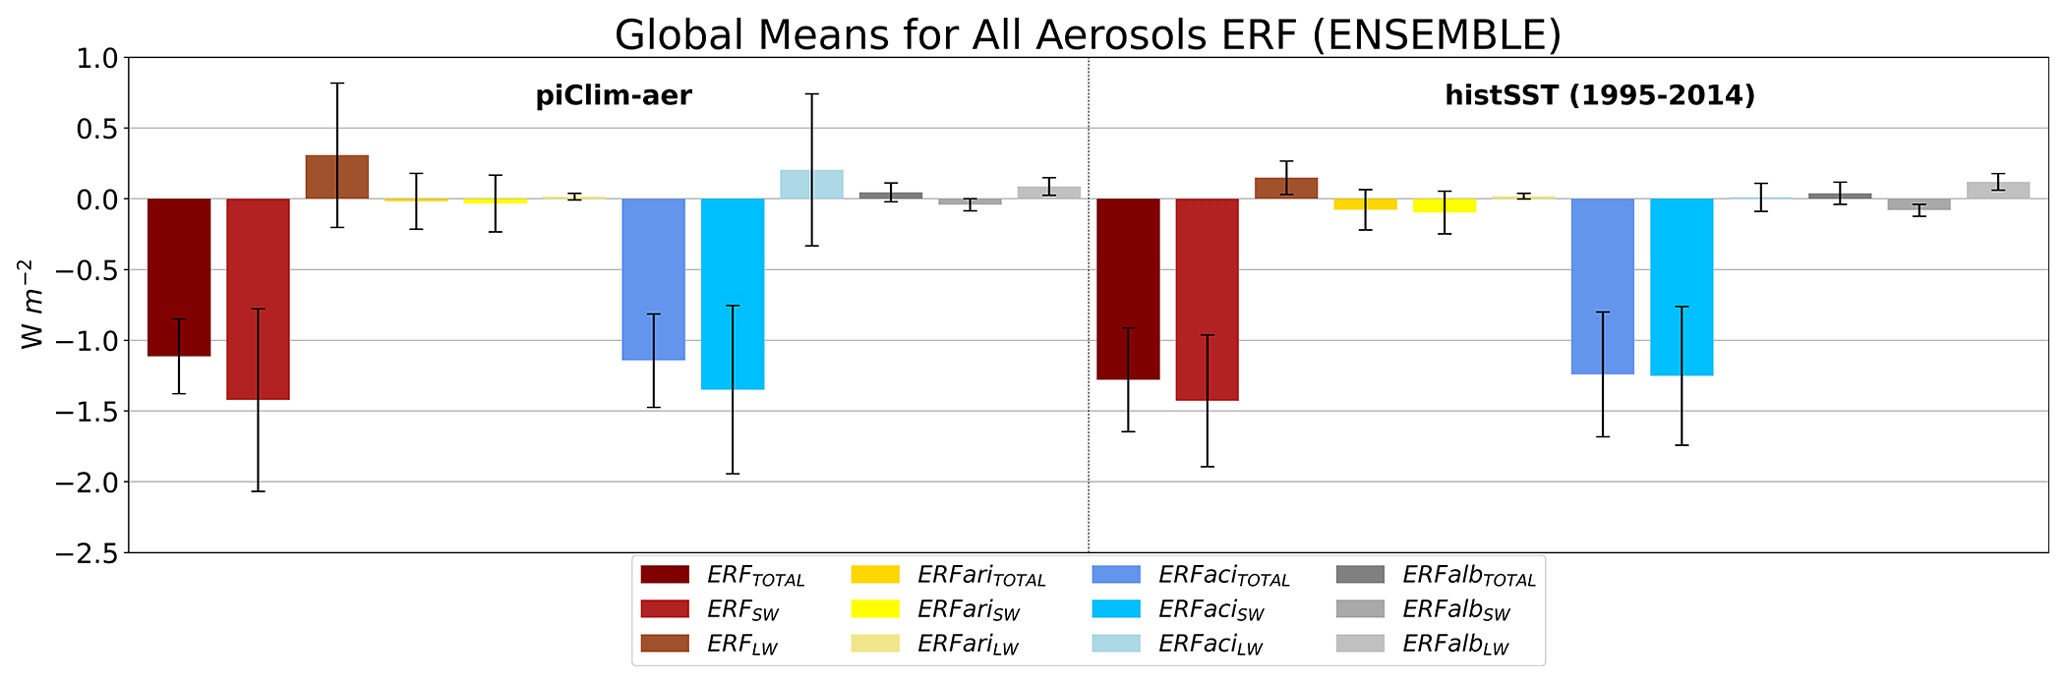
Figure 4Global multi-model mean SW, LW, and total ERF values for the piClim-aer and histSST (averaged over 1995–2014) experiments. The error bars indicate inter-model variability (1 standard deviation).
Organic carbon causes a less negative ERF on the climate system than sulfates, with a global mean value of −0.35 ± 0.21 W m−2, which peaks over southeastern Asia (Fig. 3b). ERFACI is estimated to be −0.27 ± 0.24 W m−2 and greatly affects the total ERF pattern (Fig. 3h). Despite having a globally negative mean value, the ERF pattern at TOA due to OC (in piClim-OC) does not resemble that of piClim-SO2 or piClim-aer, which can be attributed to different emission sources and radiative properties (see also Li et al., 2022). For instance, in piClim-OC there is an evident positive ERF over the eastern United States and western Europe, regions where negative ERF was detected in piClim-aer and piClim-SO2. ERFARI due to OC is negative over most continental regions (Fig. 3e), with a global mean value of −0.08 ± 0.04 W m−2, while the global mean sign of ERFALB is unclear as the global mean forcing is estimated at 0.01 ± 0.03 W m−2 (Fig. 3k).
Black carbon is the most absorbing aerosol species (Myhre et al., 2013), and it strongly absorbs light at all visible wavelengths (Bond et al., 2013), thus inducing a positive ERF at TOA (Ramanathan and Carmichael, 2008). Globally the mean total ERF caused by BC is calculated to be 0.19 ± 0.18 W m−2, with pronounced positive peaks over southern and eastern Asia, the Arabian Desert, and central Africa (Fig. 3c). In contrast to the above piClim perturbation simulations, the spatial distribution of total BC ERF at TOA is principally affected by ERFARI instead of ERFACI, with the former having a global mean value greater than the total ERF by a factor of nearly 2 (Table 4). BC ERFARI is positive all over the globe and has a mean value of 0.39 ± 0.19 W m−2, peaking over the same regions as total BC ERF (Fig. 3f), while ERFACI is −0.20 ± 0.30 W m−2 and shows no statistically significant peaks (Fig. 3i). The global mean sign of BC ERFALB is also not clear, as it is calculated to be 0.00 ± 0.05 W m−2, with the most positive (although not statistically significant) values detected over southern continental Asia (Fig. 3l).
3.4 SW and LW contributions to ERF
Investigation of the relative contribution from SW and LW ERFs to the total ERF reveals that the SW component is mainly responsible for the total ERF values calculated using the Ghan (2013) method. In Figs. 4 and 5 the total, SW, and LW values for ERFARI, ERFACI, and ERFALB, as well as their sum, are shown for the combined-aerosol experiments (Fig. 4) and the single-aerosol-species experiments (Fig. 5). The SW and LW values for all ERF components in every experiment are presented for each model and their ensemble in Tables S2–S4.
In the all-aerosol simulations (piClim-aer and histSST averaged over the EHP), although all SW (LW) ERF components have negative (positive) values, in the cases of ERFARI and ERFACI the SW component has higher absolute values than the LW and greatly influences their respective total ERF values, whereas the opposite applies to ERFALB (Fig. 4). Total ERFARI exhibits a larger spread among ESMs in piClim (varying from −0.32 to 0.26 W m−2) than in histSST (with values ranging from −0.27 to 0.08 W m−2), whereas the opposite stands for the total ERFACI, with a range between −1.57 W m−2 and −0.61 W m−2 in piClim-aer and −1.86 and −0.59 W m−2 in histSST. This shows the similarities between piClim-aer and histSST (averaged over 1995–2014) but also highlights the differences between ESMs in ERFARI and ERFACI. While all models agree on the negative sign of ERFACI for both experiments, there are discrepancies in the sign of ERFARI. In piClim-aer, ERFACI shows the largest inter-model variability among the three main ERF components in both the SW (ranging from −2.49 W m−2 to −0.59 W m−2) and the LW (with a range between −0.17 and 1.49 W m−2), probably owing to different representation of ACI and aerosol microphysical processes among individual ESMs (Bauer et al., 2020; Szopa et al., 2021). GFDL-ESM4, in particular, is the only model with negative total LW ERF (Table S3), whereas MRI-ESM2-0 has the strongest ERFACI in both the SW (Table S2) and LW (Table S3), with large negative SW ERFACI and positive LW ERFACI values caused by the aerosol effects on high-level ice clouds over convective regions in the tropics (Oshima et al., 2020), which eventually cancel each other out in the total ERFACI.
In the histSST experiment (averaged over the EHP) individual ESMs exhibit smaller differences in their ERFACI estimates (i.e., less inter-model variability; Table S4), with values ranging from −1.78 to −0.53 W m−2 in the SW. Their LW counterparts have slightly positive or negative values, resulting in a near-zero LW ERFACI (Table S4), in contrast with the more positive LW ERFACI presented in piClim-aer (Table S3), due to the highly positive LW ERFACI obtained from MRI-ESM2-0. Contributions from ERFARI and ERFALB to the total ERF are much smaller in both the piClim-aer and histSST experiments, with the former having a marginally negative and the latter having a slightly positive global mean value (Fig. 4). As the total SW (LW) ERF is the sum of the three individual SW (LW) ERF components, the global multi-model mean ERF value is a result of a strongly negative SW radiative forcing being offset by a weaker, but not negligible, positive LW forcing at TOA. The total ERFARI is predominantly influenced by SW ERFARI as aerosols interact with the incoming SW radiation through scattering and absorption. It should be borne in mind that not all ESMs agree on the magnitude or even the sign of the individual SW and LW ERF main components (Tables S2–S4) due to uncertainties in the parameterization schemes used in ESMs to describe the way aerosols interact with radiation and clouds.
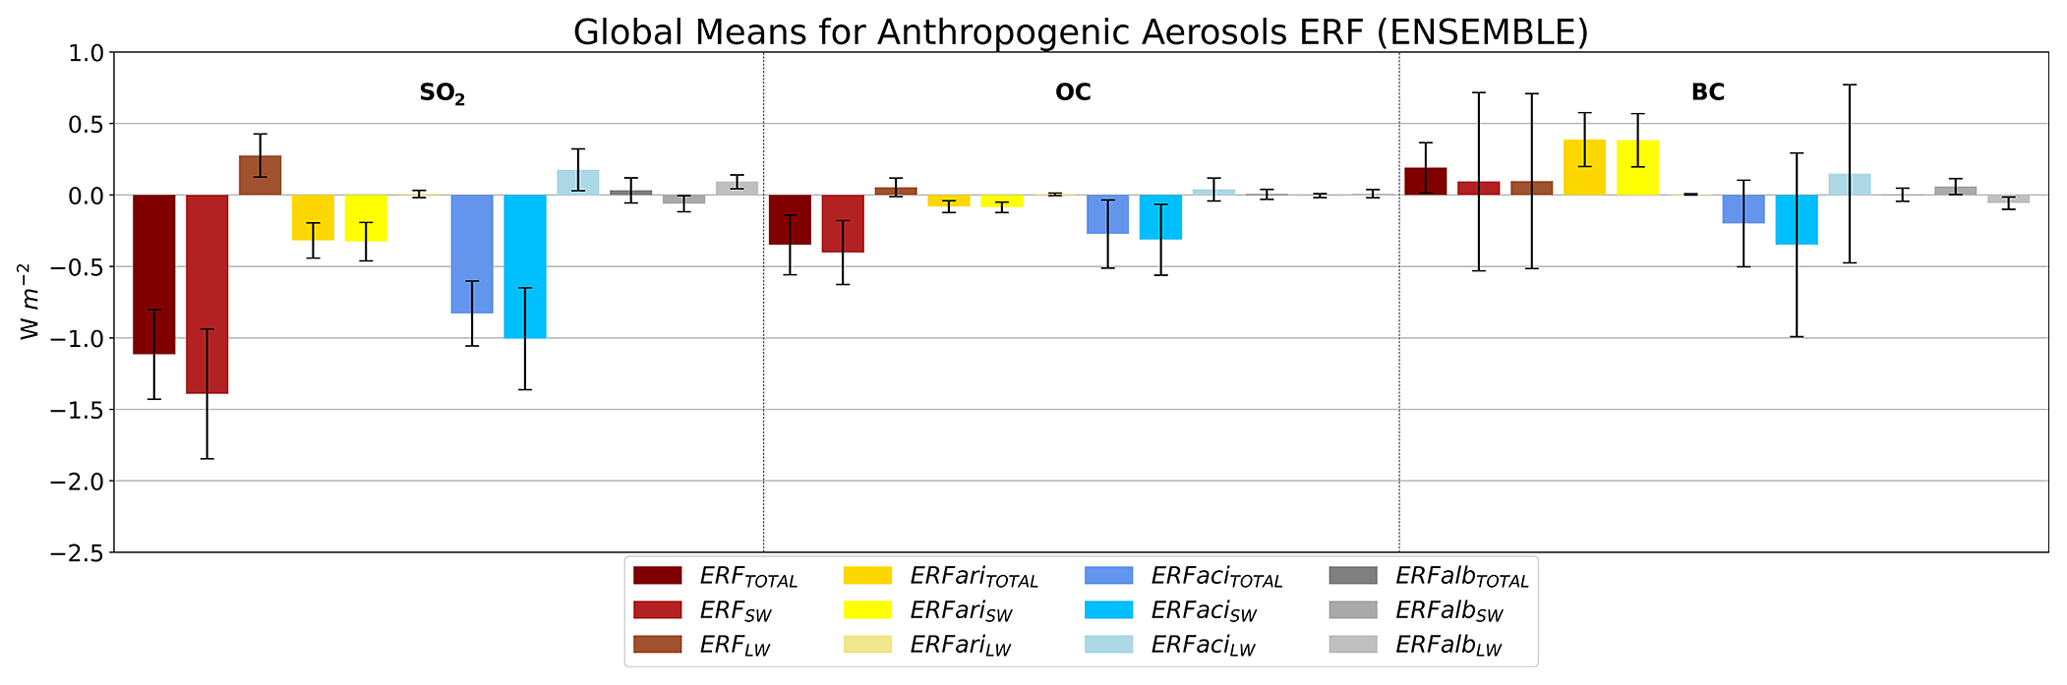
The SW, LW, and total (SW + LW) values for the three main ERF components and their sum for each anthropogenic aerosol type are presented in Fig. 5. In the case of light-scattering aerosols (i.e., sulfates and organic carbon) the strongly negative SW ERFACI drives the radiative forcing due to ACI, which in turn is mainly responsible for the negative total ERF values. Sulfates induce forcings due to ARI and ACI at TOA that are larger in magnitude than those of OC. The global mean sulfate ERFARI (ERFACI) is larger than the respective OC ERFARI (ERFACI) by a factor of 4 (3), although this may not be the case when examining each ESM individually. ERFARI and ERFACI due to SO4 range from −0.49 to −0.19 W m−2 and from −1.11 to −0.51 W m−2, respectively, while ERFARI and ERFACI caused by OC vary from −0.15 to −0.02 W m−2 and from −0.79 to −0.06 W m−2, respectively (Table 4). All models agree on the negative sign of SW ERFARI and SW ERFACI in both the piClim-SO2 and piClim-OC experiments, with global mean values ranging from −0.53 to −0.20 W m−2 for SW ERFARI and from −1.40 to −0.51 W m−2 for SW ERFACI in the piClim-SO2 experiment and values that vary from −0.16 to −0.04 W m−2 for SW ERFARI and from −0.80 to −0.07 W m−2 for SW ERFACI in piClim-OC (Table S2). In both experiments LW ERFARI is extremely small (the multi-model ensemble mean is 0.01 W m−2 for piClim-SO2 and 0.00 W m−2 for piClim-OC; Table S3), while there is a widespread agreement among ESMs that LW ERFACI is slightly positive (only GFDL-ESM4 in piClim-OC exhibits a negative ERFACI of −0.04 W m−2; Table S3). Total ERFALB is slightly positive globally in piClim-SO2 and piClim-OC experiments, with all but two models agreeing on the positive sign of the forcing (NorESM2-LM in piClim-SO2 and MRI-ESM2-0 and NorESM2-LM in piClim-OC have negative ERFALB mean values; Table 4). There is a general agreement among models for the signs of SW and LW ERFALB values in both the piClim-SO2 and piClim-OC experiments (Tables S2 and S3).
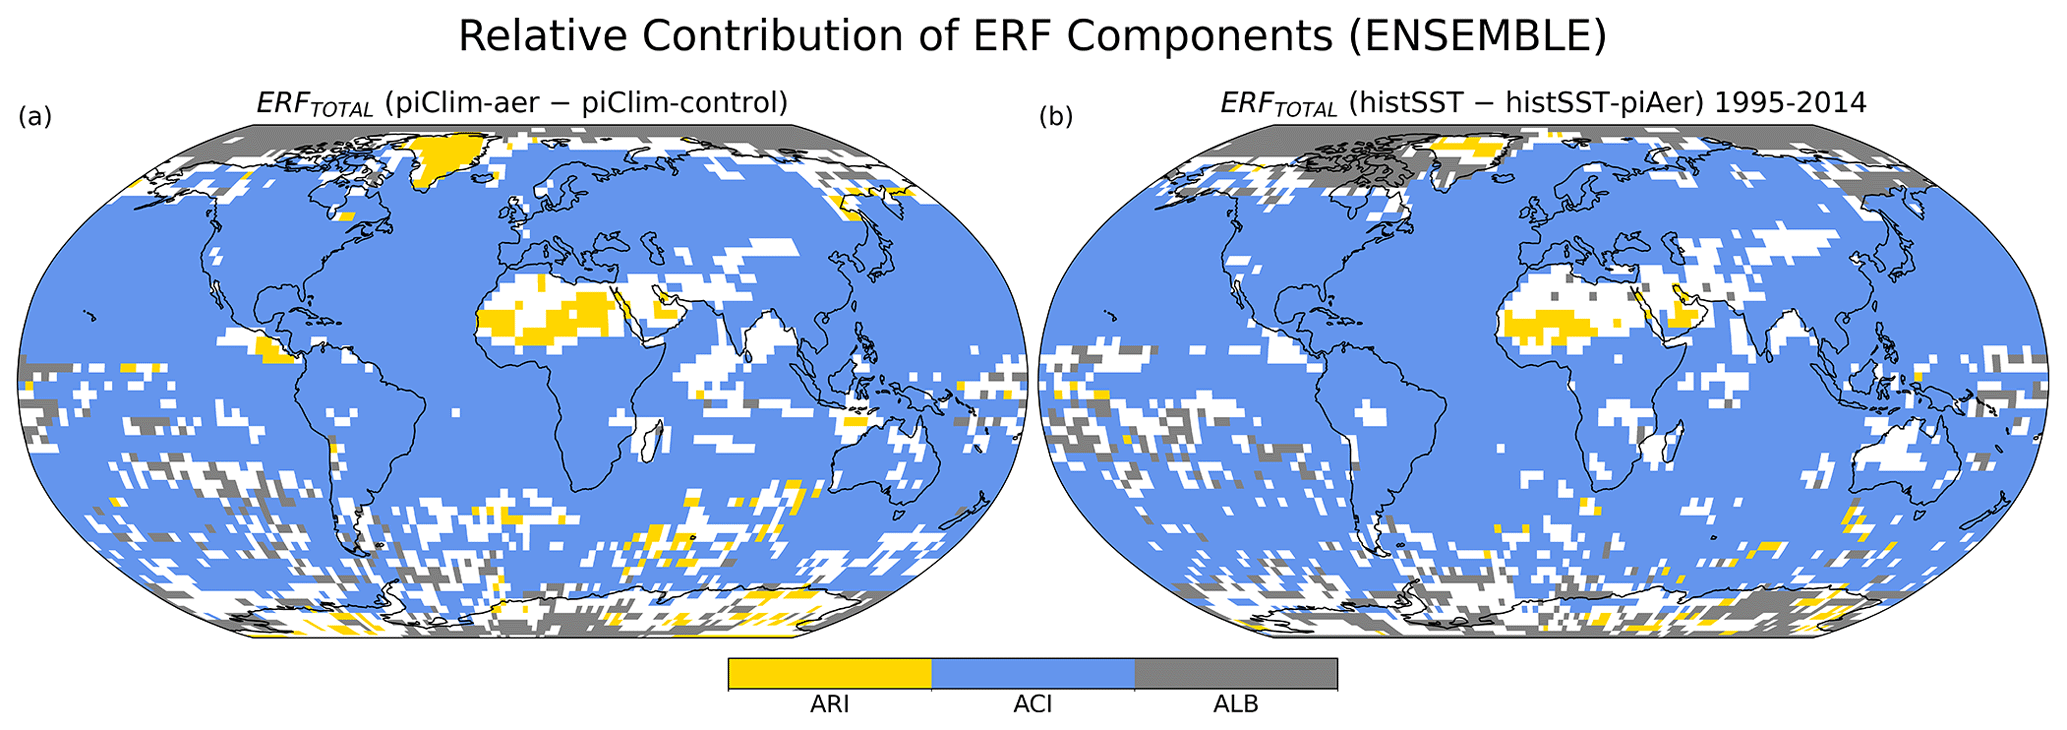
Figure 6Areas where each of the three main ERF components (ERFARI, ERFACI, and ERFALB) dominates the total ERF. The absolute values of total ERFARI, total ERFACI, and total ERFALB are summed, and every grid cell is colored after the ERF component that contributes at least 50 % to the resulting value, while each of the other two components contributes less than 33 % to the resulting value. In cases where the above criterion is not met, the grid cell is colored white.
On the contrary, light-absorbing BC induces a positive total ERF at TOA, with almost equal contribution from the SW and the LW (Fig. 5). Nearly all individual models produce a positive total BC ERF (Table 4) arising from the positive SW ERF due to absorption of solar incoming radiation (Table S2), which is offset by a negative, but weaker, LW ERF (Table S3). MPI-ESM-1-2-HAM is the only model that has a negative total ERF due to BC (Table 4) because SW ERFARI and SW ERFACI cancel each other out completely (Table S2), while MRI-ESM2-0 produces a strongly negative SW ERFACI and a highly positive LW ERFACI (Tables S2 and S3), which also cancel each other out, ultimately exhibiting a smaller total ERFACI and a positive total ERF (Table 4). Although there might be quantitative uncertainties in the strongly negative (positive) SW (LW) ERFACI produced by MRI-ESM2-0, these values could be explained by an increase in the number concentration of ice crystals in high-level clouds that is caused by BC aerosols, especially over convective regions within the tropics (Oshima et al., 2020; Thornhill et al., 2021). The large inter-model spread in SW and LW BC ERFACI (and consequently total SW and LW BC ERFs) is explained by the above inconsistencies between individual ESMs. Total ERFARI due to BC is positive in all models included in this study, despite any differences in magnitude, with SW ERFARI virtually being almost entirely responsible for the global mean total ERFARI values (Tables S2 and S3). Evidently, this shows the importance of interactions between BC and incoming SW radiation to the total forcing BC induces to the Earth's climate. Total ERFALB from BC is 0.00 W m−2 on a global scale, with similar contributions from positive SW ERFALB and negative LW ERFALB. It should be noted that this is exactly the opposite of the case in the all-aerosol, SO4, and OC experiments. Models generally agree on the sign and magnitude of ERFALB caused by BC with one exception: GFDL-ESM4 produces a negative total ERFALB globally (Table 4) due to a stronger negative LW ERFALB (Table S3). Conversely, MRI-ESM2-0 produces the strongest positive SW ERFALB, and ultimately controls the SW ERFALB induced by anthropogenic aerosols in the model's respective piClim-aer simulation (Oshima et al., 2020).
3.5 Spatial distribution of the dominant ERF component
The relevant contribution of the three main ERF components (ERFARI, ERFACI, and ERFALB) to the total ERF was examined on a global scale, and the results for the all-aerosol experiments and the individual anthropogenic aerosol species are presented in Figs. 6 and 7, respectively. The geographical distribution of the dominant SW and LW ERF component for the all-aerosol experiments is presented in Figs. S10 and S11, respectively, and for the single-aerosol-species experiments in Figs. S12 and S13, respectively. The absolute values of total ERFARI, ERFACI, and ERFALB were summed for every grid cell, and, in cases where one of these components explained at least 50 % of the resulting value, while each of the other two explained less than 33 % of the summation result, the corresponding grid cell was labeled after that ERF component, otherwise it was not labeled. Although this is a rather simplistic approach to examine the contribution from ARI, ACI, and ALB to the total ERF a climate forcer induces, it provides some useful insight. For instance, it becomes clear that ERFACI dominates over the largest part of the globe (Fig. 6), indicating that interactions between clouds and aerosols are mainly responsible for the total ERF induced by anthropogenic aerosols at TOA over a vast area extending from around 75° S to 75° N. ERFALB is mainly dominant over the poles for both piClim and histSST experiments. ERFARI is the largest contributor to the total ERF over the Sahel and parts of the Sahara, parts of Antarctica, Greenland (mainly seen in piClim-aer), and the Arabian Desert (in histSST). However, there are regions over the Sahara, the Arabian Desert, and Antarctica that do not exhibit a clear dominance of a single ERF component, suggesting that various processes influence the overall radiative forcing and should be attributed to more than one ERF component.
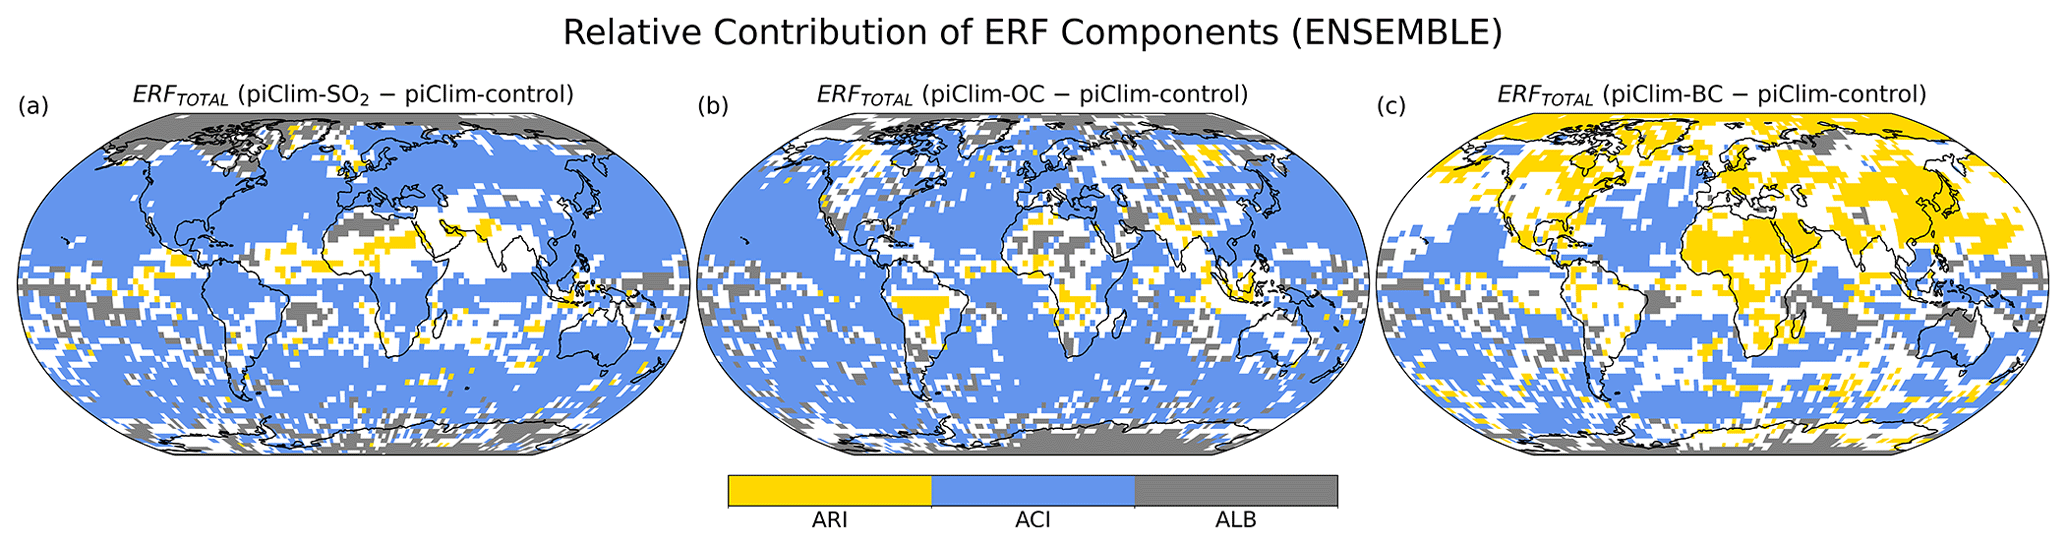
Figure 7As in Fig. 6 but for piClim-SO2 (a), piClim-OC (b), and piClim-BC (c).
In the piClim-SO2 simulation (Fig. 7a), even though ERFACI dominates globally, there is a larger contribution from ERFALB to the total ERF over the Arctic, the Sahara, and Antarctica than in piClim-aer. Moreover, ERFARI loses its dominant role over Greenland and is sparsely scattered over the Sahel, the southern parts of the North Atlantic, and the northwestern part of the Indian Peninsula. There is a wide region extending from the tropical North Atlantic to southern Asia where more than one ERF component contribute significantly to the total ERF (Fig. 7a). OC ERFALB has a more (less) pronounced dominance over Antarctica (the Arctic), along with larger contributions to the total OC ERF over continental Asia and parts of Africa (Fig. 7b) than in piClim-SO2. OC ERFARI is dominant over different regions than in piClim-SO2 and piClim-aer, as it explains more than half of the total ERF over central South America, the Maritime Continent, and areas surrounding northern India.
In contrast with the results above, ERFARI is the dominant contributor to the total ERF induced by BC over extended continental areas around the globe and the western North Pacific Ocean (Fig. 7c). While BC ERFALB dominates over a large part of Antarctica and the western and eastern parts of the southern Indian Ocean, BC ERFARI controls the total BC ERF over the largest part of the Arctic. BC ERFARI dominance is prominent over emission regions of the eastern US, eastern Europe, and eastern and southern Asia, as well as the Arabian Desert and most parts of Africa. However, in many parts of Eurasia and the Pacific Ocean the total BC ERF cannot be explained by a single ERF component. Interestingly enough, BC ERFACI dominance is confined over oceanic regions for the most part (Fig. 7c).
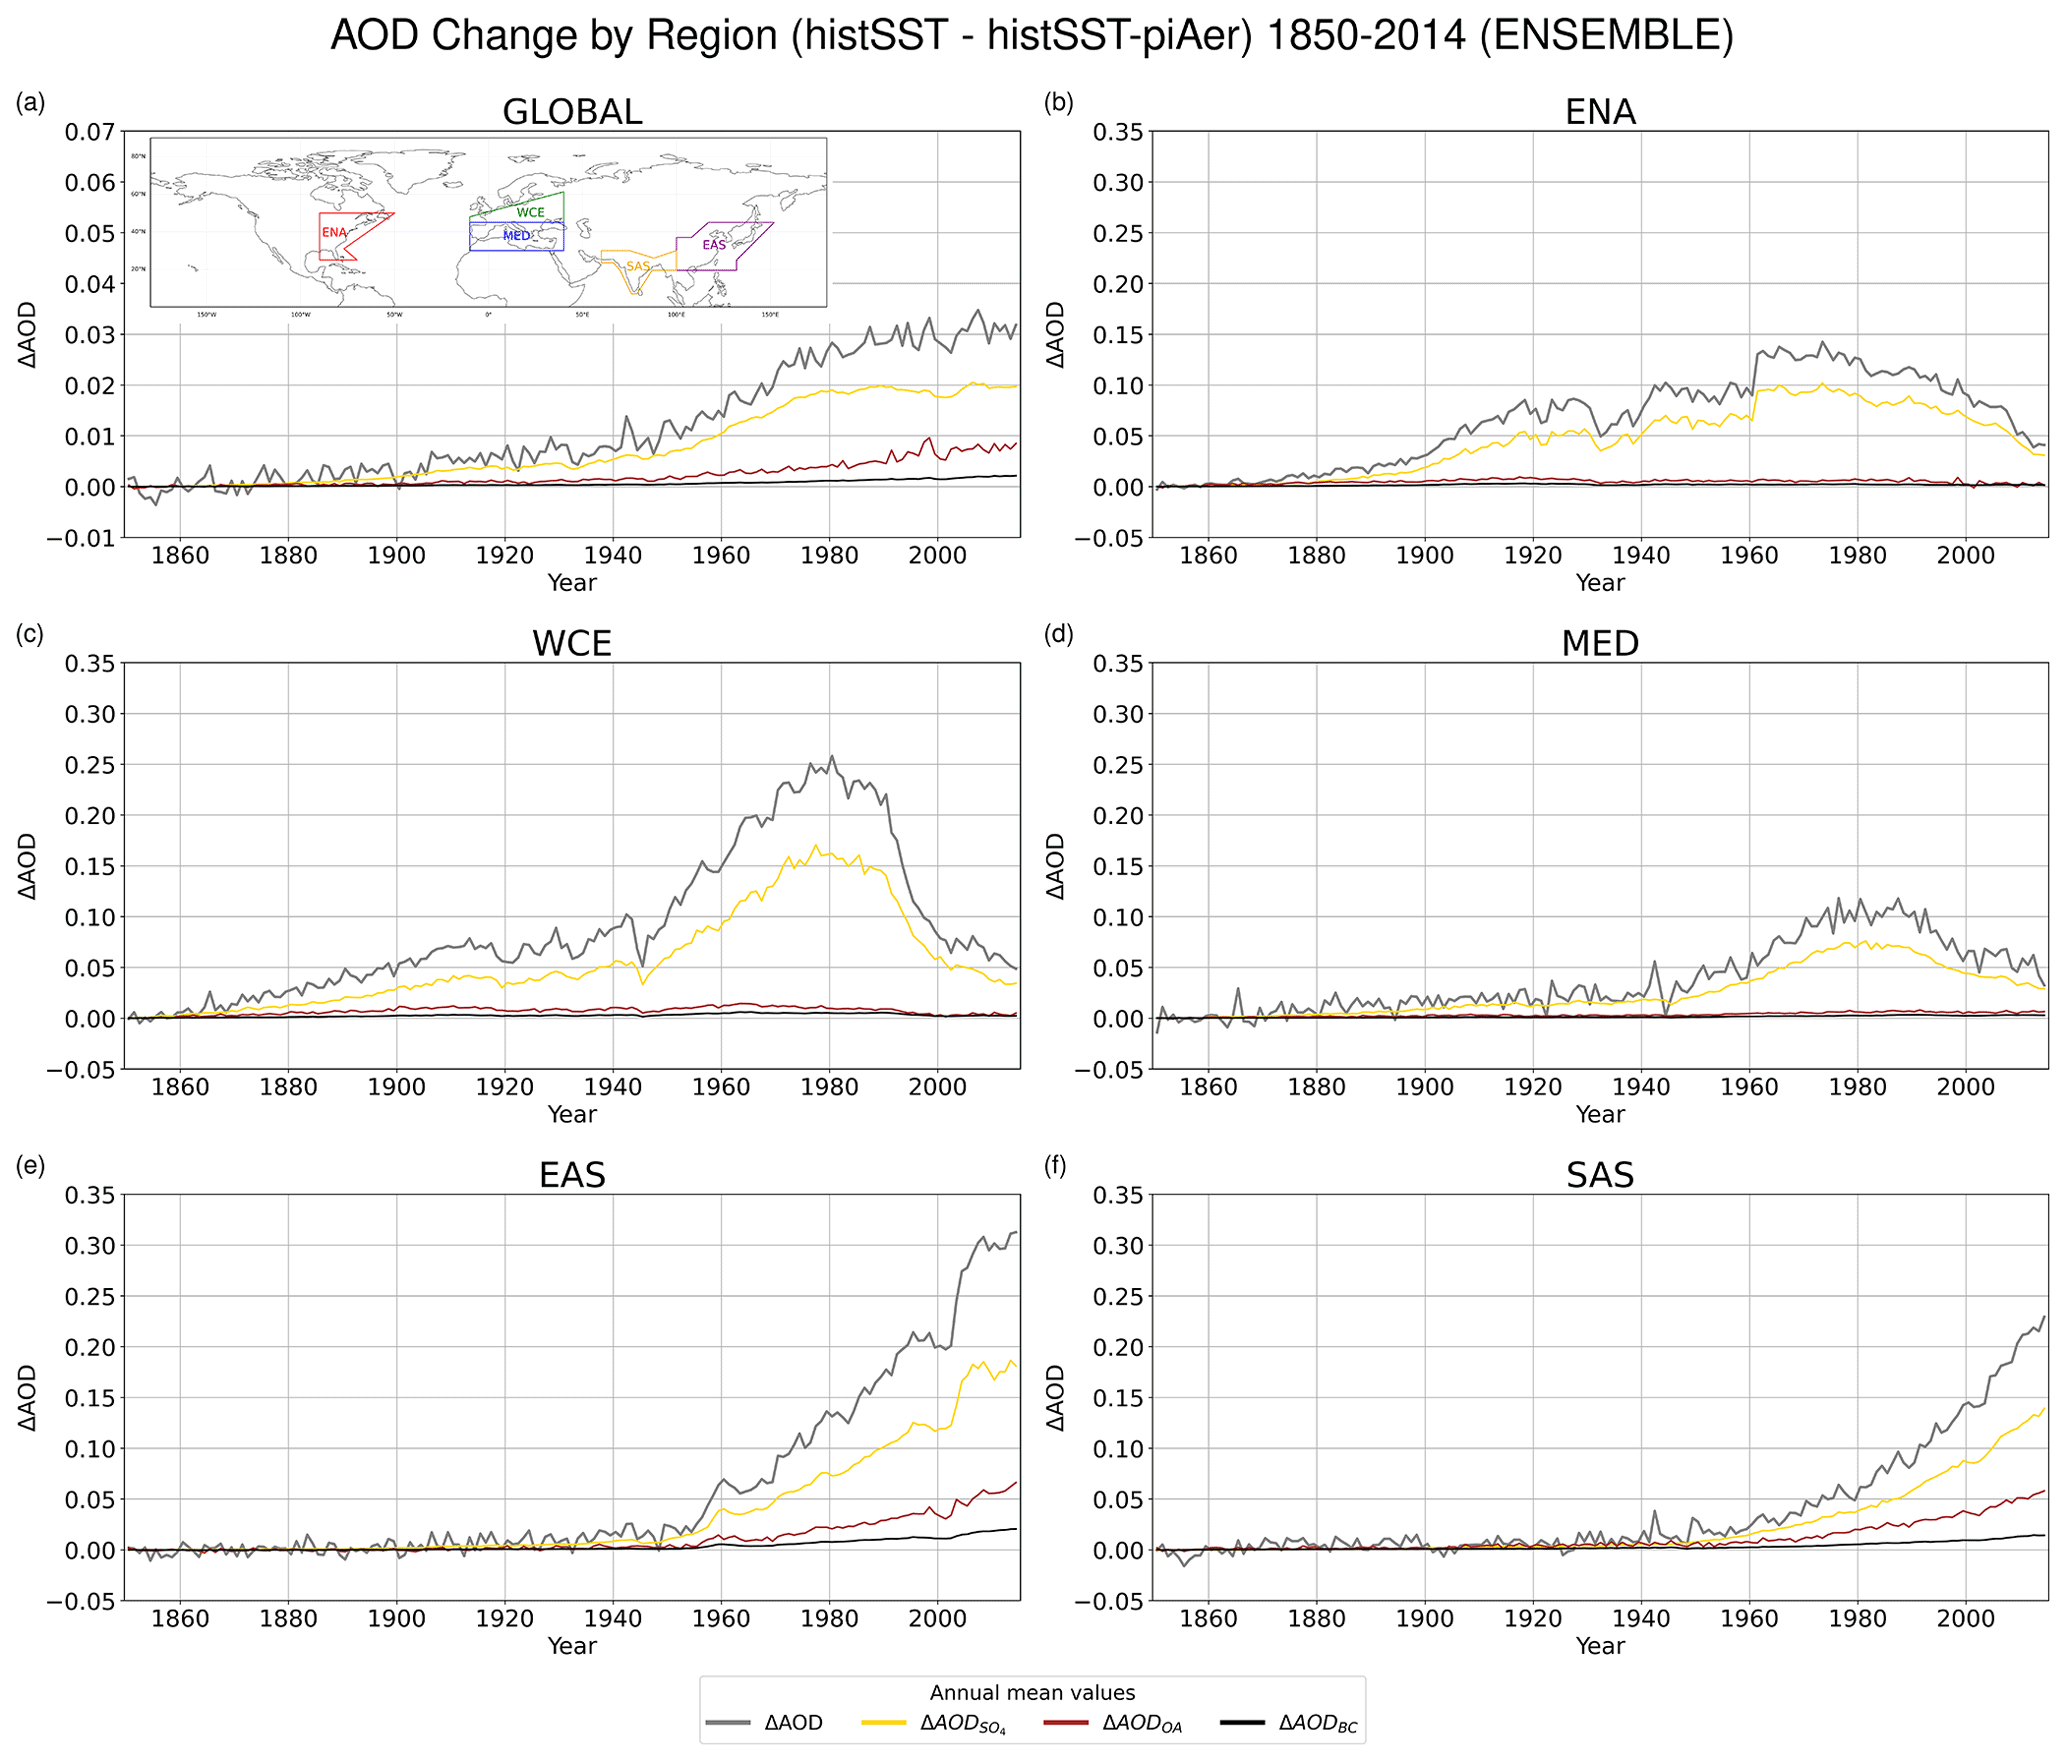
Figure 8Time evolution of AOD changes due to all anthropogenic aerosols, sulfates, organic aerosols, and BC over the historical period (1850–2014). The results are presented for the histSST experiment on a global scale (a) and over East North America (b), West and Central Europe (c), the Mediterranean (d), East Asia (e), and South Asia (f). The boundaries of each region of interest are shown in the embedded map in panel (a).

Figure 9Time evolution of the total ERF, ERFARI, ERFACI, and ERFALB due to anthropogenic aerosols over the historical period (1850–2014). The results are presented for the histSST experiment on a global scale (a) and over East North America (b), West and Central Europe (c), the Mediterranean (d), East Asia (e), and South Asia (f). The boundaries of each region are shown in the embedded map in panel (a).
3.6 AOD and ERF changes throughout the historical period
In the previous sections, only the global mean ERFs for 1995–2014 were presented. However, it is important to examine the magnitude of transient ERF induced by anthropogenic aerosols over the entire historical period (1850–2014) for assessing the evolving aerosol radiative forcing on a global and regional scale. To this end, the method proposed by Ghan (2013) was used to decompose the ERF caused by anthropogenic aerosols over the historical period. Along with the global mean ERF, five regions of interest were chosen from the IPCC AR6 WGI Atlas (Gutiérrez et al., 2021) for investigation, namely East North America (ENA), West and Central Europe (WCE), the Mediterranean (MED), East Asia (EAS), and South Asia (SAS). The boundaries of each region are shown in the embedded maps within Figs. 8a and 9a.
The differences in pre-industrial to present-day ambient AOD at 550 nm (Fig. 8) have had an increasing trend on a global scale since the 1900s but with a much smaller rate since the 1990s (Fig. 8a). Sulfate AOD has undergone the largest increase since the pre-industrial era, followed by organic aerosol AOD on a global scale and over all five Atlas regions. Changes in AOD over ENA, WCE, and MED reached their peak around the late 1970s–early 1980s, with declining trends afterwards (Fig. 8b–d). On the other hand, AOD changes over EAS and SAS have been following an upward trend since the 1950s (Fig. 8e and f). Although trends from CMIP6 models after around 2010 are more difficult to assess (as historical simulations end at 2014), the decrease in anthropogenic SO2 emissions over EAS since 2011 was underestimated in the CMIP6 emissions database available at the time of the CMIP6 aerosol simulations (Hoesly et al., 2018), implying that the AOD changes over EAS may not be captured precisely by CMIP6 models (Wang et al., 2021). There is a robust signal for declining anthropogenic aerosol emissions since 2000, particularly over North America, Europe, and eastern Asia (Quaas et al., 2022). The global and regional mean values of ΔAOD for each model can be found in Table S5. Moreover, the inter-model variability (1 standard deviation) in the multi-model ensemble ΔAOD is shown in Table S5 and Fig. S14. During 1965–1984 (negative peak period, hereafter denoted as NPP), central and eastern Europe exhibit the largest standard deviation in ΔAOD (Fig. S14), whereas, during EHP, EAS shows the largest variability (Table S5).
Table 5Mean ERF values (in W m−2) during the negative ERF peak period (1965–1984) and the recent past (1995–2014). Global and regional ERF estimates for the five NH regions of interest (ENA: East North America. WCE: West and Central Europe. MED: Mediterranean. EAS: East Asia. SAS: South Asia.) are presented for each model, along with the multi-model ensemble mean and the inter-model variability (SD: 1 standard deviation).

Changes in AOD can be linked to changes in aerosol abundances and/or emissions, which in turn induce radiative forcings at TOA. This can be supported by the temporal evolution of total ERF and its components throughout the historical period (Fig. 9 and Figs. S15 and S16). Globally, anthropogenic aerosol ERF attains its most negative values around the late 1980s, with a trend towards less negative values by the end of the historical period (Fig. 9a) due to regulations and restrictions in aerosol and aerosol precursor emissions (Myhre et al., 2017; Szopa et al., 2021). The dominant role of ERFACI is obvious here as it closely follows total ERF, whereas ERFARI and ERFALB show much smaller changes. The global mean total ERF slightly decreases from −1.27 W m−2 during NPP to −1.28 W m−2 during EHP. There is a disagreement between models in the sign of ERF change from NPP to EHP (Table 5) as half the models (CNRM-ESM2-1, GFDL-ESM4, and NorESM2-LM) show an increase in ERF magnitude during EHP. This difference between the regional findings of IPCC AR6 of the WGI (Szopa et al., 2021) and this study can be attributed to the differences in climate models used in this ensemble (Table 2) and temporal windowing effects. ERFARI becomes less negative from NPP to EHP (−0.13 to −0.08 W m−2); this is a robust change among all models used here (Table 5). However, ERFACI becomes more negative through time (from −1.17 W m−2 in NPP to −1.24 W m−2 in EHP), while ERFALB becomes more positive (from 0.03 W m−2 in NPP to 0.04 W m−2 in EHP), with most models agreeing on the sign of change. If a narrower time period were chosen (e.g., 2005–2014), the decrease in ERF magnitude towards the end of the historical period would be much more prominent (Table S6).
During the late 1970s and early 1980s, total ERF and ERFACI reach a negative peak over the ENA, WCE, and MED regions, with a simultaneous change in ERFARI towards more negative values (Fig. 9b–d). Each of the three regions shows a substantial change in total ERF from NPP to EHP (an increase of +2.20 W m−2 for ENA, +4.10 W m−2 for WCE, and +1.41 W m−2 for MED; Table 5), along with a change towards more positive (negative) values for ERFARI and ERFACI (ERFALB). EAS exhibits a strongly decreasing trend in total ERF (Fig. 9e), with the magnitude of ERFACI being extremely close to but slightly more negative than the total ERF, while ERFARI and ERFALB remain almost unchanged. Total ERF becomes more negative towards the end of the historical period over EAS (from −4.28 W m−2 in NPP to −6.36 W m−2 in EHP) largely due to ERFACI changes (an increase in magnitude from −4.17 W m−2 in NPP to −6.05 W m−2 in EHP). Finally, over the SAS region there has been a negative total ERF and ERFACI growing since the 1960s, while there has been a pronounced increasing (decreasing) trend in ERFALB (ERFARI) from the late 1980s onwards (Fig. 9f). The regional mean of total ERF, ERFARI, ERFACI, and ERFALB changed by −1.47, −0.84, −1.75, and +1.13 W m−2, respectively, from NPP to EHP over the SAS region. Note that not all models used in this work agree on the magnitude and/or the sign of the changes described above, as some of them may under- or overestimate the influence certain physical processes exert on radiative forcings at TOA (Table 5).
Analysis of the inter-model variability (1 standard deviation) in ERF over a number of IPCC AR6 WGI Atlas regions defined in Gutiérrez et al. (2021) shows that ERFACI due to all anthropogenic aerosols is the main source of uncertainty in total ERF (Table 5; Fig. S17). During EHP, the standard deviation of total ERFACI is estimated at 0.44 W m−2 globally, whereas the standard deviations of total ERFARI and total ERFALB are 0.14 and 0.08 W m−2, respectively (Table 5). EAS contributes most to the inter-model spread of both ERFARI and ERFACI with an area-weighted mean standard deviation of 1.03 and 3.71 W m−2, respectively (Table 5), followed by SAS, which has a much smaller standard deviation (0.86 and 1.76 W m−2, respectively). Based on Fig. S17, the area-weighted standard deviation was also calculated as a percent. EAS contributes 9.2 % and 6.5 % to the standard deviation of total ERFARI and total ERFACI, respectively, making it the land region with the largest contribution to both ERFARI and ERFACI (and total ERF as a result) standard deviations by far. The inter-model variability in total ERF (Fig. S17) mainly stems from the larger standard deviation of SW ERF (Fig. S18) rather than LW ERF (Fig. S19), with SW ERFACI being the main contributor. Total ERF and total ERFACI exhibit a small standard deviation during EHP over remote oceanic regions (with low ΔAOD), such as the Arctic Ocean (0.96 and 0.60 W m−2, respectively), the western South Pacific Ocean (0.23 and 0.37 W m−2, respectively), the central and eastern South Pacific Ocean (0.35 and 0.34 W m−2, respectively), the South Atlantic Ocean (0.52 and 0.44 W m−2, respectively), the southern Indian Ocean (0.59 and 0.65 W m−2, respectively), and the Southern Ocean (0.29 and 0.28 W m−2, respectively). Oceanic regions in the outflow (with high-to-medium ΔAOD) show a larger inter-model spread in total ERF and total ERFACI, such as the western North Pacific Ocean (1.55 and 1.66 W m−2, respectively), the central and eastern North Pacific Ocean (1.24 and 1.32 W m−2, respectively), the North Atlantic Ocean (1.14 and 1.28 W m−2, respectively), the Arabian Sea (1.19 and 2.04 W m−2, respectively), and the Bay of Bengal (1.73 and 1.72 W m−2, respectively). There are some oceanic regions that largely contribute to the area-weighted standard deviations of total ERF and total ERFACI, such as the central and eastern North Pacific Ocean (8.5 % and 8.8 %, respectively), the Southern Ocean (6.8 % and 6.6 %, respectively), the central and eastern South Pacific Ocean (6.0 % and 6.0 %, respectively), and the North Atlantic Ocean (5.9 % and 6.4 %, respectively), but this is due to their large surface areas affecting their contribution percentage. Regions with large standard deviation in total ERF and ERFACI over land can also be found, such as northwestern South America (2.21 and 2.17 W m−2, respectively), the Tibetan Plateau (1.06 and 1.57 W m−2, respectively), northern South America (1.38 and 1.61 W m−2, respectively), central South America (1.79 and 1.60 W m−2, respectively), and eastern Europe (1.07 and 1.36 W m−2, respectively). It is interesting to note that the Arabian Peninsula shows a large inter-model variability in total ERF (1.33 W m−2) during EHP, which originates from a large inter-model spread in ERFARI (0.81 W m−2) and ERFALB (0.79 W m−2) rather than ERFACI (0.46 W m−2). The land regions that exhibit the smallest standard deviation in both total ERF and total ERFACI are West Antarctica (0.19 and 0.22 W m−2, respectively) and East Antarctica (0.36 and 0.06 W m−2, respectively). Generally, regions with high-to-medium ΔAOD over land (Fig. 1) tend to show larger inter-model variability in total ERF and total ERFACI (Fig. S17) than land regions with medium-to-low ΔAOD, with the lowest inter-model spread appearing over remote oceanic regions with medium-to-low ΔAOD.
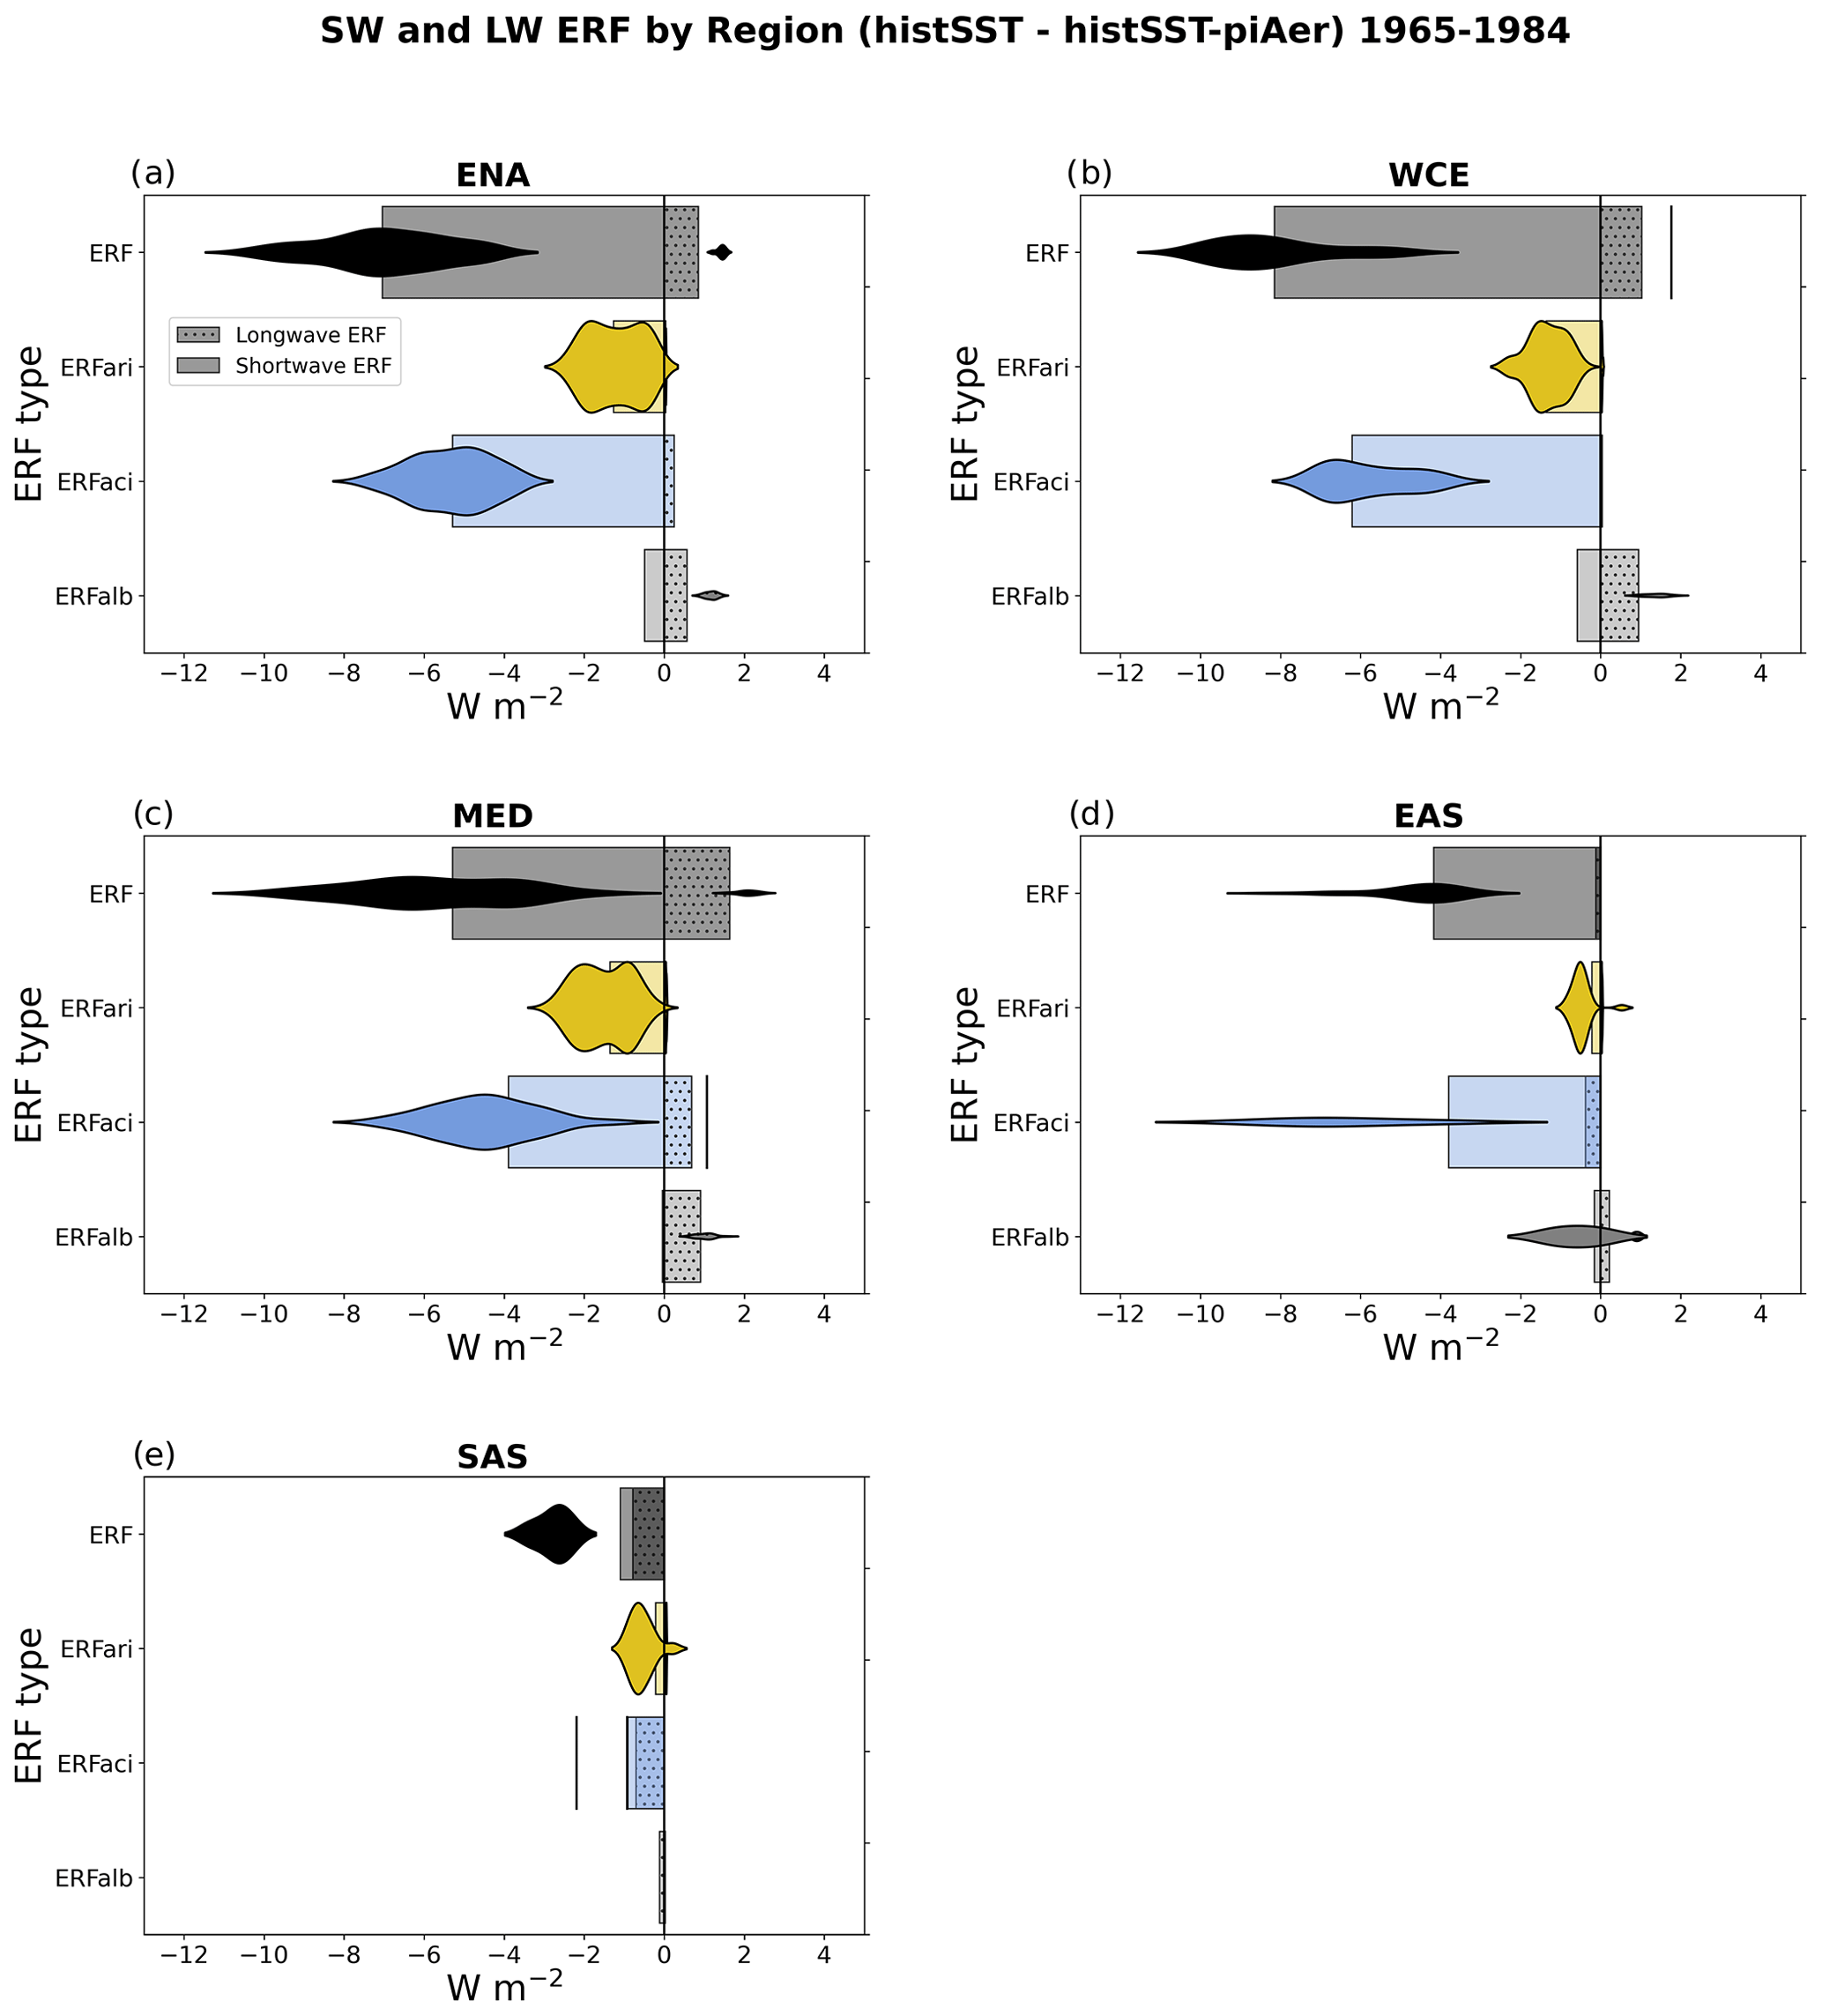
Figure 10SW and LW decomposition of ERF over East North America (a), West and Central Europe (b), the Mediterranean (c), East Asia (d), and South Asia (e). The violins show the distribution of values over regions where ERFs are statistically significant.

Figures 10 and 11 show the regional SW and LW ERF decomposition for the five Atlas regions presented above over the NPP (1965–1984) and EHP (1995–2014), respectively. These figures are a variation of Fig. 6.10 of IPCC AR6 WGI Chapter 6 (Szopa et al., 2021), which had a longitude mapping error in its figure-plotting code (IPCC AR6 WGI Errata: https://www.ipcc.ch/report/ar6/wg1/downloads/report/IPCC_AR6_WGI_Errata.pdf, last access: 22 October 2023). Figures 10 and 11 summarize succinctly the findings described earlier, that over EAS and SAS the total ERF becomes more negative in the EHP compared to the NPP, with the highest contributor from ERFACI, and is attributed to increasing AOD towards the EHP. Over ENA, WCE, and MED, the ERF becomes less negative from NPP to EHP, as observed in Fig. 9. Interestingly, over EAS and SAS, the LW ERFACI is negative, while for ENA, WCE, and MED, the LW ERFACI is positive. This effect is not dependent on the time period, and there is no significant amplitude change in EAS and SAS LW ERFACI between NPP (Fig. 10) and EHP (Fig. 11). Positive LW ERFACI could be attributed to increased cloud cover, with droplet sizes more likely to absorb infrared or scatter LW back towards the surface (Kuo et al., 2017). Considering that relatively higher clouds can trap outgoing LW radiation, thus leading to a positive LW ERF (and warming), it would be expected that there would be more higher clouds over MED and ENA and fewer higher clouds over EAS and SAS. Investigation of the ice water path (IWP; Fig. S20) shows that there is a decrease over EAS and SAS (i.e., fewer high clouds), an increase over MED and ENA (i.e., more high clouds), and a near-zero change in IWP over WCE. Liquid water path (LWP; Fig. S20) increases over EAS and SAS during EHP, while it decreases over ENA, WCE, and MED during the same period. The same happens for SW ERFACI, which is more negative (positive) over EAS and SAS (ENA, WCE, and MED) during EHP (Fig. 11). These model variables (IWP and LWP) are only indicators of the ERF changes over time and cannot fully explain the ERF time evolution during the end of the historical period. As a caveat, Burrows et al. (2022) express low confidence in the skill of global climate models in simulating cloud processes, including aerosol chemistry and physics interactions.
The global spatial patterns of present-day effective radiative forcing (ERF) due to anthropogenic aerosols were investigated using prescribed-SST simulations from seven different ESMs participating in the CMIP6, based on both time-slice pre-industrial perturbation experiments (piClim) and transient simulations over the historical period (histSST). Shortwave (SW), longwave (LW), and total (i.e., SW + LW) ERF and changes in aerosol optical depth (AOD) were quantified for all anthropogenic aerosols, combined and individually, using both piClim and histSST experiments for comparison purposes. Additionally, the robustness of the multi-model ensemble results was calculated by investigating both the statistical significance of each model's results and the agreement between individual models on the sign of change. Spatial patterns and temporal evolution of ERF and ΔAOD were presented on global and regional scale, along with tables that show the area-weighted mean values and standard deviation of ERF and ΔAOD for the multi-model ensemble as well as every individual model.
Global AOD has increased since 1850, especially over the industrialized regions of the NH, reflecting the increase in anthropogenic aerosol (and precursor) emissions since the pre-industrial era (Gulev et al., 2021; Szopa et al., 2021). The highest increase in AOD was found for sulfates, followed by organic carbon (OC) and black carbon (BC) aerosols, mainly over eastern and southern Asia.
The total ERF due to present-day anthropogenic aerosols was calculated at −1.11 ± 0.26 (1 standard deviation; inter-model variability) W m−2 using the piClim-aer experiment. It is globally negative, with more negative values over the Northern Hemisphere than the Southern Hemisphere. Pronounced negative ERF peaks were observed mainly over regions with aerosol emission sources and downwind, whereas ERF attains positive values over reflective surfaces. The calculated values for ERFARI, ERFACI, and ERFALB are −0.02 ± 0.20, −1.14 ± 0.33, and 0.05 ± 0.07 W m−2, respectively, with ERFACI dominating the spatial pattern of the total ERF at TOA. Other multi-model studies that used piClim experiments (e.g., Smith et al., 2020; Zanis et al., 2020; Thornhill et al., 2021) produced similar results, despite any differences in the climate model ensembles or calculation method. ERF estimates from single-model studies (e.g., Horowitz et al., 2020; Michou et al., 2020; Oshima et al., 2020; O'Connor et al., 2021) may vary from other multi-model ensemble studies because each climate model treats aerosol and cloud processes differently, and as a result they may overestimate or underestimate ARI and/or ACI (Bellouin et al., 2020; Forster et al., 2021).
Based on the histSST experiments, the global mean historical aerosol ERF was estimated at −1.28 ± 0.37 W m−2 for 1995–2014 relative to pre-industrial, showing a slight but statistically insignificant increase in magnitude compared to the 1965–1984 mean value of −1.27 ± 0.43 W m−2. These estimates are in good agreement with the IPCC AR6 WGI ERF assessment of −1.3 (−2.0 to −0.6) W m−2 for 1750–2014 using multiple lines of evidence (Forster et al., 2021) but show a slight disagreement in the sign of ERF change due to different climate models participating in this study. The estimated values of ERFARI, ERFACI, and ERFALB, averaged over the 1995–2014 period, are −0.08 ± 0.14, −1.24 ± 0.44, and 0.04 ± 0.08 W m−2, respectively. The piClim-aer and the histSST experiments show remarkable similarities in their calculated global mean ERF values (total ERF and its components) and their global spatial patterns. The impact of aerosol–cloud interactions on the total ERF is highlighted, as peak negative ERFACI regions coincide with the ones of total ERF for both types of experiments.
The global spatial patterns of total ERF and its components from individual aerosol species, such as sulfates, organic carbon (OC), and black carbon (BC), were also calculated based on piClim experiments. Sulfates exert a negative ERF globally (−1.11 ± 0.31 W m−2), driving the spatial distribution of the anthropogenic aerosol forcing at TOA. It is mostly negative over emission sources of the NH, predominantly over eastern and southern Asia. ERFACI is the dominant SO4 ERF component (−0.83 ± 0.23 W m−2) and peaks over eastern Asia, with significant contributions from a negative ERFARI (−0.32 ± 0.12 W m−2) particularly over southern and eastern Asia. The total ERF due to OC is also negative, although much weaker in magnitude (−0.35 ± 0.21 W m−2) than the ERF of sulfates, becoming more negative over eastern Asia and Indonesia. Conversely, BC causes a globally positive ERF (0.19 ± 0.18 W m−2) owing to quite a strong ERFARI (0.39 ± 0.19 W m−2) all over the globe, especially over eastern Asia, followed by southern Asia. The global estimates of ERF values are in line with those of Thornhill et al. (2021) for the same experiments.
In the all-aerosol, SO2, and OC experiments, the negative SW component is responsible for the resulting total ERFARI and ERFACI values, as it is larger in magnitude than its positive LW counterpart, whereas the opposite is true for the total ERFALB values. In the case of BC, both the SW and the LW ERFARI values are positive, while the combination of a weaker, negative SW ERFACI and a stronger, positive LW ERFACI leads to a small, globally negative total ERFACI. The total ERFALB is positive (as in the other experiments) because of the positive SW ERFALB, which is stronger than its negative LW counterpart. It should be highlighted that the above results vary among the individual ESMs (see also Michou et al., 2020; Oshima et al., 2020; O'Connor et al., 2021; Thornhill et al., 2021).
To determine the processes contributing the most to the total ERF on a global scale, a novel method was followed, in which each of the three main ERF components was tested as to whether it could explain at least half of the total ERF value. When considering all anthropogenic aerosols, ACI dominates over the largest part of the globe. ALB is most significant mainly over the poles, while ARI prevails over certain reflective surfaces. For sulfates and OC aerosols ACI dominates, but in piClim-BC ARI dominates over the majority of NH and especially the Arctic, while ACI clearly dominates over oceanic areas.
Changes in AOD and ERF magnitude were investigated globally and over five NH regions of interest throughout the historical period (1850–2014). AOD shows a decreasing trend after around 1980 over East North America, West and Central Europe, and the Mediterranean (see also Bauer et al., 2020; Cherian and Quaas, 2020; Gulev et al., 2021), with a subsequent increasing trend in anthropogenic aerosol ERF towards more positive values over those regions (see also Lund et al., 2018a; Seo et al., 2020; Smith et al., 2021; Szopa et al., 2021; Quaas et al., 2022) due to changes in anthropogenic aerosol emissions (Myhre et al., 2017). On the contrary, AOD shows a continuous increase over South Asia and East Asia after the 1950s, along with a strengthening of the total ERF. However, it is argued that CMIP6 models fail to capture the observed AOD trends over Asia towards the end of the historical simulations (Li et al., 2017; Zheng et al., 2018; Wang et al., 2021) due to inaccuracies in the Community Emissions Data System (CEDS; Hoesly et al., 2018), which is used by many CMIP6 climate models.
Finally, the inter-model variability in ERF and its main components (ARI, ACI, and ALB) was investigated over a number of oceanic and land regions. Our analysis indicates that ERFACI is the main source of uncertainty in total ERF. More specifically, the large standard deviation in SW ERF (mainly SW ERFACI) dominates the spatial pattern of the inter-model spread of total ERF, with small contributions from LW ERF. Eastern Asia is the greatest contributor to the inter-model variability in both ERFARI and ERFACI, while other regions, such as northwestern South America, the Arabian Sea, southern Asia, and the Bay of Bengal, significantly contribute to the large standard deviation in ERFACI. Oceanic regions with medium-to-low ΔAOD show the smallest standard deviation in both total ERF and total ERFACI, whereas land regions with high-to-medium ΔAOD generally exhibit larger inter-model variability.
Overall, our results highlight the dominant role of sulfates in the ERF of anthropogenic aerosols. ERF follows the changes in aerosols from the pre-industrial era onwards, exhibiting different trends over different regions around the globe. ERFACI clearly dominates over ERFARI and ERFALB, driving the ERF patterns and trends. This finding, in line with the latest IPCC WGI Assessment Report (AR6) (Forster et al., 2021; Szopa et al., 2021), constitutes a major update with respect to AR5, where ERFARI and ERFACI were regarded as being of the same magnitude on a global scale (Boucher et al., 2013; Myhre et al., 2013).
In this section, the CMIP6 variables used in this study for the ERF decomposition and the calculation of AOD changes are presented in Table A1. All data were downloaded from the ESGF node (https://esgf-node.llnl.gov/search/cmip6/, last access: 31 August 2023). Moreover, the method of determining the robustness of the ΔAOD and the ERF results presented in Figs. 1–3 is described in Table A2.
Table A1Description of the CMIP6 variables used in this study.
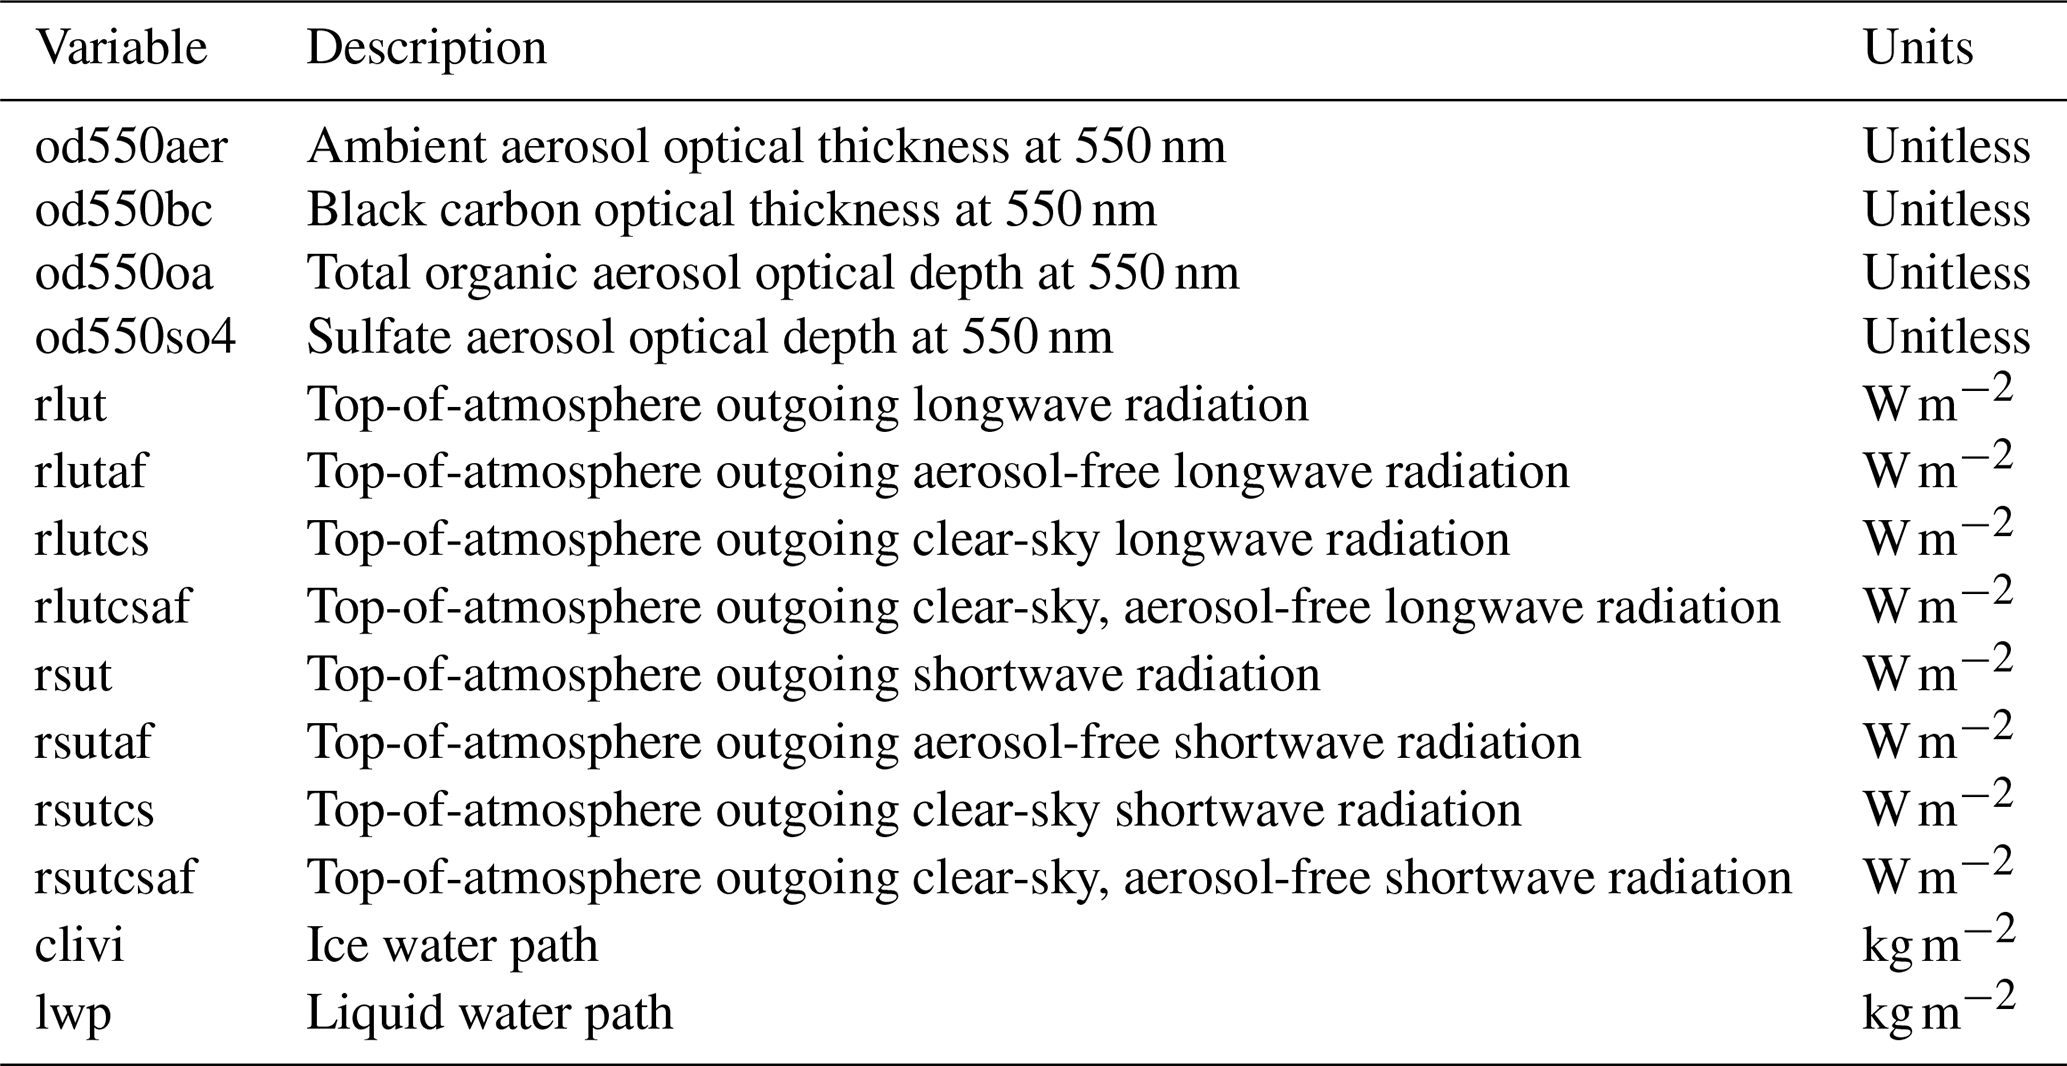

All data from the Earth system models used in this paper are available on the Earth System Grid Federation website and can be downloaded from there (https://esgf-node.llnl.gov/search/cmip6/, last access: 31 August 2023, ESGF, 2023).
The supplement related to this article is available online at: https://doi.org/10.5194/acp-24-7837-2024-supplement.
AK and PZ conceptualized this study. AK, PZ, AKG, and DA designed the analysis. AK performed the formal analysis, produced the figures (Figs. 10 and 11 were produced by CK), and prepared the original draft. PN contributed to CNRM-ESM2-1 simulations, TvN and PLS contributed to EC-Earth3-AerChem simulations, LWH and VN contributed to GFDL-ESM4 simulations, DN contributed to MPI-ESM-1-2-HAM simulations, NO contributed to MRI-ESM2-0 simulations, DO contributed to NorESM2-LM simulations, and JM contributed to UKESM1-0-LL simulations. All authors contributed to the revision and editing of the paper.
The contact author has declared that none of the authors has any competing interests.
Publisher's note: Copernicus Publications remains neutral with regard to jurisdictional claims made in the text, published maps, institutional affiliations, or any other geographical representation in this paper. While Copernicus Publications makes every effort to include appropriate place names, the final responsibility lies with the authors.
The authors acknowledge the World Climate Research Program, which promoted and coordinated CMIP6 through its Working Group on Coupled Modelling. The authors thank the climate modeling groups (listed in Table 2) for producing and making available their model output, the Earth System Grid Federation (ESGF) for archiving the data and providing access, and the multiple funding agencies who support CMIP6 and ESGF. The authors acknowledge input from Paul Glantz for improvements in the methodology for creating Fig. 6.10b in IPCC WGI AR6 Chapt. 6 which then led to Figs. 10 and 11 with the improved methodology.
Alkiviadis Kalisoras, Dimitris Akritidis, and Prodromos Zanis have received support from the REINFORCE (impRovEments in the simulation of aerosol clImate liNkages in earth system models: From glObal to Regional sCalEs) research project. The research project is implemented in the framework of HFRI call “Basic Research Financing (Horizontal Support of all Sciences)” under the National Recovery and Resilience Plan “Greece 2.0” funded by the European Union – NextGenerationEU (HFRI; project no. 15155). Naga Oshima has been supported by the Environment Research and Technology Development Fund (grant nos. JPMEERF20202003 and JPMEERF20232001) of the Environmental Restoration and Conservation Agency provided by the Ministry of the Environment of Japan, the Arctic Challenge for Sustainability II (ArCS II program; grant no. JPMXD1420318865), and a grant for the Global Environmental Research Coordination System from the Ministry of the Environment of Japan (grant no. MLIT2253). Twan van Noije, Philippe Le Sager, and David Neubauer have received funding from the European Union's Horizon 2020 research and innovation program (grant no. 821205; FORCeS).
This paper was edited by Guy Dagan and reviewed by two anonymous referees.
Abdul-Razzak, H. and Ghan, S. J.: A parameterization of aerosol activation: 2. Multiple aerosol types, J. Geophys. Res.-Atmos., 105, 6837–6844, https://doi.org/10.1029/1999JD901161, 2000.
Ackerman, A. S., Toon, O. B., Stevens, D. E., Heymsfield, A. J., Ramanathan, V., and Welton, E. J.: Reduction of Tropical Cloudiness by Soot, Science, 288, 1042–1047, https://doi.org/10.1126/science.288.5468.1042, 2000.
Albrecht, B. A.: Aerosols, Cloud Microphysics, and Fractional Cloudiness, Science, 245, 1227–1230, https://doi.org/10.1126/science.245.4923.1227, 1989.
Albright, A. L., Proistosescu, C., and Huybers, P.: Origins of a Relatively Tight Lower Bound on Anthropogenic Aerosol Radiative Forcing from Bayesian Analysis of Historical Observations, J. Climate, 34, 8777–8792, https://doi.org/10.1175/JCLI-D-21-0167.1, 2021.
Allen, R. J. and Sherwood, S. C.: Aerosol–cloud semi-direct effect and land-sea temperature contrast in a GCM, Geophys. Res. Lett., 37, L07702, https://doi.org/10.1029/2010GL042759, 2010.
Allen, R. J., Amiri-Farahani, A., Lamarque, J.-F., Smith, C., Shindell, D., Hassan, T., and Chung, C. E.: Observationally constrained aerosol–cloud semi-direct effects, Npj Clim. Atmos. Sci., 2, 16, https://doi.org/10.1038/s41612-019-0073-9, 2019.
Archibald, A. T., O'Connor, F. M., Abraham, N. L., Archer-Nicholls, S., Chipperfield, M. P., Dalvi, M., Folberth, G. A., Dennison, F., Dhomse, S. S., Griffiths, P. T., Hardacre, C., Hewitt, A. J., Hill, R. S., Johnson, C. E., Keeble, J., Köhler, M. O., Morgenstern, O., Mulcahy, J. P., Ordóñez, C., Pope, R. J., Rumbold, S. T., Russo, M. R., Savage, N. H., Sellar, A., Stringer, M., Turnock, S. T., Wild, O., and Zeng, G.: Description and evaluation of the UKCA stratosphere–troposphere chemistry scheme (StratTrop vn 1.0) implemented in UKESM1, Geosci. Model Dev., 13, 1223–1266, https://doi.org/10.5194/gmd-13-1223-2020, 2020.
Bartlett, R. E., Bollasina, M. A., Booth, B. B. B., Dunstone, N. J., Marenco, F., Messori, G., and Bernie, D. J.: Do differences in future sulfate emission pathways matter for near-term climate? A case study for the Asian monsoon, Clim. Dynam., 50, 1863–1880, https://doi.org/10.1007/s00382-017-3726-6, 2018.
Bauer, S. E., Tsigaridis, K., Faluvegi, G., Kelley, M., Lo, K. K., Miller, R. L., Nazarenko, L., Schmidt, G. A., and Wu, J.: Historical (1850–2014) Aerosol Evolution and Role on Climate Forcing Using the GISS ModelE2.1 Contribution to CMIP6, J. Adv. Model. Earth Sy., 12, e2019MS001978, https://doi.org/10.1029/2019MS001978, 2020.
Bellouin, N., Rae, J., Jones, A., Johnson, C., Haywood, J., and Boucher, O.: Aerosol forcing in the Climate Model Intercomparison Project (CMIP5) simulations by HadGEM2-ES and the role of ammonium nitrate, J. Geophys. Res.-Atmos., 116, D20206, https://doi.org/10.1029/2011JD016074, 2011.
Bellouin, N., Quaas, J., Gryspeerdt, E., Kinne, S., Stier, P., Watson-Parris, D., Boucher, O., Carslaw, K. S., Christensen, M., Daniau, A. -L., Dufresne, J. -L., Feingold, G., Fiedler, S., Forster, P., Gettelman, A., Haywood, J. M., Lohmann, U., Malavelle, F., Mauritsen, T., McCoy, D. T., Myhre, G., Mülmenstädt, J., Neubauer, D., Possner, A., Rugenstein, M., Sato, Y., Schulz, M., Schwartz, S. E., Sourdeval, O., Storelvmo, T., Toll, V., Winker, D., and Stevens, B.: Bounding Global Aerosol Radiative Forcing of Climate Change, Rev. Geophys., 58, e2019RG000660, https://doi.org/10.1029/2019RG000660, 2020.
Bond, T. C., Doherty, S. J., Fahey, D. W., Forster, P. M., Berntsen, T., DeAngelo, B. J., Flanner, M. G., Ghan, S., Kärcher, B., Koch, D., Kinne, S., Kondo, Y., Quinn, P. K., Sarofim, M. C., Schultz, M. G., Schulz, M., Venkataraman, C., Zhang, H., Zhang, S., Bellouin, N., Guttikunda, S. K., Hopke, P. K., Jacobson, M. Z., Kaiser, J. W., Klimont, Z., Lohmann, U., Schwarz, J. P., Shindell, D., Storelvmo, T., Warren, S. G., and Zender, C. S.: Bounding the role of black carbon in the climate system: A scientific assessment: BLACK CARBON IN THE CLIMATE SYSTEM, J. Geophys. Res.-Atmos., 118, 5380–5552, https://doi.org/10.1002/jgrd.50171, 2013.
Boucher, O., Randall, D., Artaxo, P., Bretherton, C., Feingold, G., Forster, P., Kerminen, V.-M., Kondo, Y., Liao, H., Lohmann, U., Rasch, P., Satheesh, S. K., Sherwood, S., Stevens, B., and Zhang, X.-Y.: Clouds and Aerosols, in: Climate Change 2013: The Physical Science Basis. Working Group I Contribution to the Fifth Assessment Report of the Intergovernmental Panel on Climate Change, edited by: Stocker, T. F., Qin, D., Plattner, G.-K., Tignor, M., Allen, S. K., Boschung, J., Nauels, A., Xia, Y., Bex, V., and Midgley, P. M., Cambridge University Press, Cambridge, United Kingdom and New York, NY, USA, 571–658, https://doi.org/10.1017/CBO9781107415324.016, 2013.
Brown, H., Liu, X., Pokhrel, R., Murphy, S., Lu, Z., Saleh, R., Mielonen, T., Kokkola, H., Bergman, T., Myhre, G., Skeie, R. B., Watson-Paris, D., Stier, P., Johnson, B., Bellouin, N., Schulz, M., Vakkari, V., Beukes, J. P., van Zyl, P. G., Liu, S., and Chand, D.: Biomass burning aerosols in most climate models are too absorbing, Nat. Commun., 12, 277, https://doi.org/10.1038/s41467-020-20482-9, 2021.
Burrows, S. M., McCluskey, C. S., Cornwell, G., Steinke, I., Zhang, K., Zhao, B., Zawadowicz, M., Raman, A., Kulkarni, G., China, S., Zelenyuk, A., and DeMott, P. J.: Ice-Nucleating Particles That Impact Clouds and Climate: Observational and Modeling Research Needs, Rev. Geophys., 60, e2021RG000745, https://doi.org/10.1029/2021RG000745, 2022.
Chen, W.-T., Lee, Y. H., Adams, P. J., Nenes, A., and Seinfeld, J. H.: Will black carbon mitigation dampen aerosol indirect forcing?, Geophys. Res. Lett., 37, L09801, https://doi.org/10.1029/2010GL042886, 2010.
Cherian, R. and Quaas, J.: Trends in AOD, Clouds, and Cloud Radiative Effects in Satellite Data and CMIP5 and CMIP6 Model Simulations Over Aerosol Source Regions, Geophys. Res. Lett., 47, e2020GL087132, https://doi.org/10.1029/2020GL087132, 2020.
Collins, W. J., Lamarque, J.-F., Schulz, M., Boucher, O., Eyring, V., Hegglin, M. I., Maycock, A., Myhre, G., Prather, M., Shindell, D., and Smith, S. J.: AerChemMIP: quantifying the effects of chemistry and aerosols in CMIP6, Geosci. Model Dev., 10, 585–607, https://doi.org/10.5194/gmd-10-585-2017, 2017.
Dagan, G., Yeheskel, N., and Williams, A. I. L.: Radiative forcing from aerosol–cloud interactions enhanced by large-scale circulation adjustments, Nat. Geosci., 16, 1092–1098, https://doi.org/10.1038/s41561-023-01319-8, 2023.
Dalvi, M., Abraham, L., Archibald, A., Folberth, G., Griffiths, P., Johnson, B., Keeble, J., Morgenstern, O., Mulcahy, J., Richardson, M., Robertson, E., Shim, S., Teixeira, J., Turnock, S., Williams, J., and Zeng, G.: NIWA UKESM1.0-LL model output prepared for CMIP6 AerChemMIP piClim-OC, Earth System Grid Federation [data set], https://doi.org/10.22033/ESGF/CMIP6.9439, 2020a.
Dalvi, M., Abraham, L., Archibald, A., Folberth, G., Griffiths, P., Johnson, B., Keeble, J., Morgenstern, O., Mulcahy, J., Richardson, M., Robertson, E., Shim, S., Teixeira, J., Turnock, S., Williams, J., and Zeng, G.: NIWA UKESM1.0-LL model output prepared for CMIP6 AerChemMIP piClim-SO2, Earth System Grid Federation [data set], https://doi.org/10.22033/ESGF/CMIP6.9440, 2020b.
Döscher, R., Acosta, M., Alessandri, A., Anthoni, P., Arsouze, T., Bergman, T., Bernardello, R., Boussetta, S., Caron, L.-P., Carver, G., Castrillo, M., Catalano, F., Cvijanovic, I., Davini, P., Dekker, E., Doblas-Reyes, F. J., Docquier, D., Echevarria, P., Fladrich, U., Fuentes-Franco, R., Gröger, M., v. Hardenberg, J., Hieronymus, J., Karami, M. P., Keskinen, J.-P., Koenigk, T., Makkonen, R., Massonnet, F., Ménégoz, M., Miller, P. A., Moreno-Chamarro, E., Nieradzik, L., van Noije, T., Nolan, P., O'Donnell, D., Ollinaho, P., van den Oord, G., Ortega, P., Prims, O. T., Ramos, A., Reerink, T., Rousset, C., Ruprich-Robert, Y., Le Sager, P., Schmith, T., Schrödner, R., Serva, F., Sicardi, V., Sloth Madsen, M., Smith, B., Tian, T., Tourigny, E., Uotila, P., Vancoppenolle, M., Wang, S., Wårlind, D., Willén, U., Wyser, K., Yang, S., Yepes-Arbós, X., and Zhang, Q.: The EC-Earth3 Earth system model for the Coupled Model Intercomparison Project 6, Geosci. Model Dev., 15, 2973–3020, https://doi.org/10.5194/gmd-15-2973-2022, 2022.
Dunne, J. P., Horowitz, L. W., Adcroft, A. J., Ginoux, P., Held, I. M., John, J. G., Krasting, J. P., Malyshev, S., Naik, V., Paulot, F., Shevliakova, E., Stock, C. A., Zadeh, N., Balaji, V., Blanton, C., Dunne, K. A., Dupuis, C., Durachta, J., Dussin, R., Gauthier, P. P. G., Griffies, S. M., Guo, H., Hallberg, R. W., Harrison, M., He, J., Hurlin, W., McHugh, C., Menzel, R., Milly, P. C. D., Nikonov, S., Paynter, D. J., Ploshay, J., Radhakrishnan, A., Rand, K., Reichl, B. G., Robinson, T., Schwarzkopf, D. M., Sentman, L. T., Underwood, S., Vahlenkamp, H., Winton, M., Wittenberg, A. T., Wyman, B., Zeng, Y., and Zhao, M.: The GFDL Earth System Model Version 4.1 (GFDL-ESM 4.1): Overall Coupled Model Description and Simulation Characteristics, J. Adv. Model. Earth Sy., 12, e2019MS002015, https://doi.org/10.1029/2019MS002015, 2020.
Earth System Grid Federation (ESGF): CMIP6, ESGF [data set], https://esgf-node.llnl.gov/search/cmip6/, last access: 31 August 2023.
EC-Earth Consortium (EC-Earth): EC-Earth-Consortium EC-Earth3-AerChem model output prepared for CMIP6 CMIP, Earth System Grid Federation [data set], https://doi.org/10.22033/ESGF/CMIP6.639, 2020a.
EC-Earth Consortium (EC-Earth): EC-Earth-Consortium EC-Earth3-AerChem model output prepared for CMIP6 RFMIP piClim-control, Earth System Grid Federation [data set], https://doi.org/10.22033/ESGF/CMIP6.15333, 2020b.
EC-Earth Consortium (EC-Earth): EC-Earth-Consortium EC-Earth3-AerChem model output prepared for CMIP6 AerChemMIP histSST-piAer, Earth System Grid Federation [data set], https://doi.org/10.22033/ESGF/CMIP6.4695, 2021a.
EC-Earth Consortium (EC-Earth): EC-Earth-Consortium EC-Earth3-AerChem model output prepared for CMIP6 RFMIP piClim-aer, Earth System Grid Federation [data set], https://doi.org/10.22033/ESGF/CMIP6.15331, 2021b.
Eyring, V., Bony, S., Meehl, G. A., Senior, C. A., Stevens, B., Stouffer, R. J., and Taylor, K. E.: Overview of the Coupled Model Intercomparison Project Phase 6 (CMIP6) experimental design and organization, Geosci. Model Dev., 9, 1937–1958, https://doi.org/10.5194/gmd-9-1937-2016, 2016.
Fiedler, S., van Noije, T., Smith, C. J., Boucher, O., Dufresne, J.-L., Kirkevåg, A., Olivié, D., Pinto, R., Reerink, T., Sima, A., and Schulz, M.: Historical Changes and Reasons for Model Differences in Anthropogenic Aerosol Forcing in CMIP6, Geophys. Res. Lett., 50, e2023GL104848, https://doi.org/10.1029/2023GL104848, 2023.
Forster, P., Storelvmo, T., Armour, K., Collins, W., Dufresne, J.-L., Frame, D., Lunt, D. J., Mauritsen, T., Palmer, M. D., Watanabe, M., Wild, M., and Zhang, X.: The Earth's energy budget, climate feedbacks, and climate sensitivity, in: Climate Change 2021: The Physical Science Basis. Contribution of Working Group I to the Sixth Assessment Report of the Intergovernmental Panel on Climate Change, edited by: Masson-Delmotte, V., Zhai, P., Pirani, A., Connors, S. L., Péan, C., Berger, S., Caud, N., Chen, Y., Goldfarb, L., Gomis, M. I., Huang, M., Leitzell, K., Lonnoy, E., Matthews, J. B. R., Maycock, T. K., Waterfield, T., Yelekçi, Ö., Yu, R., and Zhou, B., Cambridge University Press, Cambridge, United Kingdom and New York, NY, USA, 923–1054, https://doi.org/10.1017/9781009157896.001, 2021.
Forster, P. M., Richardson, T., Maycock, A. C., Smith, C. J., Samset, B. H., Myhre, G., Andrews, T., Pincus, R., and Schulz, M.: Recommendations for diagnosing effective radiative forcing from climate models for CMIP6: RECOMMENDED EFFECTIVE RADIATIVE FORCING, J. Geophys. Res.-Atmos., 121, 12460–12475, https://doi.org/10.1002/2016JD025320, 2016.
Ghan, S., Wang, M., Zhang, S., Ferrachat, S., Gettelman, A., Griesfeller, J., Kipling, Z., Lohmann, U., Morrison, H., Neubauer, D., Partridge, D. G., Stier, P., Takemura, T., Wang, H., and Zhang, K.: Challenges in constraining anthropogenic aerosol effects on cloud radiative forcing using present-day spatiotemporal variability, P. Natl. Acad. Sci. USA, 113, 5804–5811, https://doi.org/10.1073/pnas.1514036113, 2016.
Ghan, S. J.: Technical Note: Estimating aerosol effects on cloud radiative forcing, Atmos. Chem. Phys., 13, 9971–9974, https://doi.org/10.5194/acp-13-9971-2013, 2013.
Ghan, S. J., Liu, X., Easter, R. C., Zaveri, R., Rasch, P. J., Yoon, J.-H., and Eaton, B.: Toward a Minimal Representation of Aerosols in Climate Models: Comparative Decomposition of Aerosol Direct, Semidirect, and Indirect Radiative Forcing, J. Climate, 25, 6461–6476, https://doi.org/10.1175/JCLI-D-11-00650.1, 2012.
Gliß, J., Mortier, A., Schulz, M., Andrews, E., Balkanski, Y., Bauer, S. E., Benedictow, A. M. K., Bian, H., Checa-Garcia, R., Chin, M., Ginoux, P., Griesfeller, J. J., Heckel, A., Kipling, Z., Kirkevåg, A., Kokkola, H., Laj, P., Le Sager, P., Lund, M. T., Lund Myhre, C., Matsui, H., Myhre, G., Neubauer, D., van Noije, T., North, P., Olivié, D. J. L., Rémy, S., Sogacheva, L., Takemura, T., Tsigaridis, K., and Tsyro, S. G.: AeroCom phase III multi-model evaluation of the aerosol life cycle and optical properties using ground- and space-based remote sensing as well as surface in situ observations, Atmos. Chem. Phys., 21, 87–128, https://doi.org/10.5194/acp-21-87-2021, 2021.
Gryspeerdt, E., Mülmenstädt, J., Gettelman, A., Malavelle, F. F., Morrison, H., Neubauer, D., Partridge, D. G., Stier, P., Takemura, T., Wang, H., Wang, M., and Zhang, K.: Surprising similarities in model and observational aerosol radiative forcing estimates, Atmos. Chem. Phys., 20, 613–623, https://doi.org/10.5194/acp-20-613-2020, 2020.
Gulev, S. K., Thorne, P. W., Ahn, J., Dentener, F. J., Domingues, C. M., Gerland, S., Gong, D., Kaufman, D. S., Nnamchi, H. C., Quaas, J., Rivera, J. A., Sathyendranath, S., Smith, S. L., Trewin, B., von Shuckmann, K., and Vose, R. S.: Changing state of the climate system, in: Climate Change 2021: The Physical Science Basis. Contribution of Working Group I to the Sixth Assessment Report of the Intergovernmental Panel on Climate Change, edited by: Masson-Delmotte, V., Zhai, P., Pirani, A., Connors, S. L., Péan, C., Berger, S., Caud, N., Chen, Y., Goldfarb, L., Gomis, M. I., Huang, M., Leitzell, K., Lonnoy, E., Matthews, J. B. R., Maycock, T. K., Waterfield, T., Yelekçi, Ö., Yu, R., and Zhou, B., Cambridge University Press, Cambridge, United Kingdom and New York, NY, USA, 287–422, https://doi.org/10.1017/9781009157896.001, 2021.
Gutiérrez, J. M., Jones, R. G., Narisma, G. T., Muniz Alves, L., Amjad, M., Gorodetskaya, I. V., Grose, M., Klutse, N. A. B., Krakovska, S., Li, J., Martínez-Castro, D., Mearns, L. O., Mernild, S. H., Ngo-Duc, T., van den Hurk, B., and Yoon, J.-H.: Atlas, in: Climate Change 2021: The Physical Science Basis. Contribution of Working Group I to the Sixth Assessment Report of the Intergovernmental Panel on Climate Change, edited by: Masson-Delmotte, V., Zhai, P., Pirani, A., Connors, S. L., Péan, C., Berger, S., Caud, N., Chen, Y., Goldfarb, L., Gomis, M. I., Huang, M., Leitzell, K., Lonnoy, E., Matthews, J. B. R., Maycock, T. K., Waterfield, T., Yelekçi, Ö., Yu, R., and Zhou, B., Cambridge University Press, Cambridge, United Kingdom and New York, NY, USA, 1927–2058, https://doi.org/10.1017/9781009157896.001, 2021.
Hansen, J.: Efficacy of climate forcings, J. Geophys. Res., 110, D18104, https://doi.org/10.1029/2005JD005776, 2005.
Hansen, J., Sato, M., and Ruedy, R.: Radiative forcing and climate response, J. Geophys. Res.-Atmos., 102, 6831–6864, https://doi.org/10.1029/96JD03436, 1997.
Haywood, J. and Boucher, O.: Estimates of the direct and indirect radiative forcing due to tropospheric aerosols: A review, Rev. Geophys., 38, 513–543, https://doi.org/10.1029/1999RG000078, 2000.
Hodnebrog, Ø., Myhre, G., Forster, P. M., Sillmann, J., and Samset, B. H.: Local biomass burning is a dominant cause of the observed precipitation reduction in southern Africa, Nat. Commun., 7, 11236, https://doi.org/10.1038/ncomms11236, 2016.
Hoesly, R. M., Smith, S. J., Feng, L., Klimont, Z., Janssens-Maenhout, G., Pitkanen, T., Seibert, J. J., Vu, L., Andres, R. J., Bolt, R. M., Bond, T. C., Dawidowski, L., Kholod, N., Kurokawa, J.-I., Li, M., Liu, L., Lu, Z., Moura, M. C. P., O'Rourke, P. R., and Zhang, Q.: Historical (1750–2014) anthropogenic emissions of reactive gases and aerosols from the Community Emissions Data System (CEDS), Geosci. Model Dev., 11, 369–408, https://doi.org/10.5194/gmd-11-369-2018, 2018.
Horowitz, L. W., Naik, V., Sentman, L., Paulot, F., Blanton, C., McHugh, C., Radhakrishnan, A., Rand, K., Vahlenkamp, H., Zadeh, N. T., Wilson, C., Ginoux, P., He, J., John, J. G., Lin, M., Paynter, D. J., Ploshay, J., Zhang, A., and Zeng, Y.: NOAA-GFDL GFDL-ESM4 model output prepared for CMIP6 AerChemMIP histSST, Earth System Grid Federation [data set], https://doi.org/10.22033/ESGF/CMIP6.8586, 2018a.
Horowitz, L. W., Naik, V., Sentman, L., Paulot, F., Blanton, C., McHugh, C., Radhakrishnan, A., Rand, K., Vahlenkamp, H., Zadeh, N. T., Wilson, C., Ginoux, P., He, J., John, J. G., Lin, M., Paynter, D. J., Ploshay, J., Zhang, A., and Zeng, Y.: NOAA-GFDL GFDL-ESM4 model output prepared for CMIP6 AerChemMIP histSST-piAer, Earth System Grid Federation [data set], https://doi.org/10.22033/ESGF/CMIP6.8588, 2018b.
Horowitz, L. W., Naik, V., Sentman, L., Paulot, F., Blanton, C., McHugh, C., Radhakrishnan, A., Rand, K., Vahlenkamp, H., Zadeh, N. T., Wilson, C., Ginoux, P., He, J., John, J. G., Lin, M., Paynter, D. J., Ploshay, J., Zhang, A., and Zeng, Y.: NOAA-GFDL GFDL-ESM4 model output prepared for CMIP6 AerChemMIP piClim-aer, Earth System Grid Federation [data set], https://doi.org/10.22033/ESGF/CMIP6.8651, 2018c.
Horowitz, L. W., Naik, V., Sentman, L., Paulot, F., Blanton, C., McHugh, C., Radhakrishnan, A., Rand, K., Vahlenkamp, H., Zadeh, N. T., Wilson, C., Ginoux, P., He, J., John, J. G., Lin, M., Paynter, D. J., Ploshay, J., Zhang, A., and Zeng, Y.: NOAA-GFDL GFDL-ESM4 model output prepared for CMIP6 AerChemMIP piClim-BC, Earth System Grid Federation [data set], https://doi.org/10.22033/ESGF/CMIP6.8639, 2018d.
Horowitz, L. W., Naik, V., Sentman, L., Paulot, F., Blanton, C., McHugh, C., Radhakrishnan, A., Rand, K., Vahlenkamp, H., Zadeh, N. T., Wilson, C., Ginoux, P., He, J., John, J. G., Lin, M., Paynter, D. J., Ploshay, J., Zhang, A., and Zeng, Y.: NOAA-GFDL GFDL-ESM4 model output prepared for CMIP6 AerChemMIP piClim-control, Earth System Grid Federation [data set], https://doi.org/10.22033/ESGF/CMIP6.8654, 2018e.
Horowitz, L. W., Naik, V., Sentman, L., Paulot, F., Blanton, C., McHugh, C., Radhakrishnan, A., Rand, K., Vahlenkamp, H., Zadeh, N. T., Wilson, C., Ginoux, P., He, J., John, J. G., Lin, M., Paynter, D. J., Ploshay, J., Zhang, A., and Zeng, Y.: NOAA-GFDL GFDL-ESM4 model output prepared for CMIP6 AerChemMIP piClim-OC, Earth System Grid Federation [data set], https://doi.org/10.22033/ESGF/CMIP6.8647, 2018f.
Horowitz, L. W., Naik, V., Sentman, L., Paulot, F., Blanton, C., McHugh, C., Radhakrishnan, A., Rand, K., Vahlenkamp, H., Zadeh, N. T., Wilson, C., Ginoux, P., He, J., John, J. G., Lin, M., Paynter, D. J., Ploshay, J., Zhang, A., and Zeng, Y.: NOAA-GFDL GFDL-ESM4 model output prepared for CMIP6 AerChemMIP piClim-SO2, Earth System Grid Federation [data set], https://doi.org/10.22033/ESGF/CMIP6.8648, 2018g.
Horowitz, L. W., Naik, V., Paulot, F., Ginoux, P. A., Dunne, J. P., Mao, J., Schnell, J., Chen, X., He, J., John, J. G., Lin, M., Lin, P., Malyshev, S., Paynter, D., Shevliakova, E., and Zhao, M.: The GFDL Global Atmospheric Chemistry-Climate Model AM4.1: Model Description and Simulation Characteristics, J. Adv. Model. Earth Sy., 12, e2019MS002032, https://doi.org/10.1029/2019MS002032, 2020.
Kasoar, M., Voulgarakis, A., Lamarque, J.-F., Shindell, D. T., Bellouin, N., Collins, W. J., Faluvegi, G., and Tsigaridis, K.: Regional and global temperature response to anthropogenic SO2 emissions from China in three climate models, Atmos. Chem. Phys., 16, 9785–9804, https://doi.org/10.5194/acp-16-9785-2016, 2016.
Kawai, H., Yukimoto, S., Koshiro, T., Oshima, N., Tanaka, T., Yoshimura, H., and Nagasawa, R.: Significant improvement of cloud representation in the global climate model MRI-ESM2, Geosci. Model Dev., 12, 2875–2897, https://doi.org/10.5194/gmd-12-2875-2019, 2019.
Khairoutdinov, M. and Kogan, Y.: A New Cloud Physics Parameterization in a Large-Eddy Simulation Model of Marine Stratocumulus, Mon. Weather Rev., 128, 229–243, https://doi.org/10.1175/1520-0493(2000)128<0229:ANCPPI>2.0.CO;2, 2000.
Kirkevåg, A., Grini, A., Olivié, D., Seland, Ø., Alterskjær, K., Hummel, M., Karset, I. H. H., Lewinschal, A., Liu, X., Makkonen, R., Bethke, I., Griesfeller, J., Schulz, M., and Iversen, T.: A production-tagged aerosol module for Earth system models, OsloAero5.3 – extensions and updates for CAM5.3-Oslo, Geosci. Model Dev., 11, 3945–3982, https://doi.org/10.5194/gmd-11-3945-2018, 2018.
Koch, D. and Del Genio, A. D.: Black carbon semi-direct effects on cloud cover: review and synthesis, Atmos. Chem. Phys., 10, 7685–7696, https://doi.org/10.5194/acp-10-7685-2010, 2010.
Kristiansen, N. I., Stohl, A., Olivié, D. J. L., Croft, B., Søvde, O. A., Klein, H., Christoudias, T., Kunkel, D., Leadbetter, S. J., Lee, Y. H., Zhang, K., Tsigaridis, K., Bergman, T., Evangeliou, N., Wang, H., Ma, P.-L., Easter, R. C., Rasch, P. J., Liu, X., Pitari, G., Di Genova, G., Zhao, S. Y., Balkanski, Y., Bauer, S. E., Faluvegi, G. S., Kokkola, H., Martin, R. V., Pierce, J. R., Schulz, M., Shindell, D., Tost, H., and Zhang, H.: Evaluation of observed and modelled aerosol lifetimes using radioactive tracers of opportunity and an ensemble of 19 global models, Atmos. Chem. Phys., 16, 3525–3561, https://doi.org/10.5194/acp-16-3525-2016, 2016.
Kuo, C.-P., Yang, P., Huang, X., Feldman, D., Flanner, M., Kuo, C., and Mlawer, E. J.: Impact of Multiple Scattering on Longwave Radiative Transfer Involving Clouds, J. Adv. Model. Earth Sy., 9, 3082–3098, https://doi.org/10.1002/2017MS001117, 2017.
Li, C., McLinden, C., Fioletov, V., Krotkov, N., Carn, S., Joiner, J., Streets, D., He, H., Ren, X., Li, Z., and Dickerson, R. R.: India Is Overtaking China as the World's Largest Emitter of Anthropogenic Sulfur Dioxide, Sci. Rep.-UK, 7, 14304, https://doi.org/10.1038/s41598-017-14639-8, 2017.
Li, J., Carlson, B. E., Yung, Y. L., Lv, D., Hansen, J., Penner, J. E., Liao, H., Ramaswamy, V., Kahn, R. A., Zhang, P., Dubovik, O., Ding, A., Lacis, A. A., Zhang, L., and Dong, Y.: Scattering and absorbing aerosols in the climate system, Nat. Rev. Earth Environ., 3, 363–379, https://doi.org/10.1038/s43017-022-00296-7, 2022.
Liu, L., Shawki, D., Voulgarakis, A., Kasoar, M., Samset, B. H., Myhre, G., Forster, P. M., Hodnebrog, Ø., Sillmann, J., Aalbergsjø, S. G., Boucher, O., Faluvegi, G., Iversen, T., Kirkevåg, A., Lamarque, J.-F., Olivié, D., Richardson, T., Shindell, D., and Takemura, T.: A PDRMIP Multimodel Study on the Impacts of Regional Aerosol Forcings on Global and Regional Precipitation, J. Climate, 31, 4429–4447, https://doi.org/10.1175/JCLI-D-17-0439.1, 2018.
Lohmann, U. and Feichter, J.: Global indirect aerosol effects: a review, Atmos. Chem. Phys., 5, 715–737, https://doi.org/10.5194/acp-5-715-2005, 2005.
Lohmann, U. and Neubauer, D.: The importance of mixed-phase and ice clouds for climate sensitivity in the global aerosol–climate model ECHAM6-HAM2, Atmos. Chem. Phys., 18, 8807–8828, https://doi.org/10.5194/acp-18-8807-2018, 2018.
Lund, M. T., Myhre, G., Haslerud, A. S., Skeie, R. B., Griesfeller, J., Platt, S. M., Kumar, R., Myhre, C. L., and Schulz, M.: Concentrations and radiative forcing of anthropogenic aerosols from 1750 to 2014 simulated with the Oslo CTM3 and CEDS emission inventory, Geosci. Model Dev., 11, 4909–4931, https://doi.org/10.5194/gmd-11-4909-2018, 2018a.
Lund, M. T., Samset, B. H., Skeie, R. B., Watson-Parris, D., Katich, J. M., Schwarz, J. P., and Weinzierl, B.: Short Black Carbon lifetime inferred from a global set of aircraft observations, Npj Clim. Atmos. Sci., 1, 1–8, https://doi.org/10.1038/s41612-018-0040-x, 2018b.
Mann, G. W., Carslaw, K. S., Spracklen, D. V., Ridley, D. A., Manktelow, P. T., Chipperfield, M. P., Pickering, S. J., and Johnson, C. E.: Description and evaluation of GLOMAP-mode: a modal global aerosol microphysics model for the UKCA composition-climate model, Geosci. Model Dev., 3, 519–551, https://doi.org/10.5194/gmd-3-519-2010, 2010.
Mauritsen, T., Bader, J., Becker, T., Behrens, J., Bittner, M., Brokopf, R., Brovkin, V., Claussen, M., Crueger, T., Esch, M., Fast, I., Fiedler, S., Fläschner, D., Gayler, V., Giorgetta, M., Goll, D. S., Haak, H., Hagemann, S., Hedemann, C., Hohenegger, C., Ilyina, T., Jahns, T., Jimenéz-de-la-Cuesta, D., Jungclaus, J., Kleinen, T., Kloster, S., Kracher, D., Kinne, S., Kleberg, D., Lasslop, G., Kornblueh, L., Marotzke, J., Matei, D., Meraner, K., Mikolajewicz, U., Modali, K., Möbis, B., Müller, W. A., Nabel, J. E. M. S., Nam, C. C. W., Notz, D., Nyawira, S.-S., Paulsen, H., Peters, K., Pincus, R., Pohlmann, H., Pongratz, J., Popp, M., Raddatz, T. J., Rast, S., Redler, R., Reick, C. H., Rohrschneider, T., Schemann, V., Schmidt, H., Schnur, R., Schulzweida, U., Six, K. D., Stein, L., Stemmler, I., Stevens, B., von Storch, J.-S., Tian, F., Voigt, A., Vrese, P., Wieners, K.-H., Wilkenskjeld, S., Winkler, A., and Roeckner, E.: Developments in the MPI-M Earth System Model version 1.2 (MPI-ESM1.2) and Its Response to Increasing CO2, J. Adv. Model. Earth Sy., 11, 998–1038, https://doi.org/10.1029/2018MS001400, 2019.
Meehl, G. A., Senior, C. A., Eyring, V., Flato, G., Lamarque, J.-F., Stouffer, R. J., Taylor, K. E., and Schlund, M.: Context for interpreting equilibrium climate sensitivity and transient climate response from the CMIP6 Earth system models, Sci. Adv., 6, eaba1981, https://doi.org/10.1126/sciadv.aba1981, 2020.
Meinshausen, M., Vogel, E., Nauels, A., Lorbacher, K., Meinshausen, N., Etheridge, D. M., Fraser, P. J., Montzka, S. A., Rayner, P. J., Trudinger, C. M., Krummel, P. B., Beyerle, U., Canadell, J. G., Daniel, J. S., Enting, I. G., Law, R. M., Lunder, C. R., O'Doherty, S., Prinn, R. G., Reimann, S., Rubino, M., Velders, G. J. M., Vollmer, M. K., Wang, R. H. J., and Weiss, R.: Historical greenhouse gas concentrations for climate modelling (CMIP6), Geosci. Model Dev., 10, 2057–2116, https://doi.org/10.5194/gmd-10-2057-2017, 2017.
Michou, M., Nabat, P., Saint-Martin, D., Bock, J., Decharme, B., Mallet, M., Roehrig, R., Séférian, R., Sénési, S., and Voldoire, A.: Present-Day and Historical Aerosol and Ozone Characteristics in CNRM CMIP6 Simulations, J. Adv. Model. Earth Sy., 12, e2019MS001816, https://doi.org/10.1029/2019MS001816, 2020.
Ming, Y. and Ramaswamy, V.: Nonlinear Climate and Hydrological Responses to Aerosol Effects, J. Climate, 22, 1329–1339, https://doi.org/10.1175/2008JCLI2362.1, 2009.
Morcrette, J.-J., Barker, H. W., Cole, J. N. S., Iacono, M. J., and Pincus, R.: Impact of a New Radiation Package, McRad, in the ECMWF Integrated Forecasting System, Mon. Weather Rev., 136, 4773–4798, https://doi.org/10.1175/2008MWR2363.1, 2008.
Mulcahy, J. P., Johnson, C., Jones, C. G., Povey, A. C., Scott, C. E., Sellar, A., Turnock, S. T., Woodhouse, M. T., Abraham, N. L., Andrews, M. B., Bellouin, N., Browse, J., Carslaw, K. S., Dalvi, M., Folberth, G. A., Glover, M., Grosvenor, D. P., Hardacre, C., Hill, R., Johnson, B., Jones, A., Kipling, Z., Mann, G., Mollard, J., O'Connor, F. M., Palmiéri, J., Reddington, C., Rumbold, S. T., Richardson, M., Schutgens, N. A. J., Stier, P., Stringer, M., Tang, Y., Walton, J., Woodward, S., and Yool, A.: Description and evaluation of aerosol in UKESM1 and HadGEM3-GC3.1 CMIP6 historical simulations, Geosci. Model Dev., 13, 6383–6423, https://doi.org/10.5194/gmd-13-6383-2020, 2020.
Myhre, G., Shindell, D., Bréon, F.-M., Collins, W., Fuglestvedt, J., Huang, J., Koch, D., Lamarque, J.-F., Lee, D., Mendoza, B., Nakajima, T., Robock, A., Stephens, G., Takemura, T., and Zhang, H.: Anthropogenic and Natural Radiative Forcing, in: Climate Change 2013 – The Physical Science Basis: Working Group I Contribution to the Fifth Assessment Report of the Intergovernmental Panel on Climate Change, edited by: Stocker, T. F., Qin, D., Plattner, G.-K., Tignor, M., Allen, S. K., Boschung, J., Nauels, A., Xia, Y., Bex, V., and Midgley, P. M., Cambridge University Press, Cambridge, United Kingdom and New York, NY, USA, 659–740, https://doi.org/10.1017/CBO9781107415324.018, 2013.
Myhre, G., Aas, W., Cherian, R., Collins, W., Faluvegi, G., Flanner, M., Forster, P., Hodnebrog, Ø., Klimont, Z., Lund, M. T., Mülmenstädt, J., Lund Myhre, C., Olivié, D., Prather, M., Quaas, J., Samset, B. H., Schnell, J. L., Schulz, M., Shindell, D., Skeie, R. B., Takemura, T., and Tsyro, S.: Multi-model simulations of aerosol and ozone radiative forcing due to anthropogenic emission changes during the period 1990–2015, Atmos. Chem. Phys., 17, 2709–2720, https://doi.org/10.5194/acp-17-2709-2017, 2017.
Neubauer, D., Lohmann, U., Hoose, C., and Frontoso, M. G.: Impact of the representation of marine stratocumulus clouds on the anthropogenic aerosol effect, Atmos. Chem. Phys., 14, 11997–12022, https://doi.org/10.5194/acp-14-11997-2014, 2014.
Neubauer, D., Ferrachat, S., Siegenthaler-Le Drian, C., Stoll, J., Folini, D. S., Tegen, I., Wieners, K.-H., Mauritsen, T., Stemmler, I., Barthel, S., Bey, I., Daskalakis, N., Heinold, B., Kokkola, H., Partridge, D., Rast, S., Schmidt, H., Schutgens, N., Stanelle, T., Stier, P., Watson-Parris, D., and Lohmann, U.: HAMMOZ-Consortium MPI-ESM1.2-HAM model output prepared for CMIP6 AerChemMIP histSST, Earth System Grid Federation [data set], https://doi.org/10.22033/ESGF/CMIP6.5009, 2019a.
Neubauer, D., Ferrachat, S., Siegenthaler-Le Drian, C., Stoll, J., Folini, D. S., Tegen, I., Wieners, K.-H., Mauritsen, T., Stemmler, I., Barthel, S., Bey, I., Daskalakis, N., Heinold, B., Kokkola, H., Partridge, D., Rast, S., Schmidt, H., Schutgens, N., Stanelle, T., Stier, P., Watson-Parris, D., and Lohmann, U.: HAMMOZ-Consortium MPI-ESM1.2-HAM model output prepared for CMIP6 AerChemMIP histSST-piAer, Earth System Grid Federation [data set], https://doi.org/10.22033/ESGF/CMIP6.5011, 2019b.
Neubauer, D., Ferrachat, S., Siegenthaler-Le Drian, C., Stoll, J., Folini, D. S., Tegen, I., Wieners, K.-H., Mauritsen, T., Stemmler, I., Barthel, S., Bey, I., Daskalakis, N., Heinold, B., Kokkola, H., Partridge, D., Rast, S., Schmidt, H., Schutgens, N., Stanelle, T., Stier, P., Watson-Parris, D., and Lohmann, U.: HAMMOZ-Consortium MPI-ESM1.2-HAM model output prepared for CMIP6 RFMIP piClim-aer, Earth System Grid Federation [data set], https://doi.org/10.22033/ESGF/CMIP6.14728, 2019c.
Neubauer, D., Ferrachat, S., Siegenthaler-Le Drian, C., Stoll, J., Folini, D. S., Tegen, I., Wieners, K.-H., Mauritsen, T., Stemmler, I., Barthel, S., Bey, I., Daskalakis, N., Heinold, B., Kokkola, H., Partridge, D., Rast, S., Schmidt, H., Schutgens, N., Stanelle, T., Stier, P., Watson-Parris, D., and Lohmann, U.: HAMMOZ-Consortium MPI-ESM1.2-HAM model output prepared for CMIP6 RFMIP piClim-control, Earth System Grid Federation [data set], https://doi.org/10.22033/ESGF/CMIP6.14730, 2019d.
Neubauer, D., Ferrachat, S., Siegenthaler-Le Drian, C., Stier, P., Partridge, D. G., Tegen, I., Bey, I., Stanelle, T., Kokkola, H., and Lohmann, U.: The global aerosol–climate model ECHAM6.3–HAM2.3 – Part 2: Cloud evaluation, aerosol radiative forcing, and climate sensitivity, Geosci. Model Dev., 12, 3609–3639, https://doi.org/10.5194/gmd-12-3609-2019, 2019e.
Neubauer, D., Ferrachat, S., Siegenthaler-Le Drian, C., Stoll, J., Folini, D. S., Tegen, I., Wieners, K.-H., Mauritsen, T., Stemmler, I., Barthel, S., Bey, I., Daskalakis, N., Heinold, B., Kokkola, H., Partridge, D., Rast, S., Schmidt, H., Schutgens, N., Stanelle, T., Stier, P., Watson-Parris, D., and Lohmann, U.: HAMMOZ-Consortium MPI-ESM1.2-HAM model output prepared for CMIP6 AerChemMIP piClim-BC, Earth System Grid Federation [data set], https://doi.org/10.22033/ESGF/CMIP6.5024, 2020a.
Neubauer, D., Ferrachat, S., Siegenthaler-Le Drian, C., Stoll, J., Folini, D. S., Tegen, I., Wieners, K.-H., Mauritsen, T., Stemmler, I., Barthel, S., Bey, I., Daskalakis, N., Heinold, B., Kokkola, H., Partridge, D., Rast, S., Schmidt, H., Schutgens, N., Stanelle, T., Stier, P., Watson-Parris, D., and Lohmann, U.: HAMMOZ-Consortium MPI-ESM1.2-HAM model output prepared for CMIP6 AerChemMIP piClim-OC, Earth System Grid Federation [data set], https://doi.org/10.22033/ESGF/CMIP6.5032, 2020b.
Neubauer, D., Ferrachat, S., Siegenthaler-Le Drian, C., Stoll, J., Folini, D. S., Tegen, I., Wieners, K.-H., Mauritsen, T., Stemmler, I., Barthel, S., Bey, I., Daskalakis, N., Heinold, B., Kokkola, H., Partridge, D., Rast, S., Schmidt, H., Schutgens, N., Stanelle, T., Stier, P., Watson-Parris, D., and Lohmann, U.: HAMMOZ-Consortium MPI-ESM1.2-HAM model output prepared for CMIP6 AerChemMIP piClim-SO2, Earth System Grid Federation [data set], https://doi.org/10.22033/ESGF/CMIP6.5033, 2020c.
O'Connor, F.: MOHC UKESM1.0-LL model output prepared for CMIP6 AerChemMIP histSST, Earth System Grid Federation [data set], https://doi.org/10.22033/ESGF/CMIP6.6077, 2019a.
O'Connor, F.: MOHC UKESM1.0-LL model output prepared for CMIP6 AerChemMIP histSST-piAer, Earth System Grid Federation [data set], https://doi.org/10.22033/ESGF/CMIP6.6085, 2019b.
O'Connor, F.: MOHC UKESM1.0-LL model output prepared for CMIP6 AerChemMIP piClim-aer, Earth System Grid Federation [data set], https://doi.org/10.22033/ESGF/CMIP6.6270, 2019c.
O'Connor, F.: MOHC UKESM1.0-LL model output prepared for CMIP6 AerChemMIP piClim-BC, Earth System Grid Federation [data set], https://doi.org/10.22033/ESGF/CMIP6.6225, 2019d.
O'Connor, F.: MOHC UKESM1.0-LL model output prepared for CMIP6 AerChemMIP piClim-control, Earth System Grid Federation [data set], https://doi.org/10.22033/ESGF/CMIP6.6276, 2019e.
O'Connor, F. M., Abraham, N. L., Dalvi, M., Folberth, G. A., Griffiths, P. T., Hardacre, C., Johnson, B. T., Kahana, R., Keeble, J., Kim, B., Morgenstern, O., Mulcahy, J. P., Richardson, M., Robertson, E., Seo, J., Shim, S., Teixeira, J. C., Turnock, S. T., Williams, J., Wiltshire, A. J., Woodward, S., and Zeng, G.: Assessment of pre-industrial to present-day anthropogenic climate forcing in UKESM1, Atmos. Chem. Phys., 21, 1211–1243, https://doi.org/10.5194/acp-21-1211-2021, 2021.
Oliviè, D. J. L., Bentsen, M., Seland, Ø., Toniazzo, T., Gjermundsen, A., Graff, L. S., Debernard, J. B., Gupta, A. K., He, Y., Kirkevåg, A., Schwinger, J., Tjiputra, J., Aas, K. S., Bethke, I., Fan, Y., Griesfeller, J., Grini, A., Guo, C., Ilicak, M., Karset, I. H. H., Landgren, O. A., Liakka, J., Moseid, K. O., Nummelin, A., Spensberger, C., Tang, H., Zhang, Z., Heinze, C., Iversen, T., and Schulz, M.: NCC NorESM2-LM model output prepared for CMIP6 AerChemMIP histSST, Earth System Grid Federation [data set], https://doi.org/10.22033/ESGF/CMIP6.8007, 2019a.
Oliviè, D. J. L., Bentsen, M., Seland, Ø., Toniazzo, T., Gjermundsen, A., Graff, L. S., Debernard, J. B., Gupta, A. K., He, Y., Kirkevåg, A., Schwinger, J., Tjiputra, J., Aas, K. S., Bethke, I., Fan, Y., Griesfeller, J., Grini, A., Guo, C., Ilicak, M., Karset, I. H. H., Landgren, O. A., Liakka, J., Moseid, K. O., Nummelin, A., Spensberger, C., Tang, H., Zhang, Z., Heinze, C., Iversen, T., and Schulz, M.: NCC NorESM2-LM model output prepared for CMIP6 AerChemMIP histSST-piAer, Earth System Grid Federation [data set], https://doi.org/10.22033/ESGF/CMIP6.8015, 2019b.
Oliviè, D. J. L., Bentsen, M., Seland, Ø., Toniazzo, T., Gjermundsen, A., Graff, L. S., Debernard, J. B., Gupta, A. K., He, Y., Kirkevåg, A., Schwinger, J., Tjiputra, J., Aas, K. S., Bethke, I., Fan, Y., Griesfeller, J., Grini, A., Guo, C., Ilicak, M., Karset, I. H. H., Landgren, O. A., Liakka, J., Moseid, K. O., Nummelin, A., Spensberger, C., Tang, H., Zhang, Z., Heinze, C., Iversen, T., and Schulz, M.: NCC NorESM2-LM model output prepared for CMIP6 AerChemMIP piClim-BC, Earth System Grid Federation [data set], https://doi.org/10.22033/ESGF/CMIP6.8125, 2019c.
Oliviè, D. J. L., Bentsen, M., Seland, Ø., Toniazzo, T., Gjermundsen, A., Graff, L. S., Debernard, J. B., Gupta, A. K., He, Y., Kirkevåg, A., Schwinger, J., Tjiputra, J., Aas, K. S., Bethke, I., Fan, Y., Griesfeller, J., Grini, A., Guo, C., Ilicak, M., Karset, I. H. H., Landgren, O. A., Liakka, J., Moseid, K. O., Nummelin, A., Spensberger, C., Tang, H., Zhang, Z., Heinze, C., Iversen, T., and Schulz, M.: NCC NorESM2-LM model output prepared for CMIP6 AerChemMIP piClim-OC, Earth System Grid Federation [data set], https://doi.org/10.22033/ESGF/CMIP6.8157, 2019d.
Oliviè, D. J. L., Bentsen, M., Seland, Ø., Toniazzo, T., Gjermundsen, A., Graff, L. S., Debernard, J. B., Gupta, A. K., He, Y., Kirkevåg, A., Schwinger, J., Tjiputra, J., Aas, K. S., Bethke, I., Fan, Y., Griesfeller, J., Grini, A., Guo, C., Ilicak, M., Karset, I. H. H., Landgren, O. A., Liakka, J., Moseid, K. O., Nummelin, A., Spensberger, C., Tang, H., Zhang, Z., Heinze, C., Iversen, T., and Schulz, M.: NCC NorESM2-LM model output prepared for CMIP6 AerChemMIP piClim-SO2, Earth System Grid Federation [data set], https://doi.org/10.22033/ESGF/CMIP6.8161, 2019e.
Oliviè, D. J. L., Bentsen, M., Seland, Ø., Toniazzo, T., Gjermundsen, A., Graff, L. S., Debernard, J. B., Gupta, A. K., He, Y., Kirkevåg, A., Schwinger, J., Tjiputra, J., Aas, K. S., Bethke, I., Fan, Y., Griesfeller, J., Grini, A., Guo, C., Ilicak, M., Karset, I. H. H., Landgren, O. A., Liakka, J., Moseid, K. O., Nummelin, A., Spensberger, C., Tang, H., Zhang, Z., Heinze, C., Iversen, T., and Schulz, M.: NCC NorESM2-LM model output prepared for CMIP6 RFMIP piClim-aer, Earth System Grid Federation [data set], https://doi.org/10.22033/ESGF/CMIP6.8169, 2019f.
Oliviè, D. J. L., Bentsen, M., Seland, Ø., Toniazzo, T., Gjermundsen, A., Graff, L. S., Debernard, J. B., Gupta, A. K., He, Y., Kirkevåg, A., Schwinger, J., Tjiputra, J., Aas, K. S., Bethke, I., Fan, Y., Griesfeller, J., Grini, A., Guo, C., Ilicak, M., Karset, I. H. H., Landgren, O. A., Liakka, J., Moseid, K. O., Nummelin, A., Spensberger, C., Tang, H., Zhang, Z., Heinze, C., Iversen, T., and Schulz, M.: NCC NorESM2-LM model output prepared for CMIP6 RFMIP piClim-control, Earth System Grid Federation [data set], https://doi.org/10.22033/ESGF/CMIP6.8179, 2019g.
Oshima, N., Yukimoto, S., Deushi, M., Koshiro, T., Kawai, H., Tanaka, T. Y., and Yoshida, K.: Global and Arctic effective radiative forcing of anthropogenic gases and aerosols in MRI-ESM2.0, Prog. Earth Planet. Sci., 7, 38, https://doi.org/10.1186/s40645-020-00348-w, 2020.
Peng, J., Hu, M., Guo, S., Du, Z., Zheng, J., Shang, D., Levy Zamora, M., Zeng, L., Shao, M., Wu, Y.-S., Zheng, J., Wang, Y., Glen, C. R., Collins, D. R., Molina, M. J., and Zhang, R.: Markedly enhanced absorption and direct radiative forcing of black carbon under polluted urban environments, P. Natl. Acad. Sci. USA, 113, 4266–4271, https://doi.org/10.1073/pnas.1602310113, 2016.
Pincus, R. and Baker, M. B.: Effect of precipitation on the albedo susceptibility of clouds in the marine boundary layer, Nature, 372, 250–252, https://doi.org/10.1038/372250a0, 1994.
Pincus, R., Forster, P. M., and Stevens, B.: The Radiative Forcing Model Intercomparison Project (RFMIP): experimental protocol for CMIP6, Geosci. Model Dev., 9, 3447–3460, https://doi.org/10.5194/gmd-9-3447-2016, 2016.
Quaas, J., Jia, H., Smith, C., Albright, A. L., Aas, W., Bellouin, N., Boucher, O., Doutriaux-Boucher, M., Forster, P. M., Grosvenor, D., Jenkins, S., Klimont, Z., Loeb, N. G., Ma, X., Naik, V., Paulot, F., Stier, P., Wild, M., Myhre, G., and Schulz, M.: Robust evidence for reversal of the trend in aerosol effective climate forcing, Atmos. Chem. Phys., 22, 12221–12239, https://doi.org/10.5194/acp-22-12221-2022, 2022.
Ramanathan, V. and Carmichael, G.: Global and regional climate changes due to black carbon, Nat. Geosci., 1, 221–227, https://doi.org/10.1038/ngeo156, 2008.
Ramaswamy, V., Collins, W., Haywood, J., Lean, J., Mahowald, N., Myhre, G., Naik, V., Shine, K. P., Soden, B., Stenchikov, G., and Storelvmo, T.: Radiative Forcing of Climate: The Historical Evolution of the Radiative Forcing Concept, the Forcing Agents and their Quantification, and Applications, Meteorol. Monogr., 59, 14.1–14.101, https://doi.org/10.1175/AMSMONOGRAPHS-D-19-0001.1, 2019.
Roehrig, R., Beau, I., Saint-Martin, D., Alias, A., Decharme, B., Guérémy, J.-F., Voldoire, A., Abdel-Lathif, A. Y., Bazile, E., Belamari, S., Blein, S., Bouniol, D., Bouteloup, Y., Cattiaux, J., Chauvin, F., Chevallier, M., Colin, J., Douville, H., Marquet, P., Michou, M., Nabat, P., Oudar, T., Peyrillé, P., Piriou, J.-M., Salas y Mélia, D., Séférian, R., and Sénési, S.: The CNRM Global Atmosphere Model ARPEGE-Climat 6.3: Description and Evaluation, J. Adv. Model. Earth Sy., 12, e2020MS002075, https://doi.org/10.1029/2020MS002075, 2020.
Rosenfeld, D., Andreae, M. O., Asmi, A., Chin, M., de Leeuw, G., Donovan, D. P., Kahn, R., Kinne, S., Kivekäs, N., Kulmala, M., Lau, W., Schmidt, K. S., Suni, T., Wagner, T., Wild, M., and Quaas, J.: Global observations of aerosol–cloud-precipitation-climate interactions: Aerosol–cloud-climate interactions, Rev. Geophys., 52, 750–808, https://doi.org/10.1002/2013RG000441, 2014.
Samset, B. H., Myhre, G., Schulz, M., Balkanski, Y., Bauer, S., Berntsen, T. K., Bian, H., Bellouin, N., Diehl, T., Easter, R. C., Ghan, S. J., Iversen, T., Kinne, S., Kirkevåg, A., Lamarque, J.-F., Lin, G., Liu, X., Penner, J. E., Seland, Ø., Skeie, R. B., Stier, P., Takemura, T., Tsigaridis, K., and Zhang, K.: Black carbon vertical profiles strongly affect its radiative forcing uncertainty, Atmos. Chem. Phys., 13, 2423–2434, https://doi.org/10.5194/acp-13-2423-2013, 2013.
Sand, M., Berntsen, T. K., Kay, J. E., Lamarque, J. F., Seland, Ø., and Kirkevåg, A.: The Arctic response to remote and local forcing of black carbon, Atmos. Chem. Phys., 13, 211–224, https://doi.org/10.5194/acp-13-211-2013, 2013.
Seferian, R.: CNRM-CERFACS CNRM-ESM2-1 model output prepared for CMIP6 AerChemMIP histSST-piNTCF, Earth System Grid Federation [data set], https://doi.org/10.22033/ESGF/CMIP6.4064, 2019a.
Seferian, R.: CNRM-CERFACS CNRM-ESM2-1 model output prepared for CMIP6 AerChemMIP piClim-BC, Earth System Grid Federation [data set], https://doi.org/10.22033/ESGF/CMIP6.4137, 2019b.
Seferian, R.: CNRM-CERFACS CNRM-ESM2-1 model output prepared for CMIP6 AerChemMIP piClim-OC, Earth System Grid Federation [data set], https://doi.org/10.22033/ESGF/CMIP6.4145, 2019c.
Seferian, R.: CNRM-CERFACS CNRM-ESM2-1 model output prepared for CMIP6 AerChemMIP piClim-SO2, Earth System Grid Federation [data set], https://doi.org/10.22033/ESGF/CMIP6.4146, 2019d.
Seferian, R.: CNRM-CERFACS CNRM-ESM2-1 model output prepared for CMIP6 RFMIP piClim-aer, Earth System Grid Federation [data set], https://doi.org/10.22033/ESGF/CMIP6.9644, 2019e.
Seferian, R.: CNRM-CERFACS CNRM-ESM2-1 model output prepared for CMIP6 RFMIP piClim-control, Earth System Grid Federation [data set], https://doi.org/10.22033/ESGF/CMIP6.9646, 2019f.
Séférian, R., Nabat, P., Michou, M., Saint-Martin, D., Voldoire, A., Colin, J., Decharme, B., Delire, C., Berthet, S., Chevallier, M., Sénési, S., Franchisteguy, L., Vial, J., Mallet, M., Joetzjer, E., Geoffroy, O., Guérémy, J.-F., Moine, M.-P., Msadek, R., Ribes, A., Rocher, M., Roehrig, R., Salas-y-Mélia, D., Sanchez, E., Terray, L., Valcke, S., Waldman, R., Aumont, O., Bopp, L., Deshayes, J., Éthé, C., and Madec, G.: Evaluation of CNRM Earth System Model, CNRM-ESM2-1: Role of Earth System Processes in Present-Day and Future Climate, J. Adv. Model. Earth Sy., 11, 4182–4227, https://doi.org/10.1029/2019MS001791, 2019.
Seland, Ø., Bentsen, M., Olivié, D., Toniazzo, T., Gjermundsen, A., Graff, L. S., Debernard, J. B., Gupta, A. K., He, Y.-C., Kirkevåg, A., Schwinger, J., Tjiputra, J., Aas, K. S., Bethke, I., Fan, Y., Griesfeller, J., Grini, A., Guo, C., Ilicak, M., Karset, I. H. H., Landgren, O., Liakka, J., Moseid, K. O., Nummelin, A., Spensberger, C., Tang, H., Zhang, Z., Heinze, C., Iversen, T., and Schulz, M.: Overview of the Norwegian Earth System Model (NorESM2) and key climate response of CMIP6 DECK, historical, and scenario simulations, Geosci. Model Dev., 13, 6165–6200, https://doi.org/10.5194/gmd-13-6165-2020, 2020.
Sellar, A. A., Walton, J., Jones, C. G., Wood, R., Abraham, N. L., Andrejczuk, M., Andrews, M. B., Andrews, T., Archibald, A. T., de Mora, L., Dyson, H., Elkington, M., Ellis, R., Florek, P., Good, P., Gohar, L., Haddad, S., Hardiman, S. C., Hogan, E., Iwi, A., Jones, C. D., Johnson, B., Kelley, D. I., Kettleborough, J., Knight, J. R., Köhler, M. O., Kuhlbrodt, T., Liddicoat, S., Linova-Pavlova, I., Mizielinski, M. S., Morgenstern, O., Mulcahy, J., Neininger, E., O'Connor, F. M., Petrie, R., Ridley, J., Rioual, J.-C., Roberts, M., Robertson, E., Rumbold, S., Seddon, J., Shepherd, H., Shim, S., Stephens, A., Teixiera, J. C., Tang, Y., Williams, J., Wiltshire, A., and Griffiths, P. T.: Implementation of U. K. Earth System Models for CMIP6, J. Adv. Model. Earth Sy., 12, e2019MS001946, https://doi.org/10.1029/2019MS001946, 2020.
Seo, J., Shim, S., Kwon, S.-H., Boo, K.-O., Kim, Y.-H., O'Connor, F., Johnson, B., Dalvi, M., Folberth, G., Teixeira, J., Mulcahy, J., Hardacre, C., Turnock, S., Woodward, S., Abraham, L., Keeble, J., Griffiths, P., Archibald, A., Richardson, M., Dearden, C., Carslaw, K., Williams, J., Zeng, G., and Morgenstern, O.: The Impacts of Aerosol Emissions on Historical Climate in UKESM1, Atmosphere, 11, 1095, https://doi.org/10.3390/atmos11101095, 2020.
Sherwood, S. C., Bony, S., Boucher, O., Bretherton, C., Forster, P. M., Gregory, J. M., and Stevens, B.: Adjustments in the Forcing-Feedback Framework for Understanding Climate Change, B. Am. Meteorol. Soc., 96, 217–228, https://doi.org/10.1175/BAMS-D-13-00167.1, 2015.
Shindell, D. T., Lamarque, J.-F., Schulz, M., Flanner, M., Jiao, C., Chin, M., Young, P. J., Lee, Y. H., Rotstayn, L., Mahowald, N., Milly, G., Faluvegi, G., Balkanski, Y., Collins, W. J., Conley, A. J., Dalsoren, S., Easter, R., Ghan, S., Horowitz, L., Liu, X., Myhre, G., Nagashima, T., Naik, V., Rumbold, S. T., Skeie, R., Sudo, K., Szopa, S., Takemura, T., Voulgarakis, A., Yoon, J.-H., and Lo, F.: Radiative forcing in the ACCMIP historical and future climate simulations, Atmos. Chem. Phys., 13, 2939–2974, https://doi.org/10.5194/acp-13-2939-2013, 2013.
Smith, C. J., Kramer, R. J., Myhre, G., Forster, P. M., Soden, B. J., Andrews, T., Boucher, O., Faluvegi, G., Fläschner, D., Hodnebrog, Ø., Kasoar, M., Kharin, V., Kirkevåg, A., Lamarque, J.-F., Mülmenstädt, J., Olivié, D., Richardson, T., Samset, B. H., Shindell, D., Stier, P., Takemura, T., Voulgarakis, A., and Watson-Parris, D.: Understanding Rapid Adjustments to Diverse Forcing Agents, Geophys. Res. Lett., 45, 12023–12031, https://doi.org/10.1029/2018GL079826, 2018.
Smith, C. J., Kramer, R. J., Myhre, G., Alterskjær, K., Collins, W., Sima, A., Boucher, O., Dufresne, J.-L., Nabat, P., Michou, M., Yukimoto, S., Cole, J., Paynter, D., Shiogama, H., O'Connor, F. M., Robertson, E., Wiltshire, A., Andrews, T., Hannay, C., Miller, R., Nazarenko, L., Kirkevåg, A., Olivié, D., Fiedler, S., Lewinschal, A., Mackallah, C., Dix, M., Pincus, R., and Forster, P. M.: Effective radiative forcing and adjustments in CMIP6 models, Atmos. Chem. Phys., 20, 9591–9618, https://doi.org/10.5194/acp-20-9591-2020, 2020.
Smith, C. J., Harris, G. R., Palmer, M. D., Bellouin, N., Collins, W., Myhre, G., Schulz, M., Golaz, J. -C., Ringer, M., Storelvmo, T., and Forster, P. M.: Energy Budget Constraints on the Time History of Aerosol Forcing and Climate Sensitivity, J. Geophys. Res.-Atmos., 126, e2020JD033622, https://doi.org/10.1029/2020JD033622, 2021.
Stevens, B.: Rethinking the Lower Bound on Aerosol Radiative Forcing, J. Climate, 28, 4794–4819, https://doi.org/10.1175/JCLI-D-14-00656.1, 2015.
Stier, P.: Limitations of passive remote sensing to constrain global cloud condensation nuclei, Atmos. Chem. Phys., 16, 6595–6607, https://doi.org/10.5194/acp-16-6595-2016, 2016.
Stjern, C. W., Lund, M. T., Samset, B. H., Myhre, G., Forster, P. M., Andrews, T., Boucher, O., Faluvegi, G., Fläschner, D., Iversen, T., Kasoar, M., Kharin, V., Kirkevåg, A., Lamarque, J., Olivié, D., Richardson, T., Sand, M., Shawki, D., Shindell, D., Smith, C. J., Takemura, T., and Voulgarakis, A.: Arctic Amplification Response to Individual Climate Drivers, J. Geophys. Res.-Atmos., 124, 6698–6717, https://doi.org/10.1029/2018JD029726, 2019.
Szopa, S., Naik, V., Adhikary, B., Artaxo Netto, P. E., Berntsen, T., Collins, W. D., Fuzzi, S., Gallardo, L., Kiendler-Scharr, A., Klimont, Z., Liao, H., Unger, N., and Zanis, P.: Short-lived climate forcers, in: Climate Change 2021: The Physical Science Basis. Contribution of Working Group I to the Sixth Assessment Report of the Intergovernmental Panel on Climate Change, edited by: Masson-Delmotte, V., Zhai, P., Pirani, A., Connors, S. L., Péan, C., Berger, S., Caud, N., Chen, Y., Goldfarb, L., Gomis, M. I., Huang, M., Leitzell, K., Lonnoy, E., Matthews, J. B. R., Maycock, T. K., Waterfield, T., Yelekçi, Ö., Yu, R., and Zhou, B., Cambridge University Press, Cambridge, United Kingdom and New York, NY, USA, 817–922, https://doi.org/10.1017/9781009157896.001, 2021.
Taylor, K. E., Crucifix, M., Braconnot, P., Hewitt, C. D., Doutriaux, C., Broccoli, A. J., Mitchell, J. F. B., and Webb, M. J.: Estimating Shortwave Radiative Forcing and Response in Climate Models, J. Climate, 20, 2530–2543, https://doi.org/10.1175/JCLI4143.1, 2007.
Tegen, I., Neubauer, D., Ferrachat, S., Siegenthaler-Le Drian, C., Bey, I., Schutgens, N., Stier, P., Watson-Parris, D., Stanelle, T., Schmidt, H., Rast, S., Kokkola, H., Schultz, M., Schroeder, S., Daskalakis, N., Barthel, S., Heinold, B., and Lohmann, U.: The global aerosol–climate model ECHAM6.3–HAM2.3 – Part 1: Aerosol evaluation, Geosci. Model Dev., 12, 1643–1677, https://doi.org/10.5194/gmd-12-1643-2019, 2019.
Thornhill, G. D., Collins, W. J., Kramer, R. J., Olivié, D., Skeie, R. B., O'Connor, F. M., Abraham, N. L., Checa-Garcia, R., Bauer, S. E., Deushi, M., Emmons, L. K., Forster, P. M., Horowitz, L. W., Johnson, B., Keeble, J., Lamarque, J.-F., Michou, M., Mills, M. J., Mulcahy, J. P., Myhre, G., Nabat, P., Naik, V., Oshima, N., Schulz, M., Smith, C. J., Takemura, T., Tilmes, S., Wu, T., Zeng, G., and Zhang, J.: Effective radiative forcing from emissions of reactive gases and aerosols – a multi-model comparison, Atmos. Chem. Phys., 21, 853–874, https://doi.org/10.5194/acp-21-853-2021, 2021.
Tsikerdekis, A., Zanis, P., Georgoulias, A. K., Alexandri, G., Katragkou, E., Karacostas, T., and Solmon, F.: Direct and semi-direct radiative effect of North African dust in present and future regional climate simulations, Clim. Dynam., 53, 4311–4336, https://doi.org/10.1007/s00382-019-04788-z, 2019.
Twomey, S.: Pollution and the planetary albedo, Atmos. Environ. 1967, 8, 1251–1256, https://doi.org/10.1016/0004-6981(74)90004-3, 1974.
Twomey, S.: The Influence of Pollution on the Shortwave Albedo of Clouds, J. Atmos. Sci., 34, 1149–1152, https://doi.org/10.1175/1520-0469(1977)034<1149:TIOPOT>2.0.CO;2, 1977.
van Marle, M. J. E., Kloster, S., Magi, B. I., Marlon, J. R., Daniau, A.-L., Field, R. D., Arneth, A., Forrest, M., Hantson, S., Kehrwald, N. M., Knorr, W., Lasslop, G., Li, F., Mangeon, S., Yue, C., Kaiser, J. W., and van der Werf, G. R.: Historic global biomass burning emissions for CMIP6 (BB4CMIP) based on merging satellite observations with proxies and fire models (1750–2015), Geosci. Model Dev., 10, 3329–3357, https://doi.org/10.5194/gmd-10-3329-2017, 2017.
van Noije, T., Bergman, T., Le Sager, P., O'Donnell, D., Makkonen, R., Gonçalves-Ageitos, M., Döscher, R., Fladrich, U., von Hardenberg, J., Keskinen, J.-P., Korhonen, H., Laakso, A., Myriokefalitakis, S., Ollinaho, P., Pérez García-Pando, C., Reerink, T., Schrödner, R., Wyser, K., and Yang, S.: EC-Earth3-AerChem: a global climate model with interactive aerosols and atmospheric chemistry participating in CMIP6 , Geosci. Model Dev., 14, 5637–5668, https://doi.org/10.5194/gmd-14-5637-2021, 2021.
Vignati, E., Wilson, J., and Stier, P.: M7: An efficient size-resolved aerosol microphysics module for large-scale aerosol transport models, J. Geophys. Res.-Atmos., 109, D22202, https://doi.org/10.1029/2003JD004485, 2004.
Wang, R., Balkanski, Y., Boucher, O., Ciais, P., Schuster, G. L., Chevallier, F., Samset, B. H., Liu, J., Piao, S., Valari, M., and Tao, S.: Estimation of global black carbon direct radiative forcing and its uncertainty constrained by observations, J. Geophys. Res.-Atmos., 121, 5948–5971, https://doi.org/10.1002/2015JD024326, 2016.
Wang, Z., Lin, L., Xu, Y., Che, H., Zhang, X., Zhang, H., Dong, W., Wang, C., Gui, K., and Xie, B.: Incorrect Asian aerosols affecting the attribution and projection of regional climate change in CMIP6 models, Npj Clim. Atmos. Sci., 4, 1–8, https://doi.org/10.1038/s41612-020-00159-2, 2021.
Wild, M.: Global dimming and brightening: A review, J. Geophys. Res.-Atmos., 114, D00D16, https://doi.org/10.1029/2008JD011470, 2009.
Wild, M.: Enlightening Global Dimming and Brightening, B. Am. Meteorol. Soc., 93, 27–37, https://doi.org/10.1175/BAMS-D-11-00074.1, 2012.
Yang, Y., Smith, S. J., Wang, H., Lou, S., and Rasch, P. J.: Impact of Anthropogenic Emission Injection Height Uncertainty on Global Sulfur Dioxide and Aerosol Distribution, J. Geophys. Res.-Atmos., 124, 4812–4826, https://doi.org/10.1029/2018JD030001, 2019.
Yool, A., Palmiéri, J., Jones, C. G., Sellar, A. A., de Mora, L., Kuhlbrodt, T., Popova, E. E., Mulcahy, J. P., Wiltshire, A., Rumbold, S. T., Stringer, M., Hill, R. S. R., Tang, Y., Walton, J., Blaker, A., Nurser, A. J. G., Coward, A. C., Hirschi, J., Woodward, S., Kelley, D. I., Ellis, R., and Rumbold-Jones, S.: Spin-up of UK Earth System Model 1 (UKESM1) for CMIP6, J. Adv. Model. Earth Sy., 12, e2019MS001933, https://doi.org/10.1029/2019MS001933, 2020.
Yukimoto, S., Koshiro, T., Kawai, H., Oshima, N., Yoshida, K., Urakawa, S., Tsujino, H., Deushi, M., Tanaka, T., Hosaka, M., Yoshimura, H., Shindo, E., Mizuta, R., Ishii, M., Obata, A., and Adachi, Y.: MRI MRI-ESM2.0 model output prepared for CMIP6 AerChemMIP piClim-BC, Earth System Grid Federation [data set], https://doi.org/10.22033/ESGF/CMIP6.6874, 2019a.
Yukimoto, S., Koshiro, T., Kawai, H., Oshima, N., Yoshida, K., Urakawa, S., Tsujino, H., Deushi, M., Tanaka, T., Hosaka, M., Yoshimura, H., Shindo, E., Mizuta, R., Ishii, M., Obata, A., and Adachi, Y.: MRI MRI-ESM2.0 model output prepared for CMIP6 AerChemMIP piClim-OC, Earth System Grid Federation [data set], https://doi.org/10.22033/ESGF/CMIP6.6882, 2019b.
Yukimoto, S., Koshiro, T., Kawai, H., Oshima, N., Yoshida, K., Urakawa, S., Tsujino, H., Deushi, M., Tanaka, T., Hosaka, M., Yoshimura, H., Shindo, E., Mizuta, R., Ishii, M., Obata, A., and Adachi, Y.: MRI MRI-ESM2.0 model output prepared for CMIP6 AerChemMIP piClim-SO2, Earth System Grid Federation [data set], https://doi.org/10.22033/ESGF/CMIP6.6883, 2019c.
Yukimoto, S., Koshiro, T., Kawai, H., Oshima, N., Yoshida, K., Urakawa, S., Tsujino, H., Deushi, M., Tanaka, T., Hosaka, M., Yoshimura, H., Shindo, E., Mizuta, R., Ishii, M., Obata, A., and Adachi, Y.: MRI MRI-ESM2.0 model output prepared for CMIP6 RFMIP piClim-aer, Earth System Grid Federation [data set], https://doi.org/10.22033/ESGF/CMIP6.6885, 2019d.
Yukimoto, S., Koshiro, T., Kawai, H., Oshima, N., Yoshida, K., Urakawa, S., Tsujino, H., Deushi, M., Tanaka, T., Hosaka, M., Yoshimura, H., Shindo, E., Mizuta, R., Ishii, M., Obata, A., and Adachi, Y.: MRI MRI-ESM2.0 model output prepared for CMIP6 RFMIP piClim-control, Earth System Grid Federation [data set], https://doi.org/10.22033/ESGF/CMIP6.6888, 2019e.
Yukimoto, S., Kawai, H., Koshiro, T., Oshima, N., Yoshida, K., Urakawa, S., Tsujino, H., Deushi, M., Tanaka, T., Hosaka, M., Yabu, S., Yoshimura, H., Shindo, E., Mizuta, R., Obata, A., Adachi, Y., and Ishii, M.: The Meteorological Research Institute Earth System Model Version 2.0, MRI-ESM2.0: Description and Basic Evaluation of the Physical Component, J. Meteorol. Soc. Jpn. Ser II, 97, 931–965, https://doi.org/10.2151/jmsj.2019-051, 2019f.
Zanatta, M., Gysel, M., Bukowiecki, N., Müller, T., Weingartner, E., Areskoug, H., Fiebig, M., Yttri, K. E., Mihalopoulos, N., Kouvarakis, G., Beddows, D., Harrison, R. M., Cavalli, F., Putaud, J. P., Spindler, G., Wiedensohler, A., Alastuey, A., Pandolfi, M., Sellegri, K., Swietlicki, E., Jaffrezo, J. L., Baltensperger, U., and Laj, P.: A European aerosol phenomenology-5: Climatology of black carbon optical properties at 9 regional background sites across Europe, Atmos. Environ., 145, 346–364, https://doi.org/10.1016/j.atmosenv.2016.09.035, 2016.
Zanis, P., Akritidis, D., Georgoulias, A. K., Allen, R. J., Bauer, S. E., Boucher, O., Cole, J., Johnson, B., Deushi, M., Michou, M., Mulcahy, J., Nabat, P., Olivié, D., Oshima, N., Sima, A., Schulz, M., Takemura, T., and Tsigaridis, K.: Fast responses on pre-industrial climate from present-day aerosols in a CMIP6 multi-model study, Atmos. Chem. Phys., 20, 8381–8404, https://doi.org/10.5194/acp-20-8381-2020, 2020.
Zelinka, M. D., Andrews, T., Forster, P. M., and Taylor, K. E.: Quantifying components of aerosol–cloud–radiation interactions in climate models, J. Geophys. Res.-Atmos., 119, 7599–7615, https://doi.org/10.1002/2014JD021710, 2014.
Zelinka, M. D., Myers, T. A., McCoy, D. T., Po-Chedley, S., Caldwell, P. M., Ceppi, P., Klein, S. A., and Taylor, K. E.: Causes of Higher Climate Sensitivity in CMIP6 Models, Geophys. Res. Lett., 47, e2019GL085782, https://doi.org/10.1029/2019GL085782, 2020.
Zelinka, M. D., Smith, C. J., Qin, Y., and Taylor, K. E.: Comparison of methods to estimate aerosol effective radiative forcings in climate models, Atmos. Chem. Phys., 23, 8879–8898, https://doi.org/10.5194/acp-23-8879-2023, 2023.
Zhang, K., Zhang, W., Wan, H., Rasch, P. J., Ghan, S. J., Easter, R. C., Shi, X., Wang, Y., Wang, H., Ma, P.-L., Zhang, S., Sun, J., Burrows, S. M., Shrivastava, M., Singh, B., Qian, Y., Liu, X., Golaz, J.-C., Tang, Q., Zheng, X., Xie, S., Lin, W., Feng, Y., Wang, M., Yoon, J.-H., and Leung, L. R.: Effective radiative forcing of anthropogenic aerosols in E3SM version 1: historical changes, causality, decomposition, and parameterization sensitivities, Atmos. Chem. Phys., 22, 9129–9160, https://doi.org/10.5194/acp-22-9129-2022, 2022.
Zhang, S., Wang, M., Ghan, S. J., Ding, A., Wang, H., Zhang, K., Neubauer, D., Lohmann, U., Ferrachat, S., Takeamura, T., Gettelman, A., Morrison, H., Lee, Y., Shindell, D. T., Partridge, D. G., Stier, P., Kipling, Z., and Fu, C.: On the characteristics of aerosol indirect effect based on dynamic regimes in global climate models, Atmos. Chem. Phys., 16, 2765–2783, https://doi.org/10.5194/acp-16-2765-2016, 2016.
Zhao, M., Golaz, J.-C., Held, I. M., Guo, H., Balaji, V., Benson, R., Chen, J.-H., Chen, X., Donner, L. J., Dunne, J. P., Dunne, K., Durachta, J., Fan, S.-M., Freidenreich, S. M., Garner, S. T., Ginoux, P., Harris, L. M., Horowitz, L. W., Krasting, J. P., Langenhorst, A. R., Liang, Z., Lin, P., Lin, S.-J., Malyshev, S. L., Mason, E., Milly, P. C. D., Ming, Y., Naik, V., Paulot, F., Paynter, D., Phillipps, P., Radhakrishnan, A., Ramaswamy, V., Robinson, T., Schwarzkopf, D., Seman, C. J., Shevliakova, E., Shen, Z., Shin, H., Silvers, L. G., Wilson, J. R., Winton, M., Wittenberg, A. T., Wyman, B., and Xiang, B.: The GFDL Global Atmosphere and Land Model AM4.0/LM4.0: 2. Model Description, Sensitivity Studies, and Tuning Strategies, J. Adv. Model. Earth Sy., 10, 735–769, https://doi.org/10.1002/2017MS001209, 2018.
Zheng, B., Tong, D., Li, M., Liu, F., Hong, C., Geng, G., Li, H., Li, X., Peng, L., Qi, J., Yan, L., Zhang, Y., Zhao, H., Zheng, Y., He, K., and Zhang, Q.: Trends in China's anthropogenic emissions since 2010 as the consequence of clean air actions, Atmos. Chem. Phys., 18, 14095–14111, https://doi.org/10.5194/acp-18-14095-2018, 2018.