the Creative Commons Attribution 4.0 License.
the Creative Commons Attribution 4.0 License.
 | 05 Jul 2024
Global estimates of ambient reactive nitrogen components during 2000–2100 based on the multi-stage model
Rui Li
Yining Gao
Lijia Zhang
Yubing Shen
Tianzhao Xu
Gehui Wang
High contents of reactive nitrogen components aggravate air pollution and could also impact ecosystem structures and functioning across the terrestrial–aquatic–marine continuum. However, the long-term historical trends and future predictions of reactive nitrogen components at the global scale still remain highly uncertain. In our study, field observations, satellite products, model outputs, and many other covariates were integrated into the multi-stage machine-learning model to capture the global patterns of reactive nitrogen components during 2000–2019. In order to decrease the estimate uncertainties in the future scenarios, the constructed reactive nitrogen component dataset for the historical period was utilised as the constraint to calibrate the CMIP6 dataset in four scenarios. The results suggested that the cross-validation (CV) R2 values of four species showed satisfying performance (R2>0.55). The concentrations of estimated reactive nitrogen components in China experienced persistent increases during 2000–2013, while they suffered drastic decreases from 2013, except for NH3. This might be associated with the impact of clean-air policies. However, in Europe and the United States, these compounds have remained relatively stable since 2000. In the future scenarios, SSP3-7.0 (traditional-energy scenario) and SSP1-2.6 (carbon neutrality scenario) showed the highest and lowest reactive nitrogen component concentrations, respectively. Although the reactive nitrogen concentrations in some heavy-pollution scenarios (SSP3-7.0) also experienced decreases during 2020–2100, SSP1-2.6 and SSP2-4.5 (middle-emission scenario) still showed more rapidly decreasing trends. Our results emphasise the need for carbon neutrality pathways to reduce global atmospheric N pollution.
- Article
(3823 KB) - Full-text XML
-
Supplement
(3441 KB) - BibTeX
- EndNote


Along with the development of global urbanisation and industrialisation, the anthropogenic emissions of reactive nitrogen (e.g. NOx, NH3) have experienced drastic increases during the past decades and have caused the higher concentrations of NO2; NH3; and many secondary components such as (NO3–N), (NH4–N), and HNO3 (Chen et al., 2021; L. Liu et al., 2020; McDuffie et al., 2020). The reactive nitrogen released from anthropogenic sources could significantly alter the global nitrogen cycle throughout the Earth system (Altieri et al., 2021; Zhang et al., 2020). Reactive nitrogen in the atmosphere dominates the chemical formation of tropospheric O3 and aggravates particle pollution (Geddes and Martin, 2017), with implications for global air quality and climate change (He et al., 2022; Von Schneidemesser et al., 2015). Moreover, the ambient reactive nitrogen could be deposited into the land surface and could cause lake eutrophication and soil acidification (Bouwman et al., 2002; Chen et al., 2018). Therefore, it is highly necessary to understand the spatial distributions and temporal evolution trends of reactive nitrogen components at the global scale.
Despite the global importance, observational constraints on reactive nitrogen in the atmosphere are still scarce in most parts of the world (L. Liu et al., 2020). Furthermore, the majority of monitoring sites focus on China, Europe, and the United States (Du et al., 2014; Li et al., 2020, 2019a, 2016), resulting in only limited spatial representativeness (Shi et al., 2018), which restricts the accurate assessment of global reactive nitrogen pollution. Fortunately, satellite observations give us a unprecedent chance to capture the global variations in atmospheric reactive nitrogen. Geddes and Martin (2017) used satellite products to calibrate the simulated reactive nitrogen oxides (NOy) and to improve the predictive performance (R=0.83) compared with chemical transport model (CTM) outputs alone (Geddes and Martin, 2017). Following this, Liu et al. (2021) also used a similar method to estimate the global wet deposition of reduced nitrogen () and achieved an R value of 0.80 (Liu et al., 2021). Although the calibration based on satellite products could improve predictive accuracy compared with CTM outputs, the simulated values are still largely biased as a result of the ground-level observations. Moreover, the method cannot accurately fill the gaps in reactive nitrogen concentrations without satellite coverage. In our previous works, we developed a satellite-based ensemble machine-learning model to predict the wet deposition across China, and the R2 value reached 0.76 (R=0.88) (Li et al., 2020). However, this technique was not expanded to the global scale, and the high-accuracy and full-coverage global ambient reactive nitrogen dataset was still lacking.
Apart from the historical estimates, the future prediction of reactive nitrogen is also important because these components in the future scenarios could significantly affect the land carbon cycle and greenhouse gas emissions, both of which could aggravate global climate change and affect the safety of the Earth system (Chen et al., 2015; Zaehle, 2013). To the best of our knowledge, only two studies focused on global aerosol prediction in the future scenarios. Chen et al. (2023) predicted the global PM2.5 levels and associated mortalities in 2100 under different climate scenarios and found that the SSP3-7.0 scenario was linked with the highest PM2.5 exposure. Li et al. (2022) also simulated the global (NO3–N) and (NH4–N) levels in four future scenarios and demonstrated that both of these components showed marked decreases in most cases, except in the SSP5-8.5 scenario. However, this study predicted the future reactive nitrogen based on historical CTM outputs alone, which lack observational constraints. The results might increase the uncertainty of assessment.
In our study, we developed a multi-stage model to estimate the concentrations of four reactive nitrogen species ( (NO3–N), HNO3, NH3, and (NH4–N)) during 2000–2019; these species were chosen because they are the most important reactive nitrogen components for human health and ecological ecosystems and also showed abundant ground-level observations. Then, the species over the 2020–2100 period under the SSP1-2.6, SSP2-4.5, SSP3-7.0, and SSP5-8.5 scenarios were also corrected based on the historical estimates. Finally, the long-term dataset of reactive nitrogen during 2000–2100 was constructed. Our results should prove to be beneficial in the assessment of the impacts of reactive nitrogen components on air pollution and climate change in the future.
2.1 Reactive nitrogen observations
Most reactive nitrogen observations are focused on East Asia, Europe, and the United States. The monthly monitoring data for reactive nitrogen components during 2010–2015 in China were downloaded from the Nationwide Nitrogen Deposition Monitoring Network (NNDMN) including 32 sites; these sites can be classified into three types, namely urban, rural, and background sites (Xu et al., 2019) (Table S1 in the Supplement). The concentrations of reactive nitrogen components were determined using the active DELTA (DEnuder for Long-Term Atmospheric sampling) system. The sampling and analysis procedures have been described in detail by Xu et al. (2019). The dataset of reactive nitrogen components in other countries of East Asia during 2000–2019 can be downloaded from the Acid Deposition Monitoring Network in East Asia (EANET), which includes 41 sites. The European Monitoring and Evaluation Programme (EMEP) provides records of long-term reactive nitrogen components in 86 sites across most countries in western Europe. A dataset of monthly reactive nitrogen components in 84 locations across the United States can be obtained from the Clean Air Status and Trends Network (CASTNET) (Fig. S1).
2.2 Data preparation
The GEOS-Chem (v13.4.0) model driven by MERRA2 meteorological parameters was applied to simulate the historical reactive nitrogen components (daily) during 2000–2019 (Feng et al., 2021). The GEOS-Chem model was composed of detailed ozone–NOx–VOC–PM–halogen tropospheric chemistry. The grid version of the model with a horizontal resolution of 2°×2.5° was utilised. Wet deposition contained many processes including sub-grid scavenging in convective updrafts, in-cloud rainout, and below-cloud washout (Liu et al., 2001). Dry deposition was estimated based on a resistance-in-series model (Wesely, 2007). The estimates of aerosol optical properties account for the hygroscopic growth (Drury et al., 2010). Vertical mixing in the boundary layer follows a non-local scheme implemented by Lin and McElroy (2010), and convection employs the relaxed Arakawa–Schubert scheme. The anthropogenic emission inventory for 2000–2019 was downloaded from the website of the Community Emissions Data System (CEDS) (Hoesly et al., 2018). The CEDS emission inventory includes eight sectors, namely agriculture, energy, industry, residential, shipping, solvents, transportation, and waste incineration. Then, the daily reactive nitrogen components were averaged to the monthly scale.
The IASI instrument aboard the polar sun-synchronous MetOp platform traverses the Equator twice each day (09:30 and 21:30, local solar time) (Whitburn et al., 2016a). The measurements in the daytime usually show better accuracy than those at night due to the high sensitivity to ambient NH3 (Van Damme et al., 2017; Whitburn et al., 2016a, b). In our study, we used the IASI NH3 columns in the morning during 2008–2019 to estimate the NH3 and concentrations globally. Besides this, the NH3 column dataset with a cloud shield higher than 25 % and relative error above 100 % was eliminated.
The tropospheric vertical column density (VCD) of NO2 was retrieved from the OMI instrument aboard the Aura satellite, which crosses the earth once a day (Kim et al., 2016). OMI-derived tropospheric NO2 column densities for the period 2005–2019 were applied to develop the model. The tropospheric NO2 column density data with cloud radiance fraction > 0.5, terrain reflectivity > 30 %, and solar zenith angles > 85° were screened (Cooper et al., 2022). Additionally, the NO2 columns from GOME (1995–2003), SCIAMACHY (2002–2011), and GOME-2 (2007–present) were also collected to simulate the (NO3–N) and HNO3 levels. The similar overpass time of these three instruments (from about 09:30 to 10:30 LT, local time) facilitates simultaneous use to capture consistent long-term coverage. However, the dataset cannot cover the NO2 columns from 2017. To overcome the inconsistency of these satellite products, we applied the linear regression technique to construct the relationship between OMI NO2 columns and GOME/SCIAMACHY NO2 columns. The results suggested that these satellite products showed a good relationship (R2>0.6). Finally, the long-term (2000–2019) NO2 columns at the global scale were constructed.
The monthly meteorological parameters derived from ERA-5 comprise of 2 m dew point temperature (D2 m), 2 m temperature (T2 m), surface pressure (Sp), total precipitation (Tp), 10 m U wind component (U10), and 10 m V wind component (V10). The global population density data for the period 2000–2020 were downloaded from https://hub.worldpop.org/geodata/listing?id=64 (last access: 10 June 2024). The elevation data were extracted from ETOPO at a spatial resolution of 1′ (Amante and Eakins, 2009) (https://rda.ucar.edu/datasets/ds759.4/, last access: 2 June 2024). In addition, the land use types – including cropland, forest, grassland, shrubland, tundra, barren land, and snow/ice – were obtained from H. Liu et al. (2020). Besides this, the CMIP6 dataset for four scenarios was also applied to predict the reactive nitrogen concentrations during 2020–2100. The dataset includes 2 m air temperatures, wind speed at 850 and 500 hPa, total cloud cover, precipitation, relative humidity, and shortwave radiation. The modelled meteorological parameters derived from 16 Earth system models were incorporated into the machine-learning model. The models are summarised in Table S2.
2.3 Model development
A three-stage model was established to capture the full-coverage reactive nitrogen dataset at the global scale (Fig. 1). In the first stage, the ground-level reactive nitrogen species, satellite products (e.g. OMI-NO2 and IASI-NH3 columns), meteorological parameters, land use types, populations, and simulated reactive nitrogen components derived from the GEOS-Chem model were collected as the independent variables to estimate the gridded reactive nitrogen species for the period or grid with satellite product based on the XGBoost algorithm. In the second stage, the meteorological parameters, GEOS-Chem output, land use types, and populations were applied to fill the gaps without satellite retrievals. Then, the simulated results based on these models were fused to obtain the full-coverage reactive nitrogen components; the ground-level observations were further used to calibrate the full-coverage dataset, and the final reactive nitrogen components at the global scale were simulated. In the last stage, the reactive nitrogen components and meteorological parameters for four scenarios (SSP1-2.6, SSP2-4.5, SSP3-7.0, and SSP5-8.5) during 2020–2100 were collected from the CMIP6 dataset including 16 Earth system models (Table S2). Then, the data in the future scenarios were integrated into the ensemble model including XGBoost, LightGBM, and convolutional neural networks (CNNs) to further calibrate the modelling results based on the historical dataset (2000–2019) derived from the previous two-stage model. The detailed equations of multiple machine-learning models are summarised below.
-
For the XGBoost model, we use
where F(t) is the cost function during the tth period, ∂ is the derivative of the function, represents the second derivative of the function, l denotes the differentiable convex loss function that reveals the difference between the predicted value () of the ith instance during the tth period and the target value (yi), ft(x) represents the increment, and Ω(ft) reflects the regulariser. The maximum tree depth and learning rate reached 15 and 0.1, respectively.
-
For the LightGBM model, we use
where Q(y,f(x)) reflects the specific loss function, and denotes the regression trees. The maximum tree depth, learning rate, and feature fraction reached 25, 0.2, and 0.7, respectively.
-
For the CNN model, the reactive nitrogen species and meteorological parameters in the future scenarios were applied based on the historical (2000–2019) reactive nitrogen species derived from stages 1–2 of the model.
Here, x (x1, x2, …, xn) represents the reactive nitrogen species and the meteorological parameters derived from the CMIP6 dataset, and y (y1, y2, …, yn) denotes the historical (2000–2019) reactive nitrogen species.

Figure 1The workflow of global full-coverage reactive nitrogen estimates during 2000–2100. GCoutput denotes the GEOS-Chem output.
All of the convolution layers showed the same kernel size of 3×3 and used the rectified linear unit (ReLU) as the activation function. Max-pooling layers were employed for adjusting the size of images to better capture bottleneck information. After each block, the image size could be halved by using the max-pooling layer with a kernel size of 2×2, but the number of channels will be doubled. In our study, the learning rate was set to 0.1 to achieve the best performance.
All of the independent variables collected from multiple sources were resampled to 0.25° grids using Kriging interpolation. For example, both the population density and land use types in each grid were calculated using a spatial-clipping toolbox. Later on, all of these variables were combined to develop the model. During the development of the multi-stage model, it was highly imperative to remove some redundant explanatory variables and then to determine the optimal variable group. Redundant variables mean that the overall predictive accuracy could be degraded after the removal of these variables.
3.1 The modelling performance of historical reactive nitrogen estimates
The multi-stage model was applied to capture the spatiotemporal variations of reactive nitrogen concentrations during 2000–2100. In our study, we employed the XGBoost model to construct the full-coverage reactive nitrogen dataset for the period 2000–2020. The cross-validation (CV) R2 values of the model for (NO3–N), HNO3, NH3, and (NH4–N) estimates reached 0.67, 0.62, 0.58, and 0.60, respectively (Fig. 2). The RMSE values of (NO3–N), HNO3, NH3, and (NH4–N) were 0.55, 0.23, 2.32, and 1.71 µg N m−3, respectively. The MAE values of (NO3–N), HNO3, NH3, and (NH4–N) reached 0.19, 0.13, 1.23, and 0.59 µg N m−3. The CV R2 values of the (NO3–N), HNO3, and (NH4–N) estimates were significantly higher than those of Jia et al. (2016) (0.22, 0.41, and 0.49), while the CV R2 value of the estimate in our study was comparable to that of Geddes et al. (2017) (0.68). The CV R2 value of the NH3 estimates were also close to the results obtained by Liu et al. (2019) (0.45–0.71). Overall, the predictive performance of the historical reactive nitrogen was satisfactory. Although the CV R2 values in our study were not significantly higher than those in some previous studies, our study developed the full-coverage (gap-free) ambient reactive nitrogen dataset, which was superior to some previous studies. Based on the constructed full-coverage reactive nitrogen dataset, we also developed the ensemble model to calibrate the CMIP6 dataset for the future scenarios. The CV R2 values of the model for the (NO3–N), HNO3, NH3, and (NH4–N) estimates in the future scenarios reached 0.62, 0.67, 0.56, and 0.60, respectively (Fig. S2). The RMSE values of (NO3–N), HNO3, NH3, and (NH4–N) were 0.58, 0.26, 2.12, and 1.91 µg N m−3, respectively. The MAE values of (NO3–N), HNO3, NH3, and (NH4–N) reached 0.22, 0.22, 1.04, and 0.65 µg N m−3. Overall, the ensemble model for these species in the future scenarios still showed satisfactory performance; thus, the result could be treated as robust.
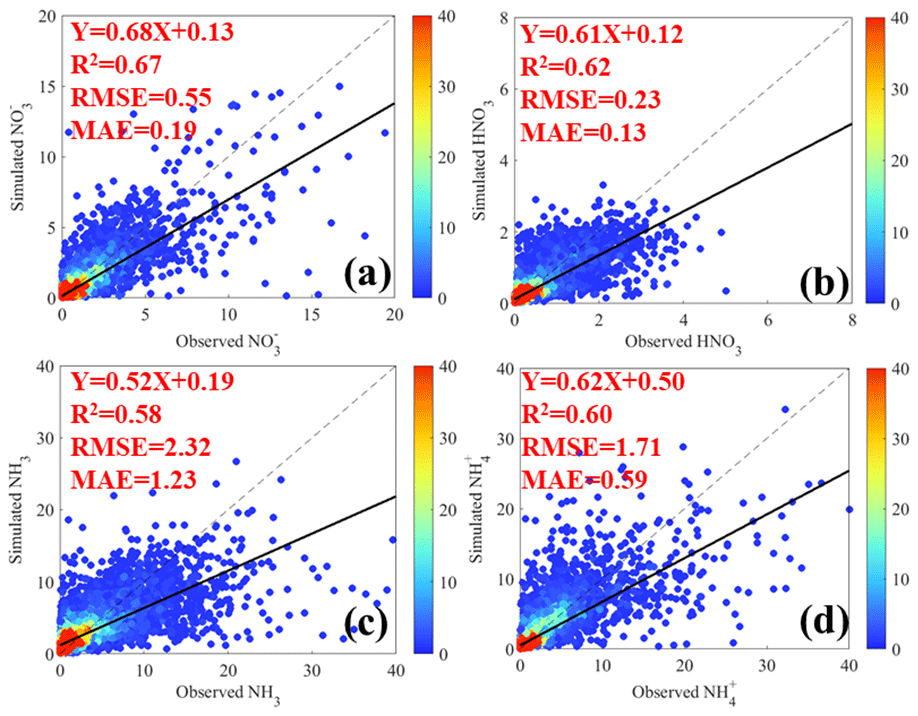
Figure 2The predictive performances of four reactive nitrogen components, namely (NO3–N) (a), HNO3 (b), NH3 (c), and (NH4—N) (d). The model was constructed with 90 % original data, and the remaining data were applied to validate the model. The solid black line denotes the best-fitting curve for all of the points, while the dashed black line represents the diagonal, which indicates the same observed and simulated values. The colour scale denotes the sample size.
3.2 The spatial patterns of nitrogen reactive components
The global annual mean concentrations of , HNO3, NH3, and during 2000–2019 ranged from 0.03 to 9.08, 0.03 to 1.73, 0.21 to 13.9, and 0.08 to 17.1 µg N m−3, with mean values of 0.43 ± 0.24 (standard deviation over grids), 0.28 ± 0.13, 1.79 ± 0.85, and 0.65 ± 0.36 µg N m−3 (Fig. S3), respectively. East Asia, especially China; western Europe; and the United States have obtained widespread attention due to their developed economies and dense anthropogenic activity.
In China, the overall mean ambient (NO3–N), HNO3, NH3, and (NH4–N) concentrations reached 1.05 ± 0.62, 0.35 ± 0.19, 4.05 ± 1.84, and 2.38±1.26 µg N m−3, ranging from 0.07 to 9.08, 0.06 to 1.73, 0.84 to 11.6, and 0.18 to 13.1 µg N m−3. At the regional scale, the annual mean , HNO3, NH3, and concentrations followed the order of the North China Plain (NCP) (4.38, 1.12, 7.22, and 7.69 µg N m−3) and then the Sichuan basin (2.40 ± 1.01, 0.52 ± 0.28, 4.92 ± 1.71, and 6.02 ± 1.82 µg N m−3) (Fig. 3). The NCP displayed higher and HNO3 concentrations due to dense human activities and its strong industry foundation (Qi et al., 2023; Wen et al., 2018), which could emit a large amount of NOx to the atmosphere. In both the Yangtze River Delta (YRD) and the Pearl River Delta (PRD), the combustion of fossil fuels and traffic emissions might be the major source of NOx emissions, which aggravates nitrate events via gas–particle conversion processes (Huang et al., 2017; Li et al., 2017). For the Sichuan basin, the poor topographical and/or meteorological conditions were major factors responsible for the severe nitrate pollution (Zhang et al., 2019). It was not surprising that high ambient NH3 concentrations were found at the NCP and Sichuan basin because many croplands (dry land) are distributed across these regions (Karra et al., 2021; Potapov et al., 2022); this constituted the major source of NH3 emissions due to frequent N fertiliser applications (Ma et al., 2022). Besides this, N manure was another major source of NH3 emissions in China, and the percentage of N manure to NH3 emissions exceeded 50 % (Kang et al., 2016). The spatial pattern of the level was in good agreement with the NH3 concentration because was often generated from the reaction of NH3 with SO2 and NO2 (Ehrnsperger and Klemm, 2021). Apart from China, many other countries such as South Korea and Japan also showed higher ambient reactive nitrogen concentrations. As shown in Fig. 3, the higher reactive N concentrations occurred more on the western coasts of South Korea than on the eastern coasts. The higher reactive N concentrations in Japan were mainly found in the urban areas around Tokyo, which might be linked to the dense anthropogenic emissions in this region (Li et al., 2024). In Southeast Asia, Indonesia ( (NO3–N), HNO3, NH3, and (NH4–N): 0.18, 0.47, 5.72, and 0.44 µg N m−3) suffered from the most serious reactive N pollution compared with other surrounding countries.
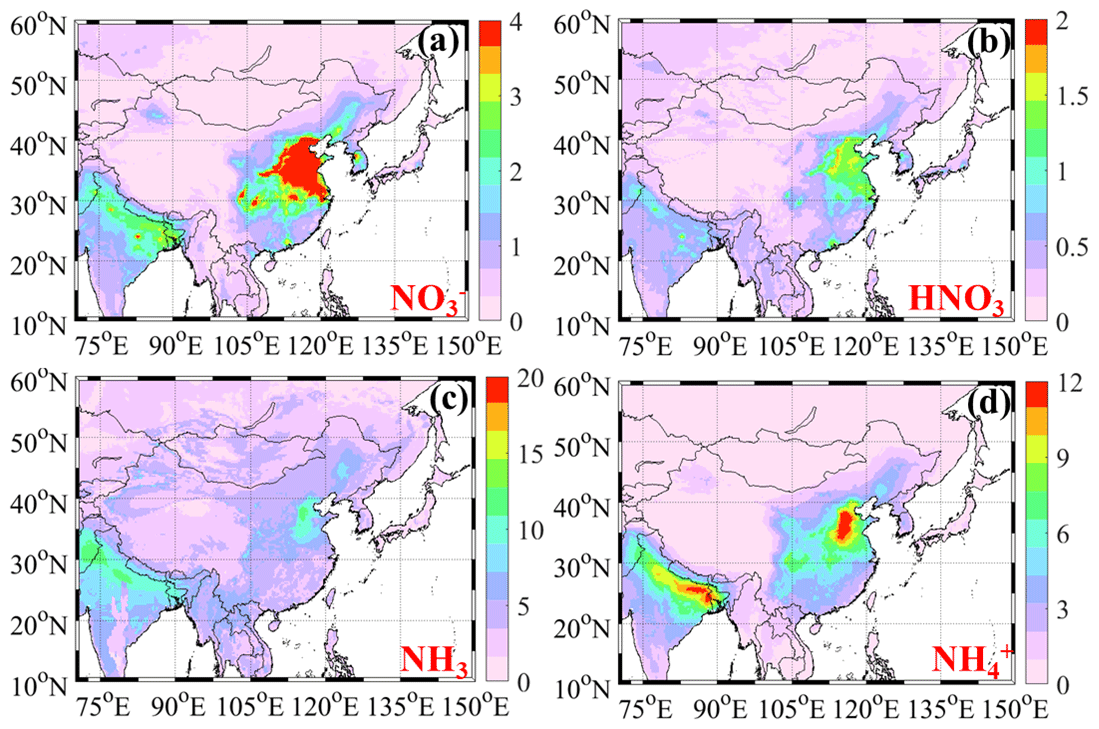
Figure 3The spatiotemporal variations in (NO3–N), HNO3, NH3, and (NH4–N) concentrations in East Asia (a–d) (unit: µg N m−3).
In Europe, the ambient (NO3–N), HNO3, NH3, and (NH4–N) concentrations ranged from 0.13 to 2.84, 0.06 to 0.92, 0.35 to 7.81, and 0.22 to 3.77 µg N m−3, respectively. The annual mean (NO3–N), HNO3, NH3, and (NH4–N) levels reached 0.57 ± 0.28, 0.25 ± 0.11, 1.58 ± 0.68, and 0.89 ± 0.42 µg N m−3, respectively (Fig. 4). High concentrations of reactive nitrogen components were found in the northern part of Italy, the central and southern parts of Germany, northern France, Poland, and the western part of Russia, which was in good agreement with the spatial pattern of NOx and NH3 emissions (Luo et al., 2022; Qu et al., 2020). The Emissions Database for Global Atmospheric Research (EDGAR) suggested that N fertilisation and N manure accounted for 43 % and 53 % of the total NH3 emissions in western Europe (Liu et al., 2019), respectively. Furthermore, Liu et al. (2019) confirmed that a good relationship between ambient NH3 levels and N fertilisation plus N manure (R=0.62) was observed in Europe. Cooper et al. (2017) employed the inversion model to estimate NOx emission in Europe and also found that high NOx emission was also mainly distributed in northern France, Germany, the northern part of Italy, and Russia, which partly explained the higher concentrations of reactive nitrogen components in these regions.
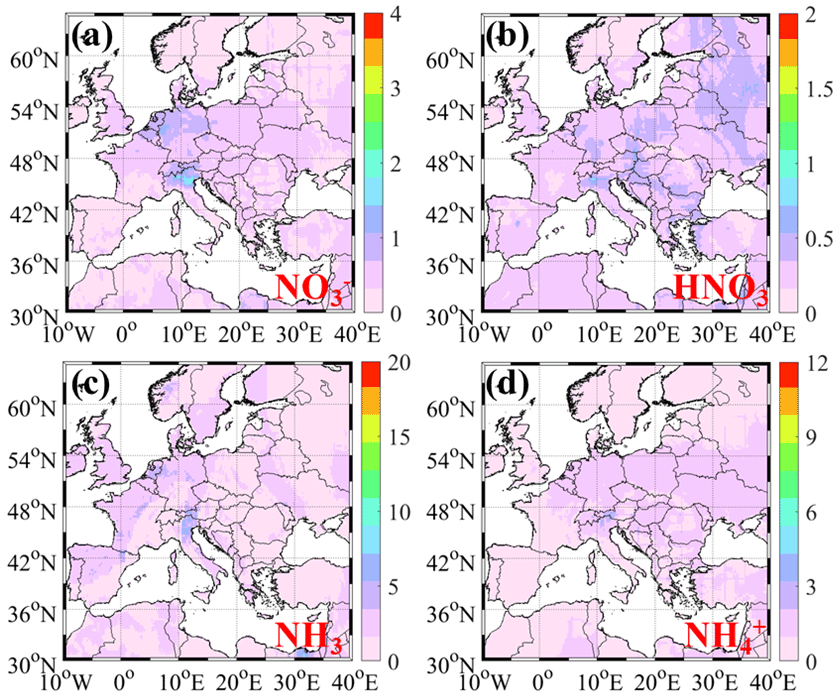
Figure 4The spatiotemporal variations in (NO3–N), HNO3, NH3, and (NH4–N) concentrations in Europe (a–d) (unit: µg N m−3).
In the United States, the ambient (NO3–N), HNO3, NH3, and (NH4–N) concentrations reached 0.28 ± 0.12, 0.19 ± 0.08, 2.12 ± 0.66, and 0.49±0.25 µg N m−3, with ranges of 0.03–2.35, 0.03–1.31, 0.26–9.96, and 0.10–6.09 µg N m−3 (Fig. 5), respectively. The hotspots of (NO3–N), HNO3, and (NH4–N) levels were concentrated in the eastern part of the United States, while the higher NH3 concentration were concentrated in the Central Great Plains and in some regions of California, such as the San Joaquin Valley (6.15 µg N m−3). Both bottom-up and top-down NOx and NH3 emissions suggested that the spatial distributions of reactive nitrogen components were strongly dependent on the precursor emissions (McDuffie et al., 2020; Qu et al., 2020).
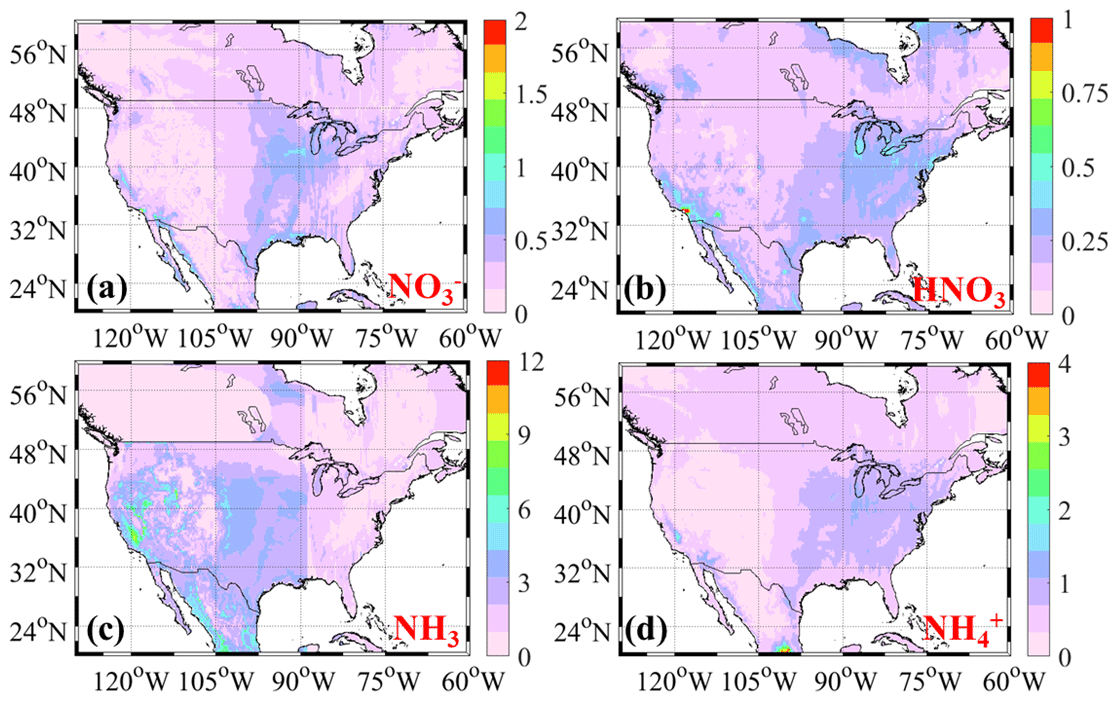
Figure 5The spatiotemporal variations in (NO3–N), HNO3, NH3, and (NH4–N) concentrations in North America (a–d) (unit: µg N m−3).
Besides this, some other regions such as India (1.4, 0.5, 6.6, and 4.4 µg N m−3), especially the northern part of India (3.1, 0.8, 12.6, and 8.4 µg N m−3), also experienced severe reactive N pollution in the atmosphere. Meanwhile, some countries in South America, such Brazil and Argentina, and in Africa, such as on the West African coast (Nigeria, Côte d'Ivoire, Ghana, Togo, and Benin) (HNO3 and NH3: 0.3 and 5.0 µg N m−3) and the Democratic Republic of Congo (0.4 and 1.6 µg N m−3), also suffered from serious HNO3 (Brazil and Argentina: 0.3 and 0.2 µg N m−3) and NH3 (3.6 and 2.8 µg N m−3) pollution. The higher ambient NH3 concentration found in the northern part of India might be due to two major reasons. First of all, the intensive agricultural activities and high air temperature might be responsible for the higher NH3 level (Cui, 2023; Wang et al., 2020). Moreover, the relatively low sulfur dioxide (SO2) and nitrogen oxide (NOx) emissions coupled with high air temperatures restricted the gas-to-particle conversion of NH3 (Wang et al., 2020). The severe HNO3 and NH3 pollution in Brazil and Argentina and on the West African coast might also be linked with the dense agricultural activities (Huneeus et al., 2017).
3.3 The seasonal variations in reactive nitrogen components
The ambient (NO3–N), HNO3, NH3, and (NH4–N) concentrations exhibited significant seasonal variations (Figs. S4–S8). , HNO3, and displayed the highest and lowest values in winter (December–February) and summer (June–August), respectively. On the one hand, the anthropogenic NOx emission for domestic heating might be higher in winter compared with other seasons (Lin et al., 2011). On the other hand, the stagnant meteorological conditions limited the pollutant diffusion (Li et al., 2019b; Y. Liu et al., 2020). Meanwhile, the higher relative humidity in winter facilitated the formation of NH4NO3 (Huang et al., 2016; Xu et al., 2012). However, both ambient and concentrations showed lower concentrations in summer, which might be attributable to the decomposition of NH4NO3 under the condition of high air temperatures. In contrast to the secondary inorganic nitrogen, the ambient NH3 level showed the highest concentration in summer (1.71 ± 0.45 µg N m−3). China, Europe, and the United States suffered from similar NH3 peaks in summer (4.20 ± 1.85, 1.77 ± 0.65, and 2.21 ± 1.04 µg N m−3). There are two reasons accounting for this fact. Firstly, mineral N fertiliser or manure application was mainly performed in spring and early summer (Paulot et al., 2014). Many field observations have obtained similar NH3 peaks in summer (He et al., 2021; Pan et al., 2018). Moreover, summer often showed the higher air temperature, which promotes the volatilisation of ammonium and limits the gas-to-particle transformation of gaseous NH3 (Liu et al., 2019).
3.4 The historical trends of reactive nitrogen components during 2000–2019
The long-term trends of ambient (NO3-N ), HNO3, NH3, and (NH4–N) concentrations are shown in Figs. 6 and S9–S12. The concentration in China displayed a rapid increase (9.7 % yr−1) during 2000–2007, and then it maintained a moderate increase (4.2 % yr−1) during 2007–2013. However, the (NO3–N) concentration in China experienced a drastic decrease (−2.6 % yr−1) from 2013. The ambient HNO3 and (NH4–N) concentrations showed similar trends during this period. Due to the impact of Clean Air Action, the concentrations of gaseous precursors (e.g. SO2 and NOx), which could be transformed into nitrate and ammonium via heterogeneous reactions, suffered from substantial decreases (Huang et al., 2019). However, the decreasing rates of were still much lower than those of gaseous precursors (Li et al., 2023). On the one hand, this might be associated with the increased O3 level and the enhanced atmospheric oxidation capacity (AOC), which led to an increase in the photochemical reaction rate of the secondary components (Wang et al., 2019). On the other hand, strong SO2 emission controls under the Clean Air Action framework allowed more gaseous NH3 to form nitrate. The ambient NH3 level remained relatively stable status during 2000–2013, while it experienced rapid increases after 2013. The result was in good agreement with Liu et al. (2019). In fact, the ambient NH3 level in the North China Plain still experienced dramatic increases (> 0.2 ) during 2000–2013 because of enhanced agricultural activities. Zhang et al. (2017) have demonstrated that the livestock manure and fertiliser application generally accounted for, respectively, 43 % and 36 % of the agricultural NH3 emission. Since 2013, the NH3 concentration over the entirety of China suffered from a rapid increase, which might be associated with the drastic decrease in sulfate. It is well known that NH3 could react with HNO3 and gaseous H2SO4 to generate ammonia sulfate and ammonia nitrate (Wang et al., 2022, 2019). Substantial decreases in acidic gases (e.g. SO2) lead to the reduction of NH3 conversion to ammonia salts in the atmosphere (Chen et al., 2019), which results in excess NH3 remaining in the gaseous phase. Differently from China, the reactive N concentrations in some other Asian and African countries, especially in India (, HNO3, NH3, and : 54 %, 46 %, 11 %, and 94 %), South Korea (76 %, 42 %, 40 %, and 9 %), Indonesia (21 %, 5 %, 14 %, and 41 %), and the Democratic Republic of Congo (9 %, 16 %, 145 %, 41 %) and along the West African coast (4 %, 11 %, 37 %, and 106 %), still exhibited stable increases during 2000–2019. The results indicated that no strong reactive N emission control measures were implemented in these countries, which, imperatively, should be further examined.
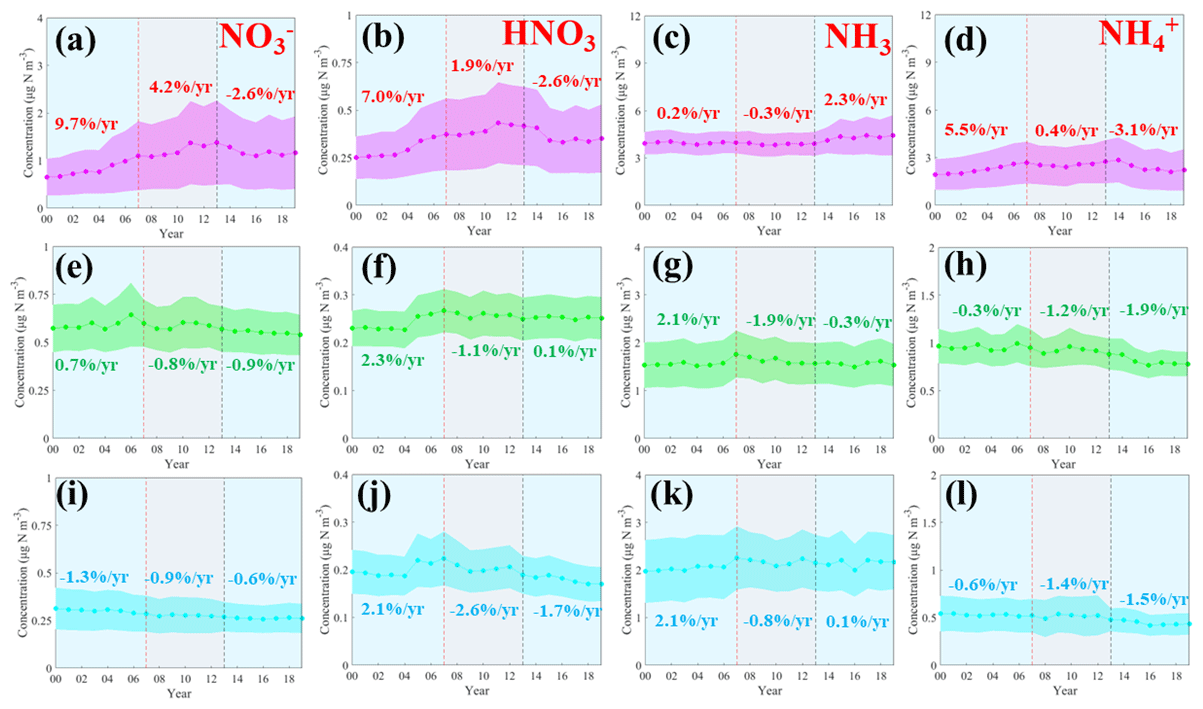
Figure 6The long-term variations in (NO3–N), HNO3, NH3, and (NH4–N) concentrations in China (pink), Europe (green), and the United States (cyan) (unit: µg N m−3).
Compared with China, the long-term trends of reactive nitrogen components in Europe and the United States were relatively stable. In Europe, the concentrations of (NO3–N), HNO3, and NH3 exhibited increases during 2000–2007 (0.7 % yr−1, 2.3 % yr−1, and 2.1 % yr−1), while they experienced slight decreases after 2007. The (NH4–N) level displayed continuous decreases from 2000. The result was closely linked with the trends of NOx and NH3 emissions derived from satellite retrieval (Cooper et al., 2017; Luo et al., 2022). In the United States, both and showed persistent decreases during 2000–2019. Zhang et al. (2018) have confirmed that NOx emission in the eastern US has experienced persistent decreases since 1990, which facilitated the decreases in and levels. However, the ambient HNO3 and NH3 concentrations displayed slight increases during 2000–2007 (2.1 % yr−1) and have remained relatively stable since 2007. Liu et al. (2019) also found similar characteristics in ambient NH3 trends in the United States. In fact, the NH3 concentrations in the Middle Plain and the eastern US still showed increases due to the lack of NH3 emission control policies, as well as the decline in acidic gases (Warner et al., 2017). The reactive N concentrations in some countries in South America such as Brazil (9 %, 0 %, 13 %, and 34 %) and Argentina (10 %, 12 %, 18 %, and 7 %) also remained relatively stable because local anthropogenic emissions of reactive N have not shown dramatic increases in the past 2 decades (McDuffie et al., 2020).
3.5 Projection of future ambient reactive nitrogen components
For the future reactive nitrogen component estimates, the ensemble model was applied to predict the reactive nitrogen component concentrations under the SSP1-2.6, SSP2-4.5, SSP3-7.0, and SSP5-8.5 scenarios. SSP1-2.6 represents the low-emission pathway. In SSP1-2.6, the projected average concentrations in most countries experienced rapid decreases from 2020 to 2100 (Fig. 7 and Table 1). The mean concentrations of in China, India, Europe, and the United States decreased from 1.16 ± 0.35, 1.23 ± 0.42, 0.41 ± 0.14, and 0.27 ± 0.09 µg N m−3 to 0.33 ± 0.10, 0.65±0.21, 0.10 ± 0.03, and 0.06 ± 0.02 µg N m−3 during 2020–2100 in the SSP1-2.6 scenario. Besides this, the concentrations in many other countries of Africa and South America, such as Brazil (−127 %) and the Democratic Republic of Congo (−162 %), also suffered from drastic decreases in this scenario. The SSP2-4.5 scenario represents the middle range of plausible future pathways (Nazarenko et al., 2022). In this scenario, the predicted average concentrations in China, India, Europe, and the United States decreased from 1.19 ± 0.40, 1.43 ± 0.35, 0.44 ± 0.13, and 0.24 ± 0.08 µg N m−3 to 0.41 ± 0.14, 0.95 ± 0.32, 0.24±0.08, and 0.05 ± 0.02 µg N m−3 during 2020–2100. SSP3-7.0 and SSP5-8.5 denote less investment in the environment and a heavily reliance on traditional energy for rapid economic development, respectively. The ambient in these scenarios generally showed higher concentrations compared with other scenarios. For instance, the concentrations in China were reduced from 1.25 ± 0.40 (SSP3-7.0) and 1.21 ± 0.39 (SSP5-8.5) to 0.75 ± 0.25 (SSP3-7.0) and 0.58 ± 0.18µg N m−3 (SSP5-8.5) during 2020–2100 (Fig. 8). The higher concentrations in SSP3-7.0 and SSP5-8.5 might be associated with the higher anthropogenic NOx emissions. Compared with SSP1-2.6 and SSP2-4.5, the concentrations in some countries under the SSP3-7.0 and SSP5-8.5 scenarios displayed slight increases from 2020 to 2040. For instance, the ambient concentrations in Indonesia increased by 12 % (SSP3-7.0) and 5 % (SSP5-8.5).

Figure 7Spatial variations in projected global ambient concentrations of reactive nitrogen components under different climate change scenarios (unit: µg N m−3). Panels (a) and (b) represent the annual mean concentrations of ambient and NO3–N under SSP1-2.6 and SSP2-4.5, respectively, during 2021–2100.
Table 1The temporal variations in ambient (NO3–N) concentrations (average concentrations, unit: µg N m−3) in selected countries during 2000–2100.
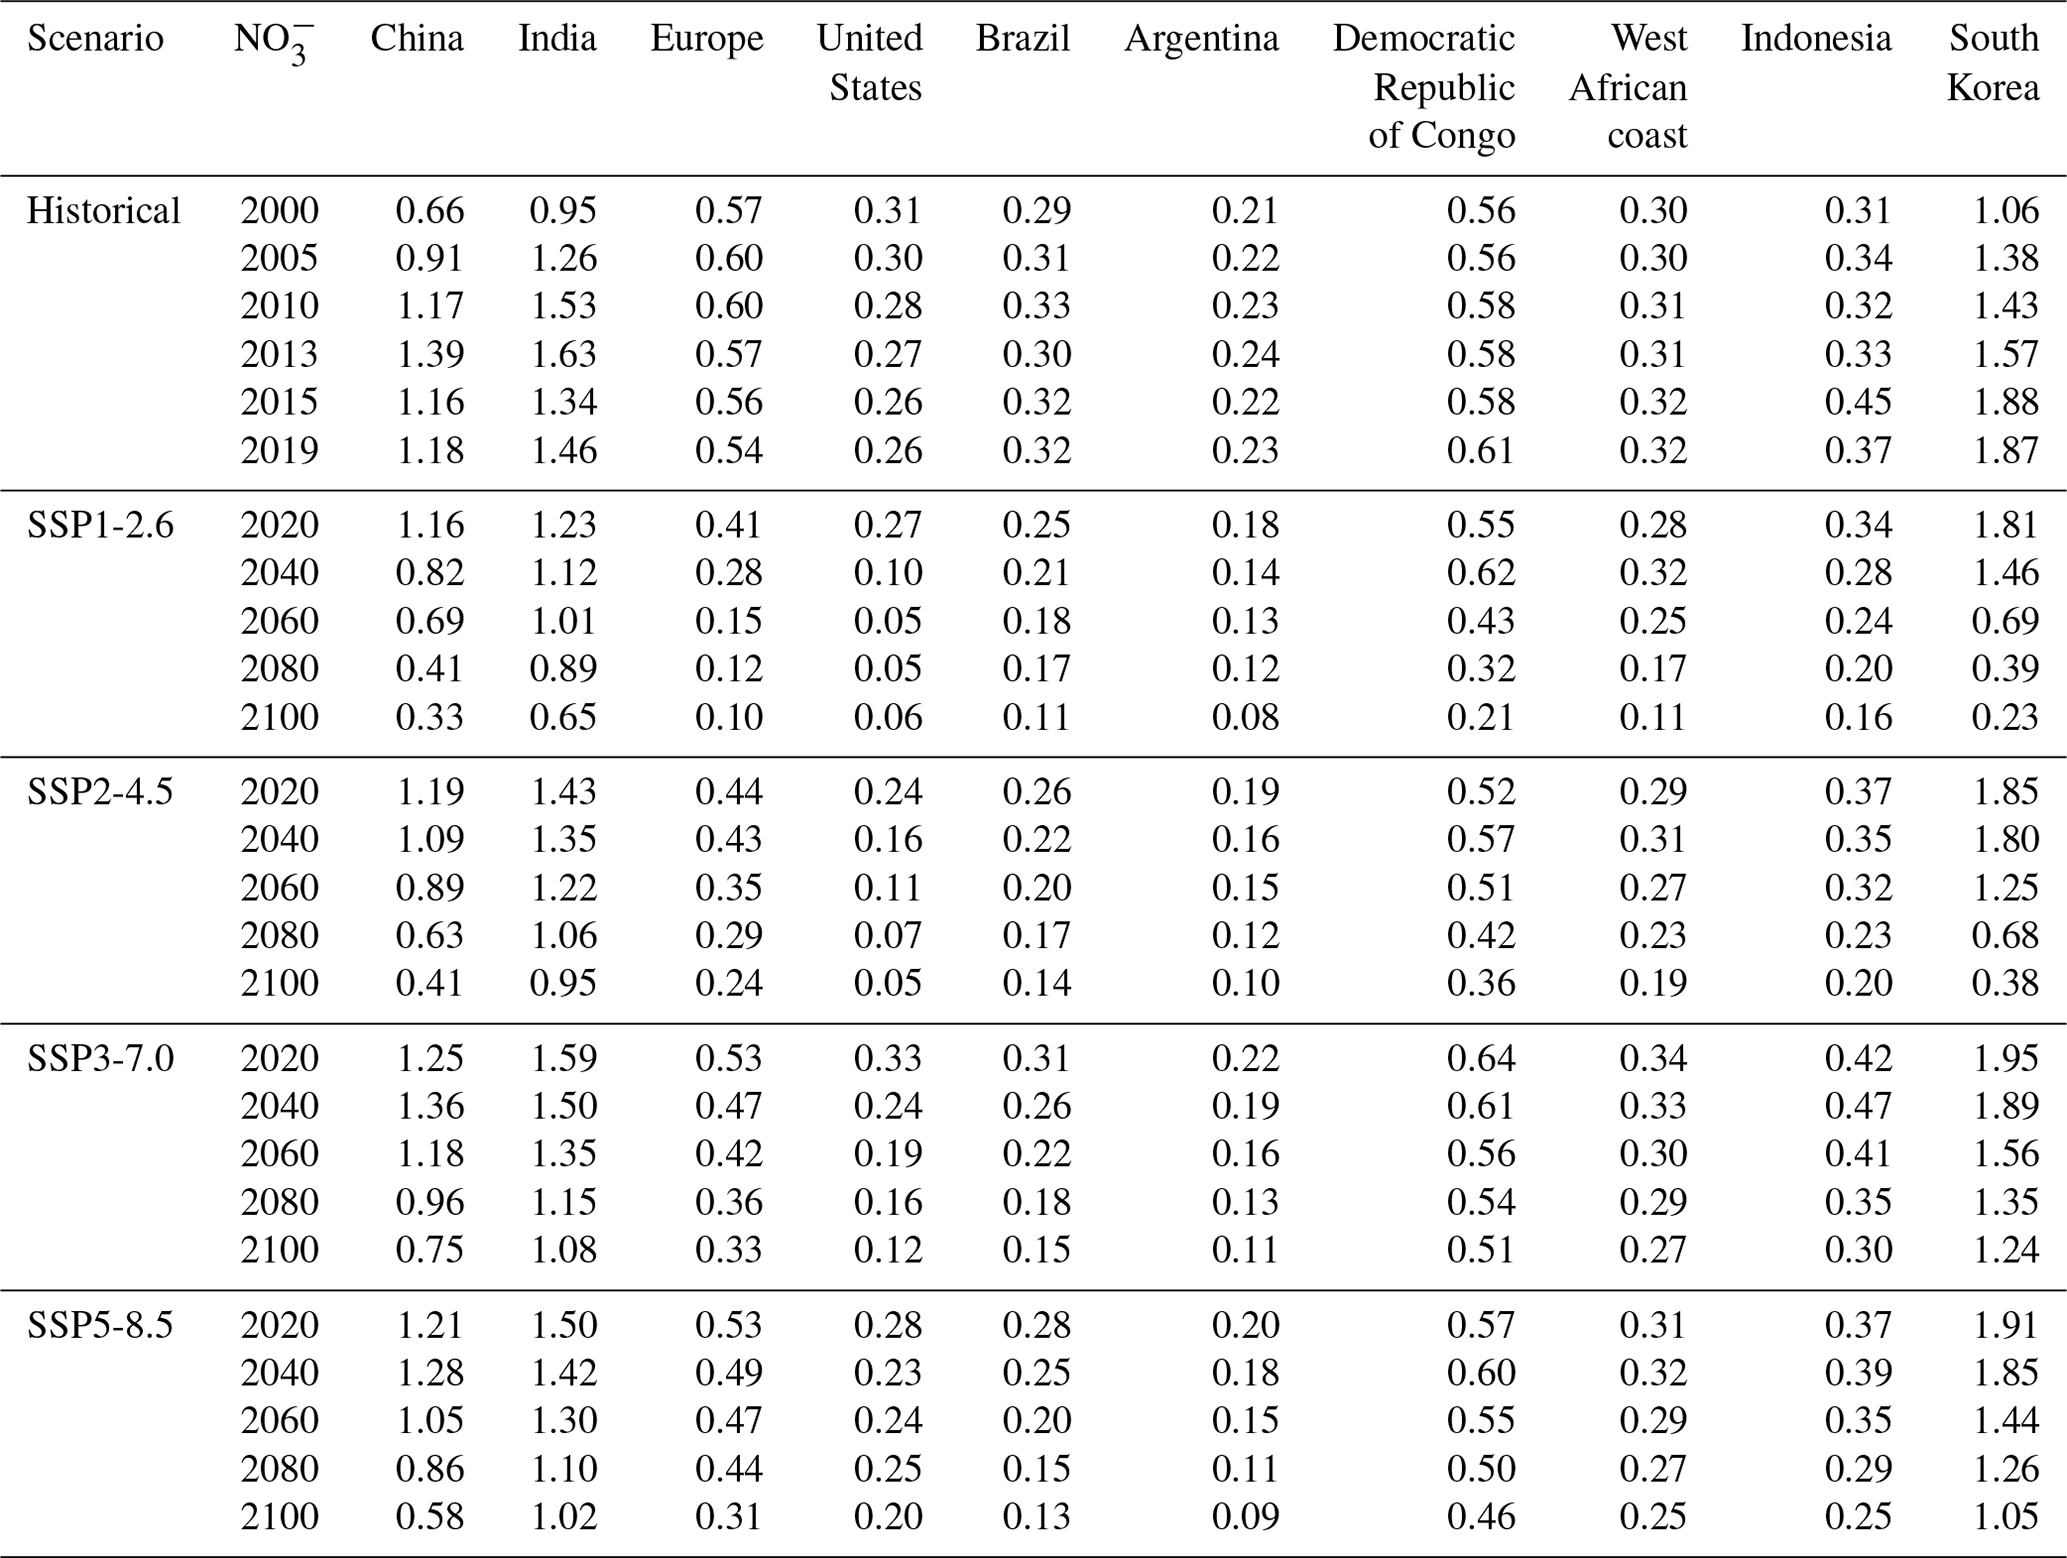
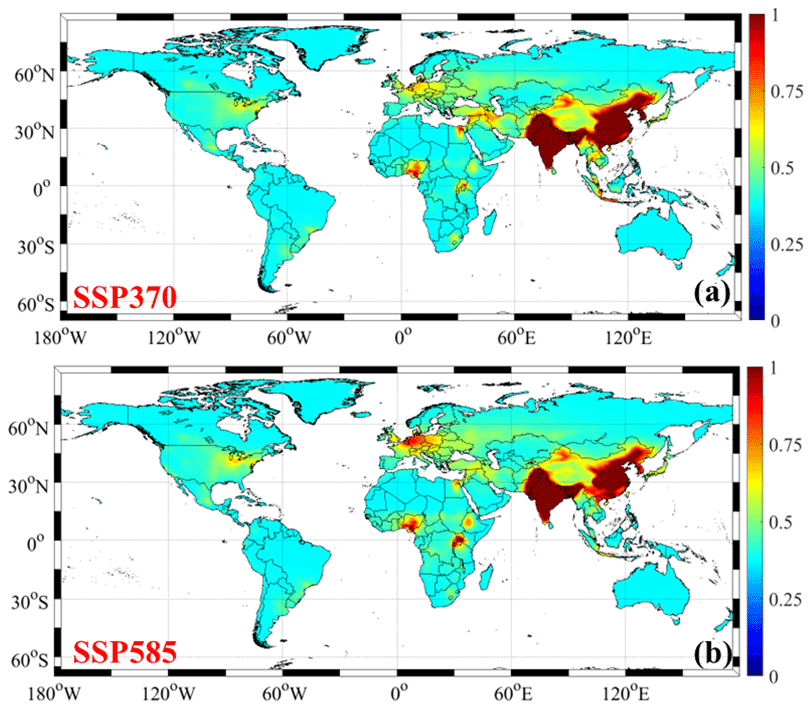
Figure 8Spatial variations in projected global ambient concentrations of reactive nitrogen components under different climate change scenarios (unit: µg N m−3). Panels (a) and (b) represent the annual mean concentrations of ambient and NO3–N under SSP3-7.0 and SSP5-8.5, respectively, during 2021–2100.
The temporal variations in ambient HNO3 were similar to those in concentrations. The mean concentrations of HNO3 in China, India, Europe, and the United States decreased from 0.25 ± 0.09, 0.50 ± 0.16, 0.18 ± 0.06, and 0.08 ± 0.03 µg N m−3 to 0.05 ± 0.01, 0.24 ± 0.08, 0.05±0.02, and 0.03 ± 0.01 µg N m−3 during 2020–2100 in the SSP1-2.6 scenario (Figs. S13, S14 and Table S3). However, the decreasing ratios of ambient HNO3 levels, especially in some developing countries such as the Democratic Republic of Congo (−13 %) and along the West African coast (−47 %), were much lower than those of ambient levels. For the SSP3-7.0 and SSP5-8.5 scenarios, the HNO3 levels in some developing countries such as the Democratic Republic of Congo (18 %), along the West African coast (16 %), and Indonesia (13 %) even experienced moderate increases. It was assumed that the government made fewer investments in environmental improvement and that the anthropogenic emissions did not show marked decreases under the conditions of the SSP3-7.0 scenario (Chen et al., 2023, 2020).
As shown in Figs. S15–S18 and Tables S4 and S5, the higher ambient NH3 and concentrations were also found in India and northern China. In SSP1-2.6, the ambient NH3 () concentrations in China, India, Europe, and the United States decreased from 3.51 ± 1.12 (2.00 ± 0.62), 6.30 ± 2.12 (4.26 ± 1.42), 1.54 ± 0.51 (0.75 ± 0.24), and 1.79 ± 0.59 µg N m−3 (0.53 ± 0.17 µg N m−3) to 1.75 ± 0.58 (0.58 ± 0.19), 2.57 ± 0.85 (1.25 ± 0.41), 1.15 ± 0.36 (0.50 ± 0.16), and 1.58 ± 0.52 µg N m−3 (0.45 ± 0.15 µg N m−3) during 2020–2100. Compared with SSP1-2.6, the ambient NH3 and concentrations in heavy-pollution scenarios (SSP3-7.0 and SSP5-8.5) did not show marked decreases from 2020 to 2100. Some developing countries such as Argentina (9 %), the Democratic Republic of Congo (25 %), and those along the West African coast (24 %) even suffered from persistent increases in ambient NH3 and levels. This might be associated with the ineffective control of NH3 emissions compared with NOx emissions.
The ground-level ambient reactive nitrogen observations, satellite retrievals, GEOS-Chem model outputs, and many other geographical covariates were integrated into the multi-stage model to reveal the global patterns of ambient reactive nitrogen components during 2000–2019. Subsequently, this high-resolution reactive nitrogen dataset covering the historical period was utilised as the constraint to calibrate the CMIP6 dataset for four scenarios during 2020–2100. The results indicated that the cross-validation (CV) R2 values of four reactive nitrogen species showed satisfactory performance (R2>0.55). At the spatial scale, four reactive nitrogen components exhibited higher concentrations in China and India. For the temporal variations, the concentrations of estimated ambient reactive nitrogen components in China experienced persistent increases during 2000–2013, while they suffered from drastic decreases from 2013, except for NH3; this might be linked with the impact of clean-air policies. However, the concentrations of these species in Europe and the United States remained relatively stable from 2000. In the future scenarios, SSP3-7.0 (traditional-energy scenario) and SSP1-2.6 (carbon neutrality scenario) displayed the highest and lowest reactive nitrogen component concentrations, respectively.
The global trends of four reactive nitrogen components during 2000–2100 emphasise the urgent need for mitigation measures (carbon neutrality pathway) to reduce precursor emissions in order to decrease the concentrations and depositions of reactive nitrogen components, especially in China and India. Furthermore, our results could give valuable insights into the impact of reactive nitrogen components on human health and ecological environments. However, this study still shows some limitations. First of all, the observation networks mainly focus on China, Europe, and the United States; thus, the simulations in many other regions might show large uncertainties. Secondly, both the GEOS-Chem outputs and CMIP6 future climate scenario data also exhibit large uncertainties, which could impact the reliability of this study. Lastly, our predictions were made on the premise that the world was steadily developing and cannot take into consideration the impacts of uncontrollable factors (e.g. COVID-19, Russia–Ukraine War).
The CMIP6 dataset used in this publication is available at https://esgf-node.ipsl.upmc.fr/search/cmip6-ipsl (ESGF, 2024).
The supplement related to this article is available online at: https://doi.org/10.5194/acp-24-7623-2024-supplement.
RL, WS, and GW designed the study. RL developed the model. YG, LZ, TX, and YS analysed the observations and model data. RL wrote the paper.
The contact author has declared that none of the authors has any competing interests.
Publisher's note: Copernicus Publications remains neutral with regard to jurisdictional claims made in the text, published maps, institutional affiliations, or any other geographical representation in this paper. While Copernicus Publications makes every effort to include appropriate place names, the final responsibility lies with the authors.
This work was supported by the National Natural Science Foundation of China (grant no. U23A2030), the Shanghai Rehabilitation Medical Association health management research project (project no. 2023JGKT32), and the Academic Mentorship for Scientific Research Cadre Project (project no. AMSCP-24-05-03).
This research has been supported by the National Natural Science Foundation of China (grant no. U23A2030).
This paper was edited by Jeffrey Geddes and reviewed by two anonymous referees.
Altieri, K. E., Fawcett, S. E., and Hastings, M. G.: Reactive nitrogen cycling in the atmosphere and ocean, Annu. Rev. Earth Pl. Sc., 49, 523–550, 2021.
Amante, C. and Eakins, B. W.: ETOPO1 arc-minute global relief model: procedures, data sources and analysis, NOAA, NOAA Technical Memorandum NESDIS NGDC-24, 2009.
Bouwman, A., Van Vuuren, D., Derwent, R., and Posch, M.: A global analysis of acidification and eutrophication of terrestrial ecosystems, Water Air Soil Poll., 141, 349–382, 2002.
Chen, H., Li, D., Gurmesa, G. A., Yu, G., Li, L., Zhang, W., Fang, H., and Mo, J.: Effects of nitrogen deposition on carbon cycle in terrestrial ecosystems of China: A meta-analysis, Environ. Pollut., 206, 352–360, 2015.
Chen, W., Lu, X., Yuan, D., Chen, Y., Li, Z., Huang, Y., Fung, T., Sun, H., and Fung, J. C.: Global PM2.5 Prediction and Associated Mortality to 2100 under Different Climate Change Scenarios, Environ. Sci. Technol., 57, 10039–10052, 2023.
Chen, X., Wang, Y.-H., Ye, C., Zhou, W., Cai, Z.-C., Yang, H., and Han, X.: Atmospheric nitrogen deposition associated with the eutrophication of Taihu Lake, J. Chem., 2018, 4017107, 2018.
Chen, Y., Shen, H., and Russell, A. G.: Current and future responses of aerosol pH and composition in the US to declining SO2 emissions and increasing NH3 emissions, Environ. Sci. Technol., 53, 9646–9655, 2019.
Chen, Y., Liu, A., and Cheng, X.: Quantifying economic impacts of climate change under nine future emission scenarios within CMIP6, Sci. Total Environ., 703, 134950, https://doi.org/10.1016/j.scitotenv.2019.134950, 2020.
Chen, Y., Zhang, L., Henze, D. K., Zhao, Y., Lu, X., Winiwarter, W., Guo, Y., Liu, X., Wen, Z., and Pan, Y.: Interannual variation of reactive nitrogen emissions and their impacts on PM2.5 air pollution in China during 2005–2015, Environ. Res. Lett., 16, 125004, https://doi.org/10.1088/1748-9326/ac3695, 2021.
Cooper, M., Martin, R. V., Padmanabhan, A., and Henze, D. K.: Comparing mass balance and adjoint methods for inverse modeling of nitrogen dioxide columns for global nitrogen oxide emissions, J. Geophys. Res.-Atmos., 122, 4718–4734, 2017.
Cooper, M. J., Martin, R. V., Hammer, M. S., Levelt, P. F., Veefkind, P., Lamsal, L. N., Krotkov, N. A., Brook, J. R., and McLinden, C. A.: Global fine-scale changes in ambient NO2 during COVID-19 lockdowns, Nature, 601, 380–387, 2022.
Cui, L.: Impact of COVID-19 restrictions on the concentration and source apportionment of atmospheric ammonia (NH3) across India, Sci. Total Environ., 881, 163443, https://doi.org/10.1016/j.scitotenv.2023.163443, 2023.
Drury, E., Jacob, D. J., Spurr, R. J. D., Wang, J., Shinozuka, Y., Anderson, B. E., Clarke, A. D., Dibb, J., McNaughton, C., and Weber, D.: Synthesis of satellite (MODIS), aircraft (ICARTT), and surface (IMPROVE, EPA-AQS, AERONET) aerosol observations over eastern North America to improve MODIS aerosol retrievals and constrain surface aerosol concentrations and sources, J. Geophys. Res.-Atmos., 115, D14204, https://doi.org/10.1029/2009JD012629, 2010.
Du, E., de Vries, W., Galloway, J. N., Hu, X., and Fang, J.: Changes in wet nitrogen deposition in the United States between 1985 and 2012, Environ. Res. Lett., 9, 095004, https://doi.org/10.1088/1748-9326/9/9/095004, 2014.
Ehrnsperger, L. and Klemm, O.: Source apportionment of urban ammonia and its contribution to secondary particle formation in a Mid-size European City, Aerosol Air Qual. Res., 21, 200404, https://doi.org/10.4209/aaqr.2020.07.0404, 2021.
ESGF: WCRP – CMIP6, World Climate Research Programme, CoG version v4.0.1, https://esgf-node.ipsl.upmc.fr/search/cmip6-ipsl (last access: 20 June 2024), 2024.
Feng, X., Lin, H., Fu, T.-M., Sulprizio, M. P., Zhuang, J., Jacob, D. J., Tian, H., Ma, Y., Zhang, L., Wang, X., Chen, Q., and Han, Z.: WRF-GC (v2.0): online two-way coupling of WRF (v3.9.1.1) and GEOS-Chem (v12.7.2) for modeling regional atmospheric chemistry–meteorology interactions, Geosci. Model Dev., 14, 3741–3768, https://doi.org/10.5194/gmd-14-3741-2021, 2021.
Geddes, J. A. and Martin, R. V.: Global deposition of total reactive nitrogen oxides from 1996 to 2014 constrained with satellite observations of NO2 columns, Atmos. Chem. Phys., 17, 10071–10091, https://doi.org/10.5194/acp-17-10071-2017, 2017.
He, Y., Pan, Y., Gu, M., Sun, Q., Zhang, Q., Zhang, R., and Wang, Y.: Changes of ammonia concentrations in wintertime on the North China Plain from 2018 to 2020, Atmos. Res., 253, 105490, https://doi.org/10.1016/j.atmosres.2021.105490, 2021.
He, Z., Liu, P., Zhao, X., He, X., Liu, J., and Mu, Y.: Responses of surface O3 and PM2.5 trends to changes of anthropogenic emissions in summer over Beijing during 2014–2019: A study based on multiple linear regression and WRF-Chem, Sci. Total Environ., 807, 150792, https://doi.org/10.1016/j.scitotenv.2021.150792, 2022.
Hoesly, R. M., Smith, S. J., Feng, L., Klimont, Z., Janssens-Maenhout, G., Pitkanen, T., Seibert, J. J., Vu, L., Andres, R. J., Bolt, R. M., Bond, T. C., Dawidowski, L., Kholod, N., Kurokawa, J.-I., Li, M., Liu, L., Lu, Z., Moura, M. C. P., O'Rourke, P. R., and Zhang, Q.: Historical (1750–2014) anthropogenic emissions of reactive gases and aerosols from the Community Emissions Data System (CEDS), Geosci. Model Dev., 11, 369–408, https://doi.org/10.5194/gmd-11-369-2018, 2018.
Huang, L., An, J., Koo, B., Yarwood, G., Yan, R., Wang, Y., Huang, C., and Li, L.: Sulfate formation during heavy winter haze events and the potential contribution from heterogeneous SO2+NO2 reactions in the Yangtze River Delta region, China, Atmos. Chem. Phys., 19, 14311–14328, https://doi.org/10.5194/acp-19-14311-2019, 2019.
Huang, T., Chen, J., Zhao, W., Cheng, J., and Cheng, S.: Seasonal variations and correlation analysis of water-soluble inorganic ions in PM2.5 in Wuhan, 2013, Atmosphere, 7, 49, https://doi.org/10.3390/atmos7040049 2016.
Huang, X., Liu, Z., Liu, J., Hu, B., Wen, T., Tang, G., Zhang, J., Wu, F., Ji, D., Wang, L., and Wang, Y.: Chemical characterization and source identification of PM2.5 at multiple sites in the Beijing–Tianjin–Hebei region, China, Atmos. Chem. Phys., 17, 12941–12962, https://doi.org/10.5194/acp-17-12941-2017, 2017.
Huneeus, N., Granier, C., Dawidowski, L., van Der Gon, H. D., Alonso, M., Castesana, P., Diaz, M., Frost, G. J., Gallardo, L., and Gomez, D.: Anthropogenic emissions in South America for air quality and climate modelling, International Emission Inventory Conference “Applying Science and Streamlining Processes to Improve Inventories”, Baltimore, August, 2017, 2017.
Jia, Y., Yu, G., Gao, Y., He, N., Wang, Q., Jiao, C., and Zuo, Y.: Global inorganic nitrogen dry deposition inferred from ground-and space-based measurements, Sci. Rep., 6, 1–11, 2016.
Kang, Y., Liu, M., Song, Y., Huang, X., Yao, H., Cai, X., Zhang, H., Kang, L., Liu, X., Yan, X., He, H., Zhang, Q., Shao, M., and Zhu, T.: High-resolution ammonia emissions inventories in China from 1980 to 2012, Atmos. Chem. Phys., 16, 2043–2058, https://doi.org/10.5194/acp-16-2043-2016, 2016.
Karra, K., Kontgis, C., Statman-Weil, Z., Mazzariello, J. C., Mathis, M., and Brumby, S. P.: Global land use/land cover with Sentinel 2 and deep learning, 2021 IEEE International Geoscience and Remote Sensing Symposium IGARSS, IEEE, 4704–4707, Washington, 11–16 July 2021, https://doi.org/10.1109/IGARSS47720.2021.9553499, 2021.
Kim, H. C., Lee, P., Judd, L., Pan, L., and Lefer, B.: OMI NO2 column densities over North American urban cities: the effect of satellite footprint resolution, Geosci. Model Dev., 9, 1111–1123, https://doi.org/10.5194/gmd-9-1111-2016, 2016.
Li, H., Zhang, Q., Zhang, Q., Chen, C., Wang, L., Wei, Z., Zhou, S., Parworth, C., Zheng, B., Canonaco, F., Prévôt, A. S. H., Chen, P., Zhang, H., Wallington, T. J., and He, K.: Wintertime aerosol chemistry and haze evolution in an extremely polluted city of the North China Plain: significant contribution from coal and biomass combustion, Atmos. Chem. Phys., 17, 4751–4768, https://doi.org/10.5194/acp-17-4751-2017, 2017.
Li, H., Yang, Y., Wang, H., Wang, P., Yue, X., and Liao, H.: Projected aerosol changes driven by emissions and climate change using a machine learning method, Environ. Sci. Technol., 56, 3884–3893, 2022.
Li, M., Kurokawa, J., Zhang, Q., Woo, J.-H., Morikawa, T., Chatani, S., Lu, Z., Song, Y., Geng, G., Hu, H., Kim, J., Cooper, O. R., and McDonald, B. C.: MIXv2: a long-term mosaic emission inventory for Asia (2010–2017), Atmos. Chem. Phys., 24, 3925–3952, https://doi.org/10.5194/acp-24-3925-2024, 2024.
Li, R., Cui, L., Zhao, Y., Zhang, Z., Sun, T., Li, J., Zhou, W., Meng, Y., Huang, K., and Fu, H.: Wet deposition of inorganic ions in 320 cities across China: spatio-temporal variation, source apportionment, and dominant factors, Atmos. Chem. Phys., 19, 11043–11070, https://doi.org/10.5194/acp-19-11043-2019, 2019a.
Li, R., Wang, Z., Cui, L., Fu, H., Zhang, L., Kong, L., Chen, W., and Chen, J.: Air pollution characteristics in China during 2015–2016: Spatiotemporal variations and key meteorological factors, Sci. Total Environ., 648, 902–915, 2019b.
Li, R., Cui, L., Fu, H., Zhao, Y., Zhou, W., and Chen, J.: Satellite-based estimates of wet ammonium (NH4-N) deposition fluxes across China during 2011–2016 using a space–time ensemble model, Environ. Sci. Technol., 54, 13419–13428, 2020.
Li, R., Gao, Y., Xu, J., Cui, L., and Wang, G.: Impact of Clean Air Policy on Criteria Air Pollutants and Health Risks Across China During 2013–2021, J. Geophys. Res.-Atmos., 128, e2023JD038939, https://doi.org/10.1029/2023JD038939, 2023.
Li, Y., Schichtel, B. A., Walker, J. T., Schwede, D. B., Chen, X., Lehmann, C. M., Puchalski, M. A., Gay, D. A., and Collett Jr., J. L.: Increasing importance of deposition of reduced nitrogen in the United States, P. Natl. Acad. Sci. USA, 113, 5874–5879, 2016.
Lin, J. T. and McElroy, M. B.: Impacts of boundary layer mixing on pollutant vertical profiles in the lower troposphere: implications to satellite remote sensing, Atmos. Environ., 44, 1726–1739, 2010.
Lin, W., Xu, X., Ge, B., and Liu, X.: Gaseous pollutants in Beijing urban area during the heating period 2007–2008: variability, sources, meteorological, and chemical impacts, Atmos. Chem. Phys., 11, 8157–8170, https://doi.org/10.5194/acp-11-8157-2011, 2011.
Liu, H., Jacob, D. J., Bey, I., and Yantosca, R. M.: Constraints from 210Pb and 7Be on wet deposition and transport in a global three-dimensional chemical tracer model driven by assimilated meteorological fields, J. Geophys. Res.-Atmos., 106, 12109–12128, 2001.
Liu, H., Gong, P., Wang, J., Clinton, N., Bai, Y., and Liang, S.: Annual dynamics of global land cover and its long-term changes from 1982 to 2015, Earth Syst. Sci. Data, 12, 1217–1243, https://doi.org/10.5194/essd-12-1217-2020, 2020.
Liu, L., Zhang, X., Wong, A. Y. H., Xu, W., Liu, X., Li, Y., Mi, H., Lu, X., Zhao, L., Wang, Z., Wu, X., and Wei, J.: Estimating global surface ammonia concentrations inferred from satellite retrievals, Atmos. Chem. Phys., 19, 12051–12066, https://doi.org/10.5194/acp-19-12051-2019, 2019.
Liu, L., Zhang, X., Xu, W., Liu, X., Lu, X., Wei, J., Li, Y., Yang, Y., Wang, Z., and Wong, A. Y. H.: Reviewing global estimates of surface reactive nitrogen concentration and deposition using satellite retrievals, Atmos. Chem. Phys., 20, 8641–8658, https://doi.org/10.5194/acp-20-8641-2020, 2020.
Liu, L., Yang, Y., Xi, R., Zhang, X., Xu, W., Liu, X., Li, Y., Liu, P., and Wang, Z.: Global Wet-Reduced Nitrogen Deposition Derived From Combining Satellite Measurements With Output From a Chemistry Transport Model, J. Geophys. Res.-Atmos., 126, e2020JD033977, https://doi.org/10.1029/2020JD033977, 2021.
Liu, Y., Zhou, Y., and Lu, J.: Exploring the relationship between air pollution and meteorological conditions in China under environmental governance, Sci. Rep.-UK, 10, 14518, https://doi.org/10.1038/s41598-020-71338-7, 2020.
Luo, Z., Zhang, Y., Chen, W., Van Damme, M., Coheur, P.-F., and Clarisse, L.: Estimating global ammonia (NH3) emissions based on IASI observations from 2008 to 2018, Atmos. Chem. Phys., 22, 10375–10388, https://doi.org/10.5194/acp-22-10375-2022, 2022.
Ma, R., Yu, K., Xiao, S., Liu, S., Ciais, P., and Zou, J.: Data-driven estimates of fertilizer-induced soil NH3, NO and N2O emissions from croplands in China and their climate change impacts, Global Change Biol., 28, 1008–1022, 2022.
McDuffie, E. E., Smith, S. J., O'Rourke, P., Tibrewal, K., Venkataraman, C., Marais, E. A., Zheng, B., Crippa, M., Brauer, M., and Martin, R. V.: A global anthropogenic emission inventory of atmospheric pollutants from sector- and fuel-specific sources (1970–2017): an application of the Community Emissions Data System (CEDS), Earth Syst. Sci. Data, 12, 3413–3442, https://doi.org/10.5194/essd-12-3413-2020, 2020.
Nazarenko, L. S., Tausnev, N., Russell, G. L., Rind, D., Miller, R. L., Schmidt, G. A., Bauer, S. E., Kelley, M., Ruedy, R., and Ackerman, A. S.: Future climate change under SSP emission scenarios with GISS-E2.1, J. Adv. Model. Earth Sy., 14, e2021MS002871, https://doi.org/10.1029/2021MS002871, 2022.
Pan, Y., Tian, S., Zhao, Y., Zhang, L., Zhu, X., Gao, J., Huang, W., Zhou, Y., Song, Y., and Zhang, Q.: Identifying ammonia hotspots in China using a national observation network, Environ. Sci. Technol., 52, 3926–3934, 2018.
Paulot, F., Jacob, D. J., Pinder, R., Bash, J., Travis, K., and Henze, D.: Ammonia emissions in the United States, European Union, and China derived by high-resolution inversion of ammonium wet deposition data: Interpretation with a new agricultural emissions inventory (MASAGE_NH3), J. Geophys. Res.-Atmos., 119, 4343–4364, 2014.
Potapov, P., Hansen, M. C., Pickens, A., Hernandez-Serna, A., Tyukavina, A., Turubanova, S., Zalles, V., Li, X., Khan, A., and Stolle, F.: The global 2000–2020 land cover and land use change dataset derived from the Landsat archive: first results, Frontiers in Remote Sensing, 3, 856903, https://doi.org/10.3389/frsen.2022.856903, 2022.
Qi, L., Zheng, H., Ding, D., and Wang, S.: Responses of sulfate and nitrate to anthropogenic emission changes in eastern China-in perspective of long-term variations, Sci. Total Environ., 855, 158875, https://doi.org/10.1016/j.scitotenv.2022.158875, 2023.
Qu, Z., Henze, D. K., Cooper, O. R., and Neu, J. L.: Impacts of global NOx inversions on NO2 and ozone simulations, Atmos. Chem. Phys., 20, 13109–13130, https://doi.org/10.5194/acp-20-13109-2020, 2020.
Shi, X., Zhao, C., Jiang, J. H., Wang, C., Yang, X., and Yung, Y. L.: Spatial representativeness of PM2.5 concentrations obtained using observations from network stations, J. Geophys. Res., 123, 3145–3158, 2018.
Van Damme, M., Whitburn, S., Clarisse, L., Clerbaux, C., Hurtmans, D., and Coheur, P.-F.: Version 2 of the IASI NH3 neural network retrieval algorithm: near-real-time and reanalysed datasets, Atmos. Meas. Tech., 10, 4905–4914, https://doi.org/10.5194/amt-10-4905-2017, 2017.
Von Schneidemesser, E., Monks, P. S., Allan, J. D., Bruhwiler, L., Forster, P., Fowler, D., Lauer, A., Morgan, W. T., Paasonen, P., and Righi, M.: Chemistry and the linkages between air quality and climate change, Chem. Rev., 115, 3856–3897, 2015.
Wang, M., Xiao, M., Bertozzi, B., Marie, G., Rörup, B., Schulze, B., Bardakov, R., He, X.-C., Shen, J., and Scholz, W.: Synergistic HNO3-H2SO4-NH3 upper tropospheric particle formation, Nature, 605, 483–489, 2022.
Wang, T., Song, Y., Xu, Z., Liu, M., Xu, T., Liao, W., Yin, L., Cai, X., Kang, L., Zhang, H., and Zhu, T.: Why is the Indo-Gangetic Plain the region with the largest NH3 column in the globe during pre-monsoon and monsoon seasons?, Atmos. Chem. Phys., 20, 8727–8736, https://doi.org/10.5194/acp-20-8727-2020, 2020.
Wang, Y., Li, W., Gao, W., Liu, Z., Tian, S., Shen, R., Ji, D., Wang, S., Wang, L., and Tang, G.: Trends in particulate matter and its chemical compositions in China from 2013–2017, Sci. China Earth Sci., 62, 1857–1871, 2019.
Warner, J., Dickerson, R., Wei, Z., Strow, L. L., Wang, Y., and Liang, Q.: Increased atmospheric ammonia over the world's major agricultural areas detected from space, Geophys. Res. Lett., 44, 2875–2884, 2017.
Wen, L., Xue, L., Wang, X., Xu, C., Chen, T., Yang, L., Wang, T., Zhang, Q., and Wang, W.: Summertime fine particulate nitrate pollution in the North China Plain: increasing trends, formation mechanisms and implications for control policy, Atmos. Chem. Phys., 18, 11261–11275, https://doi.org/10.5194/acp-18-11261-2018, 2018.
Wesely, M.: Parameterization of surface resistances to gaseous dry deposition in regional-scale numerical models, Atmos. Environ., 41, 52–63, 2007.
Whitburn, S., Van Damme, M., Clarisse, L., Bauduin, S., Heald, C., Hadji-Lazaro, J., Hurtmans, D., Zondlo, M. A., Clerbaux, C., and Coheur, P. F.: A flexible and robust neural network IASI-NH3 retrieval algorithm, J. Geophys. Res., 121, 6581–6599, 2016a.
Whitburn, S., Van Damme, M., Clarisse, L., Turquety, S., Clerbaux, C., and Coheur, P. F.: Doubling of annual ammonia emissions from the peat fires in Indonesia during the 2015 El Niño, Geophys. Res. Lett., 43, 11007–011014, 2016b.
Xu, L., Chen, X., Chen, J., Zhang, F., He, C., Zhao, J., and Yin, L.: Seasonal variations and chemical compositions of PM2.5 aerosol in the urban area of Fuzhou, China, Atmos. Res., 104, 264–272, 2012.
Xu, W., Zhang, L., and Liu, X.: A database of atmospheric nitrogen concentration and deposition from the nationwide monitoring network in China, Sci. Data, 6, 1–6, 2019.
Zaehle, S.: Terrestrial nitrogen-carbon cycle interactions at the global scale, Philos. T. Roy. Soc. B, 368, 20130125, https://doi.org/10.1098/rstb.2013.0125, 2013.
Zhang, L., Guo, X., Zhao, T., Gong, S., Xu, X., Li, Y., Luo, L., Gui, K., Wang, H., and Zheng, Y.: A modelling study of the terrain effects on haze pollution in the Sichuan Basin, Atmos. Environ., 196, 77–85, 2019.
Zhang, X., Wu, Y., Liu, X., Reis, S., and Jin, J., Dragosits, U., Van Damme, M., Clarisse, L., Whitburn, S., and Coheur, P.-F.: Ammonia emissions may be substantially underestimated in China, Environ. Sci. Technol., 51, 12089–12096, 2017.
Zhang, X., Ward, B. B., and Sigman, D. M.: Global nitrogen cycle: critical enzymes, organisms, and processes for nitrogen budgets and dynamics, Chem. Rev., 120, 5308–5351, 2020.
Zhang, Y., Mathur, R., Bash, J. O., Hogrefe, C., Xing, J., and Roselle, S. J.: Long-term trends in total inorganic nitrogen and sulfur deposition in the US from 1990 to 2010, Atmos. Chem. Phys., 18, 9091–9106, https://doi.org/10.5194/acp-18-9091-2018, 2018.