the Creative Commons Attribution 4.0 License.
the Creative Commons Attribution 4.0 License.
 | 27 Jun 2024
Global scenarios of anthropogenic mercury emissions
Peter Rafaj
Robert Sander
Fabian Wagner
Jenny Marie Jones
Anthropogenic mercury (Hg) emissions to the atmosphere are a long-lived hazard to human and environmental health. The UN Minamata Convention on Mercury is seeking to lower anthropogenic mercury emissions through a mix of policies from banning certain Hg uses to reducing unintentional Hg release from different activities. In addition to independent Hg policy, strategies to mitigate greenhouse gases, particulate matter (PM) and SO2 may also lower Hg emissions as a co-benefit. This study uses the Greenhouse Gas–Air Pollution Interactions and Synergies (GAINS) model to examine the effect of different clean air and climate policies on future global Hg emissions. The baseline scenario assumes current trends for energy use and Hg emissions as well as current legislation for clean air, mercury and climate policy. In addition, we explore the impact of the Minamata Convention, the co-benefits of climate and stringent air pollution policies, and maximum feasible reduction measures for Hg. Hg emission projections until 2050 show noticeable reductions in combustion sectors for all scenarios due to a decrease in global fossil fuel and traditional biomass use, leading to emission reductions of 33 % at baseline and up to 90 % when combining stringent climate controls and the most efficient Hg controls. Cement and non-ferrous metal emissions increase in all scenarios with current air pollution policy but could be reduced by up to 72 % and 46 %, respectively, in 2050 with stringent Hg-specific measures. Other emissions (including waste) are a significant source of uncertainty in this study, and their projections range between a 22 % increase and a 54 % decrease in 2050, depending on both climate and clean air policy. The largest absolute reduction potential for Hg abatement but also the largest uncertainties regarding absolute emissions lie in small-scale and artisanal gold production, where abatement measures could eliminate annual Hg emissions in the range of 601–1371 t (95 % confidence interval), although the uncertainties in the estimate are so high that they might eclipse reduction efforts in all other sectors. In total, 90 % of Hg emissions are covered by provisions of the Minamata Convention. Overall, the findings emphasize the necessity to implement targeted Hg control policies in addition to stringent climate, PM and SO2 policies to achieve significant reductions in Hg emissions.
- Article
(4069 KB) - Full-text XML
-
Supplement
(1732 KB) - BibTeX
- EndNote


Mercury (Hg) is one of the top 10 chemicals of major public health concern designated by the World Health Organization (WHO) (WHO, 2021). Hg has a high (redox) reactivity under ambient conditions, facilitating frequent species changes. Elemental mercury (Hg0) exhibits high volatility and vapor pressure. This is unique for a metal and leads to long-range atmospheric transport, subsequent deposition, and re-emission of the metal and its derivative compounds, as well as methylation and subsequent bioaccumulation in the aquatic food chain as methyl mercury (Selin, 2009). Mercury has been known to be highly toxic to humans for centuries, but global attention given to the health impacts, particularly to methylmercury toxicity, has been heightened since the Minamata disease tragedy in the 1950s (e.g., Selin and Selin, 2020). Increasing awareness of the long-range transport of Hg0 and the resultant cross-boundary nature of the Hg problem led to its explicit inclusion in the Aarhus Protocol on Heavy Metals in 1998, as part of the Convention on Long-range Transboundary Air Pollution (CLRTAP) (Selin and Selin, 2006; CLRTAP, 1979; Aarhus Protocol, 1998). In 2015, cumulative anthropogenic emissions had increased the Hg content in the atmosphere to 450 % above natural levels (AMAP/UN Environment, 2019). The time taken for mercury to return to a permanent sink such as deep ocean sediments has been estimated as up to 3000 years (Selin, 2009), demonstrating that Hg pollution will continue to pose a serious environmental threat for years to come but also highlighting the fact that today's action will have a long-lasting effect in terms of reducing levels of environmental Hg pollution (Angot et al., 2018). From a health perspective, it has been estimated that the accumulated health effects of Hg pollution will cost USD 19 trillion globally between 2010 and 2050 (USD in 2020; Zhang et al., 2021), further demonstrating the importance of fast action.
To break the cycle of Hg emission to air, release into the environment, and subsequent re-emission and build-up of Hg pollution in the environment, the Minamata Convention on Mercury (MCM) was adopted in 2013. It entered into force in 2017 (AMAP/UN Environment, 2013), and there were 128 signatories as of May 2024. The first international health and environment treaty on hazardous substances in almost a decade, it recognizes that Hg emissions must be tackled urgently at the global level. The MCM aims to “protect the human health and the environment from anthropogenic emissions and releases of mercury and mercury compounds” by targeting those emissions to air and releases to the environment at different entry points, such as trade, use in production, use in products, emission sources and wastes. Mercury pollution is on one hand addressed by technical solutions such as limiting emissions and releases by following best available technology (BAT) and best environmental practice (BEP) recommendations for Hg handling, industrial emissions or waste storage. On the other hand, there are provisions for regulatory action in other domains, such as banning primary mercury mining and severely limiting mercury trade, bans on specific products, and bans on small-scale or traditional (artisanal) gold mining practices, demonstrating a “life-cycle approach” to limiting Hg emissions (e.g., Selin, 2014; AMAP/UN Environment, 2013). Despite these efforts, global anthropogenic emissions of Hg were estimated to have risen by 20 % in 2015 compared to “pre-Minamata” levels in 2010. Small emission decreases in North America and the EU were offset by a mix of increased economic activity as well as increased production, use and disposal of mercury-containing products (AMAP/UN Environment, 2019; Pacyna et al., 2016). For a better understanding of future Hg levels in the atmosphere, scenarios of future anthropogenic Hg release are needed. Such scenarios need to consider the wide range of Hg emission sources as well as their emission intensity, abatement potential and drivers.
Where Hg is emitted in energy-intensive sectors, such as due to the combustion of fossil fuels or different industries, future emissions strongly depend on the assumptions on future energy demand and the decarbonization of those sectors. Emission trends from other sectors, such as waste generation, can be derived from macroeconomic factors and population growth. Other activities, such as artisanal and small-scale gold production, are specific to mercury pollution and not influenced by other air quality and climate policies. Emission intensity is always specific to the emission source, its geographic location and the application of control measures which lower the amount of Hg released into the atmosphere. Such measures include policies or technologies targeted directly at Hg. In addition, stringent clean air policy targeted at reducing particulate matter (PM), SO2 and NOx is well known to lower Hg emissions, as the applied pollution-control technologies interact with the mercury present in the flue gas streams and are able to retain it (e.g., Granite et al., 2000; Pavlish et al., 2003). Scenario analysis is a powerful tool for quantifying future pathways of anthropogenic mercury emission and for understanding the interdependencies of various mitigation factors.
Only a small number of studies have produced global scenarios of speciated future mercury emissions. Streets et al. (2009) created an Hg inventory spanning different combustion and industry sectors as well as artisanal and small-scale gold mining (ASGM)1. These emissions were projected to 2050 based on four climate scenarios from the IPCC's Special Report on Emission Scenarios (SRES) (Nakicenovic et al., 2000). The SRES is also used as a source of different energy scenarios for Hg projections by Lei et al. (2014). Rafaj et al. (2013) present a set of global Hg projections for one baseline and one climate scenario based on the POLES energy model and cover key Hg-specific sectors including gold and caustic soda production; Pacyna et al. (2010) projected Hg emissions up to 2020 based on different scenarios focusing on Hg-specific policies. Pacyna et al. (2016) projected Hg emissions up to 2035 based on the Global Mercury Assessment 2013 (GMA'13) inventory and own projections. They looked at a mix of scenarios including current legislation, new policies and a maximum feasible reduction (MFR) scenario with 450 ppm CO2, suggesting that emissions would remain constant at the 2010 level of 1960 t in 2035 under current legislation, decrease to 1020 t in the “new policies” scenario and decrease to a projected level of 300 t Hg emissions in 2035 in the MFR case. Additionally, several regional studies are available for China (Giang et al., 2015; Zhao et al., 2015; Ancora et al., 2016; Wu et al., 2018a, b; Mulvaney et al., 2020), India (Chakraborty et al., 2013; Giang et al., 2015) and Europe (Pacyna et al., 2006; Glodek et al., 2010, Poland; Rafaj et al., 2014). The base years for the global scenario studies lie between 2000 and 2010 and the projection years between 2020 and 2050. The most recent Global Mercury Assessment 2018 (GMA'18) was published for 2015 and includes significant data quality improvements compared to the 2010 inventory, also including quantification of more emission sources. Similarly, our outlook on energy and climate scenarios has significantly changed since the COVID-19 pandemic and recent geopolitical developments. Up-to-date scenarios – as reported in this paper – are needed to understand future mercury emissions and the effectiveness of clean air and climate policies on curbing them.
IIASA's Greenhouse Gas and Air Pollution Interactions and Synergies (GAINS) model is uniquely suited to the creation of global mercury emission scenarios (Amann et al., 2011). Originally built to inform policy questions regarding acid rain and particulate matter, its database was extended to Hg in 2013 (Rafaj et al., 2013, 2014). In GAINS, sector- and region-specific control strategies represent the pollution-control measures and policies that are in place. The timing and stringency of policy for air pollution control, strategies for reduction of greenhouse gases, the co-benefits of PM and SO2 abatement, and changes in the energy and industrial sectors are represented for each of the 182 GAINS regions. This study presents an update on the methodology of accounting for co-benefit control of Hg from PM and SO2 in the GAINS model. Furthermore, dedicated mercury-control options and their combinations were also updated in the modeling framework. We present the results of scenario analysis using three different energy and climate pathways combined with four different scenarios of mercury-control measures, including mercury-control options consistent with current legislation and the Minamata commitments as well as a maximum feasible reduction scenario. Scenarios were designed to identify the impact of climate policy, the co-benefits arising from air-pollution-control policy and the benefits from dedicated Hg measures. The scenario analyses are presented at the level of seven world regions and eight exemplary subregions.
2.1 The GAINS model
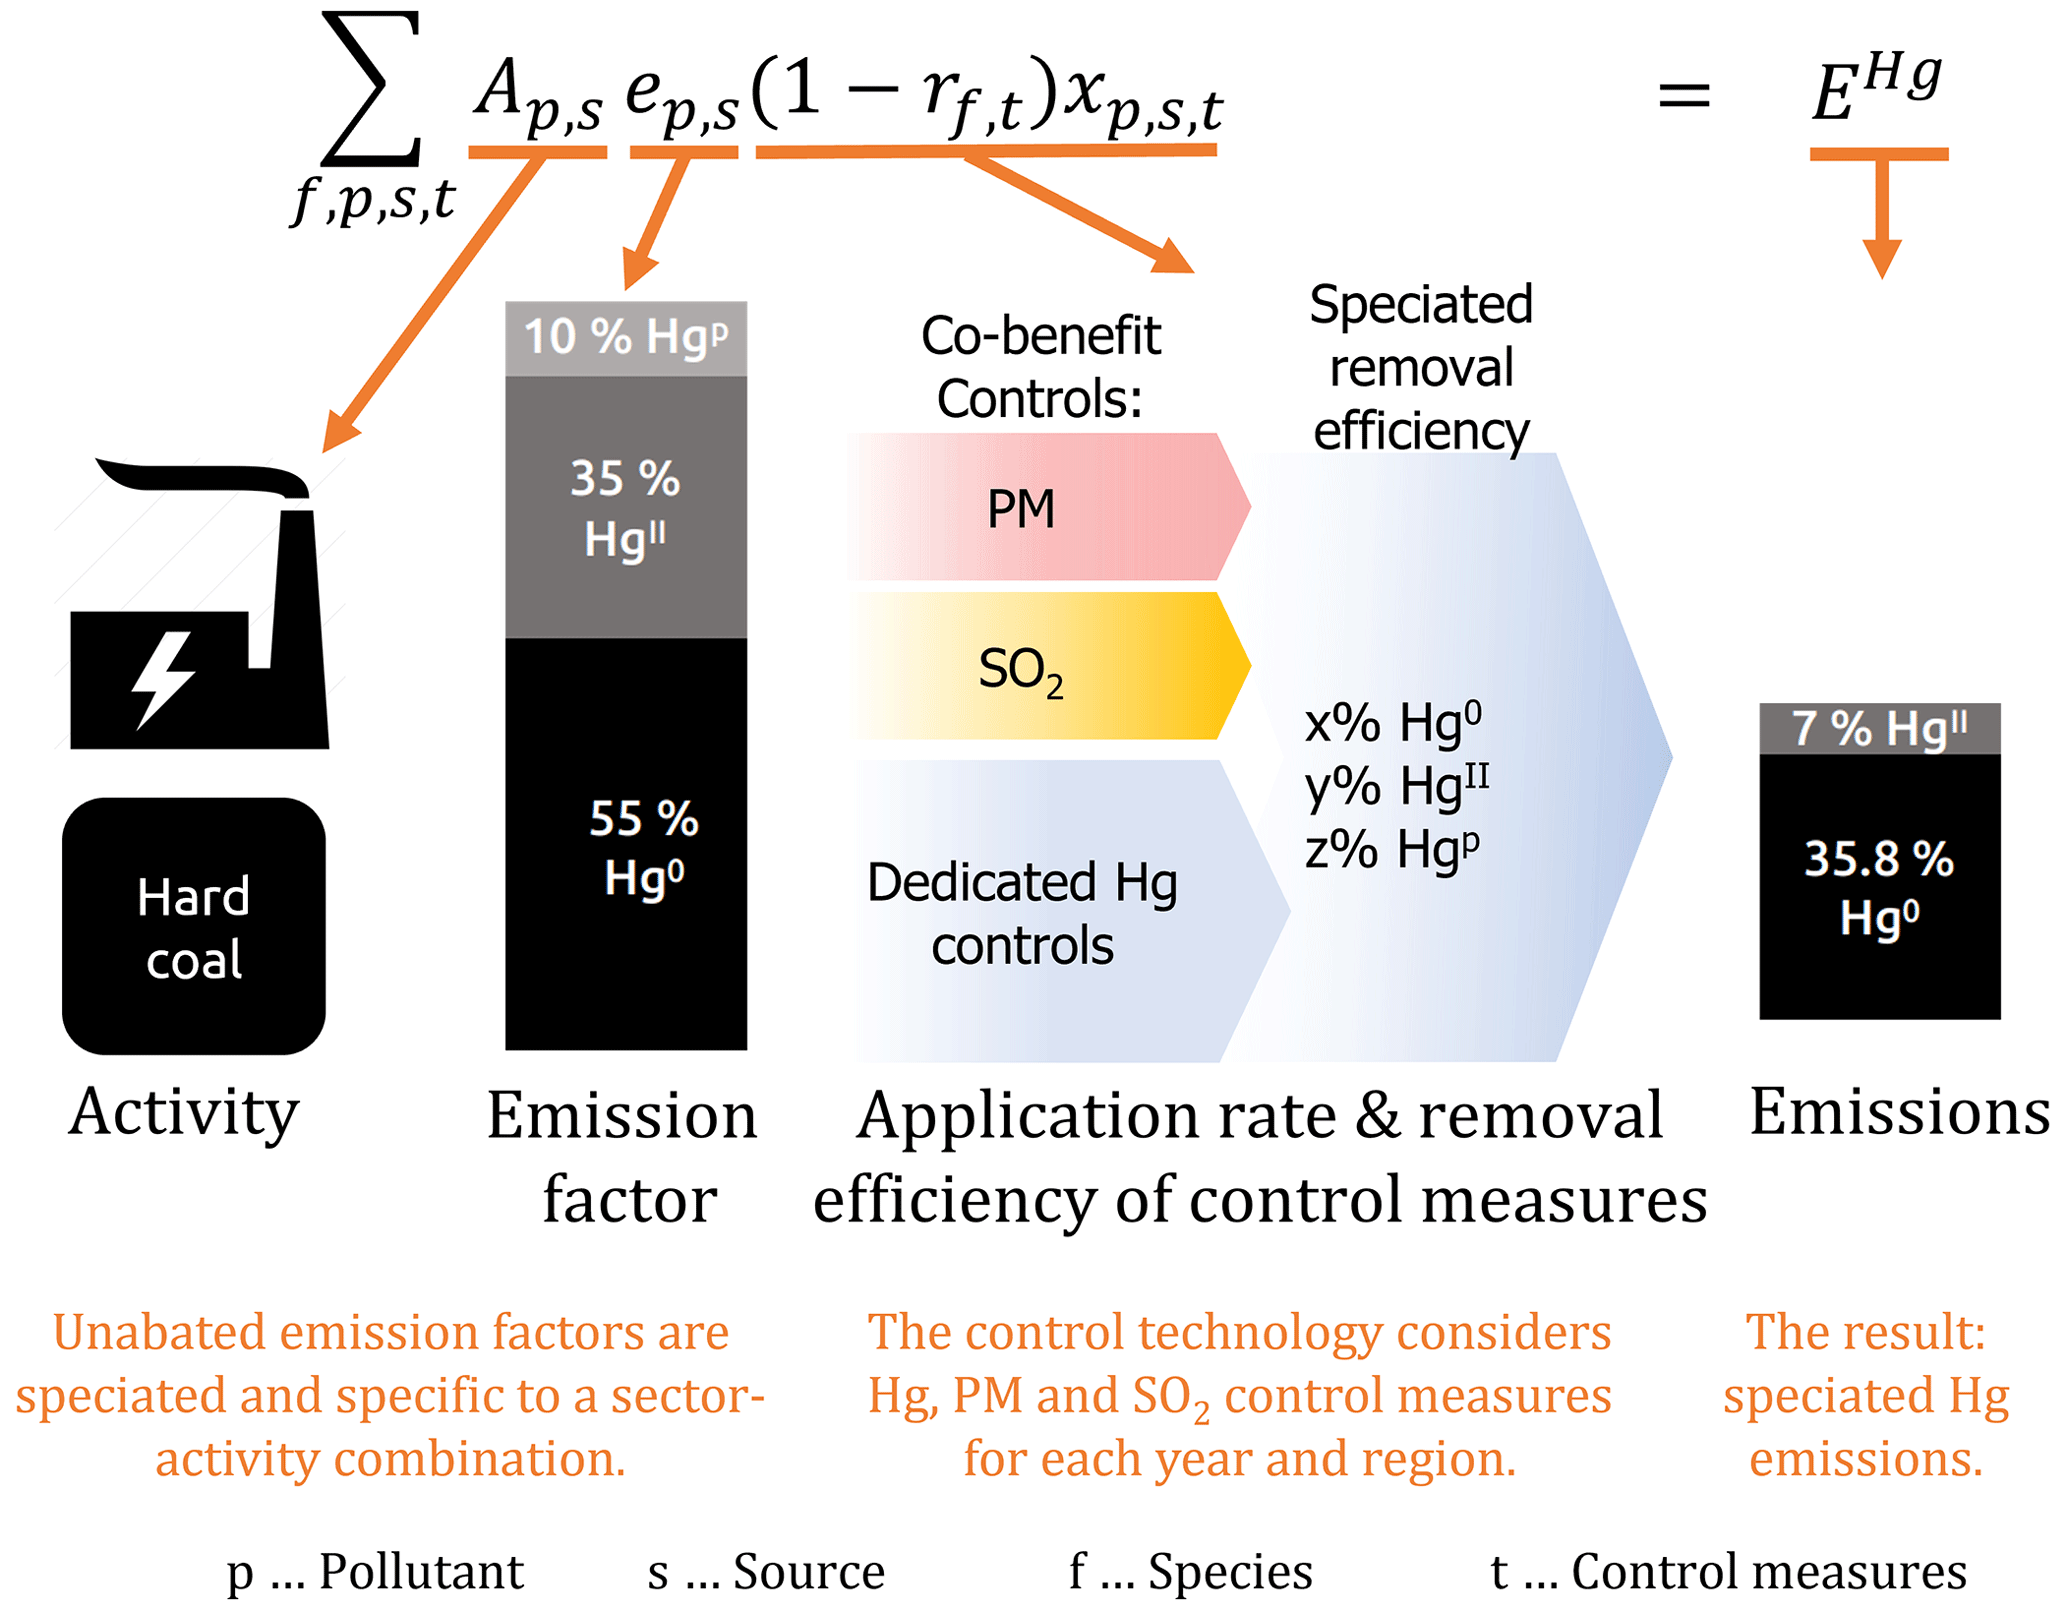
The GAINS model quantifies emissions to the atmosphere, costs, and the ecosystems and health impacts of different strategies to reduce different air pollutants and greenhouse gases (Amann et al., 2011). GAINS computes Hg emissions on a global level up to 2050 in 5-year time steps with a resolution of 182 regions. A region represents either a country, a group of neighboring countries or sub-national regions. Current and future emissions of mercury (EHg) are computed via Eq. (1) for each mercury species (f) from the activity data (A) of different combinations of pollution sources (s) and activities (p) and uncontrolled emission factors (e), which are lowered by taking into account the removal efficiencies (r) of different emission-control technologies and other measures (t) and their application rates (x) in a specific sector over time.
Table 1Ranges of unabated emission factors (UEFs) and speciation in GAINS on the global scale. UEFs vary on a regional scale and also due to different aggregates for sector–fuel combinations. Abbreviations in the second column represent the sector aggregation levels that are plotted in the figures displaying the results (Figs. 3–5 and S1 in the Supplement).
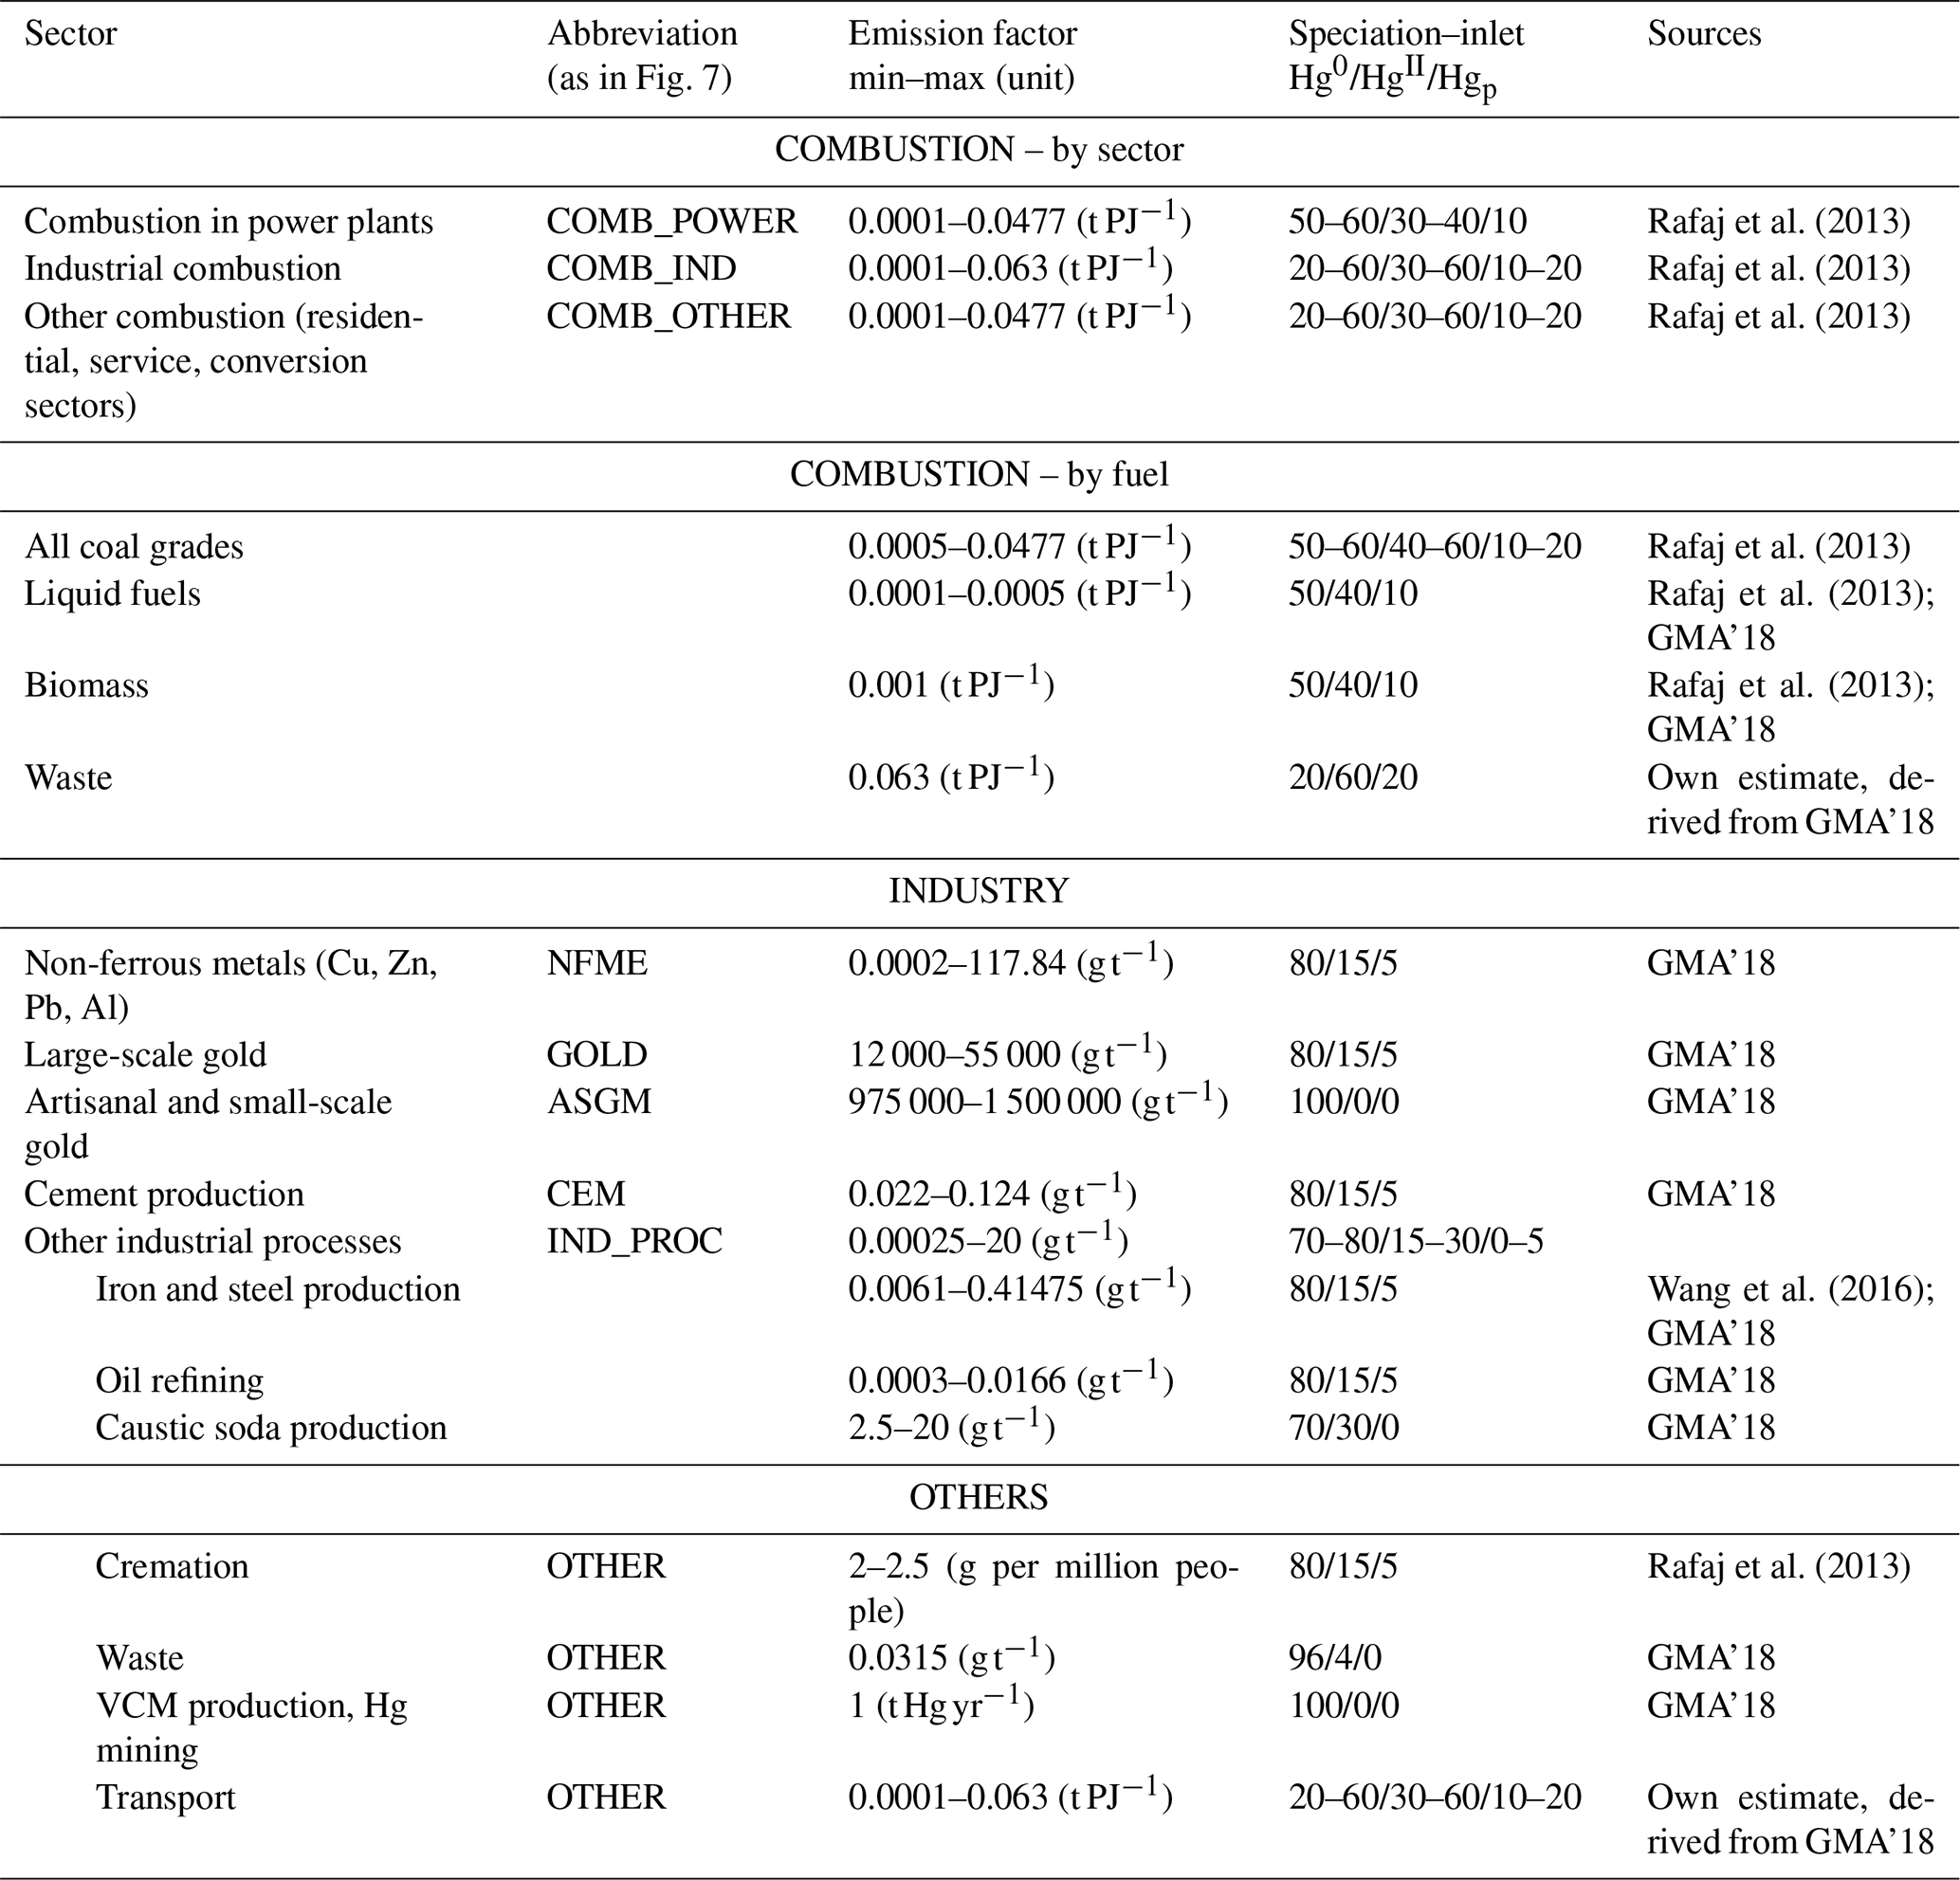
Notes: GMA'18 – AMAP/UN Environment (2019).
An illustration of this is provided by Fig. 1. In total, 13 fuel types used in 52 combustion sectors and 22 non-combustion emission sources are covered in GAINS, as summarized in the Supplement (Tables S1 and S2)2. For the purpose of this study, GAINS sector–activity combinations have been grouped into the main emission sources for Hg, as described in Table 1. Similarly, the 182 GAINS regions are grouped into 7 main regions (Africa, Asia–Pacific, Central and South America, Europe, Eurasia, Middle East, North America) consistent with the IEA World Energy Outlook (2022). Additionally, emission projections for Brazil, China, the European Union, India, Japan, Russia, Southeast Asia and the USA are computed separately as subregional case studies (see Table S10).
2.2 Emission factors
Uncontrolled emission factors (UEFs) are derived from literature sources and are specific to each sector–activity combination (see Table 1). Emission factors for hard coal and brown coal combustion (power sector, industries and buildings) remain unchanged from previous versions of GAINS (Rafaj et al., 2013, 2014). Factors for the production of cement, non-ferrous metals, aluminum, iron and steel, gold and caustic soda were updated in accordance with the Global Mercury Assessment 2018 (GMA'18; AMAP/UN Environment, 2019). The non-ferrous metal (NFME) sector in GAINS includes emissions from copper, lead, nickel and zinc smelters. Metal-specific emission factors (either country specific or generic, depending on data availability) were weighted by the share of the relevant metals of the total activity for a particular GAINS region, based on USGS Mineral Yearbook production data (Klochko, 2021; Flanagan, 2022; Tolcin, 2022). The shares were calculated for 2015 and assumed to be static, so this composite emission factor was subsequently applied to all years for a particular region. Total gold production was similarly based on USGS Mineral Yearbook data. These data were split into country-level shares of large-scale (sector “GOLD”) and artisanal and small-scale gold mining (sector “ASGM”), based on data from the World Gold Council as presented in GMA'18. Hg mining and vinyl chloride monomer production are not specified explicitly in the model, and no control measures are applied to them directly; however, their emissions are included in the aggregate category “Other Hg emissions” on a region-by-region basis, and their activities reflect projected sectoral emissions (George, 2021). In the waste sector, Hg emissions were derived from GMA'18 and attributed evenly to industrial, rural and urban waste categories.
Information on the average speciation of emissions from each source is also considered, dividing total unabated emissions into shares of Hg0, HgII and particulate Hg (Hgp). Due to a lack of regional data, identical speciation data were implemented for each sector–activity combination on a global level. The values represent the best available literature data and modeled speciation from the Interactive Process Optimization Guidance (iPOG™) tool (Krishnakumar et al., 2012) at the time of writing, but care must be taken during their interpretation, as they are associated with large uncertainty. Table 1 summarizes the ranges of unabated emission factors used in the GAINS model for aggregated Hg-relevant sectors, as well as the Hg0/HgII/Hgp of uncontrolled stack emissions.
2.3 Control technologies
2.3.1 Mercury-control measures
A review of Hg-control technologies and measures was conducted. Relevant technologies have been implemented into the GAINS model in addition to previously available co-benefit controls arising from PM and SO2 abatement. Such new controls include the option of low-mercury or halogen-treated coal (LHGCO), sorbent injection (such as activated carbon) with or without an additional baghouse filter (SINJ), acid plants for the non-ferrous metal and gold sectors (PR_AP), and stationary sorbent modules (SPC), which entail the possibility of not only removing Hg from the atmosphere but also of bringing it to a permanent sink such as a controlled hazardous waste landfill, rather than re-directing emissions into other environmental releases. Removal efficiencies and Hg speciation of the control technologies operating on Hg are summarized for each emission source category in the Supplement (Tables S3–S6).
2.3.2 Quantification of co-benefits for mercury from particulate matter and SO2 control
GAINS has been used extensively to inform policies on the reduction of air pollutants such as particulate matter (PM), SO2 and NOx, the abatement of which is known to strongly influence Hg emissions and their speciation. To compute the impacts of traditional air-pollution-control devices on the total reduction of mercury in the GAINS model, current and projected PM- and SO2-control strategies are considered in addition to Hg-specific control measures3. The concept of overlapping control measures has already been introduced in an earlier publication (Rafaj et al., 2013). Where Hg-relevant PM and/or SO2 controls co-exist in a region, sector and year, their compounded impact on Hg emissions is considered, increasing Hg-removal efficiency for the relevant portion of installations. Where appropriate, combinations of Hg-specific measures and PM/SO2 measures also lead to increased Hg-removal efficiency. The relevant technology combinations are listed in Tables S4–S6 together with their sector- and activity-specific removal efficiencies. Relevant technology combinations are defined in the power and industry sectors as different combinations of particle filters and flue gas desulfurization and acid plants. Lastly, there has been a significant update of the representation of emissions from waste in GAINS in recent years (Gómez-Sanabria et al., 2022). Control measures in the GAINS waste sector are multi-pollutant controls representing different types of landfill and other waste management options, not all of which can be directly linked to reduced atmospheric Hg emissions. In this modeling work, the following three measures found in the literature review have been associated with Hg removal: waste incineration with energy recovery and pollution controls (emissions accounted for in the power sector), landfill compression, and landfill covering. Details can be found in Table S6.
2.3.3 Effect of control measures on Hg speciation
Mercury speciation is also altered by the application of control measures. The speciated removal efficiency of the controls operates on the speciated no-control emissions. The resulting total Hg emissions are then split again into Hg0, HgII and Hgp based on reported stack speciated emissions of the technology from the literature review. Tables of all applied control technologies, their speciated removal efficiencies and resulting emission speciation can be found in the Supplement (Tables S3–S6).
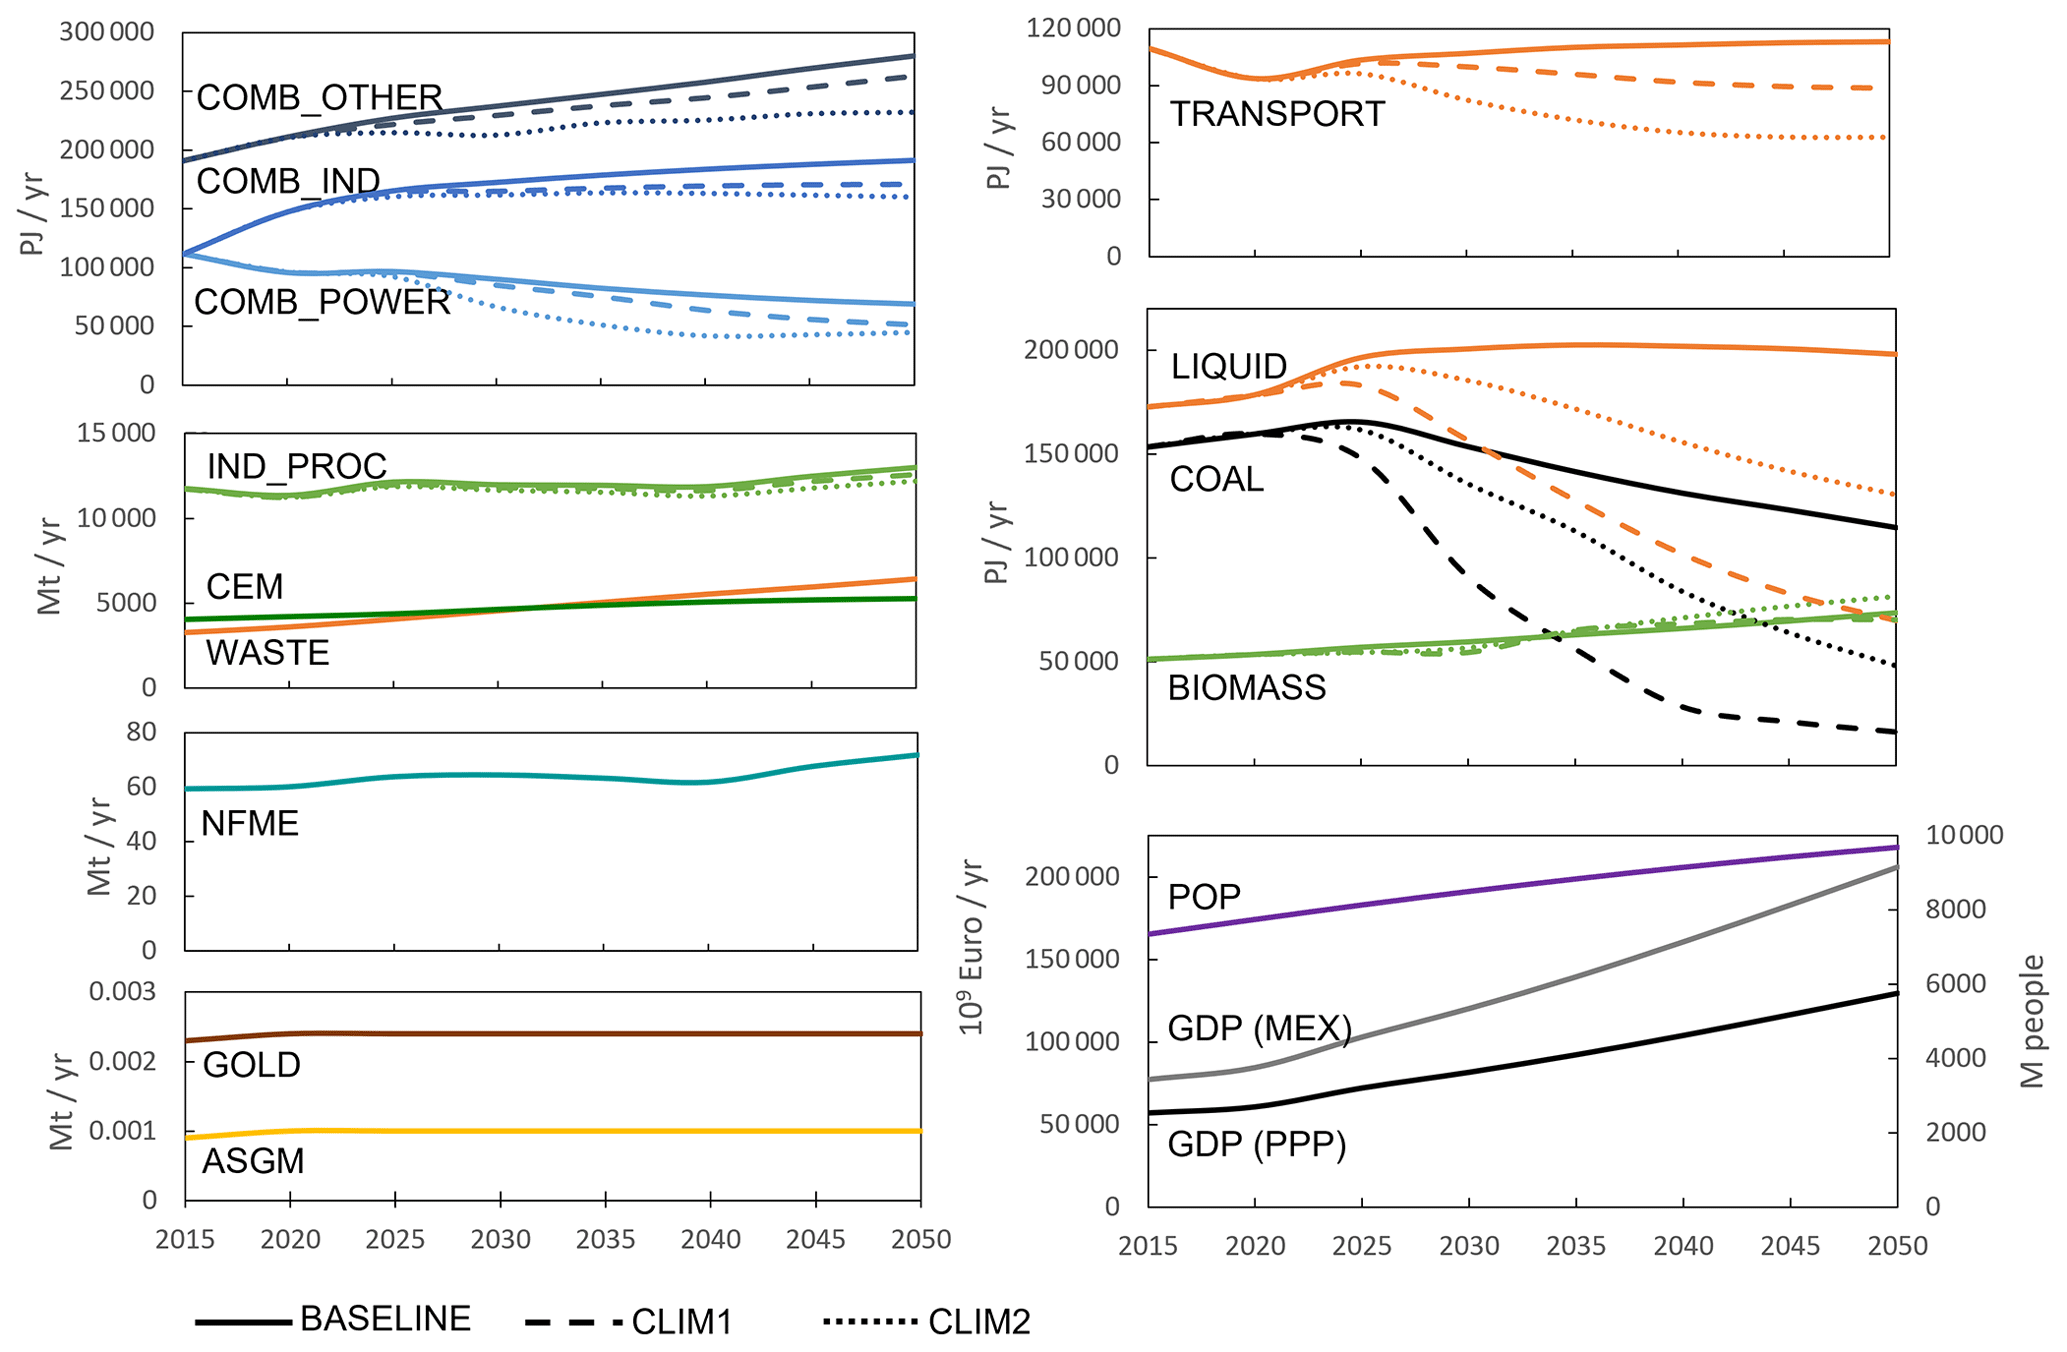
Figure 2Key activity data for the baseline, CLIM1 and CLIM2 scenarios. COMB_POWER – power plants, COMB_IND: combustion in industry, COMB_OTHER – other combustion (residential, commercial, conversion losses), IND_PROC – industrial processes, CEM – cement, NFME – non-ferrous metal production, ASGM – artisanal and small-scale gold mining, POP – population, GDP – gross domestic product, MEX – market exchange rate, PPP – purchasing power parity. Projections of fuel use (COMB and different fuels), transport, IND_PROC, CEM, NFME, POP and GDP from the World Energy Outlook 2022 (IEA, 2022). Waste data from Gómez-Sanabria et al. (2022). GOLD and ASGM – this study (see Sect. 3).
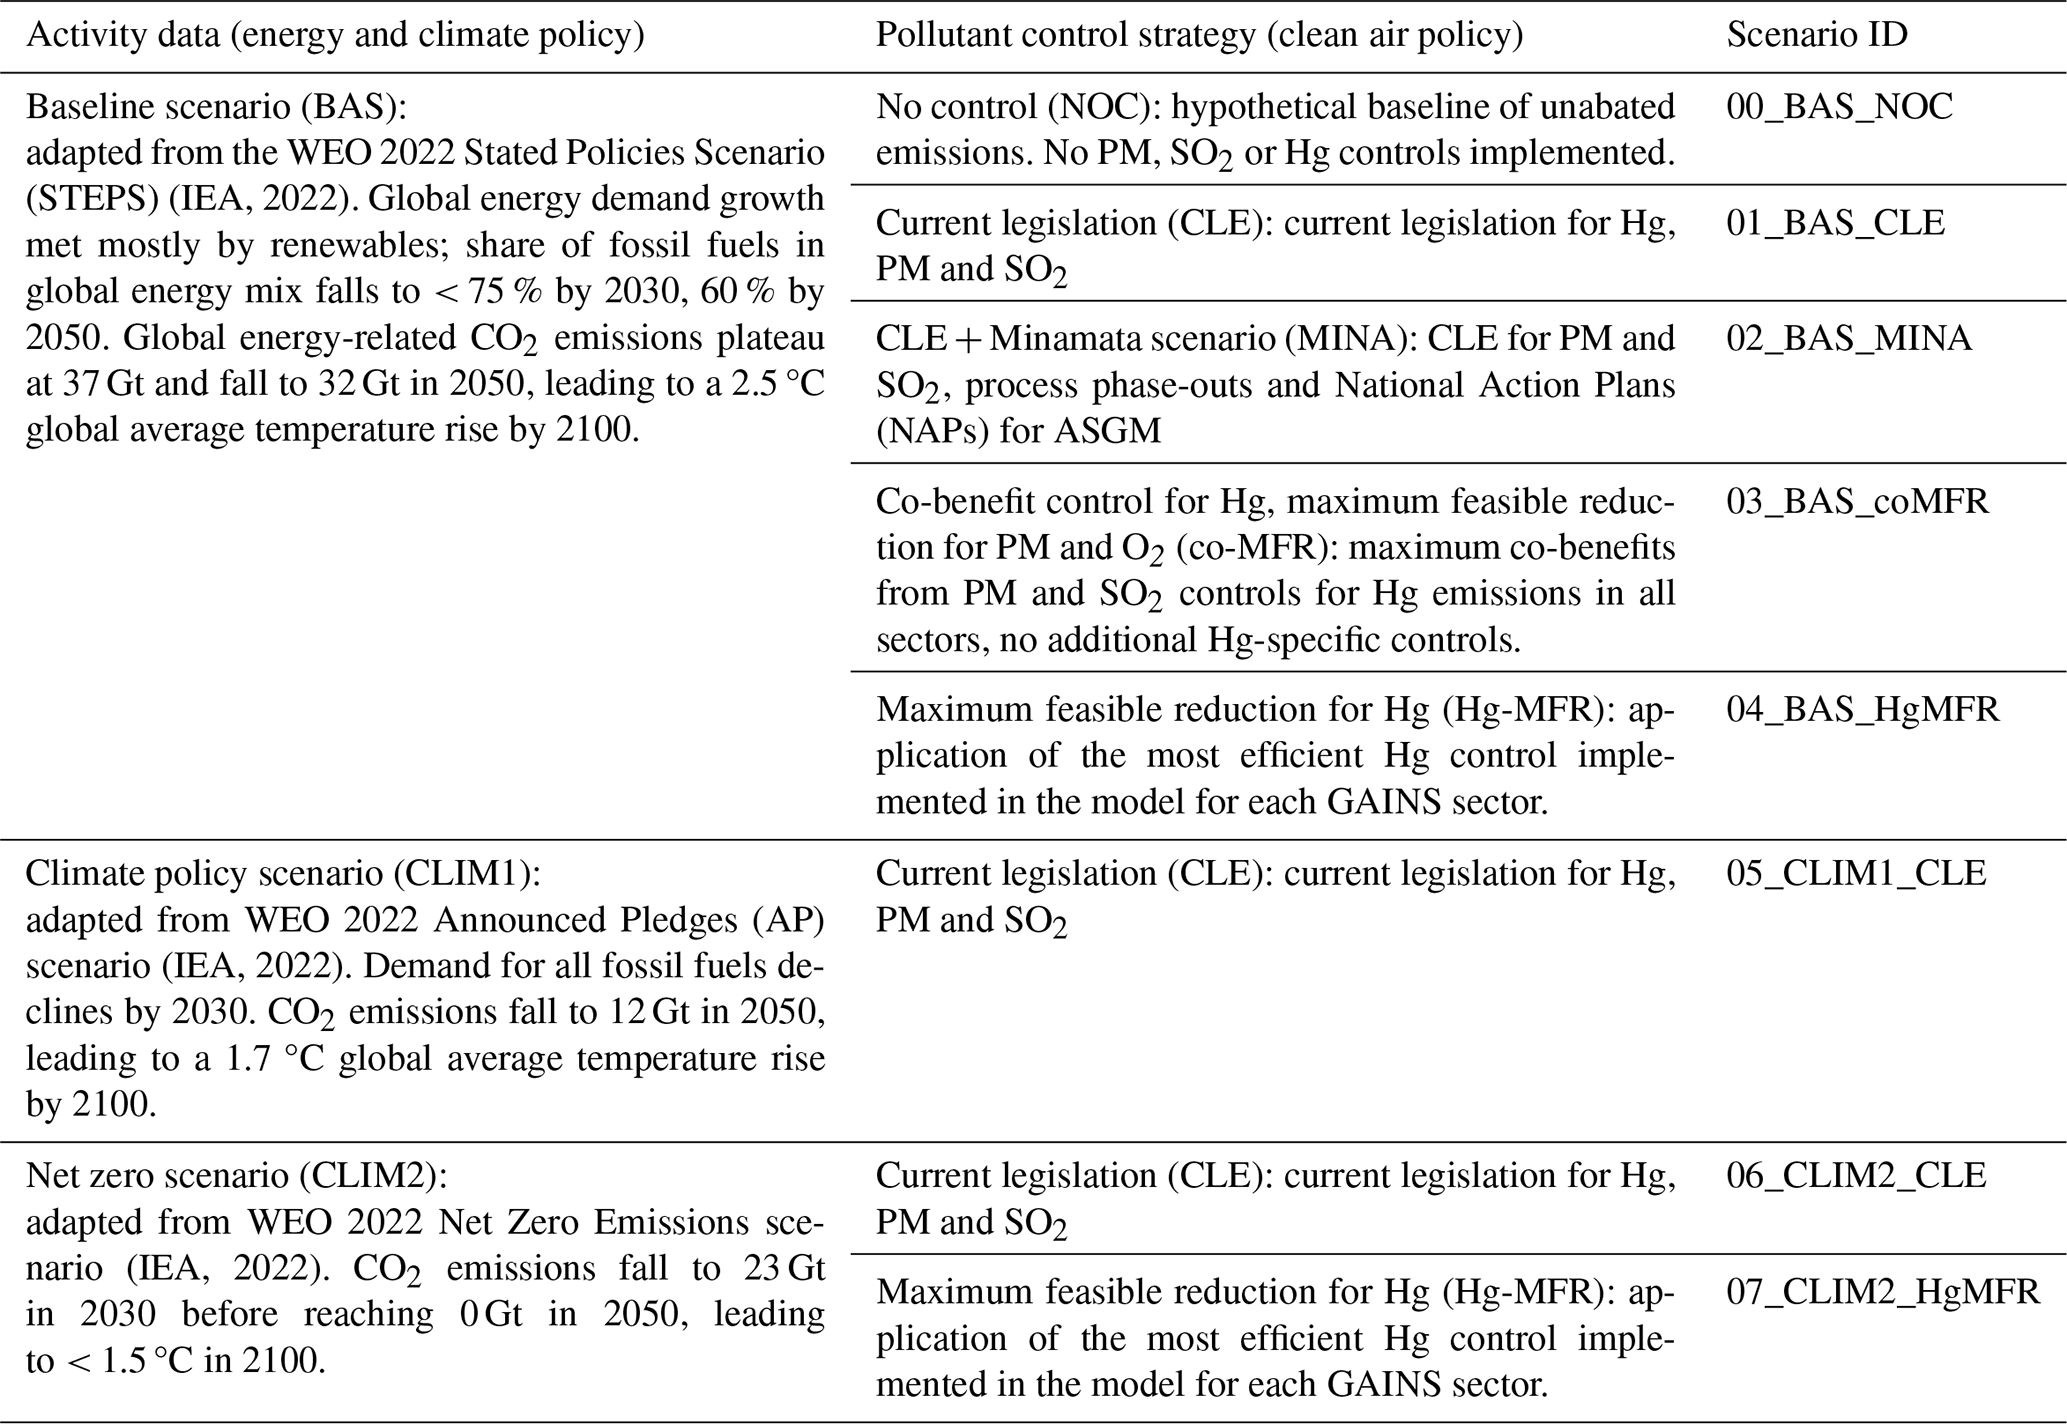
Table 2List of scenarios in this paper. The seven presented scenarios vary in two elements: activity data incorporate assumptions on energy and climate policy, and pollutant-control strategies incorporate different assumptions on clean air policy.
GAINS uses exogenous projections of anthropogenic activities and energy use to estimate future Hg emissions. For this study, three scenarios of energy and industrial production up until 2050 were implemented in GAINS based on trends reported by the World Energy Outlook 2022 (IEA, 2022). The three scenarios share assumptions on macroeconomic drivers (GDP growth, GDP per capita and annual population growth). They differ in their assumption on the stringency of climate policy and already include first effects of the Russian war in Ukraine. While the total global energy demand has either risen or stayed similar to 2015 levels in 2050 in all three scenarios, there are differences in the energy sources which meet this demand (see Fig. 2). The baseline (BAS) scenario represents developments in the energy sector leading to a 2.5 °C average global temperature rise by 2100 and is characterized by plateauing emissions at 37 Gt and a reduction to 32 Gt energy-related CO2 emissions in 2050. The demand growth is mostly met by renewable sources and the share of fossil fuels falls to 60 % in 2050. The climate policy (CLIM1) scenario is consistent with a global average temperature rise of 1.7 °C by 2100. The demand for all fossil fuels has already declined by 2030, leading to a decrease in CO2 emissions to 12 Gt by 2050. The net zero (CLIM2) scenario is the only scenario leading to a < 1.5 °C temperature rise by 2100 (IEA, 2022). Although both climate scenarios are very ambitious, they provide a scope to quantify the Hg-reduction potential induced by a rapid decarbonization of the global energy system. The scenarios are summarized in Table 2.
In addition, activities of Hg-specific sectors4 have been modeled in GAINS as follows: gold production volumes were cross-checked between the USGS Mineral Yearbook data (Sheaffer, 2022) and reports on ASGM from the World Gold Council via GMA'18, based on which shares between small- and large-scale gold production were calculated for 2020. Where the ASGM amounts in a specific country were larger than the total gold production reported by the USGS, this higher number was taken and the share of ASGM was assumed to be 1. Shares between ASGM and large-scale gold production were then taken as fixed for all past and projected years. Gold production and ASGM activity were projected into the future following the conservative assumption that levels will stay the same as 2020 levels, only to be modified by changing Hg policy through the control strategy (e.g., a ban on ASGM).
Caustic soda production from chlor-alkali plants using mercury cells has been adopted from the Rafaj et al. (2013) implementation of Hg in GAINS; phase-out of this technology is imminent, mandated through the Minamata Convention, and no updates were necessary. Similarly, the methodology on estimating cremation emissions has been previously described in Rafaj et al. (2013). Activity projections for vinyl chloride monomer (VCM) production and Hg mining are only represented implicitly in an aggregated category of other Hg-specific emission sources. The MCM mandates that the Hg intensity of VCM production must be reduced by 50 % in 2020 relative to production in 2010. For this study, 2015 VCM production values were assumed to be constant based on the data reported in GMA'18, but the Hg emission intensity was adjusted as mandated by the Minamata Convention.
The following mercury emission sources are not included in any GAINS sector for the current study: open savannah and forest burning; coal bed fires; and intentional mercury use in batteries, lamps or other devices.
4.1 Control strategies
Combined with the three energy and activity pathways listed in Sect. 3, scenarios of mercury-control measures were devised. They span the full range of possible approaches to influencing anthropogenic mercury emissions to the atmosphere – from the complete absence of control measures, to current legislation, all the way to maximizing co-benefit controls and applying stringent Hg-specific controls where this is feasible (see Table 2).
The no control scenario (NOC; as in 00_BAS_NOC) represents the complete absence of control measures for any pollutant – unabated emission factors are applied for all emission sources and all years. It displays higher-than-actual emissions, serving as a hypothetical endpoint that shows the efficacy of current legislation.
The current legislation (CLE; as in 01_BAS_CLE, 05_CLIM1_CLE, 06_CLIM2_CLE) control strategy represents existing and planned air-pollution-control policies for all pollutants implemented in GAINS (e.g., Rafaj et al., 2018; Amann et al., 2020, for global control strategies; Li et al., 2019, for China). Of these, the PM- and SO2-control strategies directly influence Hg emissions. In addition to co-benefit controls, Hg-specific controls were added in the extended modeling framework for this study: Hg-specific control measures were added for the cremation and waste incineration sectors in Europe, and control measures for non-ferrous metal production were adjusted to acid plants in line with existing legislation (e.g., the European Union Industrial Emissions Directive, Directive 2010/75/EU; Indian emissions regulations, CPCB, 1998). Table S7 summarizes all Hg-specific control strategy changes.
For the Minamata scenario (MINA; as in 02_BAS_MINA), the CLE control strategy was extended by information from the available Minamata National Action Plans (NAPs) for ASGM. Targets for good practice or elimination of mercury use in this sector were collected on the country level and then aggregated into the GAINS regional levels and then the WEO regional level (Table S7)5. It is important to note that this scenario does not include any assumptions on the implementation of emission reductions pursuant to MCM Article 8 beyond co-benefits arising from current legislation.
Scenarios combined with maximum feasible reduction (MFR) strategies assume the implementation of currently available emission-reduction technologies that achieve the lowest air pollution emission factors. Such scenarios have been computed for pollutants including PM and SO2 in GAINS using optimization procedures (e.g., Amann et al., 2011; Wagner et al., 2013). An MFR scenario with maximized PM and SO2 controls but CLE Hg controls is called the co-benefit MFR scenario (co-MFR; as in 03_BAS_coMFR) and it simulates the maximum Hg reduction that can be achieved without Hg-specific measures, i.e., solely through co-benefits from air-pollution-abatement policy.
Lastly, to demonstrate the endpoint of the control measures represented in GAINS, the Hg-specific maximum feasible reduction scenario (Hg-MFR; as in 04_BAS_HgMFR and 07_CLIM2_HgMFR) was generated. It represents the full application of the air pollution control devices (APCDs) and Hg-specific control measures (or their combinations) with the highest removal efficiency for each sector and each GAINS region in 2050. For combustion of coal, oil products and waste, as well as for most industrial processes including gold production, the Hg-specific control measures are applied. In sectors with low emission factors where no Hg-specific controls are currently applicable, such as transport or biomass combustion and domestic or residential fuel combustion, the co-benefit control with the greatest removal efficiency for Hg was applied. Activities where a ban is a viable policy option, such as ASGM, are banned. The only exceptions are Hg mining and VCM production, as they are implemented indirectly in GAINS and do not have control measures applied to them, but the activities rather reflect an adoption of current Minamata policies. For the waste sector, multi-pollutant waste management controls were applied, the most Hg-efficient of which is incineration coupled with sorbent injection before an additional fabric filter (FFSINJ). Table S8 summarizes the MFR control strategy for the year 2050.
4.2 Uncertainty of scenario results
Uncertainties for the aggregated sectors were estimated using a Monte Carlo simulation approach. Uncertainties for uncontrolled emissions (scenario 00_BAS_NOC) were modeled by varying unabated emission factors and activities based on the uncertainty estimates given in Table S11. The Monte Carlo simulation was conducted by varying UEFs and activity data at the most granular GAINS resolution (182 regions, all sectors as listed in Tables S1 and S10). The results were then aggregated to the regional and sectoral level used in this study and are given in Table S12. Assuming that the abated emission factors, which take into account Hg emission reductions through abatement measures, have the same levels of uncertainty as the UEFs, the calculated relative uncertainties are applied to 01_BAS_CLE (see Fig. S1).
Table 3Mercury emissions in the baseline + current legislation (01_BAS_CLE) scenario by world region and by sector (t yr−1).
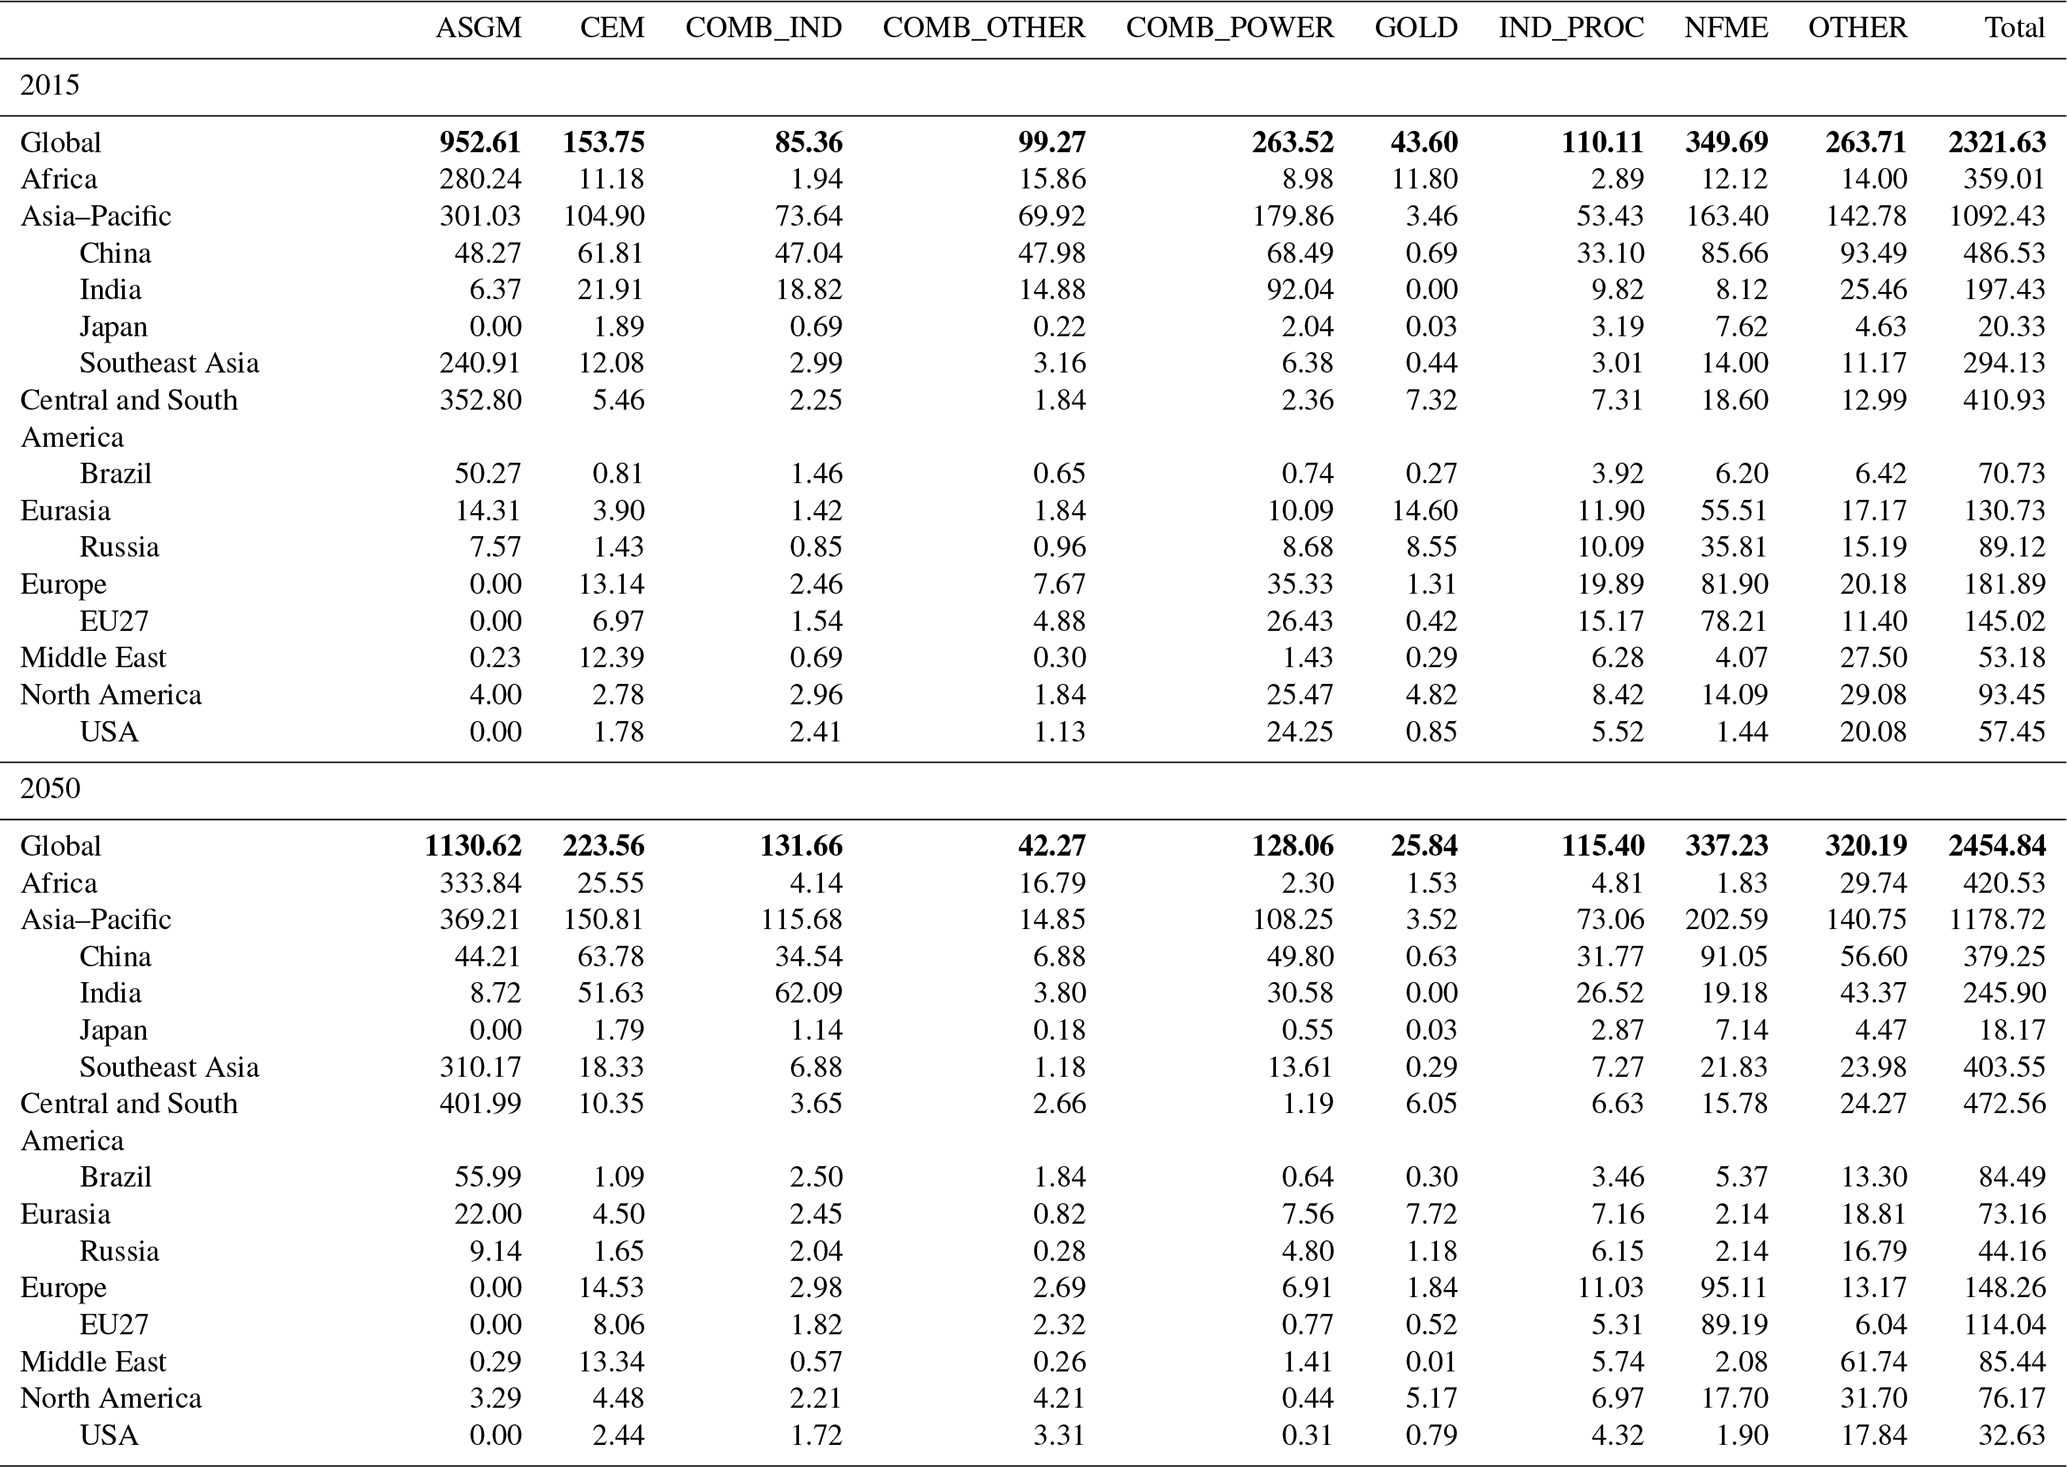
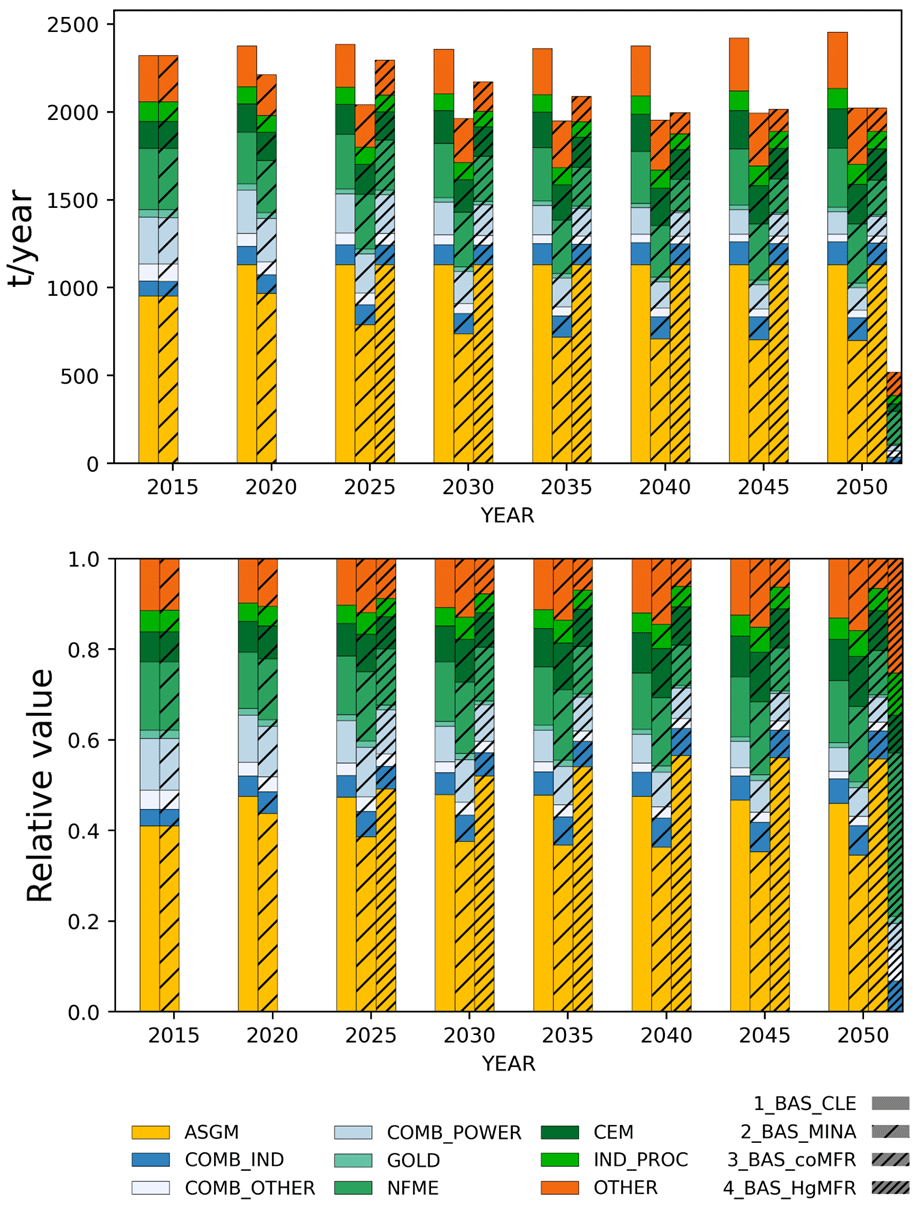
Figure 3Global mercury emissions for the BAS scenario combined with a set of different control strategies – by sector.
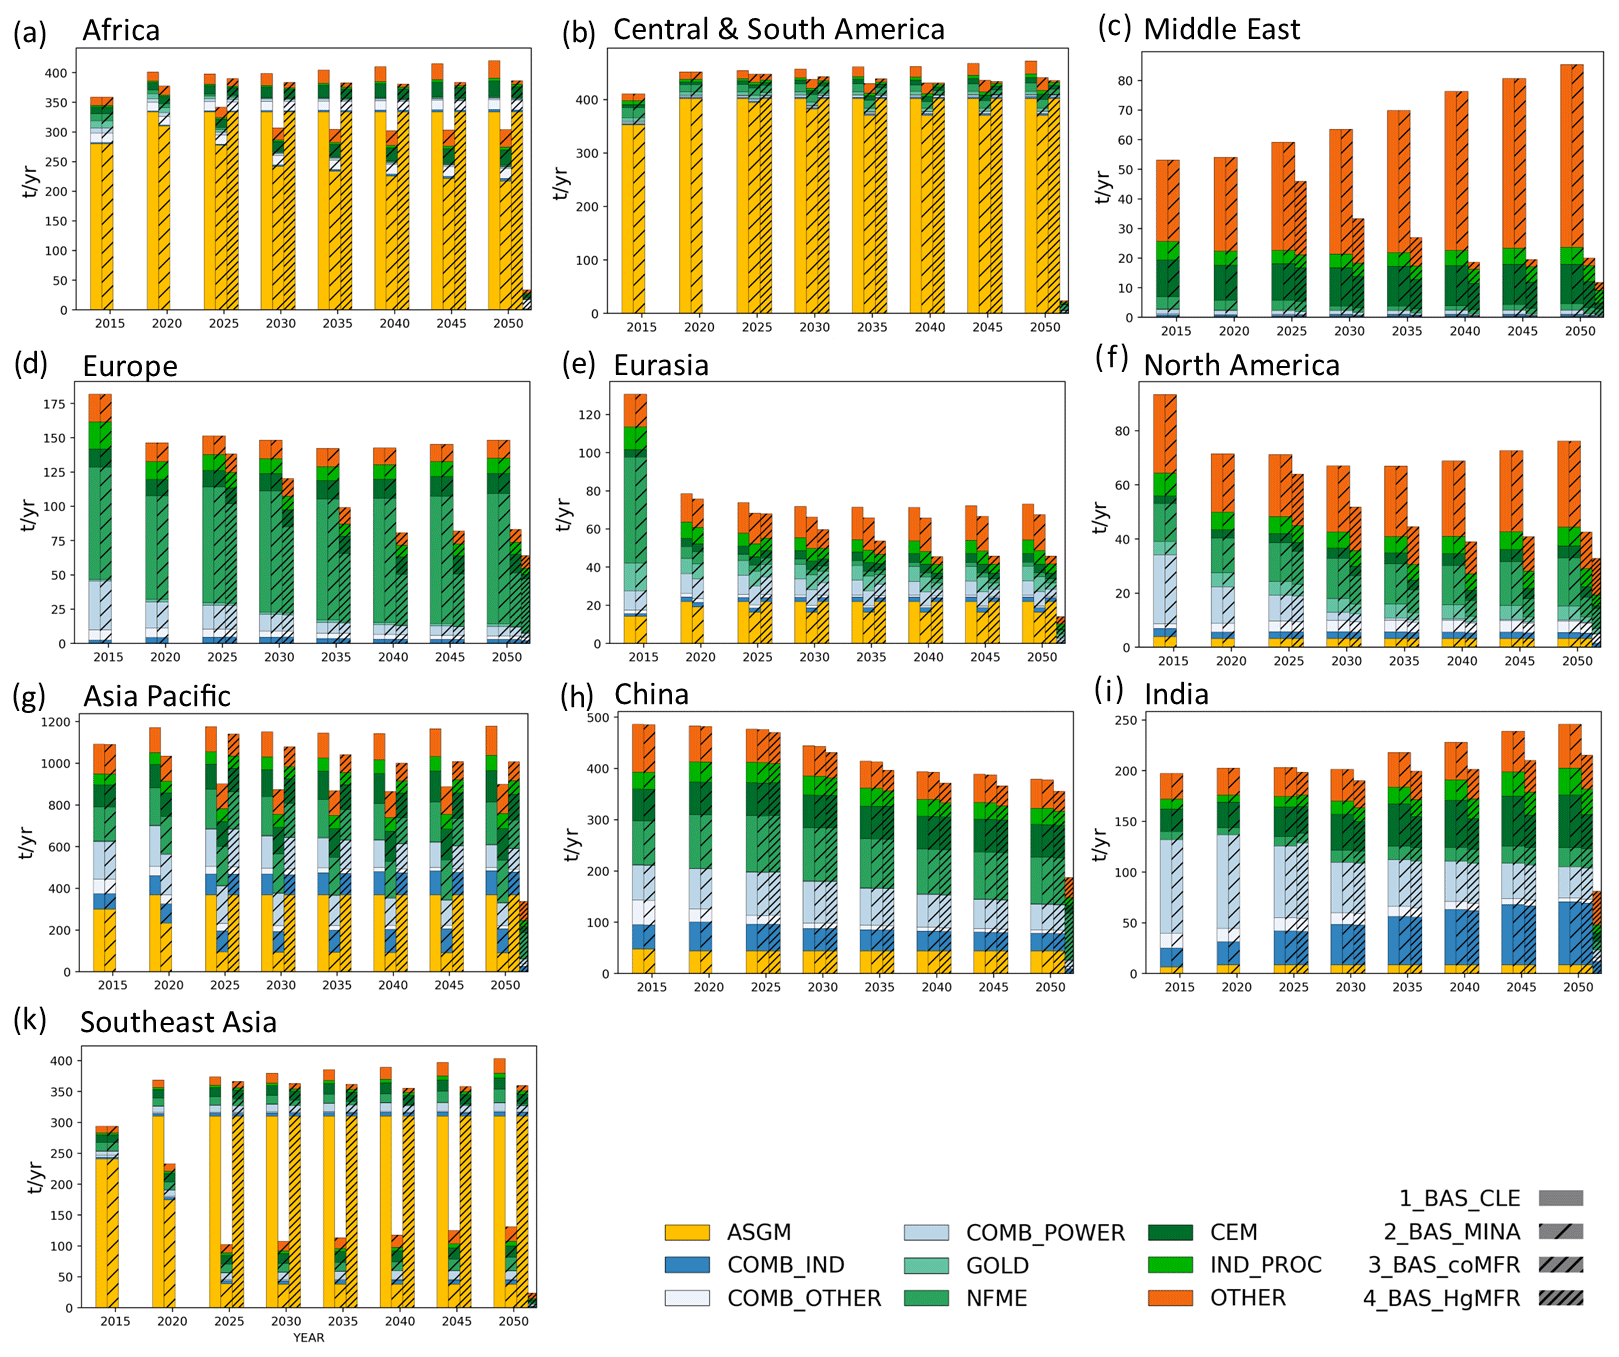
Figure 4Regional data: Hg emissions for the baseline, Minamata, co-MFR and BAS_HgMFR scenarios (01_BAS_CLE, 02_BAS_MINA, 03_BAS_coMFR and 04_BAS_HgMFR, respectively). (a) Africa, (b) Central and South America, (c) Middle East, (d) Europe, (e) Eurasia, (f) North America, and (g) Asia–Pacific and Asia–Pacific subregions – (h) China, (i) India and (j) Southeast Asia.
5.1 The baseline and current legislation scenario (01_BAS_CLE)
The global emissions trajectory for the baseline scenario of this study (01_BAS_CLE; as displayed in Table 3 and in Fig. 3 compared with other control strategies) sees a slight increase in Hg emissions until 2050 to 109.6 % of 2015 levels. Decreases from power generation and residential combustion and a small decrease in non-ferrous metal production are offset by emissions from waste and industrial emissions during both combustion and production processes. However, much of the increase is due to the increase in reported gold production between 2015 and 2020; thereafter, it is assumed that gold production be constant from 2020 to 2050. As a result, 75 % of the increase in Hg emissions by 2050 is due to the near-term growth in ASGM. Similarly, emissions of Hg from the waste sector increase, as they are driven by projected population increases (see Fig. 3). If these highly uncertain estimates are discounted, the combustion, metallurgy and other process sectors reduce their emissions slightly, by 80 t yr−1 by 2050. On a regional level, albeit largely confirmed, these trends depend strongly on the dominating emission sectors and assumed controls in each region, as plotted in Fig. 4.
In Europe, emissions decrease by 18 %, largely due to a reduction in Hg from combustion and industrial processes followed by other sources (mainly waste). There is a significant relative shift in the dominant emission sector as well: the main emission sources become non-ferrous metals (63 % of 2050 emissions) and cement (10 %). For the NFME sector there is not much potential for emission reduction left in the GAINS model, as acid plants, the most efficient control technology currently implemented in, e.g., copper smelters, are already mandated6. A very similar trend can be observed for North America.
African, Central and South American as well as Southeast Asian Hg emissions are dominated by ASGM, and the uncertainty intrinsic to these estimates (−36.8 % up to +44.5 %; see Table S12) eclipses trends in all other sectors such as small increases in cement and waste sectors. For all three regions, it is important to note that ASGM estimates for 2015 are subject to large uncertainty (Keane et al., 2023), and the purpose of projections in all scenarios can only be to show the influence of Hg policies such as the Minamata Convention, as the activity is kept constant.
The Asia–Pacific region spans the majority of the world's population and produces the majority of the world's Hg emissions. Emissions represent 46 % of global emissions in 2015 and 48 % in 2050. Globally, most emissions from power generation and industrial combustion come from this region. Emission reductions are only projected in the baseline scenario (01_BAS_CLE) for combustion in power plants and residential combustion. Emissions related to manufacturing and building activities such as cement production, industrial processes, NFME smelting and also population-related releases such as waste are projected to increase by 2050. ASGM emissions are regionally highly variable. Within the Asia–Pacific region, large differences pervade at the country and subregional levels (Fig. 4h–j). Emissions in China are projected to decrease in the baseline scenario due to both decarbonization and the co-benefits arising from rapid and stringent application of PM and SO2 controls. Indian Hg emissions from fossil fuel combustion (in COMB_POWER) are projected to increase and ASGM emissions dominate in Southeast Asia.
Emissions from the Middle East are dominated by cement production and unmanaged landfill waste emissions.
Uncertainty
Table S12 presents the percent ranges for the aggregated emission sectors on a global level. ASGM emission variations are largest on a relative level, but due to the large uncertainty in emission factors and the high unabated emission factors in the NFME sector, the absolute range of emissions was largest in this sector, followed by “OTHER” emissions and CEM. Combustion sectors show a small spread, reflecting the good data quality. While large-scale gold emissions give a large relative spread in the upper and lower bounds, their low total emissions mean that their contribution to the overall uncertainty of the results is small. The result is that the main uncertainties of this model lie within the ASGM sector: ASGM emissions make up between a third and 47 % of total emissions when looking at the lower- and upper-range estimates, respectively, varying between 602 and 1373 t in 2015. After this, waste emissions have the most variability in absolute terms, followed by emissions from the non-ferrous metal and power sectors. To conclude, improved data quality in ASGM and non-ferrous metals and waste as well as cement will significantly reduce the overall uncertainty of the baseline mercury emission estimates.
5.2 Mercury emission reductions as co-benefits of PM and SO2 controls
Comparing the no control and baseline scenarios, the full extent of emission reductions from current clean air policy becomes apparent, as NOC emissions are more than double those of the baseline in 2015, illustrating that more than 50 % of potential unabated Hg emissions are avoided through existing clean air policy. An extended discussion can be found in Sect. S4 of the Supplement.
The further potential for Hg emission reductions through co-benefits arising from PM and SO2 policy is assessed by comparing the Baseline with a co-MFR case without considering any Hg-specific measures beyond those already implemented in the CLE case. In 2050, the co-MFR scenario projects 2023 t of emissions compared to 2455 t in the baseline scenario – a reduction of 18 %.
In most of the world's regions, the comparison of co-MFR to CLE scenarios reveals that a large fraction of power sector capacities and industrial installations are already controlled by at least PM controls, and some form of SO2 control policy will already have been put in place by 2050, reflected in an implementation of the Hg-control measure “PM_FGD” in the power sector in GAINS. An extended discussion of the technology shares can be found in Sect. S3.2. In China alone, the retrofitting measures for coal-fired power plants in the 12th 5-year plan from 2010 to 2015 reduced Hg emissions by 23.5 t, explaining why further reductions in the power sector are limited, as current policy already mandates the strictest levels of APCD deployment, closure of inefficient small plants and coal phase-out policies (e.g., Li et al., 2020). On the other hand, there is still scope for improvement in the industry sectors such as NFME, cement, gold and other production: in 2050, emissions in the co-MFR for China are 6.2 % (22.5 t) lower than in the baseline scenario. The difference is mainly found in the OTHER (17.4 t) and IND_PROC (4.6 t) sectors, indicating that co-benefits arising from PM- and SO2-control measures are already planned to be maximized in the currently active policy. The results for India imply that co-benefits of air pollution abatement can still make significant contributions to lower Hg emissions, totaling a 12.4 % reduction in the co-MFR compared to the baseline case. The largest reductions are an 18.0 t Hg reduction in cement production in 2050 between the baseline and co-MFR cases and a 10.1 t Hg reduction in OTHER, with contributions mostly from waste management (see Fig. S3). In the Middle East, the potential for emission reduction through better waste management becomes especially clear (Figs. 3, 4, and S3), as waste emissions in OTHER dominate the picture. In the baseline scenario, unmanaged waste allows Hg to be emitted into the atmosphere and waste generation is expected to increase with population growth. However, in the co-MFR scenario, these emissions are minimized by 2050 thanks to the application of waste incineration with efficient Hg capture, the OTHER sector alone causing a 69.2 % reduction in total Hg emissions in 2050 in the co-MFR compared to the baseline scenario. In North America, Europe including the EU 27 and the Asia–Pacific region, the most significant co-benefit reduction potential lies in the NFME sector, owing to its exceptionally high emission factors, where even small improvements in the co-benefit controls are able to cut tonnes of Hg emissions. For example, in the EU27, over 90 % of the emission reduction is reached in the NFME sector alone, which could see a further 54.1 t of Hg reductions EU-wide if the strictest acid plant controls were to be employed at all plants.
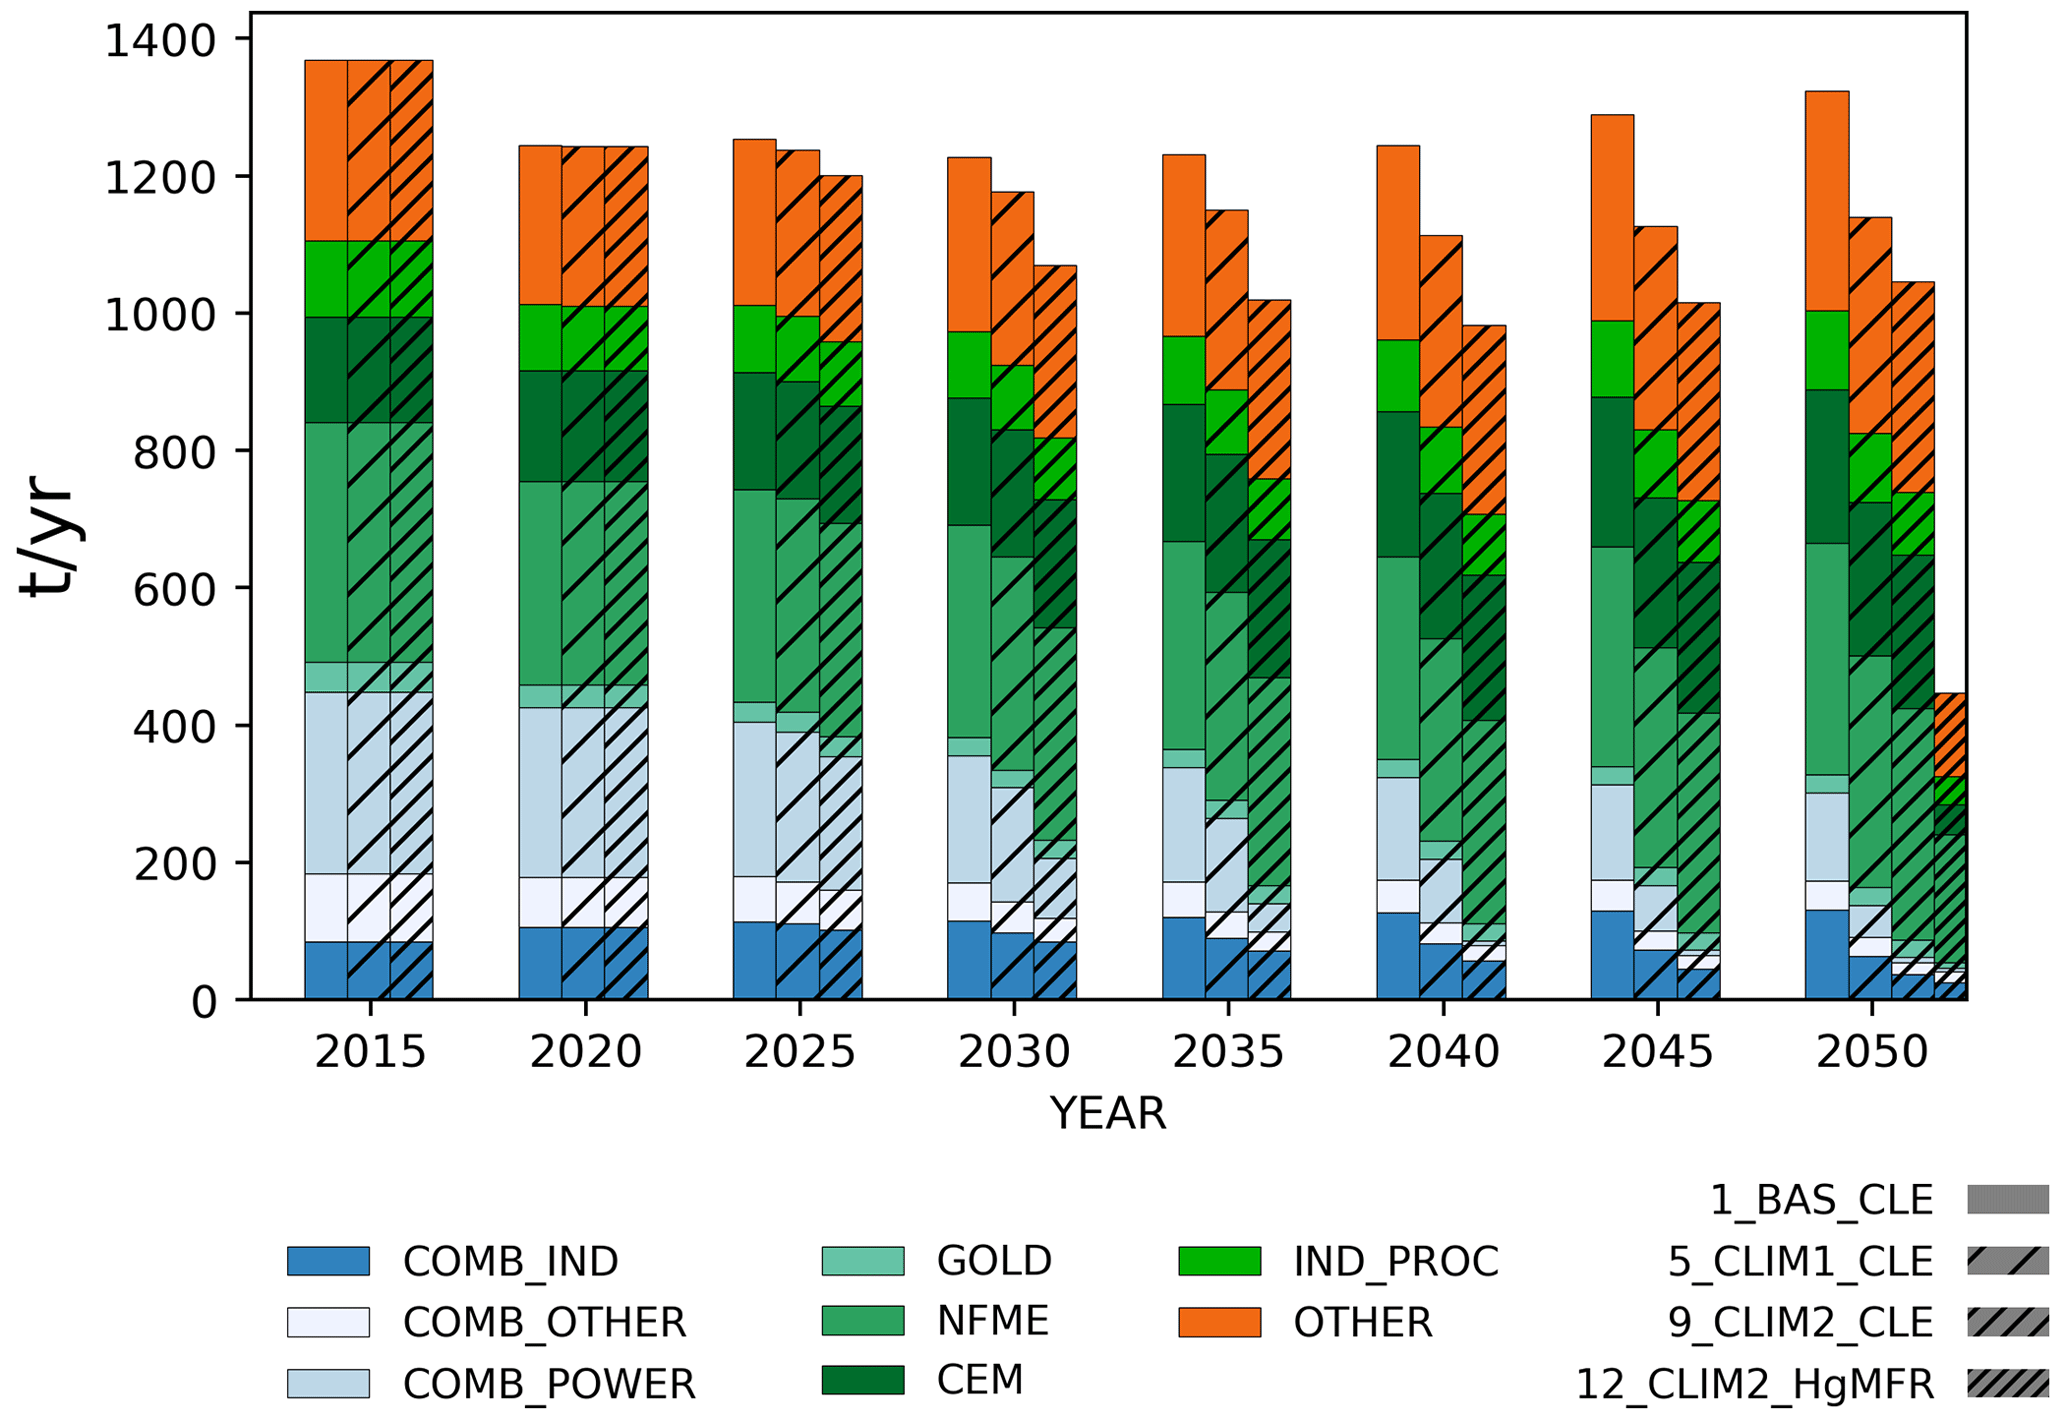
Figure 5Global mercury emissions excluding ASGM for the three energy scenarios BAS, CLIM1 and CLIM 2 under the CLE control strategy. The CLIM2 with HgMFR controls is included as the scenario with lowest-possible Hg emissions.
5.3 The maximum feasible reduction scenario
Comparison with a maximum feasible reduction (MFR) scenario serves to quantify the maximum potential of targeted Hg abatement (04_BAS_HgMFR, 07_BAS_HgMFR; short: Hg-MFR) relative to other approaches. Here, the results of BAS_HgMFR are discussed relative to BAS_co-MFR. Both scenarios represent endpoints of possible policy developments, so this comparison is only made for the year 2050. Co-benefits from PM and SO2 control impact mainly the power, industry and waste sectors; however, there are more efficient technologies available targeting Hg emissions applicable to a large range of sectors. For industry and combustion sectors, where Hg-specific measures are expected, the Hg-MFR scenario assumes adoption of the most efficient pollution-control measures available, which, in most sectors, encompasses sorbent injection in front of a fabric filter (FFSINJ). The Hg-MFR scenario implements a complete ban on ASGM and is thus the only scenario where the 1130 t of ASGM Hg emissions disappear, reducing total Hg emissions in 2050 drastically, by 79 % compared to the baseline case, to 521 t. As seen in Figs. 3 and S3, the difference in 2050 emissions is also large between the Hg-MFR and the co-MFR: the co-MFR projects 2050 emissions to be 2023 t, 3.9 times higher compared to the 521 t in Hg-MFR. Even when discounting the fact that ASGM emissions are completely removed from Hg-MFR, and when comparing all sectors except ASGM, the co-MFR would still produce 371 t of annual Hg emissions more than the Hg-MFR case. Besides ASGM, the largest absolute reduction of 135 t can be achieved in the cement sector, where emissions in Hg-MFR are just 24 % of those in the co-MFR scenario. This is followed by emissions from industrial processes (mainly iron and steel production), which, in 2050, are halved to 43 t in the Hg-MFR compared to co-MFR. Little to no further emission reductions are estimated in the COMB_OTHER, NFME and OTHER sectors. Waste-related emissions are captured by multi-pollutant controls. This is especially visible in the Middle East region, where the majority of emissions is modeled to come from waste (in OTHER), as shown in the CLE and MINA scenarios (e.g., Fig. 4). This emission source is addressed in the co-benefit MFR scenario, where better landfill practices are adopted and the loosely managed waste is re-directed into waste incineration with mercury capture. Similarly, in NFME, the most advanced SO2 controls, i.e., sulfuric acid plants, are expected to already comply with strict Hg legislation and are expected to contain Hg-specific sorbents, as sulfuric acid is sold on as a product and therefore needs to comply with the Hg content and quality standards applicable for this product. Combined with the net zero CO2 policy, 07_CLIM2_HgMFR presents the lowest-possible primary Hg emissions in 2050: co-benefits from climate policy, clean air policy and Hg-control policy are maximized and taken into account at the same time, leading to only 446.7 t of Hg emissions in 2050, a further reduction of 56.9 t compared to BAS_HgMFR (Figs. 3 and 5).
5.4 Mercury emission changes with climate policy
To compare climate policy impacts on Hg pollution, the three energy scenarios (BAS, CLIM1 and CLIM2) with CLE controls (BAS_CLE, CLIM1_CLE, CLIM2_CLE) have been analyzed. Considering the large decline in CO2 emissions by 2050 driven by climate change mitigation goals simulated in the Stated Policies, Announced Pledges and Net Zero Emissions scenarios (IEA, 2022), our analysis suggests that the reductions in Hg emissions, while apparent in Fig. 5, occur at a significantly lower rate than for CO2, and the differences between the three scenarios (277.7 t Hg between BAS_CLE and CLIM2_CLE) are smaller than the uncertainty attached to the ASGM estimates. Nevertheless, we believe that a discussion of trends is warranted as this helps to quantify co-benefits arising from climate action. As ASGM emissions are not affected by climate policy in our model, they have been excluded from Fig. 5 for easier comparison of the remaining sectors.
Noticeable emission reductions relative to 2015 are projected in the combustion sectors and caused by a reduction in global consumption of coal, oil, natural gas and traditional biomass use in the three scenarios. In contrast, emissions from cement production (CEM) and OTHER (mostly waste) increase in all three scenarios between 2015 and 2050. While this does not offset the emission reductions in CLIM1 and CLIM2, it leads to a slight increase in global emissions in the 01_BAS_CLE scenario. A shift of emissions from the combustion sector towards industrial processes, gold production and waste treatment can be seen due to changes in the energy and industrial systems and is most pronounced in the scenario complying with the most stringent climate policy (Fig. 5).
The decarbonization of global economy and the transition towards renewable energy sources and associated infrastructure induce an increased demand for critical minerals for electrification in all three scenarios. In GAINS, this is reflected in an increased demand for non-ferrous metals in 2050 (see Fig. 3, NFME activity). However, improved pollution-control measures lead to 3.6 % lower emissions in 2050 than in 2015. A projected increase in activities and resulting emissions in all three scenarios relative to 2015 are also shown in another industrial processes sector (IND_PROC), largely due to iron and steel production. In the CLIM1 scenario, IND_PROC emissions dip to 93t in 2030 and then increase again to 101 t by 2050. Overall, the baseline (BAS) scenario projects slightly rising emissions from IND_PROC, while both CLIM1 and CLIM2 show slight declines from 110 t yr−1 in 2015 to 101 t yr−1 Hg (CLIM1) and 91 t yr−1 (CLIM2) by 2050, mostly due to declining iron and steel emissions.
The largest differentiation between the different energy scenarios and their resulting Hg emissions is apparent within the combustion sectors. Globally, emissions from the power sector (COMB_POWER) roughly halve from 2015 to 2050 in the baseline scenario and drop further by 82 % and 97 % in CLIM1 and CLIM2, respectively, virtually removing the combustion sources of Hg from the emissions profile. It is noted that the largest reductions in Hg emissions occur in regions where coal power is a significant contributor to the energy mix. Globally, the largest relative share of combustion-related Hg emissions in 2050 in all scenarios is estimated within the industrial combustion sector. In the baseline case, emission levels from industries are projected to rise by 50 % between 2015 and 2050; however, in comparison, these are reduced by a quarter in CLIM1 and by 56 % in CLIM2.
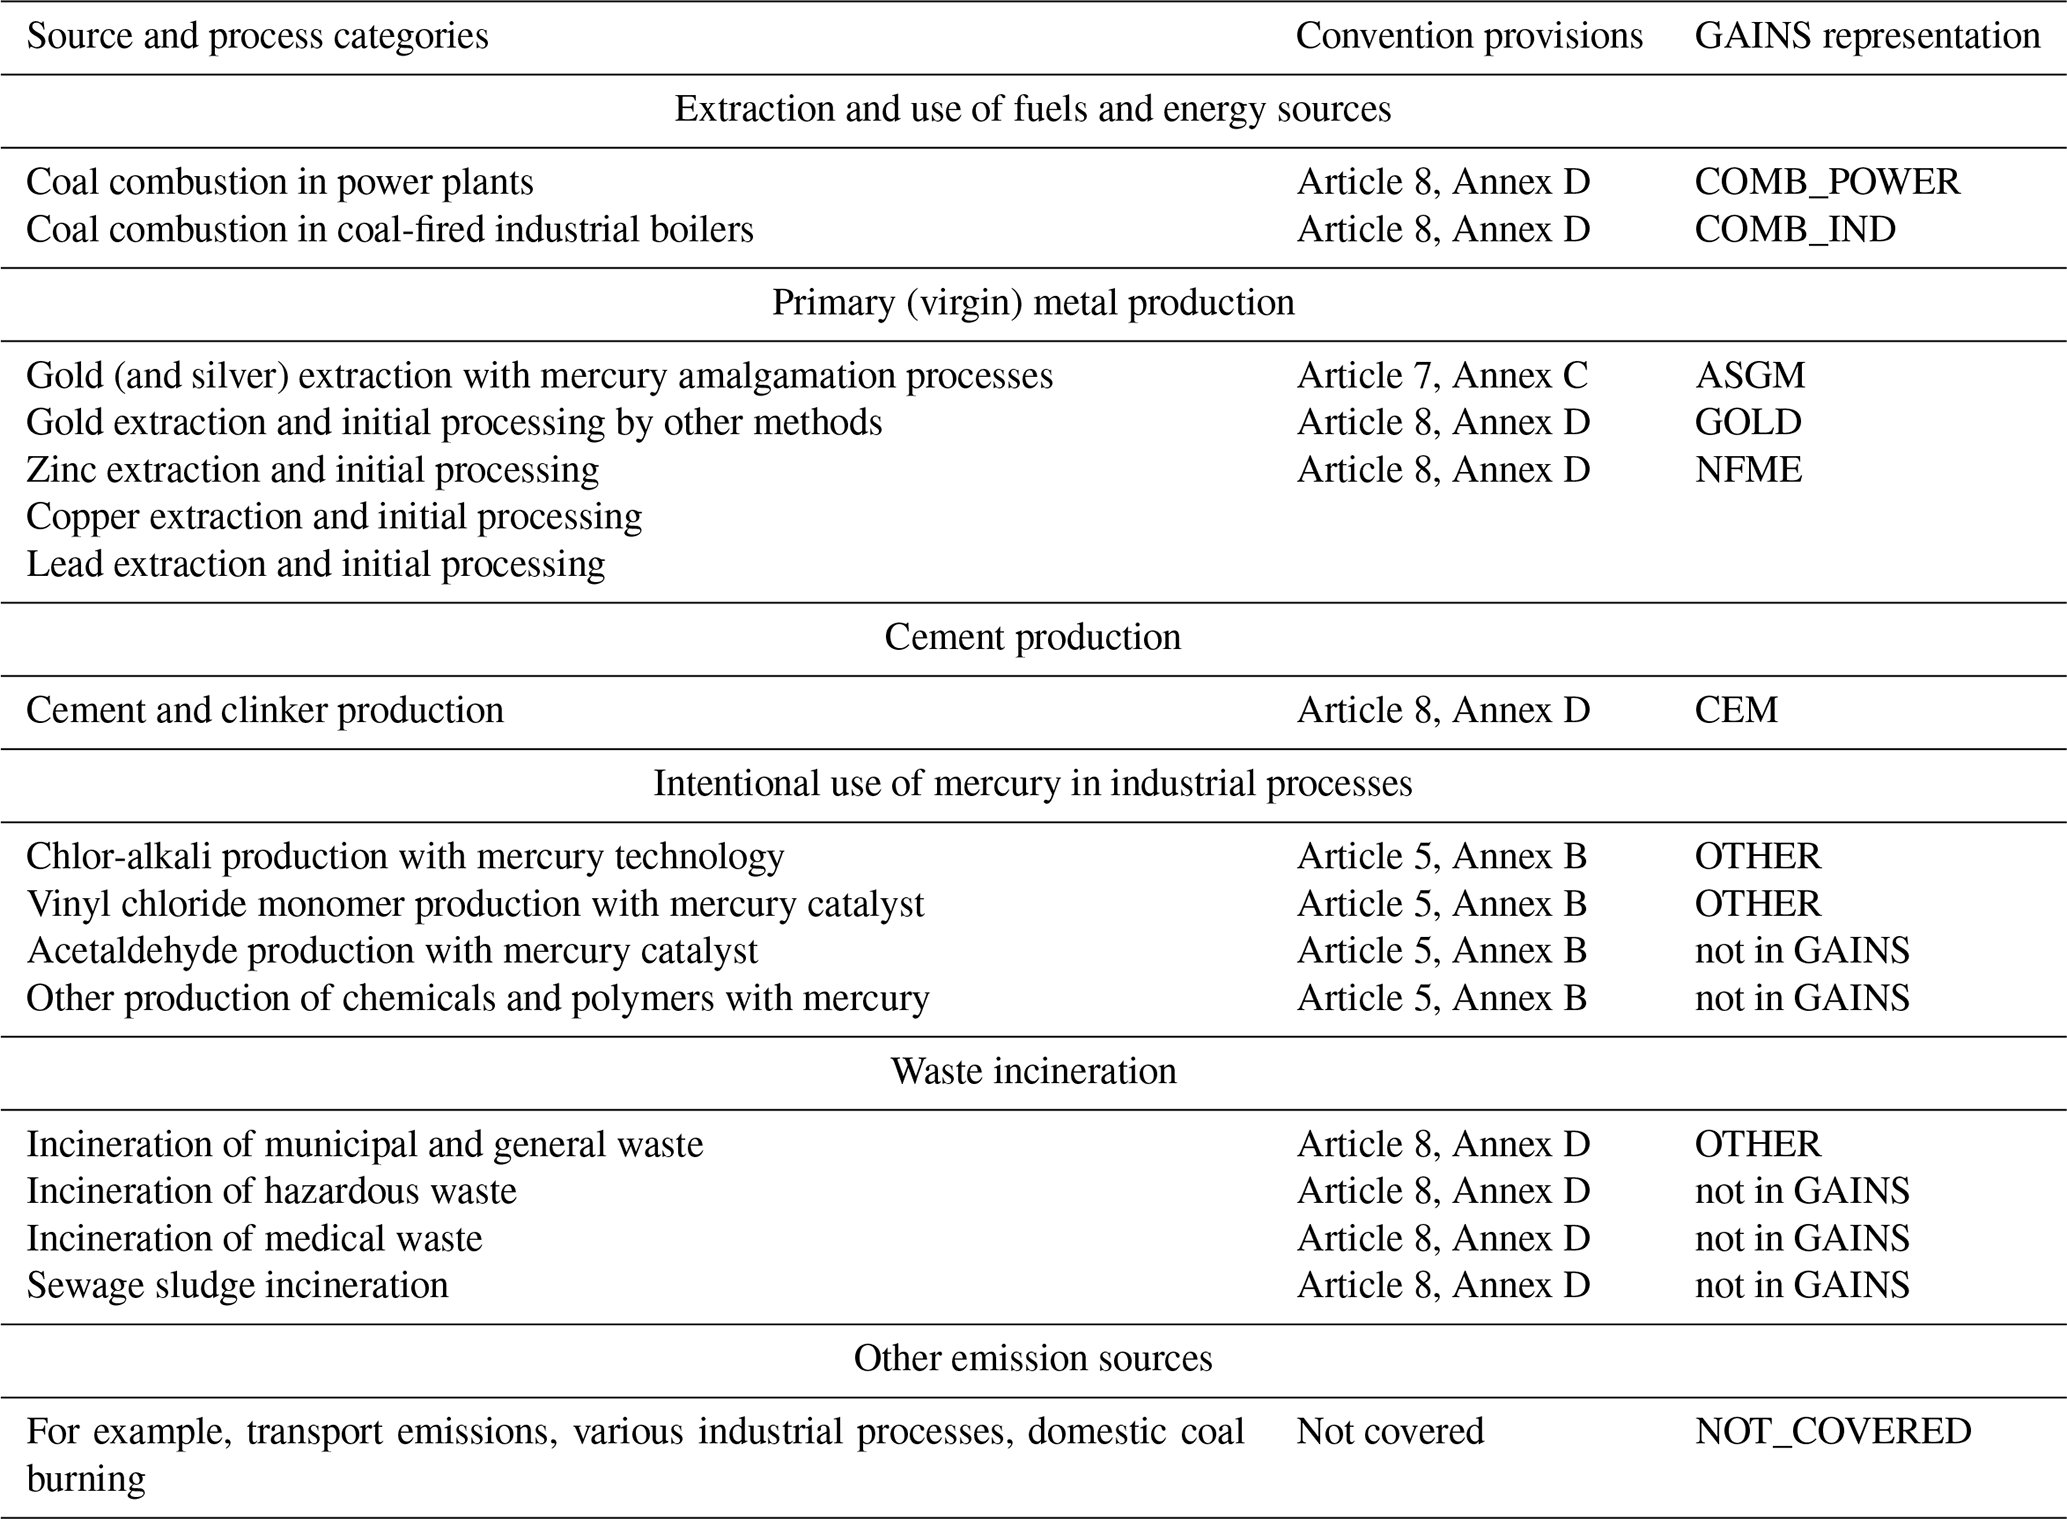
Table 4Source and process categories covered by the Minamata Convention provisions with their corresponding GAINS sector representation in the “Minamata” sector aggregation.
While fossil fuel combustion in the power sector is projected to decline on a global level, in some countries such as India, fossil fuel combustion in industries (COMB_IND) is projected to grow beyond 2015 values in all scenarios, with Hg emissions projected to more than triple from 18.8 t yr−1 in the baseline case to 62.1 t yr−1 by 2050. In CLIM1, COMB_IND emissions rise by 7.7 t yr−1, and only in the net zero CLIM2 scenario do Indian industrial combustion emissions decrease to 6.7 t yr−1 by 2050. Emissions of Hg from activities which are scaled by population growth, such as waste generation, rise equally in all scenarios. In the OTHER category, Hg emissions from transport are combined with emissions from waste and some other Hg-emission activities. Consequently, waste emission increases are offset by emission savings from fossil fuel-based road and off-road transport. Nevertheless, an overall increase in these emissions is seen across all three scenarios, although it is slightly higher in the baseline than in the climate scenarios.
5.5 Implications of the Minamata Convention for future Hg emission trends
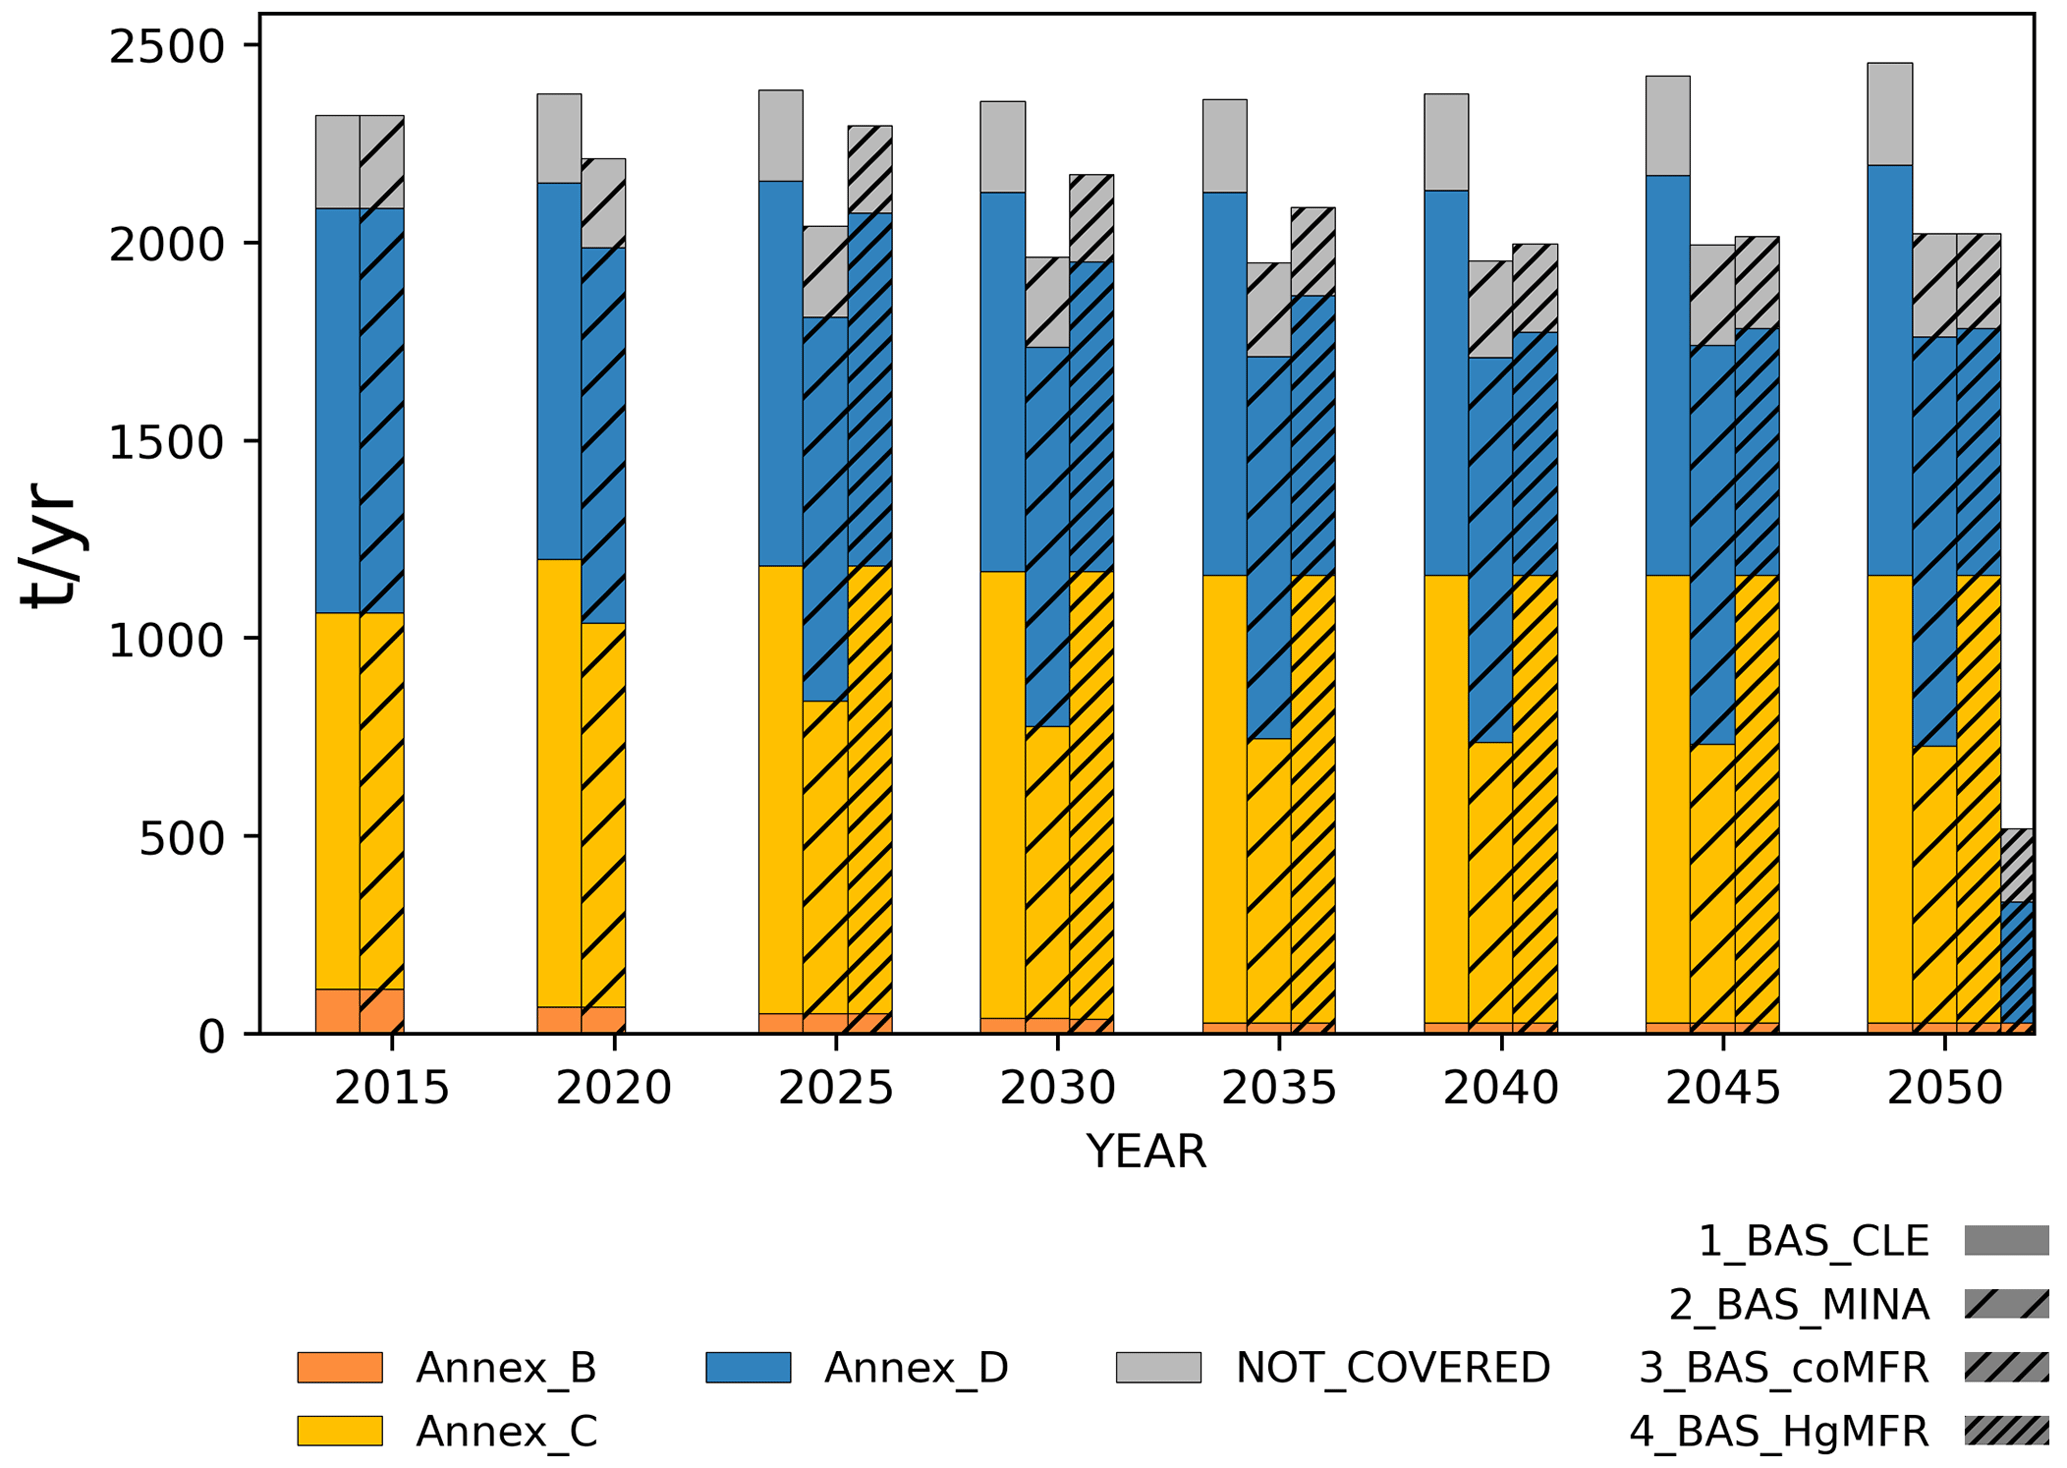
For the purpose of direct comparison between the modeling results and the impacts of the Minamata Convention on Mercury (MCM) concerning Hg emissions to the atmosphere, a sector mapping between the MCM provisions and GAINS was conducted, as detailed in Table 4. GAINS sectors which are also included in the MCM (AMAP/UN Environment, 2013) are grouped into Annex B, C and D sources. Smaller emission sources in GAINS including some industrial processes; combustion of biomass, liquid and gaseous fossil fuels; and transport emissions are not covered by the MCM7. Figure 6 shows the results of the BAS scenarios (CLE, MINA, coMFR, HgMFR) mapped to the Minamata sectors.
5.5.1 Annex D sources
Article 8 of the MCM addresses atmospheric emissions directly by “controlling and, where feasible, reducing emissions of mercury and mercury compounds, often expressed as `total mercury', to the atmosphere through measures to control emissions from the point sources falling within the source categories listed in Annex D” (Minamata Convention on Mercury, 2013, art. 8.1). Annex D sources are represented well in GAINS (Table 4). Article 8 does not mandate a phase-out of these activities, but rather mandates use of BAT and BEP for new sources, and it is up to the parties of the MCM to formulate appropriate steps to reduce Hg emissions from existing sources – which may be co-benefit reduction of Hg from other air-pollution-control or Hg-specific measures. The different control strategies in the CLE, co-MFR and Hg-MFR scenarios (01_BAS_CLE, 03_BAS_coMFR, 04_BAS_HgMFR) represent different narratives of how the Art. 8 objectives could be achieved, as different Hg-reduction measures may be considered BAT or BEP. For example, the EU's Industrial Emissions Directive (EU-IED) states for large coal and lignite combustion plants that PM, SO2 or NOx, as well as Hg-specific reduction technologies, is considered BAT (see BAT 27 in Commission Implementing Decision, EU, 2021/2326, 2021). Fuel choice is also listed as a Hg-specific control measure but might be considered a co-benefit of energy and climate policy in the case of Hg emissions from coal. Thus, each scenario (baseline, co-MFR, Hg-MFR, CLIM1_CLE and CLIM2_CLE and combinations thereof) would represent a variation of possible compliance with Art. 8 for coal combustion. For non-ferrous metals, BAT is to consider raw materials with low Hg contents as well as using Hg-specific sorbents in the EU (BAT 11 in Commission Implementing Decision, EU, 2016/1032, 2016), the endpoint of which is represented in the Hg-MFR scenario. Annex D sources are globally dominated by NFME and coal power emissions in 2015, but power sector emissions are expected to fall in importance by 2050, as discussed earlier. Industrial (NFME, CEM) and waste emissions are projected to become the largest contributors to total emissions in Annex D in all scenarios. The scenario results suggest that targeted, Hg-specific measures result in the most significant Hg reduction for Annex D sources, as they are generally associated with the lowest emission factors. However, after taking into account region-specific and economical factors, this may not translate into BAT and BEP for many countries and represents an endpoint of the lowest possible emissions from these sources.
5.5.2 Annex C sources
Article 7 does not exclusively address air emissions but concerns the phase-out of ASGM activities: each party with ASGM activities on their territory “shall take steps to reduce, and where feasible eliminate, the use of mercury and mercury compounds in, and the emissions and releases to the environment of mercury from, such mining and processing.” (Minamata Convention on Mercury, 2013, art. 7.3). The National Action Plans (NAPs) required by Art. 7 lay out the planned reduction and/or phase-out for each relevant party. With currently published targets fully implemented, ASGM emissions in BAS_MINA are projected to sink to 738.3 t in 2030 and 700.0 t in 2050, and ASGM is bound to make up roughly one-third of global Hg emissions in 2050, the largest absolute reduction stemming from Southeast Asia (272.0 t) and Africa (116.3 t). There are large uncertainties connected to the activity levels as well as emission factors of ASGM (determined to be −37 % to +44 % uncertainty in this study's baseline scenario on a global level).
5.5.3 Sources not covered by the Minamata Convention
It is important to note that the MCM does not cover all potential emission sources nor all mercury uses, instead focusing on intentional use of Hg and Hg compounds, as well as the largest emitters. In this study, only roughly 10 % (of the emissions computed by GAINS) fall into the “NOT_COVERED” category: 234.6 t Hg in 2015, increasing slightly to 259.8 t by 2050 in BAS_CLE). The number includes emissions from residential and domestic coal combustion, biomass combustion, transport emissions and emissions related to oil refining as well as production of iron and steel, paper, fertilizer, glass and aluminum. This number is higher than the GMA'18 estimate (171.5 t Hg, not including paper, fertilizer and glass). It highlights that the MCM has the potential to impact 90 % of the future emissions examined in this paper.
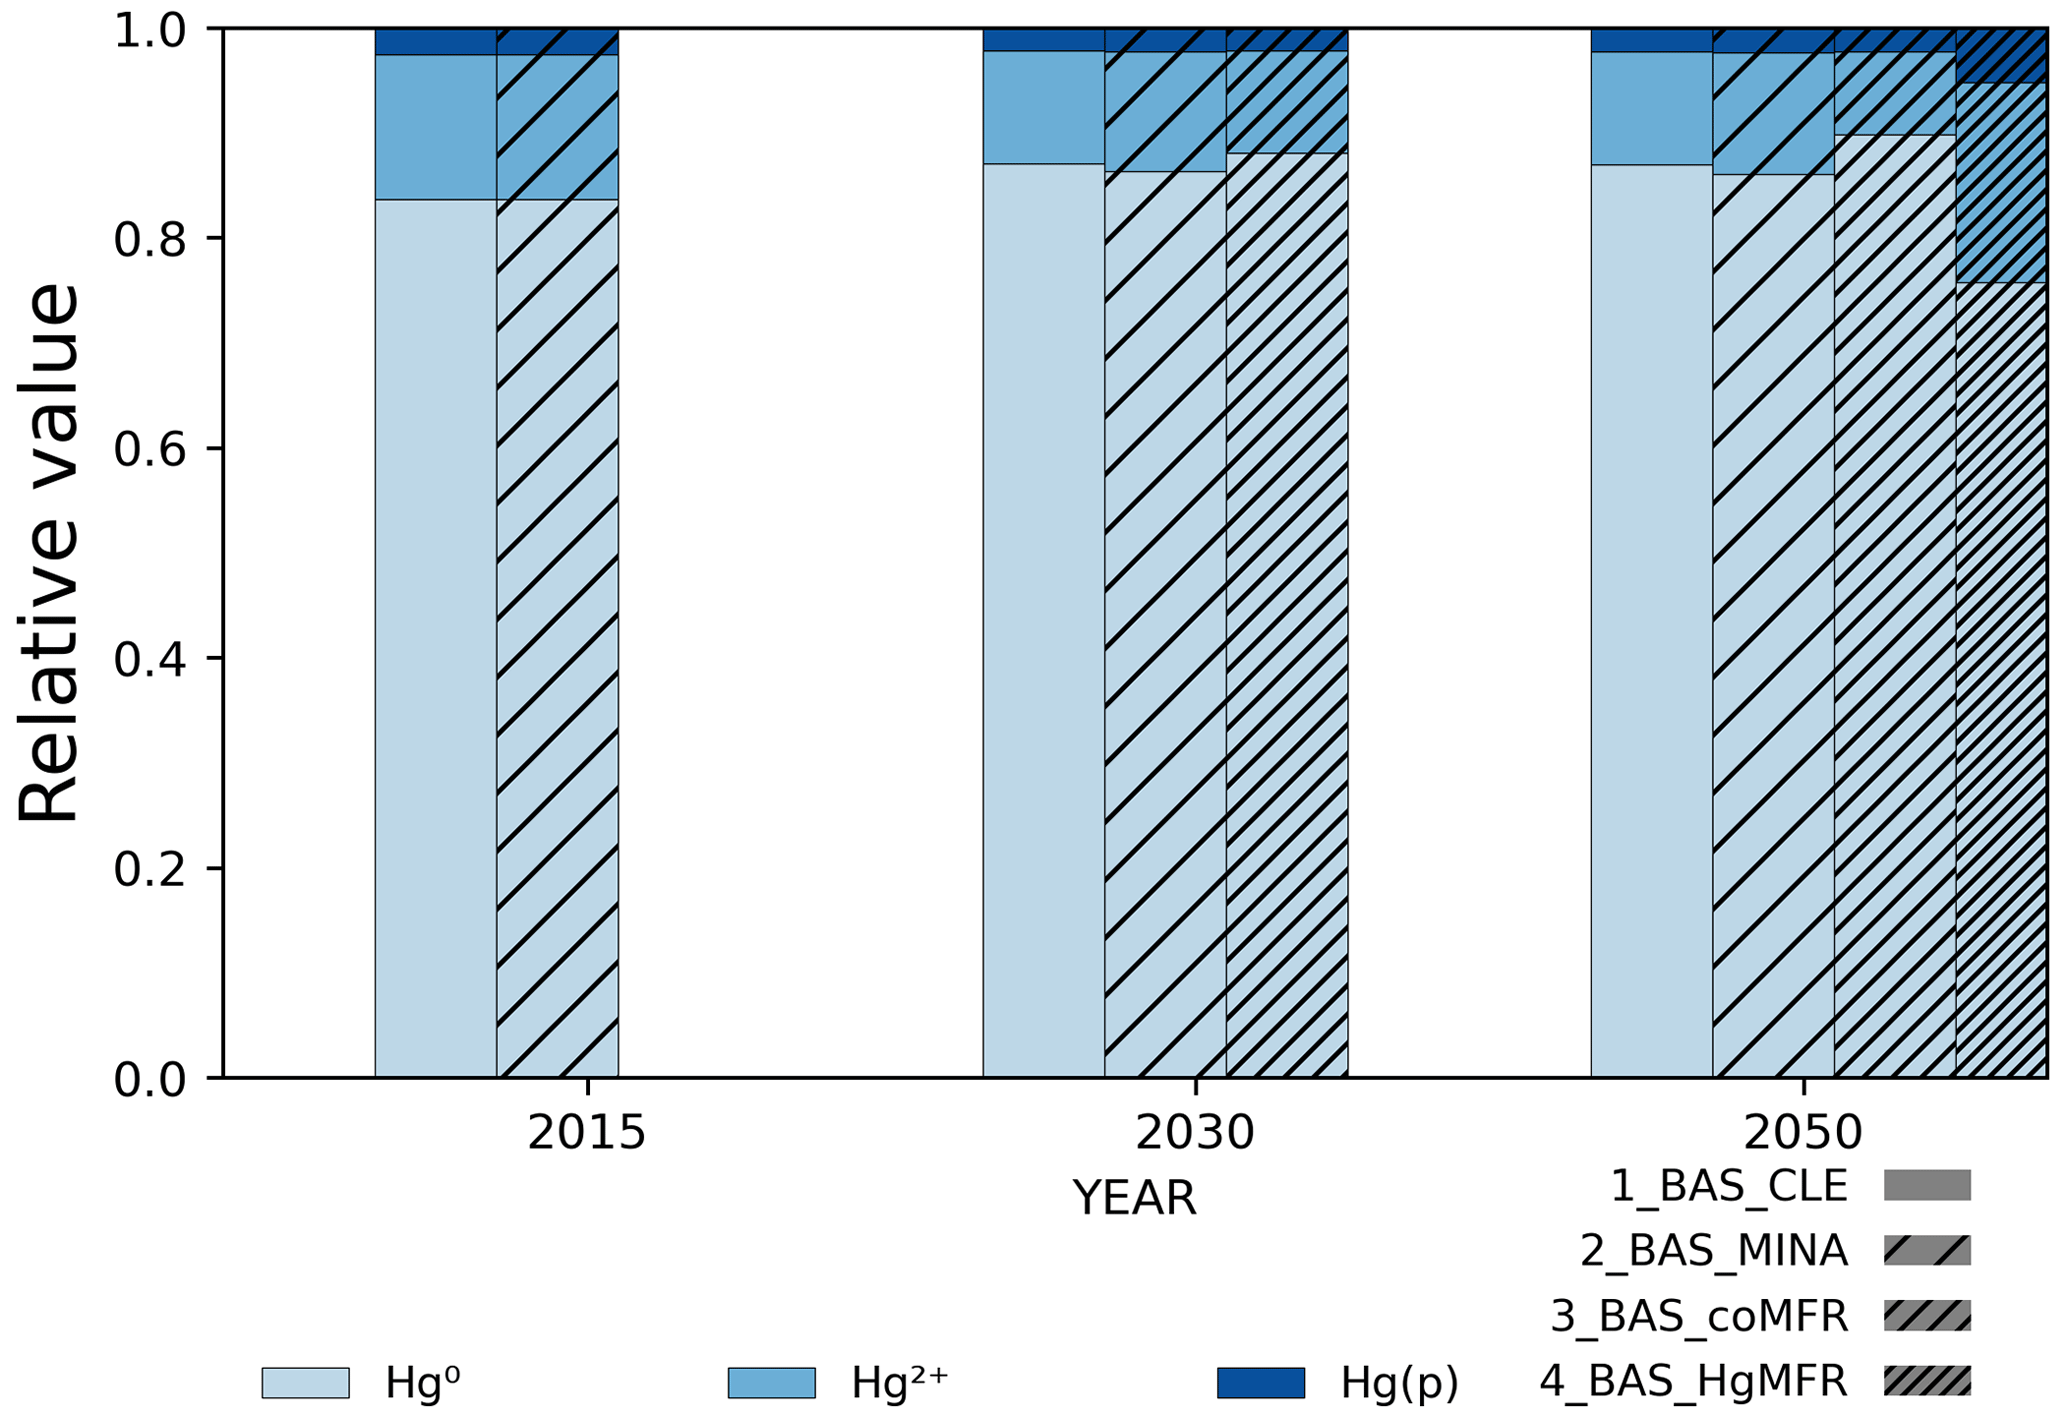
5.6 Speciation
The speciation of Hg emissions released to the atmosphere strongly influences their fate and spatial distribution (e.g., Selin, 2009). In this study, Hg0 dominates the speciation profile in all scenarios, making up between 76 % and 90 % of total emissions in the year 2050, as can be seen in Fig. 7. The scenarios with Hg-specific control measures (BAS_HgMFR, CLIM2_HgMFR) project the lowest proportions of Hg0 emissions with 76 % and 77 %, respectively, while the scenario BAS_coMFR, which leans most heavily on co-benefit control of Hg, displays the highest share of 90 % Hg0 emissions. This is due to the fact that the PM and SO2 controls implemented in GAINS tend to have higher removal efficiencies for HgII and Hgp, while the harder-to-abate Hg0 requires targeted approaches as implemented in the Hg-MFR scenarios. As ASGM emissions are assumed to be elemental Hg0 only, scenarios with higher ASGM abatement, such as BAS_MINA, have a lower share of Hg0 emissions than BAS_CLE (84 % and 87 %, respectively).
5.7 Further work
While the future scenarios are indicative of the abatement potential of different types of policy, there are some simplifications built into the current implementation of Hg within the GAINS model that warrant further attention and present areas for future work.
-
When considering future projections of non-ferrous metal smelting, the share between Cu, Pb and Zn and the proportions of primary vs. secondary production within the NFME category are fixed to the 2015 level, not dynamic. This is a simplification that can lead to an overestimation of Hg emissions from this sector, as copper production generates relatively lower Hg emissions compared to lead and zinc, but its share in the NFME category is projected to increase as it is a critical metal in the decarbonized economy.
-
Similarly, assumptions regarding Hg levels in the waste sectors have one fixed global unabated emission factor derived from total estimates of emissions from waste in 2015. These numbers are projected into the future using shares of different waste types as well as population and macroeconomic projections. However, again, the fixed emission factor might change as Hg policy reduces Hg levels in consumer products. Furthermore, the emission factors are likely to be heterogeneous on a regional scale. Better projections of Hg content in waste will increase the accuracy of waste emission estimates and enable better simulation of shifts in waste composition under assumptions of a circular economy.
-
The Hg-removal efficiency of NOx controls could be studied further and impacts of NOx control policy and their interplay with Hg-, PM- and SO2-control technologies could be included into the GAINS algorithm, thus making the calculation of removal efficiencies more detailed. This is especially relevant for the consideration of Hg speciation, as selective catalytic reduction technology for NOx removal from flue gas systems can be optimized to oxidize Hg0 to HgII, thus changing the share of species as well as increasing the efficiency of particle filters and flue gas desulfurization units for keeping mercury from the atmosphere (Usberti et al., 2016).
-
Projections of artisanal and small-scale gold mining into the future need to be improved as additional data and a better understanding of the ASGM drivers are emerging from the Minamata Convention process and the scientific community. Similarly, policy and technical measures for ASGM emission reduction might be refined to better reflect the complexity of this social phenomenon.
-
As is done for traditional pollutants, optimization of mitigation options would allow the calculation of cost-optimal achievement of reduction targets. Further, the GAINS model output could be used as input to dispersion modeling of Hg transport and deposition and the subsequent calculation of health and environmental impacts.
This study explores future anthropogenic mercury emissions through seven scenarios combining different energy and climate strategies (BAS, CLIM1, CLIM2) with policies to abate mercury as well as traditional pollutants such as PM and SO2 (CLE, MINA, co-MFR, Hg-MFR).
Of all studied sectors, ASGM offers the largest absolute Hg reduction potential, but also the largest uncertainty in the emission estimates, and in world regions with a significant ASGM contribution, all other emission sources fall within the uncertainty of ASGM emissions, making the studied scenarios (with the exception of Hg-MFR) virtually undistinguishable. While caution should be exercised when interpreting absolute emission values, valuable information can be gained from considering trends across years and between scenarios and sectors.
The baseline scenario (BAS_CLE) projects a slight increase of 5.7 % in global emissions in 2050 compared to 2015, despite a 32.6 % reduction of emissions from combustion, due to increased cement and other emissions including waste (+45.4 % and +21.4 %, respectively). The comparison of three climate scenarios under current legislation for clean air policy shows that the Hg emission reduction from the fossil fuel combustion sectors depends on the level of climate policy ambition prompting transformation in the energy system towards non-coal sources. Thus a range of 30 % (BAS_CLE) – 86 % (CLIM2_CLE) emission reduction from combustion sources is observed, causing a shift of emissions towards industrial processes, gold production and waste treatment. In all studied sectors except ASGM, emission increases can be dampened or reversed by conventional air-pollution-control measures. High levels of co-benefits resulting from PM and SO2 control are already induced by the current legislation, as comparison to the no control scenario demonstrates. Compared to the baseline case, a 17.6 % reduction in emissions can be achieved in 2050 solely through maximizing PM and SO2 control (BAS_coMFR). This strategy is especially effective for the waste sector (represented in OTHER), where emissions fall by 58.9 % compared to the baseline in the 2050. Drastic reduction of ASGM as set out in the Minamata Convention is only possible with an Hg-focused approach, as the MINA and Hg-MFR scenarios show. OTHER emissions (including waste) are also a large source of uncertainty in this study, and projections range between a 22 % increase and a 54 % decrease in 2050, depending on both climate and clean air policy.
The Minamata Convention covers roughly 90 % of the Hg emissions computed by the GAINS model. Annex D sources of the convention may be regulated differently by each convention party and the CLE, co-MFR and Hg-MFR scenarios combined with different climate policy delineate the option space of possible Hg reductions from these sources.
Overall, the findings emphasize the importance of the ASGM sector for total Hg emission reduction. Further, implementing targeted Hg-control policies in addition to stringent climate and air-pollution-abatement policies is vital to achieve significant reductions in Hg emissions.
| APCD | Air pollution control device |
| ASGM | Artisanal and small-scale gold mining |
| BAS | Baseline scenario |
| BAT | Best available technology |
| BEP | Best environmental practice |
| CLE | Current legislation |
| CLIM1 | Climate policy scenario |
| CLIM2 | Net zero scenario |
| co-MFR | co-benefits for Hg from PM and SO2 MFR |
| control | |
| EC | Emission control |
| EF | Emission factor |
| EU-IED | Industrial Emissions Directive of the European Union |
| GDP | Gross domestic product |
| GMA'18 | Global Mercury Assessment (AMAP/UN Environment 2019) |
| Hg-MFR | Maximum feasible reduction for Hg |
| MEX | Market exchange rate |
| MFR | Maximum feasible reduction |
| MCM | Minamata Convention on Mercury |
| Mina | Minamata policy scenario |
| NAPs | National Action Plans |
| NFME | Non-ferrous metals |
| NOC | No control scenario |
| PM | Particulate matter |
| PPP | Purchasing power parity |
| POP | Population |
| SRES | IPCC Special Report on Emission Scenarios |
| UEF | Unabated emission factor |
| VCM | Vinyl chloride monomer production |
| WEO | World Energy Outlook |
| WHO | World Health Organization |
Data accompanying this paper have been deposited and are also available under https://doi.org/10.5281/zenodo.10477377 (Brocza, 2024). The GAINS model can be accessed upon registration through the online interface (http://gains.iiasa.ac.at/models/gains_models4.html, IIASA, 2024).
The supplement related to this article is available online at: https://doi.org/10.5194/acp-24-7385-2024-supplement.
Conception of and study design – PR, FB. Concept and methodology – FB, PR, FB, FW. Implementation into the GAINS model – FB, RS. Data collection, uncertainty calculation, preparation of manuscript – FB. Manuscript review and supervision – PR, JMJ, FW.
The contact author has declared that none of the authors has any competing interests.
Publisher's note: Copernicus Publications remains neutral with regard to jurisdictional claims made in the text, published maps, institutional affiliations, or any other geographical representation in this paper. While Copernicus Publications makes every effort to include appropriate place names, the final responsibility lies with the authors.
Flora Maria Brocza thanks Zbigniew Klimont for welcoming and supporting the project, as well as for comments on the manuscript. Feedback from Francesco De Simone and an anonymous reviewer during review was gratefully received and taken on board, sharpening the overall discussion and the Introduction.
This research has been supported by the Research Councils UK (grant no. EP/L014912/1) and the International Institute for Applied Systems Analysis (Young Scientists Summer Program 2021).
This paper was edited by Qiang Zhang and reviewed by Francesco De Simone and one anonymous referee.
Aarhus Protocol: Protocol to the 1979 Convention on Long-Range Transboundary Air Pollution on Heavy Metals, CHAPTER XXVII – ENVIRONMENT, Aarhus, 24 June 1998, https://treaties.un.org/pages/ViewDetails.aspx?src=TREATY&mtdsg_no=XXVII-1-f&chapter=27&clang=_en (last access: 5 April 2024).
Amann, M., Bertok, I., Borken-Kleefeld, J., Cofala, J., Heyes, C., Höglund-Isaksson, L., Klimont, Z., Nguyen, B., Posch, M., Rafaj, P., Sandler, R., Schöpp, W., Wagner, F., and Winiwarter, W.: Cost-effective control of air quality and greenhouse gases in Europe: Modeling and policy applications, Environ. Modell. Softw., 26, 1489–1501, https://doi.org/10.1016/j.envsoft.2011.07.012, 2011.
Amann, M., Kiesewetter, G., Schoepp, W., Klimont, Z., Winiwarter, W., Cofala, J., Rafaj, P., Hoglund-Isaksson, L., Gomez Sanabria, A., Heyes, C., Purohit, P., Borken-Kleefeld, J., Wagner, F., Sander, R., Fagerli, H., Nyiri, A., Cozzi, L., and Pavarini, C.: Reducing global air pollution: The scope for further policy interventions, Philos. T. R. Soc. A, 378, 1–27, https://doi.org/10.1098/rsta.2019.0331, 2020.
AMAP/UN Environment: Technical Background Report for the Global Mercury Assessment 2013, Arctic Monitoring and Assessment Programme, Arctic Monitoring, Assessment Programme, Oslo, Norway/UNEP Chemicals Branch, Geneva, Switzerland, 2013.
AMAP/UN Environment: Technical Background Report to the Global Mercury Assessment 2018, Troms: Arctic Monitoring; Assessment Programme, Oslo, Norway/UN Environment Programme, Chemicals; Health Branch, https://www.unep.org/resources/publication/global-mercury-assessment-technical-background-report (last access: 18 June 2024), 2019.
Ancora, M. P., Zhang, L., Wang, S., Schreifels, J. J., and Hao, J.: Meeting Minamata: Cost-effective compliance options for atmospheric mercury control in Chinese coal-fired power plants, Energy Policy, 88, 485–494, https://doi.org/10.1016/j.enpol.2015.10.048, 2016.
Angot, H., Hoffman, N., Giang, A., Thackray, C. P., Hendricks, A. N., Urban, N. R., and Selin, N. E.: Global and Local Impacts of Delayed Mercury Mitigation Efforts, Environ. Sci. Technol., 52, 12968–12977, https://doi.org/10.1021/acs.est.8b04542, 2018.
Brocza, F. M.: Global scenarios of anthropogenic mercury emissions in GAINS, Zenodo [data set], https://doi.org/10.5281/zenodo.10477377, 2024.
Chakraborty, L. B., Qureshi, A., Vadenbo, C., and Hellweg, S.: Anthropogenic Mercury Flows in India and Impacts of Emission Controls, Environ. Sci. Technol., 47, 8105–8113, https://doi.org/10.1021/es401006k, 2013.
CLRTAP: Convention on long-range transboundary air pollution, CHAPTER XXVII – ENVIRONMENT, Geneva, 13 November 1979, https://treaties.un.org/Pages/ViewDetails.aspx?src=IND&mtdsg_no=XXVII-1&chapter=27&clang=_en (last access: 5 April 2024), 1979.
Commission Implementing Decision (EU) 2016/1032: Commission Implementing Decision (EU) 2016/1032 of 13 June 2016 establishing best available techniques (BAT) conclusions, under Directive 2010/75/EU of the European Parliament and of the Council, for the non-ferrous metals industries, https://eur-lex.europa.eu/legal-content/EN/ALL/?uri=CELEX:32016D1032 (last access: 18 June 2024), 2016.
Commission Implementing Decision (EU) 2021/2326: Commission Implementing Decision (EU) 2021/2326 of 30 November 2021, establishing best available techniques (BAT) conclusions, under Directive 2010/75/EU of the European Parliament and of the Council, for large combustion plants, https://eur-lex.europa.eu/legal-content/EN/ALL/?uri=CELEX:32021D2326 (last access: 18 June 2024), 2021.
CPCB: Emission Regulations. Part – Two, Comprehensive Industry Document Series: COINDS/18/1984-85, Central Pollution Control Board, Ministry of Environment & Forests, Government of India, Parivesh Bhawan, East Arjun Nagar, Delhi, https://cpcb.nic.in/openpdffile.php?id=UmVwb3J0RmlsZXMvTmV3SXRlbV8xNjRfRU1JU1NJT05fUkVHVUxBVElPTlNfUEFSVF8yLnBkZg== (last access: 7 September 2023), 1998.
Directive 2010/75/EU: Directive 2010/75/EU of the European Parliament and of the Council of 24 November 2010 on industrial emissions (integrated pollution prevention and control) (recast) (Text with EEA relevance), OJ L, http://data.europa.eu/eli/dir/2010/75/oj (last access: 18 June 2024), 2010.
Flanagan, D. M.: 2018 Minerals Yearbook – Copper (Advance Release), U. S. Geological Survey, https://pubs.usgs.gov/myb/vol1/2018/myb1-2018-copper.pdf (last access: 18 June 2024), 2022.
George, M. W.: 2018 Minerals Yearbook – Mercury (Advance Release), U. S. Geological Survey, https://pubs.usgs.gov/myb/vol1/2018/myb1-2018-mercury.pdf (last access: 18 June 2024), 2021.
Giang, A., Stokes, L. C., Streets, D. G., Corbitt, E. S., and Selin, N. E.: Impacts of the Minamata Convention on Mercury Emissions and Global Deposition from Coal-Fired Power Generation in Asia, Environ. Sci. Technol., 49, 5326–5335, https://doi.org/10.1021/acs.est.5b00074, 2015.
Glodek, A., Panasiuk, D., and Pacyna, J. M.: Mercury Emission from Anthropogenic Sources in Poland and Their Scenarios to the Year 2020, Water Air Soil Pollut., 213, 227–236, https://doi.org/10.1007/s11270-010-0380-6, 2010.
Gómez-Sanabria, A., Kiesewetter, G., Klimont, Z., Schoepp, W., and Haberl, H.: Potential for future reductions of global GHG and air pollutants from circular waste management systems, Nat. Commun., 13, 106, https://doi.org/10.1038/s41467-021-27624-7, 2022.
Granite, E. J., Pennline, H. W., and Hargis, R. A.: Novel Sorbents for Mercury Removal from Flue Gas, Ind. Eng. Chem. Res., 39, 1020–1029, https://doi.org/10.1021/ie990758v, 2000.
IEA: World Energy Outlook 2022, Paris, https://www.iea.org/reports/world-energy-outlook-2022 (last access: 18 June 2024), 2022.
International Institute of Applied Systems Analysis (IIASA): Greenhouse gas – Air pollution Interactions and Synergies (GAINS) model, http://gains.iiasa.ac.at/models/gains_models4.html last access: 18 June 2024.
Keane, S., Bernaudat, L., Davis, K. J., Stylo, M., Mutemeri, N., Singo, P., Twala, P., Mutemeri, I., Nakafeero, A., and Etui, I. D.: Mercury and artisanal and small-scale gold mining: Review of global use estimates and considerations for promoting mercury-free alternatives, Ambio, 833–852, https://doi.org/10.1007/s13280-023-01843-2, 2023.
Klochko, K..: 2017 Minerals Yearbook – Lead (Advance Release), U. S. Geological Survey, https://prd-wret.s3-us-west-2.amazonaws.com/assets/palladium/production/atoms/files/myb1-2015-manga.pdf (last access: 18 June 2024), 2021.
Krishnakumar, B., Niksa, S., Sloss, L., Jozewicz, W., and Futsaeter, G.: Process Optimization Guidance (POG and iPOG) for Mercury Emissions Control, Energ. Fuels, 26, 4624–4634, https://doi.org/10.1021/ef2018397, 2012.
Lei, H., Wuebbles, D. J., Liang, X.-Z., Tao, Z., Olsen, S., Artz, R., Ren, X., and Cohen, M.: Projections of atmospheric mercury levels and their effect on air quality in the United States, Atmos. Chem. Phys., 14, 783–795, https://doi.org/10.5194/acp-14-783-2014, 2014.
Li, J., Zhou, S., Wei, W., Qi, J., Li, Y., Chen, B., Zhang, N., Guan, D., Qian, H., Wu, X., Miao, J., Chen, L., Feng, K., and Liang, S.: China's retrofitting measures in coal-fired power plants bring significant mercury-related health benefits, One Earth, 3, 777–787, https://doi.org/10.1016/j.oneear.2020.11.012, 2020.
Li, N., Chen, W., Rafaj, P., Kiesewetter, G., Schöpp, W., Wang, H., Zhang, H., Krey, V., and Riahi, K.: Air Quality Improvement Co-benefits of Low-Carbon Pathways toward Well Below the 2 °C Climate Target in China, Environ. Sci. Technol., 53, 5576–5584, https://doi.org/10.1021/acs.est.8b06948, 2019.
Minamata Convention on Mercury (MCM): CHAPTER XXVII – ENVIRONMENT, Kumamoto, 10 October 2013, https://treaties.un.org/pages/ViewDetails.aspx?src=IND&mtdsg_no=XXVII-17&chapter=27&clang=_en (last access: 5 April 2024), 2013.
Mulvaney, K. M., Selin, N. E., Giang, A., Muntean, M., Li, C.-T., Zhang, D., Angot, H., Thackray, C. P., and Karplus, V. J.: Mercury Benefits of Climate Policy in China: Addressing the Paris Agreement and the Minamata Convention Simultaneously, Environ. Sci. Technol., 54, 1326–1335, https://doi.org/10.1021/acs.est.9b06741, 2020.
Nakicenovic, N., Swart, R., Alcamo, J., Davis, G., Vries, B. de, Fenhann, J., Gaffin, S., Gregory, K., and Gruebler, A.: Special Report on Emissions Scenarios. Working Group III of the Intergovernmental Panel on Climate Change (IPCC), Cambridge University Press, Cambridge, UK, 2000.
Pacyna, E. G., Pacyna, J. M., Fudala, J., Strzelecka-Jastrzab, E., Hlawiczka, S., and Panasiuk, D.: Mercury emissions to the atmosphere from anthropogenic sources in Europe in 2000 and their scenarios until 2020, Sci. Total Environ., 370, 147–156, https://doi.org/10.1016/j.scitotenv.2006.06.023, 2006.
Pacyna, J. M., Sundseth, K., Pacyna, E. G., Jozewicz, W., Munthe, J., Belhaj, M., and Aström, S.: An Assessment of Costs and Benefits Associated with Mercury Emission Reductions from Major Anthropogenic Sources, J. Air Waste Manage., 60, 302–315, https://doi.org/10.3155/1047-3289.60.3.302, 2010.
Pacyna, J. M., Travnikov, O., De Simone, F., Hedgecock, I. M., Sundseth, K., Pacyna, E. G., Steenhuisen, F., Pirrone, N., Munthe, J., and Kindbom, K.: Current and future levels of mercury atmospheric pollution on a global scale, Atmos. Chem. Phys., 16, 12495–12511, https://doi.org/10.5194/acp-16-12495-2016, 2016.
Pavlish, J. H., Sondreal, E. A., Mann, M. D., Olson, E. S., Galbreath, K. C., Laudal, D. L., and Benson, S. A.: Status review of mercury control options for coal-fired power plants, Fuel Process. Technol., 82, 89–165, https://doi.org/10.1016/s0378-3820(03)00059-6, 2003.
Rafaj, P., Bertok, I., Cofala, J., and Schöpp, W.: Scenarios of global mercury emissions from anthropogenic sources, Atmos. Environ., 79, 472–479, https://doi.org/10.1016/j.atmosenv.2013.06.042, 2013.
Rafaj, P., Cofala, J., Kuenen, J., Wyrwa, A., and Zyśk, J.: Benefits of European Climate Policies for Mercury Air Pollution, Atmosphere, 5, 45–59, https://doi.org/10.3390/atmos5010045, 2014.
Rafaj, P., Kiesewetter, G., Gül, T., Schöpp, W., Cofala, J., Klimont, Z., Purohit, P., Heyes, C., Amann, M., Borken-Kleefeld, J., and Cozzi, L.: Outlook for clean air in the context of sustainable development goals, Global Environ. Chang., 53, 1–11, https://doi.org/10.1016/j.gloenvcha.2018.08.008, 2018.
Selin, N. E.: Global Biogeochemical Cycling of Mercury: A Review, Annu. Rev. Env. Resour., 34, 43–63, https://doi.org/10.1146/annurev.environ.051308.084314, 2009.
Selin, N. E.: Global change and mercury cycling: Challenges for implementing a global mercury treaty, Environmental Toxicology and Chemistry, 33, 1202–1210, https://doi.org/10.1002/etc.2374, 2014.
Selin, N. E. and Selin, H.: Global Politics of Mercury Pollution: The Need for Multi-Scale Governance, Review of European Community & International Environmental Law, 15, 258–269, https://doi.org/10.1111/j.1467-9388.2006.00529.x, 2006.
Selin, H. and Selin, N. E.: Human Health: Mercury's Caduceus, in: Mercury Stories: Understanding Sustainability through a Volatile Element, The MIT Press, https://doi.org/10.7551/mitpress/11856.003.0007, 77–114, 2020.
Sheaffer, K. N.: 2018 Minerals Yearbook – Gold (Advance Release), U. S. Geological Survey, https://pubs.usgs.gov/myb/vol1/2018/myb1-2018-gold.pdf (last access: 18 June 2024), 2022.
Streets, D. G., Zhang, Q., and Wu, Y.: Projections of Global Mercury Emissions in 2050, Environ. Sci. Technol., 43, 2983–2988, https://doi.org/10.1021/es802474j, 2009.
Tolcin, A. C.: 2018 Minerals Yearbook – Zinc (Advance Release), U. S. Geological Survey, https://pubs.usgs.gov/myb/vol1/2018/myb1-2018-zinc.pdf (last access: 18 June 2024). 2022.
UNEP: Guidance on best available techniques and best environmental practices, Geneva, Secretariat of the Minamta Convention on Mercury, Chemicals and Health Branch, https://minamataconvention.org/sites/default/files/2021-06/BAT_BEP_E_interractif.pdf (last access: 18 June 2024), 2019.
Usberti, N., Alcove Clave, S., Nash, M., and Beretta, A.: Kinetics of Hg0 oxidation over a V2O5/MoO3/TiO2 catalyst: Experimental and modelling study under DeNOX inactive conditions, Appl. Catal. B-Environ., 193, 121–132, https://doi.org/10.1016/j.apcatb.2016.03.071, 2016.
Wagner, F., Heyes, C., Klimont, Z., and Schoepp W.: The Gains Optimization Module: Identifying Cost-Effective Measures for Improving Air Quality and Short-Term Climate Forcing, IIASA Interim Report, IR-13-001, IIASA, Laxenburg, Austria, https://pure.iiasa.ac.at/id/eprint/10755/ (last access: 18 June 2024), 2013.
Wang, F., Wang, S., Zhang, L., Yang, H., Gao, W., Wu, Q., and Hao, J.: Mercury mass flow in iron and steel production process and its implications for mercury emission control, J. Environ. Sci., 43, 293–301, https://doi.org/10.1016/j.jes.2015.07.019, 2016.
World Health Organization: Chemicals, in: Compendium of WHO and other UN guidance on health and environment (WHO/HEP/ECH/EHD/21.02), World Health Organization, Geneva, 2021.
Wu, Q., Li, G., Wang, S., Liu, K., and Hao, J.: Mitigation Options of Atmospheric Hg Emissions in China, Environ. Sci. Technol., 52, 12368–12375, https://doi.org/10.1021/acs.est.8b03702, 2018.
Zhang, Y., Song, Z., Huang, S., Zhang, P., Peng, Y., Wu, P., Gu, J., Dutkiewicz, S., Zhang, H., Wu, S., Wang, F., Chen, L., Wang, S., and Li, P.: Global health effects of future atmospheric mercury emissions, Nat. Commun., 12, 3035, https://doi.org/10.1038/s41467-021-23391-7, 2021.
Zhao, Y., Zhong, H., Zhang, J., and Nielsen, C. P.: Evaluating the effects of China's pollution controls on inter-annual trends and uncertainties of atmospheric mercury emissions, Atmos. Chem. Phys., 15, 4317–4337, https://doi.org/10.5194/acp-15-4317-2015, 2015.
The Minamata Convention further defines ASGM as “gold mining conducted by individual miners or small enterprises with limited capital investment and production” (Minamata Convention on Mercury, 2013).
The full list of activities, sectors and technologies in GAINS can be found in the GAINS glossary: https://gains.iiasa.ac.at/gains/GOD/abbreviations.info (last access: 18 June 2024).
Co-benefits arising from NOx controls were not considered in this exercise because when combined with PM- and SO2-abatement techniques, they have been reported to bring Hg-removal efficiency improvements of only a few percent lower than the standard deviation of the technology categories used in this study (see, e.g., Li et al., 2020, Table S10) or the iPOG tool at reference conditions (Krishnakumar et al., 2012).
“Hg-specific sector” means a sector which, in the GAINS model, is only associated with Hg emissions (e.g., no PM, SO2 or other emissions).
It is important to note that at the time of writing, not all ASGM-producing countries have published NAPs, meaning that not all ASGM reduction targets might be fully represented in this scenario as of yet and that Hg reductions in this sector will likely be larger than estimated in this work once all NAPs are enforced.
To further reduce Hg in NFME, the removal efficiency of acid plants would need to be increased. The GAINS removal efficiency of acid plants is significantly lower than their assumed removal efficiency in GMA'18. This is due to the speciated emission-accounting approach. The removal efficiency of PR_AP for Hg0 is 91 % (see Table S5 and sources therein). As 80 % of the emissions are assumed to be Hg0, this leads to an overall removal efficiency of 92.7 % as opposed to 99.98 % in the GMA'18. Better data on emission speciation would be needed for a more exact estimate for this sector, and there might be an overestimation of European NFME emissions in GAINS.
It is noted that there are also emission sources which the MCM covers that are not explicitly represented in GAINS. This concerns emissions from acetaldehyde production, other chemicals' and polymers' production, incineration of medical waste, hazardous waste and sewage sludge.