the Creative Commons Attribution 4.0 License.
the Creative Commons Attribution 4.0 License.
 | 25 Jun 2024
Impact of Asian aerosols on the summer monsoon strongly modulated by regional precipitation biases
Massimo A. Bollasina
Laura J. Wilcox
Reliable attribution of Asian summer monsoon variations to aerosol forcing is critical to reducing uncertainties in future projections of regional water availability, which is of utmost importance for risk management and adaptation planning in this densely populated region. Yet, simulating the monsoon remains a challenge for climate models that suffer from long-standing biases, undermining their reliability in attributing anthropogenically forced changes. We analyze a suite of climate model experiments to identify a link between model biases and monsoon responses to Asian aerosols and associated physical mechanisms, including the role of large-scale circulation changes. The aerosol impact on monsoon precipitation and circulation is strongly influenced by a model's ability to simulate the spatio-temporal variability in the climatological monsoon winds, clouds, and precipitation across Asia, which modulates the magnitude and efficacy of aerosol–cloud–precipitation interactions, an important component of the total aerosol response. There is a strong interplay between South Asia and East Asia monsoon precipitation biases and their relative predominance in driving the overall monsoon response. We found a striking contrast between the early- and late-summer aerosol-driven changes ascribable to opposite signs and seasonal evolution of the biases in the two regions. A realistic simulation of the evolution of the large-scale atmospheric circulation is crucial to realize the full extent of the aerosol impact over Asia. These findings provide important implications for better understanding and constraining the diversity and inconsistencies of model responses to aerosol changes over Asia in historical simulations and future projections.
- Article
(24101 KB) - Full-text XML
-
Supplement
(7184 KB) - BibTeX
- EndNote


The Asian summer monsoon is one of the key components of the global atmospheric circulation, providing critical water resources to more than 60 % of the world's population. Because of this reliance, even small changes in the spatio-temporal characteristics of the monsoon represent a significant hurdle for the local population. Yet, despite considerable efforts, simulating the monsoon remains a long-standing challenge for climate models as some biases have persisted for decades, such as deficient rainfall over central India and excess wetting over eastern China (Sperber et al., 2013; Liu et al., 2021). The existence of these large and widespread biases not only decreases confidence in the modeled monsoon and associated physical mechanisms (Yang et al., 2019; Jiang et al., 2020; Rajendran et al., 2022; Liu et al., 2022) but also represents a major cause of the large inter-model spread in historical monsoon evolution (Zhou et al., 2019; Guilbert et al., 2023). Moreover, these biases are likely to hinder reliable monsoon projections with critical implications for water management and planning across Asia and subsequent impacts on agriculture and economy (Zhou et al., 2019; Cao et al., 2020; Wang et al., 2020; Pillai et al., 2021). In particular, model biases introduce large uncertainties into our ability to separate externally forced from internally generated monsoon variability, preventing robust attribution to specific drivers, including the extent to which recent and near-future trends of temperature and precipitation over East Asia are driven by anthropogenic aerosols (Wilcox et al., 2015; Dai et al., 2022).
Anthropogenic aerosols represent the largest uncertainty in quantifying the total anthropogenic forcing on climate since the pre-industrial era (Andrews and Forster, 2020). Aerosols exert an overall cooling effect on climate by modulating solar radiation via absorption and scattering, as well as by acting as cloud condensation and ice nuclei, thus altering cloud albedo, lifetime, and precipitation processes (Boucher et al., 2013). Asia has the largest present-day anthropogenic aerosol burden as rapid urbanization and economic development have drastically increased aerosol emissions and loading since the 1950s (J. Lin et al., 2016). China has recently implemented strong pollution control policies, which has substantially reduced aerosol emissions since 2013 (e.g., 59 % for sulfur dioxide and 28 % for black carbon during 2013–2017; Zheng et al., 2018). Yet, Asia will still experience the highest aerosol loading in the world over the coming decades, as projected by the different future socioeconomic pathways used in the Coupled Model Intercomparison Project Phase 6 (Lund et al., 2019).
Aerosols have been found to play a key role in driving the observed decreasing trend in Indian summer rainfall (Chung and Ramanathan, 2006; Lau and Kim, 2010; Bollasina et al., 2011; Guo et al., 2015) and the southern-flood–northern-drought (SFND) pattern over East Asia (Menon et al., 2002a; Guo et al., 2013; Song et al., 2014; Yu et al., 2016; Tian et al., 2018) during the late 20th century. Studies that have separately investigated the impact of regional (Asian) and remote (outside Asia) emissions have found the former to be fundamental to explaining the observed monsoon changes but with the latter also providing an important contribution (Cowan and Cai, 2011; Ganguly et al., 2012; Bollasina et al., 2014; Dong et al., 2016). In particular, either South Asian or East Asian aerosols can separately exert a strong influence on both the South Asian and the East Asian monsoons, with contrasting, if not opposite, changes as well as strong non-linear interactions between the responses to individual emission sources (Singh et al., 2019; Sherman et al., 2021; Herbert et al., 2022; Liu et al., 2023).
At a larger scale, the Asian monsoon progression is linked to the evolution of semi-permanent features of the tropical and extratropical atmospheric circulation, such as the western Pacific subtropical high (Zhang et al., 2005) and the Mascarene high in the southern Indian Ocean (Vidya et al., 2020). The monsoon and the large-scale circulation are affected by anthropogenic aerosol forcing, resulting in complex and intertwined interactions between externally and internally forced variability (Deser et al., 2012; Huang et al., 2020a; Zha et al., 2022). Understanding the interplay between the Asian monsoon and the large-scale circulation outside Asia and the extent to which concurrent changes in the large-scale circulation modulate the monsoon response to regional aerosol changes is thus beneficial to achieving better monsoon simulations and more robust projections (An et al., 2012; Liu et al., 2021).
One approach that has provided valuable insights into the mechanisms of aerosol–monsoon interactions is the decomposition of the response into two complementary components: a fast response involving atmospheric and land surface adjustments but fixed sea surface temperature (SST), acting on a short timescale (a few years) and a slow response scaling with SST changes (Samset et al., 2016; Li et al., 2020; Zhang et al., 2021). The fast and slow components over and around Asia show similar features under global and regional (Asian only) aerosol forcing. In the case of sulfate aerosols, the total response over Asia and downwind Pacific regions shows substantial precipitation decreases, with the fast component featuring negative anomalies over land and positive ones over the adjoining ocean. While the monsoon is a fully atmosphere–ocean coupled system, recent studies have found rapid adjustments to be of fundamental importance in explaining inter-model differences in the response to aerosols (Fläschner et al., 2016; Liu et al., 2018; Zanis et al., 2020).
Building on the above considerations, this study aims to identify a link between model biases and monsoon response to Asian aerosols on the one hand and the underpinning physical mechanism on the other, including the role of large-scale circulation changes outside Asia and SST changes. The rest of the paper is organized as follows: details of model experiments and analysis methods are provided in Sect. 2. Section 3 examines the influence of precipitation biases on the climate response to Asian aerosol perturbations and describes the underlying mechanism. Discussion and conclusions follow in Sects. 4 and 5, respectively.
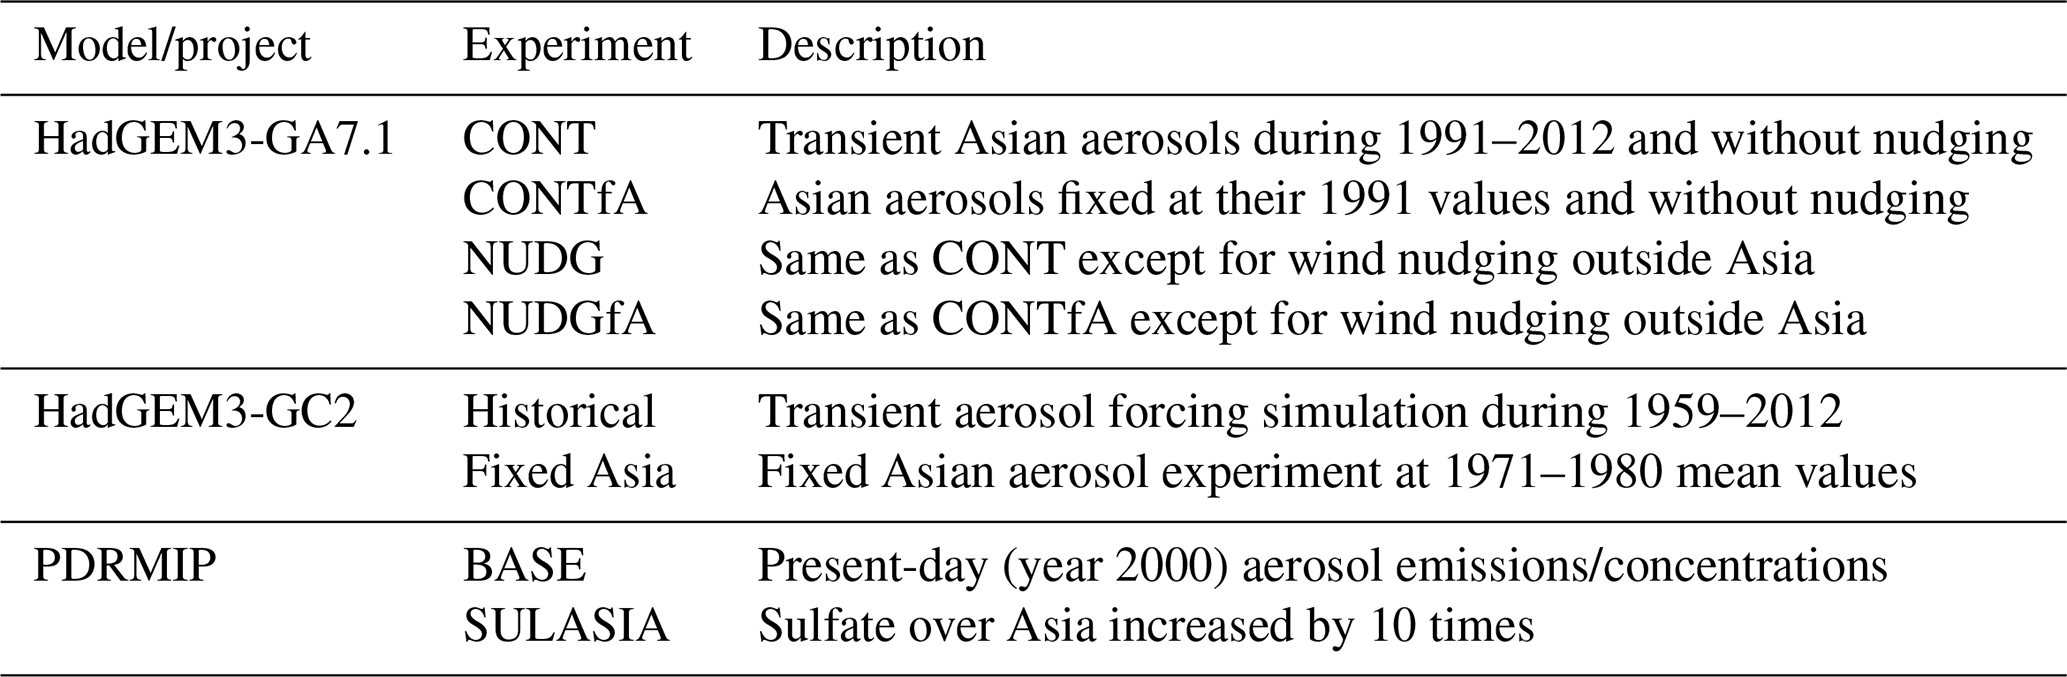
Table 1Model simulations used in this study. For the HadGEM3-GA7.1 simulations, the Asia domain (10–45° N, 60–125° E) is enclosed by the purple box in Fig. 2c. Note wind nudging is applied only above the planetary boundary layer (model level 12, or approximately 850 hPa). The years 2003–2012 are used for analysis. The PDRMIP experiments include both fixed-SST (15 years) and coupled (100 years) model configurations. The experiment details of HadGEM3-GC2 and PDRMIP are documented in Wilcox et al. (2019) and Samset et al. (2016), respectively.
The primary dataset analyzed consists of simulations conducted with the Met Office Unified Model (MetUM) HadGEM3-Global Atmosphere version 7.1 (GA7.1) at N96 horizontal resolution (1.875° × 1.25°) and with 85 vertical levels extending up to 85 km (Walters et al., 2019). The Global Model of Aerosol Processes (GLOMAP) modal aerosol scheme is used to represent aerosol processes, including a representation of both aerosol–radiation and aerosol–cloud interactions (see Mann et al., 2010, and Bellouin et al., 2013, for more details). GA7.1 was used as the atmospheric component of the climate model participating in CMIP6, which reduces the overly negative global-mean anthropogenic aerosol effective radiative forcing in the previous model version, GA7.0 (Walters et al., 2019). A single-moment microphysics is used based on Wilson and Ballard (1999), with extensive improvement of the warm-rain scheme (Boutle et al., 2014a, b). To account for aerosol–cloud interactions, the cloud droplet number concentration is calculated using prognostic aerosol concentration according to the UK Chemistry and Aerosol (UKCA)-Activate scheme (West et al., 2014). The atmospheric boundary layer and convection schemes are based on Lock et al. (2000) and Gregory and Rowntree (1990), respectively. A detailed description of the HadGEM3-GA7.1 physics is provided by Walters et al. (2019).
A set of four experiments (see Table 1) is performed with HadGEM3-GA7.1 for the period December 1991 to December 2012 with prescribed daily observed SST from the European Centre for Medium-Range Weather Forecasts (ECMWF) Interim Reanalysis (ERA-I; Dee et al., 2011). The reference experiment (CONT) is driven by monthly varying historical emissions of anthropogenic aerosols and precursors following CMIP6 (Hoesly et al., 2018). CONTfA is identical to CONT except for having anthropogenic aerosol emissions of sulfur dioxide (SO2), black carbon, organic carbon, and biomass burning emissions fixed at the year 1991 over Asia (10–45° N, 60–125° E; the purple box in Fig. 2c). The difference between CONT and CONTfA represents the fast response to changes in Asian anthropogenic aerosols.
To separate regional and remote circulation adjustments to aerosol forcing, dynamical nudging (also known as Newtonian relaxation) is applied by constraining horizontal winds towards ERA-I (Kooperman et al., 2012; Liu et al., 2021). We conducted another pair of experiments (NUDG and NUDGfA, respectively) that were identical to CONT and CONTfA except for nudging horizontal winds to ERA-I outside Asia (the region outlined in Fig. 2c). The difference, NUDG minus NUDGfA, represents the local response to Asian aerosols in the absence of concurrent changes in the large-scale atmospheric circulation outside Asia. Nudging is only applied above the planetary boundary layer (model level 12, or approximately 850 hPa) so that low-level winds can adapt to surface conditions (e.g., different topography with respect to ERA-I; Liu et al., 2021). Comparing the differences between the free-running experiments (i.e., CONT − CONTfA) and the nudged runs (i.e., NUDG − NUDGfA) enables us to determine the extent to which simultaneous adjustments in the large-scale atmospheric circulation outside the region modulate the Asian monsoon response to changes in regional anthropogenic aerosols.
To account for the role of internal variability, all experiments consist of three ensemble members initialized from different atmospheric conditions. Only the last 10 years of each experiment is analyzed (i.e., 2003–2012), when Asian aerosol emissions are at their maximum (Fig. 2a). The results are however largely unchanged if a longer analysis window is chosen (e.g., 15-year averages) as anomalies display similar large-scale features, albeit of slightly smaller magnitude (not shown). The statistical significance of ensemble-mean differences relative to model internal variability is estimated using a 35-year HadGEM3-GA7.1 experiment where all forcing factors are set at pre-industrial (1850) levels. After splitting the output from this simulation into 26 overlapping 10-year segments, the probability distribution of the unforced 10-year means for a three-member ensemble is computed by randomly selecting three of these segments without repetition, for a total of 2600 samples. In turn, the probability distribution of the 10-year ensemble-mean differences is calculated by randomly selecting 2 of the 2600 samples a total of 10 000 times (e.g., Efron and Tibshirani, 1993), and the 90 % confidence interval is estimated as the range in which 90 % of the samples fall.
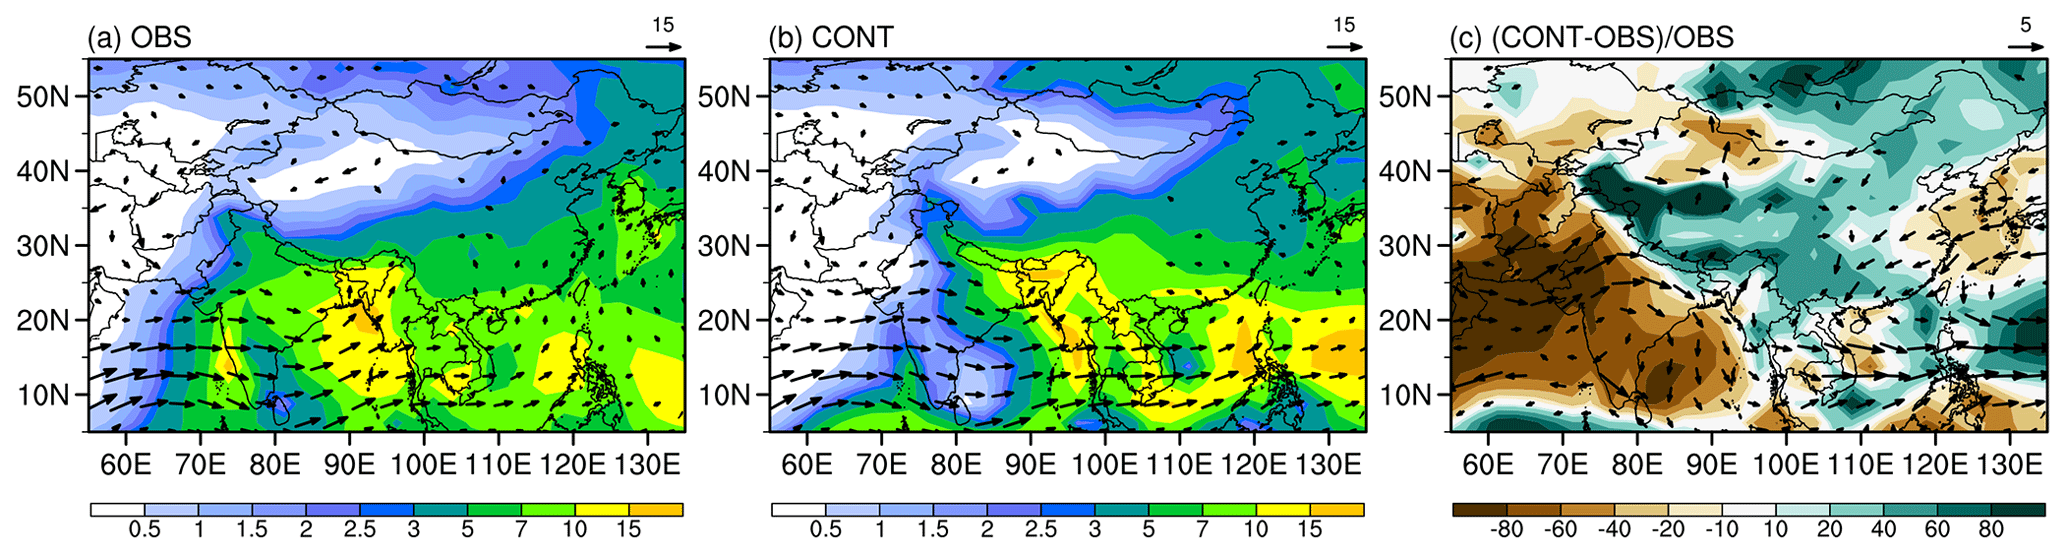
Figure 1June–September average precipitation (mm d−1) and 850 hPa wind (m s−1) for the observations (OBS; GPCP and CMAP average for precipitation, ERA5 for wind), the control simulation (CONT), and their differences (precipitation differences in percentage and wind differences in absolute values) during the period 1993 to 2012.
Data from the Precipitation Driver Response Model Intercomparison Project (PDRMIP; Samset et al., 2016) are also utilized to corroborate our findings from a multi-model perspective. Two experiments are considered (Table 1): the baseline simulation forced by present-day (year 2000) levels in aerosols and greenhouse gases emissions/concentrations and one identical to the baseline run except for having a 10-fold increase in sulfate aerosol emissions/concentrations over Asia (10–50° N, 60–140° E; SULASIA). The geographical distribution of the baseline sulfate burden in the PDRMIP ensemble (Myhre et al., 2017) is very close to that in the CONT − CONTfA difference (Fig. 2b) over Asia, with the latter also showing an approximately 10-fold increase in SO2 emissions since the early 1990s (Fig. 2a), which ensures a sound comparison between the different simulations. The PDRMIP experiments were run for 15 years with fixed present-day SSTs and for 100 years in coupled mode (Liu et al., 2018). The response to Asian aerosols is identified as the difference between the perturbed and baseline simulation averaged over the years 6–15 for both fixed-SST and coupled simulations. In the case of fixed SST, this choice is consistent with previous studies (Samset et al., 2016; Myhre et al., 2017) and accounts for the adjustment time in response to the step change in emissions from the baseline simulation. We also chose the same averaging period for the coupled experiments for consistency with the nature of the transient response to time-evolving emissions examined in this study. In this sense, the coupled experiments allow us to ascertain whether the findings are sensitive to “fast” ocean-mediated responses (i.e., air–sea interactions), thus excluding the contribution brought about by slow oceanic adjustments pertaining to a fully equilibrated atmosphere–ocean climate system.
We also analyze the transient historical simulations with the MetUM HadGEM3-GC2 coupled model described in Wilcox et al. (2019). These consist of four-member ensemble runs with all historical forcings and a companion experiment in which aerosols over Asia (5–47.5° N, 67.5–145° E) are fixed at their 1971–1980 mean levels (Table 1). The difference between the two ensemble means across two 10-year periods (i.e., 1999–2008 and 1971–1980) is interpreted as the total transient response to Asian aerosol changes. We choose the later period 1999–2008 when aerosol emission differences are maximized (see Fig. 1 in Wilcox et al., 2019) and are at a comparable magnitude to our HadGEM3-GA7.1 simulations. These experiments allow us to ascertain the consistency between uncoupled and coupled transient settings.
In light of the strong seasonality of the precipitation response to aerosol changes and the partial compensation between the monsoon response in the early and late summer (Bollasina et al., 2013), we examine monthly precipitation and circulation changes in addition to the June–September seasonal means. The simulated climatological precipitation and circulation are evaluated against the arithmetic mean of the Climate Prediction Center Merged Analysis of Precipitation (CMAP; Xie and Arkin, 1997) and the Global Precipitation Climatology Project (GPCP) version 2 (Adler et al., 2003) precipitation observations (Wang et al., 2014) and the ECMWF Reanalysis v5 (ERA5; Hersbach et al., 2020) sea-level pressure and 850 hPa winds for the period 1981–2010, respectively. These datasets are also used to provide a broader interpretation of the aerosol-driven simulated changes in the context of recent observed trends.
3.1 Model evaluation
Figure 1 compares the 1993–2012 June–September average precipitation and 850 hPa winds in the control simulation to observations (GPCP and CMAP average for precipitation, ERA5 for wind). The model reproduces the broad characteristics of the observed rainfall and circulation patterns (pattern correlation of 0.80 for precipitation, which is significant at the 99.9 % confidence level). The difference panel indicates that the model underestimates the rainfall amount by 60 % over India and the Bay of Bengal due to a weaker southwesterly monsoon flow. To the east, there are wet biases ranging from 20 % to 60 % of the observed climatology over southwestern China and even up to 80 % over the northwestern subtropical Pacific, associated with enhanced cyclonic flow. Note that this bias pattern is common across CMIP6 models, although the magnitude of the anomalies varies from model to model (Wilcox et al., 2020), and is also consistent with that in the historical simulations of the CMIP6 Met Office model (Rajendran et al., 2022). A thorough discussion of the model bias and its linkage to regional and remote circulation can be found in Liu et al. (2021).
3.2 Monsoon response to Asian aerosols in HadGEM3-GA7.1
3.2.1 Seasonal-mean changes in Asian aerosols
The temporal evolution of the seasonal-mean differences in aerosol emissions and total aerosol optical depth (AOD) between CONT and CONTfA averaged over Asia (the area enclosed by the purple box in Fig. 2c) is displayed in Fig. 2a. The rapid rise in AOD after 2002 is mostly due to the increase in SO2 emissions as the similarity between the respective time series indicates. Black carbon (BC) and organic carbon (OC) emissions exhibit a comparatively minor increasing trend, while biomass burning emissions show negligible changes. The spatial distribution of changes in the column-integrated sulfate burden closely resembles that of emission changes and is characterized by large increases over eastern China and northern India (Fig. 2b). The pattern of the seasonal AOD change follows that of sulfate loading, further indicating the primary contribution of SO2 emissions to the total aerosol amounts over the region. Positive AOD anomalies also extend eastward from China to the northwestern Pacific, reflecting atmospheric transport of aerosols by climatological southwesterly winds. Seasonal-mean aerosol changes across Asia are thus dominated by sulfate aerosols, which is consistent with longer-term trends since the 1950s (Lund et al., 2019) and hints at a predominant role of SO2 emissions in driving the response discussed below.
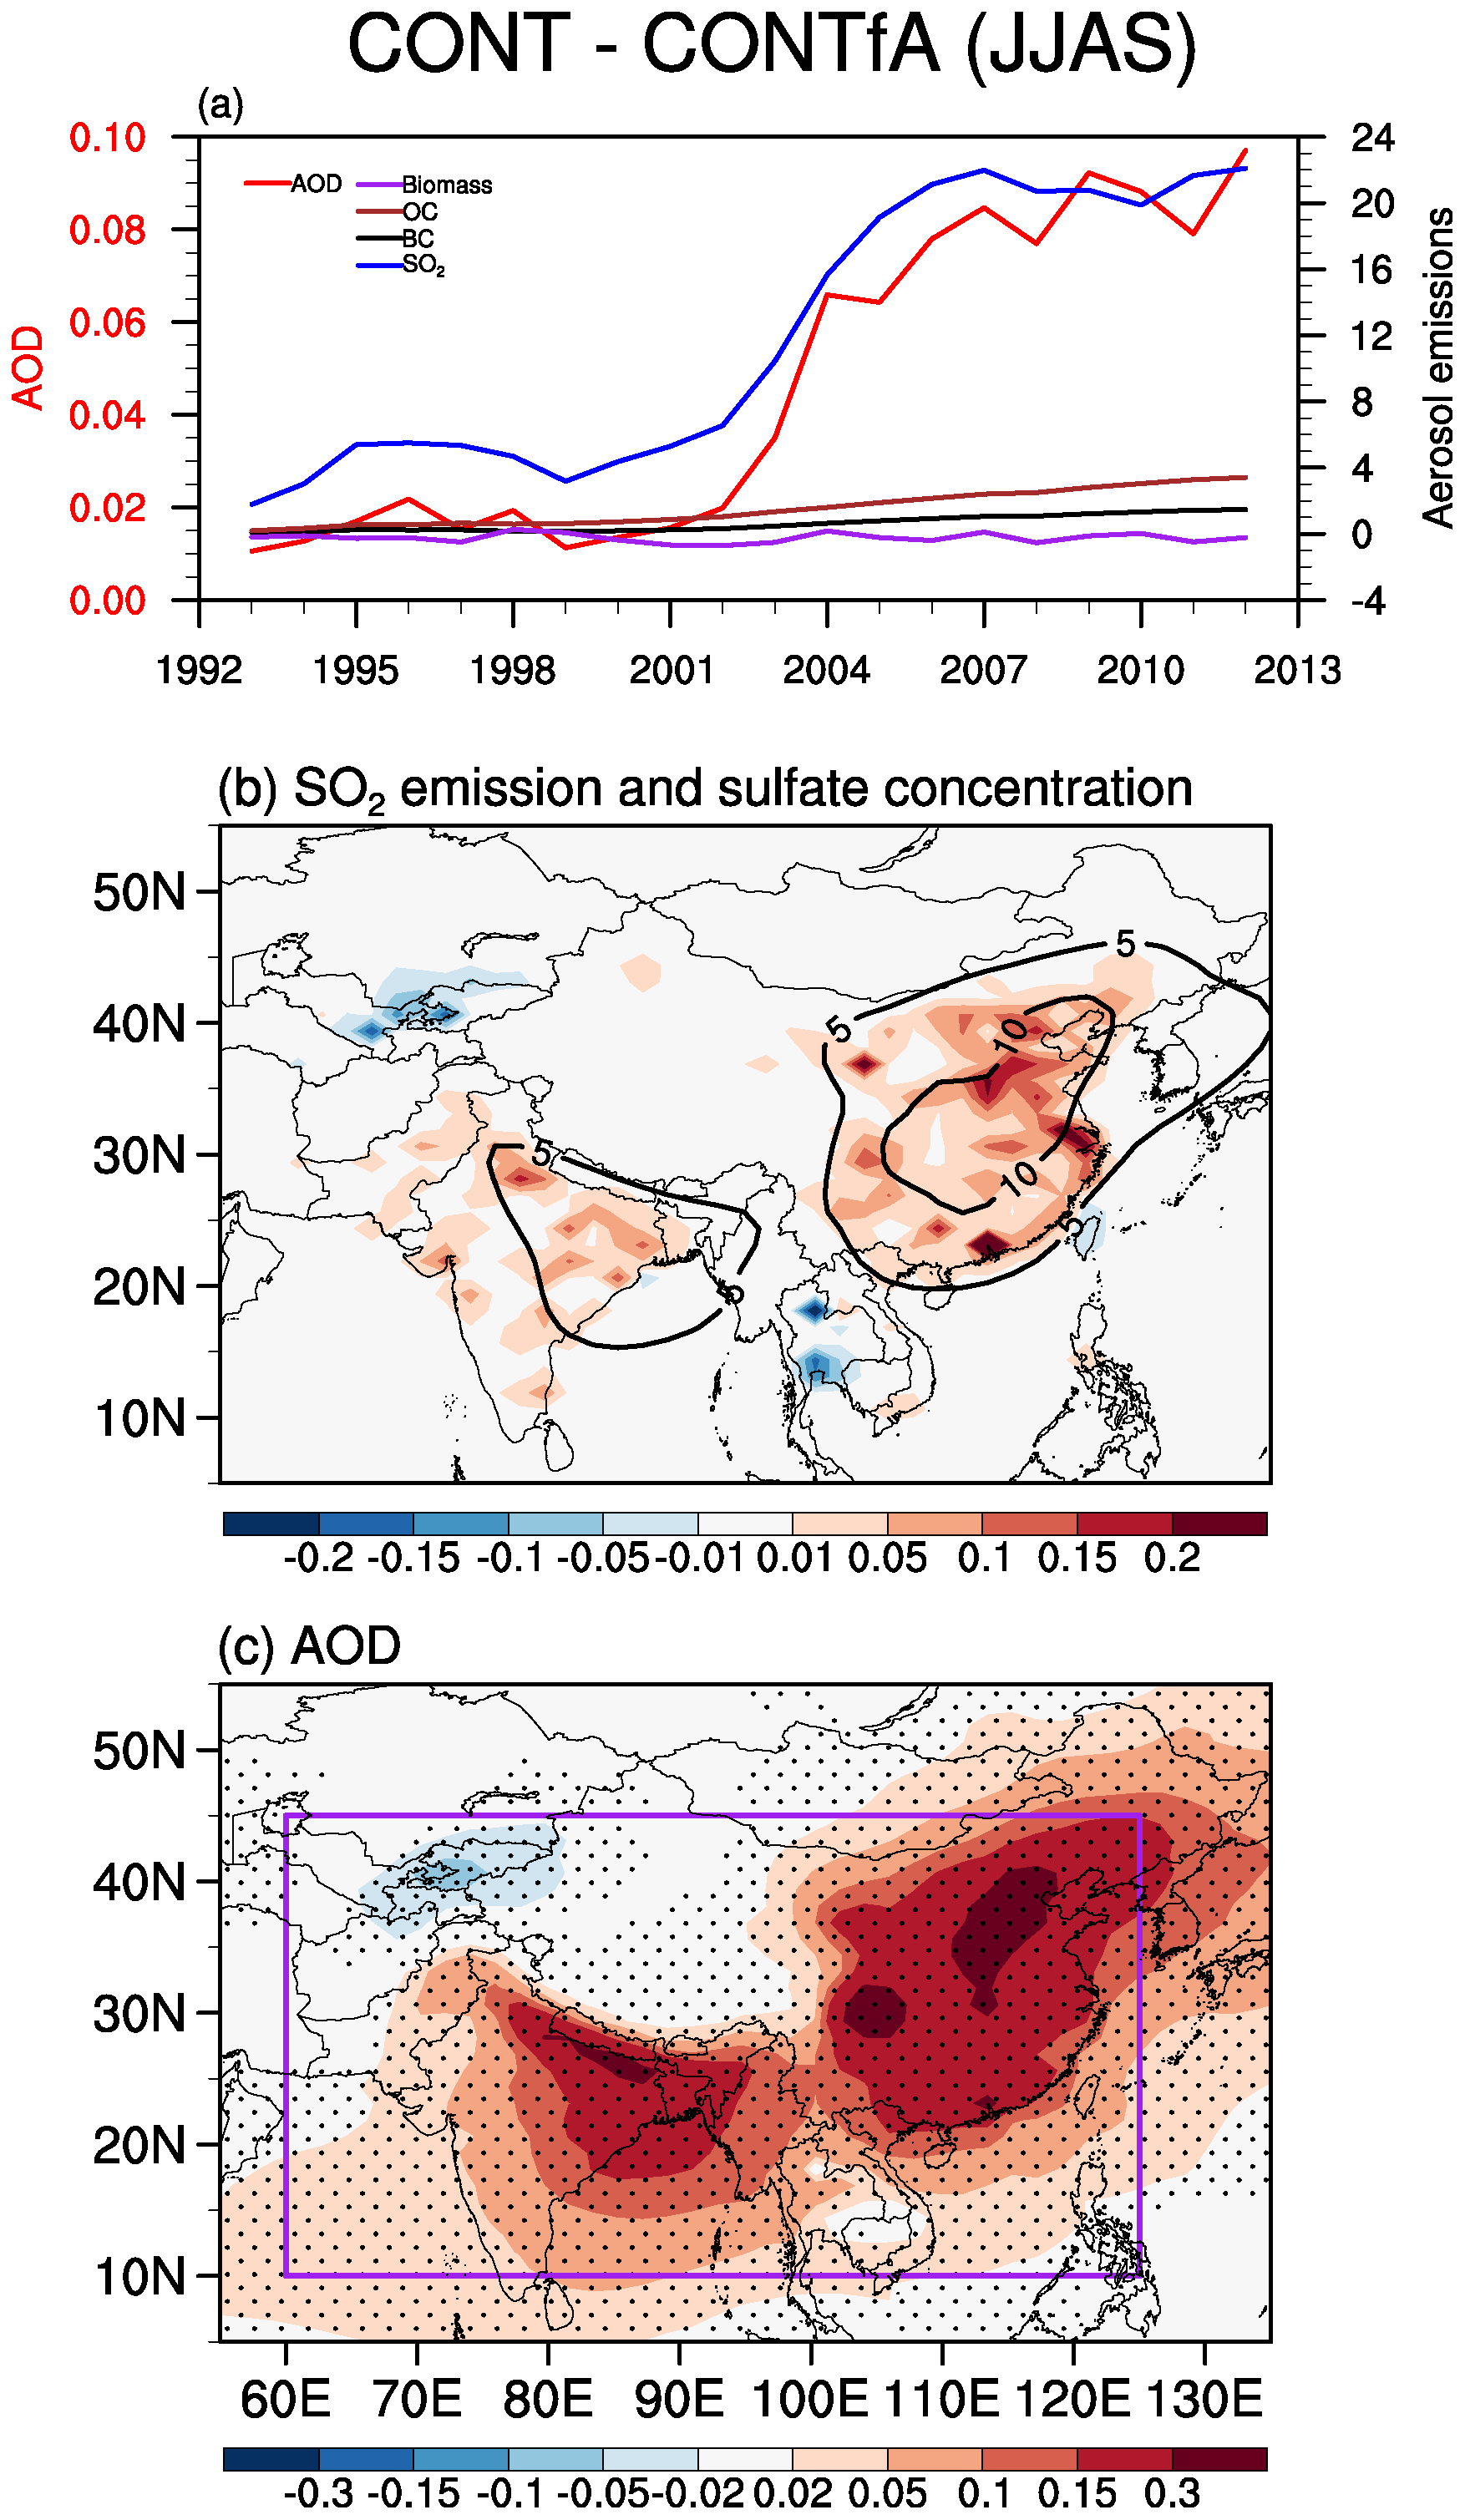
Figure 2(a) Differences in annual time series between CONT and CONTfA of summer AOD (unitless; red), total SO2 emissions (Tg yr−1; blue), total BC emissions (Tg yr−1; black), total OC emissions (Tg yr−1; brown), and total biomass burning emissions (Tg yr−1; purple) over Asia. Spatial distribution of changes in (b) SO2 emissions (shading; Tg yr−1) and sulfate column burden (contour; mg m−2) and (c) AOD changes (difference between CONT and CONTfA averaged for the period 2003–2012). The purple box in (c) denotes the Asia region (10–45° N, 60–125° E). Black dots in (c) mark grid points for which the difference is significant at the 90 % confidence level.
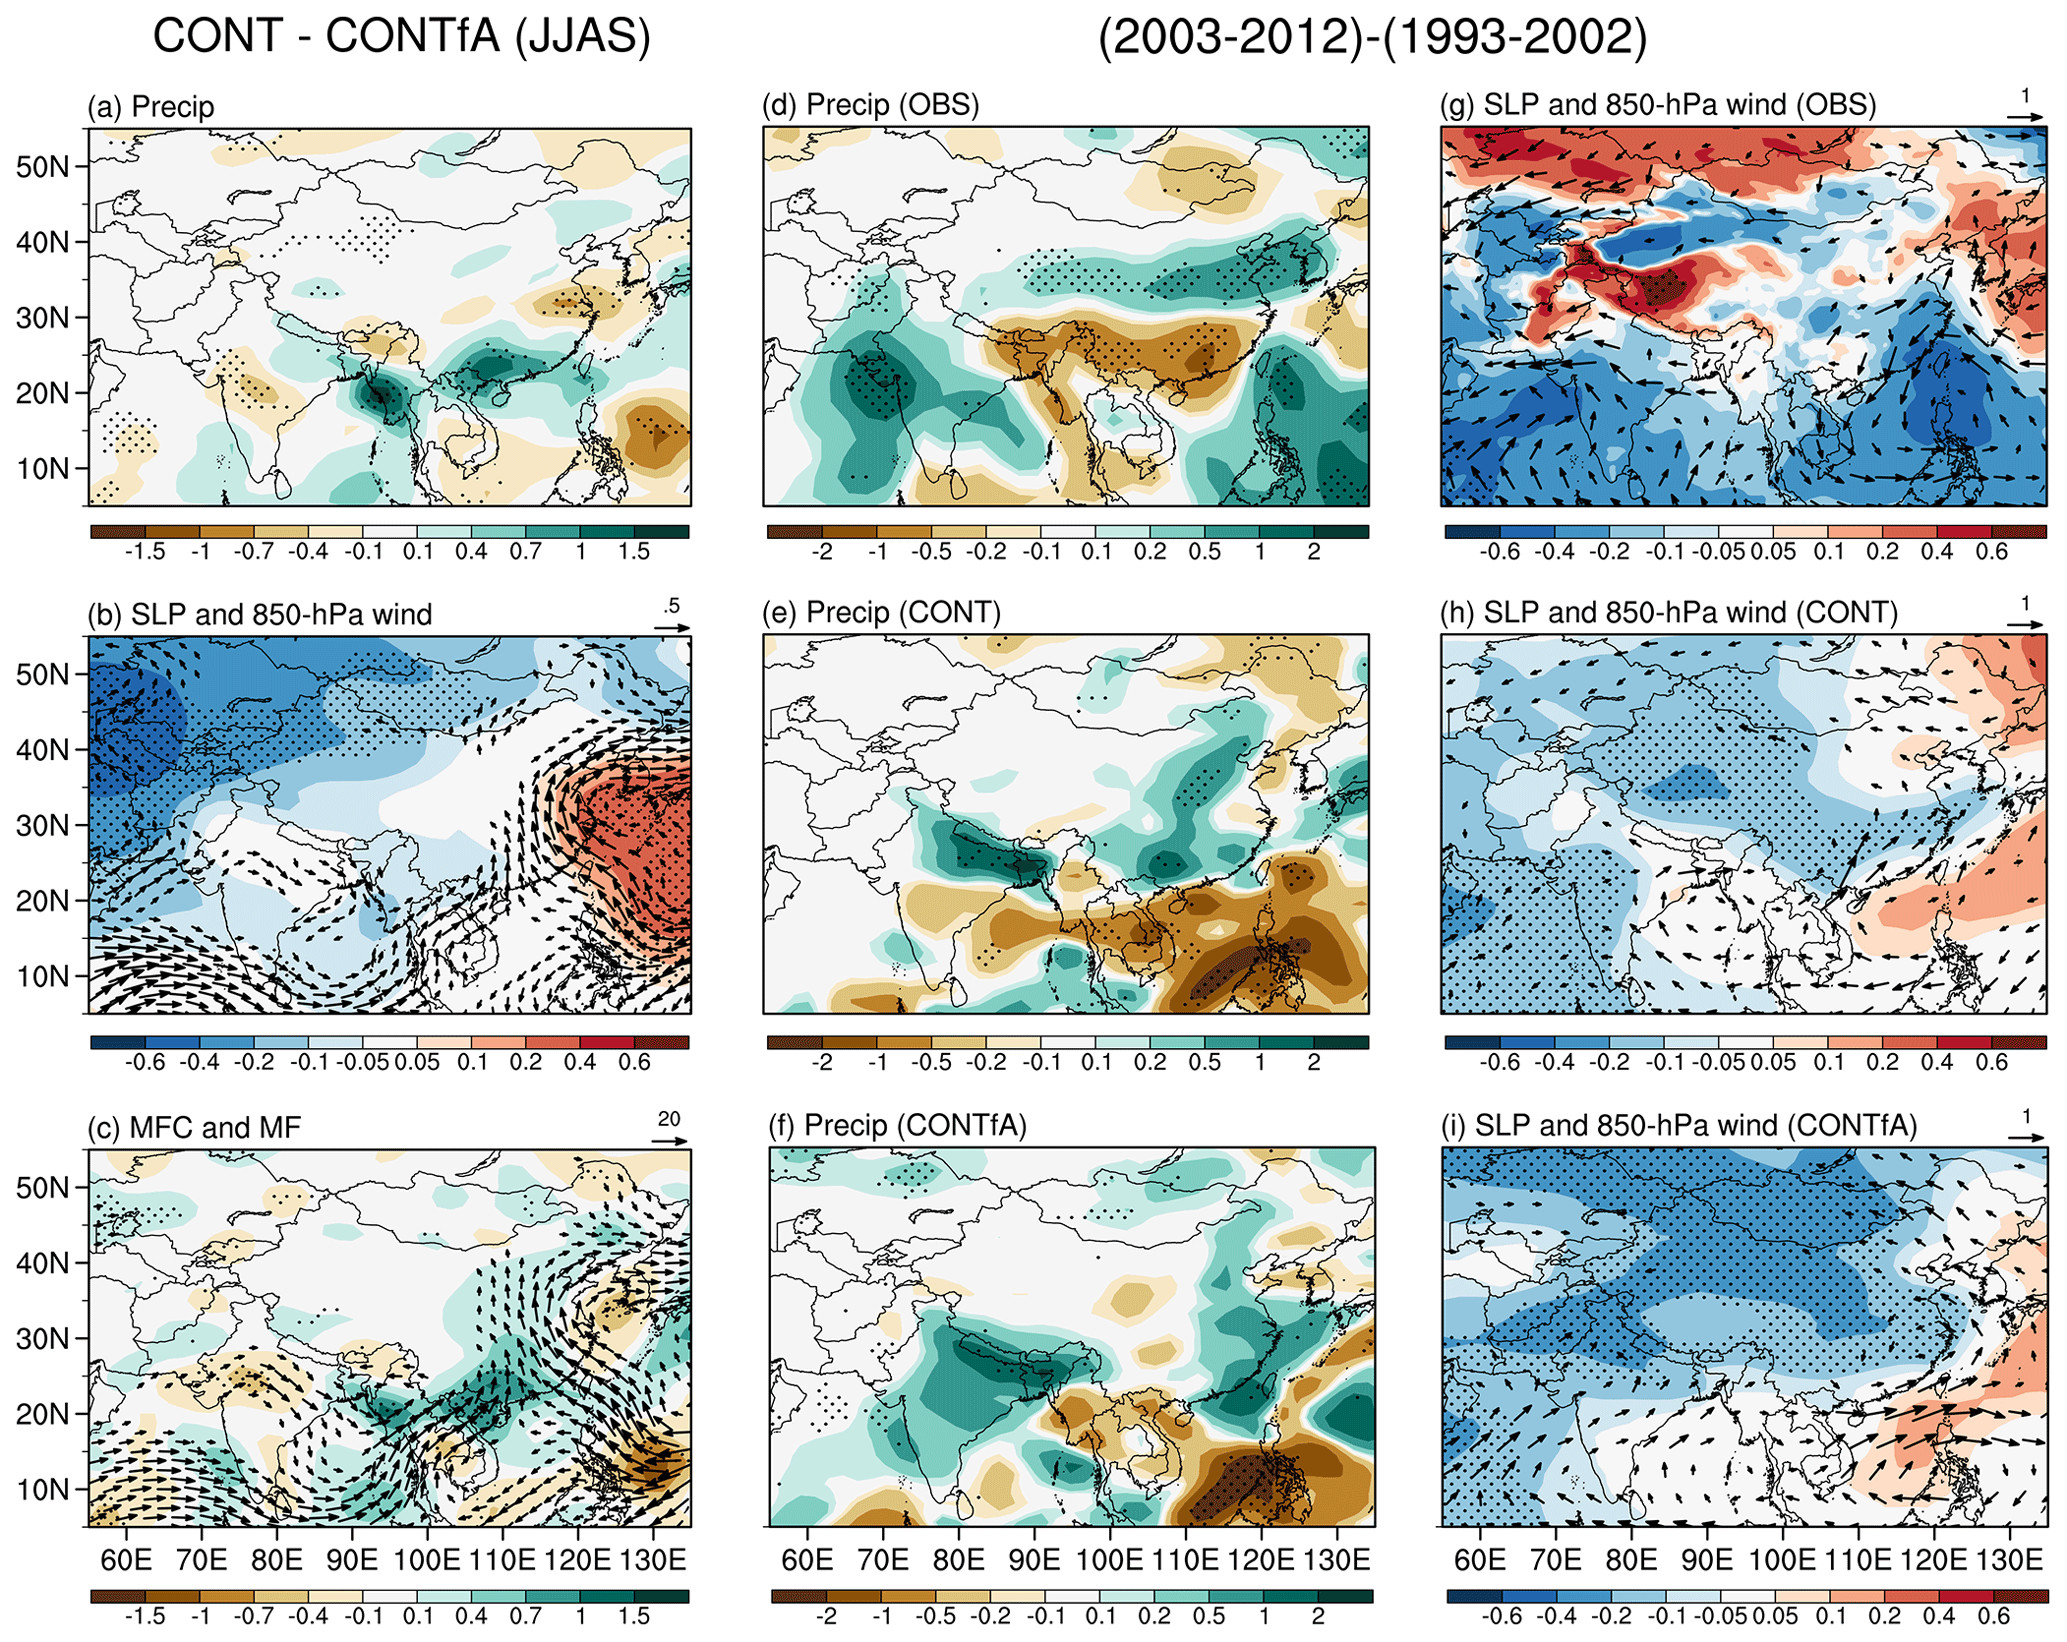
Figure 3June–July–August–September (JJAS) response to Asian anthropogenic aerosols (difference between CONT and CONTfA averaged during 2003–2012) for (a) precipitation (mm d−1), (b) sea-level pressure (hPa; shading) and 850 hPa winds (m s−1), and (c) 1000–300 hPa vertically integrated moisture flux convergence (MFC; mm d−1, shading) and moisture flux (MF; ). Black dots mark grid points for which the difference is significant at the 90 % confidence level. JJAS precipitation differences (mm d−1) between 2003–2012 and 1993–2002 in (d) the mean of GPCP and CMAP, (e) CONT, and (f) CONTfA. (g–i) Same as (d)–(f) but for sea-level pressure (SLP; hPa) and 850 hPa wind (m s−1) in ERA5 reanalysis and model simulations.
3.2.2 Seasonal-mean response to Asian aerosols
Figure 3a shows the aerosol-driven summer precipitation changes. A band of excess rainfall stretches from southeastern China and the South China Sea (SCS) to the northern Indochinese Peninsula and the northern the Bay of Bengal (BOB), associated with a negative sea-level pressure anomaly and anomalous cyclonic flow centered over the northern BOB (Fig. 3b). The enhanced cross-equatorial southwesterly flow over the western tropical Indian Ocean and subsequent northeastward moisture transport and precipitation increases across the basin indicate an intensified monsoon circulation (Fig. 3b and c). The anomalous wind then turns counterclockwise, bringing abundant moisture across the BOB to northern India, the Indochinese Peninsula, and southern China (Fig. 3c). Concurrently, anomalous dry westerlies over central India lead to precipitation decreases, resulting in an approximately southwest–northeast-oriented wet–dry rainfall dipole (Fig. 3a).
Over China, the widespread wetting to the south, together with the drying to the north, forms a meridional dipole. The dipole is accompanied by a marked anomalous anticyclone centered over the western subtropical Pacific and extending further inland, suggesting a strong dynamical link with the rainfall anomalies via modulation of the climatological western Pacific subtropical high (WPSH; Fig. 3a and b). On the southwestern flank of the anticyclone, anomalous southeasterlies blow from the subtropical western Pacific across the SCS and bring moisture to southern China (Fig. 3c). Here the flow converges with the southwesterly winds from the Indian Ocean mentioned above, resulting in the abundant precipitation increase. Moist southerlies further extend over eastern China and result in a positive, albeit of weak magnitude, moisture convergence anomaly. This contrasts with the local precipitation deficit, which, also given the modest evaporation anomaly (not shown), appears to be associated with moisture divergence due to transient eddies whose contribution to the total moisture flux convergence is relevant for the region (e.g., Seager et al., 2010; Li et al., 2018).
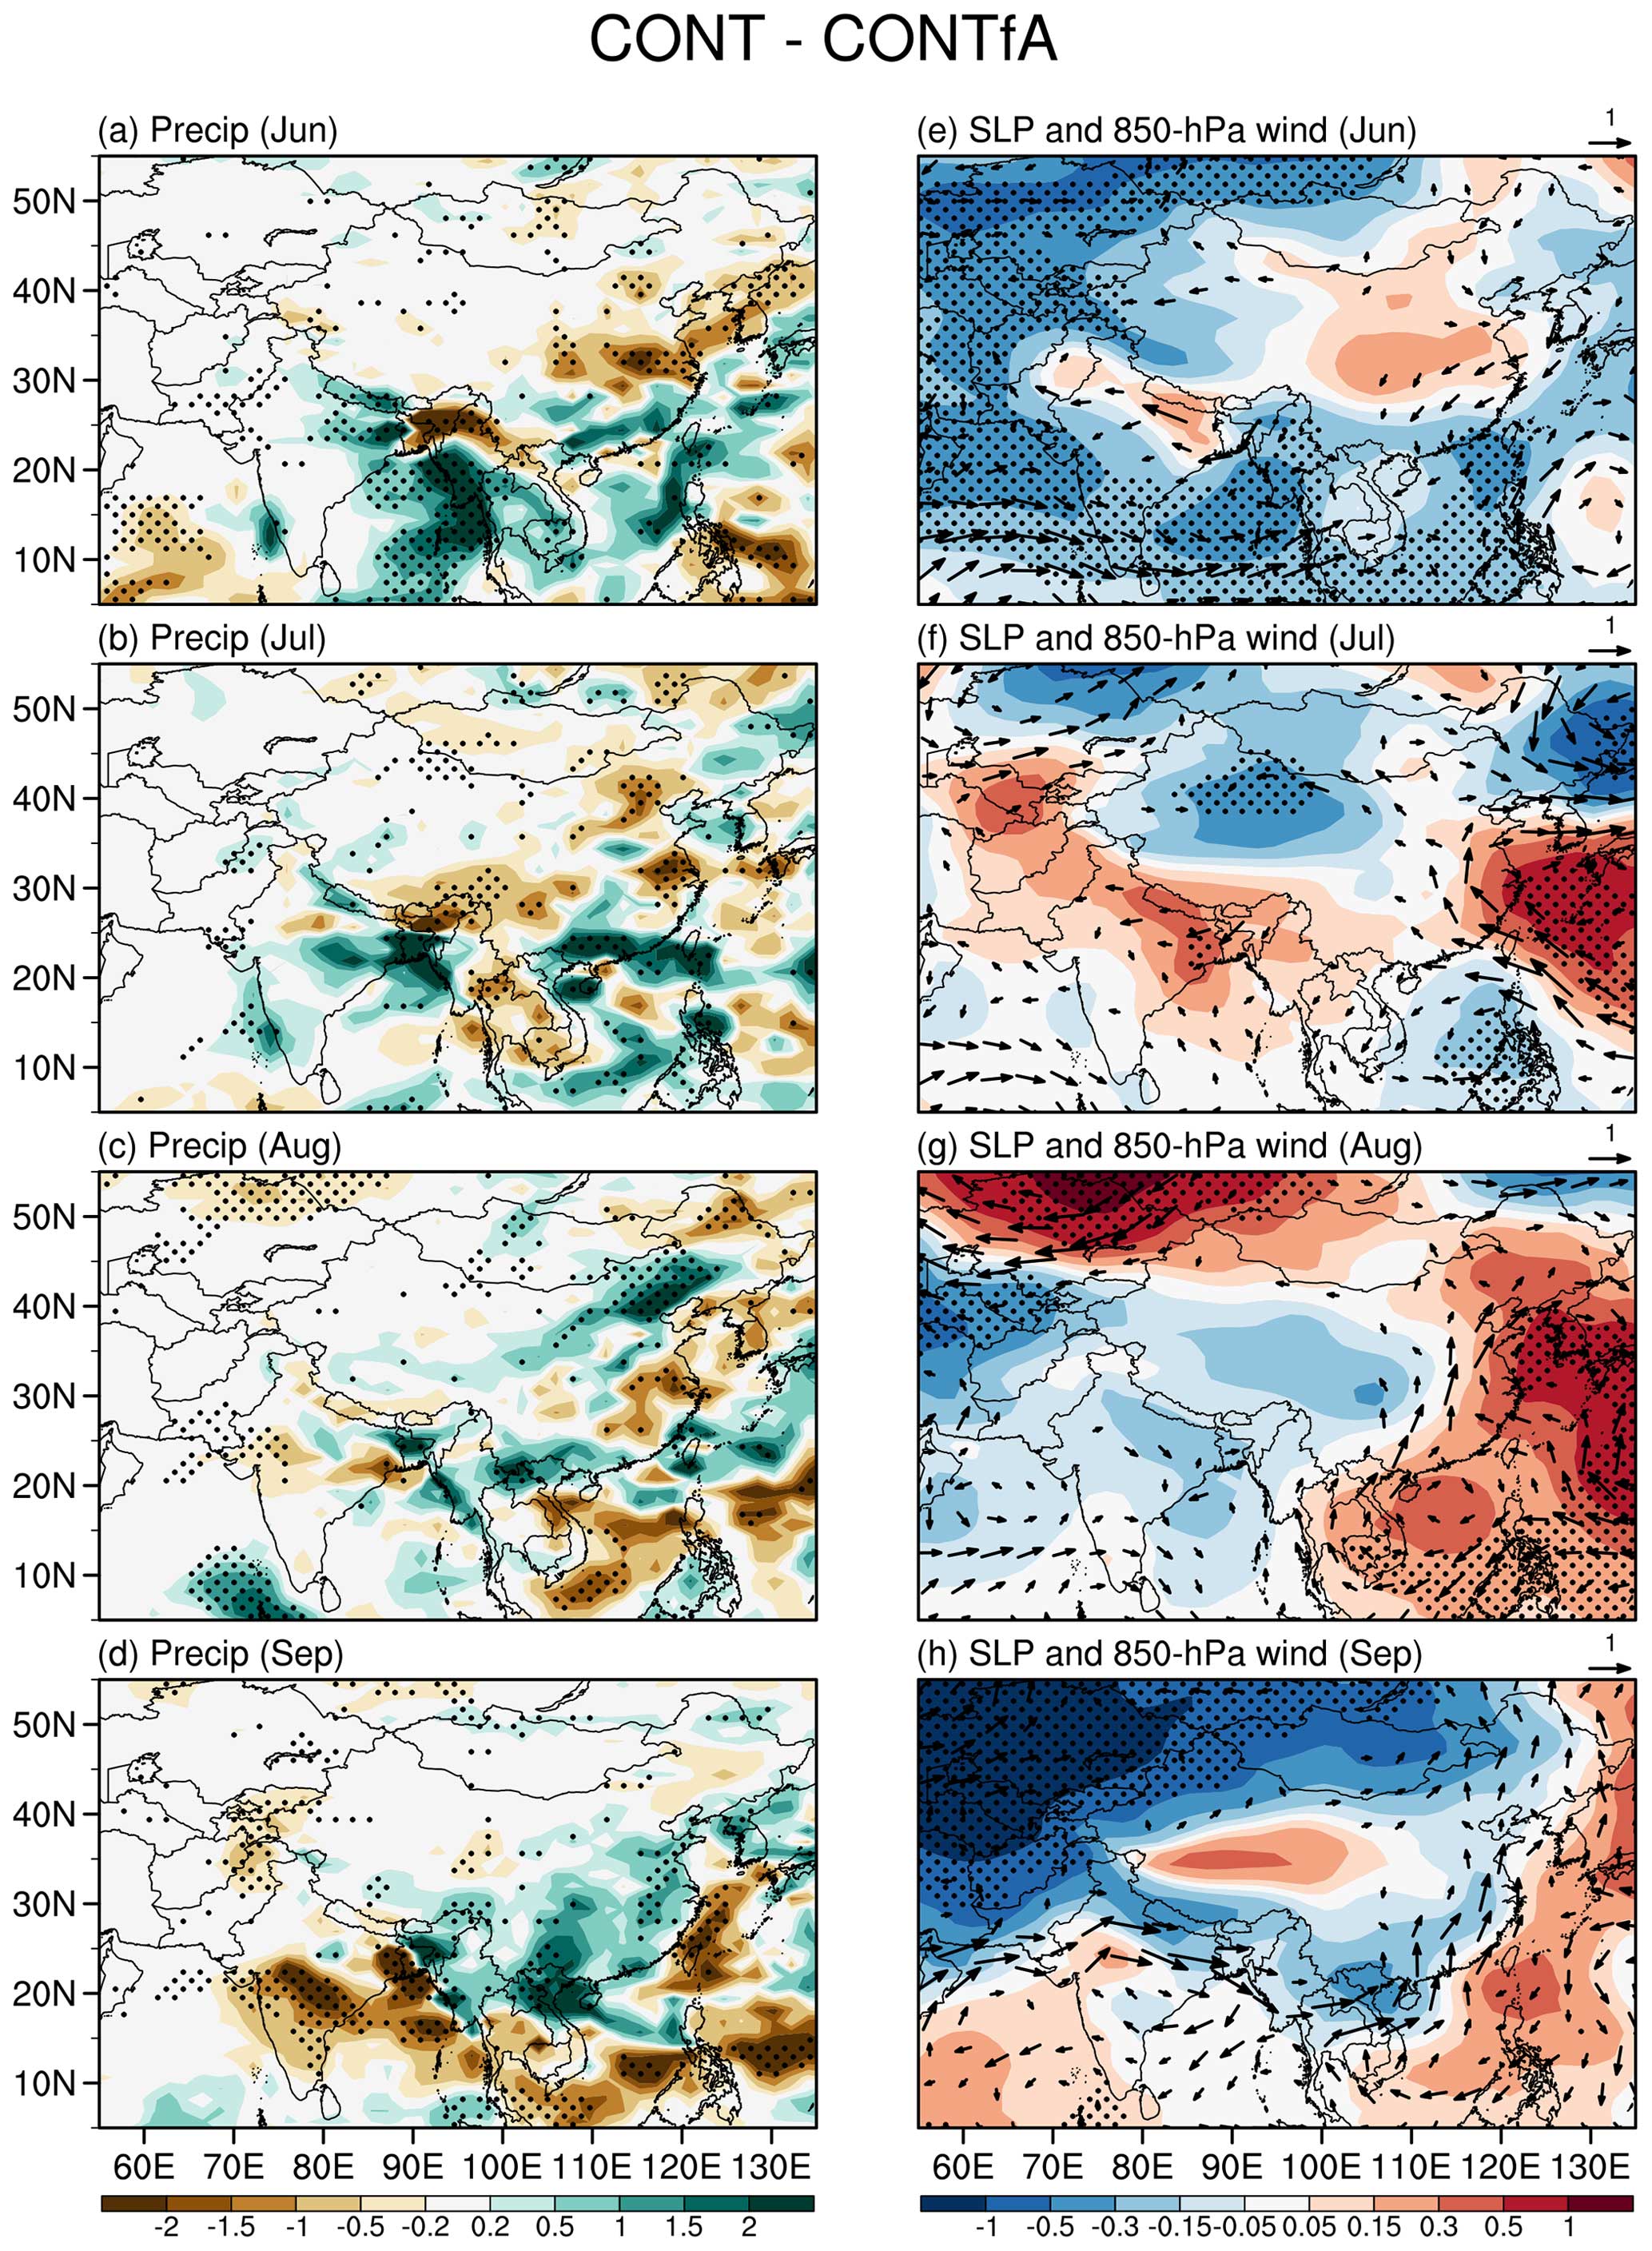
Figure 4Monthly differences in precipitation (mm d−1) between CONT and CONTfA in (a) June, (b) July, (c) August, and (d) September for the period 2003–2012. (e–h) Same as (a)–(d) but for sea-level pressure (hPa, shading) and 850 hPa winds (m s−1). Black dots mark grid points for which the difference is significant at the 90 % confidence level.
Examining these changes in a broader context, the aerosol-driven rainfall difference pattern displays, in its large-scale features, a remarkable similarity, but opposite sign, to observations (Fig. 3a and d). In particular, model and observations feature key rainfall action centers of comparable magnitude and in similar geographical locations while being of opposite polarity. For example, observed changes show drying from northern India across the northern BOB to southeastern China, with wetting over central and western India, northern China, and the western subtropical Pacific (Fig. 3d), in stark contrast to the simulated anomalies shown in Fig. 3a. These precipitation anomalies over East Asia are associated with an anomalous cyclone over the western subtropical Pacific (Fig. 3g, compared to the anomalous anticyclone in Fig. 3b), leading to oceanic moisture advection over northern China and dry northeasterlies over southern and eastern China. Anomalous anticyclonic anomalies are seen over the northern BOB in contrast to a low over the Arabian Sea, which leads to excess rainfall over central and western India and a deficit to the northeast and in the northern BOB (Fig. 3g, opposite to the simulated dipole in Fig. 3b). Interestingly, the consistency between observed and simulated (sign-reversed) precipitation and sea-level pressure patterns is also evident in CONT (Fig. 3e and h), albeit with some dissimilarities over land, while it is less obvious when aerosol emissions are not evolving (Fig. 3f and i), particularly around the Indian subcontinent and eastern China, resulting in an overall mixed signal. While this suggests a possible important role of aerosols in driving the model anomalies, the opposite polarity of the aerosol-induced patterns compared to observations is puzzling and warrants further investigation into the underpinning cause and physical mechanism.
3.2.3 Subseasonal response to Asian aerosols
Inspection of monthly precipitation and low-level circulation changes reveals a stark contrast over the Indian subcontinent and adjacent ocean between the early and late monsoon season (Fig. 4). In June, there is increased precipitation and anomalous cyclonic flow over the BOB, consistent with the seasonal mean (Fig. 4a and e). On the contrary, decreased precipitation and anomalous anticyclonic winds are seen over India in September (Fig. 4d and h). Rainfall and circulation anomalies in July display similarities to those in June (Fig. 4b and f), while August shows a mixed pattern, with more spatially confined and smaller-magnitude anomalies (Fig. 4c and g). Over East Asia, the June–July precipitation anomalies, closely resembling the seasonal-mean changes, feature a zonally elongated meridional dipole, with wetting stretching from the Indochinese Peninsula and southern China to the South China Sea and drying to the north across central and eastern China (Fig. 4a and b). Interestingly, the dipole reverses sign in September, accompanied by a southward displacement (i.e., the dipole nodal line moves from around 30° N to about 20° N), with widespread drying over the southern Indochinese Peninsula and most of the western subtropical Pacific and wetting to the north over the northern Indochinese Peninsula and most of China (Fig. 4d). Consistently with the comparison for the seasonal means, the subseasonal aerosol-driven simulated response patterns bear a strong similarity, with opposite signs, to those observed (not shown).
These contrasting changes in the simulated aerosol-induced responses between the early and late summer, despite negligible monthly variations in magnitude and spatial distribution of aerosol emissions across Asia, especially for SO2 (Fig. S2b and f), and the consistently reversed polarity of their key centers compared to observations, suggest that different mechanisms may underpin the responses throughout the season. This also suggests a possible link between long-term changes and the underlying mean seasonal cycle and the possibility of discrepancies between simulated and observed characteristics in the latter to be the cause of the differences in the former. From a more general perspective, this also highlights the importance of investigating and interpreting seasonal monsoon changes accounting for the pronounced subseasonal variability in the response – an aspect usually overlooked in aerosol–monsoon research but particularly relevant for attribution studies.
3.3 A mechanism linking model climatology to response
3.3.1 Subseasonal monsoon biases
The accuracy of the simulated regional climate change signal and its attribution to anthropogenic drivers has been suggested to be strongly dependent on the model performance in reproducing the corresponding mean climatological conditions, which represent the baseline state on top of which changes occur (Matsueda and Palmer, 2011; Christidis et al., 2013). Examining the subseasonal evolution of the model bias could therefore provide insights into the simulated aerosol-induced monsoon response described above, a topic that has been insufficiently addressed and possibly underappreciated so far.
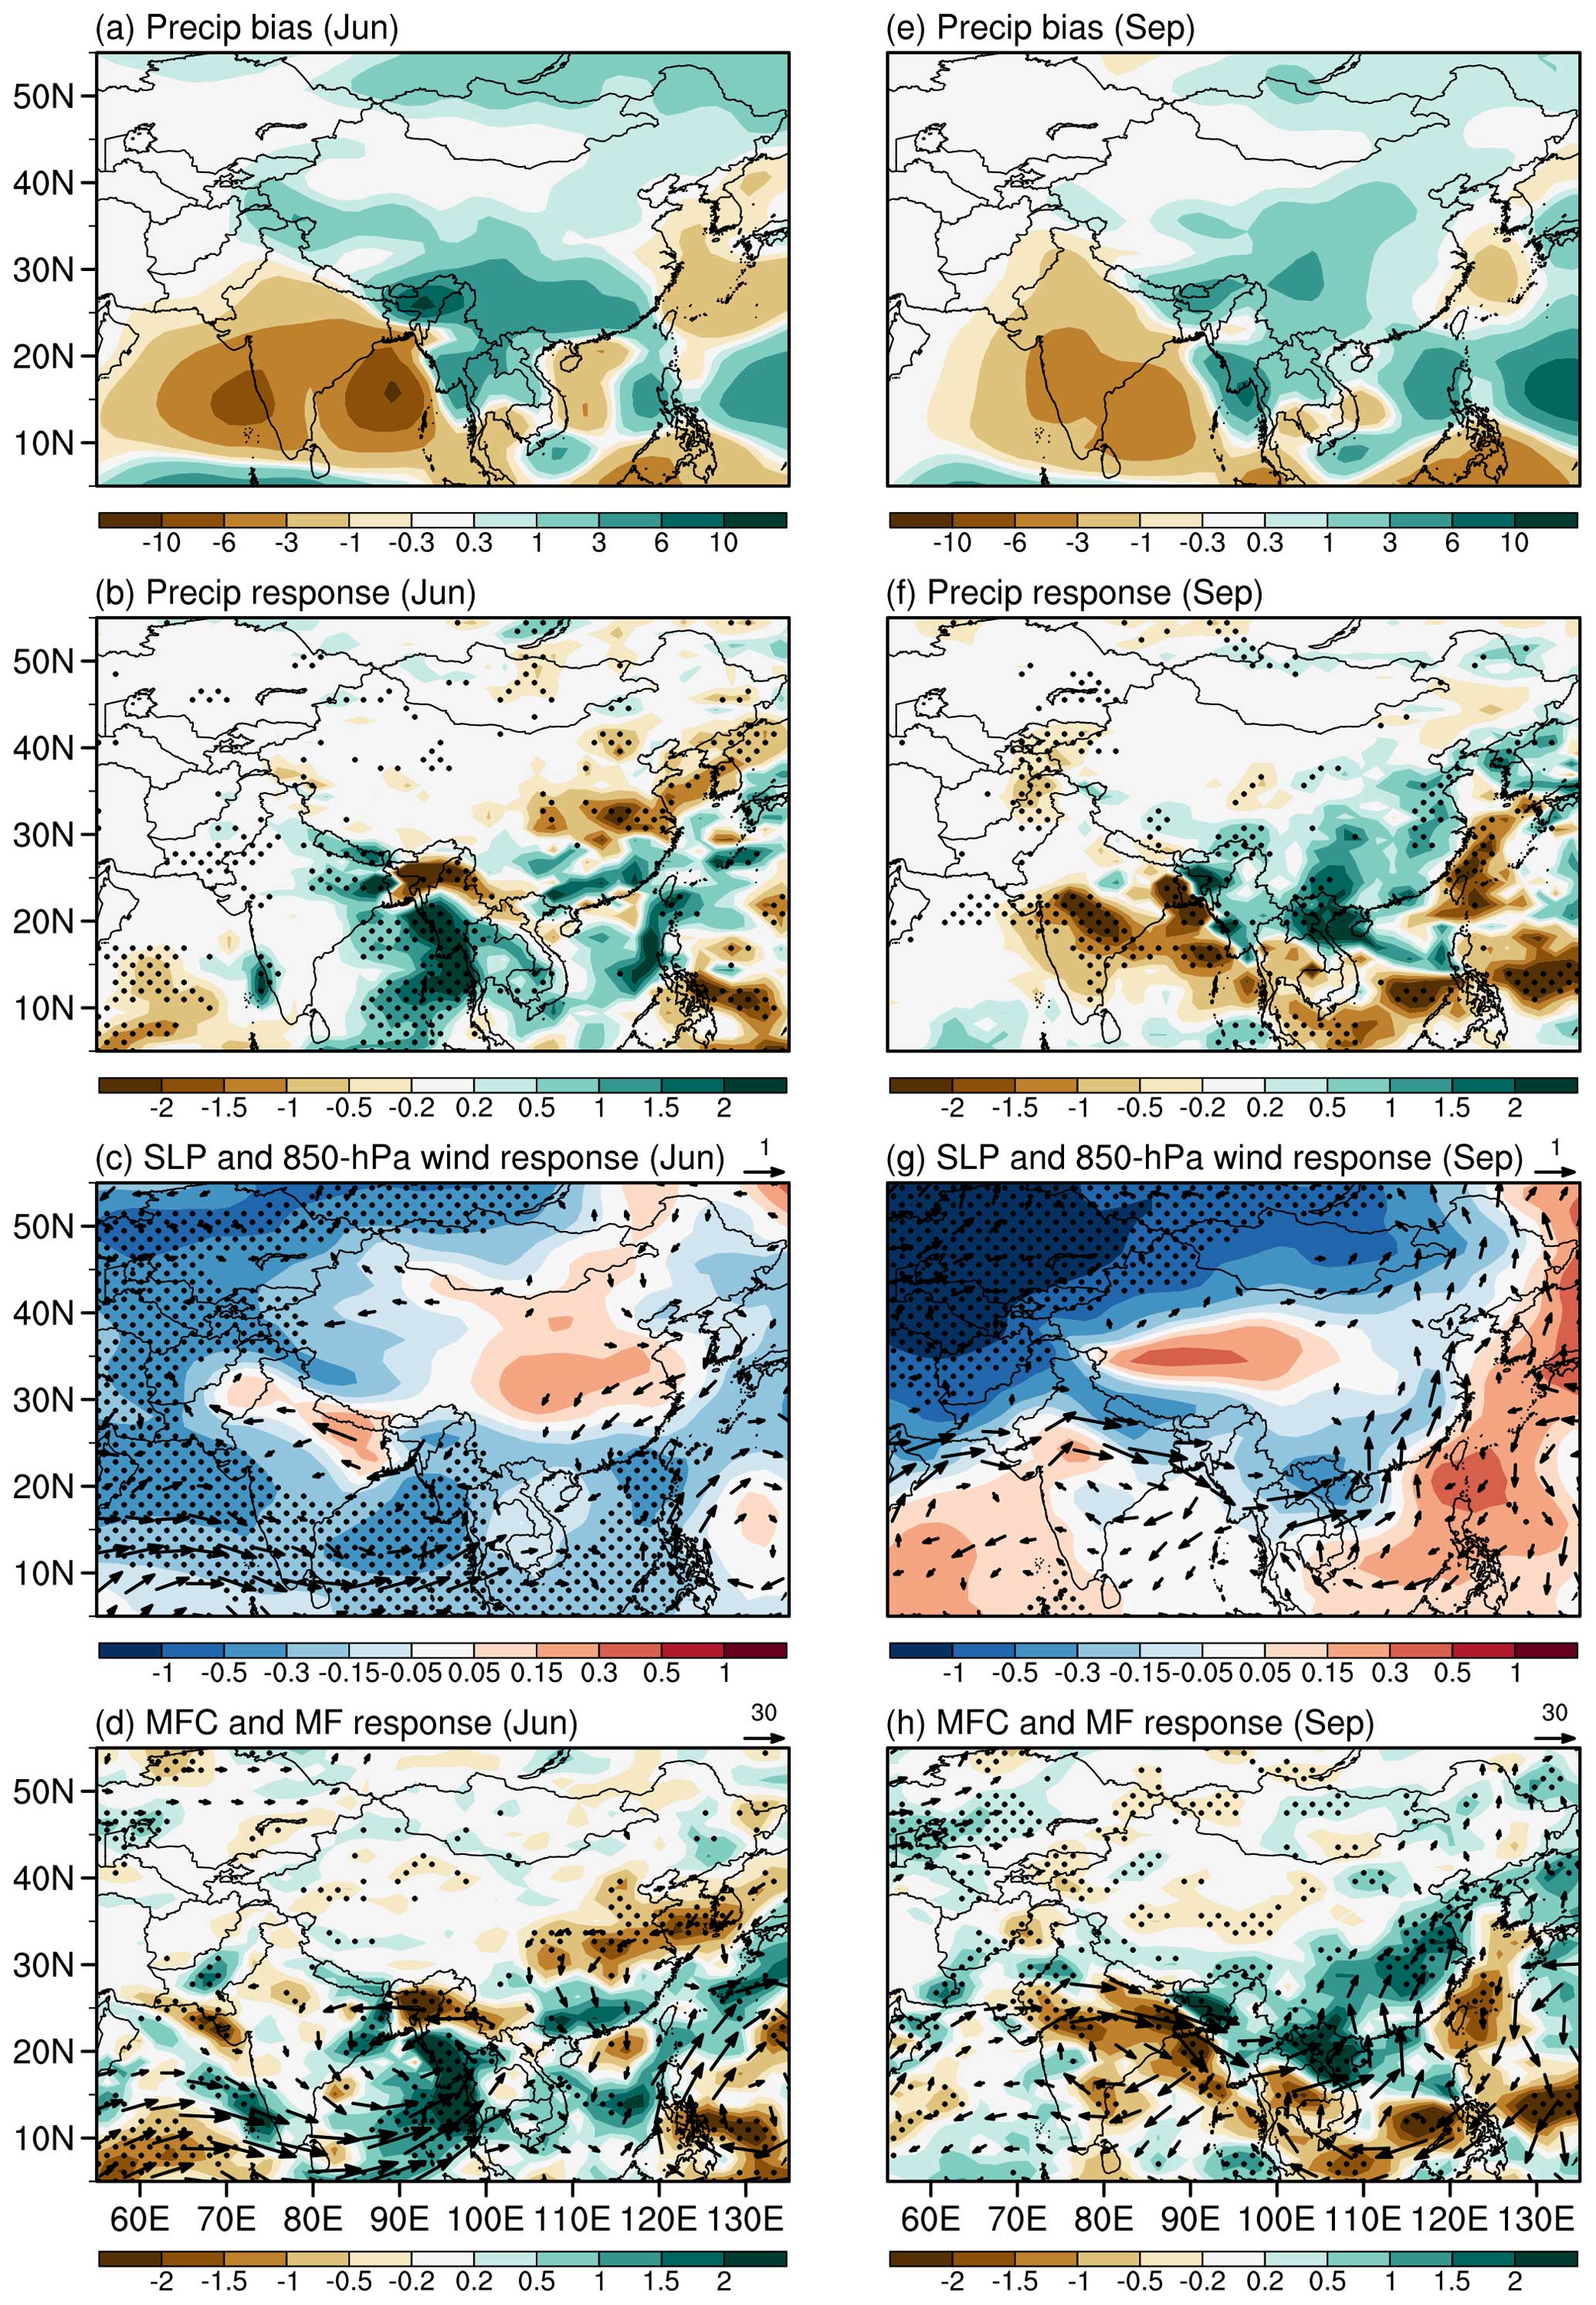
Figure 5(a) June precipitation bias (mm d−1) in CONT with respect to the mean of GPCP and CMAP. Model data are averaged over 2003–2012, and observations are averaged over 1981–2010. June response to Asian anthropogenic aerosols (difference between CONT and CONTfA averaged during 2003–2012) for (b) precipitation (mm d−1), (c) sea-level pressure (hPa, shading) and 850 hPa wind (m s−1), and (d) 1000–300 hPa vertically integrated moisture flux convergence (mm d−1, shading) and moisture flux (). (e–h) Same as (a)–(d) but for September. Black dots in (b)–(d) and (f)–(h) mark grid points for which the difference is significant at the 90 % confidence level.
Figure 5a and b show the model precipitation bias relative to the mean of CMAP and GPCP in June and September, respectively. In June, there is a clear anomalous meridional dipole over the Indian sector with rainfall excess over the equatorial Indian Ocean and deficit over India and the surrounding oceanic areas, including the BOB (Fig. 5a). This dipole pattern is similar to that of the seasonal-mean bias commonly presented in both uncoupled and coupled models (Song and Zhou, 2014; He et al., 2022; Rajendran et al., 2022). Particularly, the magnitude of the June dry bias over the Indian subcontinent (−2.8 mm d−1) is about 60 % of the observed climatological amount (4.7 mm d−1). The model is excessively wet to the east over the northern Indochinese Peninsula and most of China, particularly to the south, with predominant dry anomalies over the South China Sea. Interestingly, this bias pattern over continental Asia, particularly the contrasting dipole between (dry) India and the (wet) northern Indochinese Peninsula–China area, bears a close resemblance, with opposite sign, to the June aerosol-induced simulated precipitation distribution discussed above (wetting over India and drying over the northern Indochinese Peninsula–China; Fig. 5b). Is there a mechanistic link between bias and the aerosol-driven response?
3.3.2 Monsoon bias and response in the pre-monsoon season
Aerosol–cloud interactions have been found to play a fundamental role in modulating the Asian summer monsoon response to anthropogenic aerosols, in both uncoupled and coupled experiments (Guo et al., 2015; Li et al., 2018). Hydrophilic aerosols (e.g., sulfate) activated at a given supersaturation level can serve as cloud condensation nuclei and increase the cloud droplet number concentration (CDNC). At constant levels of cloud liquid water content, the increases in CDNC reduce the cloud effective radius and enhance the cloud albedo (Twomey, 1974), exerting a cooling effect at the surface. Meanwhile, the smaller cloud droplets reduce the collision–coalescence probability of droplets and thus weaken the precipitation efficiency (Albrecht, 1989). The cloud effective radius, the critical variable linking aerosol emission changes to cloud and precipitation variations, is proportional to the liquid water content at a given CDNC (Menon et al., 2002b). While column water content also changes in response to aerosol variations (Sato et al., 2018; Wang et al., 2022), and thus cause and effect are tightly intertwined at short timescales, the above hints at the possibility of baseline conditions modulating aerosol–cloud interactions and the subsequent monsoon response to aerosol changes, especially in the presence of large model discrepancies in simulating the climatological distribution of atmospheric moisture (John and Soden, 2007; Bastin et al., 2019; Han et al., 2022). The marked and abrupt shift in the atmospheric state accompanying the monsoon onset and subsequent establishment across Asia is also by nature substantially affected and preconditioned by the presence of anomalous conditions in the preceding spring months. In view of this and to better identify possible precursor conditions leading to the marked aerosol-induced response in June, we examine the model anomalies in late spring.
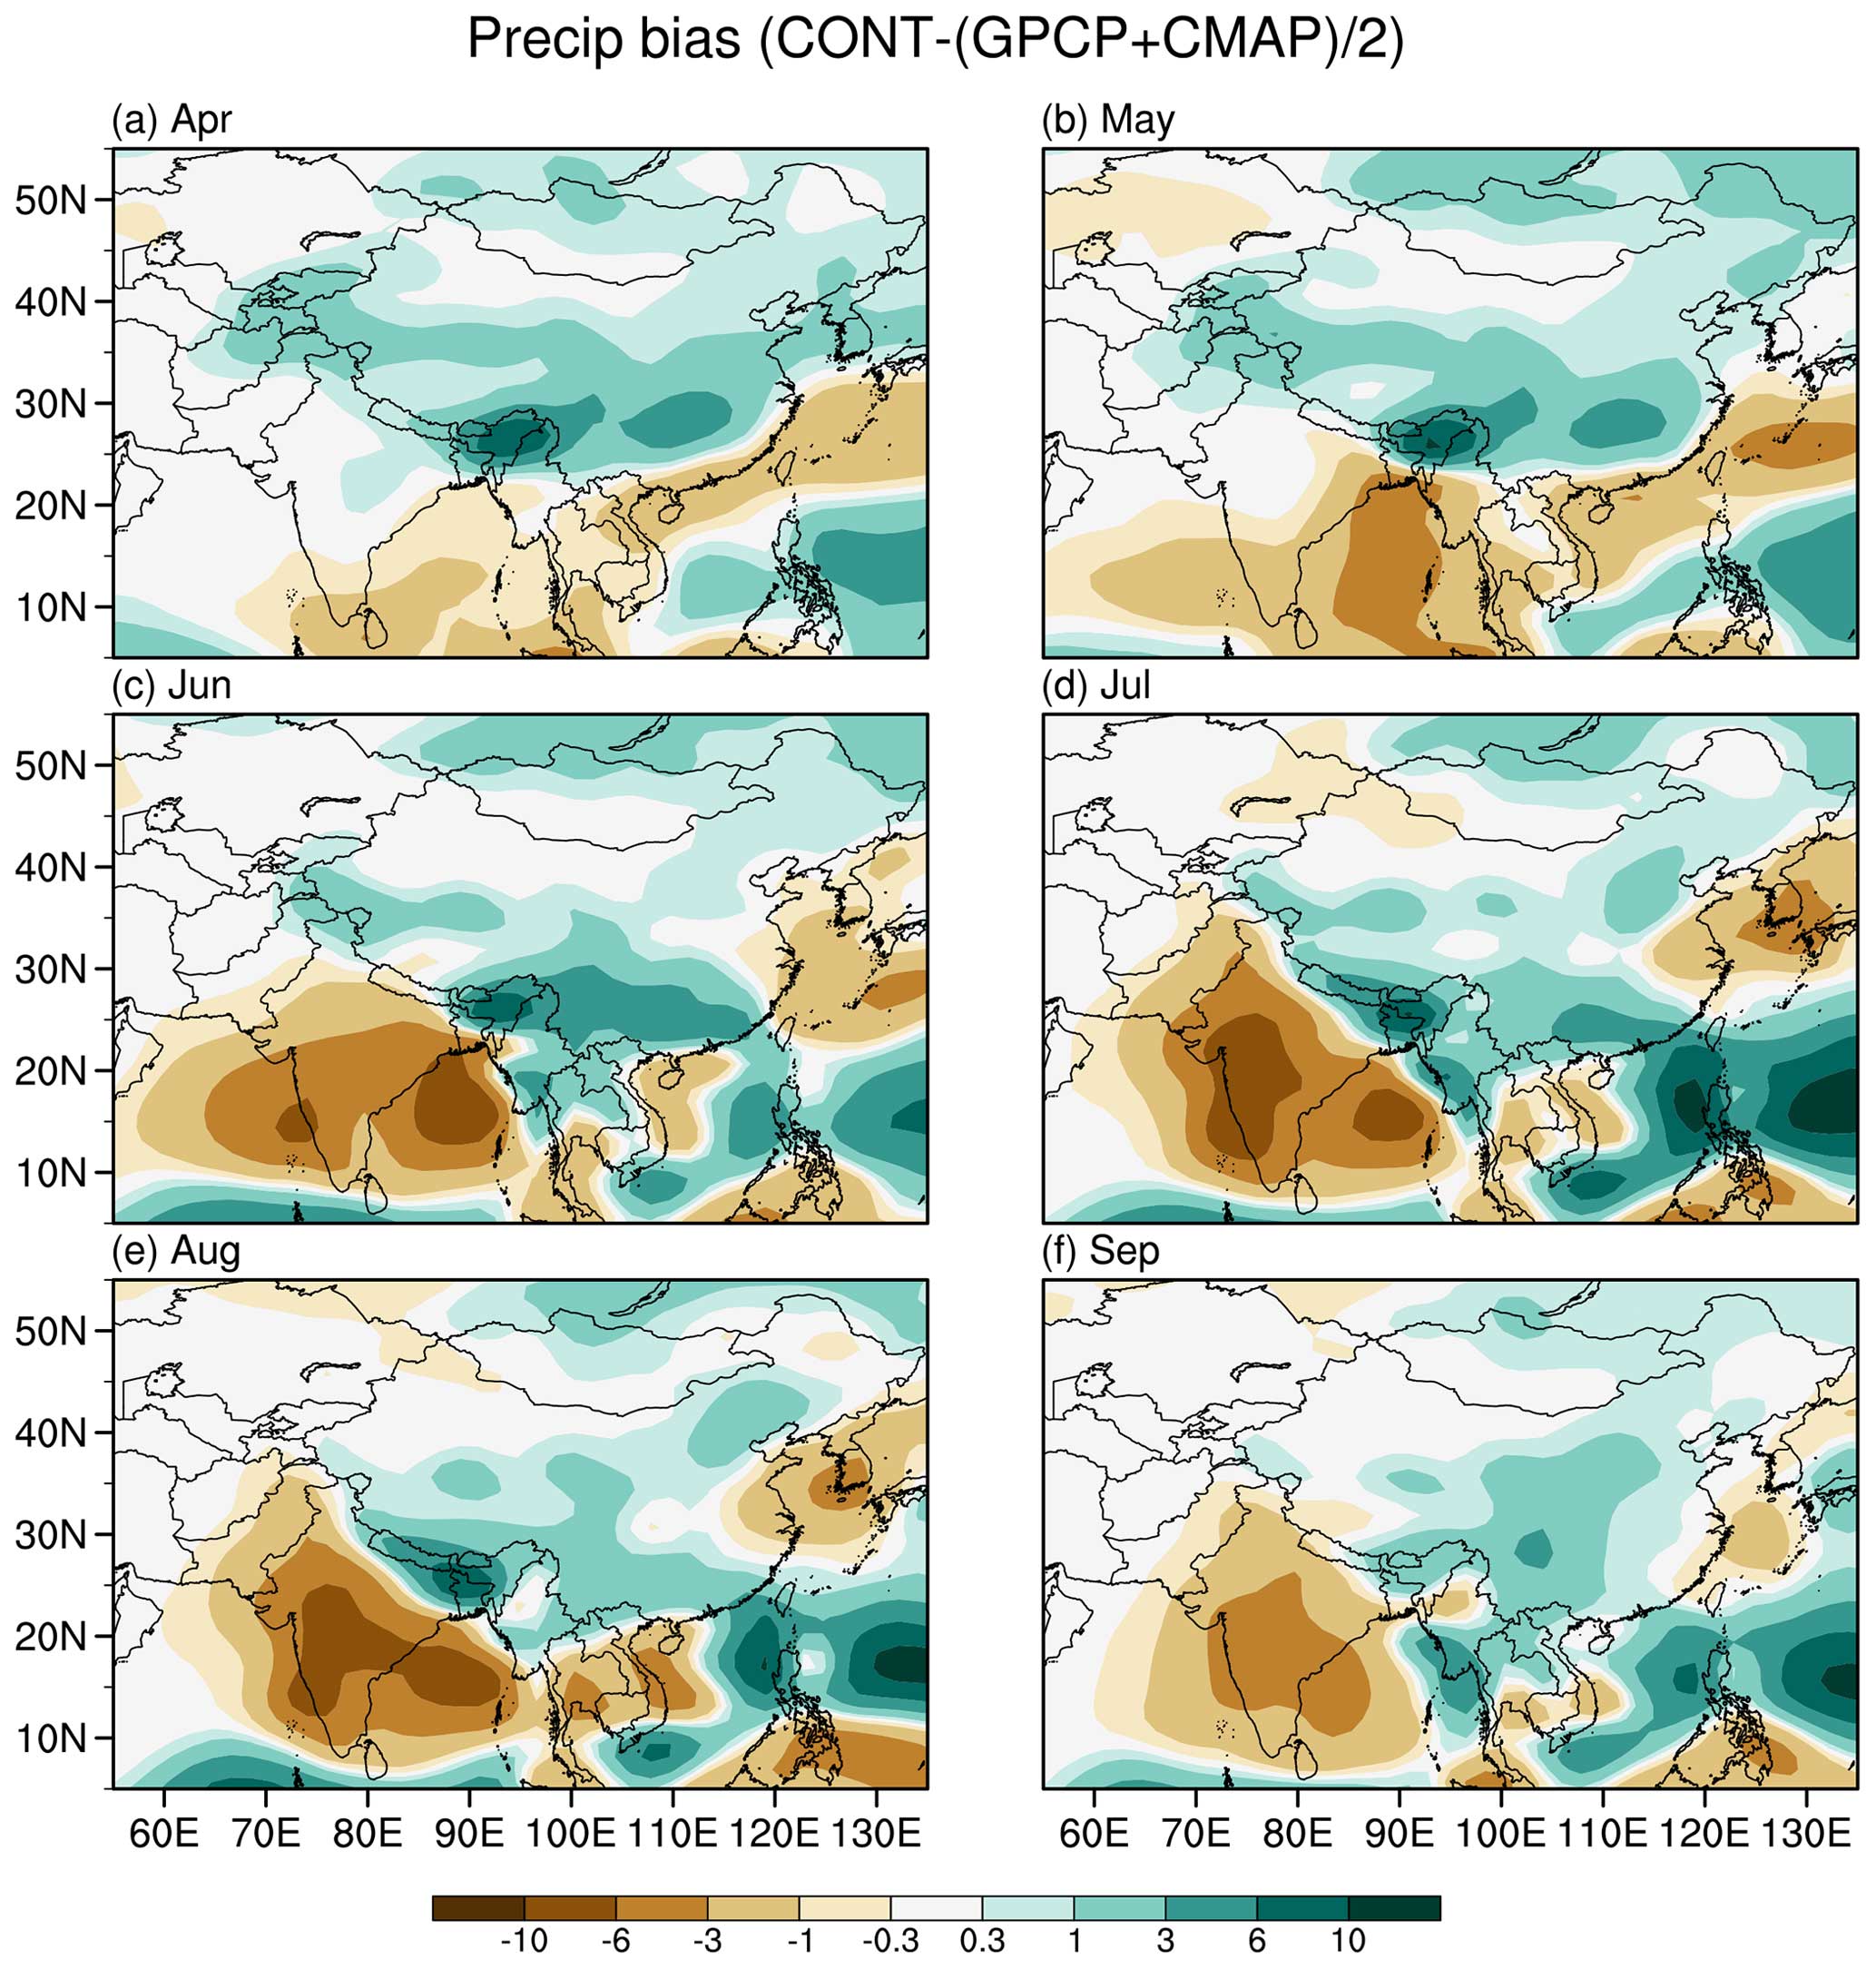
Figure 6Monthly precipitation bias (mm d−1) in CONT with respect to the mean of GPCP and CMAP for (a) April, (b) May, (c) June, (d) July, (e) August, and (f) September.
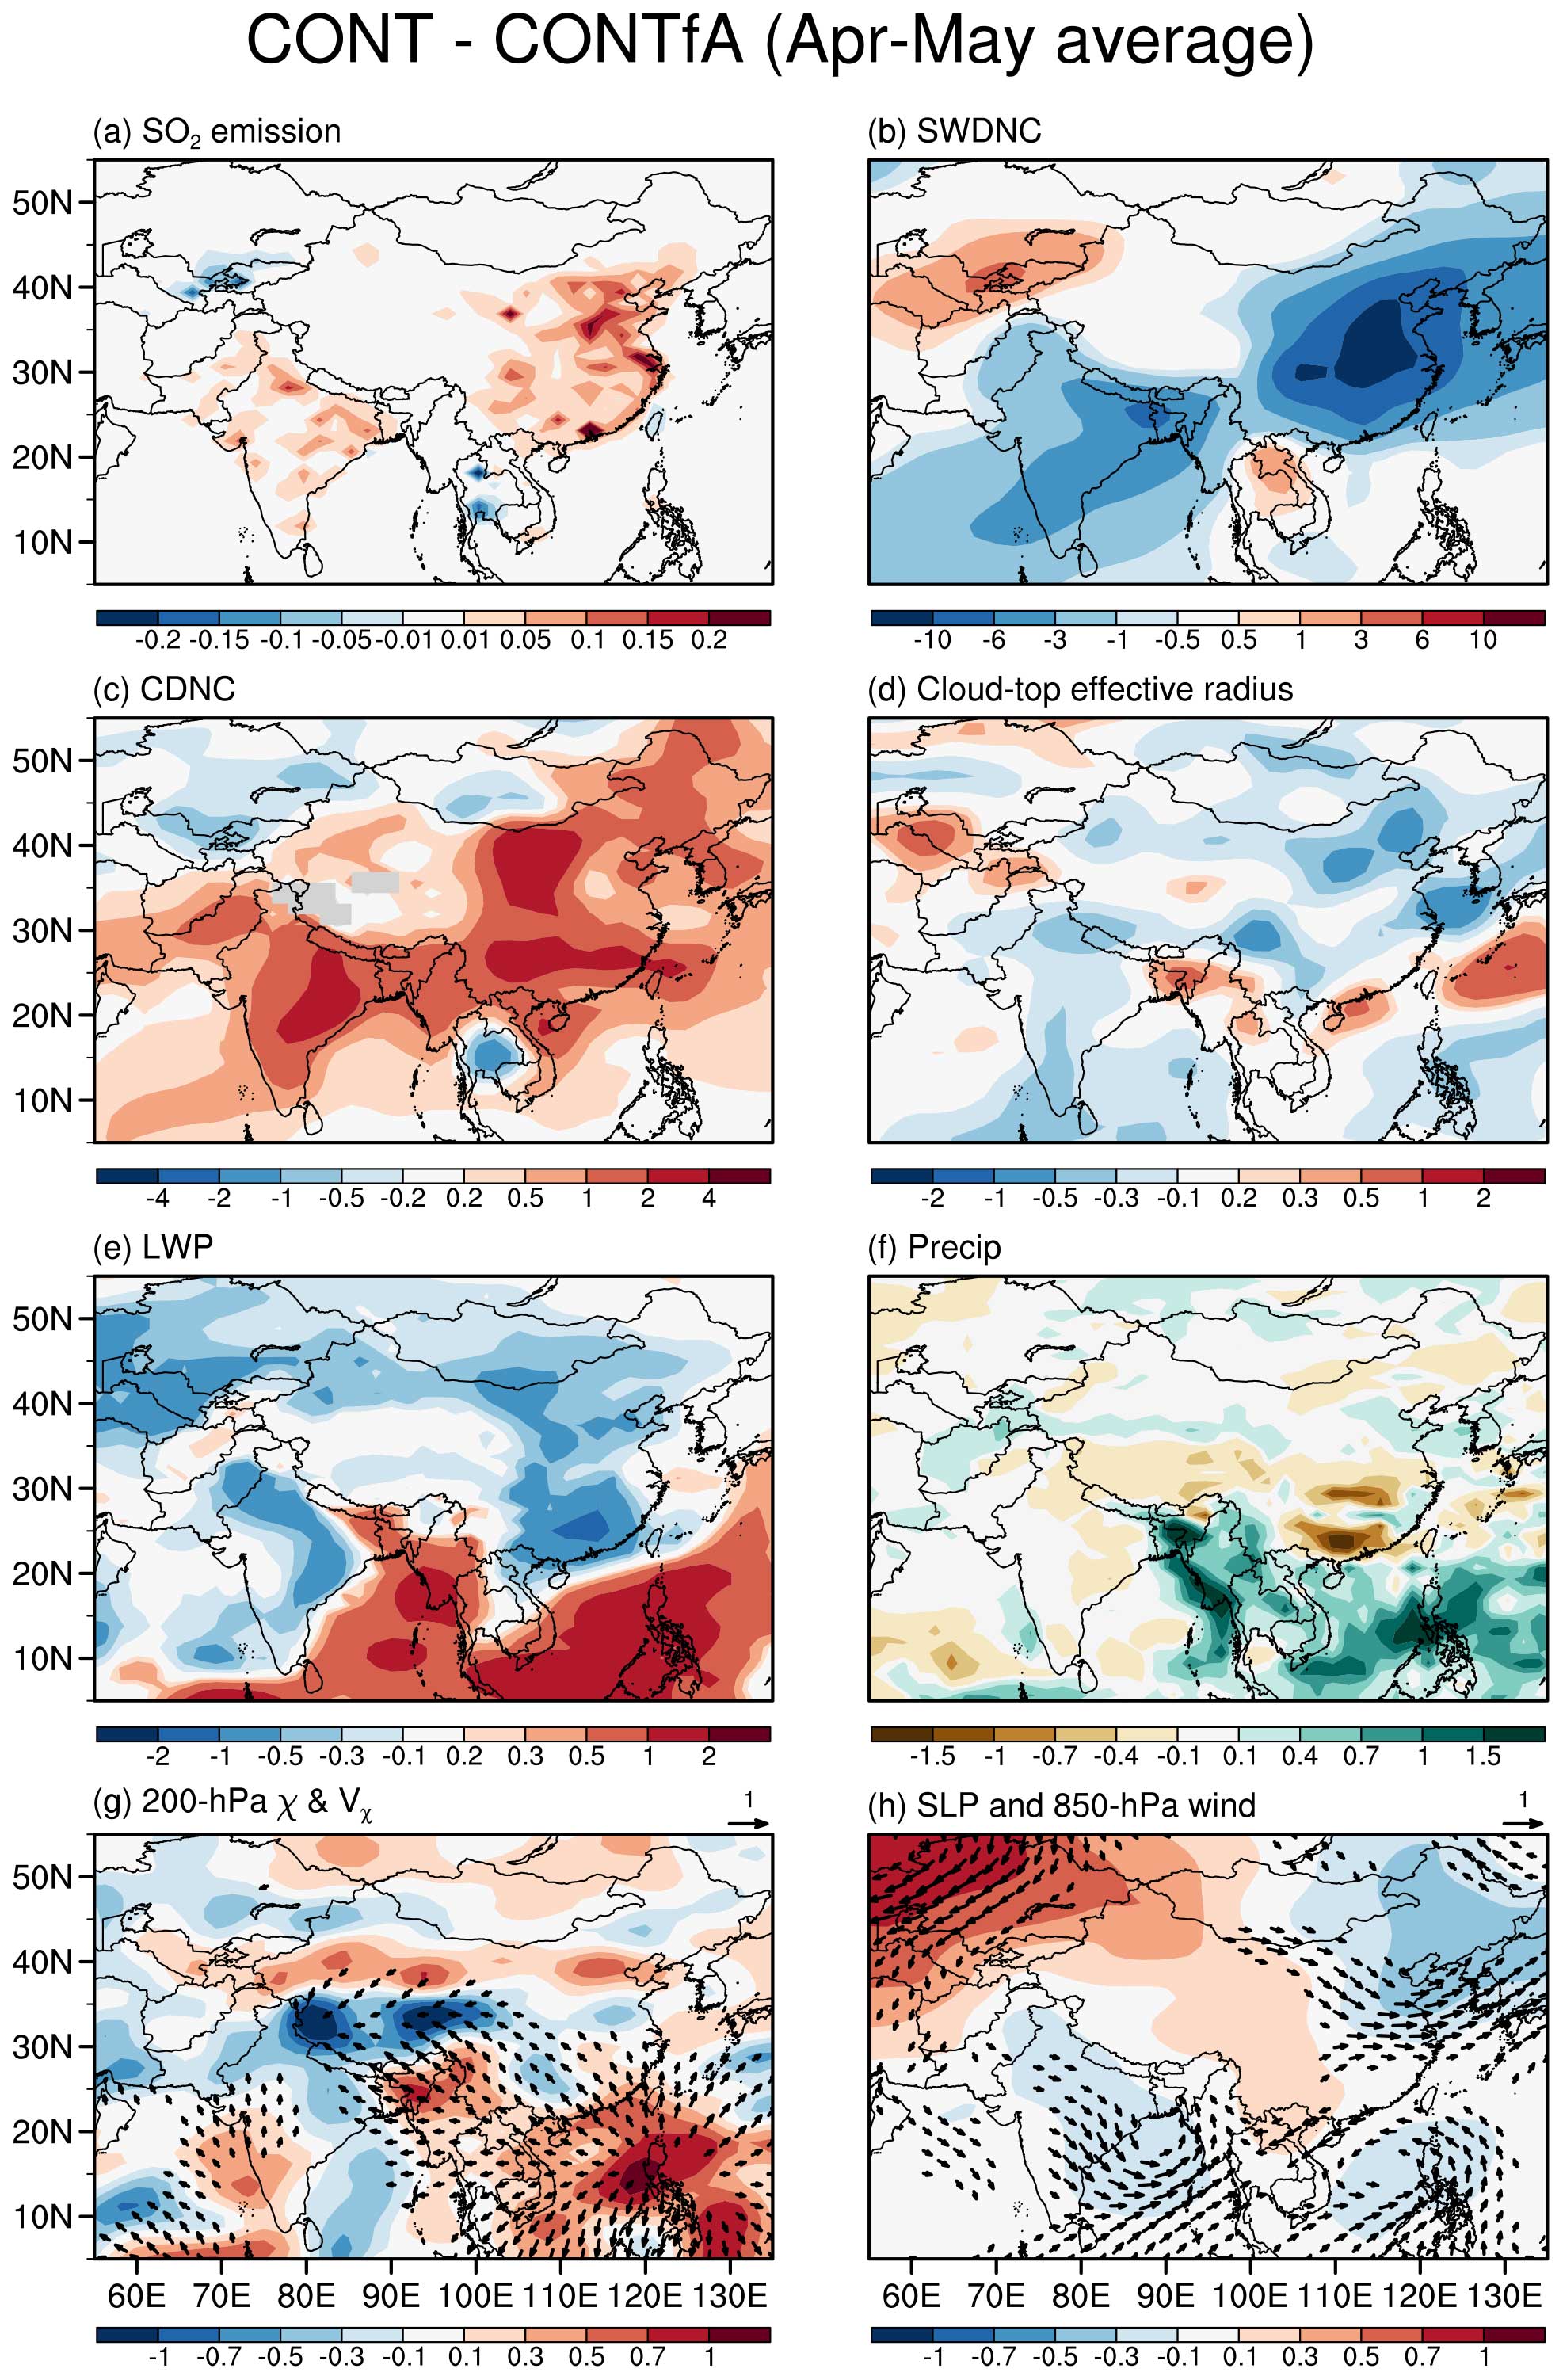
Figure 7April–May average differences in (a) SO2 emissions (Tg yr−1), (b) clear-sky downward shortwave radiation (SWDNC) (W m−2), (c) cloud droplet number concentration (1010 m−2), (d) cloud-top effective radius (µm), (e) liquid water path (LWP; g m−2), (f) precipitation (mm d−1), (g) 200 hPa divergence (106 s−1, shading) and divergent wind (m s−1), and (h) sea-level pressure (hPa) and 850 hPa winds (m s−1) between CONT and CONTfA.
It is worth noting that while the band of excess climatological rainfall over southern and eastern China is present for most of the year, the magnitude of the bias undergoes a rapid increase from April until the peak in June and then decays from July to September (Fig. 6). Also, the wet bias over eastern China is particularly spatially extensive in the spring (up to 50 % of the climatology), while a weak, dry anomaly appears in the summer over the lower reaches of the Yangtze River. Importantly, the widespread wet anomaly over China in April–May is largely collocated with the largest aerosol emission sources, particularly SO2 (Fig. 7a). The excess climatological moisture available over China provides favorable conditions for the aerosol impact via aerosol–cloud interactions in addition to changes in radiation. In fact, the CONT − CONTfA difference shows reduced shortwave clear-sky radiation at the surface, a simultaneous increase in cloud droplet number concentration, and a decrease in the cloud-top effective radius (Fig. 7b–d). An anomalous anticyclone situated over southeastern China (Fig. 7h), consistent with the pattern of aerosol forcing, leads to a meridional dipole in the water content and precipitation response, with large and widespread wet anomalies over the Indochinese Peninsula and the SCS and drying over eastern China (Fig. 7e and f).
Conversely, the model underestimates the observed rainfall over the already-dry pre-monsoon Indian subcontinent, with a substantial dry bias over eastern India and the BOB (Fig. 6a and b). In response to the aerosol increase, there is a clear reduction in clear-sky shortwave radiation over India, although it is secondary to that over China due to the smaller emission changes, and a minor increase (decrease) in cloud droplet number concentration (cloud-top effective radius) (Fig. 7b–d). This indicates overall weak aerosol–radiation and aerosol–cloud interactions, resulting in negative, although very weak, precipitation anomalies and associated mixed lower-tropospheric circulation response (Fig. 7f and h). It is worth noting that the upper-level divergent outflow from the rainfall maximum anomaly over the Indochinese Peninsula converges over northeastern India, where it subsides and generates a near-surface return flow, forming a system of closed and interacting cells (Fig. 7g and h).
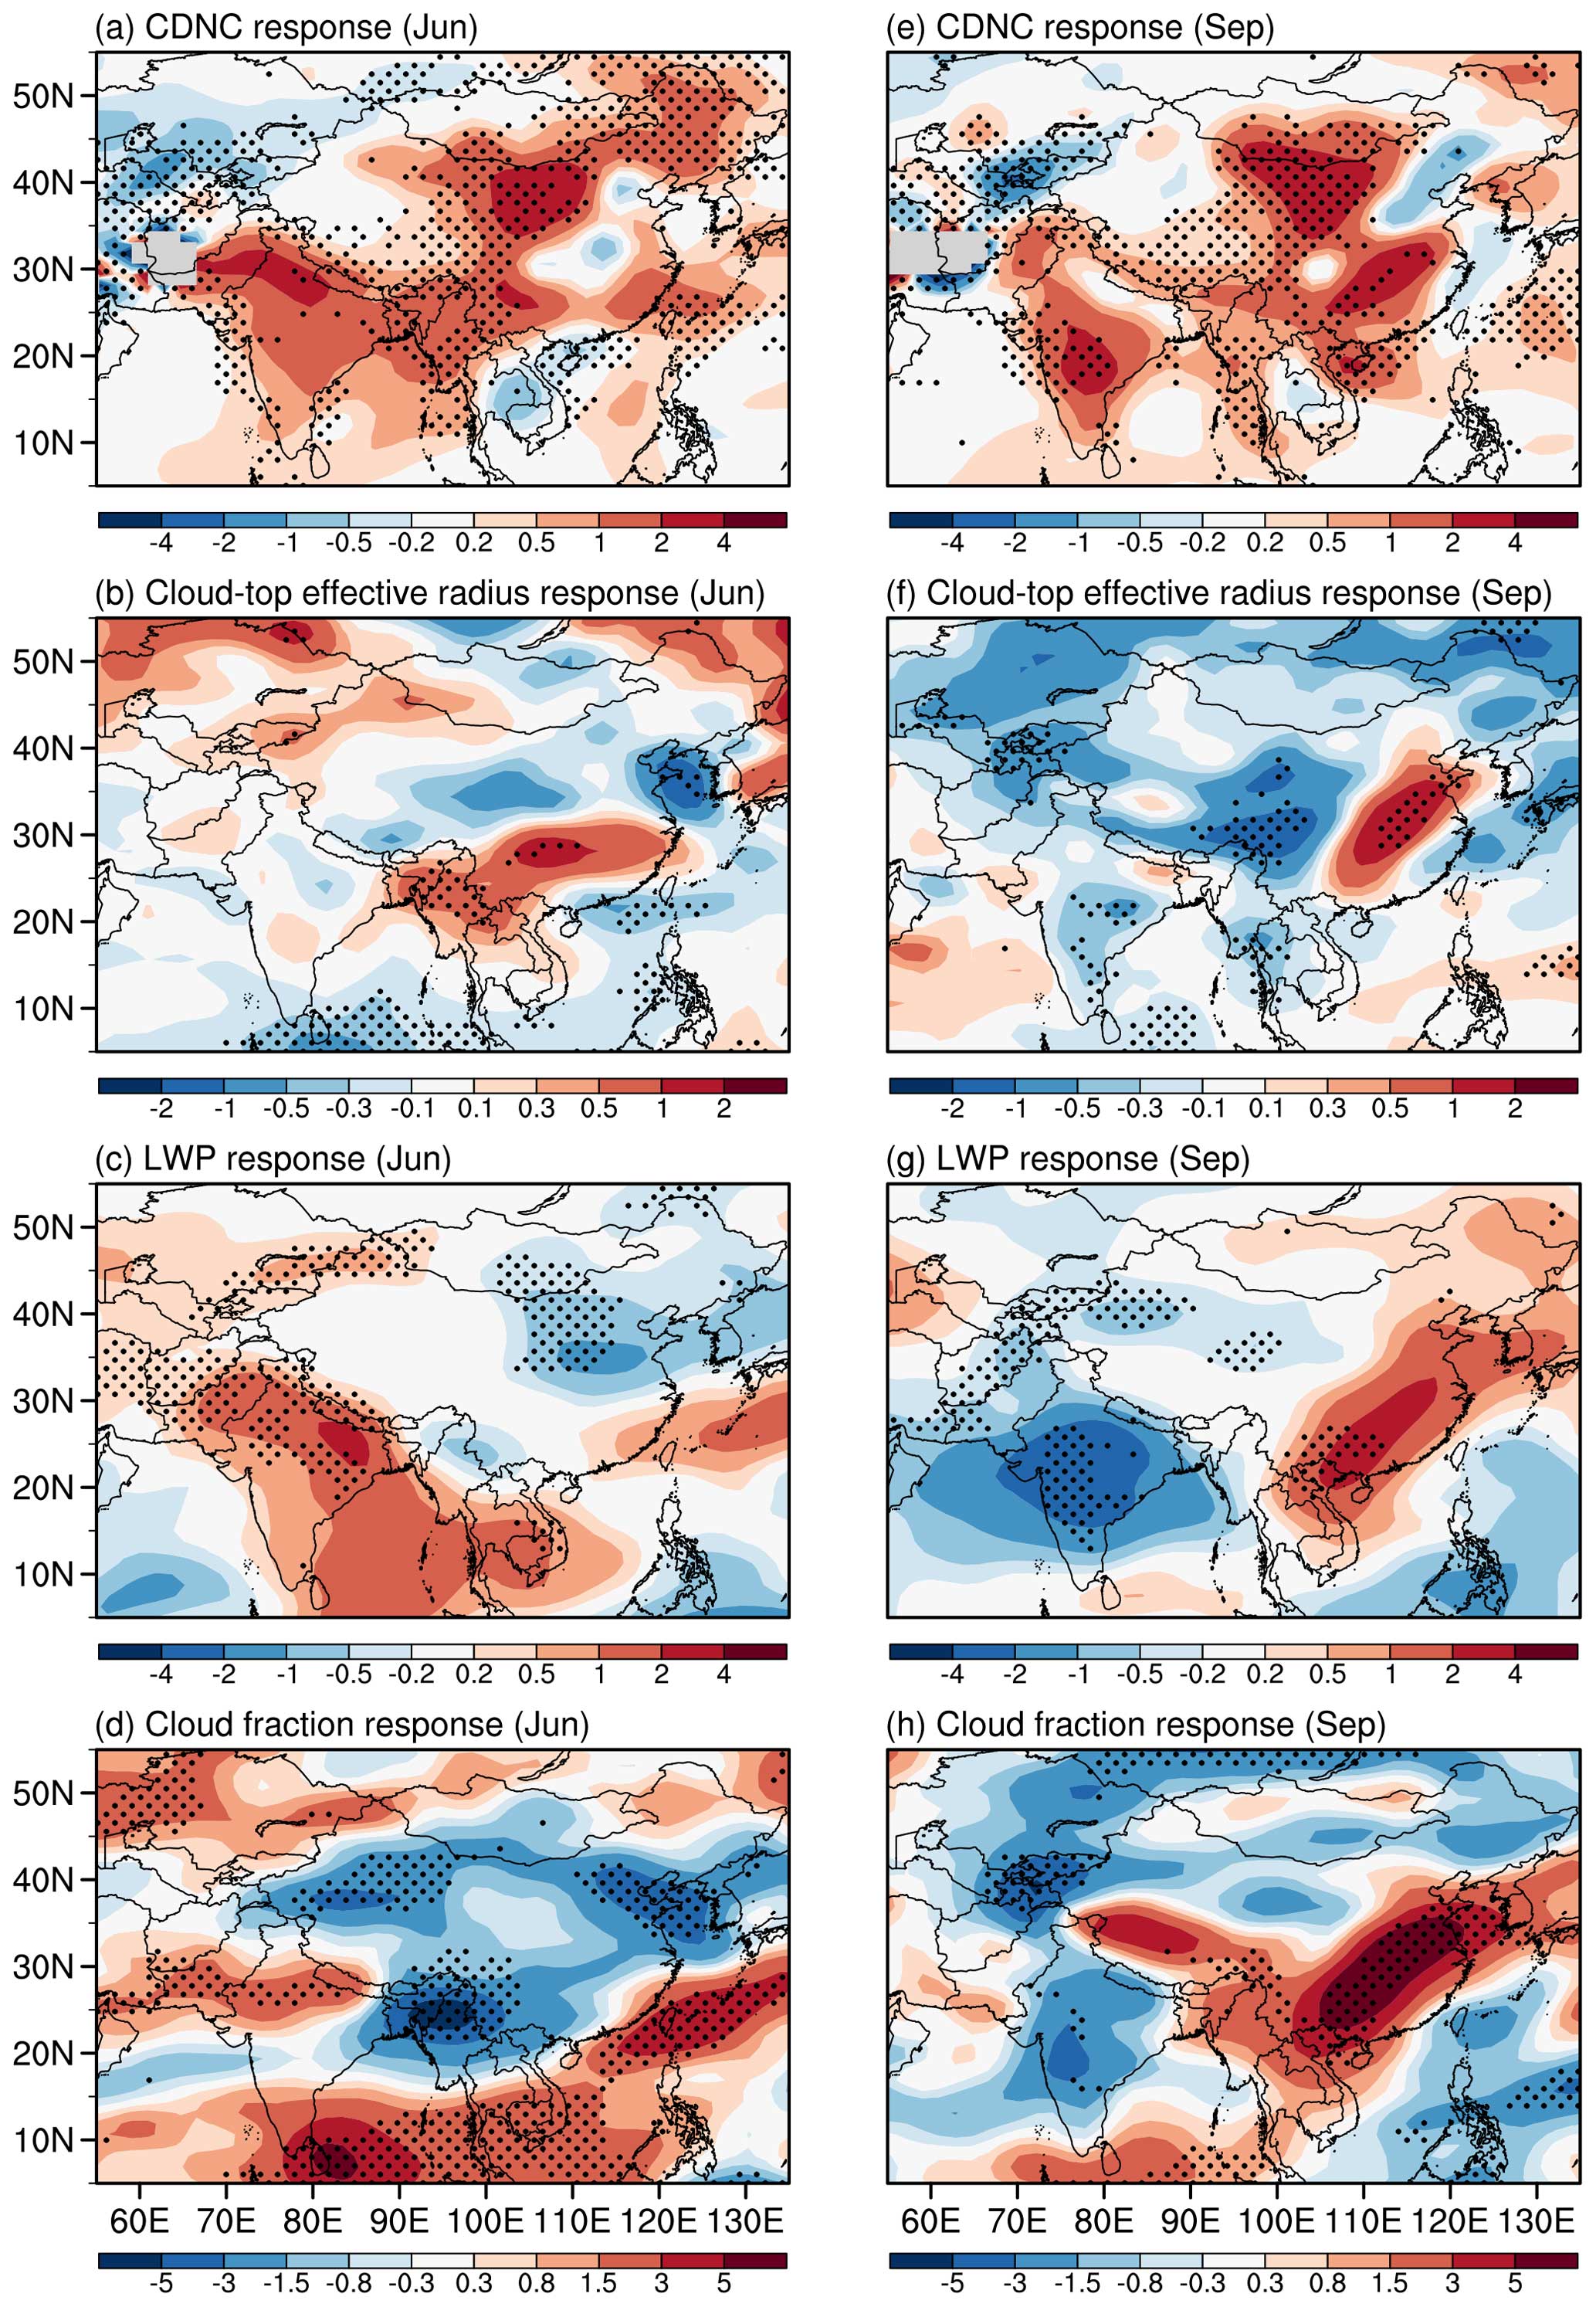
Figure 8June response to Asian anthropogenic aerosols (difference between CONT and CONTfA averaged during 2003–2012) for (a) cloud droplet number concentration (1010 m−2), (b) cloud-top effective radius (µm), (c) liquid water path (g m−2), and (d) cloud fraction (%). (e–h) Same as (a)–(d) but for September. Black dots mark grid points for which the difference is significant at the 90 % confidence level.
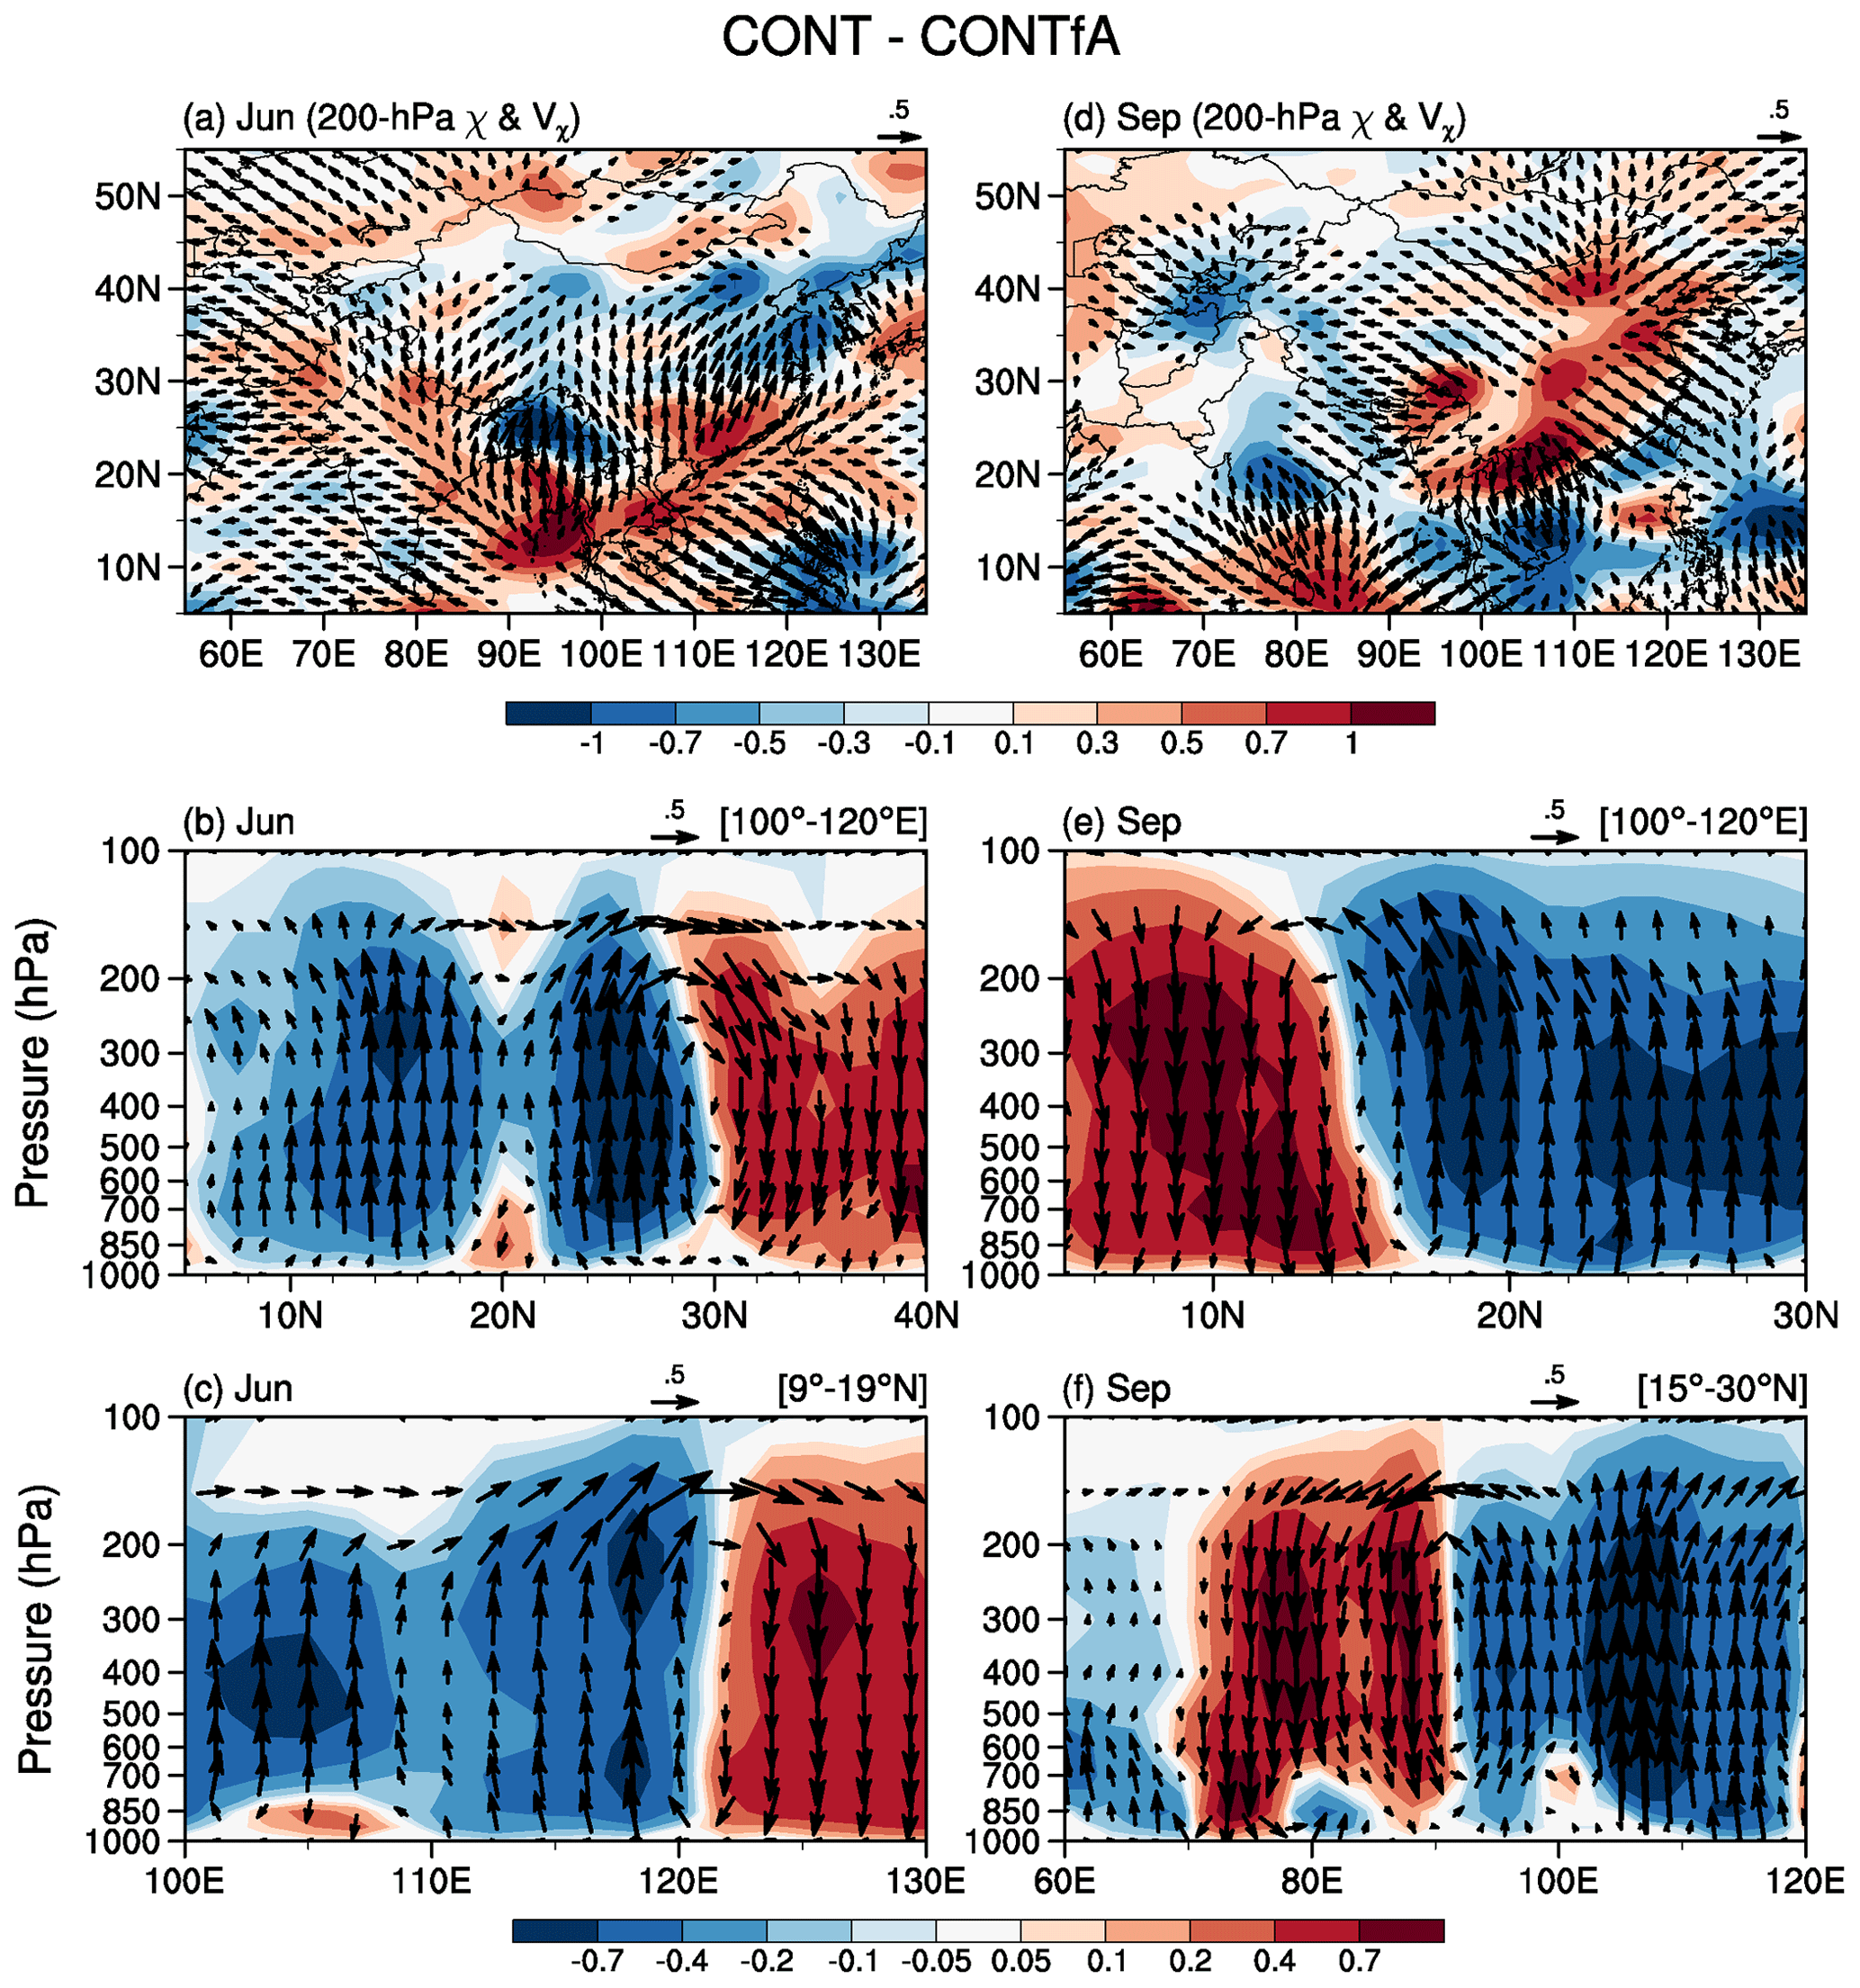
Figure 9June differences in (a) 200 hPa divergence (106 s−1, shading) and divergent wind (mm d−1) and (b, c) vertical cross-section of vertical velocity (10−2 Pa s−1) and divergent circulation averaged over (b) 100–120° E and (c) 9–19° N. (d–f) Same as (a)–(c) but for September.
3.3.3 Contrasting bias and response between early and late summer
With the arrival and establishment of the monsoon over Asia in June, the simulated climatological precipitation increases considerably over the northern Indochinese Peninsula and southern China but only marginally over India (Fig. S1 in the Supplement), resulting in a substantial zonal precipitation dipole in the model bias across Asia, with marked dry anomalies over and around India and wet conditions over Southeast Asia and southern China (Fig. 5a). There is also a dry anomaly over eastern China, resulting from weak southwesterlies and stagnation of the monsoon front to the south (Liu et al., 2021). As in the spring, the patterns of the precipitation bias and associated water content anomalies are important to understand the corresponding aerosol-driven response. The anticyclonic circulation anomaly over eastern China strengthens and widens compared to the earlier months from both aerosol–radiation and aerosol–cloud interactions (Figs. 5c and 7h), manifested in the considerable reduction in surface clear-sky shortwave radiation (Fig. S2c), overall increased cloud droplet number concentration, and decreased cloud effective radius over central and eastern China (Fig. 8a and b). Note the latter displays positive anomalies over southern China, where enhanced easterlies along the southern flank of the anticyclone bring moisture-laden air from the western Pacific towards South Asia (Fig. 5c), leading to increased water availability and the large precipitation excess there. Over India, the substantial climatological atmospheric water content deficit, seeing in the ensuing large dry bias (Fig. 5a), strongly limits local aerosols from exerting a sizable impact by markedly weakening the magnitude of regional aerosol–cloud interactions (e.g., modest changes in cloud-top effective radius in Fig. 8b). Regional anomalies in the aerosol response are thus interpreted as remotely induced by the large-scale circulation adjustment to aerosol changes over China. Local aerosols and the ensuing circulation and precipitation response are therefore tightly coupled over Asia and linked by positive feedbacks, whereby an initial aerosol-induced anomaly in precipitation subsequently acts to reinforce the anomalous pattern by regional circulation adjustments. For example, the deep ascent and upper tropospheric divergent outflow associated with the excess precipitation over the BOB and Indochinese Peninsula bifurcates into the primary branch converging and subsiding over northeastern China (reinforcing the local anticyclone) and the secondary branch over the southeastern Philippines Sea where dry anomalies are found and are part of the northwestward rainfall shift (Fig. 9a–c).
As summer progresses, the simulated climatological precipitation reaches its peak over India, while it retreats markedly over China (Fig. S2a and b). This, together with the anomalies set up as part of the aerosol response in the earlier part of the season (Fig. 5b), leads to enhanced moisture availability over South Asia compared to the earlier months while also partially alleviating the reduced, but persistent, model dry bias there (Fig. 5e). Conversely, over China, the moisture deficit from the aerosol-weakened monsoon circulation (Fig. 5b), as well as the rapid monsoon demise in the simulated climatology (Fig. S2e), contributes to lessening the degree of interaction between aerosols and clouds and precipitation. As a result, aerosol–cloud interactions over South Asia are more effective compared to the early summer, and the continental-scale simulated response is predominantly driven by aerosol-induced anomalies over South Asia. Associated with a decrease in cloud-top effective radius (Fig. 8f), negative precipitation anomalies appear over South Asia from August (Fig. 4c), with a maximum peak in September (Fig. 4d). Correspondingly, the lower-tropospheric circulation features an anomalous anticyclone, with westerly winds over northern India and the BOB (Fig. 5g). The flow turns southwesterly over the northern Indochinese Peninsula, bringing more moisture to eastern China (leading to increased cloud-top effective radius in Fig. 8f) and increasing precipitation, which forms a zonal dipole with the rainfall decrease over the north equatorial western Pacific (Fig. 5f and h). The associated anomalous western Pacific anticyclone weakens and shifts eastward (Fig. 5g). The large-scale anomalous circulation pattern is characterized by the mid-tropospheric vertical motion and divergent outflow over southern China and upper-level convergence and subsidence over South Asia and the north equatorial western Pacific (Fig. 9d–f), which further attests to the strong coupling across the region.
3.4 Response in nudged simulations
The Asian monsoon response to aerosol changes discussed above entails large-scale atmospheric circulation adjustments extending beyond the Asian region. It is therefore interesting to understand the extent to which they contribute to driving the regional response. Constraining the large-scale circulation outside Asia to observations allows us to isolate the effect of remote (i.e., outside Asia) circulation changes in generating the monsoon response to Asian aerosols.
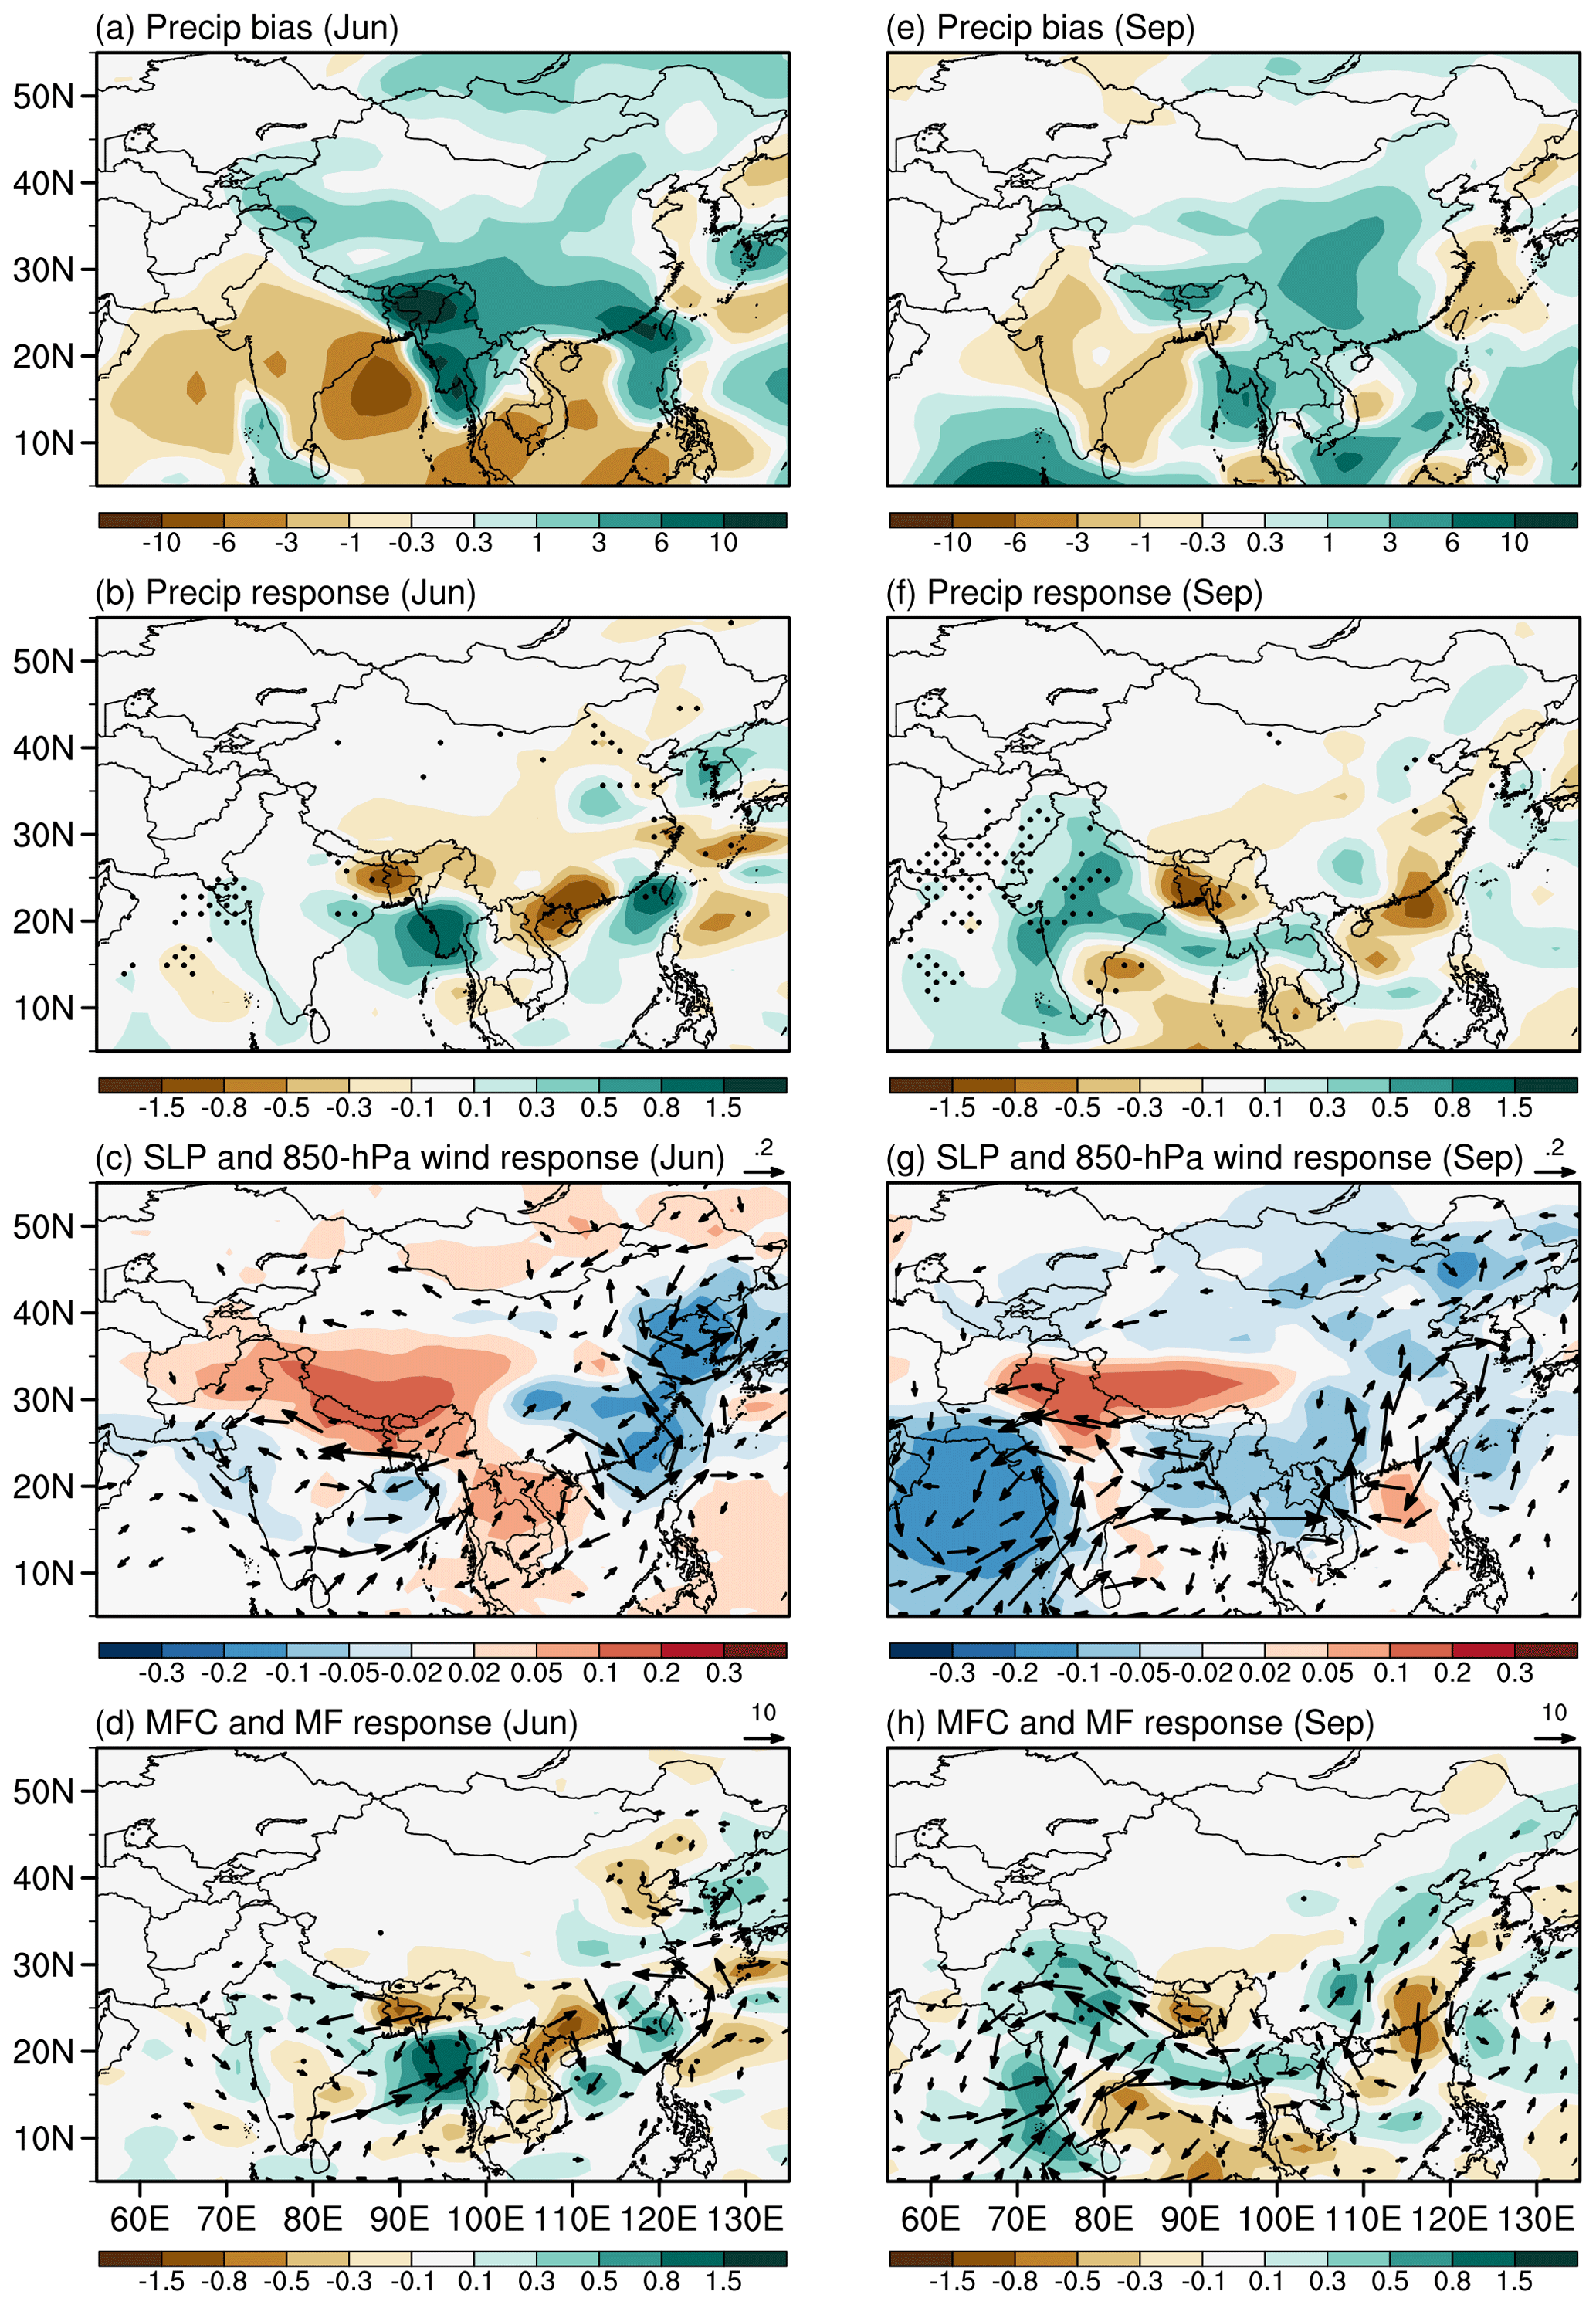
Figure 10Same as Fig. 5 but for the difference between the corresponding nudged simulations (i.e., NUDG − NUDGfA).
The AOD differences between the pair of nudged simulations (Fig. S3) resemble those shown in Fig. 2 despite the considerably different circulation and precipitation anomalies (see Figs. 5c, g and 10c, g), indicating that the AOD distribution is predominantly influenced by emission changes rather than by aerosol transport and removal processes. The spatial patterns of both the June and the September precipitation biases in NUDG, where horizontal winds outside Asia are nudged to ERA-I, are overall very similar to those in the control simulation (see Fig. 10a and e). Sub-regional differences in the magnitude of the bias between the two sets of experiments are however noticeable (e.g., the dry bias is markedly reduced over India, whereas southeastern China is wetter, compared to CONT), indicating that an improved representation of the remote circulation can potentially reduce the precipitation bias in some areas but not necessarily across the entire domain (Liu et al., 2021).
The June precipitation response to aerosol changes features an approximately meridional dipole, with widespread drying from northeastern India to southern China and wet anomalies over central India, the BOB, and parts of the South China Sea (Fig. 10b). Compared to the free-running simulations, precipitation anomalies are of much smaller magnitude and mostly confined to Asia and the neighboring oceanic areas, without a significant aerosol signature downstream (e.g., over the equatorial Indian Ocean and the subtropical Pacific). This is expected as the atmospheric circulation above the planetary boundary layer is nudged outside Asia, and it attests to the key role of large-scale circulation adjustments in realizing the aerosol impact. Consistently with the link between rainfall bias and the response to aerosol forcing found in the free-running simulations, wetter climatological conditions over China and a reduced dry bias over India translate into more efficient aerosol–cloud interactions over both regions (Fig. 10a). As a result, the ensuing precipitation response, while bearing similarities to that in Fig. 5 and thus the driving role of Chinese aerosol emissions, also shows noticeable differences: the drying over China is more spatially extensive, particularly to the south, while the wetting over the Indian sector is mainly confined to the northern BOB (Fig. 10b). While the sign and pattern of the aerosol-induced response are consistent with the bias pattern, the generally weak anomalies are a result of the unchanged large-scale circulation outside Asia in the nudged experiments. For example, Fig. 10c shows a pattern of sea-level pressure anomalies which resembles that shown in Fig. 5c but with much smaller gradients and mostly confined to Asia only. In particular, there is only a very weak westerly flow across the north equatorial Indian Ocean, with reduced moisture supply towards the Indochinese Peninsula and southern China, in contrast to the vigorous cross-equatorial moisture-laden flow from the western Indian Ocean in the free-running experiments. These anomalies, a manifestation of a local aerosol effect, are indicative of the predominant role of large-scale circulation adjustments and two-way interactions with local anomalies in realizing the full extent of the aerosol impact over Asia. Nudging the circulation outside Asia thus proves to be a strong constraint on the model response to aerosols over Asia, despite unchanged emissions compared to the free-running simulations.
In September, the dry bias over India is reduced compared to June (Fig. 10e) as in the free-running simulation. The wet bias over China is also reduced overall in magnitude compared to June, although NUDG is wetter than CONT (Fig. 2b), which may be conducive to enhanced aerosol–cloud interactions. In fact, CDNC increases across Asia (Fig. S4c) but cloud-top effective radius decreases mainly over central and eastern China, with conversely muted changes over India (Fig. S4d). As a result, precipitation decreases over most of central and eastern China, accompanied by positive sea-level pressure anomalies and anomalous low-tropospheric anticyclonic circulation (Fig. 10f and g). The anomalous easterly flow over the northern Indochinese Peninsula and northern India draws anomalous southwesterly moisture transport across India, which features widespread wetting. Like during June, the lack of circulation adjustments outside Asia appears to play an important role in determining the magnitude and sign of the aerosol response: the marked anomalous anticyclone over the subtropical western Pacific in the free-running simulations contributes to the strong southerly moisture advection towards southern and eastern China and thus to the generation of the precipitation increase (Fig. 5g and f). These features are of very weak magnitude in the nudged experiments due to the fixed circulation, leading to prevalently dry conditions over China (as opposed to wet anomalies). This, in turn, contributes to weakening, or even opposing, the anomalous westerly wind across India and the Indochinese Peninsula seen in CONT, with these regions now displaying prevalently wet (as opposed to dry) anomalies. These findings highlight a competing role of and complex interplay between sub-regional precipitation biases in modulating the response to aerosols.
3.5 Response in the fixed-SST PDRMIP simulations
To ascertain whether the link between climatological biases and aerosol response found above for HadGEM3-GA7.1 is common to other models, we analyze the PDRMIP multi-model experiments forced by fixed SST. In particular, models are composited based on the sign of the June precipitation bias over central India (the area 20–28° N, 73–85° E – approximately corresponding to the core monsoon region), given its key role in determining the seasonality of the aerosol imprint discussed above. Given the key role of aerosol–cloud interactions in realizing the aerosol impact, the CESM1-CAM4 and GISS models are excluded from the analysis as they include only a parameterization of aerosol–radiation interactions (Liu et al., 2018). In fact, these two models display very weak monthly precipitation variations over India and China induced by aerosol changes (not shown). Of the five remaining models, two (i.e., HadGEM3 and IPSL-CM) display a precipitation deficit, while the other three (i.e., MIROC-SPRINTARS, NorESM1, and CESM1-CAM5) present excessive rainfall over India in June (hereafter DRY and WET ensembles, respectively; Fig. S5). Biases and responses for individual models are shown in Fig. S5.
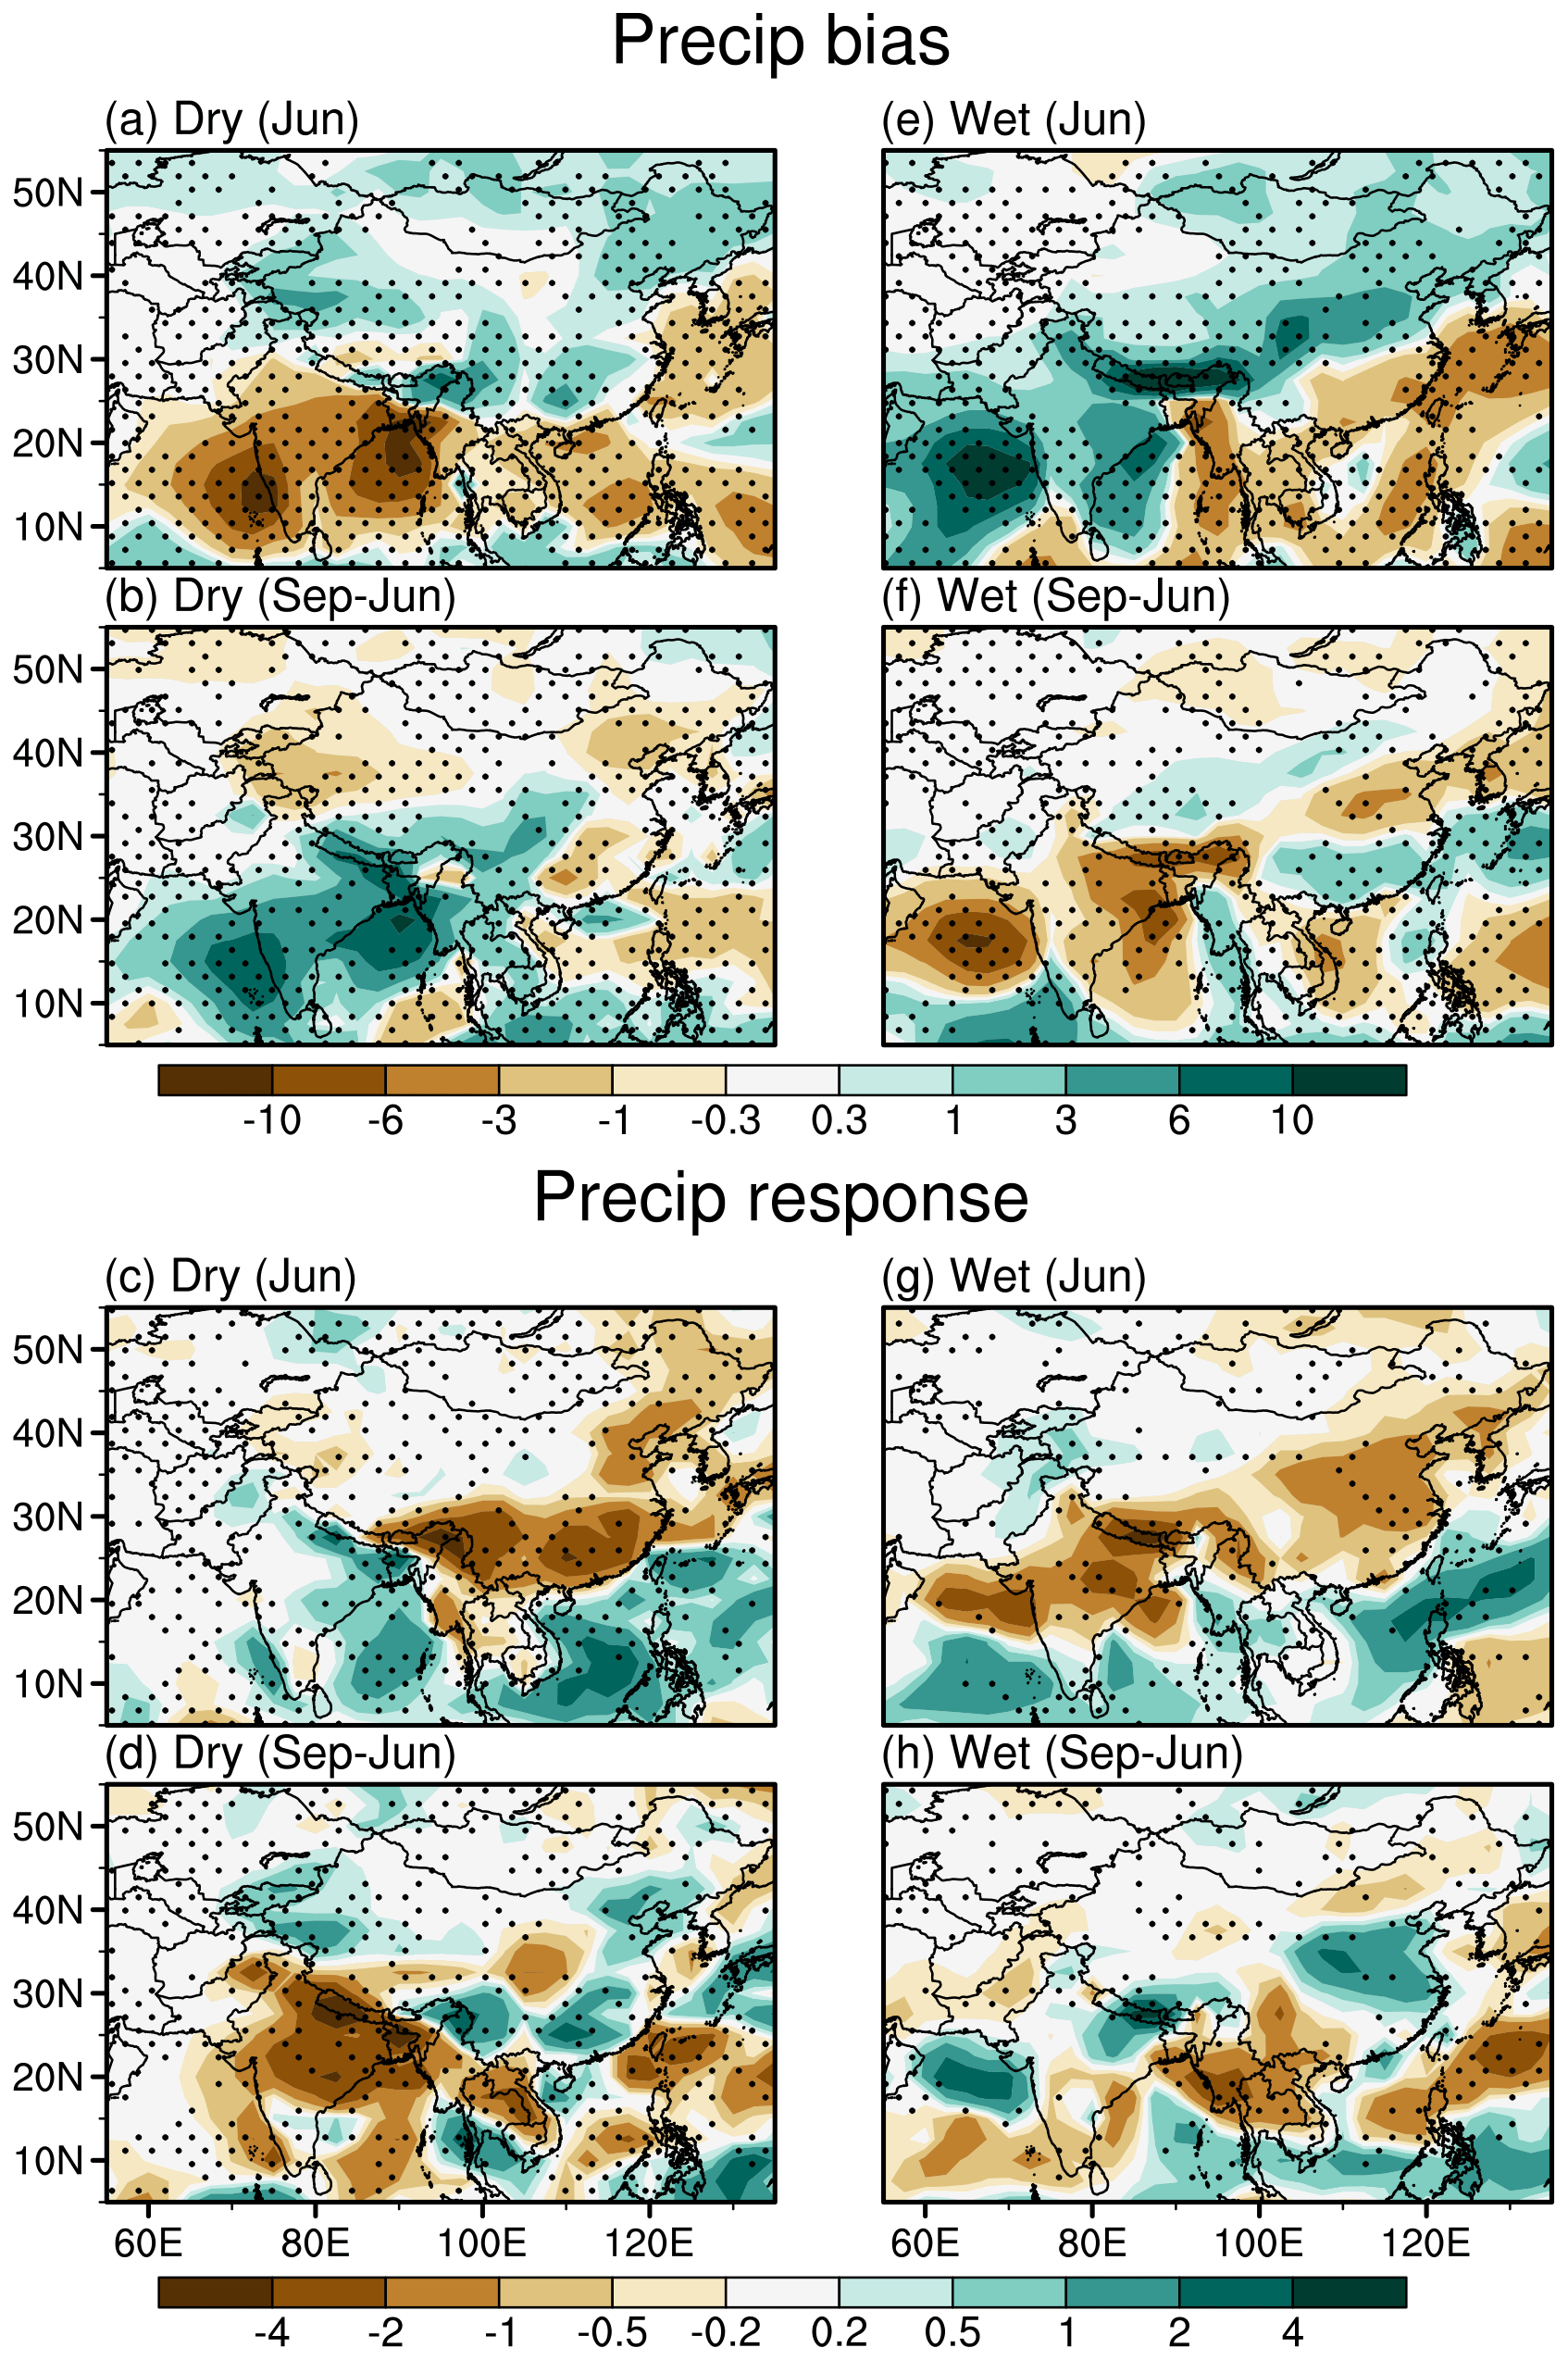
Figure 11DRY PDRMIP model composites in (a) June precipitation bias (mm d−1), (b) September-minus-June difference in precipitation bias, (c) June precipitation response to increased Asian sulfate aerosols (i.e., the difference between 10× sulfate and baseline simulations), and (d) September-minus-June difference in the precipitation response to increased Asian sulfate aerosols. (e–h) Same as (a)–(d) but for WET PDRMIP model composites. Black dots mark grid points for which all models agree on the sign of the precipitation differences.
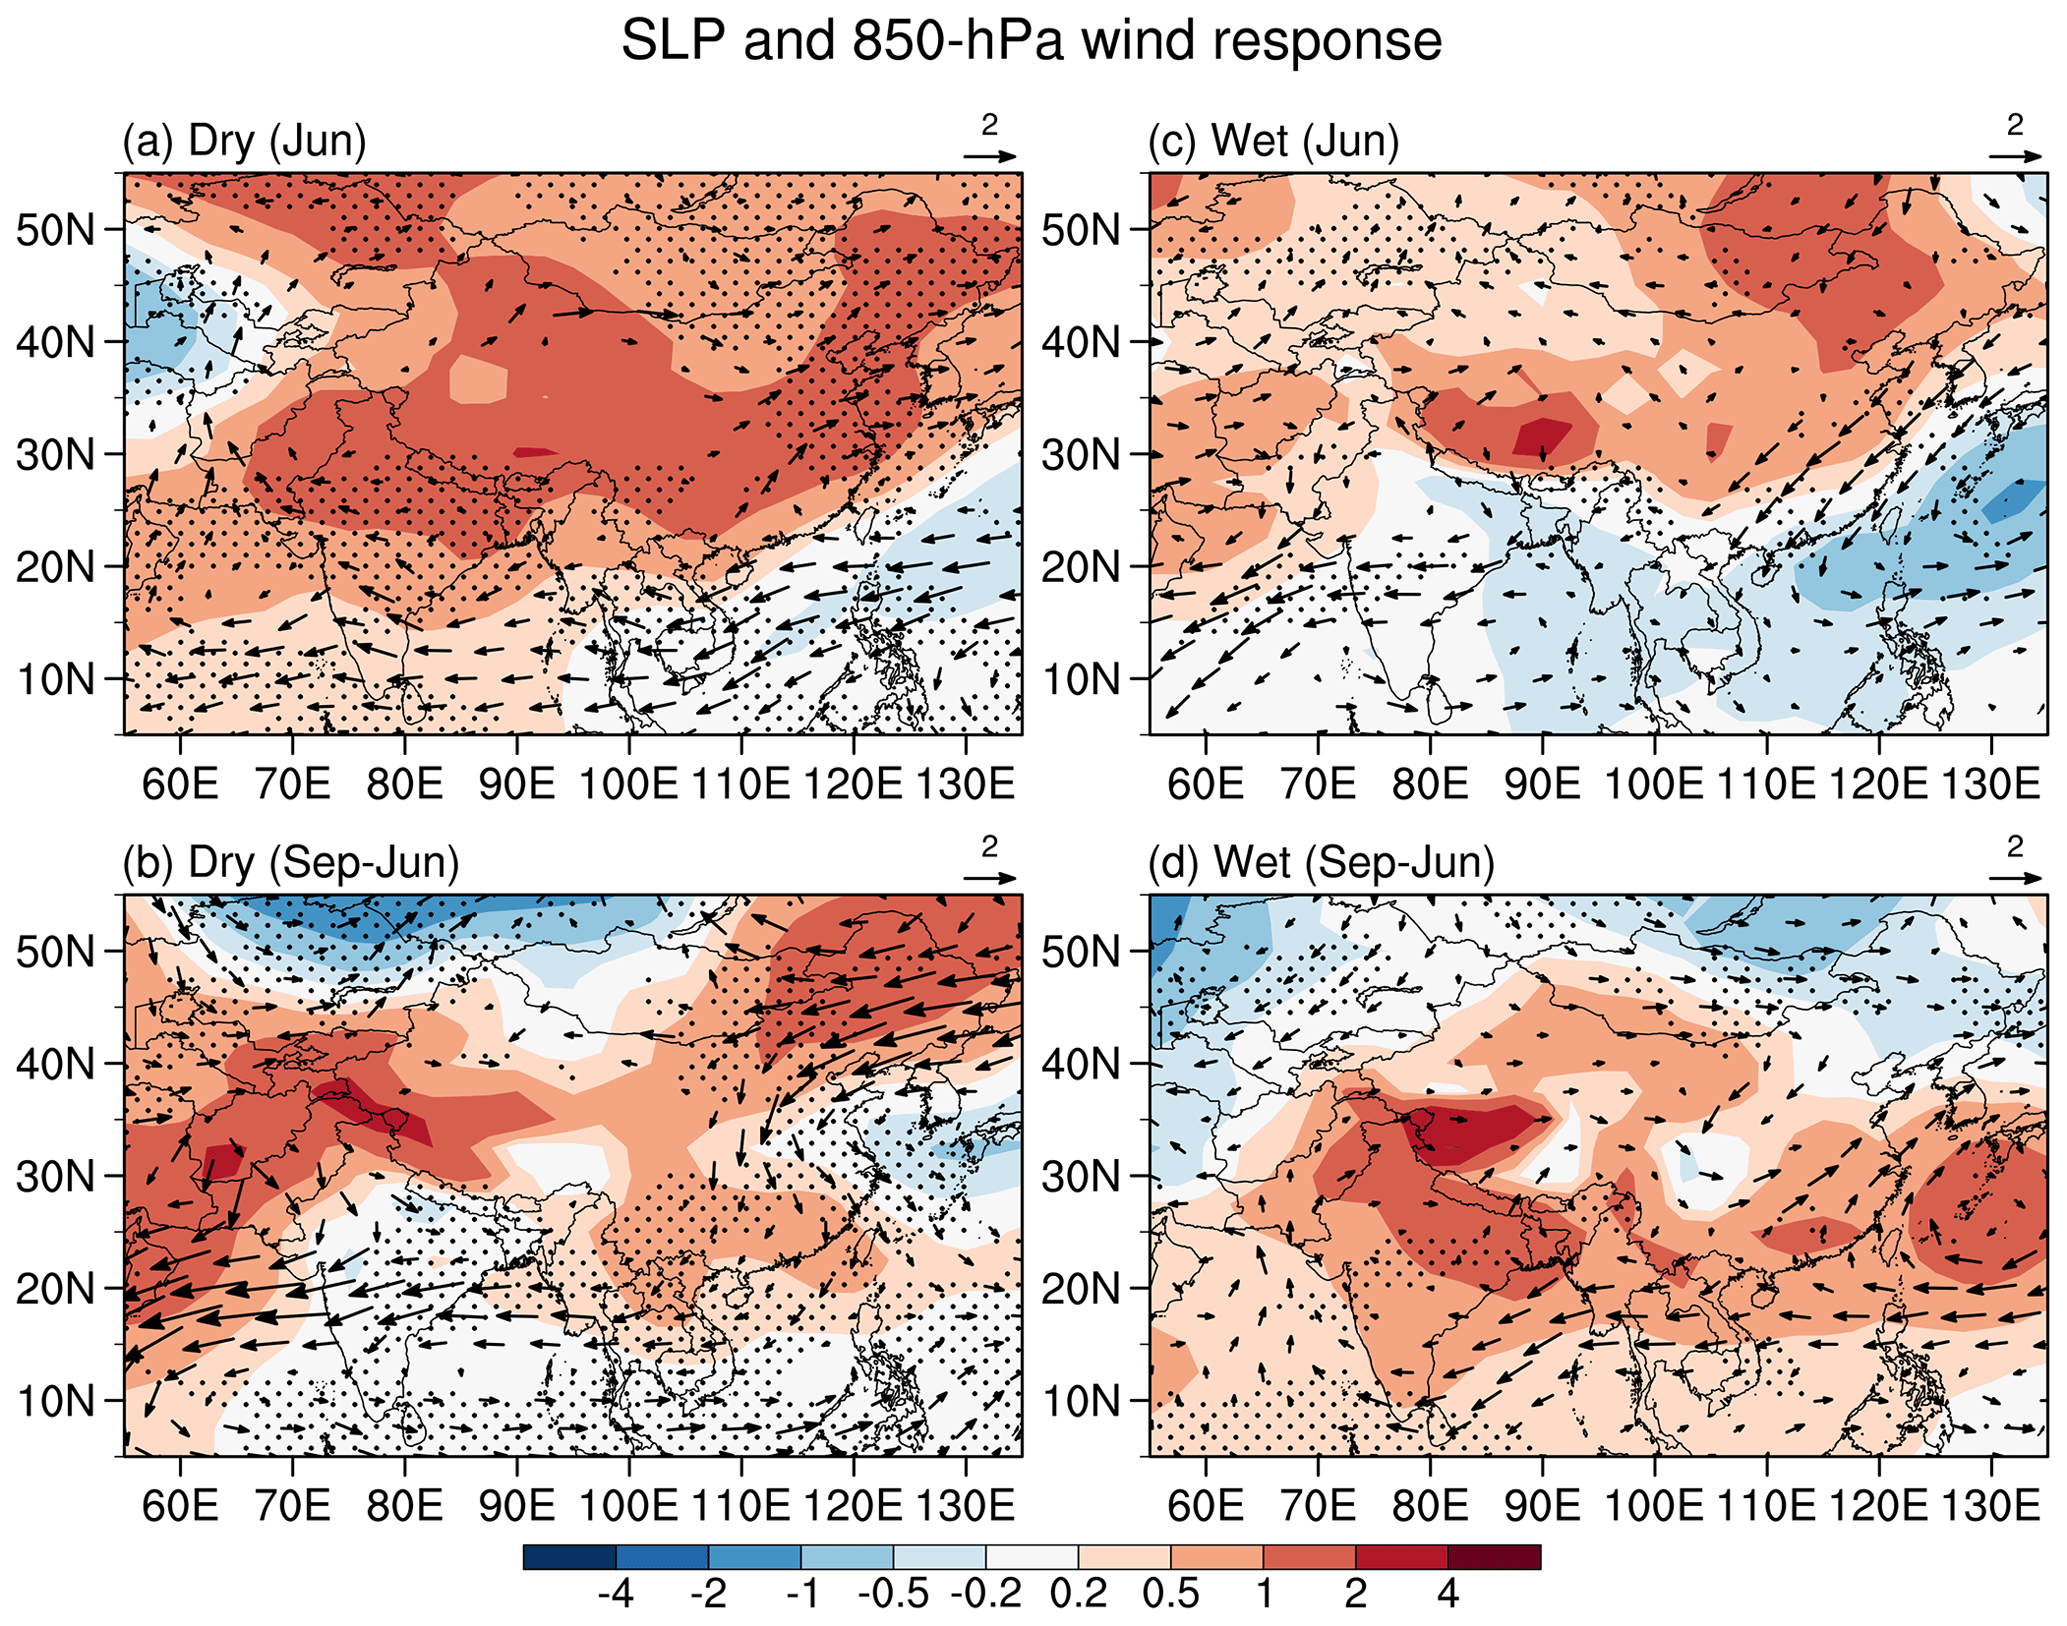
Figure 12Sea-level pressure (hPa, shading) and 850 hPa wind (m s−1) responses to increased Asian sulfate aerosols in the (a, b) DRY and (c, d) WET PDRMIP model composites. (a, c) June; (b, d) September-minus-June differences. Black dots mark grid points for which all models agree on the sign of the precipitation differences.
DRY features a dipole pattern in the June precipitation bias over Asia with drying across India and most of the Indochinese Peninsula and wetting over China, particularly to the south and east (Fig. 11a). Based on the mechanism described above, this pattern provides favorable conditions for aerosol–cloud interactions to come into play over China, leading to anomalous low-tropospheric anticyclonic flow over China (Fig. 12a), thereby reducing precipitation there and shifting it southward (Fig. 11c). This leads to compensating precipitation increases over northern India, the BOB, and the SCS. Key features of both the bias and response patterns are common, in sign and magnitude, to both HadGEM3 and IPSL-CM (Fig. S5) and overall bear marked similarity to those in HadGEM3-GA7.1 (Fig. 5). One notable difference compared to HadGEM3-GA7.1 is that DRY shows an evident meridional land–ocean contrast in the precipitation distribution over the western Pacific, with the wetting predominantly confined to the ocean and the drier Indochinese Peninsula and southeastern China. This feature is recognizable in both HadGEM3 and IPSL-CM, with the former model close to the one employed in this study, which suggests the shift is related to the differing prescribed SST patterns.
In order to account for model differences and to more clearly highlight the spatio-temporal changes between early and late summer, Fig. 11b and f show incremental variations (i.e., September-minus-June differences) rather than absolute anomalies. The DRY bias features a relative precipitation excess over India, the northern BOB, and most of the Indochinese Peninsula and a deficit over eastern China. Correspondingly, the aerosol-induced response shows easterly flow (Fig. 12b) and widespread decreased precipitation across the Indian subcontinent in September with respect to June (Fig. 11d), associated with an anticyclonic anomalous flow over the SCS (Fig. 12b) and contributing to precipitation increases over southern and eastern China. There is again marked similarity between these patterns and those for the HadGEM3-GA7.1. As noted for the June response, there is a strong land–ocean contrast in the WET precipitation distribution over the East Asian sector.
Turning to the analysis of the WET ensemble, the June bias features precipitation excess over most of India and central and northern China, while deficient precipitation is seen over eastern and southern China (Fig. 11e). This pattern, with opposite anomalies over India and a reversed meridional dipole over China compared to DRY, is conducive to strong aerosol–cloud interactions over India and relatively weak signals over eastern China (compared to DRY). As a result, the WET response displays northeasterly flow and widespread drying over India and a cyclonic anomaly over the tropical western Pacific, leading to dry northeasterlies over central and eastern China and wet anomalies over the SCS (Figs. 11g and 12c). The June-to-September incremental bias features an approximately opposite pattern to that in June, and so does the precipitation response (Fig. 11f and h). Overall, the reversed polarity of bias and responses in WET compared to DRY and the consistency of the key features of the patterns among the individual models further corroborate the robustness of the physical mechanism proposed above.
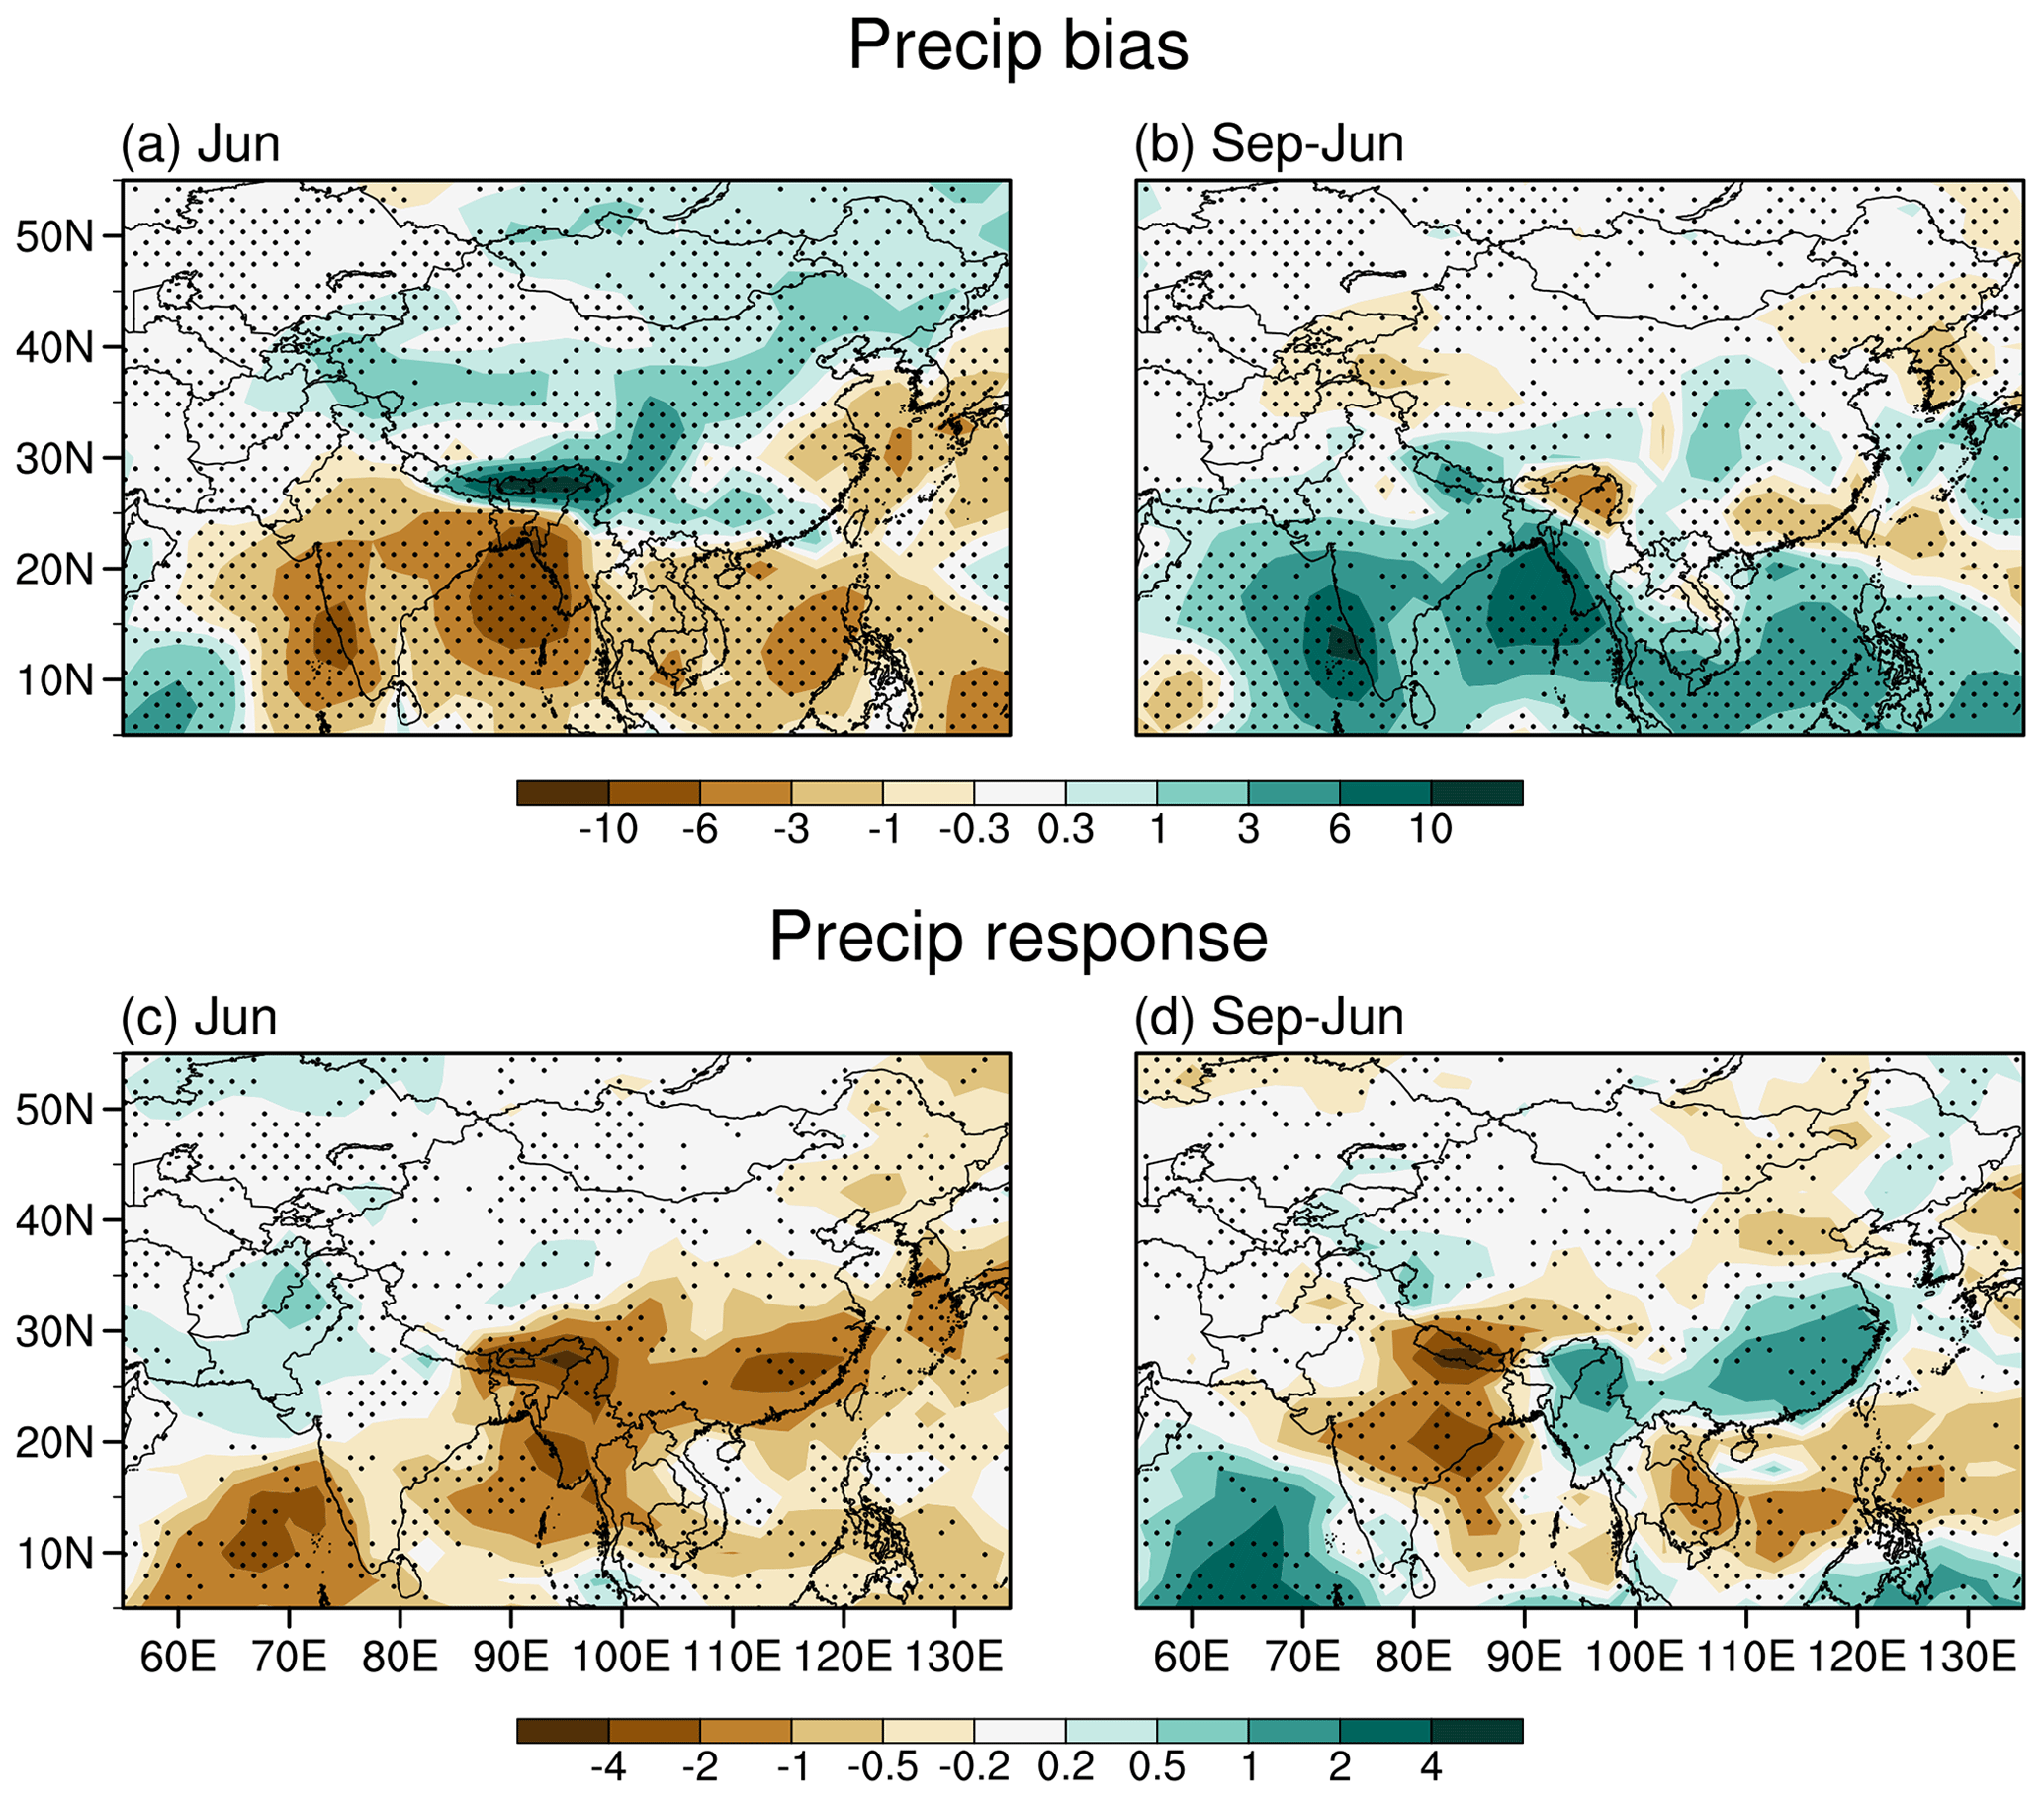
Figure 13PDRMIP coupled model composites in (a) June precipitation bias (mm d−1) and (c) June precipitation response to increased Asian sulfate aerosols (i.e., the difference between 10× sulfate and baseline simulations). (b, d) Same as (a) and (c) but for the September-minus-June differences. Black dots mark grid points for which at least four out of the five models agree on the sign of the precipitation differences.
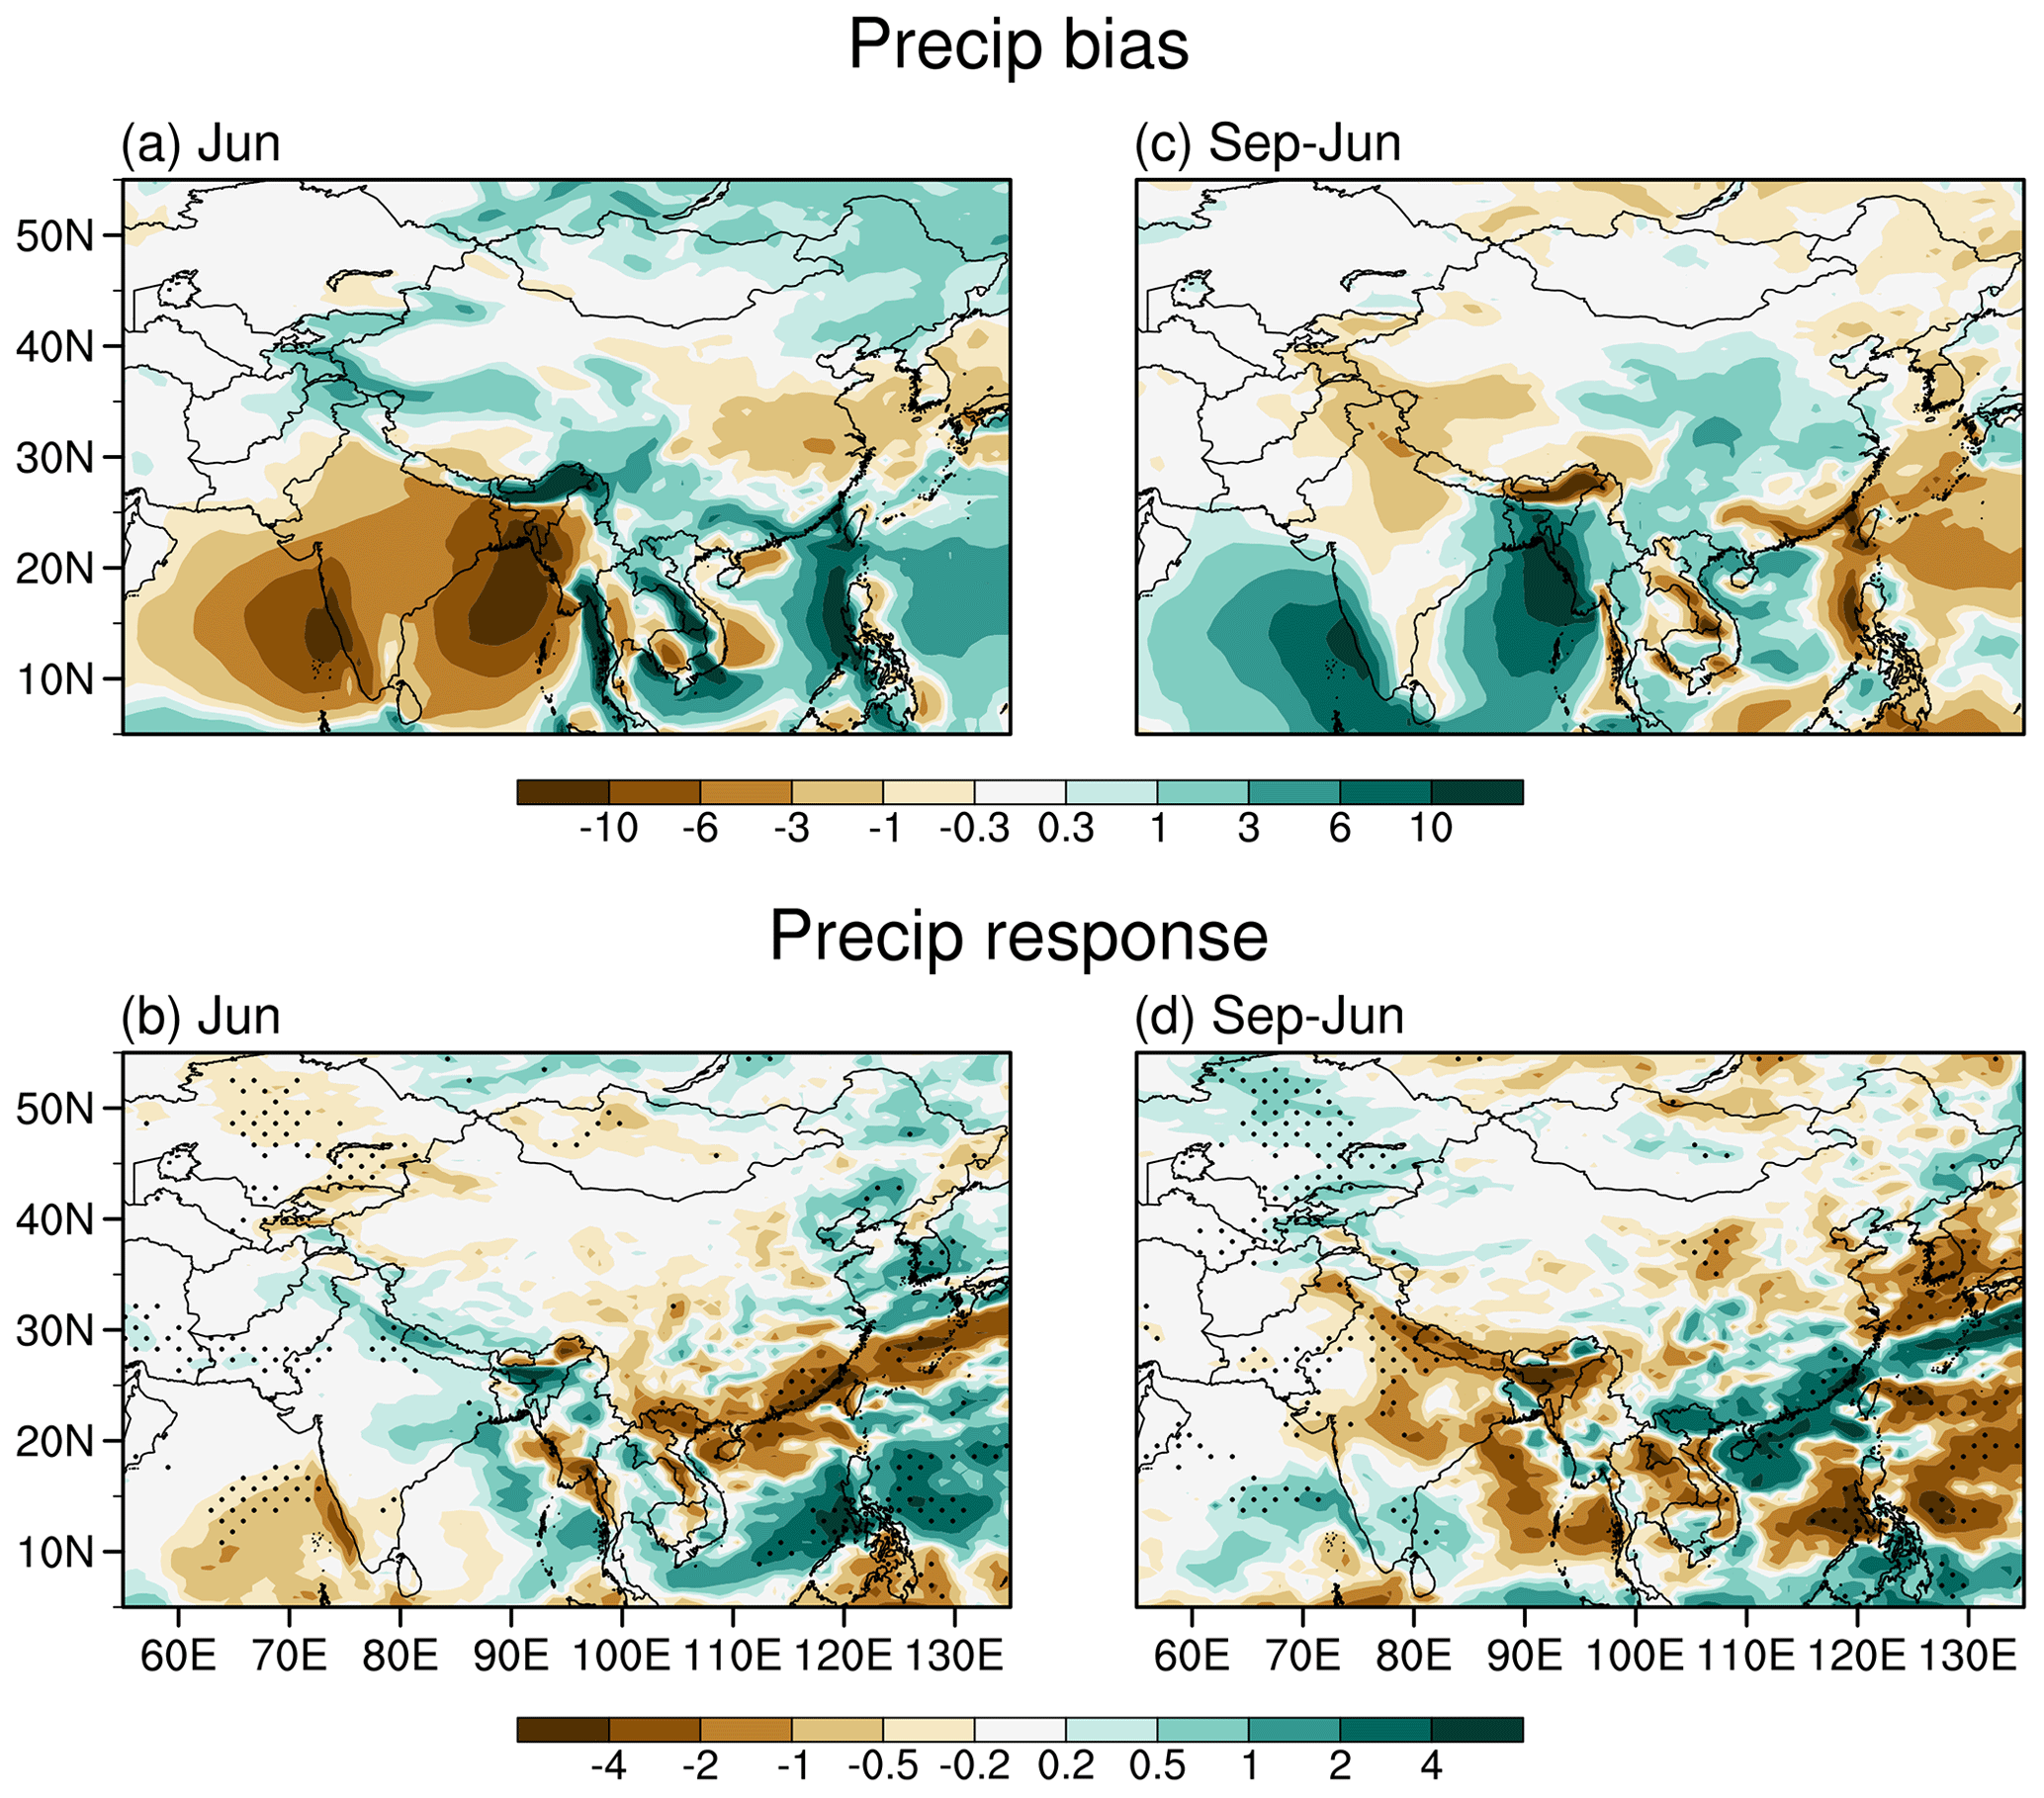
Figure 14(a) June precipitation bias (mm d−1) in HadGEM3-GC2 coupled simulations, (b) precipitation bias difference between September and June, (c) June precipitation response to Asian aerosol changes, and (d) difference in the precipitation response to Asian aerosols between September and June. Black dots in (b) and (d) mark grid points for which the difference is significant at the 90 % confidence level.
3.6 Response in coupled simulations
One may wonder whether the findings above, based on the analysis of atmospheric-only models, still hold in fully coupled models and how much they are modulated by including two-way air–sea interactions. First, we analyze the PDRMIP coupled model experiments. For consistency with the analysis of the fixed-SST experiments, as well as to include the contribution of air–sea coupling but not the full long-term response of the ocean, which presumably has not adjusted to the time-varying emissions in the transient experiments, the analysis was restricted to the first 6–15 years of the simulations. All five chosen models display a dry bias over India in June (Fig. S6), and thus Fig. 13 only shows the DRY multi-model ensemble. In common with the experiments investigated above, the June bias features dry anomalies over South Asia and wet anomalies over southern China (Fig. 13a). A noticeable difference compared to HadGEM3-GC2 is the large-scale drying over the SCS and western subtropical Pacific, showing a meridional dipole (Figs. S6 and 14a). This dipole is obvious in most individual models except for HadGEM3 (mostly zonal; Fig. S6). In September, the dry bias over the Indian sector and western subtropical Pacific undergoes a marked reduction, while the wetting over China is restricted to the central regions. Correspondingly, both the June and the September responses follow the shapes of bias patterns (Fig. 13c and d), further attesting to the pervasiveness and consistency of the link between bias and aerosol response across different models.
To further examine the robustness of the results, we also analyze the HadGEM3-GC2 coupled transient simulations, which are a close counterpart to the simulations discussed in Sect. 3.2 and 3.3. The bias pattern and magnitude in the coupled experiment bear a close similarity to that of the HadGEM3-GA7.1 model during both June and September (Fig. 14a and b), including the dipole between India and central-southeastern China and its sign reversal between early and late summer. This suggests the underlying cause to be rooted in the atmospheric component (Bollasina and Nigam, 2009; Song and Zhou, 2014). The June precipitation response features widespread wetting over India and a large southwest–northeast-oriented dipole over China, with excess precipitation over the western Pacific and drying from the northern Indochinese Peninsula across southeastern China to Japan (Fig. 14b). These two main features, of comparable magnitude, are also evident in Fig. 5. The main difference is that the dipole is slightly shifted southeastward in the coupled model, associated with the anticyclonic circulation extending over the SCS due to aerosol-induced oceanic cooling (not shown), with consequent opposite-sign precipitation anomalies over southeastern China. Also, in agreement with the atmospheric-only simulations, the September response shows extensive drying across South Asia and wetting over southeastern China. As in June, oceanic coupling appears to lead to some differences over southeastern China and the SCS, where the precipitation anomalies, modulated by the slower oceanic response, are slightly shifted over the ocean compared to the uncoupled simulations.
While numerous studies have emphasized the key role of anthropogenic aerosols in driving seasonal-mean changes in the Asian monsoon, only very few of them have focused on the aerosol impact at a subseasonal (e.g., monthly) timescale (e.g., Lau and Kim, 2006; Bollasina et al., 2013; Fang et al., 2023). Yet, the onset and withdrawal phases of the monsoon are of key importance for the regional economy and water resources as they herald the arrival and demise of the monsoon rains, which provide up to 75 % of the total annual rainfall for large areas of Asia. For example, a delayed monsoon onset as well as an early monsoon retreat, or long-term trends in their timings induced by anthropogenic aerosols, can lead to severe consequences for the region. Equally importantly, inter-model discrepancies in the simulated aerosol-induced monsoon changes at a subseasonal scale may help to explain the diversity of the seasonal-mean responses.
A link between model bias and the corresponding response has been shown to hold, for example, in the case of summer precipitation over Asia (Wilcox et al., 2015), global SST patterns and overlying rainfall changes (He and Soden, 2016), tropical rainfall (Chadwick, 2016) and circulation (Zhou and Xie, 2015), extratropical stationary eddies and their influence on tropical convection (Chen et al., 2018), and Arctic Ocean temperature (Park and Lee, 2021). Given that state-of-the-art climate models still suffer from large and persistent biases in simulating magnitude and distribution of the monsoon precipitation and circulation across Asia (Wilcox et al., 2020; Rajendran et al., 2022; Tong et al., 2022), it is certainly plausible that these biases exert a sizable control on the aerosol-induced monsoon changes. Climatological biases in climate models could lead to unrealistic projections of anthropogenic climate change and add further uncertainties, for example due to their possible non-stationarity (Krinner and Flanner, 2018).
One important implication of the link between model climatological bias and response pattern found here is the possibility of better understanding and constraining the diversity and inconsistencies of model responses to aerosol changes over Asia in historical and future projections by accounting for model deficiencies in simulating the climatological monsoon seasonal cycle compared to observations. These biases critically modulate the magnitude and efficacy of aerosol–cloud–precipitation interactions, an important component of the total aerosol-driven response (e.g., Li et al., 2018; Dong et al., 2019). This finding will help in further narrowing the uncertainties associated with aerosol–cloud interactions, given their important role in driving the monsoon changes. For example, the clear contrast in the monthly response to aerosols between the PDRMIP DRY and WET composites calls for caution in the interpretation of the aerosol-induced signal without proper consideration of the model baseline performance. This will translate into more robust assessments of sub-regional scale monsoon variations. In fact, despite an overall similarity in the seasonal-mean monsoon responses between the DRY and WET ensembles, it is interesting to note that the difference pattern in precipitation (e.g., DRY minus WET) bears a striking similarity to the observational pattern (Figs. S8f and 3d).
One may wonder whether the linkage between monsoon bias and aerosol-induced monsoon responses still works in fully coupled models, particularly at longer timescales when SST changes occur. Response patterns between uncoupled and coupled models indeed differ in both magnitude and sign over the surrounding oceanic regions. However, the coupled model response pattern displays an overall minor sensitivity to changes in the averaging period (see Figs. S7 and 13), with the key anomalies, particularly over land, already appearing in the first decades of the simulation. This indicates that, while air–sea interactions contribute to realizing the aerosol impact, the full oceanic response plays a secondary role compared to the predominant action of the atmospheric circulation (Soden and Chung, 2017). This topic, and particularly the analysis of the timescales required to set up the equilibrium response, has been mostly overlooked in literature, which has often compared the fast to the slow response, the latter taken after 50 or more simulated years (e.g., Samset et al., 2016).
Differences exist between the observed monsoon changes during the recent decades shown above (Jin and Wang, 2017; Monerie et al., 2022) and those over a longer period (e.g., the late 20th century) documented in previous literature and attributed to the dominating regional aerosol forcing and sulfate aerosols in particular. For example, the increase in anthropogenic aerosol emissions over Asia in the second half of the 20th century has been found to have played a key role in driving the observed southern-flood–northern-dry-rainfall dipole over East Asia (Gong and Ho, 2002; Song et al., 2014b; Dong et al., 2016), as well as the South Asian monsoon decline (Gu et al., 2006; Bartlett et al., 2018; Dong et al., 2016; Jiang et al., 2013). A combination of factors, including internal climate variability, may have contributed to these recent trends (Huang et al., 2020b; Monerie et al., 2022) or to setting background (oceanic) conditions on top of which aerosols acted (R. Lin et al., 2016). While the findings of our study on the possible role of aerosols are not necessarily conclusive, the model bias is found to be equally important to explain model discrepancies. A careful examination of these biases could help reconcile the generally poor performance of state-of-the-art climate models in reproducing recently observed trends (Huang et al., 2020b; Monerie et al., 2022).
It is also worth emphasizing that the analysis carried out above focuses on the impact of sulfate aerosol emission changes, either because of their marked dominance over other aerosol components (e.g., BC and OC) in the historical period investigated with the HadGEM3-GA7.1 and HadGEM3-GC2 experiments or because of experimental design in the PDRMIP simulations. While sulfate aerosol emissions underwent the largest changes across Asia throughout the historical period (e.g., Lund et al., 2019), the imprint of BC aerosols, although of comparatively weaker magnitude (e.g., Liu et al., 2018; Westervelt et al., 2018), also needs to be accounted for to interpret the full extent of the simulated monsoon response to historical aerosol changes and its inter-model inconsistencies, given, for example, their different physical mechanisms and responses of opposite sign compared to those due to sulfate aerosols (e.g., Xie at al., 2020).
The competition between South Asia and East Asia in generating the continental-scale monsoon response and the underpinning modulation by the bias pattern is very relevant in the context of interpreting near-future monsoon projections and related uncertainties, including for regional attribution studies, given the present-day and near-future dipole pattern of emission changes between the two regions (Lund et al., 2019; Samset et al., 2019). For example, it is conceivable to expect that a reduced model bias over South Asia, particularly in early summer, would further promote the importance of Indian aerosol emissions compared to those over China. This also highlights the potential key role of non-local aerosols in driving the simulated response across Asia, which is again crucial in interpreting future projections.
Based on the analysis of several climate models and aerosol forcing experiments, we find the subseasonal variability in the Asian summer monsoon response to regional anthropogenic aerosol changes to be significantly affected by the spatial pattern and seasonality of the model bias across Asia. The aerosol impact on monsoon precipitation and circulation is strongly influenced by the model ability to simulate the spatial distribution of and temporal variability in the climatological monsoon clouds and precipitation, as well as the underlying atmospheric dynamical action centers. The amount of available water vapor in the model baseline climatological state exerts a strong control on the extent to which aerosols can interact with clouds and precipitation processes (i.e., via reduced cloud effective radius) and thus modulate the aerosol-induced monsoon response. This involves a strong interplay between South Asia and East Asia and their relative predominance in driving the overall monsoon response, with a striking contrast between the early- and late-summer aerosol-driven changes ascribable to the seasonal evolution of the biases between the two regions. Our results and proposed mechanism, firstly based on a detailed analysis of atmospheric-only experiments with the HadGEM3-GA7.1 model, are corroborated by the analysis of other atmospheric and coupled models for which sensitivity experiments regarding Asian aerosol changes are also available.
In summary, during the onset month (June), models that feature a dry bias over India display corresponding wet anomalies over eastern China. As the monsoon season progresses and approaches the end (September), the absolute bias decreases, or even reverses, such that incremental changes show wetter conditions over India and drier conditions over eastern China compared to June. Similar variations, but of opposite sign, occur for the models that display a wet June bias over India (and corresponding deficient rainfall over China). These patterns and their subseasonal evolution, together with the corresponding atmospheric circulation anomalies, indicate the existence of a strong internal coupling between the South Asia and East Asian monsoon systems, whereby the two components fluctuate and oppose each other at short (monthly or below) timescales. As a result, the aerosol influence on the monsoon, modulated by aerosol–cloud interactions, also features a dipole and oscillating pattern between South Asia and East Asia, with the key driving region varying during the season and depending on the evolution of the model climatological state. For example, while the direct aerosol imprint is predominant over East Asia in early summer, it dominates over South Asia towards the end of the season in the DRY composites. The continental-scale aerosol response, particularly the inter-monsoon interaction, involves an ensuing large-scale atmospheric circulation response, which is pivotal to extending the aerosol impact downstream of the dominating aerosol forcing region by modulation of the associated moisture transport towards the rest of the domain. The analysis of the nudged experiments further supports the crucial role of non-regional atmospheric circulation adjustments: while keeping the circulation outside Asia close to observations reduces the model bias over Asia, the lack of adjustments under varying Asian aerosol emissions dampens and modifies the pattern and evolution of the regional precipitation response, leading to unrealistic changes (e.g., seasonal-mean wetting over South Asia). This suggests that climatological large-scale circulation features, such as the western Pacific subtropical high, not only are modulated by aerosol forcing over Asia but also are active contributors to generating the aerosol impact itself over Asia.
The consistency of our findings across different models suggests that the mechanism is robust with respect to the specific model structure and physics, including details of the aerosol module, as long as aerosol–cloud interactions are parameterized. Biases and responses are markedly similar between atmosphere-only and coupled models over land (e.g., South Asia and East Asia), where the largest aerosol loading is also located and thus the largest forcing is exerted via aerosol–cloud–precipitation interactions. Furthermore, compared with the fixed-SST experiments, the fully coupled settings may affect the magnitude and sign of oceanic responses, but the anomalies over land follow the bias pattern, further attesting to the robustness of the proposed physical mechanisms.
We acknowledge some limitations of this study. Only a few models are available in each of the DRY and WET composites as aerosol–cloud interactions are not parameterized in some of the PDRMIP models. There are also inter-model differences in the aerosol setups (i.e., prescribed concentrations or emissions), the implications of which are difficult to ascertain given the limited model sample. Including more models and conducting coordinated perturbed aerosol experiments on Asian aerosols would further increase the robustness of our study. It would be interesting to extend this analysis to a longer period and examine, for example, the 20th-century monsoon changes. Internal climate variability may also play an important role and partially mask or offset externally driven changes, especially given the relatively short time period examined here.
The GPCP and CMAP observational datasets are obtained from https://psl.noaa.gov/data/gridded/data.gpcp.html (Adler et al., 2003) and https://psl.noaa.gov/data/gridded/data.cmap.html, Xie and Arkin, 1997, respectively. The ERA-I reanalysis used for nudging can be accessed from https://www.ecmwf.int/en/forecasts/dataset/ecmwf-reanalysis-interim (Dee et al., 2011). The ERA5 reanalysis is provided by the European Center for Medium-Range Weather Forecasts (https://www.ecmwf.int/en/forecasts/dataset/ecmwf-reanalysis-v5, Hersbach et al., 2020). The PDRMIP data can be accessed through the World Data Center for Climate (WDCC) data server at https://doi.org/10.26050/WDCC/PDRMIP_2012-2021 (Andrews et al., 2021). The model simulation output is available from the corresponding author on reasonable request.
The supplement related to this article is available online at: https://doi.org/10.5194/acp-24-7227-2024-supplement.
MAB and ZL designed the study. ZL ran the model simulations. ZL and MAB carried out the analysis, visualized the results, and discussed the results. All authors edited the paper.
At least one of the (co-)authors is a member of the editorial board of Atmospheric Chemistry and Physics. The peer-review process was guided by an independent editor, and the authors also have no other competing interests to declare.
Publisher's note: Copernicus Publications remains neutral with regard to jurisdictional claims made in the text, published maps, institutional affiliations, or any other geographical representation in this paper. While Copernicus Publications makes every effort to include appropriate place names, the final responsibility lies with the authors.
The authors thank the editor Guy Dagan and two anonymous reviewers, whose constructive comments led to a significant improvement of the manuscript. We acknowledge the use of ARCHER, of the UK HPC, and of the JASMIN super-data-cluster.
Zhen Liu is supported by the start-up funding of The Hong Kong University of Science and Technology (Guangzhou). Massimo A. Bollasina is supported by the Natural Environment Research Council (grant no. NE/N006038/1). Zhen Liu is also supported by the Guangzhou Municipal Science and Technology Project for Maiden Voyage (grant no. 2024A04J4523). Massimo A. Bollasina and Laura J. Wilcox are supported by the Research Council of Norway (grant no. 324182; CATHY). Zhen Liu, Massimo A. Bollasina, and Laura J. Wilcox were supported by the UK-China Research and Innovation Partnership Fund through the Met Office Climate Science for Service Partnership (CSSP) China as part of the Newton Fund.
This paper was edited by Guy Dagan and reviewed by two anonymous referees.
Adler, R. F., Huffman, G. J., Chang, A., Ferraro, R., Xie, P. P., Janowiak, J., Rudolf, B., Schneider, U., Curtis, S., Bolvin, D., Gruber, A., Susskind, J., Arkin, P., and Nelkin, E.: The version-2 global precipitation climatology project (GPCP) monthly precipitation analysis (1979–present), J. Hydrometeorol., 4, 1147–1167, https://doi.org/10.1175/1525-7541(2003)004<1147:TVGPCP>2.0.CO;2, 2003 (data available at: https://psl.noaa.gov/data/gridded/data.gpcp.html, last access: 19 June 2024).
Albrecht, B. A.: Aerosols, cloud microphysics, and fractional cloudiness, Science, 245, 1227–1230, https://doi.org/10.1126/science.245.4923.1227, 1989.
An, Z., Colman, S. M., Zhou, W., Li, X., Brown, E. T., Jull, A. J. T., Cai, Y., Huang, Y., Lu, X., Chang, H., Song, Y., Sun, Y., Xu, H., Liu, W., Jin, Z., Liu, X., Cheng, P., Liu, Y., Ai, L., Li, X., Liu, X., Yan, L., Shi, Z., Wang, X., Wu, F., Qiang, X., Dong, J., Lu, F., and Xu, X.: Interplay between the Westerlies and Asian monsoon recorded in Lake Qinghai sediments since 32 ka, Sci. Rep., 2, 619, https://doi.org/10.1038/srep00619, 2012.
Andrews, T. and Forster, P. M.: Energy budget constraints on historical radiative forcing, Nat. Clim. Change, 10, 313–316, https://doi.org/10.1038/s41558-020-0696-1, 2020.
Andrews, T., Boucher, O., Fläschner, D., Kasoar, M., Kharin, V., Kirkevåg, A., Lamarque, J.-F., Myhre, G., Mülmenstädt, J., Oliviè, D. J. L., Samset, B., Sandstad, M., Shawki, D., Shindell, D., Stier, P., Takemura, T., Voulgarakis, A., and Watson-Parris, D.: Precipitation Driver Response Model Intercomparison Project data sets 2013–2021, World Data Center for Climate (WDCC) at DKRZ [data set], https://doi.org/10.26050/WDCC/PDRMIP_2012-2021, 2021.
Bartlett, R. E., Bollasina, M. A., Booth, B. B. B., Dunstone, N. J., Marenco, F., Messori, G., and Bernie, D. J.: Do differences in future sulfate emission pathways matter for near-term climate? A case study for the Asian monsoon, Clim. Dynam., 50, 1863–1880, https://doi.org/10.1007/s00382-017-3726-6, 2018.
Bastin, S., Drobinski, P., Chiriaco, M., Bock, O., Roehrig, R., Gallardo, C., Conte, D., Domínguez Alonso, M., Li, L., Lionello, P., and Parracho, A. C.: Impact of humidity biases on light precipitation occurrence: observations versus simulations, Atmos. Chem. Phys., 19, 1471–1490, https://doi.org/10.5194/acp-19-1471-2019, 2019.
Bellouin, N., Mann, G. W., Woodhouse, M. T., Johnson, C., Carslaw, K. S., and Dalvi, M.: Impact of the modal aerosol scheme GLOMAP-mode on aerosol forcing in the Hadley Centre Global Environmental Model, Atmos. Chem. Phys., 13, 3027–3044, https://doi.org/10.5194/acp-13-3027-2013, 2013.
Bollasina, M. and Nigam, S.: Indian Ocean SST, evaporation, and precipitation during the South Asian summer monsoon in IPCC-AR4 coupled simulations, Clim. Dynam., 33, 1017–1032, https://doi.org/10.1007/s00382-008-0477-4, 2009.
Bollasina, M. A., Ming, Y., and Ramaswamy, V.: Anthropogenic aerosols and the weakening of the south asian summer monsoon, Science, 334, 502–505, https://doi.org/10.1126/science.1204994, 2011.
Bollasina, M. A., Ming, Y., and Ramaswamy, V.: Earlier onset of the Indian monsoon in the late twentieth century: The role of anthropogenic aerosols, Geophys. Res. Lett., 40, 3715–3720, https://doi.org/10.1002/grl.50719, 2013.
Bollasina, M. A., Ming, Y., Ramaswamy, V., Schwarzkopf, M. D., and Naik, V.: Contribution of local and remote anthropogenic aerosols to the twentieth century weakening of the South Asian Monsoon, Geophys. Res. Lett., 41, 680–687, https://doi.org/10.1002/2013GL058183, 2014.
Boucher, O., Randall, D., Artaxo, P., Bretherton, C., Feingold, G., Forster, P., Kerminen, V.-M., Kondo, Y., Liao, H., Lohmann, U., Rasch, P., Satheesh, S. K., Sherwood, S., Stevens, B., and Zhang, X. Y.: IPCC: Clouds and Aerosols, in: Climate Change 2013: The Physical Science Basis. Contribution of Working Group I to the Fifth Assessment Report of the Intergovernmental Panel on Climate Change, Cambridge University Press, Cambridge, UK, https://doi.org/10.1017/CBO9781107415324.016, 2013.
Boutle, I. A., Eyre, J. E. J., and Lock, A. P.: Seamless Stratocumulus Simulation across the Turbulent Gray Zone, Mon. Weather Rev., 142, 1655–1668, https://doi.org/10.1175/MWR-D-13-00229.1, 2014a.
Boutle, I. A., Abel, S. J., Hill, P. G., and Morcrette, C. J.: Spatial variability of liquid cloud and rain: observations and microphysical effects, Q. J. Roy. Meteor. Soc., 140, 583–594, https://doi.org/10.1002/qj.2140, 2014b.
Cao, J., Wang, B., Wang, B., Zhao, H., Wang, C., and Han, Y.: Sources of the Intermodel Spread in Projected Global Monsoon Hydrological Sensitivity, Geophys. Res. Lett., 47, e2020GL089560, https://doi.org/10.1029/2020GL089560, 2020.
Chadwick, R.: Which aspects of CO2 forcing and SST warming cause most uncertainty in projections of tropical rainfall change over land and ocean?, J. Climate, 29, 2493–2509, https://doi.org/10.1175/JCLI-D-15-0777.1, 2016.
Chen, X., Wu, P., Roberts, M. J., and Zhou, T.: Potential underestimation of future Mei-Yu Rainfall with coarse-resolution climate models, J. Climate, 31, 6711–6727, https://doi.org/10.1175/JCLI-D-17-0741.1, 2018.
Christidis, N., Stott, P. A., Scaife, A. A., Arribas, A., Jones, G. S., Copsey, D., Knight, J. R., and Tennant, W. J.: A new HADGEM3-a-based system for attribution of weather- and climate-related extreme events, J. Climate, 26, 2756–2783, https://doi.org/10.1175/JCLI-D-12-00169.1, 2013.
Chung, C. E. and Ramanathan, V.: Weakening of north Indian SST gradients and the monsoon rainfall in India and the Sahel, J. Climate, 19, 2036–2045, https://doi.org/10.1175/JCLI3820.1, 2006.
Cowan, T. and Cai, W.: The impact of Asian and non-Asian anthropogenic aerosols on 20th century Asian summer monsoon, Geophys. Res. Lett., 38, L11703, https://doi.org/10.1029/2011GL047268, 2011.
Dai, L., Cheng, T. F., and Lu, M.: Anthropogenic warming disrupts intraseasonal monsoon stages and brings dry-get-wetter climate in future East Asia, npj Clim. Atmos. Sci., 5, 11, https://doi.org/10.1038/s41612-022-00235-9, 2022.
Dee, D. P., Uppala, S. M., Simmons, A. J., Berrisford, P., Poli, P., Kobayashi, S., Andrae, U., Balmaseda, M. A., Balsamo, G., Bauer, P., Bechtold, P., Beljaars, A. C. M., van de Berg, L., Bidlot, J., Bormann, N., Delsol, C., Dragani, R., Fuentes, M., Geer, A. J., Haimberger, L., Healy, S. B., Hersbach, H., Hólm, E. V., Isaksen, L., Kållberg, P., Köhler, M., Matricardi, M., Mcnally, A. P., Monge-Sanz, B. M., Morcrette, J. J., Park, B. K., Peubey, C., de Rosnay, P., Tavolato, C., Thépaut, J. N., and Vitart, F.: The ERA-Interim reanalysis: Configuration and performance of the data assimilation system, Q. J. Roy. Meteor. Soc., 137, 553–597, https://doi.org/10.1002/qj.828, 2011 (data aavailable at: https://www.ecmwf.int/en/forecasts/dataset/ecmwf-reanalysis-interim, last access: 19 June 2024).
Deser, C., Phillips, A., Bourdette, V., and Teng, H.: Uncertainty in climate change projections: The role of internal variability, Clim. Dynam., 38, 527–546, https://doi.org/10.1007/s00382-010-0977-x, 2012.
Dong, B., Sutton, R. T., Highwood, E. J., and Wilcox, L. J.: Preferred response of the East Asian summer monsoon to local and non-local anthropogenic sulphur dioxide emissions, Clim. Dynam., 46, 1733–1751, https://doi.org/10.1007/s00382-015-2671-5, 2016.
Dong, B., Wilcox, L. J., Highwood, E. J., and Sutton, R. T.: Impacts of recent decadal changes in Asian aerosols on the East Asian summer monsoon: roles of aerosol–radiation and aerosol–cloud interactions, Clim. Dynam., 53, 3235–3256, https://doi.org/10.1007/s00382-019-04698-0, 2019.
Efron, B. and Tibshirani, R. J.: An introduction to the bootstrap, Monographs on Statistics and Applied Probability, Vol. 57, Chapman and Hall, London, p. 436, https://doi.org/10.1111/1467-9639.00050, 1993.
Fang, C., Haywood, J. M., Liang, J., Johnson, B. T., Chen, Y., and Zhu, B.: Impacts of reducing scattering and absorbing aerosols on the temporal extent and intensity of South Asian summer monsoon and East Asian summer monsoon, Atmos. Chem. Phys., 23, 8341–8368, https://doi.org/10.5194/acp-23-8341-2023, 2023.
Fläschner, D., Mauritsen, T., and Stevens, B.: Understanding the intermodel spread in global-mean hydrological sensitivity, J. Climate, 29, 801–817, https://doi.org/10.1175/JCLI-D-15-0351.1, 2016.
Ganguly, D., Rasch, P. J., Wang, H., and Yoon, J. H.: Fast and slow responses of the South Asian monsoon system to anthropogenic aerosols, Geophys. Res. Lett., 39, L18804, https://doi.org/10.1029/2012GL053043, 2012.
Gong, D.-Y. and Ho, C.-H.: Shift in the summer rainfall over the Yangtze River valley in the late 1970s, Geophys. Res. Lett., 29, 78-1–78-4, https://doi.org/10.1029/2001gl014523, 2002.
Gregory, D. and Rowntree, P. R.: A Mass Flux Convection Scheme with Representation of Cloud Ensemble Characteristics and Stability-Dependent Closure, Mon. Weather Rev., 118, 1483–1506, https://doi.org/10.1175/1520-0493(1990)118<1483:AMFCSW>2.0.CO;2, 1990.
Gu, Y., Liou, K. N., Xue, Y., Mechoso, C. R., Li, W., and Luo, Y.: Climatic effects of different aerosol types in China simulated by the UCLA general circulation model, J. Geophys. Res.-Atmos., 111, D15201, https://doi.org/10.1029/2005JD006312, 2006.
Guilbert, M., Terray, P., and Mignot, J.: Intermodel spread of historical Indian monsoon rainfall change in CMIP6: The role of the tropical Pacific mean-state, J. Climate, 1, 1–42, https://doi.org/10.1175/JCLI-D-22-0585.1, 2023.
Guo, L., Highwood, E. J., Shaffrey, L. C., and Turner, A. G.: The effect of regional changes in anthropogenic aerosols on rainfall of the East Asian Summer Monsoon, Atmos. Chem. Phys., 13, 1521–1534, https://doi.org/10.5194/acp-13-1521-2013, 2013.
Guo, L., Turner, A. G., and Highwood, E. J.: Impacts of 20th century aerosol emissions on the South Asian monsoon in the CMIP5 models, Atmos. Chem. Phys., 15, 6367–6378, https://doi.org/10.5194/acp-15-6367-2015, 2015.
Han, Y., Zhang, M. Z., Xu, Z., and Guo, W.: Assessing the performance of 33 CMIP6 models in simulating the large-scale environmental fields of tropical cyclones, Clim. Dynam., 58, 1683–1698, https://doi.org/10.1007/s00382-021-05986-4, 2022.
He, J. and Soden, B. J.: The impact of SST biases on projections of anthropogenic climate change: A greater role for atmosphere-only models?, Geophys. Res. Lett., 43, 7745–7750, https://doi.org/10.1002/2016GL069803, 2016.
He, L., Zhou, T., and Chen, X.: South Asian summer rainfall from CMIP3 to CMIP6 models: biases and improvements, Clim. Dynam., 61, 1049–1061, https://doi.org/10.1007/s00382-022-06542-4, 2022.
Herbert, R., Wilcox, L. J., Joshi, M., Highwood, E., and Frame, D.: Nonlinear response of Asian summer monsoon precipitation to emission reductions in South and East Asia, Environ. Res. Lett., 17, 014005, https://doi.org/10.1088/1748-9326/ac3b19, 2022.
Hersbach, H., Bell, B., Berrisford, P., Hirahara, S., Horányi, A., Muñoz-Sabater, J., Nicolas, J., Peubey, C., Radu, R., Schepers, D., Simmons, A., Soci, C., Abdalla, S., Abellan, X., Balsamo, G., Bechtold, P., Biavati, G., Bidlot, J., Bonavita, M., De Chiara, G., Dahlgren, P., Dee, D., Diamantakis, M., Dragani, R., Flemming, J., Forbes, R., Fuentes, M., Geer, A., Haimberger, L., Healy, S., Hogan, R. J., Hólm, E., Janisková, M., Keeley, S., Laloyaux, P., Lopez, P., Lupu, C., Radnoti, G., de Rosnay, P., Rozum, I., Vamborg, F., Villaume, S., and Thépaut, J. N.: The ERA5 global reanalysis, Q. J. Roy. Meteor. Soc., 146, 1999–2049, https://doi.org/10.1002/qj.3803, 2020 (data available at: https://www.ecmwf.int/en/forecasts/dataset/ecmwf-reanalysis-v5, last access: 18 June 2024).
Hoesly, R. M., Smith, S. J., Feng, L., Klimont, Z., Janssens-Maenhout, G., Pitkanen, T., Seibert, J. J., Vu, L., Andres, R. J., Bolt, R. M., Bond, T. C., Dawidowski, L., Kholod, N., Kurokawa, J.-I., Li, M., Liu, L., Lu, Z., Moura, M. C. P., O'Rourke, P. R., and Zhang, Q.: Historical (1750–2014) anthropogenic emissions of reactive gases and aerosols from the Community Emissions Data System (CEDS), Geosci. Model Dev., 11, 369–408, https://doi.org/10.5194/gmd-11-369-2018, 2018.
Huang, X., Zhou, T., Dai, A., Li, H., Li, C., Chen, X., Lu, J., von Storch, J. S., and Wu, B.: South Asian summer monsoon projections constrained by the interdecadal Pacific oscillation, Science Advances, 6, eaay6546, https://doi.org/10.1126/sciadv.aay6546, 2020a.
Huang, X., Zhou, T., Turner, A., Dai, A., Chen, X., Clark, R., Jiang, J., Man, W., Murphy, J., Rostron, J., Wu, B., Zhang, L., Zhang, W., and Zou, L.: The recent decline and recovery of Indian summer monsoon rainfall: Relative roles of external forcing and internal variability, J. Climate, 33, 5035–5060, https://doi.org/10.1175/JCLI-D-19-0833.1, 2020b.
Jiang, D., Hu, D., Tian, Z., and Lang, X.: Differences between CMIP6 and CMIP5 Models in Simulating Climate over China and the East Asian Monsoon, Adv. Atmos. Sci., 37, 1102–1118, https://doi.org/10.1007/s00376-020-2034-y, 2020.
Jiang, Y., Liu, X., Yang, X. Q., and Wang, M.: A numerical study of the effect of different aerosol types on East Asian summer clouds and precipitation, Atmos. Environ., 70, 51–63, https://doi.org/10.1016/j.atmosenv.2012.12.039, 2013.
Jin, Q. and Wang, C.: A revival of Indian summer monsoon rainfall since 2002, Nat. Clim. Change, 7, 587–594, https://doi.org/10.1038/NCLIMATE3348, 2017.
John, V. O. and Soden, B. J.: Temperature and humidity biases in global climate models and their impact on climate feedbacks, Geophys. Res. Lett., 34, L18704, https://doi.org/10.1029/2007GL030429, 2007.
Kooperman, G. J., Pritchard, M. S., Ghan, S. J., Wang, M., Somerville, R. C. J., and Russell, L. M.: Constraining the influence of natural variability to improve estimates of global aerosol indirect effects in a nudged version of the Community Atmosphere Model 5, J. Geophys. Res.-Atmos., 117, D23204, https://doi.org/10.1029/2012JD018588, 2012.
Krinner, G. and Flanner, M. G.: Striking stationarity of large-scale climate model bias patterns under strong climate change, P. Natl. Acad. Sci. USA, 115, 9462–9466, https://doi.org/10.1073/pnas.1807912115, 2018.
Lau, K. M. and Kim, K. M.: Observational relationships between aerosol and Asian monsoon rainfall, and circulation, Geophys. Res. Lett., 33, L21810, https://doi.org/10.1029/2006GL027546, 2006.
Lau, W. K. M. and Kim, K. M.: Fingerprinting the impacts of aerosols on long-term trends of the Indian summer monsoon regional rainfall, Geophys. Res. Lett., 37, L16705, https://doi.org/10.1029/2010GL043255, 2010.
Li, X., Ting, M., and Lee, D. E.: Fast Adjustments of the Asian Summer Monsoon to Anthropogenic Aerosols, Geophys. Res. Lett., 45, 1001–1010, https://doi.org/10.1002/2017GL076667, 2018.
Li, X., Ting, M., You, Y., Lee, D. E., Westervelt, D. M., and Ming, Y.: South Asian Summer Monsoon Response to Aerosol-Forced Sea Surface Temperatures, Geophys. Res. Lett., 47, e2019GL085329, https://doi.org/10.1029/2019GL085329, 2020.
Lin, J., Tong, D., Davis, S., Ni, R., Tan, X., Pan, D., Zhao, H., Lu, Z., Streets, D., Feng, T., Zhang, Q., Yan, Y., Hu, Y., Li, J., Liu, Z., Jiang, X., Geng, G., He, K., Huang, Y., and Guan, D.: Global climate forcing of aerosols embodied in international trade, Nat. Geosci., 9, 790–794, https://doi.org/10.1038/ngeo2798, 2016.
Lin, R., Zhu, J., and Zheng, F.: Decadal shifts of East Asian summer monsoon in a climate model free of explicit GHGs and aerosols, Sci. Rep., 6, 38546, https://doi.org/10.1038/srep38546, 2016.
Liu, C., Yang, Y., Wang, H., Ren, L., Wei, J., Wang, P., and Liao, H.: Influence of Spatial Dipole Pattern in Asian Aerosol Changes on East Asian Summer Monsoon, J. Climate, 36, 1575–1585, https://doi.org/10.1175/JCLI-D-22-0335.1, 2023.
Liu, L., Shawki, D., Voulgarakis, A., Kasoar, M., Samset, B. H., Myhre, G., Forster, P. M., Hodnebrog, Sillmann, J., Aalbergsjø, S. G., Boucher, O., Faluvegi, G., Iversen, T., Kirkevåg, A., Lamarque, J. F., Olivié, D., Richardson, T., Shindell, D., and Takemura, T.: A PDRMIP Multimodel study on the impacts of regional aerosol forcings on global and regional precipitation, J. Climate, 31, 4429–4447, https://doi.org/10.1175/JCLI-D-17-0439.1, 2018.
Liu, Z., Bollasina, M. A., Wilcox, L. J., Rodríguez, J. M., and Regayre, L. A.: Contrasting the Role of Regional and Remote Circulation in Driving Asian Monsoon Biases in MetUM GA7.1, J. Geophys. Res.-Atmos., 126, 126, e2020JD034342, https://doi.org/10.1029/2020JD034342, 2021.
Liu, Z., Lee, S.-S., Nellikkattil, A. B., Lee, J.-Y., Dai, L., Ha, K.-J., and Franzke, C. L. E.: The East Asian Summer Monsoon Response to Global Warming in a High Resolution Coupled Model: Mean and Extremes, Asia-Pac. J. Atmos. Sci. 2022, 1–17, https://doi.org/10.1007/S13143-022-00285-2, 2022.
Lock, A. P., Brown, A. R., Bush, M. R., Martin, G. M., and Smith, R. N. B.: A New Boundary Layer Mixing Scheme. Part I: Scheme Description and Single-Column Model Tests, Mon. Weather Rev., 128, 3187–3199, https://doi.org/10.1175/1520-0493(2000)128<3187:ANBLMS>2.0.CO;2, 2000.
Lund, M. T., Myhre, G., and Samset, B. H.: Anthropogenic aerosol forcing under the Shared Socioeconomic Pathways, Atmos. Chem. Phys., 19, 13827–13839, https://doi.org/10.5194/acp-19-13827-2019, 2019.
Mann, G. W., Carslaw, K. S., Spracklen, D. V., Ridley, D. A., Manktelow, P. T., Chipperfield, M. P., Pickering, S. J., and Johnson, C. E.: Description and evaluation of GLOMAP-mode: a modal global aerosol microphysics model for the UKCA composition-climate model, Geosci. Model Dev., 3, 519–551, https://doi.org/10.5194/gmd-3-519-2010, 2010.
Matsueda, M. and Palmer, T. N.: Accuracy of climate change predictions using high resolution simulations as surrogates of truth, Geophys. Res. Lett., 38, L05803, https://doi.org/10.1029/2010GL046618, 2011.
Menon, S., Hansen, J., Nazarenko, L., and Luo, Y.: Climate effects of black carbon aerosols in China and India, Science, 297, 2250–2253, https://doi.org/10.1126/science.1075159, 2002a.
Menon, S., Del Genio, A. D., Koch, D., and Tselioudis, G.: GCM simulations of the aerosol indirect effect: Sensitivity to cloud parameterization and aerosol Burden, J. Atmos. Sci., 59, 692–713, https://doi.org/10.1175/1520-0469(2002)059<0692:gsotai>2.0.co;2, 2002b.
Monerie, P. A., Wilcox, L. J., and Turner, A. G.: Effects of Anthropogenic Aerosol and Greenhouse Gas Emissions on Northern Hemisphere Monsoon Precipitation: Mechanisms and Uncertainty, J. Climate, 35, 2305–2326, https://doi.org/10.1175/JCLI-D-21-0412.1, 2022.
Myhre, G., Forster, P. M., Samset, B. H., Hodnebrog, Sillmann, J., Aalbergsjø, S. G., Andrews, T., Boucher, O., Faluvegi, G., Fläschner, D., Iversen, T., Kasoar, M., Kharin, V., Kirkevag, A., Lamarque, J. F., Olivié, D., Richardson, T. B., Shindell, D., Shine, K. P., Stjern, C. W., Takemura, T., Voulgarakis, A., and Zwiers, F.: PDRMIP: A precipitation driver and response model intercomparison project-protocol and preliminary results, B. Am. Meteorol. Soc., 98, 1185–1198, https://doi.org/10.1175/BAMS-D-16-0019.1, 2017.
Park, M. and Lee, S.: Is the Stationary Wave Bias in CMIP5 Simulations Driven by Latent Heating Biases?, Geophys. Res. Lett., 48, e2020GL091678, https://doi.org/10.1029/2020GL091678, 2021.
Pillai, P. A., Rao, S. A., Srivastava, A., Ramu, D. A., Pradhan, M., and Das, R. S.: Impact of the tropical Pacific SST biases on the simulation and prediction of Indian summer monsoon rainfall in CFSv2, ECMWF-System4, and NMME models, Clim. Dynam., 56, 1699–1715, https://doi.org/10.1007/s00382-020-05555-1, 2021.
Rajendran, K., Surendran, S., Varghese, S. J., and Sathyanath, A.: Simulation of Indian summer monsoon rainfall, interannual variability and teleconnections: evaluation of CMIP6 models, Clim. Dynam., 58, 2693–2723, https://doi.org/10.1007/s00382-021-06027-w, 2022.
Seager, R., Naik, N., and Vecchi, G. A.: Thermodynamic and dynamic mechanisms for large-scale changes in the hydrological cycle in response to global warming, J. Climate, 23, 4651–4668, https://doi.org/10.1175/2010JCLI3655.1, 2010.
Samset, B. H., Myhre, G., Forster, P. M., Hodnebrog, Andrews, T., Faluvegi, G., Fläschner, D., Kasoar, M., Kharin, V., Kirkevåg, A., Lamarque, J. F., Olivié, D., Richardson, T., Shindell, D., Shine, K. P., Takemura, T., and Voulgarakis, A.: Fast and slow precipitation responses to individual climate forcers: A PDRMIP multimodel study, Geophys. Res. Lett., 43, 2782–2791, https://doi.org/10.1002/2016GL068064, 2016.
Samset, B. H., Lund, M. T., Bollasina, M., Myhre, G., and Wilcox, L.: Emerging Asian aerosol patterns, Nat. Geosci., 12, 582–584, https://doi.org/10.1038/s41561-019-0424-5, 2019.
Sato, Y., Goto, D., Michibata, T., Suzuki, K., Takemura, T., Tomita, H., and Nakajima, T.: Aerosol effects on cloud water amounts were successfully simulated by a global cloud-system resolving model, Nat. Commun., 9, 985, https://doi.org/10.1038/s41467-018-03379-6, 2018.
Sherman, P., Gao, M., Song, S., Archibald, A. T., Abraham, N. L., Lamarque, J.-F., Shindell, D., Faluvegi, G., and McElroy, M. B.: Sensitivity of modeled Indian monsoon to Chinese and Indian aerosol emissions, Atmos. Chem. Phys., 21, 3593–3605, https://doi.org/10.5194/acp-21-3593-2021, 2021.
Singh, D., Bollasina, M., Ting, M., and Diffenbaugh, N. S.: Disentangling the influence of local and remote anthropogenic aerosols on South Asian monsoon daily rainfall characteristics, Clim. Dynam., 52, 6301–6320, https://doi.org/10.1007/s00382-018-4512-9, 2019.
Soden, B. and Chung, E.-S.: The Large-Scale Dynamical Response of Clouds to Aerosol Forcing, J. Climate, 30, 8783–8794, https://doi.org/10.1175/JCLI-D-17-0050.1, 2017.
Song, F. and Zhou, T.: The climatology and interannual variability of east Asian summer monsoon in CMIP5 coupled models: Does air-sea coupling improve the simulations?, J. Climate, 27, 8761–8777, https://doi.org/10.1175/JCLI-D-14-00396.1, 2014.
Song, F., Zhou, T., and Qian, Y.: Responses of East Asian summer monsoon to natural and anthropogenic forcings in the 17 latest CMIP5 models, Geophys. Res. Lett., 41, 596–603, https://doi.org/10.1002/2013GL058705, 2014.
Sperber, K. R., Annamalai, H., Kang, I. S., Kitoh, A., Moise, A., Turner, A., Wang, B., and Zhou, T.: The Asian summer monsoon: An intercomparison of CMIP5 vs. CMIP3 simulations of the late 20th century, Clim. Dynam., 41, 2711–2744, https://doi.org/10.1007/s00382-012-1607-6, 2013.
Tian, F., Dong, B., Robson, J., and Sutton, R.: Forced decadal changes in the East Asian summer monsoon: the roles of greenhouse gases and anthropogenic aerosols, Clim. Dynam., 51, 3699–3715, https://doi.org/10.1007/s00382-018-4105-7, 2018.
Tong, M., Zheng, Z., and Fu, Q.: Evaluation of East Asian Meiyu from CMIP6/AMIP simulations, Clim. Dynam., 59, 2429–2444, https://doi.org/10.1007/s00382-022-06218-z, 2022.
Twomey, S.: Pollution and the planetary albedo, Atmos. Environ., 8, 1251–1256, https://doi.org/10.1016/0004-6981(74)90004-3, 1974.
Vidya, P. J., Ravichandran, M., Subeesh, M. P., Chatterjee, S., and Nuncio, M.: Global warming hiatus contributed weakening of the Mascarene High in the Southern Indian Ocean, Sci. Rep., 10, 3255, https://doi.org/10.1038/s41598-020-59964-7, 2020.
Walters, D., Baran, A. J., Boutle, I., Brooks, M., Earnshaw, P., Edwards, J., Furtado, K., Hill, P., Lock, A., Manners, J., Morcrette, C., Mulcahy, J., Sanchez, C., Smith, C., Stratton, R., Tennant, W., Tomassini, L., Van Weverberg, K., Vosper, S., Willett, M., Browse, J., Bushell, A., Carslaw, K., Dalvi, M., Essery, R., Gedney, N., Hardiman, S., Johnson, B., Johnson, C., Jones, A., Jones, C., Mann, G., Milton, S., Rumbold, H., Sellar, A., Ujiie, M., Whitall, M., Williams, K., and Zerroukat, M.: The Met Office Unified Model Global Atmosphere 7.0/7.1 and JULES Global Land 7.0 configurations, Geosci. Model Dev., 12, 1909–1963, https://doi.org/10.5194/gmd-12-1909-2019, 2019.
Wang, B., Yim, S. Y., Lee, J. Y., Liu, J., and Ha, K. J.: Future change of Asian-Australian monsoon under RCP 4.5 anthropogenic warming scenario, Clim. Dynam., 42, 83–100, https://doi.org/10.1007/s00382-013-1769-x, 2014.
Wang, B., Jin, C., and Liu, J.: Understanding Future Change of Global Monsoons Projected by CMIP6 Models, J. Climate, 33, 6471–6489, https://doi.org/10.1175/JCLI-D-19-0993.1, 2020.
Wang, N., Zhang, K., Shen, X., Wang, Y., Li, J., Li, C., Mao, J., Malinka, A., Zhao, C., Russell, L. M., Guo, J., Gross, S., Liu, C., Yang, J., Chen, F., Sijie Chen1, L. W., Ke, J., Xiao, D., Zhou, Y., Fang, J., and Liu, D.: Dual-field-of-view high-spectral-resolution lidar: Simultaneous profiling of aerosol and water cloud to study aerosol–cloud interaction, P. Natl. Acad. Sci. USA, 119, e2110756119, https://doi.org/10.1073/pnas.2110756119, 2022.
West, R. E. L., Stier, P., Jones, A., Johnson, C. E., Mann, G. W., Bellouin, N., Partridge, D. G., and Kipling, Z.: The importance of vertical velocity variability for estimates of the indirect aerosol effects, Atmos. Chem. Phys., 14, 6369–6393, https://doi.org/10.5194/acp-14-6369-2014, 2014.
Westervelt, D. M., Conley, A. J., Fiore, A. M., Lamarque, J.-F., Shindell, D. T., Previdi, M., Mascioli, N. R., Faluvegi, G., Correa, G., and Horowitz, L. W.: Connecting regional aerosol emissions reductions to local and remote precipitation responses, Atmos. Chem. Phys., 18, 12461–12475, https://doi.org/10.5194/acp-18-12461-2018, 2018.
Wilcox, L. J., Dong, B., Sutton, R. T., and Highwood, E. J.: The 2014 hot, dry summer in northeast Asia, B. Am. Meteorol. Soc., 96, S105–S110, https://doi.org/10.1175/BAMS-D-15-00123.1, 2015.
Wilcox, L. J., Dunstone, N., Lewinschal, A., Bollasina, M., Ekman, A. M. L., and Highwood, E. J.: Mechanisms for a remote response to Asian anthropogenic aerosol in boreal winter, Atmos. Chem. Phys., 19, 9081–9095, https://doi.org/10.5194/acp-19-9081-2019, 2019.
Wilcox, L. J., Liu, Z., Samset, B. H., Hawkins, E., Lund, M. T., Nordling, K., Undorf, S., Bollasina, M., Ekman, A. M. L., Krishnan, S., Merikanto, J., and Turner, A. G.: Accelerated increases in global and Asian summer monsoon precipitation from future aerosol reductions, Atmos. Chem. Phys., 20, 11955–11977, https://doi.org/10.5194/acp-20-11955-2020, 2020.
Wilson, D. R. and Ballard, S. P.: A microphysically based precipitation scheme for the UK meteorological office unified model, Q. J. Roy. Meteor. Soc., 125, 1607–1636, https://doi.org/10.1002/qj.49712555707, 1999.
Xie, P. and Arkin, P. A.: Global Precipitation: A 17-Year Monthly Analysis Based on Gauge Observations, Satellite Estimates, and Numerical Model Outputs, B. Am. Meteorol. Soc., 78, 2539–2558, https://doi.org/10.1175/1520-0477(1997)078<2539:GPAYMA>2.0.CO;2, 1997 (data available at: https://psl.noaa.gov/data/gridded/data.cmap.html, last access: 19 June 2024).
Xie, X., Myhre, G., Liu, X., Li, X., Shi, Z., Wang, H., Kirkevåg, A., Lamarque, J.-F., Shindell, D., Takemura, T., and Liu, Y.: Distinct responses of Asian summer monsoon to black carbon aerosols and greenhouse gases, Atmos. Chem. Phys., 20, 11823–11839, https://doi.org/10.5194/acp-20-11823-2020, 2020.
Yang, B., Zhang, Y., Qian, Y., Song, F., Leung, L. R., Wu, P., Guo, Z., Lu, Y., and Huang, A.: Better monsoon precipitation in coupled climate models due to bias compensation, npj Clim. Atmos. Sci., 2, 43, https://doi.org/10.1038/s41612-019-0100-x, 2019.
Yu, S., Li, P., Wang, L., Wang, P., Wang, S., Chang, S., Liu, W., and Alapaty, K.: Anthropogenic aerosols are a potential cause for migration of the summer monsoon rain belt in China, P. Natl. Acad. Sci. USA, 113, E2209–E2210, https://doi.org/10.1073/pnas.1601104113, 2016.
Zanis, P., Akritidis, D., Georgoulias, A. K., Allen, R. J., Bauer, S. E., Boucher, O., Cole, J., Johnson, B., Deushi, M., Michou, M., Mulcahy, J., Nabat, P., Olivié, D., Oshima, N., Sima, A., Schulz, M., Takemura, T., and Tsigaridis, K.: Fast responses on pre-industrial climate from present-day aerosols in a CMIP6 multi-model study, Atmos. Chem. Phys., 20, 8381–8404, https://doi.org/10.5194/acp-20-8381-2020, 2020.
Zha, J., Shen, C., Zhao, D., Feng, J., Xu, Z., Wu, J., Fan, W., Luo, M., and Zhang, L.: Contributions of External Forcing and Internal Climate Variability to Changes in the Summer Surface Air Temperature over East Asia, J. Climate, 35, 5013–5032, https://doi.org/10.1175/JCLI-D-21-0577.1, 2022.
Zhang, P., Yang, S., and Kousky, V. E.: South Asian high and Asian–Pacific–American climate teleconnection, Adv. Atmos. Sci., 22, 915–923, https://doi.org/10.1007/bf02918690, 2005.
Zhang, S., Stier, P., and Watson-Parris, D.: On the contribution of fast and slow responses to precipitation changes caused by aerosol perturbations, Atmos. Chem. Phys., 21, 10179–10197, https://doi.org/10.5194/acp-21-10179-2021, 2021.
Zheng, B., Tong, D., Li, M., Liu, F., Hong, C., Geng, G., Li, H., Li, X., Peng, L., Qi, J., Yan, L., Zhang, Y., Zhao, H., Zheng, Y., He, K., and Zhang, Q.: Trends in China's anthropogenic emissions since 2010 as the consequence of clean air actions, Atmos. Chem. Phys., 18, 14095–14111, https://doi.org/10.5194/acp-18-14095-2018, 2018.
Zhou, S., Huang, P., Huang, G., and Hu, K.: Leading source and constraint on the systematic spread of the changes in East Asian and western North Pacific summer monsoon, Environ. Res. Lett., 14, 124059, https://doi.org/10.1088/1748-9326/ab547c, 2019.
Zhou, Z. Q. and Xie, S. P.: Effects of climatological model biases on the projection of tropical climate change, J. Climate, 28, 9909–9917, https://doi.org/10.1175/JCLI-D-15-0243.1, 2015.