the Creative Commons Attribution 4.0 License.
the Creative Commons Attribution 4.0 License.
 | 12 Jun 2024
Investigating the contribution of grown new particles to cloud condensation nuclei with largely varying preexisting particles – Part 2: Modeling chemical drivers and 3-D new particle formation occurrence
Ming Chu
Xing Wei
Shangfei Hai
Huiwang Gao
Yujiao Zhu
Nan Ma
Juan Hong
Xiaohong Yao
In this study, we utilized a 20-bin WRF-Chem (Weather Research and Forecasting coupled with Chemistry) regional model to investigate the contributions of chemical drivers to the growth of new particles, as well as to simulate the three-dimensional dynamics of new particle formation (NPF) events over the North China Plain during a summer campaign in 2019. The model replicated the occurrence of NPF and the growth pattern of newly formed particles, as well as the performance to meet the benchmarks, i.e., absolute mean fractional bias ≤ 50 % and mean fractional error ≤ 75 %, in replicating number concentrations of particles in the 10–40 nm range in five events between 29 June and 6 July 2019. Therefore, we further analyzed three NPF events with distinct particle growth characteristics. In these instances, the model overpredicted daytime condensation of H2SO4 vapor and nighttime formation of NH4NO3. These resulted in overestimation of the hygroscopicity parameter of nanometer particles. Nevertheless, the model performance met the benchmarks for reproducing cloud condensation nuclei (CCN) at a supersaturation (SS) of 0.4 % on NPF days. This was because the overestimation of inorganics was offset by the model underestimation of CCN originating from submicron particles. Additionally, three-dimensional simulations of NPF events demonstrated some key findings. First, NPF consistently begins in the upper parts of the planetary boundary layer (PBL) before expanding. Second, during daytime organics dominate growth of new particles in the PBL, whereas in the free troposphere the primary chemical drivers are inorganic species. However, to confirm these findings, vertical observations are required.
- Article
(9460 KB) - Full-text XML
-
Supplement
(1877 KB) - BibTeX
- EndNote


In the atmosphere, gaseous precursors form critical nuclei that can grow. This new particle formation (NPF) has been extensively studied (Kulmala et al., 2004; Bzdek and Johnston, 2010; Zhang et al., 2012; Chu et al., 2019; Lee et al., 2019; Sellegri et al., 2019). NPF events cause a sharp increase in particle number concentrations (PNCs) and can potentially impact the global climate by acting as cloud condensation nuclei (CCN) (Huang et al., 2016; Gordon et al., 2017; Yu et al., 2017). Specifically, NPF has been estimated to contribute as much as 45 % to the global CCN budget (Spracklen et al., 2008; Merikanto et al., 2009; Williamson et al., 2019). Furthermore, NPF particles have been shown to continue growing for several days to make substantial contributions to atmospheric particle mass. This link between NPF and subsequent haze events has been observed in China (Zhang et al., 2012; Chu et al., 2021; Kulmala et al., 2022). In fact, if the newly formed particles grow to a sufficient size, they may have direct climate effects by altering atmospheric radiation.
Although the North China Plain (NCP) is one of the largest Asian plains, it still suffers from air pollution (Li et al., 2017; Jiang and Bai, 2018; Ma et al., 2019; Yang et al., 2021). Despite this, the NCP frequently experiences NPF events, due to the abundance of precursors such as sulfuric acid, ammonia, amines, and secondary gaseous organics, as well as dry weather (Wehner et al., 2004; Wu et al., 2007; Yue et al., 2010; Wang et al., 2015; Zhu et al., 2017; Ma et al., 2021; Chu et al., 2021). There is a significant decrease in the NCP air pollutants, including SO2 and NOx, over the past decade, as reported by Z. Chen et al. (2019), Wen et al. (2021), and Zhu et al. (2021a). This could affect CCN production (Dusek et al., 2006; Hudson, 2007; Zhu et al., 2021b). This situation makes it imperative and essential to conduct new studies that quantify chemical drivers for growth of new particles that may become CCN and modification of preexisting particles simultaneously over the NCP (Wei et al., 2023).
Commercial particle sizers, such as the scanning mobility particle sizer (SMPS), wide-range particle sizer (WPS), and fast mobility particle sizer (FMPS), have limitations in detecting particles smaller than 3 or 5.6 nm and have low detection efficiency for particles smaller than 15 nm. As a result, newly formed particles are typically observed at initial sizes larger than 6–15 nm. Growth of clusters larger than 6–15 nm takes hours, during which time NPF can occur and move with the air mass. Although observations are important to characterize NPF events and explore related mechanisms, the use of one fixed site to observe condensable vapors is not sufficient to explain NPF occurring downwind, and it is difficult to perform Lagrangian observations in moving air masses. Thus, three-dimensional (3-D) modeling studies are needed to determine where NPF events initially occurred. Furthermore, it has been suggested that long-duration NPF events can extend hundreds of kilometers horizontally (Wehner et al., 2007; Hussein et al., 2009; Crippa and Pryor, 2013; Pikridas et al., 2015; Kerminen et al., 2018). However, relying solely on data from one or two observation sites limits understanding of NPF regional-scale spatial inhomogeneities. Factors such as NPF event duration, particle formation, and particle growth rates can differ significantly therein (Kim et al., 2016; Dai et al., 2017; Shen et al., 2018). Therefore, NPF modeling studies are critical to fully explore the 3-D dynamic evolution of NPF events.
Matsui et al. (2009) utilized the Weather Research and Forecasting (WRF) Community Multiscale Air Quality (CMAQ) and WRF-Chem models to reasonably replicate PNCs and identify instances of NPF during the CARE-Beijing 2006 campaign. Similarly, Chen et al. (2014) implemented a few simulations of PNCs in the NCP using the Nested Air Quality Prediction Modeling System (NAQPMS) with an Advanced Particle Microphysics (APM) model (X. Chen et al., 2017, 2019). The NPF-explicit WRF-Chem model has reportedly demonstrated a good performance in simulating some regional NPF events in East Asia and North America (Matsui et al., 2013; Dong et al., 2019; Yu et al., 2020), and Lai et al. (2022) investigated the vertical transport and distribution of particles using the WRF-Chem model. Therefore, it would be beneficial to utilize this model to examine the recently observed NPF events in the NCP, especially in terms of their 3-D evolution and chemical drivers for growth of new particles in horizontal and vertical directions, as highlighted in the companion paper, which discusses the low probability of newly formed particles to grow to CCN sizes. It is important to note, however, that there may be significant uncertainties in PNCs emission factors and particle number size distributions (PNSDs) from primary sources in China due to the lack of such data (Yao et al., 2005; Shen et al., 2022).
In this study, the NPF-explicit WRF-Chem model is used to investigate NPF events observed at a mountain site in the NCP from 23 June to 14 July 2019, focusing on chemical drivers to grow new particles to CCN, the uncertainty of estimated contributions of grown new particles to CCN, and 3-D NPF. Before the presentation and discussion of results, a comprehensive model performance evaluation will be delivered in Sect. 2.4. Section 3.1 will provide an overview of modeling NPF events. The simulated chemical drivers to grow newly formed particles at ground level and different heights will be presented in Sects. 3.2 and 3.3, respectively. Section 3.4 will analyze the 3-D evolution of NPF events and transport of new particles. Section 3.5 will address what happened to grown new particles after they disappeared from observations.
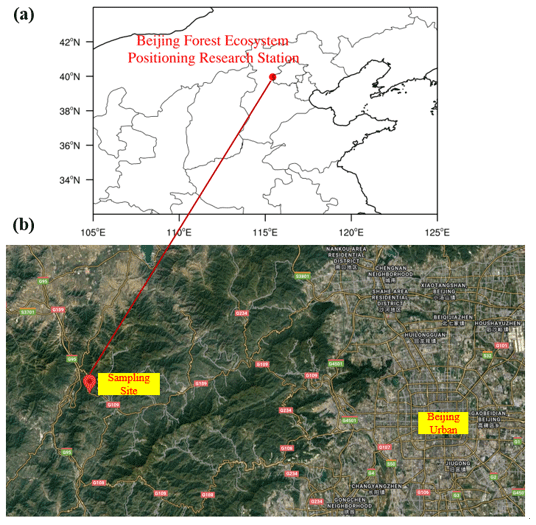
Figure 1Map of sampling site (a) and 3-D view of sampling site (b) in summer from Google Maps (©Google Maps).
2.1 Observational information
The Beijing Forest Ecosystem Positioning Research Station is located at an elevation of 1170 m a.s.l. (above sea level) and is surrounded by the Yanshan (39.96° N, 115.43° E; hereinafter referred to as the mountain station). This area is mainly covered by secondary forest vegetation, such as secondary shrub, oak, and birch. The mountain station is located at the western edge of Beijing (see Fig. 1) and is far from industrial and urban areas. Strong air pollutant sources and heavily polluted cities are distributed to the southwest 200–500 km from the site (Ma et al., 2019). No strong air pollutant emission sources are found to the north where the playing fields of the 2022 Beijing Olympic Winter Games are located. Simulated NPF events from the north were significantly stronger than those from other directions, as will be explained later.
The performance of the model was assessed using a suite of observational data, which were detailed in the companion paper. These included both on-line and off-line measurements of total PNCs, PNSDs, and CCN, which were conducted using a condensation particle counter (CPC; TSI model 3775), a fast mobility particle sizer (FMPS, TSI model 3091), a scanning mobility particle sizer (SMPS, Grimm), and a continuous-flow CCN counter (CCNC, DMT model 100), respectively. The instruments were located on the third floor of the main station building and obtained ambient air through conductive silicone tubing (TSI Inc., product number 3001788, inner diameter 0.19 in., outer diameter 0.375 in.) of ∼ 2 m length. In addition, a high-volume total suspended particle (TSP) sampler was used for off-line sampling to analyze water-soluble ions, as well as organic and elemental carbon. For measurements that took place between 14 and 30 June 2019, both the SMPS and the additional CPC were used. The FMPS measured from 23 June to 14 July 2019. Thus, it had a 1 week overlap with the SMPS measurements. During laboratory tests conducted after the campaign, it was determined that the dryer caused significant particle diffusion losses when the SMPS and CPC were used with flow rates less than 1 L min−1. However, the FMPS with a flow rate of 10 L min−1 did not suffer from this issue and was able to accurately capture rapid changes in PNCs from primary and secondary sources, as documented in previous studies (Yao et al., 2005, 2006; Man et al., 2015). Therefore, only the data collected between 23 June and 14 July were evaluated here. It is worth noting that the PNSDs were employed for a comparative analysis of NPF events with those measured at an urban site in Beijing, as presented in Zhou et al. (2020).
2.2 NPF-explicit WRF-Chem model
The NPF-explicit WRF-Chem model (Grell et al., 2005; Fast et al., 2006) was employed to simulate NPF events in the NCP between 23 June and 14 July 2019. The model was equipped with a 20-bin MOSAIC module that covered particle diameters from 1 nm to 10 µm (Matsui et al., 2011; Matsui et al., 2013; Lupascu et al., 2015; Lai et al., 2022). The parameter settings used in the model are shown in Table S1 in the Supplement. It should be noted that anthropogenic emissions in China for 2019 were not publicly available. Therefore, custom-modified MEIC_2019 emissions (Multi-resolution Emission Inventory for China), which were based on MEIC_2016 and assumed a linear downward trend in the total amounts of chemicals from 2016 to 2019, were used. The custom-modified MEIC_2019 emissions were successfully applied to simulate PM2.5 in the NCP, and more information can be found in Zhang et al. (2022).
2.3 Selection of nucleation mechanism
Based on previous research on the importance of H2SO4 and organic vapors in modeling high-altitude NPF events, as well as the varied environmental conditions found in forests (Metzger et al., 2010; Schobesberger et al., 2013; Riccobono et al., 2014; Yu and Hallar, 2014; Bianchi et al., 2016; Dong et al., 2019), this study selected the empirical H2SO4-organic nucleation mechanism in the NPF-explicit WRF-Chem model for simulating NPF events. The mechanism can be expressed as
The variable J represents the rate of formation of activated clusters with a diameter of 1 nm (measured in ). KORG (measured in ) is an empirical coefficient for nucleation, while [H2SO4] and [NucORG] represent the concentrations of gaseous sulfuric acid (measured in cm−3) and low-volatility organic compounds with a saturation mass concentration of 10−5–10−8 µg m−3, respectively (Lupascu et al., 2015). The nucleation empirical coefficient is a key parameter for accurately simulating NPF, but its value can vary significantly for different atmospheric conditions (Sihto et al., 2006; Riipinen et al., 2007; Matsui et al., 2011; Cui et al., 2014; Sullivan et al., 2018). In this study, a series of sensitivity tests were conducted to identify the optimal value of KORG for modeling NPF events in the NCP. The results showed that a value of KORG = 6.2 × 10⁻¹⁸ produced the best performance, and it was therefore used to replace the default value of KORG = 1.00 × 10⁻¹⁵ for modeling purposes.
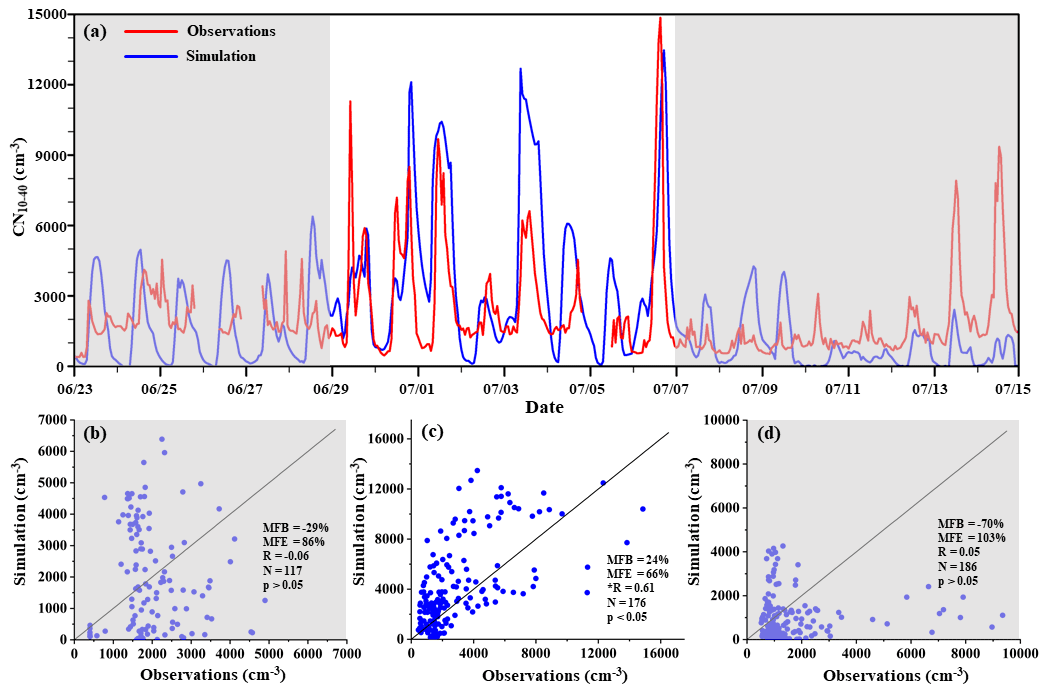
Figure 2Time series of observed and modeled CN10–40 from 23 June to 14 July (a), the comparison of the modeled CN10–40 with the observations in 23–28 June (b), in 29 June–6 July (c) and in 7–14 July (d) (a: local time is used and the harsh marks with the data represent the beginning of each day at 00:00, and the same is applicable for all time plots presented later).
2.4 Model performance evaluation
To evaluate the performance of the model, we compared the modeled PNCs, mass concentrations of secondary ions, and PM2.5 mass concentrations with the observations. Specifically, we evaluated the modeled CN10–40, which is the summed PNCs in the 10–40 nm range, by comparing it with the observations (Fig. 2a). The simulated CN10–40 showed a higher agreement with the observations during 29 June–6 July (unshaded area in Fig. 2a) than that before 29 June or after 6 July. To quantify the simulation performance of the CN10–40, we used three statistical parameters: mean fractional bias (MFB), mean fractional error (MFE), and correlation coefficient (R) (Fig. 2b–d). No benchmark is available regarding the statistical metrics for simulated atmospheric particle number concentrations, but we adopt the benchmarks and the goal values widely used in air quality studies for PM2.5 mass concentrations (US EPA, 2007; the benchmark with absolute MFB: ≤ 50 %; MFE: ≤ 75 %; the goal values with absolute MFB: ≤ 30 %; MFE: ≤ 50 %). During the NPF events period, the MFB of 24 % and the MFE of 66 % of 29 June–6 July met the benchmarks. This R was 0.61, which ranked high in the 0.4–0.7 range reported in the literature (Matsui et al., 2013; Lupascu et al., 2015; Dong et al., 2019). However, the three parameters showed poor model reproduction of observations before 29 June and after 6 July (Fig. 2b–d). The reasons for the poor simulations are not yet explained. In our recent study (Zhang et al., 2023), we tried to modify the model to improve its performance near the coast. However, those modifications are not applicable to this study and are therefore not applied.
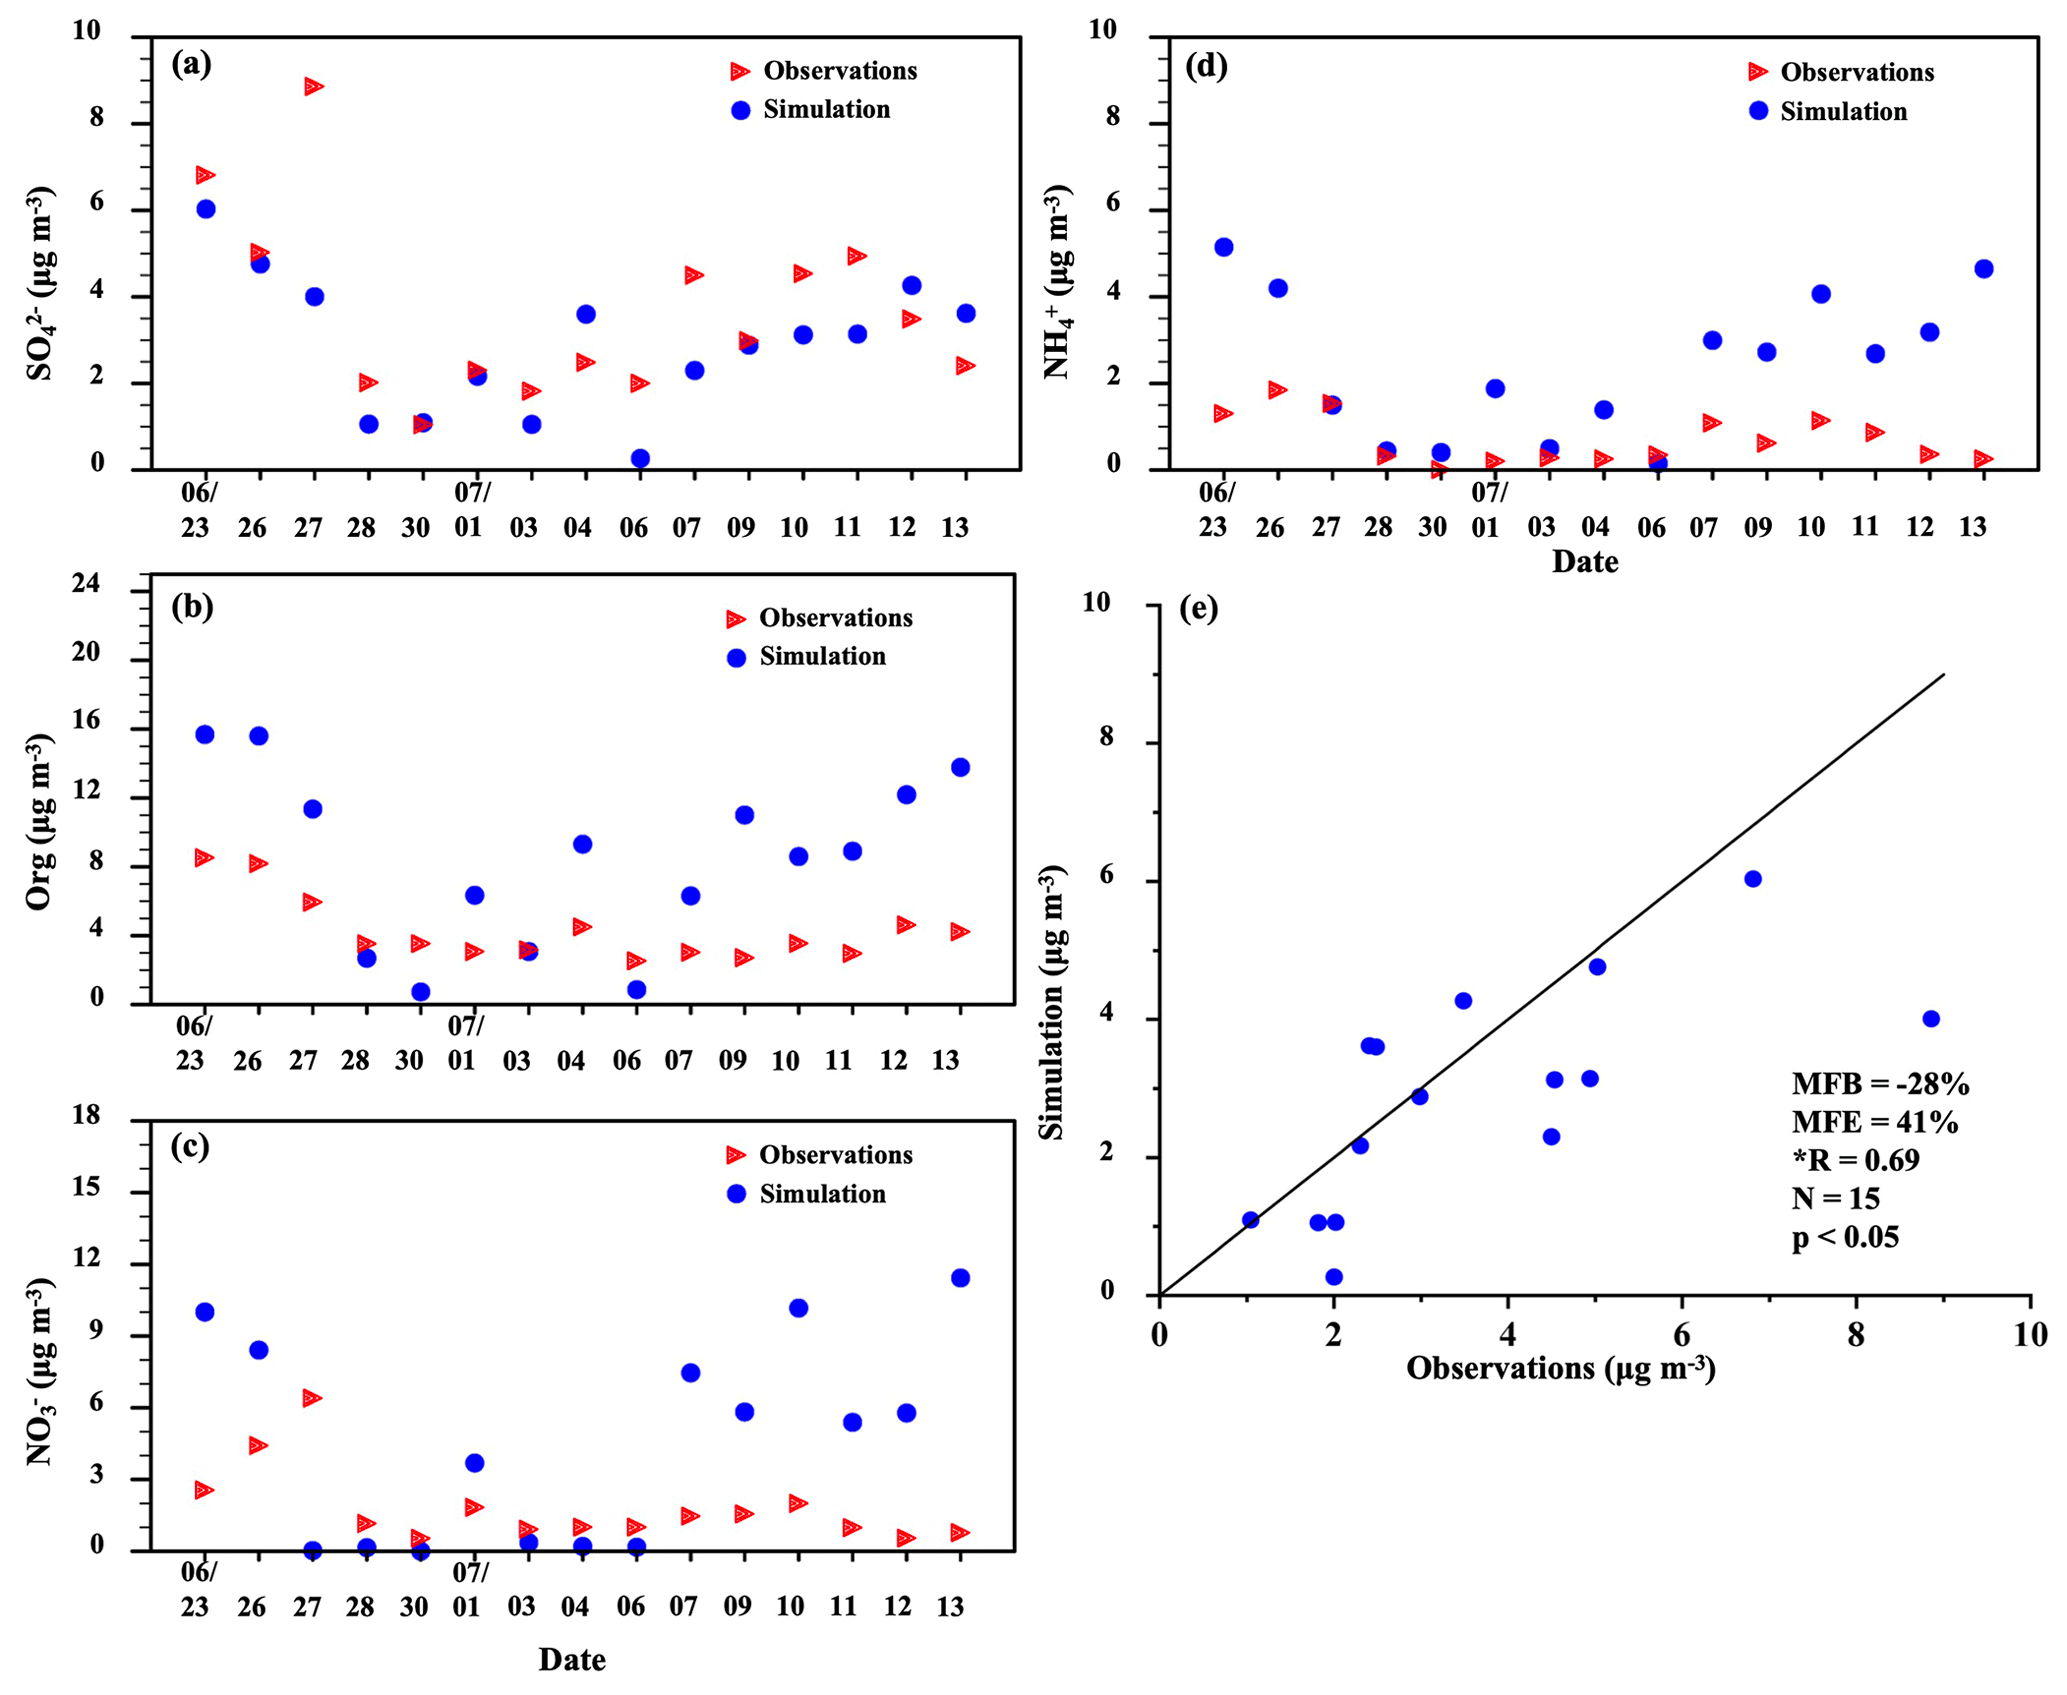
Figure 3Time series of observed and modeled mass concentrations of (a), organics (b), (c), and (d), as well as a comparison of the modeled and observed (e) in 23 June–14 July.
The simulated mass concentrations of within PM10, shown in Fig. 3a–e, met the benchmarks, i.e., MFB = 28 %, MFE = 41 %, and R = 0.69, for reproducing the observations of total suspended particles collected at the mountain station. However, the model tended to overestimate organic mass concentrations (ORG in Fig. 3b), , and within PM10 before 29 June and after 6 July. Despite this, the model was able to reproduce the low mass concentrations of all three species within PM10 between 29 June and 6 July. Differences of simulated concentrations from observed values can be due to model weaknesses such as sometimes poorly predicting meteorology, poorly estimating air pollutant emissions, or lack of key mechanisms (US EPA, 2007; Matsui et al., 2011; Liu et al., 2021; Shen et al., 2022). However, the poor performance in overestimating observed organics, , and could also be attributed to sampling artifacts, given their higher volatility compared to ammoniated sulfate acid (Yao et al., 2002; Chow et al., 2010).
During this study period, the chemical composition measured by the ToF-ACSM (time-of-flight aerosol chemical speciation monitor) in Beijing (39.98°N, 116.39°E) was used for evaluation. The simulated mass concentrations of , , , and organics within PM1.0 were reasonably consistent with the 29 June to 6 July observations, which had frequent NPF events (unshaded area in Fig. S1a–d in the Supplement, referring to the frequent-NPF period in this study). However, this was not the case before 29 June and after 6 July. Quantitatively, the model performed to meet the benchmarks for simulating (MFB = 7 %, MFE = 54 % in Fig. S1e) with R = 0.52 and p < 0.05 and for organics (MFB = 1 %, MFE = 40 % in Fig. S1h) with R = 0.58 and p < 0.05 during the frequent-NPF period. On 5 July, the model mistakenly predicted the daytime wind direction to be mainly from the northeast, while the on-site recorded wind direction swayed between southwest and northwest. When excluding the evidently overestimated concentrations of PM2.5 and all ions on 5 July, the model performed better in reproducing and organics. The MFB and MFE were below the goal values with MFB = 4 % and MFE = 49 %, and R largely increased. For the modeled , the MFB (−1 %) and MFE (57 %) met the benchmarks during the frequent-NPF period (Fig. S1g). Excluding the data on 5 July only slightly increased R from 0.41 to 0.45. On the other hand, for , the model largely overestimated the observations, and the MFB (−125 %) and MFE (178 %) did not meet the benchmarks during the frequent-NPF period (Fig. S1f). Excluding the data of 5 July, the model performed even worse in predicting . Simulations of in the literature also showed significant overestimations (Zakoura and Pandis, 2018; Travis et al., 2022).
Model performance met the benchmarks in reproducing PM2.5 mass concentrations in both Beijing downtown (R = 0.49, p < 0.05, MFB = 1 %, MFE = 49 %, as shown in Fig. S2c in the Supplement) and Beijing suburbs (R = 0.42, p < 0.05, MFB = −32 %, MFE = 69 %, as shown in Fig. S2d) during the frequent-NPF period (unshaded area in Fig. S2a and b). Notably, the model also met the goal values in simulating PM2.5 mass concentrations prior to 29 June, with an R = 0.58 and p < 0.05, as well as MFB and MFE of −14 % and 26 %, respectively, in Beijing downtown and in suburban Beijing with an R value of 0.54 with MFB and MFE values of −11 % and 33 %, respectively. Overall, the model demonstrated performance that met the benchmarks or even met the goal values for simulating the variables of interest during 29 June–6 July, except for . As such, we will focus our analysis and discussion on the frequent-NPF period of better simulation performance.
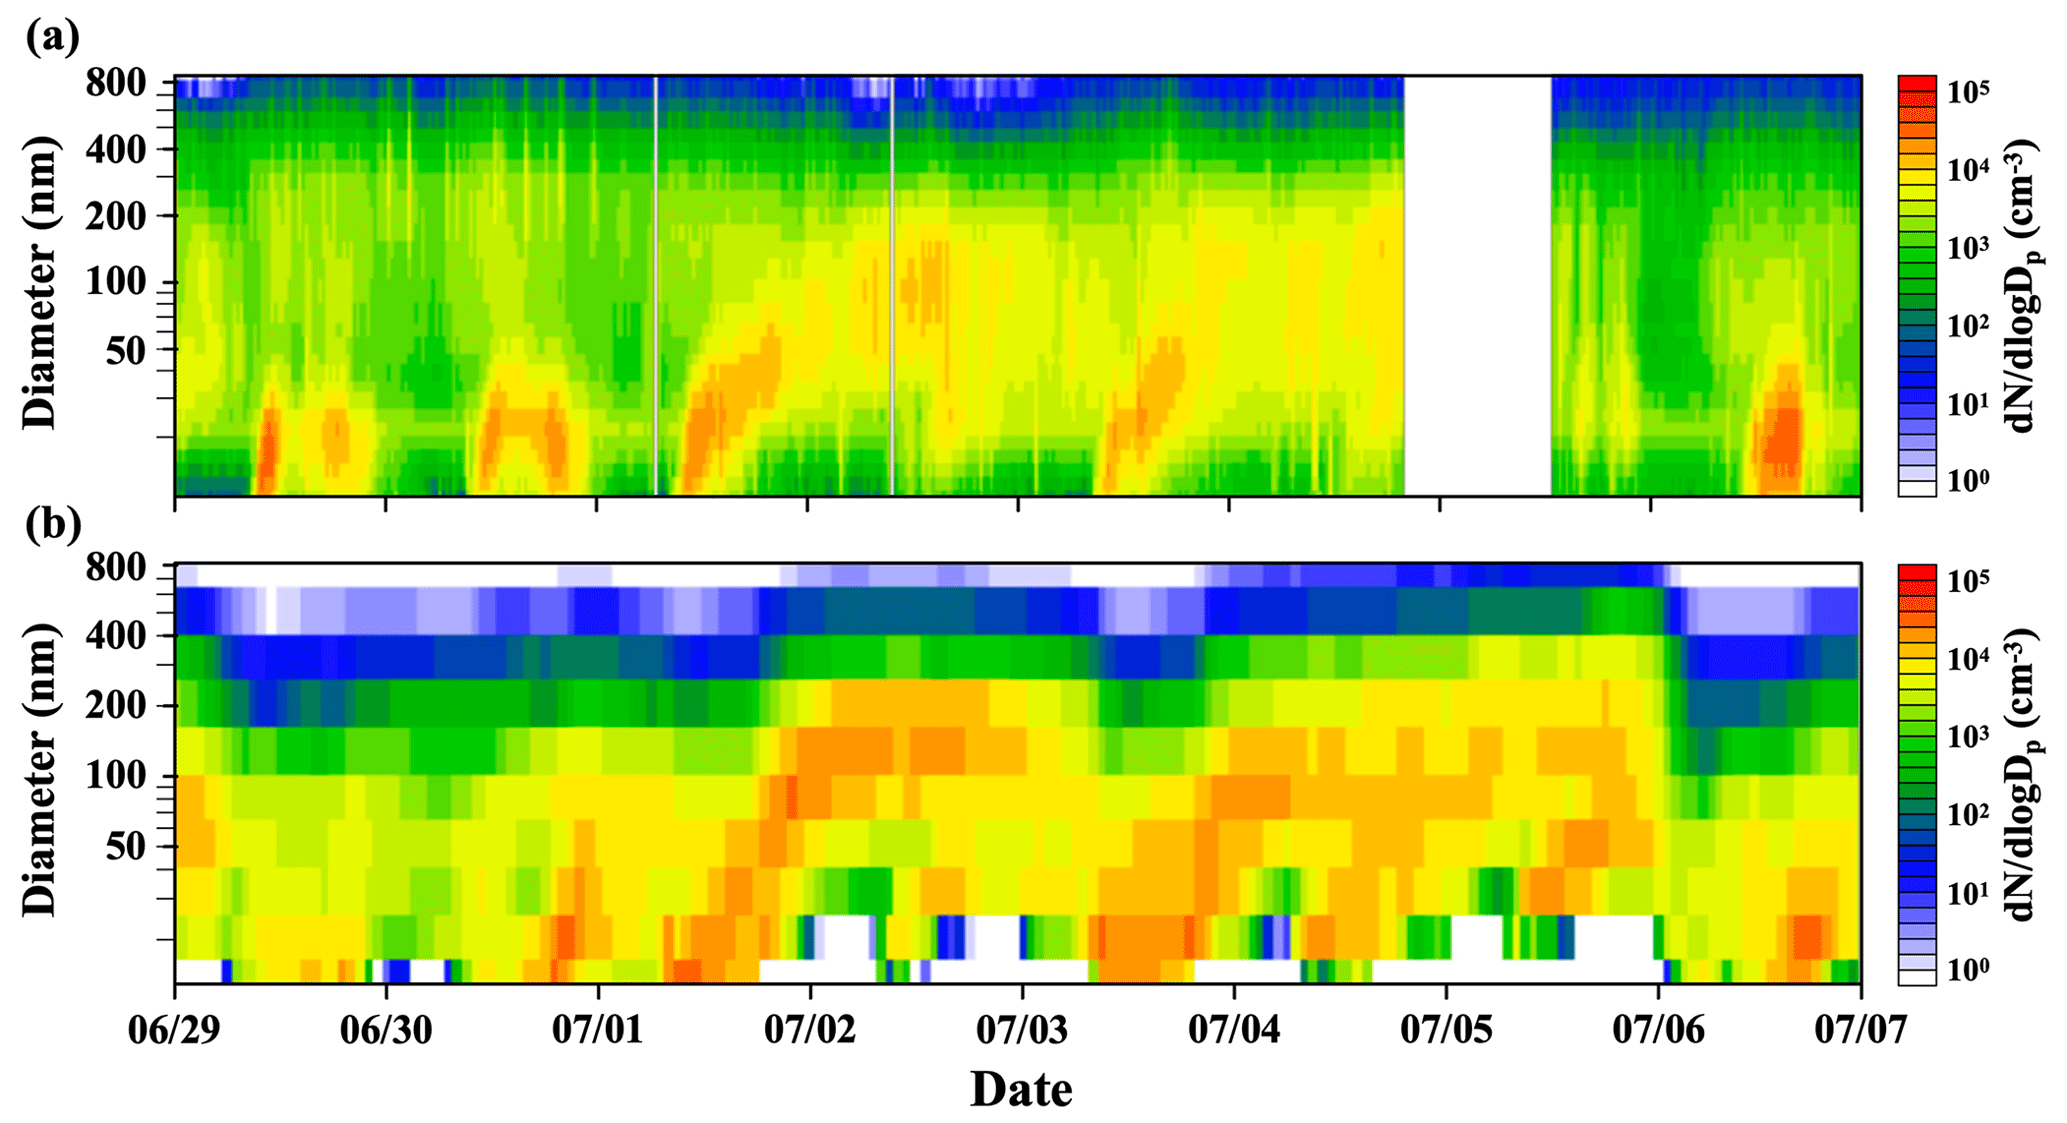
Figure 4Contour plot of PNSDs from observations (a) and modeling (b) from 29 June to 6 July 2019.
3.1 Overview of modeling NPF events
From 29 June to 6 July 2019, there were five NPF events (29 and 30 June and 1, 3, and 6 July) as shown in Fig. 4a and b. The high frequency of NPF events was associated with clean air masses from the north and was favored by dry and sunny conditions, which is consistent with previous literature (Wu et al., 2007; Chu et al., 2021; Ma et al., 2021). During the NPF events on 1 and 3 July, a typical banana-shaped growth pattern was observed, with the maximum median mode diameter of newly formed particles reaching above 60 and around 50 nm, respectively. The NPF events on 29 and 30 June also experienced rapid new particle growth during the initial 2–3 h, but the maximum median mode diameters of the newly formed particles were smaller than 30 nm. Similarly, during the NPF event of 6 July, the maximum median mode diameter of the newly formed particles was smaller than 30 nm before they disappeared from the observations. The details on the growth patterns can be found in the companion paper (Wei et al., 2023).
The modeling results effectively captured the occurrence characteristics of five NPF events, including their initial occurrence time and duration. Moreover, the model partially captured the growth characteristics of new particles while the low size resolution of modeled results cannot allow a quantitative comparison of the growth parameters. However, the model failed to predict the decreased median diameter of new particles at nighttime on 29 and 30 June, because the related mechanisms were not included in the model and were poorly understood (Yao et al., 2010; Skrabalova et al., 2015; Alonso-Blanco et al., 2017; Kamra et al., 2022). Furthermore, the modeling results performed to meet the benchmarks for reproducing the PNC plumes occurring on the nights of 2–3 and 4–5 July. However, the model overestimated PNCs plumes on 5 July, which was consistent with the overestimation of PM2.5, , , , and organics, as mentioned above. This overestimation of PNCs was previously reported by Matsui et al. (2011), who argued that it was due to the underestimation of vertical mixing capacity at night and excessive ground chemical concentrations in the model. Similar arguments were also reported by Mckeen et al. (2007) and Matsui et al. (2009). More discussion of PNCs in the vertical can be found in Sect. 3.3.
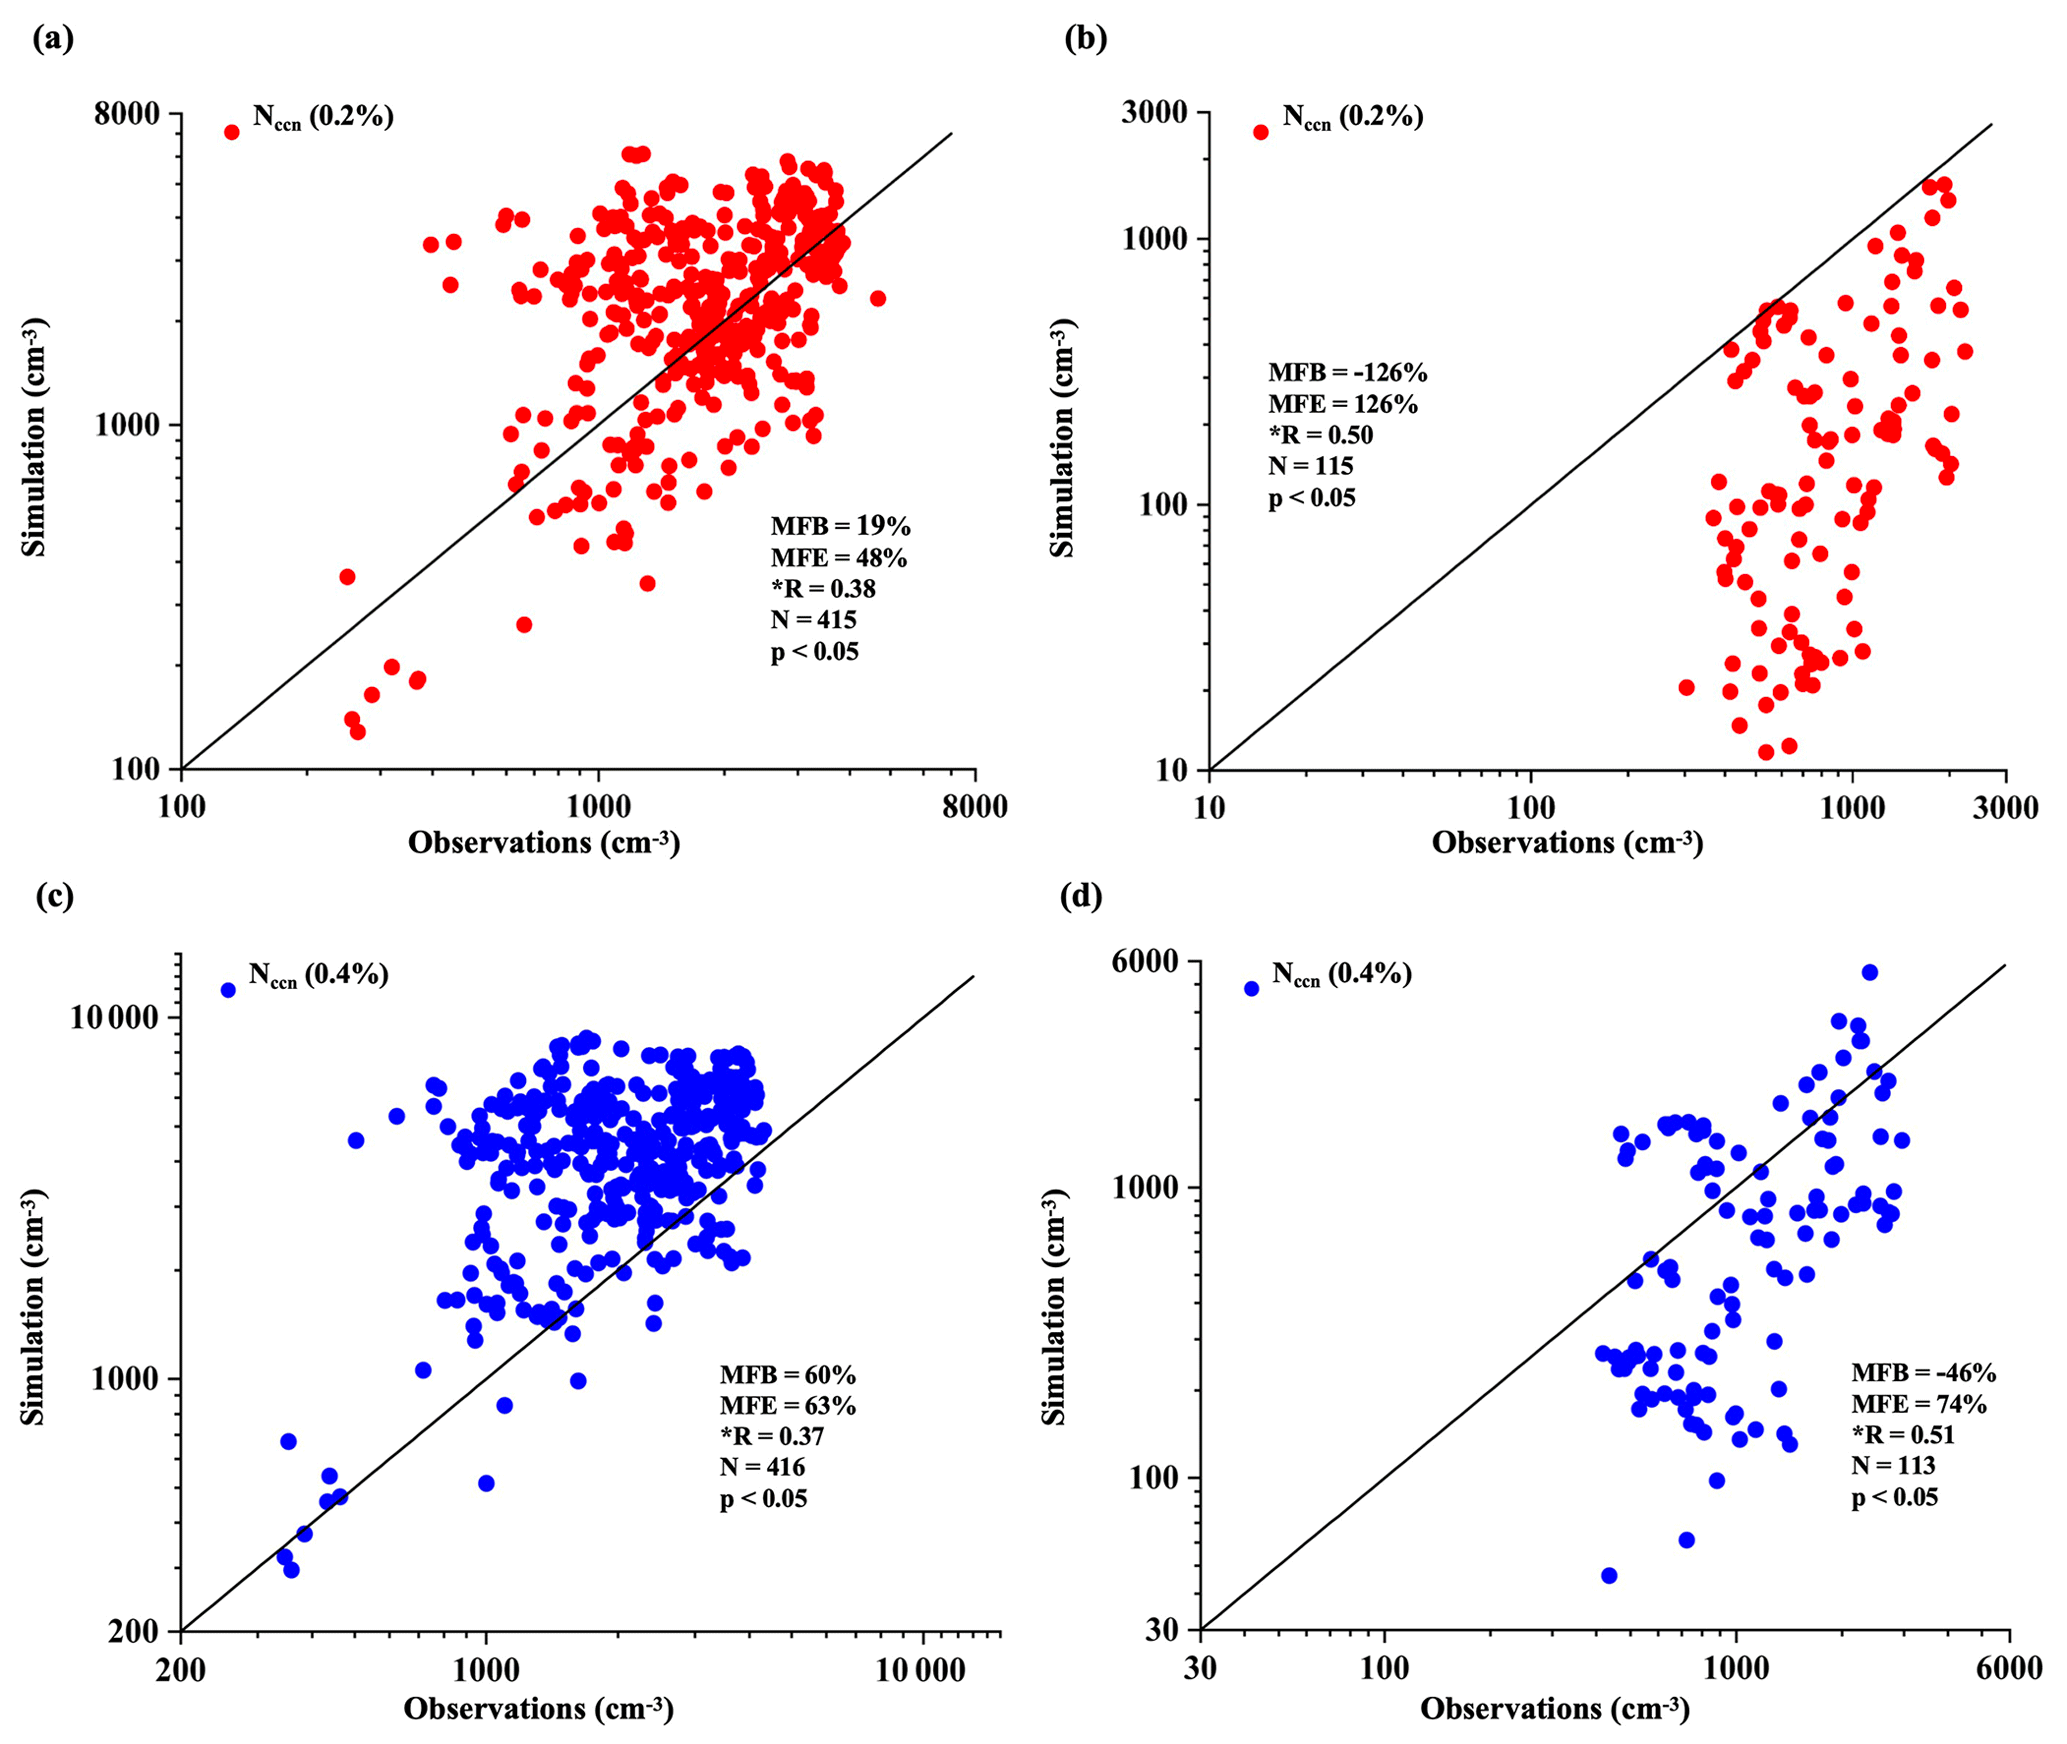
Figure 5The simulated Nccn against the observations at 0.2 % supersaturation (SS) (a, b) and 0.4 % SS (c, d) on non-NPF days (a, c) and NPF days (b, d), respectively, during the frequent-NPF period.
When considering NPF and non-NPF days separately, the simulated Nccn at SS = 0.2 % met the goal values on non-NPF days, with R = 0.38, p < 0.05, MFB = 19 %, and MFE = 48 % (Fig. 5a). However, on NPF days, the model substantially underestimated Nccn at SS = 0.2 % with R = 0.50, p < 0.05 (Fig. 5b). At SS = 0.4 %, the model performed to meet the benchmarks for reproducing Nccn on NPF days, with R = 0.51, p < 0.05, MFB = −46 %, and MFE = 74 % (Fig. 5d). However, it substantially overestimated Nccn at SS = 0.4 % relative to the observations on non-NPF days (Fig. 5c). The underestimation or overestimation was determined not only by the estimated PNCs with sizes larger than 60–120 nm but also by the κ values. We will delve into this further later on.
Based on the reasonable model predictions of NPF events from 29 June to 6 July, a comprehensive analysis of three distinct NPF events will be conducted in Sect. 3.2–3.5. This analysis will include a detailed examination of the chemical drivers at ground level and their vertical profiles, 3-D growth patterns of new particles, contributions of grown new particles to CCN, and other relevant factors.
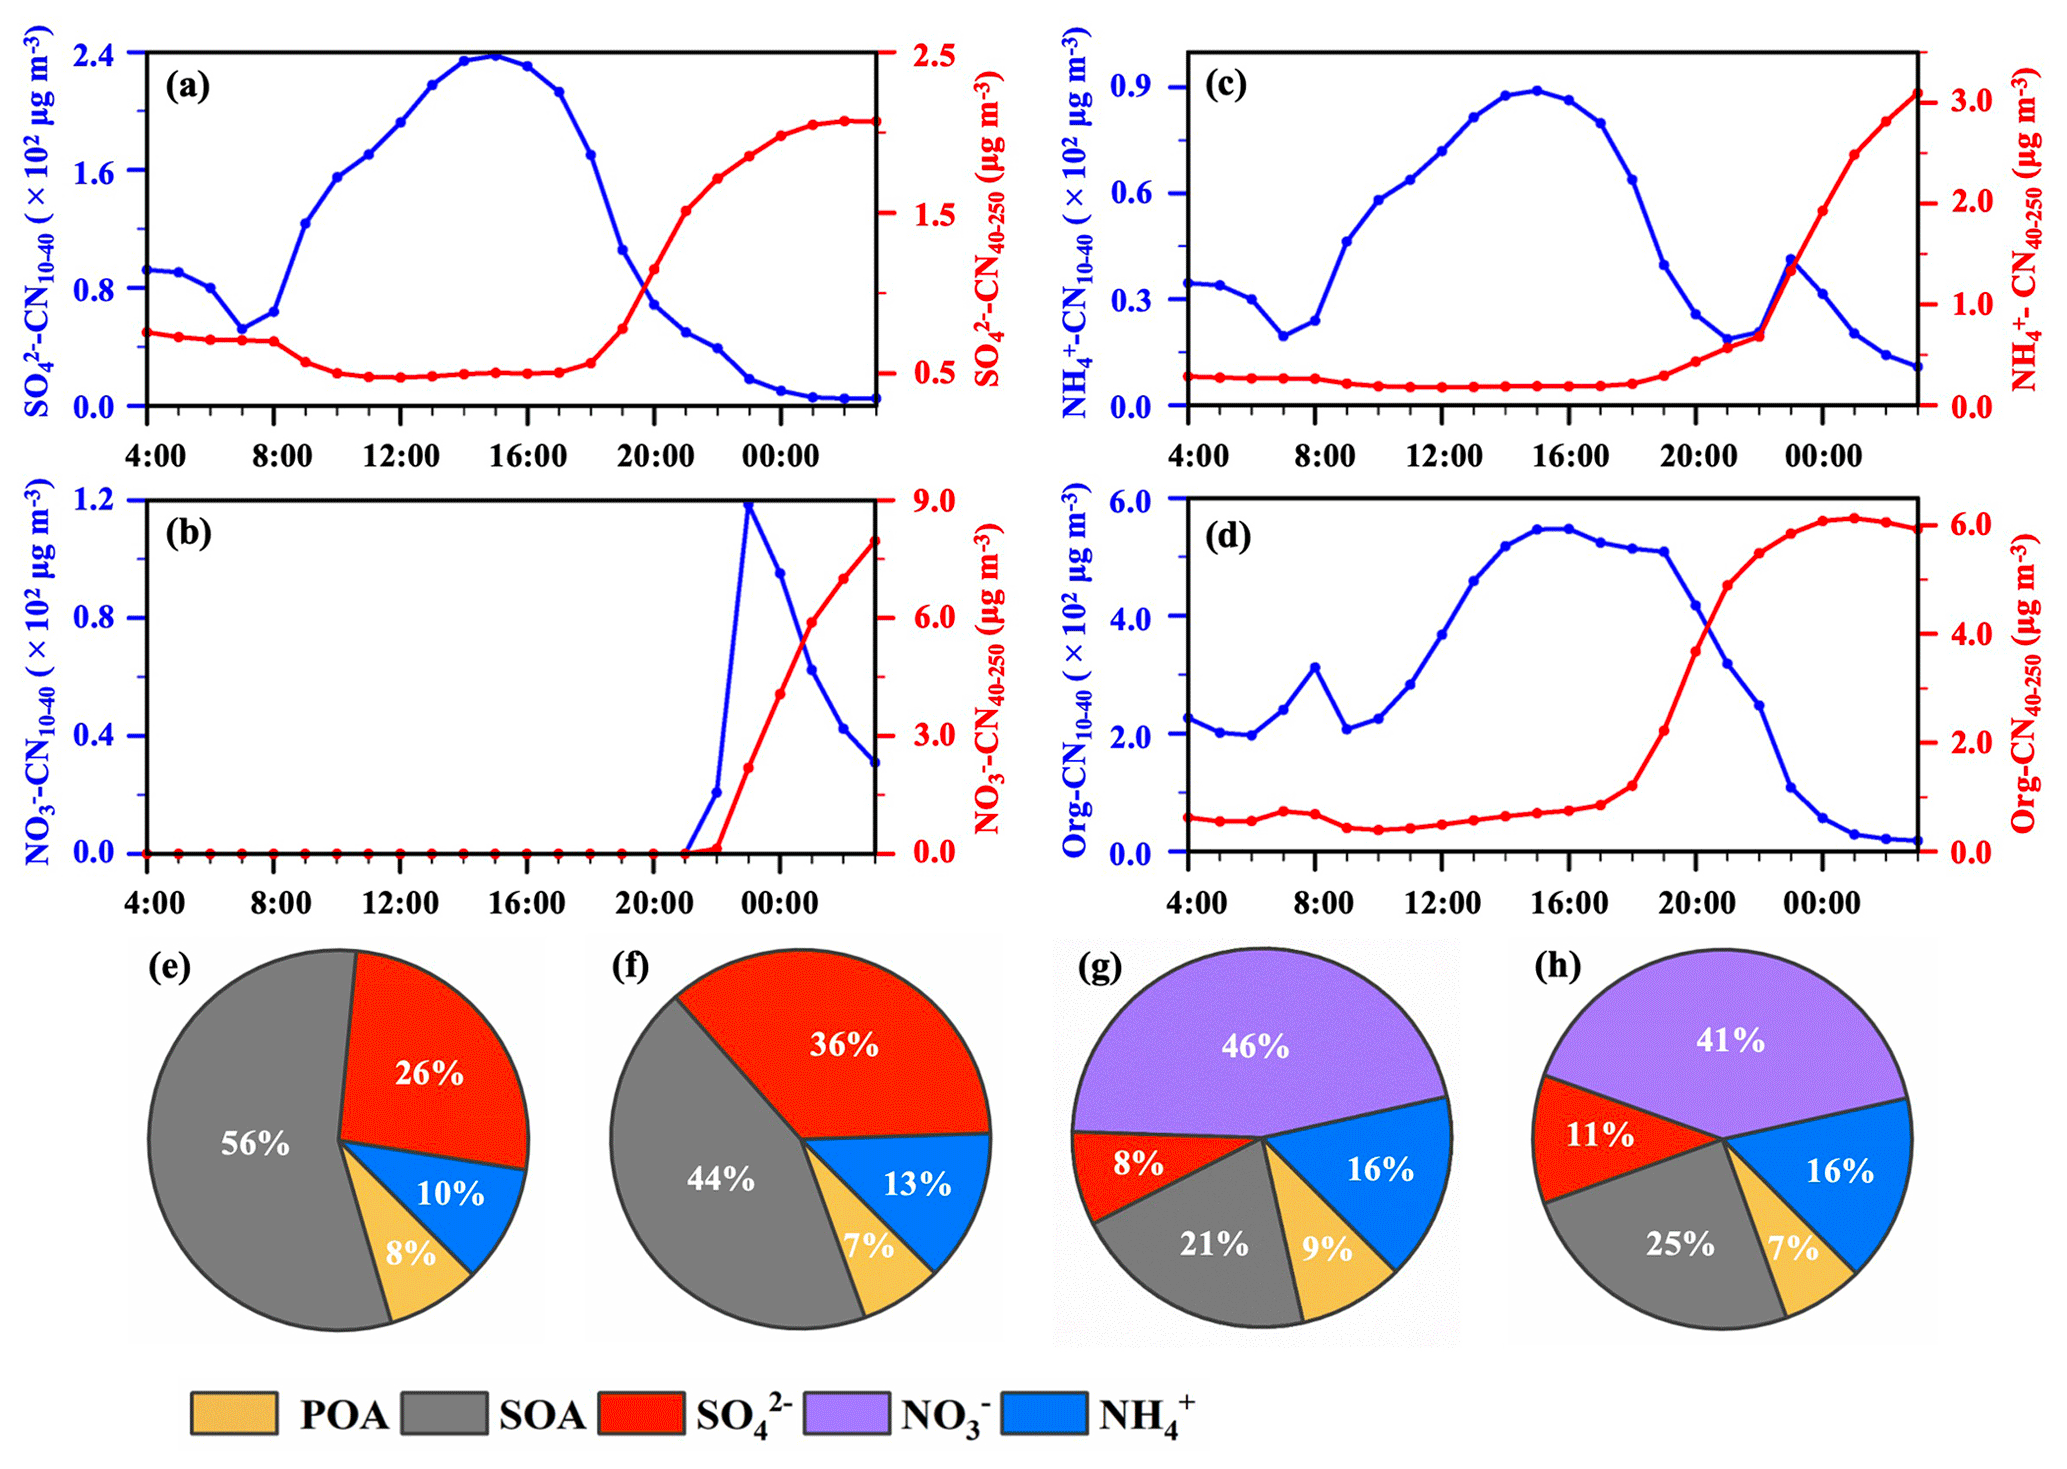
Figure 6Diurnal variations in modeled chemical components in 10–40 nm particles and 40–250 nm particles: (a), (b), (c), and organics (d) on 1–2 July; fractions of chemical species in 10–40 nm particles (e) and 40–250 nm particles (f) at 15:00 on 1 July and those at 03:00 on 2 July (g, h). POA and SOA stand for primary organic aerosol and secondary organic aerosol, respectively.
3.2 Chemical drivers to grow newly formed particles and subsequently contribute to CCN at the ground level
Figure 6a–d presents time series data for modeled chemical components of particles within two size ranges (10–40 nm and 40–250 nm) on 1–2 July. During daytime, organics were found to be the dominant contributor to growth of 10–40 nm particles followed by (NH4)2SO4. In contrast, NH4NO3 was the most significant chemical component driving growth in 40–250 nm particles during nighttime. An analysis of κ presented later in this section confirms that this could be an overestimated effect. To determine the relative contribution of each species as examples, their fractions within particles within each size range were calculated at two time points: 15:00 LT (local time in Beijing, UTC+8) on 1 July (Fig. 6e and f) and 03:00 on 2 July (Fig. 6g and h). To account for differences in the contributions of secondary organic aerosol (SOA) and primary organic aerosol (POA) to new particle growth in the model results, SOA and POA were analyzed separately. In this study, SOA was defined as the sum of secondarily generated particulate organics from anthropogenic and biogenic precursors, while POA was the sum of primary organic aerosol.
At 15:00 on 1 July, the simulated SOA contributed 56 % of the total mass of particles ranging from 10–40 nm, while (NH4)2SO4 accounted for 36 %, and POA made up 8 % of the mass. The high mass fraction of (NH4)2SO4 in 10–40 nm particles at 15:00 resulted in corresponding high hygroscopicity parameters (κ) of up to 0.24. The model predicted that the fraction of (NH4)2SO4 in 40–250 nm particles was larger than that in 10–40 nm particles at 15:00, with (NH4)2SO4 contributing 49 % of the mass, followed by 44 % for SOA and 7 % for POA. This resulted in a corresponding κ value of up to 0.30. However, the estimated κ values based on observations at SS = 1.0 %, 0.4 %, and 0.2 % were only 0.08, 0.08, and 0.16, respectively, at the same time, as reported in the companion paper. At 08:00, the model predicted that the concentration of H2SO4 vapor was approximately 108 (Fig. S3 in the Supplement), which was substantially higher than previous observations in Beijing, where the maximum concentration was around 107 (Wang et al., 2011; Lu et al., 2019). Other modeling studies (Matsui et al., 2011; 2013) have also reported an overestimation of H2SO4 vapor similar to ours. In addition, gas-to-particle condensation overwhelmingly contributed to POA in 10–40 nm particles, which also aided in the growth of newly formed particles. According to our simulated mass fractions of 40–250 nm particles, which are 68 % in NH4NO3 and (NH4)2SO4, 25 % in SOA, and 7 % in POA, this led to the model-based κ value being estimated at 0.37. However, at 03:00 on 2 July, the observation-based estimated κ values at SS = 1.0 %, 0.4 %, and 0.2 % were 0.10, 0.13, and 0.28, respectively, as reported in our companion paper. In this case, overestimation of NH4NO3 is likely to have contributed to the overestimation of κ (Fig. S1b and c).
Similar to the NPF event on 1–2 July, the modeling results on 3–4 July indicated that SOA was the dominant driver of new particle growth. Overestimation of H2SO4 vapor during daytime resulted in overestimated κ values for particles ranging from 10–40 and 40–250 nm (Fig. S4a–h in the Supplement). However, the model did not predict the formation of NH4NO3 before 24:00 on 3 July, which was consistent with observation-based estimated κ values of less than 0.1 at SS levels of 0.4 % or higher.
On 6 July, the model predicted that new particle growth was dominantly driven by SOA, with higher contributions than those observed on 1–2 July and 3 July (Fig. S5a–j in the Supplement). Unlike the cases on 1–2 July and 3 July, the κ values derived from the modeled mass fractions of 10–40 and 40–250 nm particles were reasonably consistent with the observation-based κ values on 6 July. This suggests that there was no detectable evidence for overestimated H2SO4 vapor condensation during daytime on 6 July. Additionally, the model did not predict the formation of NH4NO3 before 24:00 at nighttime.
Figure S6a–c in the Supplement presents the comparison of CCN simulations with observations for 0.2 % SS during the NPF events on 1, 3, and 6 July, respectively. The comparison shows that the simulated Nccn at 0.2 % SS were clearly underestimated by several times. This underestimation was mainly due to the underestimates of number concentrations of preexisting particles > 100 nm, as the κ values of particles at different sizes during the NPF events had been overestimated to some extent. However, the model performed to meet the benchmark for reproducing Nccn at 0.4 % SS during the NPF events on 1 and 3 July (Fig. S6d and e). In these cases, the overestimation of number concentrations of grown new particles and their κ values probably canceled out the effect of the underestimated preexisting particles (> 100 nm). However, this was not the case for the NPF event on 6 July (Fig. S6f), when the grown new particles were too small to be activated as CCN. On that day, the Nccn values at 0.2 % SS were still underestimated to some extent.
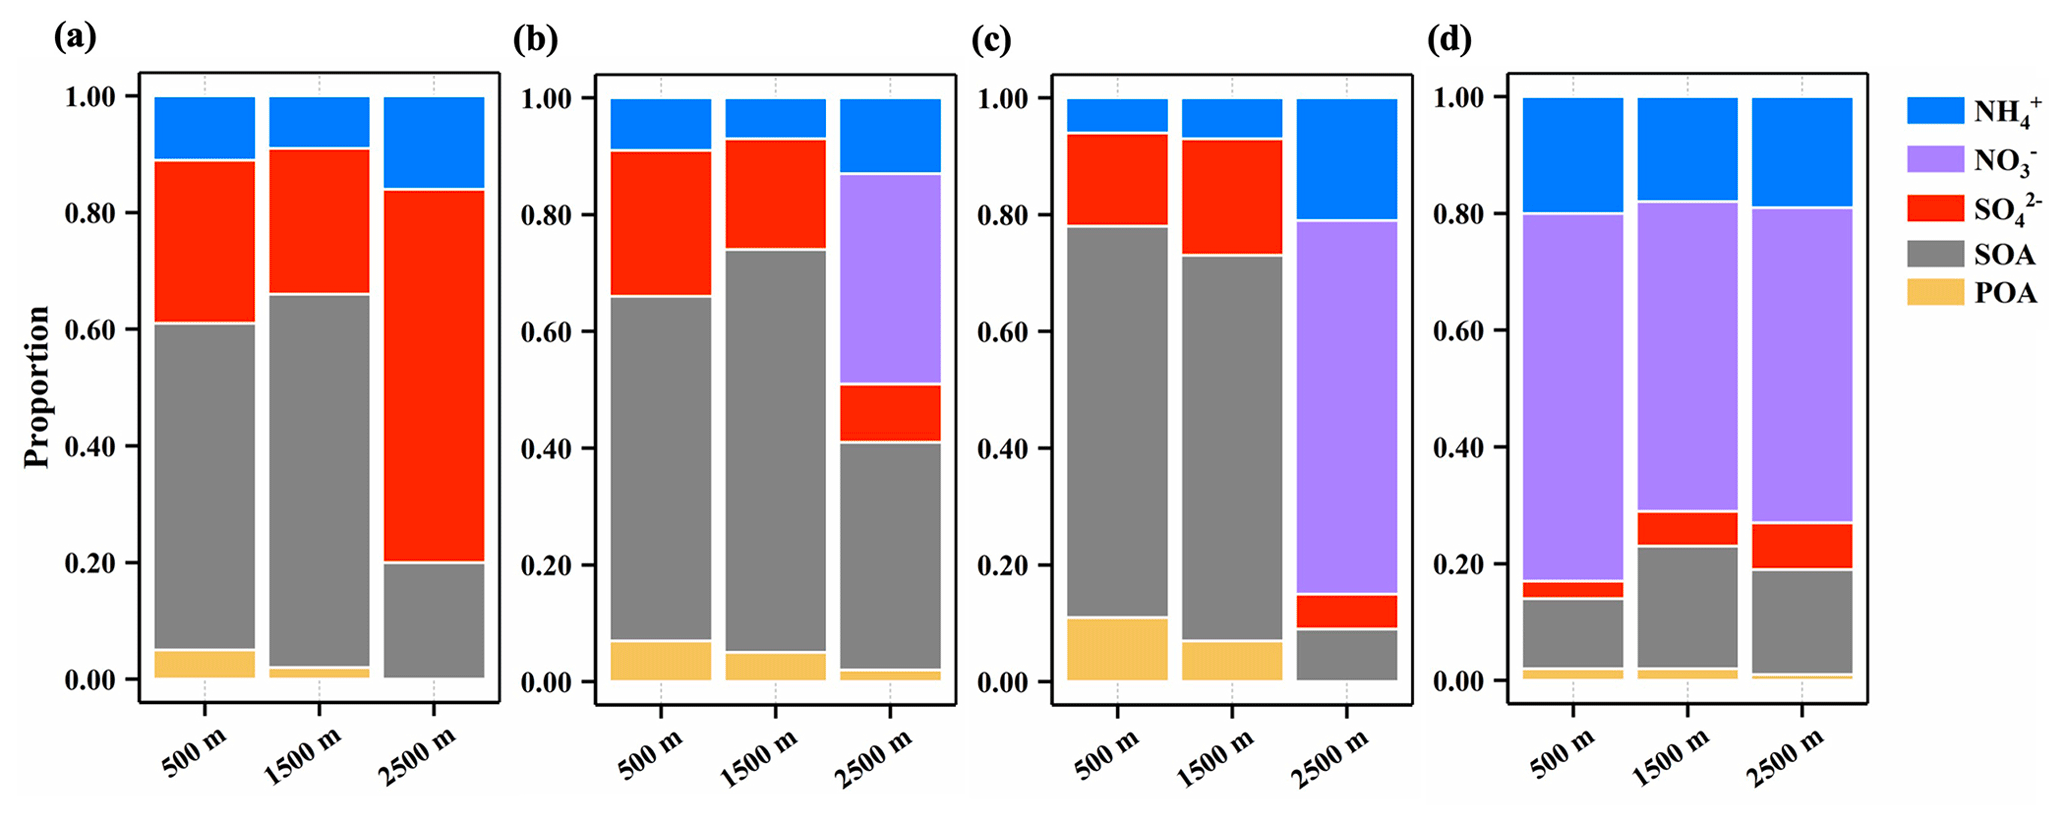
Figure 7The simulated chemical components in 10–40 nm particles at 500, 1500, and 2500 m above the ground, respectively, at 10:00 (a), 15:00 (b), 22:00 (c) on 1 July and 03:00 (d) on 2 July.
3.3 Chemical drivers to grow newly formed particles in the vertical direction
Based on the facts that the model reproduced CN10–40 and organic drivers, which led to the growth of new particles at the ground level, and met the benchmark during 29 June–6 July, this section delves deeper into the chemical drivers at different heights during three selected NPF events. Figure 7a–d show the simulated chemical composition of 10–40 nm particles at three different heights (500, 1500, and 2500 m) above the observation site. These heights represent the lower part of the planetary boundary layer (PBL), the upper part of the PBL in the morning during the initial occurrence of NPF, and the top of the diurnal peak PBL on 1–2 July, respectively. The results indicate that SOA dominated the growth of 10–40 nm particles at 500 and 1500 m at 10:00, 15:00, and 22:00 on 1 July. In contrast, inorganic species were found to control growth at 2500 m during the same time; that is, the ammoniated sulfuric acid likely acted as the dominant driver at 10:00, while the dominant driver switched to NH4NO3 at other times. This height dependence of chemical drivers is consistent with previous findings in the literature, which attribute it to the low abundance of volatile organic compounds in the free troposphere (Sanchez et al., 2018; Williamson et al., 2019). On 2 July at 03:00, NH4NO3 acted as the dominant driver at all heights. However, as mentioned earlier, the ammoniated sulfuric acid and NH4NO3 in 10–40 nm particles may have been overestimated to some extent during daytime and nighttime at the ground level. The same overestimation could also occur at different heights, underscoring the urgent need for vertical observations of chemical composition in 10–40 nm particles.
On 3 July, the simulation showed a similar height dependence of chemical drivers for the growth of newly formed particles (see Fig. S7 in the Supplement). However, the model did not predict any NH4NO3 at a height of 500 m before the new particle signal disappeared. On 6 July, the model predicted that a combination of SOA and POA contributed to approximately 80 %–90 % of the CN10–40 mass concentrations at a height of 500 m during the event, as shown in Fig. S8 in the Supplement. However, these percentages decreased with increasing height, dropping to approximately 35 %–60 % at a height of 2500 m. This indicates that inorganic species also played a significant role in the growth of newly formed particles, with an even greater contribution at higher altitudes.
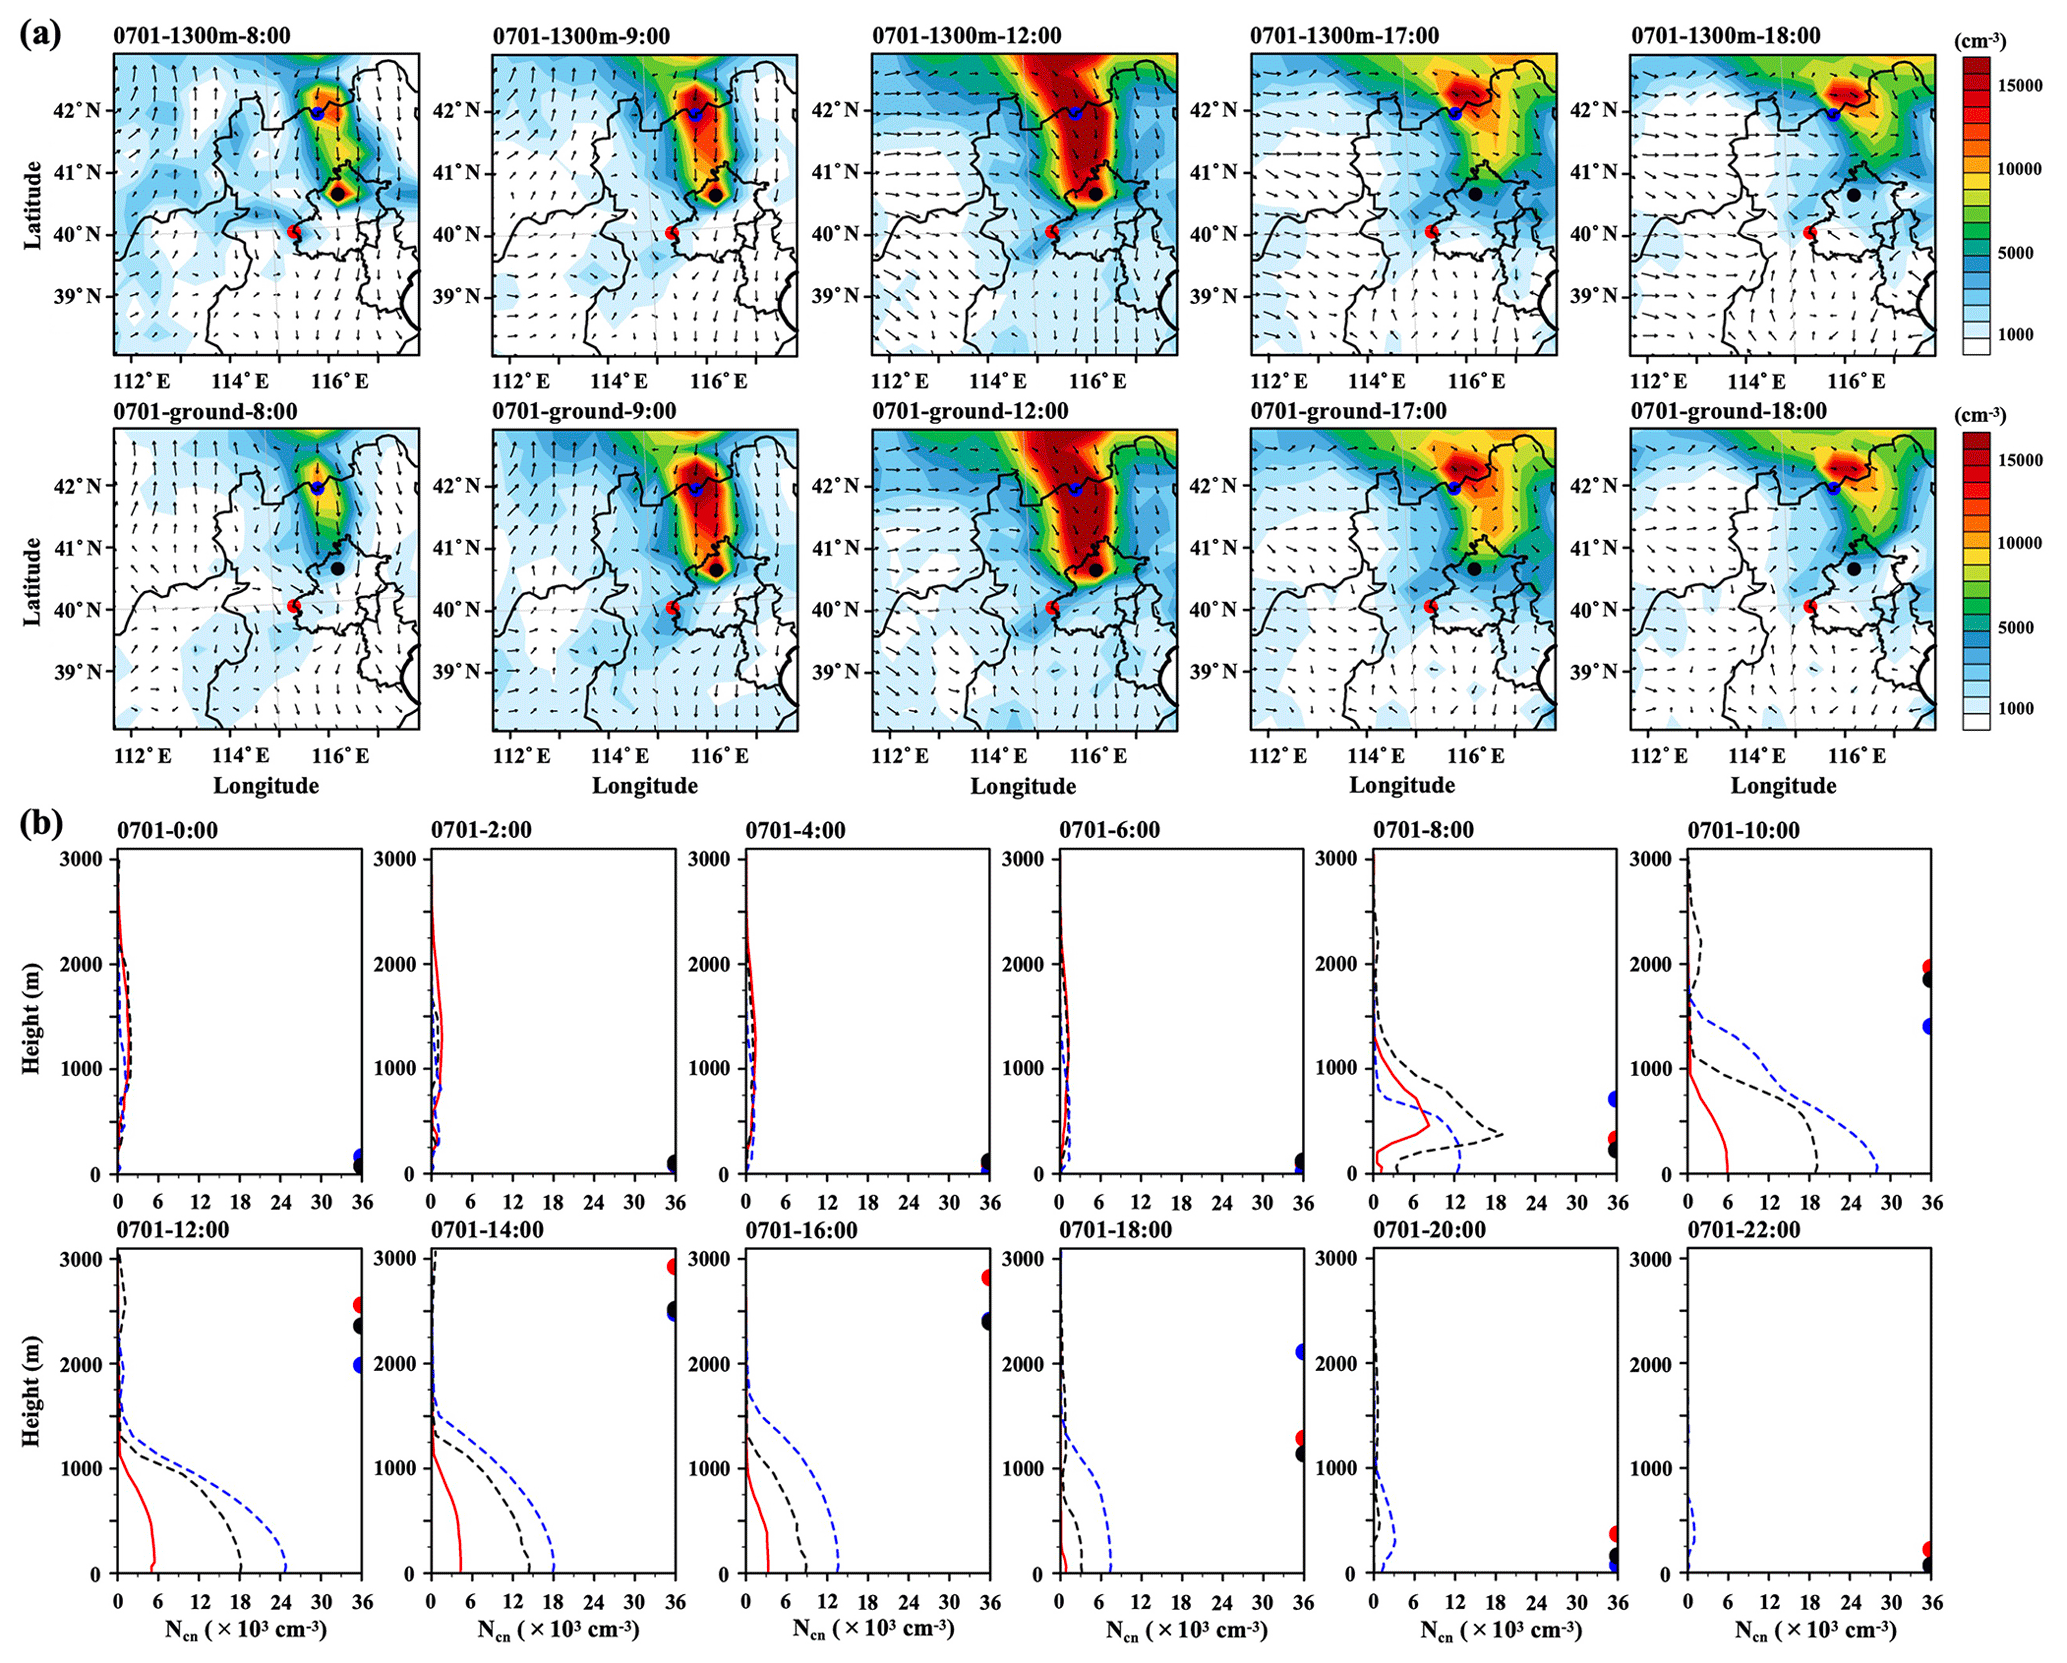
Figure 8Horizontal distribution of CN10 at ∼ 1300 (a, the upper row) and on the ground level (a, the bottom row) at 08:00, 09:00, 12:00, 17:00, and 18:00 on 1 July 2019 (the red, blue, and black solid dots represent the observation site and two centers of strong NPF zones (point A and point B), respectively; the direction and length of the black arrows represent the wind direction and wind speed, respectively); Vertical profiles of CN10 above the observational site (red solid line), point A (blue dashed line) and point B (black dashed line) from 00:00 to 22:00 on 1 July 2019 (b, the Y-axis coordinate is the height above the ground; the red, blue, and black solid dots represent the height of the PBL over the observational site, point A, and point B, and the PBL values exceeding 3000 are not shown in figure).
3.4 3-D occurrence of NPF events and transport of newly formed particles
To investigate the 3-D evolution of NPF events, we utilized the CN10 (summed number concentrations of particles with diameter less than 10 nm) instead of CN10–40. The simulated 3-D evolution of CN10 on 1 July is presented in Fig. 8a and b. The maximum CN10 value of approximately 8000 cm−3 was predicted over the mountain station at around 1300 , starting from 08:00 on 1 July. At this point, the PBL had risen to approximately 1260 As reported in the literature, NPF events tend to occur initially in the residual layer, which was formed above the PBL at night, due to high oxidation capacity, low condensation sink, and abundant precursors (Stratmann et al., 2003; Wehner et al., 2010; Quan et al., 2017; Qi et al., 2019; Tröstl et al., 2016). From 08:00 to 09:00 on 1 July, NPF rapidly extended to the ground level, leading to a sharp increase in CN10 at that altitude (Fig. 8b). The NPF event reached its maximum concentration at the ground level between 10:00–11:00 and subsequently weakened.
When examining the occurrence of NPF in the horizontal at an altitude of approximately 1300 , a significant spatial inhomogeneity was predicted across the NCP. Specifically, the simulated CN10 revealed the presence of two stronger NPF regions located roughly 100–300 km away from the observation site at 08:00 (see Fig. 8a). From 09:00 to 12:00, these two stronger regions continued to expand and eventually connected with each other, forming a large zone approximately 270 km × 135 km in size, located at 40.5–43° N and 115–116.5° E. When comparing the vertical distributions of the mountain station and points A and B (which represent the high-value areas of the two strong NPF regions) from 10:00 to 12:00, it was found that the simulated CN10 across the stronger NPF zone were approximately 3–4 times larger than those observed over most of the weaker NPF zones. However, the simulation also showed that there was no time lag for the occurrence of NPF, whether it was at the priority nucleation height of approximately 1300 or at the ground over the NCP, as shown in Fig. 8a.
Similar to the event on 1 July, NPF also occurred widely over the NCP on 3 July. However, the stronger NPF zone was situated far from the observation site (refer to Fig. S9 in the Supplement). On 6 July, NPF occurred over most parts of the NCP, as shown in Fig. S10 in the Supplement. However, the areas of NPF occurrence were noticeably smaller compared to those on 1 and 3 July, which could explain the shorter duration of NPF observed on 6 July. Furthermore, the stronger NPF zone was located north of the observation site, and the strong northeast wind blew the new particle signal away from the observation site in the period.
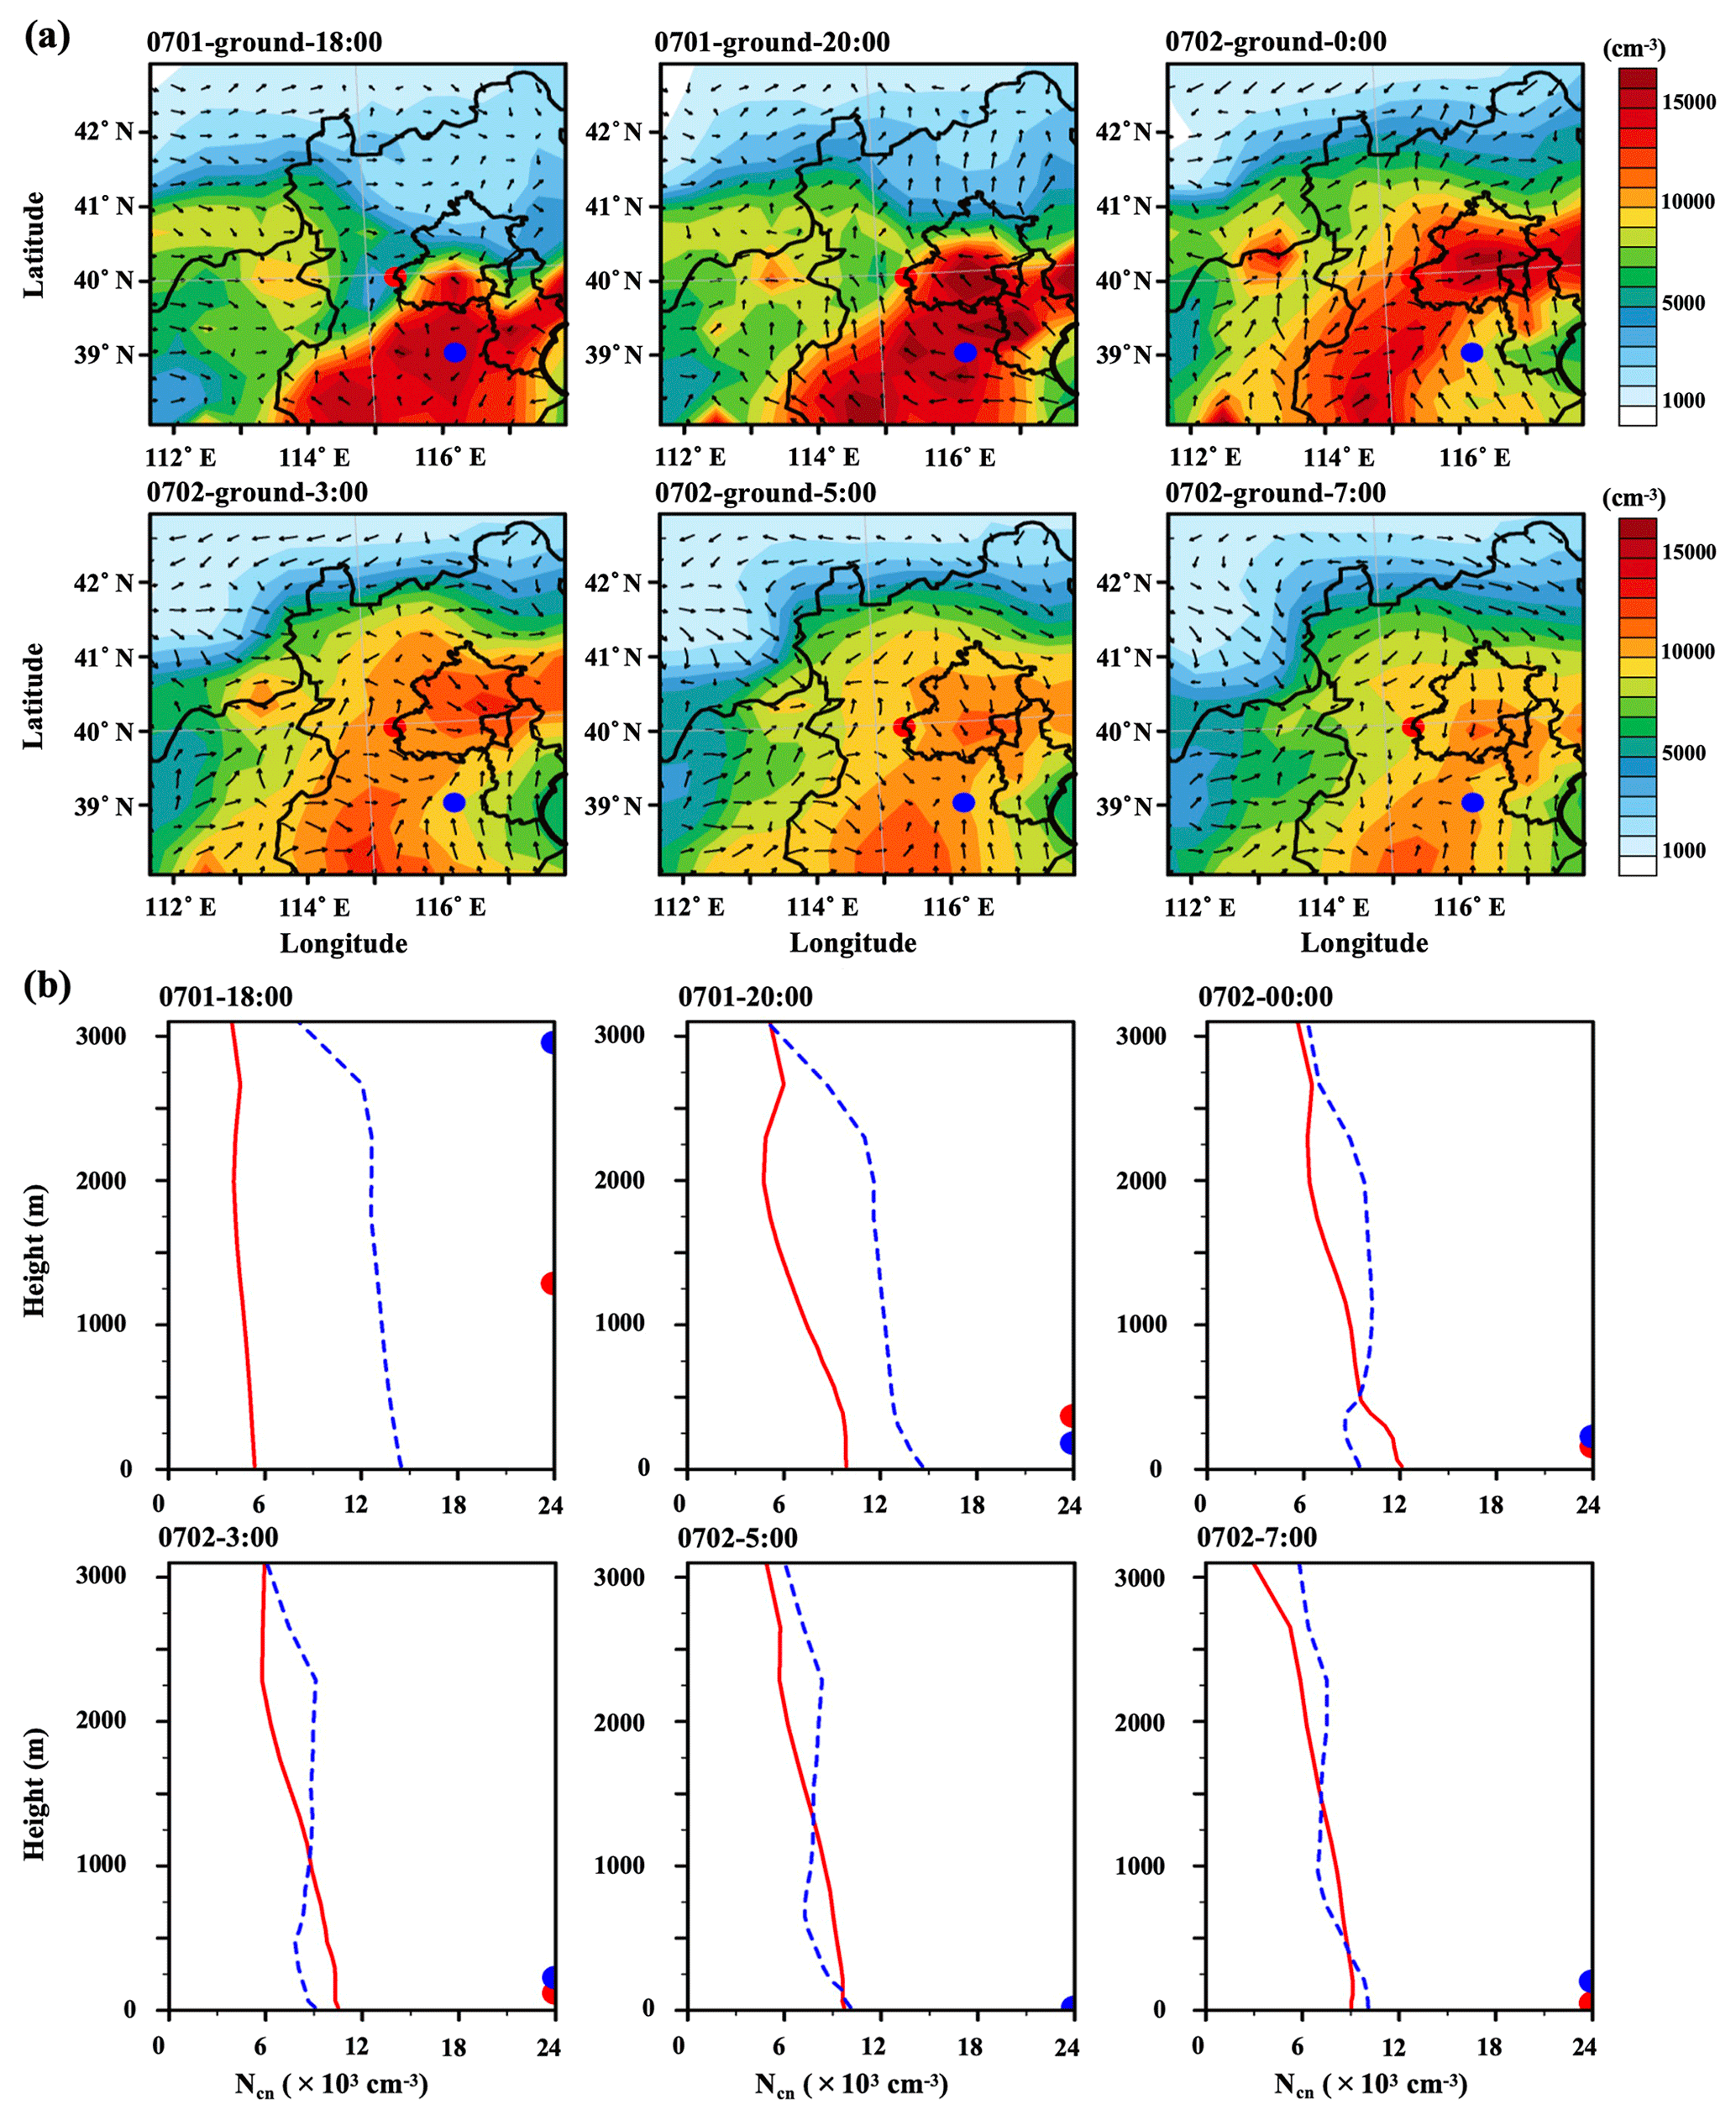
Figure 9Horizontal distribution of CN40–250 on the ground (a, the upper row) and vertical profiles of CN40–250 over the observational site (red solid line) and point A (blue dashed line) from 18:00 on 1 July to 07:00 on 2 July (b, the Y-axis coordinate is the height above the ground; the red and blue solid dots represent the height of the PBL over the observational site and point A, and the PBL values exceeding 3000 are not shown in figure).
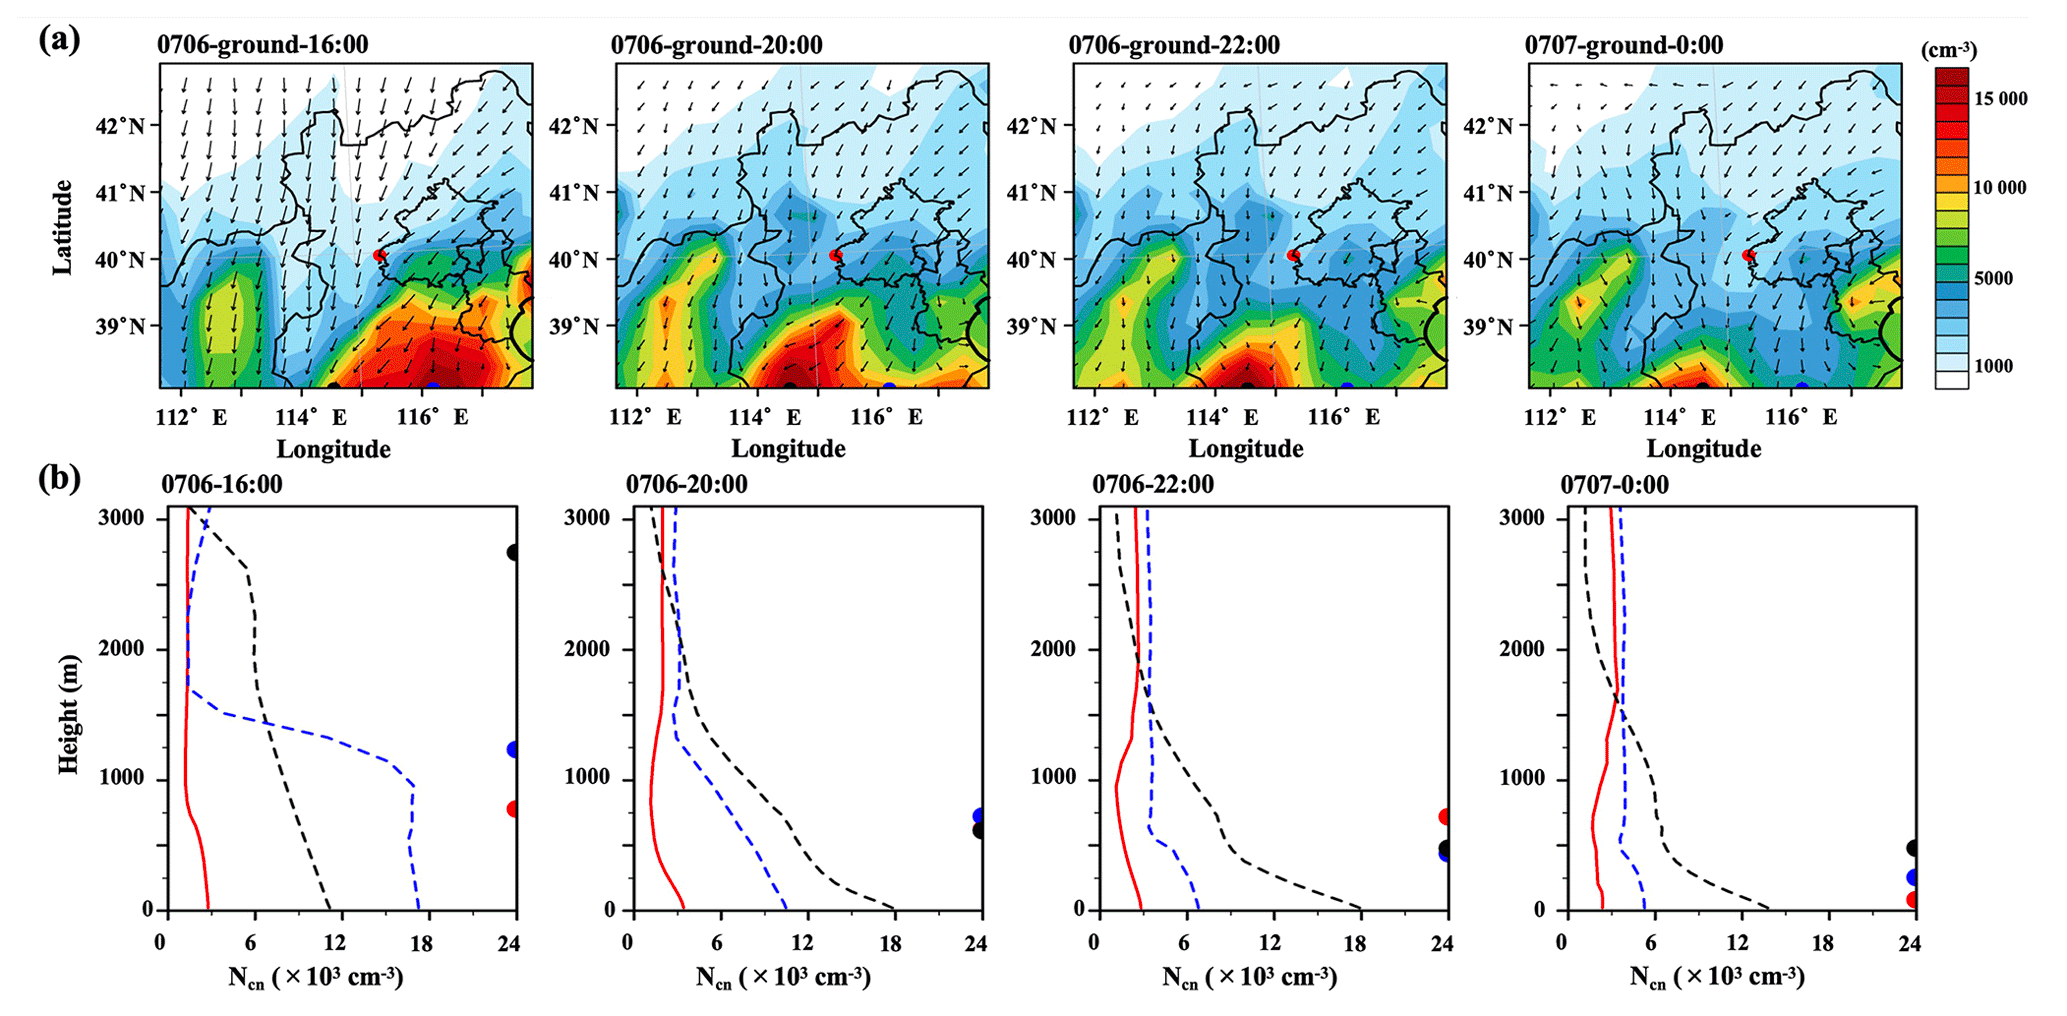
Figure 10Horizontal distributions of CN40–250 on the ground (a) and vertical profile of CN40–250 in the observation site (red solid line), point A (blue dashed line), and point B (black dashed line) in the NPF event occurred on 6 July from 16:00 on 6 July to 00:00 on 7 July (b, the Y-axis coordinate is the height above the ground; the red, blue, and black solid dots represent the height of the PBL at the observation site, point A, and point B, and the PBL values exceeding 3000 are not shown in the figure).
3.5 What happened for grown new particles after the particles disappear from observations?
The total number concentration of particles with sizes between 40 and 250 nm (CN40–250) was used to characterize new particles that grew too large to observe. Figure 9a–b depict the horizontal distribution of CN40–250 at ground level from 18:00 on 1 July to 07:00 on 2 July and the corresponding vertical profiles of CN40–250 over the observation zone and two stronger NPF zones. The simulated wind direction over the observation zone changed from northwest to southwest at 18:00 on 1 July, coinciding with the decrease in observed new particle concentrations (as shown in Figs. 4a and 9a), due to weaker NPF events in the southwest direction. At that time, strong plumes were predicted in the southwest direction over a large area. By 24:00 on 1 July, the modeling results indicated that these plumes had approached the observation zone. This intrusion likely led to an increase in both simulated and observed CN40–250 from 24:00 on 1 July to 04:00 on 2 July (as shown in Fig. 4a), with the plume particle concentration eventually overwhelming the new particle concentration. The modeling results suggested that the new particles were mostly moved out of the observation zone. Consequently, the question of whether grown new particles can experience additional growth to become CCN was replaced by a new question: whether < 20–50 nm preexisting particles, mainly composed of organics, can grow to become CCN. In this study, preexisting particle growth only occurred on 5 July, as presented in the companion paper. Unfortunately, the model poorly reproduced the observations on 5 July. However, the occurrence frequency of preexisting particle growth was much less than that of NPF events on the basis of observations in this study alone.
Similar to what occurred on 1 July, the new particle concentration was also significantly diluted to a low level, and by 3 July, the new particles had vanished over the observation zone (see Fig. S11 in the Supplement). However, this was not the case on 6 July, as demonstrated in Fig. 10a and b. On that day, the strong northeast wind carried the new particles out of the observation zone, rather than diluting them to normal ambient levels prior to the event. It is still expected that the new particle concentrations will eventually be diluted to the ambient concentrations. Nevertheless, the model results need to be confirmed with Lagrangian observations that track moving air masses.
To quantitatively understand the 3-D evolution of NPF events and impacts on CCN, we used a 20-bin WRF-Chem model to simulate NPF events in the NCP during a 3 week observational period in the summer of 2019. The model was able to reproduce the observations during 29 June–6 July, which was characterized by a high frequency of NPF occurrence. Specifically, the model reproduced CN10–40, Nccn at 0.4 % SS, mass concentrations of PM2.5, mass concentrations of in PM1.0 and TSP, ORG and in PM1.0, and other variables, with the performance meeting the benchmark. However, the model consistently overestimated daytime H2SO4 vapor by approximately 1 order of magnitude and frequently overestimated nighttime formation of NH4NO3. These overestimations led to an overestimation of the κ values of both grown new particles and preexisting particles to some extent. The model also poorly reproduced most of the observed variables during the remaining 2 weeks, and we have yet to explain this poor simulation. Our modeling results indicated that the growth of newly formed particles from 10 nm to larger sizes was overwhelmingly determined by SOA, which is consistent with previous modeling studies in the literature. This implies that the critical challenge in modeling contributions of NPF events to CCN may be accurately reproducing those inorganic species, accounting for a small but appreciable fraction, rather than SOA.
The results of 3-D simulations of NPF events over the NCP, based on case studies, showed that NPF events occurred preferentially at the top of the PBL and then expanded vertically. In the horizontal direction, the NPF was predicted in a large regional scale with the stronger NPF zone located northeast of the observation site. The modeling results also suggested that SOA played a dominant role in controlling the growth of newly formed particles in the PBL. However, inorganic species likely replaced SOA as the dominant driver above the PBL. Additional observations are needed to confirm these findings.
The model performed to meet the goal values in reproducing CCN at SS = 0.2 % on non-NPF days, but it clearly overestimated CCN at SS = 0.4 % on those days. Conversely, the model performed to meet the benchmark in reproducing CCN at SS = 0.4 % on NPF days, but it noticeably underestimated CCN at SS = 0.2 %. This presents a significant challenge that must be urgently addressed, as it has a major impact on the accuracy of predicted contributions of NPF events to CCN budgets. Additionally, the disappearance of new particles from observations may simply be due to dilution effects or the movement of the particles elsewhere. In such cases, the issue of how newly formed particles grow into CCN becomes another important question: specifically, how do preexisting particles with an organic-dominant composition of < 20–50 nm grow into CCN?
The model poorly predicted the PNCs and CCN during the periods with low occurrence frequency of NPF events because of lack of local particle number size distributions (PNSDs) from various sources in China. The weakness may restrict the model application on various aspects and a localized PNSDs adaptor in China is urgently needed to be developed.
The data of this paper are available upon contact with the authors: Yang Gao (yanggao@ouc.edu.cn), Xiaohong Yao (xhyao@ouc.edu.cn), and Ming Chu (cm5594@stu.ouc.edu.cn).
The supplement related to this article is available online at: https://doi.org/10.5194/acp-24-6769-2024-supplement.
YG and XY designed the experiments. MC conducted the experiments. MC, XW, and SH analyzed the data, and MC wrote the paper. YG, XY, HG, YZ, BC, NM, JH, and YS provided advice on data processing. YG and XY revised the original draft of the paper. All authors contributed to editing and improving the paper.
The contact author has declared that none of the authors has any competing interests.
Publisher's note: Copernicus Publications remains neutral with regard to jurisdictional claims made in the text, published maps, institutional affiliations, or any other geographical representation in this paper. While Copernicus Publications makes every effort to include appropriate place names, the final responsibility lies with the authors.
This research was supported by the National Natural Science Foundation of China (grant no. 42276036) and Hainan Provincial Natural Science Foundation of China (grant no. 422MS098). The simulations were conducted on Marine Big Data Center of the Institute for Advanced Ocean Study of the Ocean University of China. ChatGPT was used to polish the language paragraph-by-paragraph.
This research has been supported by the National Natural Science Foundation of China (grant no. 42276036) and the Hainan Provincial Natural Science Foundation of China (grant no. 422MS098).
This paper was edited by Barbara Ervens and reviewed by James Hudson and three anonymous referees.
Alonso-Blanco, E., Gómez-Moreno, F. J., Núñez, L., Pujadas, M., Cusack, M., and Artíñano, B.: Aerosol particle shrinkage event phenomenology in a South European suburban area during 2009–2015, Atmos. Environ., 160, 154–164, https://doi.org/10.1016/j.atmosenv.2017.04.013, 2017.
Bianchi, F., Tröstl, J., Junninen, H., Frege, C., Henne, S., Hoyle, C. R., Molteni, U., Herrmann, E., Adamov, A., Bukowiecki, N., Chen, X., Duplissy, J., Gysel, M., Hutterli, M., Kangasluoma, J., Kontkanen, J., Kürten, A., Manninen, H. E., Münch, S., Peräkylä, O., Petäjä, T., Rondo, L., Williamson, C., Weingartner, E., Curtius, J., Worsnop, D. R., Kulmala, M., Dommen, J., and Baltensperger, U.: New particle formation in the free troposphere: A question of chemistry and timing, Science, 352, 1109–1112, https://doi.org/10.1126/science.aad5456, 2016.
Bzdek, B. R. and Johnston, M. V.: New particle formation and growth in the troposphere, Anal. Chem., 82, 7871–7878, https://doi.org/10.1021/ac100856j, 2010.
Chen, X., Wang, Z., Li, J., and Yu, F.: Development of a Regional Chemical Transport Model with Size-Resolved Aerosol Microphysics and Its Application on Aerosol Number Concentration Simulation over China, Sola, 10, 83–87, https://doi.org/10.2151/sola.2014-017, 2014.
Chen, X., Wang, Z., Li, J., Chen, H., Hu, M., Yang, W., Wang, Z., Ge, B., and Wang, D.: Explaining the spatiotemporal variation of fine particle number concentrations over Beijing and surrounding areas in an air quality model with aerosol microphysics, Environ. Pollut., 231, 1302–1313, https://doi.org/10.1016/j.envpol.2017.08.103, 2017.
Chen, X., Yang, W., Wang, Z., Li, J., Hu, M., An, J., Wu, Q., Wang, Z., Chen, H., Wei, Y., Du, H., and Wang, D.: Improving new particle formation simulation by coupling a volatility-basis set (VBS) organic aerosol module in NAQPMS+APM, Atmos. Environ., 204, 1–11, https://doi.org/10.1016/j.atmosenv.2019.01.053, 2019.
Chen, Z., Chen, D., Wen, W., Zhuang, Y., Kwan, M.-P., Chen, B., Zhao, B., Yang, L., Gao, B., Li, R., and Xu, B.: Evaluating the “2+26” regional strategy for air quality improvement during two air pollution alerts in Beijing: variations in PM2.5 concentrations, source apportionment, and the relative contribution of local emission and regional transport, Atmos. Chem. Phys., 19, 6879–6891, https://doi.org/10.5194/acp-19-6879-2019, 2019.
Chow, J. C., Watson, J. G., Chen, L.-W. A., Rice, J., and Frank, N. H.: Quantification of PM2.5 organic carbon sampling artifacts in US networks, Atmos. Chem. Phys., 10, 5223–5239, https://doi.org/10.5194/acp-10-5223-2010, 2010.
Chu, B., Kerminen, V.-M., Bianchi, F., Yan, C., Petäjä, T., and Kulmala, M.: Atmospheric new particle formation in China, Atmos. Chem. Phys., 19, 115–138, https://doi.org/10.5194/acp-19-115-2019, 2019.
Chu, B., Dada, L., Liu, Y., Yao, L., Wang, Y., Du, W., Cai, J., Dallenbach, K. R., Chen, X., Simonen, P., Zhou, Y., Deng, C., Fu, Y., Yin, R., Li, H., He, X. C., Feng, Z., Yan, C., Kangasluoma, J., Bianchi, F., Jiang, J., Kujansuu, J., Kerminen, V. M., Petaja, T., He, H., and Kulmala, M.: Particle growth with photochemical age from new particle formation to haze in the winter of Beijing, China, Sci. Total. Environ., 753, 142207, https://doi.org/10.1016/j.scitotenv.2020.142207, 2021.
Crippa, P. and Pryor, S. C.: Spatial and temporal scales of new particle formation events in eastern North America, Atmos. Environ., 75, 257–264, https://doi.org/10.1016/j.atmosenv.2013.04.051, 2013.
Cui, Y. Y., Hodzic, A., Smith, J. N., Ortega, J., Brioude, J., Matsui, H., Levin, E. J. T., Turnipseed, A., Winkler, P., and de Foy, B.: Modeling ultrafine particle growth at a pine forest site influenced by anthropogenic pollution during BEACHON-RoMBAS 2011, Atmos. Chem. Phys., 14, 11011–11029, https://doi.org/10.5194/acp-14-11011-2014, 2014.
Dai, L., Wang, H., Zhou, L., An, J., Tang, L., Lu, C., Yan, W., Liu, R., Kong, S., Chen, M., Lee, S., and Yu, H.: Regional and local new particle formation events observed in the Yangtze River Delta region, China, J. Geophys. Res., 122, 2389–2402, https://doi.org/10.1002/2016JD026030, 2017.
Dong, C., Matsui, H., Spak, S., Kalafut-Pettibone, A., and Stanier, C.: Impacts of New Particle Formation on Short-term Meteorology and Air Quality as Determined by the NPF-explicit WRF-Chem in the Midwestern United States, Aerosol Air Qual. Res., 19, 204–220, https://doi.org/10.4209/aaqr.2018.05.0163, 2019.
Dusek, U., Frank, G. P., Hildebrandt, L., Curtius, J., Schneider, J., Walter, S., Chand, D., Drewnick, F., Hings, S., Jung, D., Borrmann, S., and Andreae, M. O.: Size Matters More Than Chemistry for Cloud-Nucleating Ability of Aerosol Particles, Science, 312, 1375–1378, https://doi.org/10.1126/science.1125261, 2006.
Fast, J. D., Gustafson Jr, W. I., Easter, R. C., Zaveri, R. A., Barnard, J. C., Chapman, E. G., Grell, G. A., and Peckham, S. E.: Evolution of ozone, particulates, and aerosol direct radiative forcing in the vicinity of Houston using a fully coupled meteorology–chemistry–aerosol model, J. Geophys. Res., 111, D21305, https://doi.org/10.1029/2005JD006721, 2006.
Gordon, H., Kirkby, J., Baltensperger, U., Bianchi, F., Breitenlechner, M., Curtius, J., Dias, A., Dommen, J., Donahue, N. M., Dunne, E. M., Duplissy, J., Ehrhart, S., Flagan, R. C., Frege, C., Fuchs, C., Hansel, A., Hoyle, C. R., Kulmala, M., Kürten, A., Lehtipalo, K., Makhmutov, V., Molteni, U., Rissanen, M. P., Stozkhov, Y., Tröstl, J., Tsagkogeorgas, G., Wagner, R., Williamson, C., Wimmer, D., Winkler, P. M., Yan, C., and Carslaw, K. S.: Causes and importance of new particle formation in the present-day and preindustrial atmospheres, J. Geophys. Res., 122, 8739–8760, https://doi.org/10.1002/2017JD026844, 2017.
Grell, G. A., Peckham, S. E., Schmitz, R., McKeen, S. A., Frost, G., Skamarock, W. C., and Eder, B.: Fully coupled “online” chemistry within the WRF model, Atmos. Environ., 39, 6957–6975, https://doi.org/10.1016/j.atmosenv.2005.04.027, 2005.
Huang, X., Zhou, L., Ding, A., Qi, X., Nie, W., Wang, M., Chi, X., Petäjä, T., Kerminen, V.-M., Roldin, P., Rusanen, A., Kulmala, M., and Boy, M.: Comprehensive modelling study on observed new particle formation at the SORPES station in Nanjing, China, Atmos. Chem. Phys., 16, 2477–2492, https://doi.org/10.5194/acp-16-2477-2016, 2016.
Hudson, J. G.: Variability of the relationship between particle size and cloud-nucleating ability, Geophys. Res. Lett., 34, L08801, https://doi.org/10.1029/2006GL028850, 2007.
Hussein, T., Junninen, H., Tunved, P., Kristensson, A., Dal Maso, M., Riipinen, I., Aalto, P. P., Hansson, H.-C., Swietlicki, E., and Kulmala, M.: Time span and spatial scale of regional new particle formation events over Finland and Southern Sweden, Atmos. Chem. Phys., 9, 4699–4716, https://doi.org/10.5194/acp-9-4699-2009, 2009.
Jiang, L. and Bai, L.: Spatio-temporal characteristics of urban air pollutions and their causal relationships: Evidence from Beijing and its neighboring cities, Sci. Rep.-UK, 8, 1279, https://doi.org/10.1038/s41598-017-18107-1, 2018.
Kamra, A. K., Victor, J. N., Siingh, D., Singh, A., and Dharmaraj, T.: Changes in the new particle formation and shrinkage events of the atmospheric ions during the COVID-19 lockdown, Urban. Clim., 44, 101214, https://doi.org/10.1016/j.uclim.2022.101214, 2022.
Kerminen, V. M., Chen, X. M., Vakkari, V., Petaja, T., Kulmala, M., and Bianchi, F.: Atmospheric new particle formation and growth: review of field observations, Environ. Res. Lett., 13, 103003, https://doi.org/10.1088/1748-9326/aadf3c, 2018.
Kim, Y., Kim, S.-W., Yoon, S.-C., Park, J.-S., Lim, J.-H., Hong, J., Lim, H.-C., Ryu, J., Lee, C.-K., and Heo, B.-H.: Characteristics of formation and growth of atmospheric nanoparticles observed at four regional background sites in Korea, Atmos. Res., 168, 80–91, https://doi.org/10.1016/j.atmosres.2015.08.020, 2016.
Kulmala, M., Vehkamäki, H., Petäjä, T., and Dal Maso, M.: Formation and growth rates of ultrafine atmospheric particles: a review of observations, J. Aerosol. Sci., 35, 143–176, https://doi.org/10.1016/j.jaerosci.2003.10.003, 2004.
Kulmala, M., Cai, R., Stolzenburg, D., Zhou, Y., Dada, L., Guo, Y., Yan, C., Petäjä, T., Jiang, J., and Kerminen, V.-M.: The contribution of new particle formation and subsequent growth to haze formation, Environ. Sci.: Atmos., 2, 352–361, https://doi.org/10.1039/D1EA00096A, 2022.
Lai, S. Y., Hai, S. F., Gao, Y., Wang, Y. H., Sheng, L. F., Lupascu, A., Ding, A. J., Nie, W., Qi, X. M., Huang, X., Chi, X. G., Zhao, C., Zhao, B., Shrivastava, M., Fast, J. D., Yao, X. H., and Gao, H. W.: The striking effect of vertical mixing in the planetary boundary layer on new particle formation in the Yangtze River Delta, Sci. Total. Environ., 829, 154607, https://doi.org/10.1016/j.scitotenv.2022.154607, 2022.
Lee, S.-H., Gordon, H., Yu, H., Lehtipalo, K., Haley, R., Li, Y., and Zhang, R.: New particle formation in the atmosphere: From molecular clusters to global climate, J. Geophys. Res.-Atmos., 124, 7098–7146, https://doi.org/10.1029/2018JD029356, 2019.
Li, S., Feng, K., and Li, M.: Identifying the main contributors of air pollution in Beijing, J. Clean. Prod., 163, S359-S365, https://doi.org/10.1016/j.jclepro.2015.10.127, 2017.
Liu, X., Chang, M., Zhang, J., Wang, J., Gao, H., Gao, Y., and Yao, X.: Rethinking the causes of extreme heavy winter PM2.5 pollution events in northern China, Sci. Total. Environ., 794, 148637, https://doi.org/10.1016/j.scitotenv.2021.148637, 2021.
Lu, Y., Yan, C., Fu, Y., Chen, Y., Liu, Y., Yang, G., Wang, Y., Bianchi, F., Chu, B., Zhou, Y., Yin, R., Baalbaki, R., Garmash, O., Deng, C., Wang, W., Liu, Y., Petäjä, T., Kerminen, V.-M., Jiang, J., Kulmala, M., and Wang, L.: A proxy for atmospheric daytime gaseous sulfuric acid concentration in urban Beijing, Atmos. Chem. Phys., 19, 1971–1983, https://doi.org/10.5194/acp-19-1971-2019, 2019.
Lupascu, A., Easter, R., Zaveri, R., Shrivastava, M., Pekour, M., Tomlinson, J., Yang, Q., Matsui, H., Hodzic, A., Zhang, Q., and Fast, J. D.: Modeling particle nucleation and growth over northern California during the 2010 CARES campaign, Atmos. Chem. Phys., 15, 12283–12313, https://doi.org/10.5194/acp-15-12283-2015, 2015.
Ma, L., Zhu, Y., Zheng, M., Sun, Y., Huang, L., Liu, X., Gao, Y., Shen, Y., Gao, H., and Yao, X.: Investigating three patterns of new particles growing to the size of cloud condensation nuclei in Beijing's urban atmosphere, Atmos. Chem. Phys., 21, 183–200, https://doi.org/10.5194/acp-21-183-2021, 2021.
Ma, M., Gao, Y., Wang, Y., Zhang, S., Leung, L. R., Liu, C., Wang, S., Zhao, B., Chang, X., Su, H., Zhang, T., Sheng, L., Yao, X., and Gao, H.: Substantial ozone enhancement over the North China Plain from increased biogenic emissions due to heat waves and land cover in summer 2017, Atmos. Chem. Phys., 19, 12195–12207, https://doi.org/10.5194/acp-19-12195-2019, 2019.
Man, H., Zhu, Y., Ji, F., Yao, X., Lau, N. T., Li, Y., Lee, B. P., and Chan, C. K.: Comparison of Daytime and Nighttime New Particle Growth at the HKUST Supersite in Hong Kong, Environ. Sci. Technol., 49, 7170–7178, https://doi.org/10.1021/acs.est.5b02143, 2015.
Matsui, H., Koike, M., Kondo, Y., Takegawa, N., Wiedensohler, A., Fast, J. D., and Zaveri, R. A.: Impact of new particle formation on the concentrations of aerosols and cloud condensation nuclei around Beijing, J. Geophys. Res., 116, D19208, https://doi.org/10.1029/2011jd016025, 2011.
Matsui, H., Koike, M., Kondo, Y., Takegawa, N., Kita, K., Miyazaki, Y., Hu, M., Chang, S. Y., Blake, D. R., Fast, J. D., Zaveri, R. A., Streets, D. G., Zhang, Q., and Zhu, T.: Spatial and temporal variations of aerosols around Beijing in summer 2006: Model evaluation and source apportionment, J. Geophys. Res., 114, D00G13, https://doi.org/10.1029/2008jd010906, 2009.
Matsui, H., Koike, M., Takegawa, N., Kondo, Y., Takami, A., Takamura, T., Yoon, S., Kim, S. W., Lim, H. C., and Fast, J. D.: Spatial and temporal variations of new particle formation in East Asia using an NPF-explicit WRF-chem model: North-south contrast in new particle formation frequency, J. Geophys. Res., 118, 11647–11663, https://doi.org/10.1002/jgrd.50821, 2013.
Mckeen, S., Chung, S. H., Wilczak, J., Grell, G., Djalalova, I., Peckham, S., Gong, W., Bouchet, V., Moffet, R., and Tang, Y.: Evaluation of several PM2.5 forecast models using data collected during the ICARTT/NEAQS 2004 field study, J. Geophys. Res., 112, D10S20, https://doi.org/10.1029/2006JD007608, 2007.
Merikanto, J., Spracklen, D. V., Mann, G. W., Pickering, S. J., and Carslaw, K. S.: Impact of nucleation on global CCN, Atmos. Chem. Phys., 9, 8601–8616, https://doi.org/10.5194/acp-9-8601-2009, 2009.
Metzger, A., Verheggen, B., Dommen, J., Duplissy, J., Prevot, A. S. H., Weingartner, E., Riipinen, I., Kulmala, M., Spracklen, D. V., Carslaw, K. S., and Baltensperger, U.: Evidence for the role of organics in aerosol particle formation under atmospheric conditions, P. Natl. Acad. Sci. USA, 107, 6646–6651, https://doi.org/10.1073/pnas.0911330107, 2010.
Pikridas, M., Sciare, J., Freutel, F., Crumeyrolle, S., von der Weiden-Reinmüller, S.-L., Borbon, A., Schwarzenboeck, A., Merkel, M., Crippa, M., Kostenidou, E., Psichoudaki, M., Hildebrandt, L., Engelhart, G. J., Petäjä, T., Prévôt, A. S. H., Drewnick, F., Baltensperger, U., Wiedensohler, A., Kulmala, M., Beekmann, M., and Pandis, S. N.: In situ formation and spatial variability of particle number concentration in a European megacity, Atmos. Chem. Phys., 15, 10219–10237, https://doi.org/10.5194/acp-15-10219-2015, 2015.
Qi, X., Ding, A., Nie, W., Chi, X., Huang, X., Xu, Z., Wang, T., Wang, Z., Wang, J., Sun, P., Zhang, Q., Huo, J., Wang, D., Bian, Q., Zhou, L., Zhang, Q., Ning, Z., Fei, D., Xiu, G., and Fu, Q.: Direct measurement of new particle formation based on tethered airship around the top of the planetary boundary layer in eastern China, Atmos. Environ., 209, 92–101, https://doi.org/10.1016/j.atmosenv.2019.04.024, 2019.
Quan, J., Liu, Y., Liu, Q., Jia, X., Li, X., Gao, Y., Ding, D., Li, J., and Wang, Z.: Anthropogenic pollution elevates the peak height of new particle formation from planetary boundary layer to lower free troposphere, Geophys. Res. Lett., 44, 7537–7543, https://doi.org/10.1002/2017GL074553, 2017.
Riccobono, F., Schobesberger, S., Scott, C. E., Dommen, J., Ortega, I. K., Rondo, L., Almeida, J., Amorim, A., Bianchi, F., Breitenlechner, M., David, A., Downard, A., Dunne, E. M., Duplissy, J., Ehrhart, S., Flagan, R. C., Franchin, A., Hansel, A., Junninen, H., Kajos, M., Keskinen, H., Kupc, A., Kürten, A., Kvashin, A. N., Laaksonen, A., Lehtipalo, K., Makhmutov, V., Mathot, S., Nieminen, T., Onnela, A., Petäjä, T., Praplan, A. P., Santos, F. D., Schallhart, S., Seinfeld, J. H., Sipilä, M., Spracklen, D. V., Stozhkov, Y., Stratmann, F., Tomé, A., Tsagkogeorgas, G., Vaattovaara, P., Viisanen, Y., Vrtala, A., Wagner, P. E., Weingartner, E., Wex, H., Wimmer, D., Carslaw, K. S., Curtius, J., Donahue, N. M., Kirkby, J., Kulmala, M., Worsnop, D. R., and Baltensperger, U.: Oxidation Products of Biogenic Emissions Contribute to Nucleation of Atmospheric Particles, Science, 344, 717–721, https://doi.org/10.1126/science.1243527, 2014.
Riipinen, I., Sihto, S.-L., Kulmala, M., Arnold, F., Dal Maso, M., Birmili, W., Kerminen, V.-M., Laaksonen, A., and Lehtinen, K. E. J.: Connections Between Ambient Sulphuric Acid and New Particle Formation in Hyytiälä and Heideleberg, in: Nucleation and Atmospheric Aerosols, edited by: O'Dowd, C. D. and Wagner, Paul E., Springer, Dordrecht, 2007, 1033–1037, https://doi.org/10.1007/978-1-4020-6475-3_205, 2007.
Sanchez, K. J., Chen, C.-L., Russell, L. M., Betha, R., Liu, J., Price, D. J., Massoli, P., Ziemba, L. D., Crosbie, E. C., Moore, R. H., Müller, M., Schiller, S. A., Wisthaler, A., Lee, A. K. Y., Quinn, P. K., Bates, T. S., Porter, J., Bell, T. G., Saltzman, E. S., Vaillancourt, R. D., and Behrenfeld, M. J.: Substantial Seasonal Contribution of Observed Biogenic Sulfate Particles to Cloud Condensation Nuclei, Sci. Rep.-UK, 8, 3235, https://doi.org/10.1038/s41598-018-21590-9, 2018.
Schobesberger, S., Junninen, H., Bianchi, F., Lönn, G., Ehn, M., Lehtipalo, K., Dommen, J., Ehrhart, S., Ortega, I. K., Franchin, A., Nieminen, T., Riccobono, F., Hutterli, M., Duplissy, J., Almeida, J., Amorim, A., Breitenlechner, M., Downard, A. J., Dunne, E. M., Flagan, R. C., Kajos, M., Keskinen, H., Kirkby, J., Kupc, A., Kürten, A., Kurtén, T., Laaksonen, A., Mathot, S., Onnela, A., Praplan, A. P., Rondo, L., Santos, F. D., Schallhart, S., Schnitzhofer, R., Sipilä, M., Tomé, A., Tsagkogeorgas, G., Vehkamäki, H., Wimmer, D., Baltensperger, U., Carslaw, K. S., Curtius, J., Hansel, A., Petäjä, T., Kulmala, M., Donahue, N. M., and Worsnop, D. R.: Molecular understanding of atmospheric particle formation from sulfuric acid and large oxidized organic molecules, P. Natl. Acad. Sci. USA, 110, 17223–17228, https://doi.org/10.1073/pnas.1306973110, 2013.
Sellegri, K., Rose, C., Marinoni, A., Lupi, A., Wiedensohler, A., Andrade, M., Bonasoni, P., and Laj, P.: New particle formation: A review of ground-based observations at mountain research stations, Atmosphere-Basel, 10, 493, https://doi.org/10.3390/atmos10090493, 2019.
Shen, X., Sun, J., Kivekäs, N., Kristensson, A., Zhang, X., Zhang, Y., Zhang, L., Fan, R., Qi, X., Ma, Q., and Zhou, H.: Spatial distribution and occurrence probability of regional new particle formation events in eastern China, Atmos. Chem. Phys., 18, 587–599, https://doi.org/10.5194/acp-18-587-2018, 2018.
Shen, Y., Meng, H., Yao, X., Peng, Z., Sun, Y., Zhang, J., Gao, Y., Feng, L., Liu, X., and Gao, H.: Does Ambient Secondary Conversion or the Prolonged Fast Conversion in Combustion Plumes Cause Severe PM2.5 Air Pollution in China?, Atmosphere, 13, 673, https://doi.org/10.3390/atmos13050673, 2022.
Sihto, S.-L., Kulmala, M., Kerminen, V.-M., Dal Maso, M., Petäjä, T., Riipinen, I., Korhonen, H., Arnold, F., Janson, R., Boy, M., Laaksonen, A., and Lehtinen, K. E. J.: Atmospheric sulphuric acid and aerosol formation: implications from atmospheric measurements for nucleation and early growth mechanisms, Atmos. Chem. Phys., 6, 4079–4091, https://doi.org/10.5194/acp-6-4079-2006, 2006.
Skrabalova, L., Zikova, N., and Zdimal, V.: Shrinkage of Newly Formed Particles in an Urban Environment, Aerosol Air Qual. Res., 15, 1313–1324, https://doi.org/10.4209/aaqr.2015.01.0015, 2015.
Spracklen, D. V., Carslaw, K. S., Kulmala, M., Kerminen, V.-M., Sihto, S.-L., Riipinen, I., Merikanto, J., Mann, G. W., Chipperfield, M. P., Wiedensohler, A., Birmili, W., and Lihavainen, H.: Contribution of particle formation to global cloud condensation nuclei concentrations, Geophys. Res. Lett., 35, L06808, https://doi.org/10.1029/2007GL033038, 2008.
Stratmann, F., Siebert, H., Spindler, G., Wehner, B., Althausen, D., Heintzenberg, J., Hellmuth, O., Rinke, R., Schmieder, U., Seidel, C., Tuch, T., Uhrner, U., Wiedensohler, A., Wandinger, U., Wendisch, M., Schell, D., and Stohl, A.: New-particle formation events in a continental boundary layer: first results from the SATURN experiment, Atmos. Chem. Phys., 3, 1445–1459, https://doi.org/10.5194/acp-3-1445-2003, 2003.
Sullivan, R. C., Crippa, P., Matsui, H., Leung, L. R., Zhao, C., Thota, A., and Pryor, S. C.: New particle formation leads to cloud dimming, npj. Clim. Atmos. Sci., 1, 9, https://doi.org/10.1038/s41612-018-0019-7, 2018.
Travis, K. R., Crawford, J. H., Chen, G., Jordan, C. E., Nault, B. A., Kim, H., Jimenez, J. L., Campuzano-Jost, P., Dibb, J. E., Woo, J.-H., Kim, Y., Zhai, S., Wang, X., McDuffie, E. E., Luo, G., Yu, F., Kim, S., Simpson, I. J., Blake, D. R., Chang, L., and Kim, M. J.: Limitations in representation of physical processes prevent successful simulation of PM2.5 during KORUS-AQ, Atmos. Chem. Phys., 22, 7933–7958, https://doi.org/10.5194/acp-22-7933-2022, 2022.
Tröstl, J., Chuang, W. K., Gordon, H., Heinritzi, M., Yan, C., Molteni, U., Ahlm, L., Frege, C., Bianchi, F., Wagner, R., Simon, M., Lehtipalo, K., Williamson, C., Craven, J. S., Duplissy, J., Adamov, A., Almeida, J., Bernhammer, A.-K., Breitenlechner, M., Brilke, S., Dias, A., Ehrhart, S., Flagan, R. C., Franchin, A., Fuchs, C., Guida, R., Gysel, M., Hansel, A., Hoyle, C. R., Jokinen, T., Junninen, H., Kangasluoma, J., Keskinen, H., Kim, J., Krapf, M., Kürten, A., Laaksonen, A., Lawler, M., Leiminger, M., Mathot, S., Möhler, O., Nieminen, T., Onnela, A., Petäjä, T., Piel, F. M., Miettinen, P., Rissanen, M. P., Rondo, L., Sarnela, N., Schobesberger, S., Sengupta, K., Sipilä, M., Smith, J. N., Steiner, G., Tomè, A., Virtanen, A., Wagner, A. C., Weingartner, E., Wimmer, D., Winkler, P. M., Ye, P., Carslaw, K. S., Curtius, J., Dommen, J., Kirkby, J., Kulmala, M., Riipinen, I., Worsnop, D. R., Donahue, N. M., and Baltensperger, U.: The role of low-volatility organic compounds in initial particle growth in the atmosphere, Nature, 533, 527–531, https://doi.org/10.1038/nature18271, 2016.
US EPA: Guidance on the Use of Models and Other Analyses for Demonstrating Attainment of Air Quality Goals for Ozone, PM2.5, and Regional Haze, Vol EPA-454/B-07e002, U. S. Environmental Protection Agency, Research Triangle Park, NC, 2007.
Wang, Z. B., Hu, M., Yue, D. L., Zheng, J., Zhang, R. Y., Wiedensohler, A., Wu, Z. J., Nieminen, T., and Boy, M.: Evaluation on the role of sulfuric acid in the mechanisms of new particle formation for Beijing case, Atmos. Chem. Phys., 11, 12663–12671, https://doi.org/10.5194/acp-11-12663-2011, 2011.
Wang, Z. B., Hu, M., Pei, X. Y., Zhang, R. Y., and Paasonen, P.: Connection of organics to atmospheric new particle formation and growth at an urban site of Beijing, Atmos. Environ., 103, 7–17, https://doi.org/10.1016/j.atmosenv.2014.11.069, 2015.
Wehner, B., Wiedensohler, A., Tuch, T. M., Wu, Z. J., Hu, M., Slanina, J., and Kiang, C. S.: Variability of the aerosol number size distribution in Beijing, China: New particle formation, dust storms, and high continental background, Geophys. Res. Lett., 31, L22108, https://doi.org/10.1029/2004GL021596, 2004.
Wehner, B., Siebert, H., Stratmann, F., Tuch, T., Wiedensohler, A., Petaja, T., Dal Maso, M., and Kulmala, M.: Horizontal homogeneity and vertical extent of new particle formation events, Tellus B, 59, 362–371, https://doi.org/10.1111/j.1600-0889.2007.00260.x, 2007.
Wehner, B., Siebert, H., Ansmann, A., Ditas, F., Seifert, P., Stratmann, F., Wiedensohler, A., Apituley, A., Shaw, R. A., Manninen, H. E., and Kulmala, M.: Observations of turbulence-induced new particle formation in the residual layer, Atmos. Chem. Phys., 10, 4319–4330, https://doi.org/10.5194/acp-10-4319-2010, 2010.
Wei, X., Shen, Y., Yu, X.-Y., Gao, Y., Gao, H., Chu, M., Zhu, Y., and Yao, X.: Investigating the contribution of grown new particles to cloud condensation nuclei with largely varying preexisting particles – Part 1: Observational data analysis, Atmos. Chem. Phys., 23, 15325–15350, https://doi.org/10.5194/acp-23-15325-2023, 2023.
Wen, Z., Wang, C., Li, Q., Xu, W., Lu, L., Li, X., Tang, A., Collett, J. L., and Liu, X.: Winter air quality improvement in Beijing by clean air actions from 2014 to 2018, Atmos. Res., 259, 105674, https://doi.org/10.1016/j.atmosres.2021.105674, 2021.
Williamson, C. J., Kupc, A., Axisa, D., Bui, T., and Yu, P.: A large source of cloud condensation nuclei from new particle formation in the tropics, Nature, 574, 399, https://doi.org/10.1038/s41586-019-1638-9, 2019.
Wu, Z., Hu, M., Liu, S., Wehner, B., Bauer, S., Ma ßling, A., Wiedensohler, A., Petäjä, T., Dal Maso, M., and Kulmala, M.: New particle formation in Beijing, China: Statistical analysis of a 1-year data set, J. Geophys. Res., 112, D09209, https://doi.org/10.1029/2006JD007406, 2007.
Yang, S., Li, X., Song, M., Liu, Y., Yu, X., Chen, S., Lu, S., Wang, W., Yang, Y., Zeng, L., and Zhang, Y.: Characteristics and sources of volatile organic compounds during pollution episodes and clean periods in the Beijing-Tianjin-Hebei region, Sci. Total. Environ., 799, 149491, https://doi.org/10.1016/j.scitotenv.2021.149491, 2021.
Yao, X., Chan, C. K., Fang, M., Cadle, S., Chan, T., Mulawa, P., He, K., and Ye, B.: The water-soluble ionic composition of PM2.5 in Shanghai and Beijing, China, Atmos. Environ., 36, 4223–4234, https://doi.org/10.1016/S1352-2310(02)00342-4, 2002.
Yao, X., Lau, N. T., Fang, M., and Chan, C. K.: Real-Time Observation of the Transformation of Ultrafine Atmospheric Particle Modes, Aerosol. Sci. Tech., 39, 831–841, https://doi.org/10.1080/02786820500295248, 2005.
Yao, X., Choi, M. Y., Lau, N. T., Lau, A. P. S., Chan, C. K., and Fang, M.: Growth and Shrinkage of New Particles in the Atmosphere in Hong Kong, Aerosol. Sci. Tech., 44, 639–650, https://doi.org/10.1080/02786826.2010.482576, 2010.
Yao, X. H., Lau, N. T., Fang, M., and Chan, C. K.: On the time-averaging of ultrafine particle number size spectra in vehicular plumes, Atmos. Chem. Phys., 6, 4801–4807, https://doi.org/10.5194/acp-6-4801-2006, 2006.
Yu, F. and Hallar, A. G.: Difference in particle formation at a mountaintop location during spring and summer: Implications for the role of sulfuric acid and organics in nucleation, J. Geophys. Res., 119, 12246–12255, https://doi.org/10.1002/2014JD022136, 2014.
Yu, F., Luo, G., Nadykto, A. B., and Herb, J.: Impact of temperature dependence on the possible contribution of organics to new particle formation in the atmosphere, Atmos. Chem. Phys., 17, 4997–5005, https://doi.org/10.5194/acp-17-4997-2017, 2017.
Yu, F., Luo, G., Nair, A. A., Schwab, J. J., Sherman, J. P., and Zhang, Y.: Wintertime new particle formation and its contribution to cloud condensation nuclei in the Northeastern United States, Atmos. Chem. Phys., 20, 2591–2601, https://doi.org/10.5194/acp-20-2591-2020, 2020.
Yue, D. L., Hu, M., Zhang, R. Y., Wang, Z. B., Zheng, J., Wu, Z. J., Wiedensohler, A., He, L. Y., Huang, X. F., and Zhu, T.: The roles of sulfuric acid in new particle formation and growth in the mega-city of Beijing, Atmos. Chem. Phys., 10, 4953–4960, https://doi.org/10.5194/acp-10-4953-2010, 2010.
Zakoura, M. and Pandis, S. N.: Overprediction of aerosol nitrate by chemical transport models: The role of grid resolution, Atmos. Environ., 187, 390–400, https://doi.org/10.1016/j.atmosenv.2018.05.066, 2018.
Zhang, C., Hai, S., Gao, Y., Wang, Y., Zhang, S., Sheng, L., Zhao, B., Wang, S., Jiang, J., Huang, X., Shen, X., Sun, J., Lupascu, A., Shrivastava, M., Fast, J. D., Cheng, W., Guo, X., Chu, M., Ma, N., Hong, J., Wang, Q., Yao, X., and Gao, H.: Substantially positive contributions of new particle formation to cloud condensation nuclei under low supersaturation in China based on numerical model improvements, Atmos. Chem. Phys., 23, 10713–10730, https://doi.org/10.5194/acp-23-10713-2023, 2023.
Zhang, R., Khalizov, A., Wang, L., Hu, M., and Xu, W.: Nucleation and growth of nanoparticles in the atmosphere, Chem. Rev., 112, 1957–2011, https://doi.org/10.1021/cr2001756, 2012.
Zhang, W., Li, W., An, X., Zhao, Y., Sheng, L., Hai, S., Li, X., Wang, F., Zi, Z., and Chu, M.: Numerical study of the amplification effects of cold-front passage on air pollution over the North China Plain, Sci. Total. Environ., 833, 155231, https://doi.org/10.1016/j.scitotenv.2022.155231, 2022.
Zhou, Y., Dada, L., Liu, Y., Fu, Y., Kangasluoma, J., Chan, T., Yan, C., Chu, B., Daellenbach, K. R., Bianchi, F., Kokkonen, T. V., Liu, Y., Kujansuu, J., Kerminen, V.-M., Petäjä, T., Wang, L., Jiang, J., and Kulmala, M.: Variation of size-segregated particle number concentrations in wintertime Beijing, Atmos. Chem. Phys., 20, 1201–1216, https://doi.org/10.5194/acp-20-1201-2020, 2020.
Zhu, Y., Yan, C., Zhang, R., Wang, Z., Zheng, M., Gao, H., Gao, Y., and Yao, X.: Simultaneous measurements of new particle formation at 1 s time resolution at a street site and a rooftop site, Atmos. Chem. Phys., 17, 9469–9484, https://doi.org/10.5194/acp-17-9469-2017, 2017.
Zhu, Y., Shen, Y., Li, K., Meng, H., Sun, Y., Yao, X., Gao, H., Xue, L., and Wang, W.: Investigation of Particle Number Concentrations and New Particle Formation With Largely Reduced Air Pollutant Emissions at a Coastal Semi-Urban Site in Northern China, J. Geophys. Res.-Atmos., 126, e2021JD035419, https://doi.org/10.1029/2021JD035419, 2021a.
Zhu, Y., Xue, L., Gao, J., Chen, J., Li, H., Zhao, Y., Guo, Z., Chen, T., Wen, L., Zheng, P., Shan, Y., Wang, X., Wang, T., Yao, X., and Wang, W.: Increased new particle yields with largely decreased probability of survival to CCN size at the summit of Mt. Tai under reduced SO2 emissions, Atmos. Chem. Phys., 21, 1305–1323, https://doi.org/10.5194/acp-21-1305-2021, 2021b.