the Creative Commons Attribution 4.0 License.
the Creative Commons Attribution 4.0 License.
 | 10 Jun 2024
Isotopic composition of convective rainfall in the inland tropics of Brazil
Vinicius dos Santos
Ana María Durán-Quesada
Ricardo Sánchez-Murillo
Kazimierz Rozanski
Oliver Kracht
Demilson de Assis Quintão
Strong convective systems characterize the tropical central-southern region of Brazil. These systems provide abundant water supply for agroindustrial activities and pose flood risks to large cities. Here, we present high-frequency (2–10 min; inter- and intra-event) rainfall isotopic compositions (n = 90 samples) to reveal regional and local atmospheric processes controlling the isotopic variability of convective systems between 2019–2021. Inter-event rainfall weighted-average (δwgd) values were low (δ18Owgd ≤ −10.0 ‰) due to the higher rainfall along the Hybrid Single-Particle Lagrangian Integrated Trajectory (HYSPLIT) model trajectories from the Amazon forest during the summer. In contrast, during autumn and spring seasons HYSPLIT model trajectories from the Atlantic Ocean and southern Brazil exhibited lower rainfall amounts, resulting in high δ18Owgd ≥ −4.2 ‰. This strong regional δwgd pattern often masks intra-event isotopic variability. Therefore, we analyzed the vertical structure of local rainfall using reflectivity (Z) from microradar data. Variations in Z indicate that microphysical processes as raindrops fall led to changes in δ18O and deuterium excess (d-excess). Our findings establish a novel framework for evaluating the meteorological controls on the isotopic variability of convective precipitation in tropical South America, fill the gap in high-frequency studies in this region, and generate an isotopic dataset for convective model evaluations.
- Article
(8658 KB) - Full-text XML
- BibTeX
- EndNote


The tropical central-southern region of Brazil (CSB) is the primary contributor to the country's economy, with agriculture and agroindustry being the main sectors (Zilli et al., 2017). These economic activities are highly dependent on seasonal rainfall for irrigation and hydropower supply (Luiz Silva et al., 2019). Projected changes in the frequency of heavy and extreme rainfall events (Marengo et al., 2020, 2021; Donat et al., 2013; IPCC, 2021) pose a significant threat to regional economic growth and energy generation. Similarly, according to Marengo et al. (2021), simulations with pre-CMIP6 models suggest that the intensification of heavy rainfall events could exacerbate the prevalence of floods and landslides in susceptible regions. Such occurrences have resulted in a total cost of USD 41.7 billion over the past half-century (Marengo et al., 2020; World Meteorological Organization, 2021).
Extreme precipitation events are linked to convective systems (CSs). These systems significantly contribute to the annual rainfall budget and account for a large number of extreme rainfall events (Roca and Fiolleau, 2020). Across the tropics, diurnal surface heating amplifies convection, generating short-lived events that can occur in consecutive days. Rapid upward movement of air results in large condensation and precipitation rates (Breugem et al., 2020; Kastman et al., 2017; Lima et al., 2010; Machado et al., 1998). This is identified by vigorous vertical development in the form of cumulonimbus and cumulus congestus (convective clouds) and low-level divergence (stratiform clouds) (Siqueira et al., 2005; Machado and Rossow, 1993; Zilli et al., 2017; Houze, 1989, 2004). Precipitation associated with these systems is commonly referred to as convective and stratiform rainfall and accounts for 45% and 46% of the total rainfall in South America, respectively (Romatschke and Houze, 2013).
Whether rainfall is convective or stratiform has been suggested to determine variations in stable isotope composition of precipitation across the tropics (Zwart et al., 2018; Sánchez-Murillo et al., 2019; Sun et al., 2019; Han et al., 2021; Aggarwal et al., 2016; Munksgaard et al., 2019). Processes driving the variations in the isotopic composition in CSs are more complex and less understood compared to other precipitation-producing systems. Studies using the isotopic composition of rain and water vapor have quantified and modeled physical processes related to convection (Bony et al., 2008; Kurita, 2013). Previous studies have suggested that the isotopic composition of CSs is connected to the integrated history of convective activity (Risi et al., 2008; Moerman et al., 2013), the depth of organized convection and aggregation (Lawrence et al., 2004; Lekshmy et al., 2014; Lacour et al., 2018; Galewsky et al., 2023), the microphysical processes within clouds (Aggarwal et al., 2016; Lawrence et al., 2004; Zwart et al., 2018), and cold-pool dynamics (Torri, 2021). These interpretations have simplified and lumped together the effects of multiple rainfall timescales (e.g., monthly, daily, and sub-hourly), providing different perspectives on convective processes, such as the regional (synoptic forcings) and local factors (e.g. microphysical processes occurring both within and below the cloud) (Kurita et al., 2009; Muller et al., 2015; Graf et al., 2019; Lee and Fung, 2008).
High-frequency rainfall sampling and analyses of stable isotope ratios have been used to better understand the evolution of large weather systems such as tropical cyclones and typhoons (Sun et al., 2022; Sánchez-Murillo et al., 2019; Han et al., 2021), squall lines (Taupin et al., 1997; Risi et al., 2010; Tremoy et al., 2014; de Vries et al., 2022), mid-latitude cyclones, and cold fronts (Barras and Simmonds, 2009; Celle-Jeanton et al., 2004; Aemisegger et al., 2015; Thurnherr and Aemisegger, 2022; Muller et al., 2015; Landais et al., 2023). High-resolution isotope information can provide better insight into isotopic variability during the lifecycle of rainfall events (Coplen et al., 2008; Muller et al., 2015; Celle-Jeanton et al., 2004).
In this study, we used high-frequency rainfall sampling to disentangle regional (moisture origin and transport, regional atmospheric circulation) from local (below-cloud processes, vertical structure of rainfall, cloud top temperature) processes controlling the isotopic composition of convective rainfall. High-frequency rainfall was integrated with ground-based observational data (micro rain radar and automatic weather station), satellite imagery (GOES-16), ERA5 reanalysis products, and Hybrid Single-Particle Lagrangian Integrated Trajectory (HYSPLIT) model trajectories to better characterize convective rainfall over the inland tropics of Brazil.
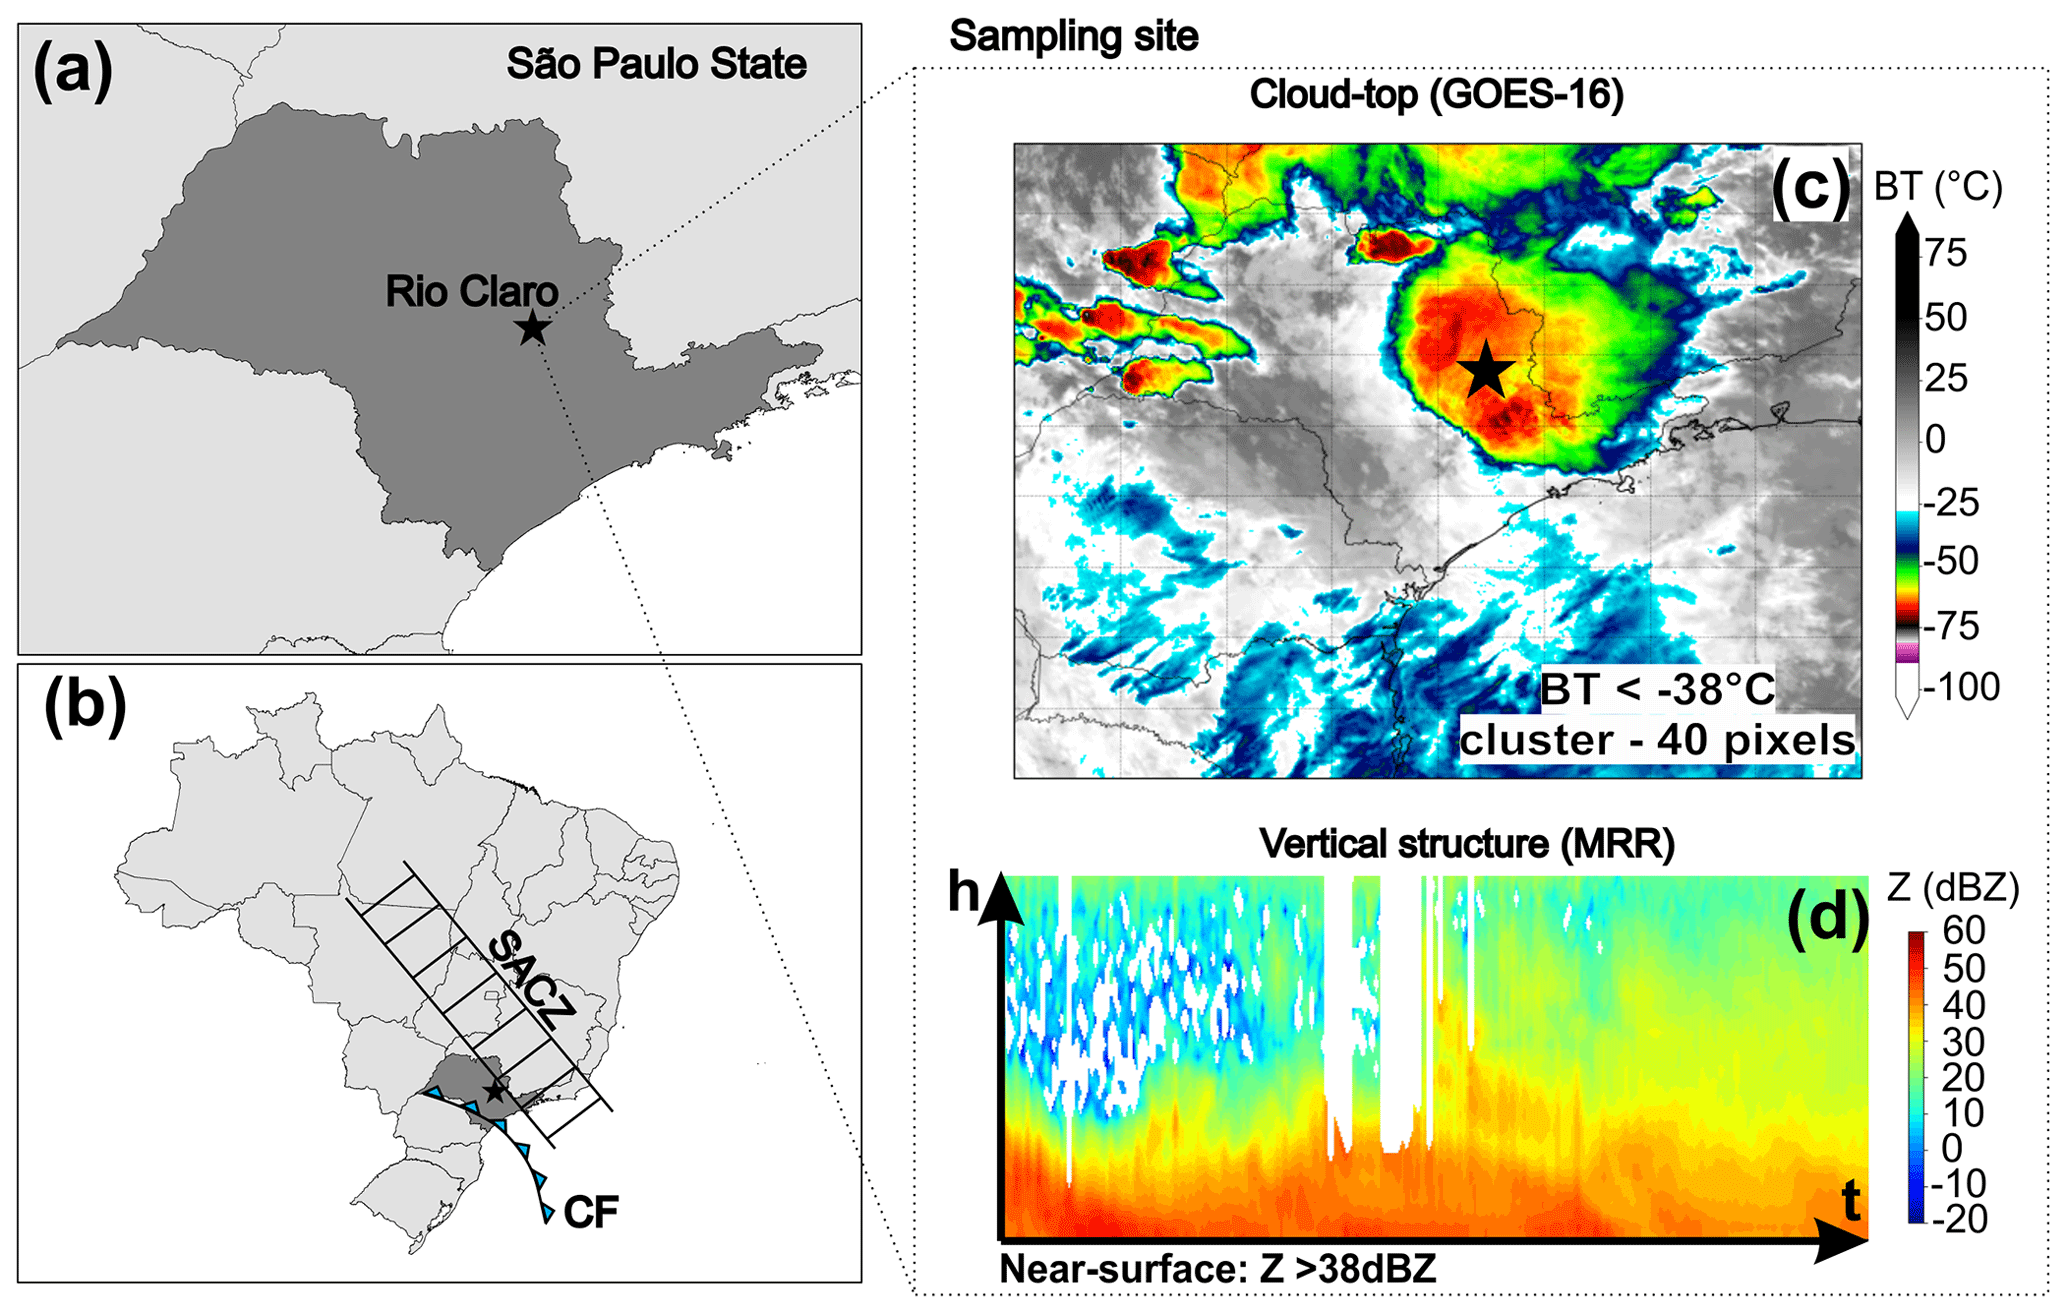
Figure 1Regional and local context of study area. (a) Localization of sampling site in Rio Claro (black star), (b) regional synoptic context across Brazil and main weather systems (cold front – CF and Southern Atlantic Convergence Zone – SACZ). Maps (a) and (b) were produced by the authors using trivial information, and no copyright is required. (c) GOES-16 satellite imagery of convective rainfall (Bruning et al., 2019: NOAA GOES-R Series Advanced Baseline Imager (ABI), Level 0 data, indicate subset used. NOAA National Centers for Environmental Information, https://doi.org/10.25921/tvws-w071). (d) Micro rain radar (MRR) image of convective rainfall.
2.1 Sampling site and weather systems
The rainfall sampling site was located in Rio Claro, São Paulo (Fig. 1a). The station (22.3° S, 47.5° W; 670 ) is part of the Global Network of Isotopes in Precipitation (GNIP) and is influenced by weather systems responsible for rainfall variations and seasonality linked to the regional atmospheric circulations across the CSB region. The rainfall seasonality over CSB is associated with (i) frontal systems (FSs), represented mainly by cold fronts from southern South America acting throughout the year, and (ii) the activity of the South Atlantic Convergence Zone (SACZ) during austral summer (December to March) (Kodama, 1992; Garreaud, 2000) (Fig. 1b). These features are mostly responsible for CS development (Romatschke and Houze, 2013; Siqueira et al., 2005; Machado and Rossow, 1993) (Fig. 1c) and were captured during their passage over the Rio Claro station.
2.2 Rainfall sampling and isotope analyses
High-frequency rainfall sampling was conducted using a passive collector (2 to 10 min intervals) from September 2019 to February 2021, except for April, July, and August (during winter 2020), when no rainfall was observed in the study area. The Covid-19 pandemic disrupted access to the university campus, thereby reducing the number of rainfall events sampled during the spring of 2020, particularly at night (due to lockdowns). In this study, the rainfall samples collected do not consist of consecutive day–night pairs during the same day. In total, 90 samples representing 8 convective events (3 nighttime and 5 daytime events) were collected. Samples were transferred to the laboratory and stored in 20 mL HDPE bottles at 4 °C. In parallel to high-frequency sampling, monthly cumulative rainfall samples were also collected using the methodology recommended by the International Atomic Energy Agency.
Rainfall samples were analyzed for stable isotope composition using off-axis integrated cavity output spectroscopy (Los Gatos Research Inc.) at the Hydrogeology and Hydrochemistry laboratory of the São Paulo State University's (UNESP) Department of Applied Geology and at the Chemistry School of the National University (UNA; Heredia, Costa Rica). All results are expressed in per mil relative to Vienna Standard Mean Ocean Water (VSMOW). The certified calibration standards used in UNESP were USGS45 (δ2H = −10.3 ‰, δ18O = −2.24 ‰) and USGS46 (δ2H = −236.0 ‰, δ18O = −29.80 ‰), including one internal standard (Cachoeira de Emas (CE); δ2H = −36.1 ‰, δ18O = −5.36 ‰). USGS standards were used to calibrate the results on the V-SMOW2-SLAP2 scale, whereas CE was used for memory and drift corrections. At UNA, the certified standards MTW (δ2H = −130.3 ‰, δ18O = −16.7 ‰), USGS45 (δ2H = −10.3 ‰, δ18O = −2.2 ‰), and CAS (δ2H = −64.3 ‰, δ18O = −8.3 ‰) were used to correct the measurement results for memory and drift effects and to calibrate them on the V-SMOW2-SLAP2 scale (García-Santos et al., 2022). The analytical uncertainty (1σ) was 1.2 ‰ for δ2H and 0.2 ‰ for δ18O for UNESP analysis and 0.38 ‰ for δ2H and 0.07 ‰ for δ18O for UNA analysis. Deuterium excess (d-excess) was calculated as d-excess = δ2H − 8 ⋅ δ18O (Dansgaard, 1964), with uncertainties (1σ) of 1.33 and 0.43 ‰, respectively. This secondary isotope parameter was used to interpret the influence of moisture origin and transport (Sánchez-Murillo et al., 2017; Froehlich et al., 2002) and local processes (Aemisegger et al., 2015; Muller et al., 2015; Celle-Jeanton et al., 2004).
2.3 Meteorological data
An automatic weather station (AWS) Decagon Em50 (METER) was installed next to the micro rain radar (MRR) (METEK) at 670 , within the immediate vicinity of the rainfall collection site. Meteorological data were recorded in 1 min intervals for rain rate (RR; mm min−1), air temperature (T; °C), and relative humidity (RH; %). The MRR data for reflectivity (Z; in dBZ) and fall velocity (w; m s−1) were also recorded in 1 min intervals. MRR parameters correspond to the mean values measured at the elevation between 150 and 350 m above surface. MRR operated at a frequency of 24.230 GHz and a modulation of 0.5–15 MHz according to the height resolution mode. For this work, different height resolutions (31 range bins) were tested, 150, 200, 300, and 350 m, resulting in vertical profiles of 4650, 6200, 9300, and 10 850 m, respectively (Endries et al., 2018). The MRR data used in the following discussion are the near-surface data (first measurement from 150 to 350 m). The lifting condensation level (LCL; meters) was computed from AWS RH and T, using an expression proposed by Soderberg et al. (2013). The rainfall amount (R; mm) was also calculated during the sampling interval. GOES-16 imagery was used to identify the convective nuclei of the cloud top (10.35 µm, Band-13) and brightness temperature (BT; °C) at 10 min intervals during the sampling period (Ribeiro et al., 2019; Schmit et al., 2017). The 10.35 µm BT is often used to estimate the convective cloud depth, since the lower BT is linked to deeper cloud tops (Adler and Fenn, 1979; Roberts and Rutledge, 2003; Adler and Mack, 1986; Ribeiro et al., 2019; Machado et al., 1998). The weather systems (fronts, instabilities, and low pressure) were defined according to the synoptic chart and meteorological technical bulletin of the Center for Weather Forecast and Climatic Studies of the National Institute of Space Research (CPTEC/INPE) that used information of numerical models, automatic weather stations, satellite and radar images, reanalysis data, and regional atmospheric models (such as the Brazilian Global Atmospheric Model and ETA model).
2.4 HYSPLIT modeling and reanalysis data
The origin of air masses and moisture transport to the Rio Claro site were evaluated using the Hybrid Single-Particle Lagrangian Integrated Trajectory (HYSPLIT) modeling framework (Stein et al., 2015; Soderberg et al., 2013). The trajectories of the air masses were estimated for 240 h prior to rainfall onset, considering the estimated time of residence of the water vapor (Gimeno et al., 2010, 2020; van der Ent and Tuinenburg, 2017). The start time of the trajectories was the same as the start time of rainfall events. The trajectories were computed using NOAA's meteorological data (Global Data Assimilation System (GDAS): 1°, global, 2006–present), with ending elevations of the trajectories at 1500 , taking into account the climatological height of the low-level jet, within 1000–2000 m (Marengo et al., 2004). The 10 d trajectories representing convective events were calculated as trajectory ensembles, each consisting of 27 ensemble members released at the start hour of the convective rainfall sample collection. Ensembles were produced by varying the initial trajectory wind speeds and pressures, according to the HYSPLIT ensemble algorithm, in order to account for the uncertainties involved in the simulation of individual backward trajectories (Jeelani et al., 2018). A sum of the rainfall intensity (mm h−1) along the trajectories was used to analyze rainout of the moist air masses according to Jeelani et al. (2018).
Reanalysis data were used to better understand the influence of atmospheric circulation on the isotopic composition of rainfall at the study area. ERA5 information was used to evaluate hourly vertical integrals of eastward water vapor flux () during the sampled convective events. Global Modeling and Assimilation Office (GMAO) data (MERRA-2, 1 h, 0.5° × 0.625° v5.12.4) were used for calculations of latent heat flux (LHF). Aqua/AIRS L3 Daily Standard Physical Retrieval (AIRS-only) data (1° × 1°, v7.0, Greenbelt, MD, USA, Goddard Earth Sciences Data and Information Services Center) (known as GES DISC) were used for average outgoing longwave radiation (OLR). OLR values below 240 W m−2 indicate organized deep convection (Gadgil, 2003).
2.5 Identification of convective rainfall events and vertical variations in reflectivity
In general, the identification of CSs was based on the vertical structure of the given precipitation system (lack of the melting layer and bright band – BB) in the radar profiles featuring high reflectivity values (Z > 38 dBZ) (Houze, 1993, 1997; Steiner and Smith, 1998; Rao et al., 2008; Mehta et al., 2020; Endries et al., 2018) and satellite imagery (Vila et al., 2008; Ribeiro et al., 2019; Siqueira et al., 2005; Machado et al., 1998). Consequently, convective rainfall was defined in this study by (i) convective cloud nuclei observed in GOES-16 imagery, (ii) no BB detected, (iii) Z > 38 dBZ near the surface, and (iv) rainfall intensity (AWS) of at least 10 mm h−1 (Klaassen, 1988) (Fig. 1c and d). The convective nuclei were identified using GOES-16 imagery, determined as a contiguous area of at least 40 pixels with BT lower than 235 K (≤ −38 °C) over Rio Claro station, according to previous studies (Ribeiro et al., 2019).
Z is defined as the mean number of raindrops within a specific diameter interval per unit volume of air. Therefore, Z represents the concentration of a particular raindrop property (in this case, the sixth power of their diameter, proportional to the square of their volume) (Houze, 1993; Mehta et al., 2020; Uijlenhoet, 2001). A high Z value indicates a high concentration of raindrops. A modification in the formation mechanism for precipitation particles results in a change in Z of the vertical profile (Houze, 1997). Descriptive statistics were conducted on the Z values at different heights to comprehend and quantify the dynamics of rain particle formation during intra-events. The resulting parameters from considering the entire vertical profile of the MRR are Zmax, the maximum reflectivity value in the vertical profile indicating the maximum concentration of raindrops; Zmedian, the median reflectivity in the vertical profile that was used to synthesize the change in vertical Z values; and Zamplitude (Zampl), defined as the difference between the maximum and minimum reflectivity values in the vertical profile. In other words, a larger Zampl indicates that raindrops undergo more microphysical transformations as they fall to the surface.
2.6 Statistical tests
The Shapiro–Wilk test was applied to verify that the data distribution was normal (parametric) or non-normal (non-parametric) (Shapiro and Wilk, 1965). A significant difference (p value < 0.05) indicates a non-parametric distribution. A Spearman rank correlation test was used for nonparametric distribution data, whereas Pearson's linear correlation test was applied for parametric data. Correlation tests were conducted between isotopes (δ18O and d-excess) and meteorological data (AWS and MRR variables) during the same time interval and from individual events. Correlation tests were not applied to GOES-16 BT and reanalysis data due to their temporal resolution, which reduced the number of samples. All tests were performed with significance levels defined by a p value < 0.05, using the R statistical package (R Core Team, 2024).
Rainfall weighted averages were calculated for each event to evaluate large-scale processes using the following equation:
where δwgd is the rainfall weighted average of the isotopic composition, Ri is the rainfall of the event (mm), δi is the isotopic composition of an individual sample (‰), and n is the number of samples from each event. Rainfall weighted averages refer to the δ18Owgd, δ2Hwgd, and dwgd and the median of the δ18Omed, δ2Hmed, and dmed.
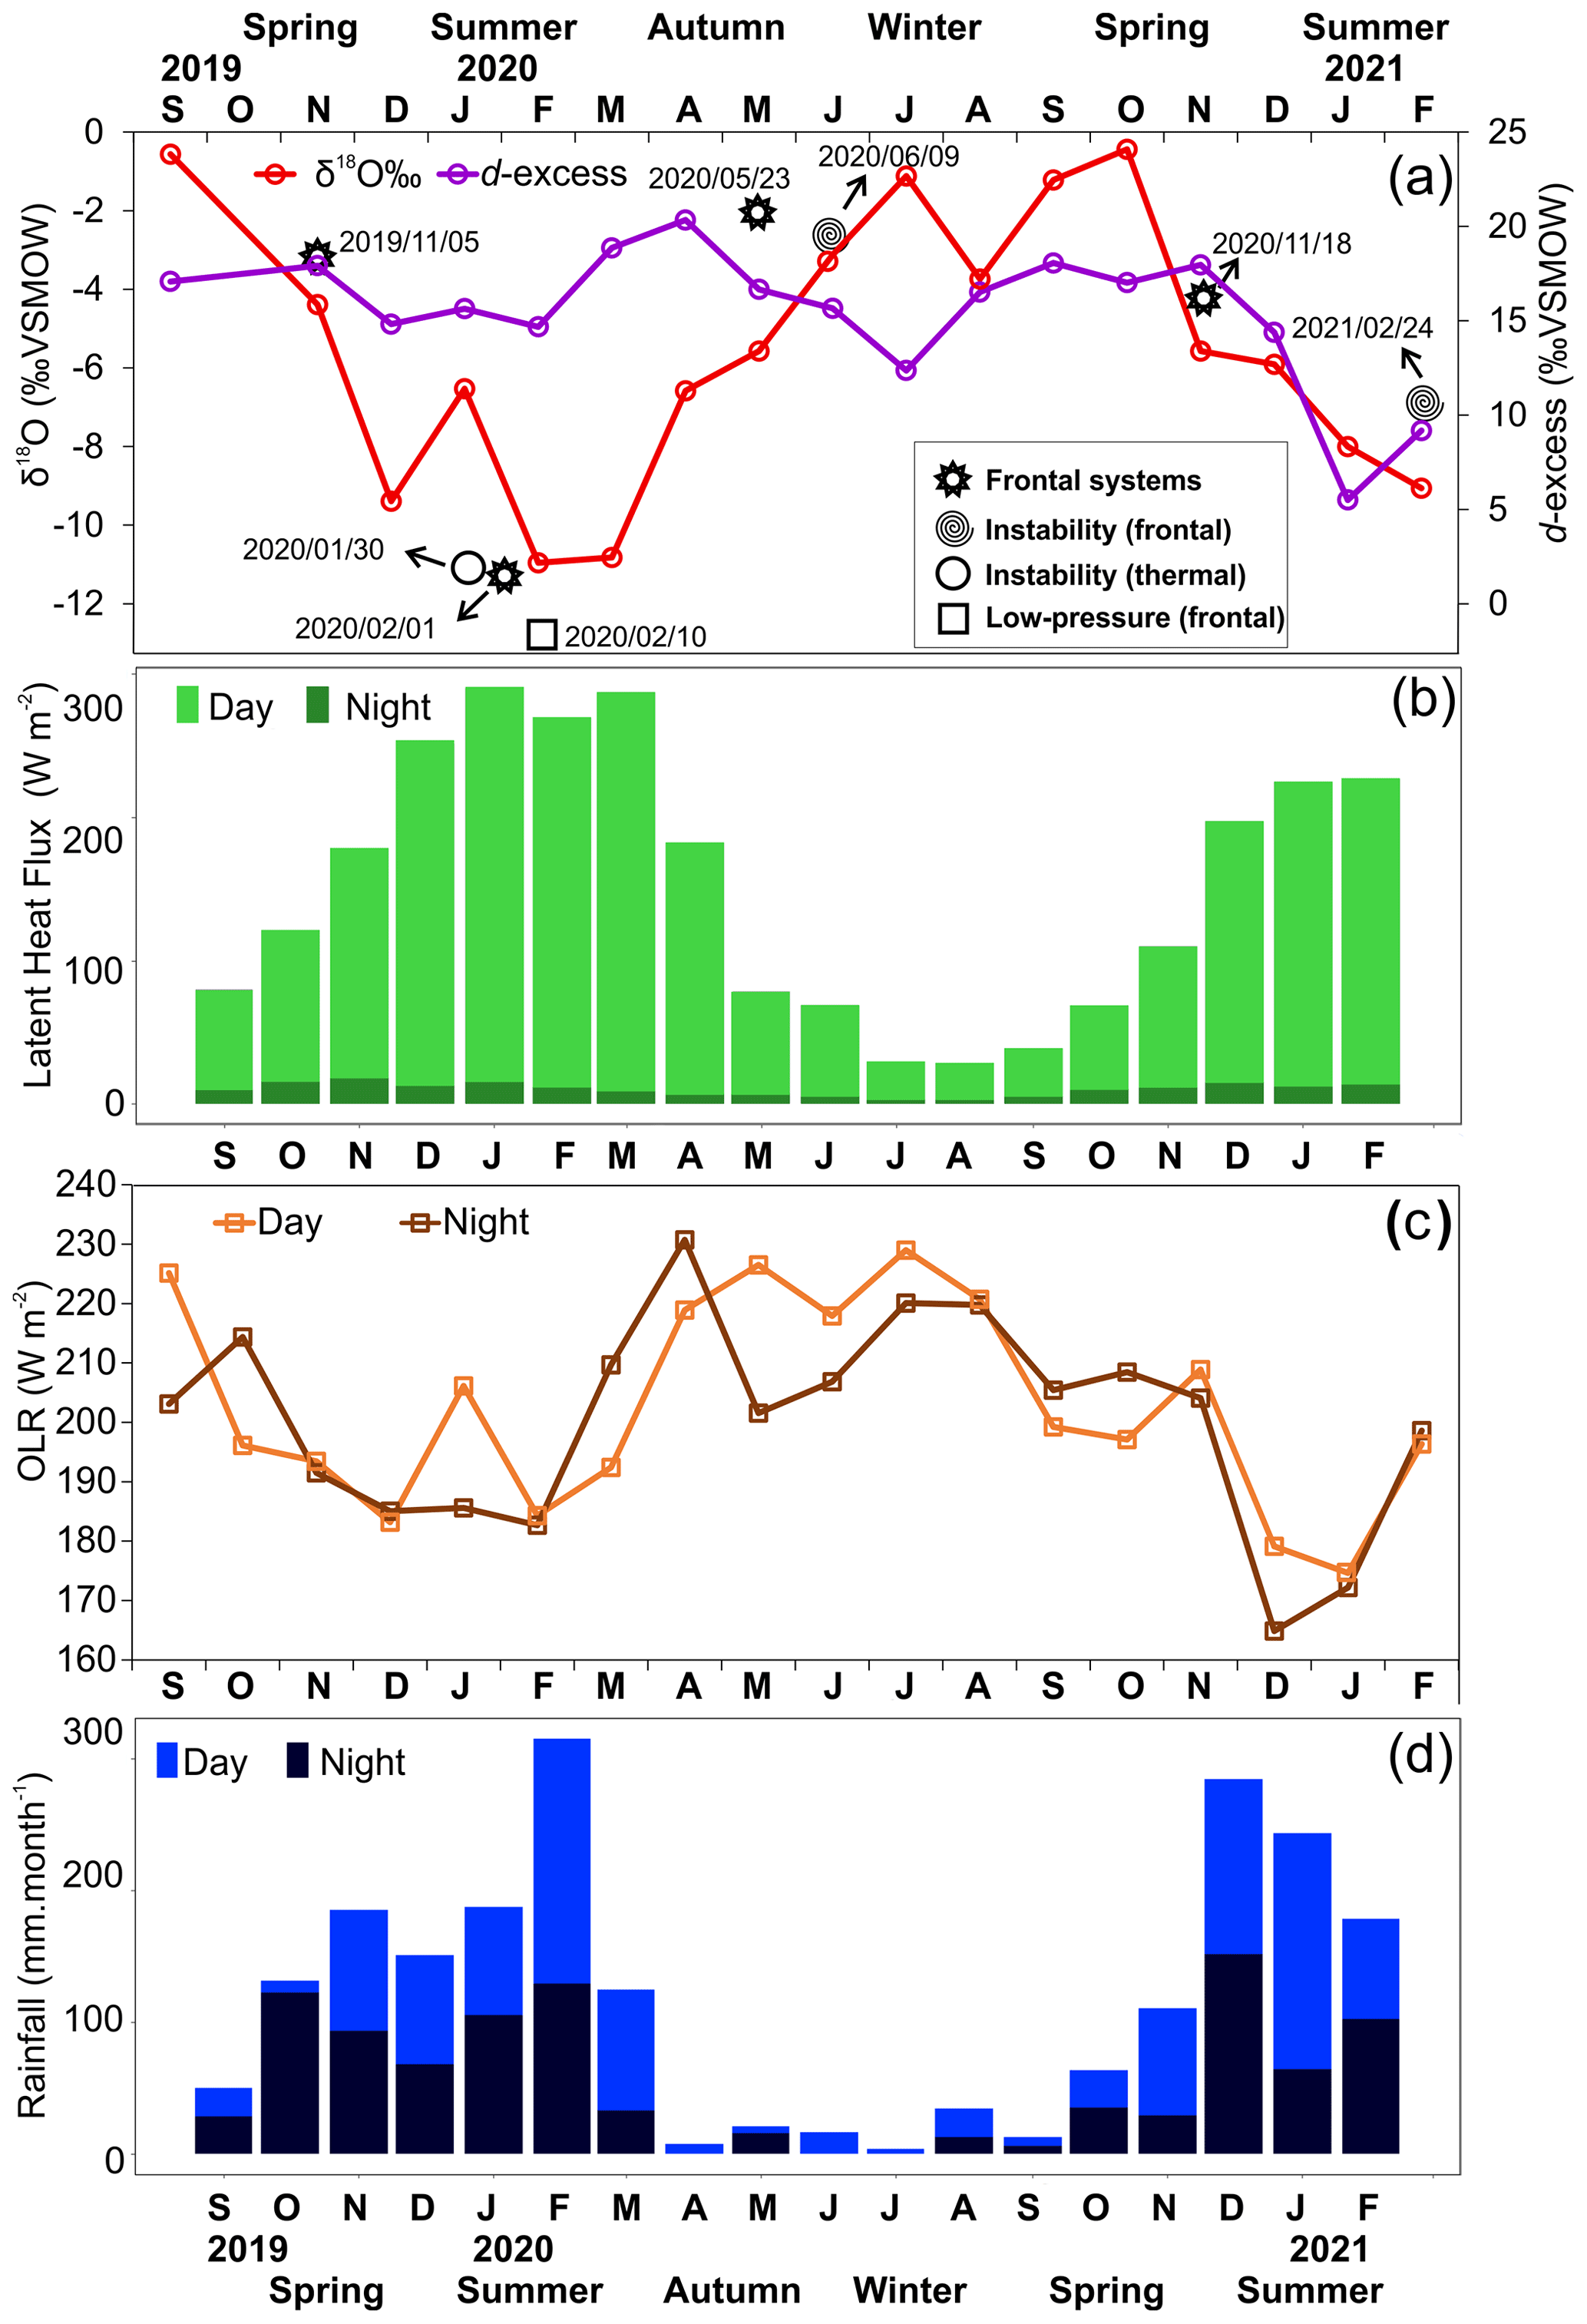
Figure 2Seasonal variation in isotope and convective parameters. (a) Temporal distribution of monthly δ18O and d-excess values during study period, with aggregated median of δ18O values for high-frequency convective rainfall events. (b) AQUA/AIRS latent heat flux. (c) MERRA-2 outgoing longwave radiation (monthly averaged daytime and nighttime data). (d) Monthly rainfall amounts at Rio Claro separated into day and night fraction (no rainfall types distinguished). The black symbol indicates weather systems described in Sect. 3.1. The monthly isotopic composition used in this figure was collected by the first authors of the article and determined by the UNESP laboratory, following the same procedures mentioned in Sect. 2.2.
3.1 Inter-event variability of meteorological and isotopic parameters
3.1.1 Seasonal-mean climatic and isotopic conditions
The isotopic composition of monthly rainfall exhibits clear seasonal variations between September 2019 and February 2021 (Fig. 2a). Seasonal variability was characterized by wet (low δ18O) and dry (high δ18O) seasons (austral summer and autumn–spring, respectively). Summer months were characterized by the influence of convective activity, reflected in high latent heat flux and lower OLR (Fig. 2b–d). During autumn and spring, significant lower latent heat flux and higher OLR were associated with less convective development (Houze, 1997, 1989). The formation of convective rainfall may not be primarily controlled by diurnal thermal convection, as rainfall is more likely to be associated with frontal systems (Siqueira and Machado, 2004), as observed in the rainfall episodes during autumn and spring.
A significant influence of the cold fronts was observed before, during, and after their passage over the study area (Fig. 2a). During autumn and spring, the convective events of 5 November 2019, 18 November 2020, and 23 May 2020 were associated with cold fronts in the study area. On 9 June 2020, changes in the regional atmosphere over the state of São Paulo caused convective rainfall due to an instability (frontal) system resulting from a cold front settling over the southern region of Brazil. During the summer season, convective rainfall also occurred on 1 February 2020 and 24 February 2021 due to cold fronts and instability (frontal), respectively. In addition, thermal convection over land led to a convective rainfall event on 30 January 2020. As a result of the interaction between thermal convection and the incursion of the frontal system, a low-pressure system (frontal) was responsible for the convective rainfall event on 10 February 2020.
Table 1Summarizing overall convective rainfall events, isotopes, and meteorological parameters.
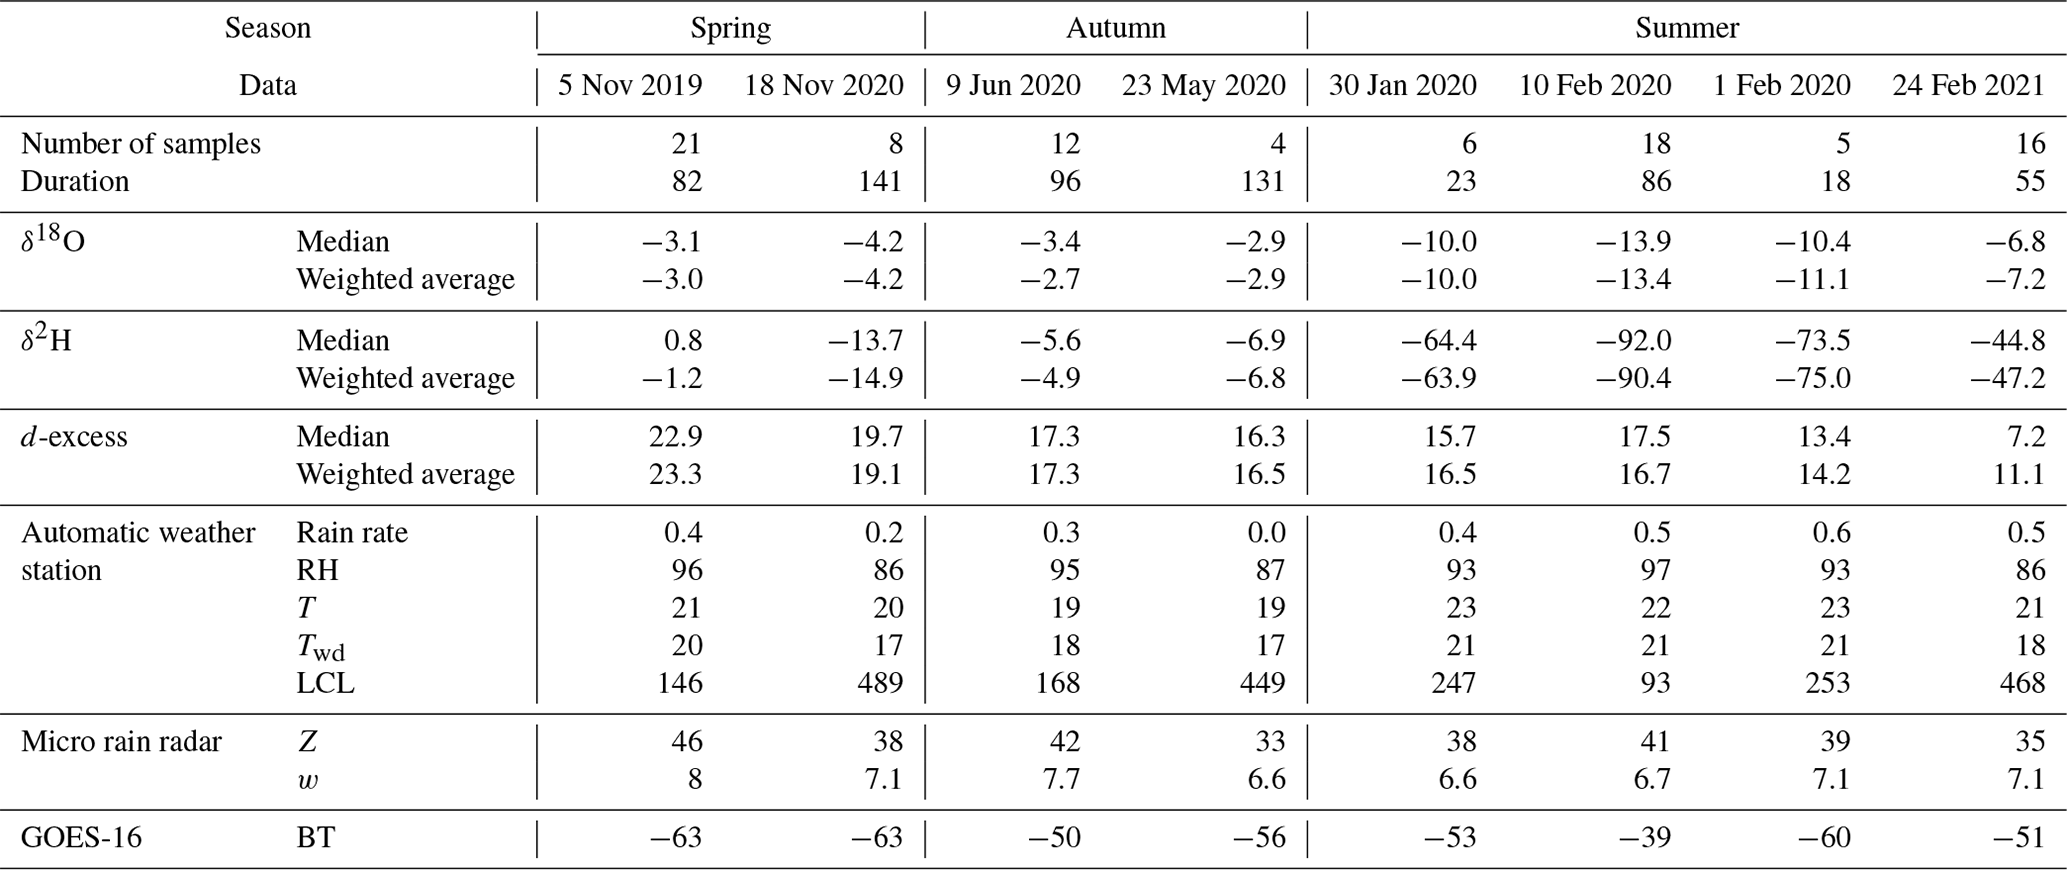
Duration (min); isotope parameters (‰); median values of meteorological variables: rain rate (mm min−1), relative humidity (RH; %), temperature (T; °C), dew temperature (Twd; °C), lifting condensation level (LCL; m), reflectivity (Z; dBZ), vertical velocity (m s−1), and brightness temperature (BT; °C).
3.1.2 Isotopic and local meteorological variations
Table 1 presents an overview of the sampling, isotope compositions (δmed and δwgd), and median values of meteorological variables from individual events. The duration of sampled events ranged from 141 min to 18 min. T and Twd exhibited small differences among the events. In contrast, RR, RH, LCL, Z, w, and BT varied considerably between events. The maximum recorded values for these parameters were 97%, 489 m, 46 dBZ, 8 m s−1, and −6 °C, respectively. Isotope values varied among convective events, with a range of −11.0 ‰, −91.2 ‰, and +15.7 ‰ for δ18Omed, δ2Hmed, and dmed, respectively (Table 1).
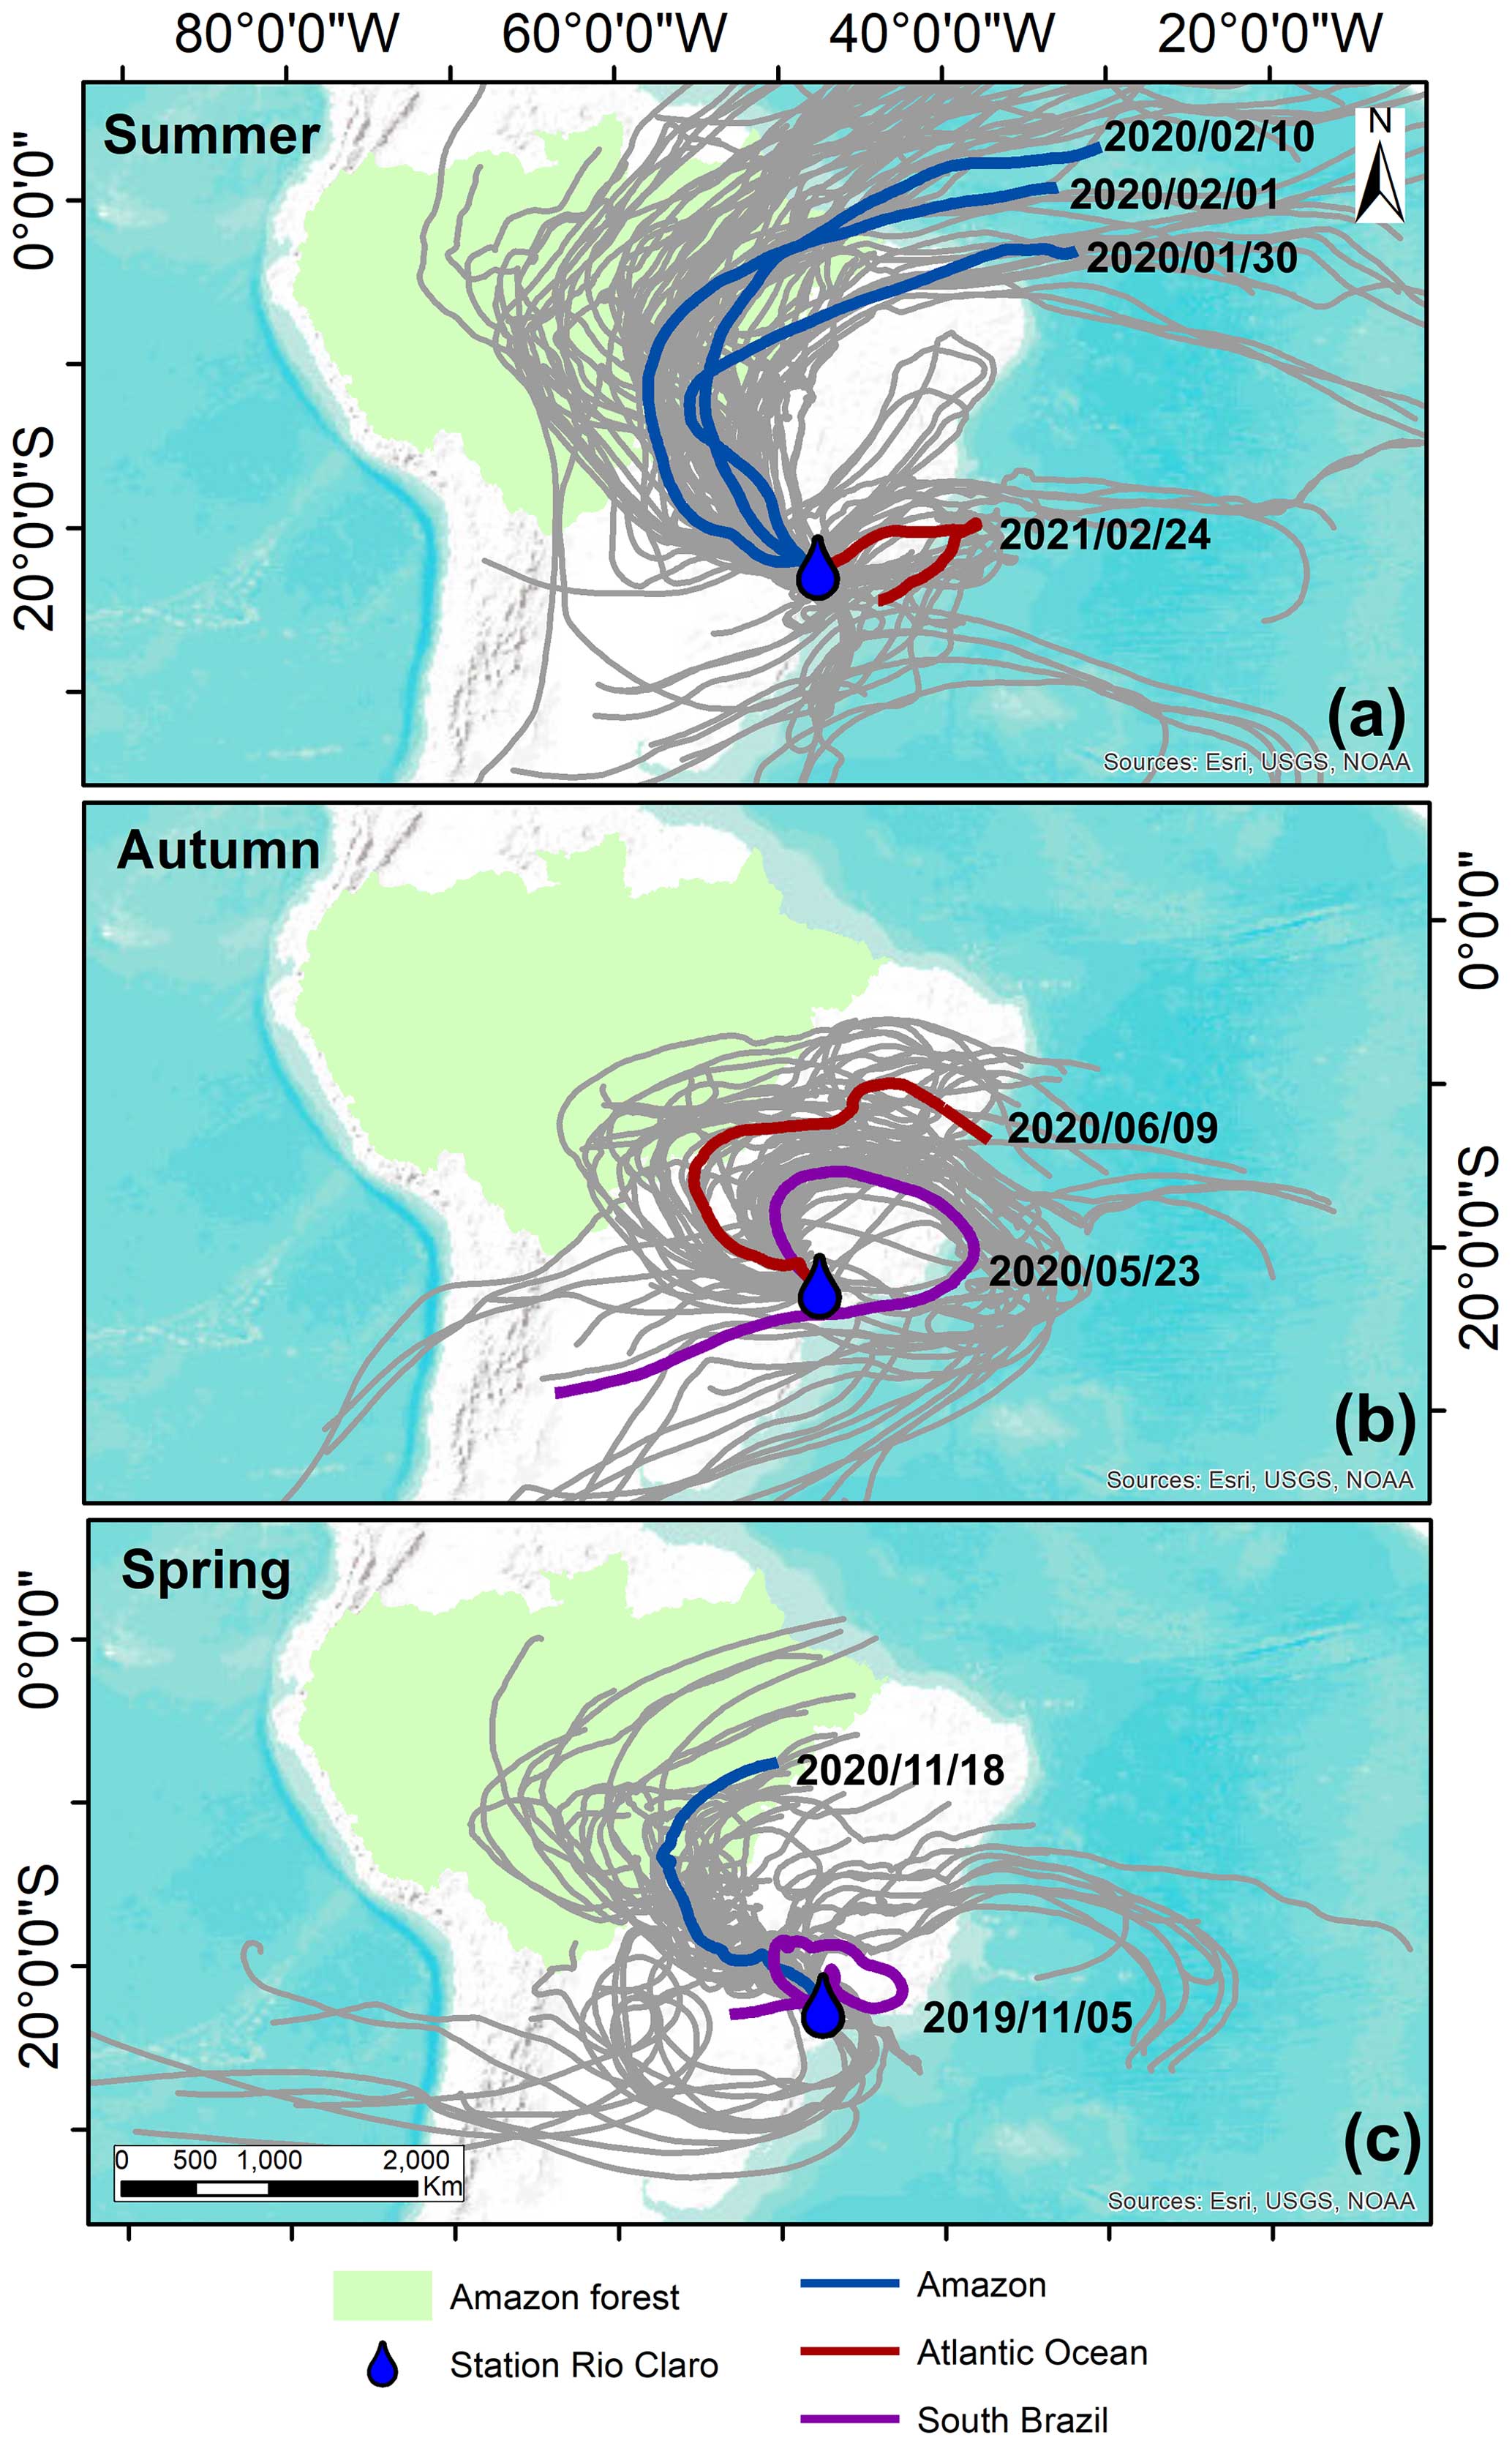
Figure 3The 10 d backward trajectories of eight convective events arriving at Rio Claro station. (a) Summer, (b) autumn, and (c) spring. The 27 ensembles are denoted by the grey lines, and the mean trajectory is denoted by the color lines. The colors of the mean trajectories indicate the origin of air masses. The authors used trivial information, the borders of the countries, and the ocean provided by the ESRI base map.
3.1.3 Moisture origin
The sourcing of moisture for rainfall over Rio Claro varies seasonally and spatially, suggesting complex interactions in moisture transport and mixing that strongly influence the δwgd isotopic composition of rainfall throughout the year (Table 1). HYSPLIT air mass back trajectories revealed three main domains as moisture origin during the presence of convective rainfall: the Amazon forest, the Atlantic Ocean, and southern Brazil (Fig. 3).
Summer rainfall events were characterized by the trajectory and length of moist air masses arriving from the Amazon forest (10 February 2020, 1 February 2020, and 30 January 2020) (Fig. 3a). As a result, there was a large amount of rainfall along HYSPLIT model trajectories. Rainfall amounts were 177, 126, and 78 mm, respectively. Remarkably, these events exhibited similar isotope characteristics (δ2Hwgd, δ18Owgd) (Table 1). In contrast, the event on 24 February 2021 presented higher δwgd values, reflecting the oceanic moisture influence (Fig. 3a), with the lowest amount of rainfall (53 mm) along the HYSPLIT model trajectory.
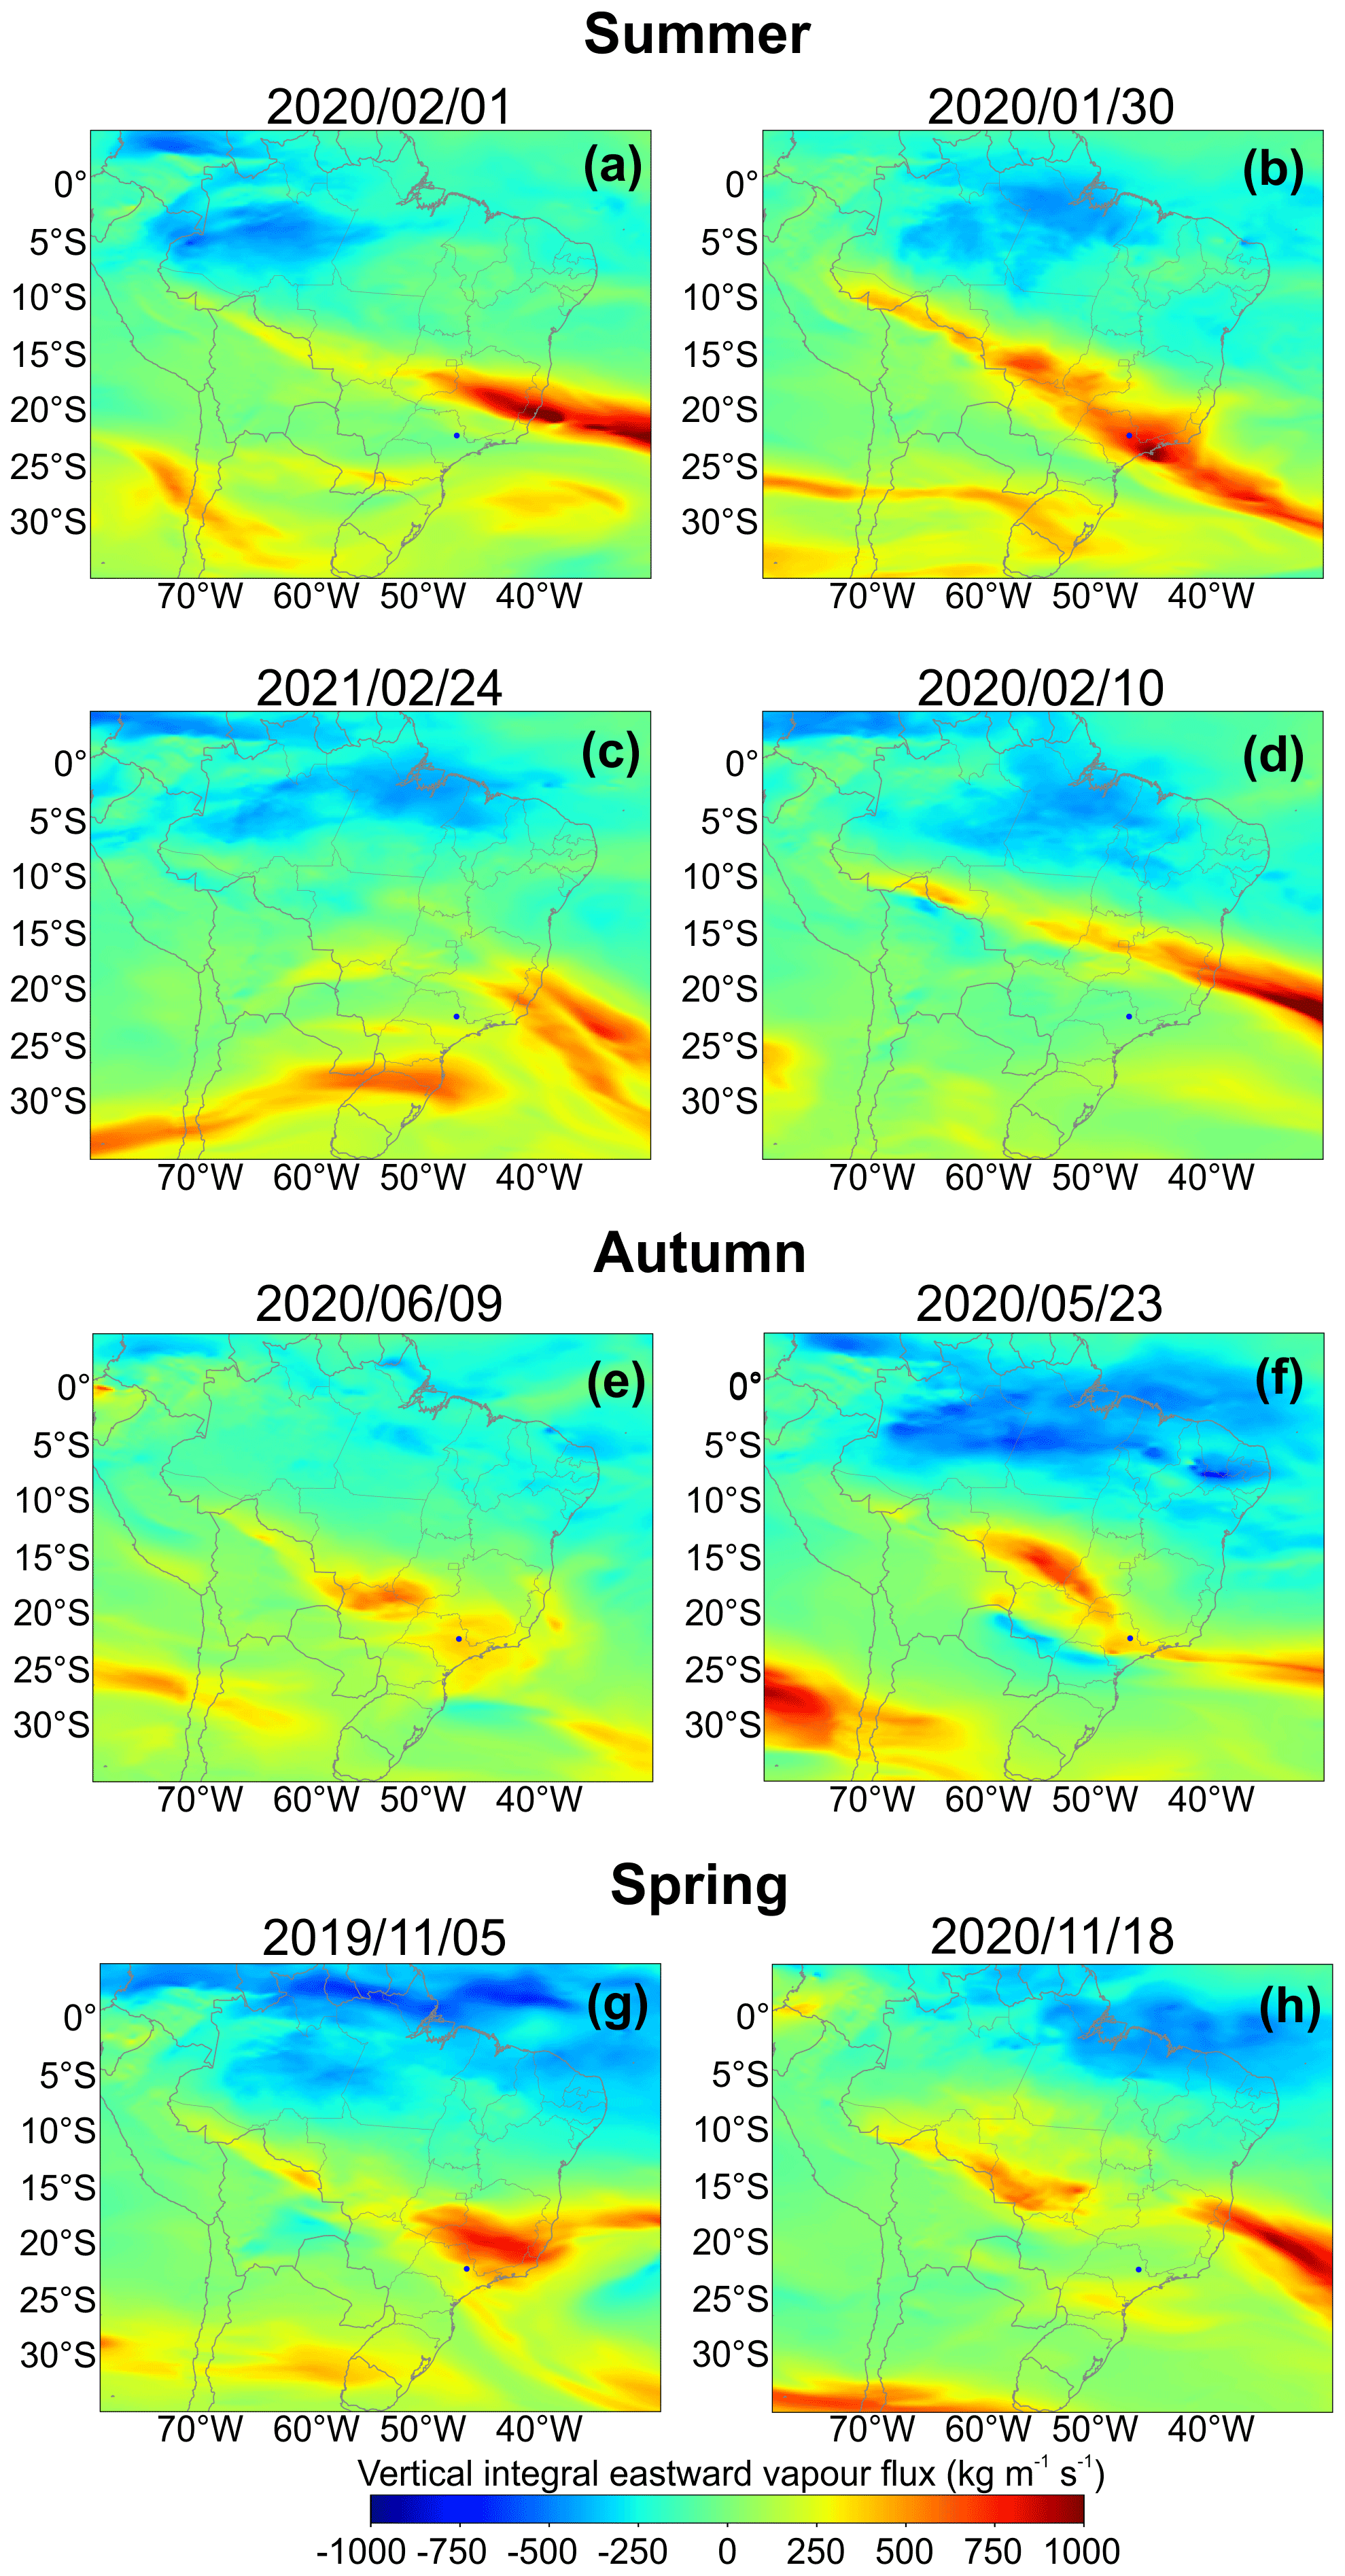
Figure 4ERA5 vertical integral of eastward water vapor flux. (a–d) Summer convective events, (e, f) autumn and (g, h) spring aggregated. The maps correspond to the days when convective rainfall events occurred. Positive values indicate the direction of moisture vapor flux from left to right and negative values from right to left.
Based on ERA5, the vertically integrated eastward vapor flux corroborates the influence of a distinct mechanism on moisture transport and δwgd values. Negative values for vertical vapor fluxes over the Amazon forest during sampled convective events in summer (Fig. 4a, b, and d) clearly illustrate a westward moisture flux from the Atlantic Ocean to the Amazon forest. Positive values in the central-southern region of Brazil indicate moisture being transported eastward from the Amazon forest. However, these moisture fluxes were not observed on 24 February 2021 when the eastward vapor flux was positive with high values over the Atlantic Ocean (250 ∼ 750 ).
The autumn convective events on 23 May 2020 and 9 June 2020 revealed a significant continental origin of moist air masses (from south-western Brazil). In addition, during the second event, the Amazon-type trajectory started in the southern Atlantic and did not reach the boundary of the rainforest (Fig. 3b). Both autumn events reported the lowest rainfall amounts (4 mm) along HYSPLIT model trajectories. On 23 May 2020 negative vertical flux values (−500 ∼ −250 ) were observed in south-western Brazil, indicating moisture transport from the Atlantic Ocean to the continent. This favored a vapor flux (500 ∼ 750 ) from western Brazil to the study area (Fig. 4f). On 9 June 2020, there were slightly negative values (−250 ∼ 0 ) of eastward vapor flux in the Amazon forest, indicating less influence from rainforest moisture. Conversely, positive vapor flux values (250 ∼ 500 ) were observed in the western part of continental Brazil.
Two events in the spring season (Fig. 3c) also showed contrasting origin of moisture and dwgd values, despite having only slight differences in δ18Owgd (Table 1). The mean trajectory on 18 November 2020 clearly belongs to the Amazon category, although it only passed over the south-eastern boundary of the Amazon rainforest and had a much shorter length and lower rainfall along the HYSPLIT model trajectory (23 mm) compared to the Amazon trajectories observed during the summer season. Thus, positive values of the eastward vapor flux (250 ∼ 750 ) were not distributed along the Amazon forest to the Atlantic Ocean as typically observed (Fig. 4h). The mean trajectory on 5 November 2019 and the eastward vapor flux (> 500 , Fig. 4g) circled around Rio Claro, indicating the continental moisture origin (from southern Brazil) and a low amount of rainfall along the HYSPLIT model trajectory of 8 mm.
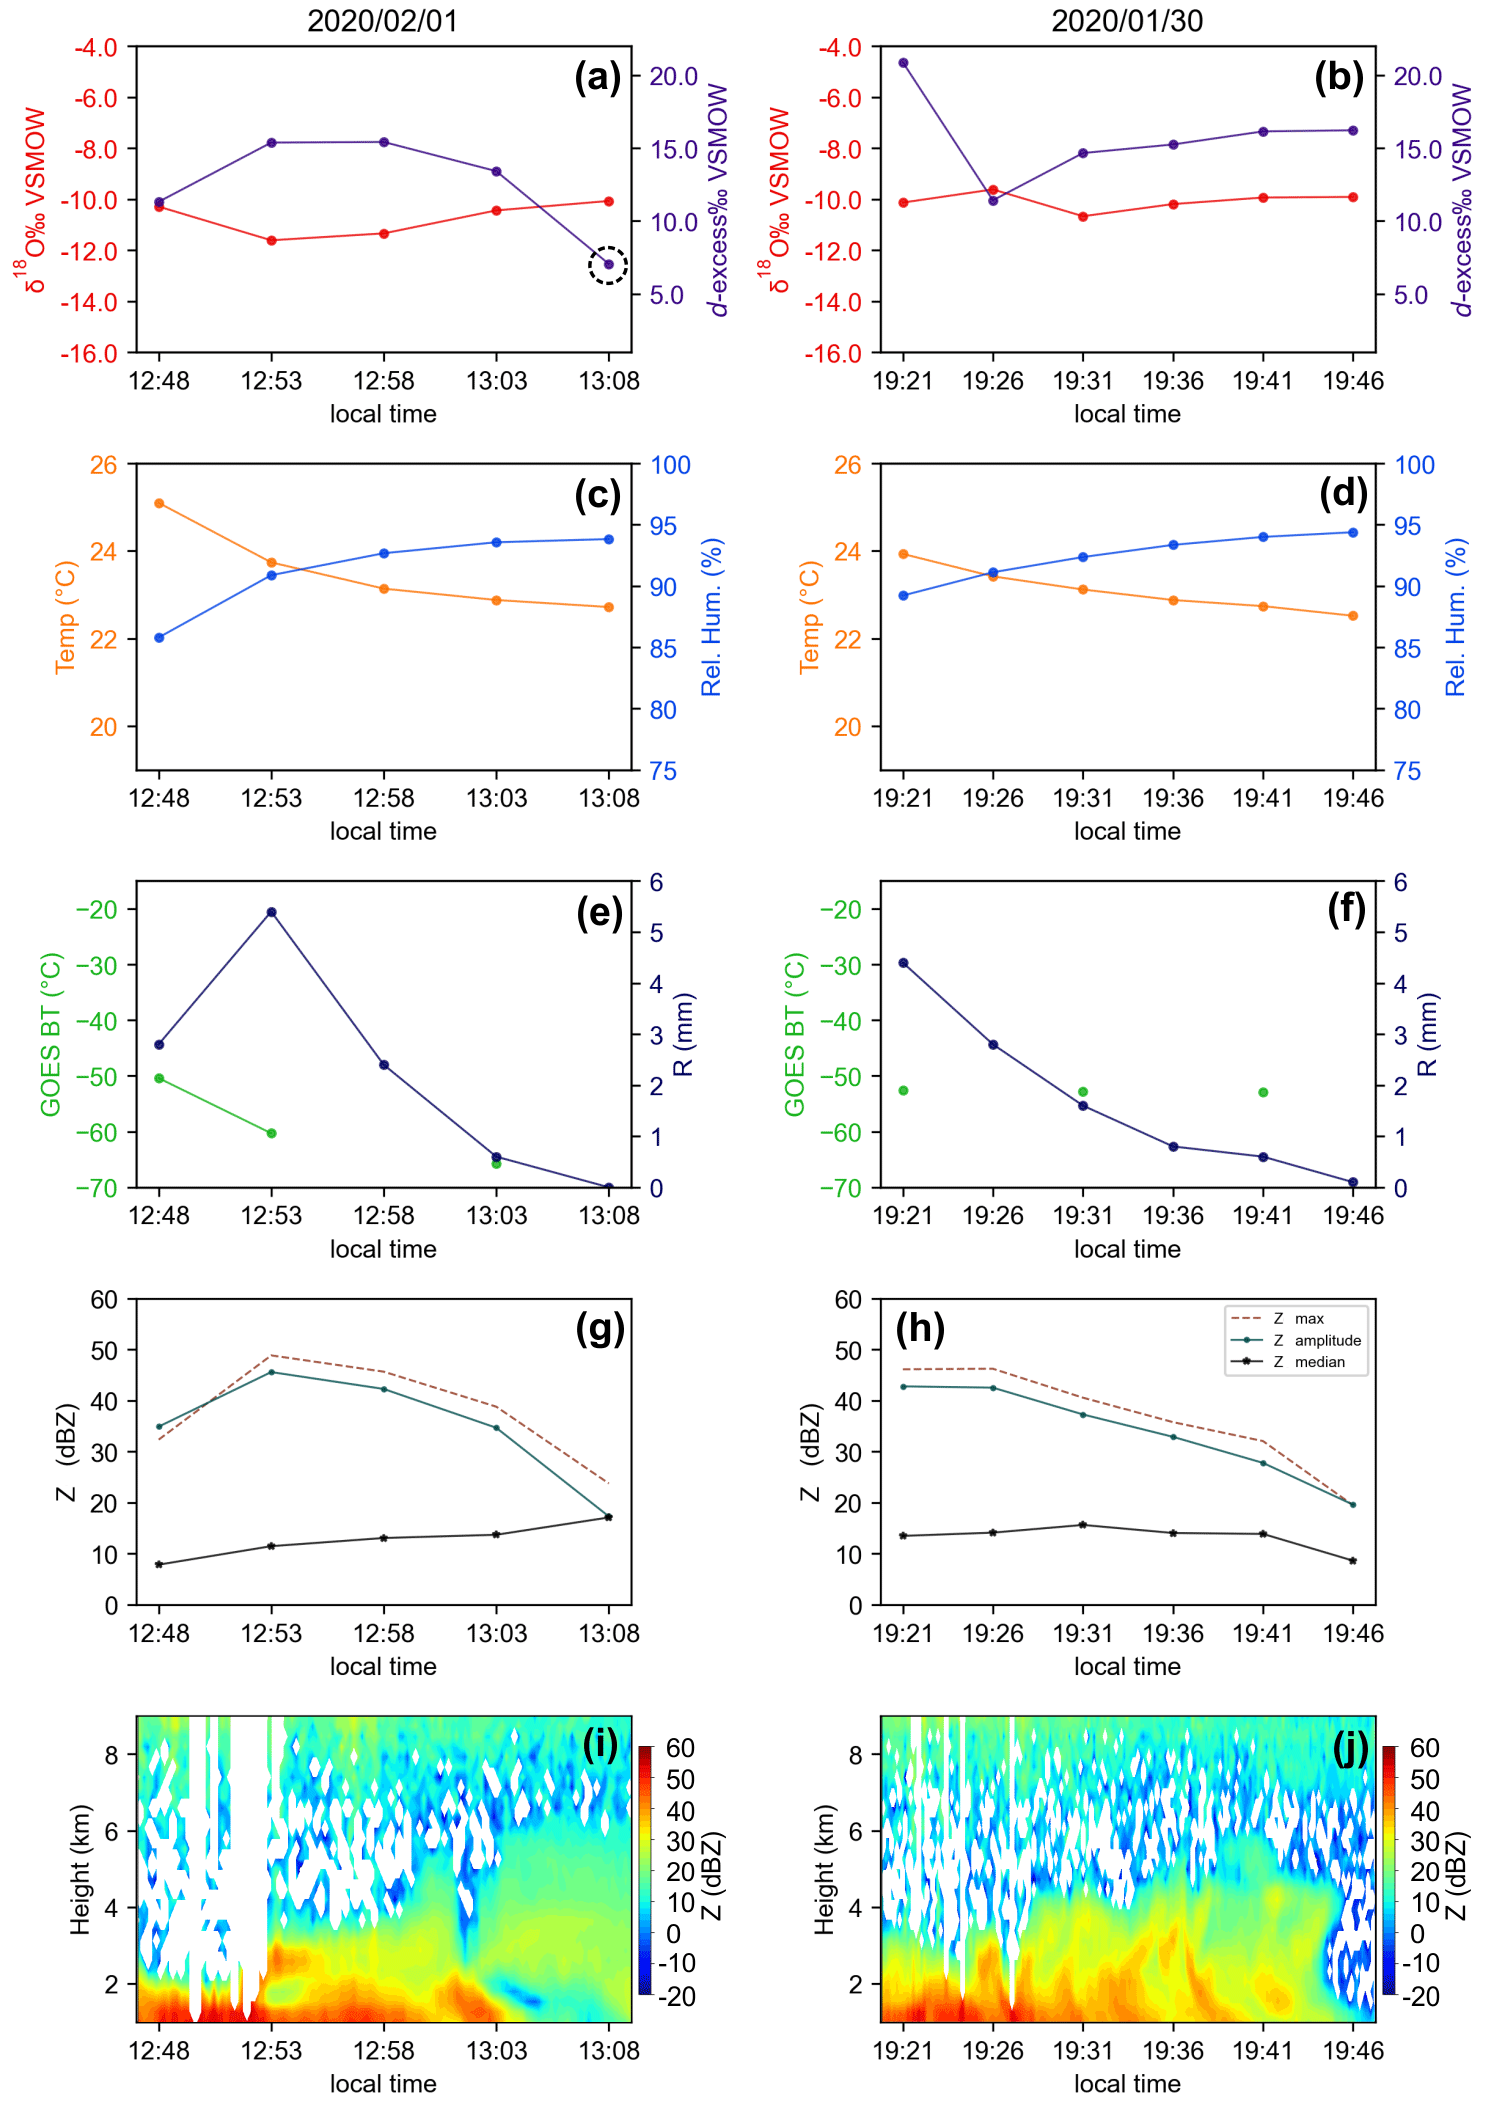
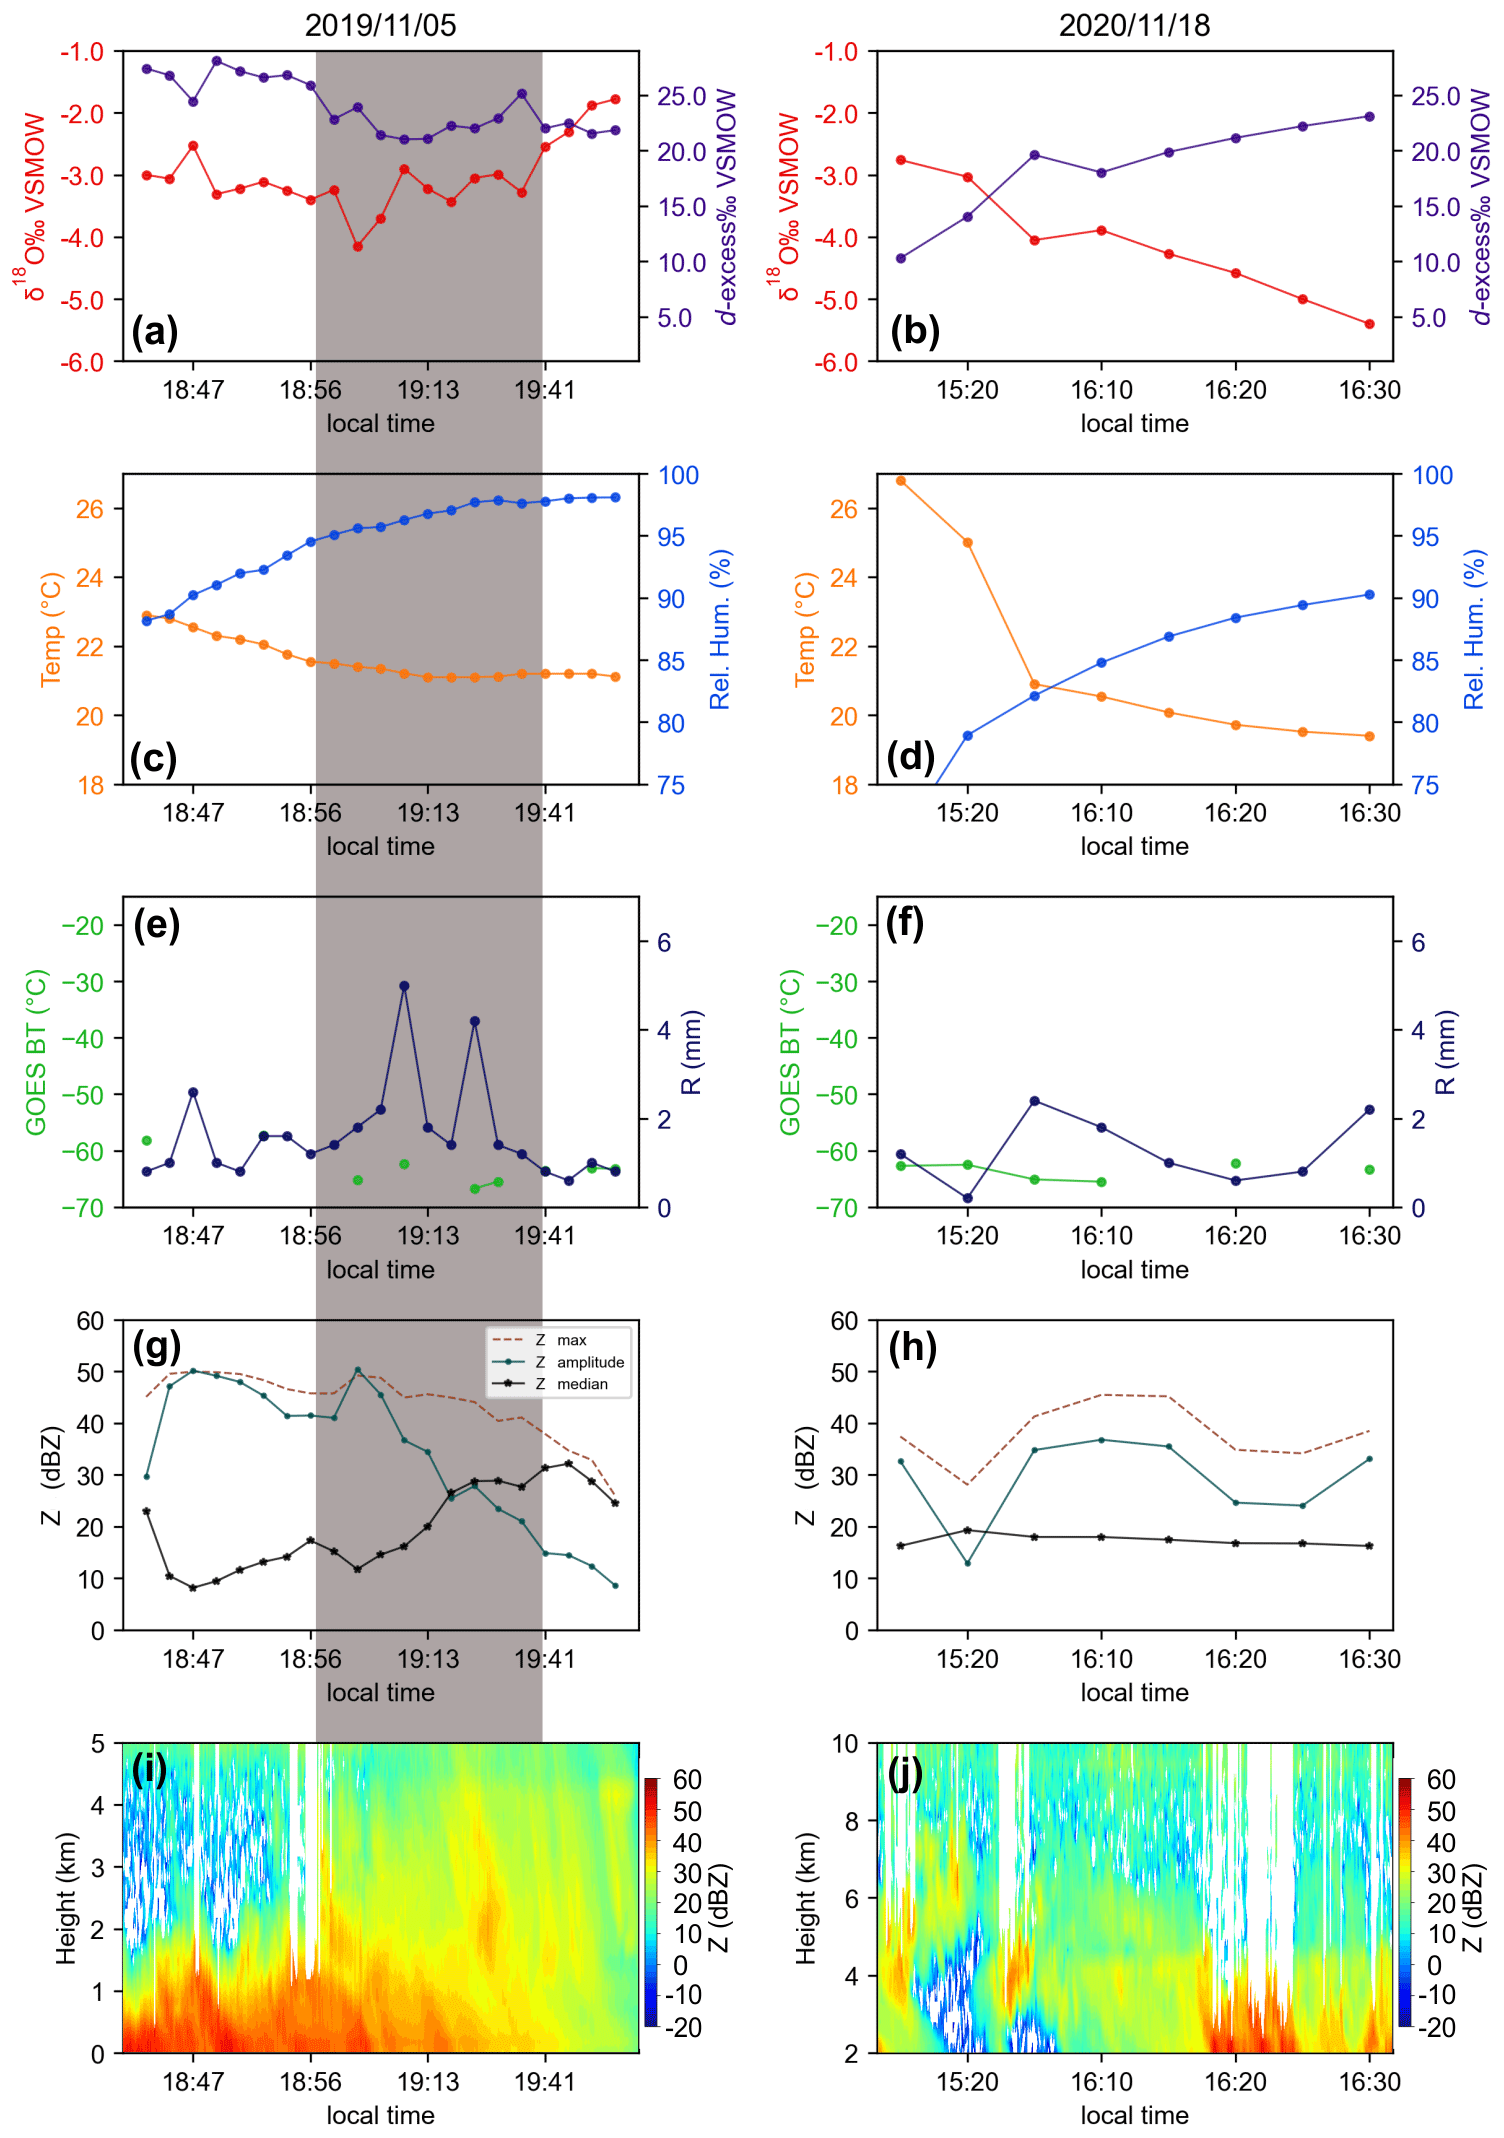
Figure 5Summer intra-events. (a, b) δ18O (red lines) and d-excess (purple lines). (c, d) Temperature (orange lines) and relative humidity (blue lines). (e, f) Brightness temperature (BT – green bars) and rainfall amount (blue lines). (g, h) Reflectivity parameters, Z maximum (red lines), Z amplitude (green lines), and Z median (black lines). (i, j) Radar reflectivity of micro rain radar. The black dotted cycle refers to the low d-excess value.
3.2 Intra-event variability of the isotope and meteorological parameters
The temporal evolution of isotope characteristics and selected meteorological parameters of convective rainfall are shown in Figs. 5 (summer), 6 (summer), 7 (autumn), and 8 (spring). The vertical Z variation in the MRR in all events shows a pattern of values ranging from 0 to 10 dBZ at the top, a wide band of the lowest values and noise attenuating the reflectivity-producing white horizontal and vertical bands, and an increase in Z values closer to the surface where Zmax occurs (highest values ranging from 44 to 51 dBZ). During intra-events, Z, isotopic parameters, and GOES-16 BT display distinct temporal patterns across events and seasons. There are large variations in Z values and inverse patterns between δ18O and d-excess (more variable) and between T and RH. Different decreasing, increasing, or stable trends were observed in BT values. The following sections describe the main seasonal results for the intra-event analysis.
3.2.1 During summer
Low-variability patterns were observed on 1 February 2020 and 30 January 2020 (Fig. 5) for δ18O, T, RH, and BT. Both events were shorter in duration (≤ 25 min) and had a higher R (≤ 5.4 mm) value at the beginning, which decreased over the course of the event (0.2 mm). Similar MRR vertical profiles were observed between the events, illustrated by similar Z values, with low variability of Zmedian (7 ∼ 17 and 8 ∼ 15 dBZ) and Zmax (23 ∼ 48 and 19 ∼ 46 dBZ) and Z amplitude decreasing during the event (17 ∼ 45 and 19 ∼ 42 dBZ), respectively. Strong and significant (p < 0.0001) correlations were observed between isotopic composition and MRR parameters for 1 February 2020: δ18O-Z (r = −0.9), δ18O-w (r = −0.9), δ18O-Zmax (r = −0.9), δ18O-Zampl (r = −0.8), d-excess-Z (r = 0.9), d-excess-w (r = 0.9), d-excess-Zmax (r = −0.9), and d-excess-Zampl (r = 0.9). There were no significant correlations between isotopic composition and meteorological parameters for 30 January 2020, except for a moderate correlation between δ2H and Zmedian (r = −0.5).
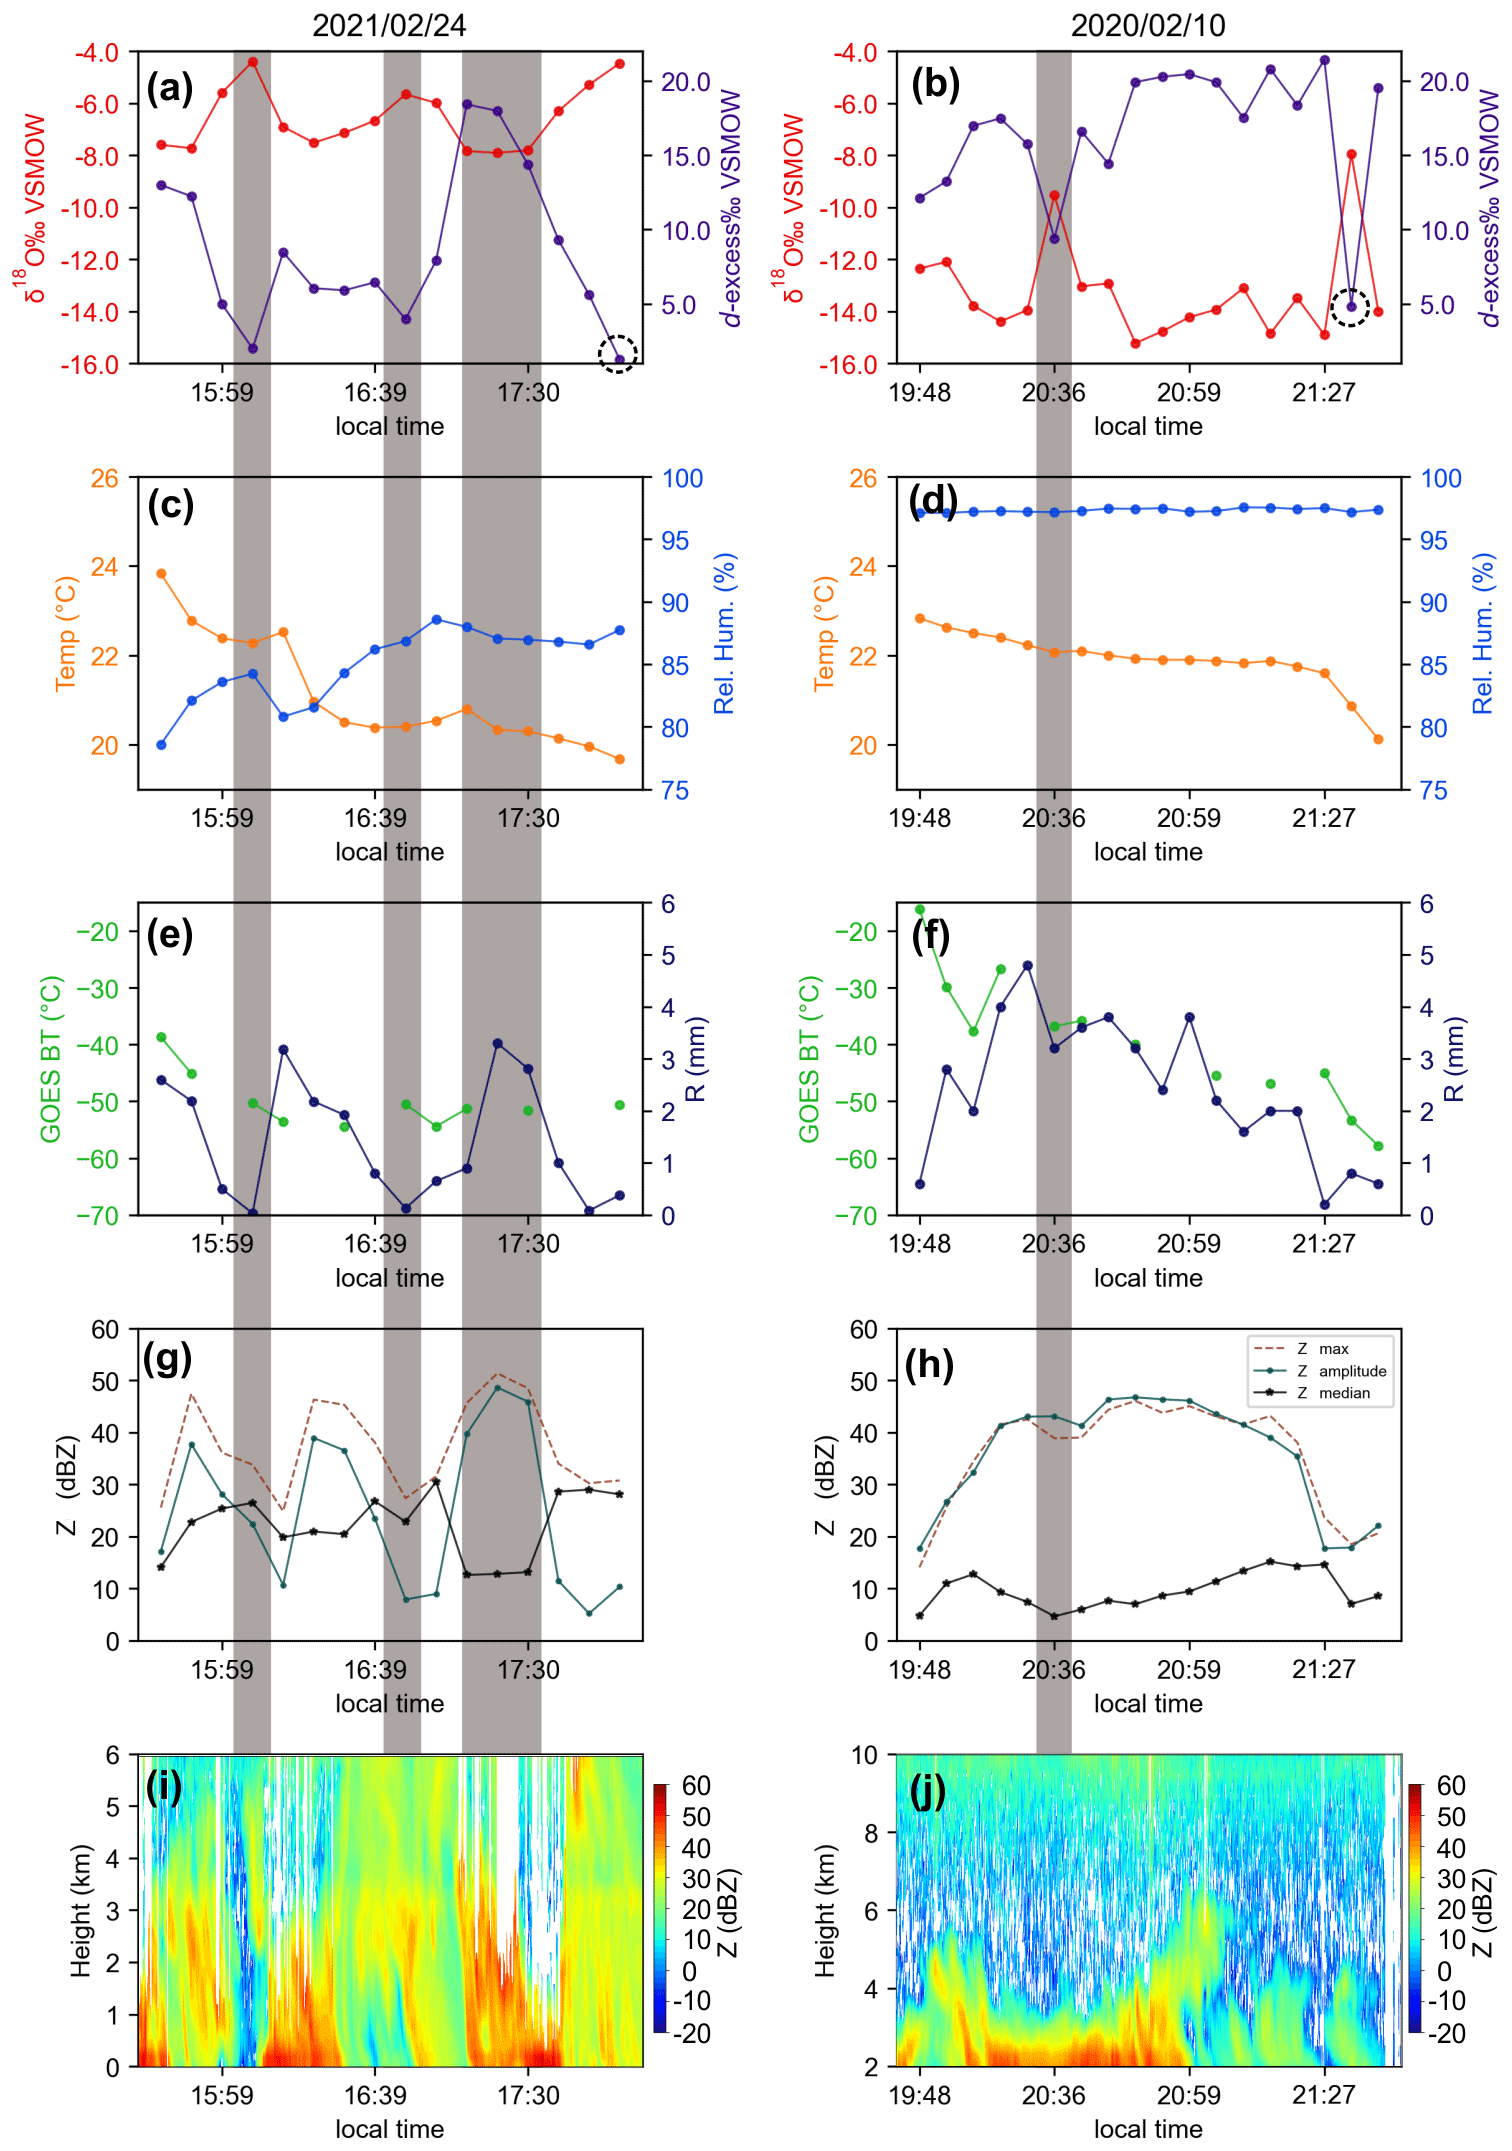
Large isotopic and meteorological variations were observed for 24 February 2021 (δ18O: −7.9 ∼ −4.4 ‰, d-excess: +1.2 to +18.4 ‰) and 10 February 2020 (δ18O: −15.2 ∼ −7.9 ‰, d-excess: +4.8 ∼ +21.4 ‰) (Fig. 6). On 24 February 2021 a strong and significant (p < 0.05) correlation was observed between δ18O and R (r = −0.8), Z (r = −0.6), Zmax (r = −0.6), Zampl (r = −0. 6), and Zmedian (r = 0.7) and between d-excess and R (r = −0.6), Z (r = −0.5), Zmax (r = 0.5), Zampl (r = 0.5), and Zmedian (r = −0.7). For 10 February 2020, significant correlations were reported between δ18O-RH (r = −0.5) and d-excess-RH (r = 0.5) and d-excess and Zmedian (r = 0.5). In addition, d-excess values lower than +10 ‰ were observed at the end of the events (1 February 2020, 10 February 2020, and 24 February 2021), corresponding to low values of the R and Z parameters and high RH (dotted black cycle in Figs. 5 and 6).
3.2.2 During autumn and spring
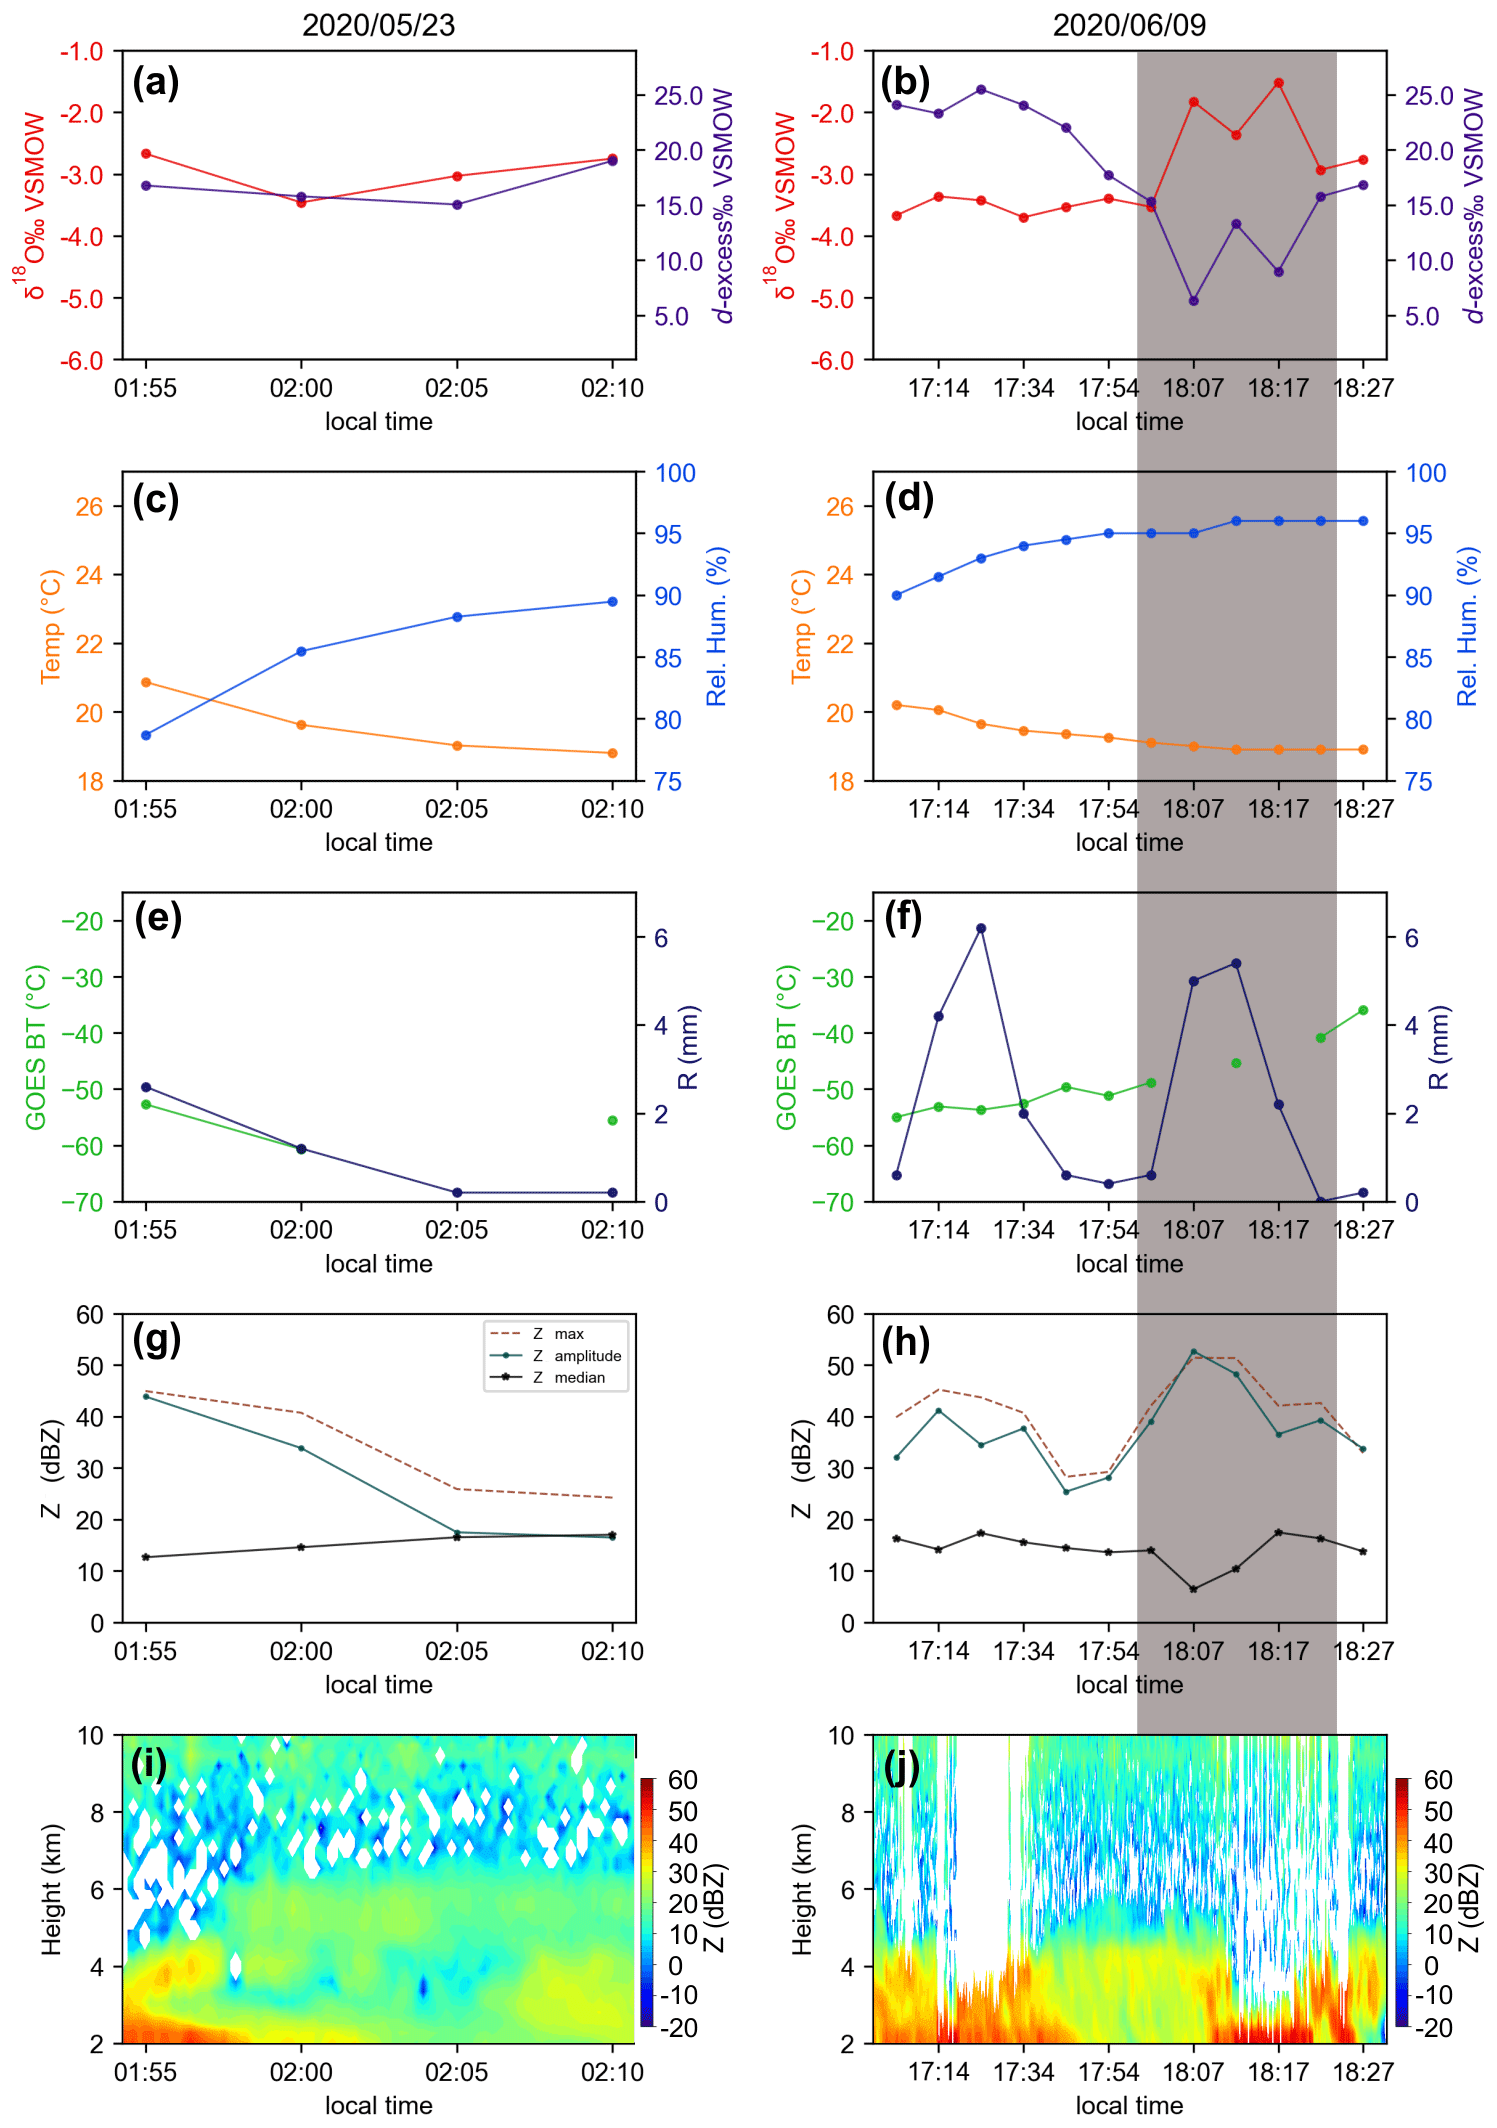
Autumn events show distinct isotopic patterns. The 23 May 2020 event exhibited a small isotopic (δ18O: −2.6 ∼ −2.7 ‰, d-excess: +16.7 ∼ +19.0 ‰) and meteorological (declining T, R, and Z parameters during the event) variation (Fig. 7). On 9 June 2020 (Fig. 7) two isotopic distribution patterns were recorded, with minimal (δ18O: −3.6 ∼ −3.4 ‰, d-excess: +26.4 ∼ +17.7 ‰) and large (δ18O: −1.5 ∼ −2.9 ‰; d-excess: +15.3 ∼ +6.3 ‰) variations, corresponding to high RH, R, Zampl, and Zmax (grey bands in Fig. 8). Strong and significant (p < 0.05) correlations were observed between δ18O-RH (r = 0.5), δ18O-T (r = −0.6), d-excess-RH (r = −0.6), d-excess-T (r = 0.7), and d-excess-Zampl (r = −0.5) on 9 June 2020. However, no significant correlations were found during the event on 23 May 2020.
Distinctive isotopic patterns were also found during spring events. On 5 November 2019, a change in the vertical profile and Z parameters was observed (grey bands in Fig. 8), with a shift in δ18O from maximum depletion (−4.1 ‰) to enrichment at the end of the event (−3.2 ∼ −1.7 ‰). On 18 November 2020, there was a gradual decrease observed in δ18O (−2.7 ∼ −5.4 ‰) and an increase in d-excess (+10.2 ∼ +23.1 ‰). The latter was accompanied by a progressive increase in RH, decrease in T, and constant Zmedian values (Fig. 8). On 5 November 2019 strong and significant (p < 0.005) correlations were observed between δ18O and Z (r = −0.7), w (r = −0.7), Zmax (r = −0.7), and Zampl (r = −0.6) and between d-excess and RH (r = −0.7), T (r = 0.8), w (r = 0.6), Zampl (r = 0.5), and Zmedian (r = −0.5). For 18 November 2020, significant correlations were obtained between δ18O-RH (r = −0.5), δ18O-T (r = 0.7), and d-excess-Zampl (r = 0.7).
Detailed evaluations of the isotopic variability in convective rainfall were provided at both inter- and intra-event scales. The key regional and local controls on the isotopic composition of convective rainfall can be divided into two groups: (i) rainfall produced by different moisture source region(s), represented by inter-event isotopic values, and (ii) local effects associated with vertical rainfall structure and surface meteorological conditions. In the summer, thermal conditions dominate convective processes. During autumn and spring, convective rainfall was associated with frontal systems (Fig. 2). In this regard, δwgd values better constrained the large-scale processes (such as vapor origin, convective activity, and weather systems) with stronger rainfall amount dependencies. The individual isotopic patterns influenced by local effects revealed microphysical processes such as coalescence (i.e., higher concentration of raindrops with high Z values) that are often masked by weighted averages and long-term averages during the evolution of individual precipitation systems.
4.1 Regional atmospheric controls
Regional aspects of atmospheric moisture transport to Rio Claro were illustrated in HYSPLIT backward trajectories (Fig. 3) and maps of vertically integrated moisture flux across the region (Fig. 4). Most moist air masses arriving at Rio Claro during summer exhibited a common origin in the equatorial Atlantic Ocean and were subjected to a long rainfall rainout, extending over several thousand kilometers. Along this pathway, air masses interacted with the Amazon forest. Intensive moisture recycling resulted in a small continental isotope gradient across the Amazon forest (Salati et al., 1979; Rozanski et al., 1993) and elevated d-excess (Gat and Matsui, 1991). At Rio Claro, the arriving air masses are depleted in heavy isotopes (δwgd ≤ −10.0 ‰) due to rainout along the trajectories (≥ 78 mm), with consistent dwgd > +14.0 ‰, inherited through the interaction of maritime moisture with the Amazon forest. In contrast, the summer event on 24 February 2021 was influenced by oceanic moisture and had a short trajectory compared to other typical summer events. The convective events during the spring and autumn seasons exhibited substantially shorter trajectories, suggesting that the atmospheric “pump” transporting moisture from the equatorial Atlantic Ocean to the Amazon forest was much weaker or non-existent during this time of the year. These short trajectories suggest enhanced evapotranspiration of source moisture for rainfall (Salati et al., 1979; Risi et al., 2013; Gat and Matsui, 1991; Worden et al., 2007; Brown et al., 2008; Levin et al., 2009; Worden et al., 2021). As a result, these trajectories were characterized by a reduction in the amount of rainfall along the trajectories and enriched δ18Owgd = ≥ −4.2 ‰ and higher dwgd = ≥ +16.5 ‰. In addition, the highest dwgd (+23.3 ‰) observed on 5 November 2019 was characterized by a continental moisture trajectory circling around Rio Claro (Fig. 3c) over a greater RH gradient (e.g., sugarcane crop regions) (da Silva et al., 2021). Evaporation from soil increases kinetic fractionation, favoring the evaporation of HDO due to high diffusivity, resulting in strong d-excess changes (Risi et al., 2013).
4.2 Local atmospheric controls
In deep convection, precipitation particles primarily grow through the collection of water (known as coalescence) by larger droplets and ice particles (known as riming). These larger particles sweep water from the cloud on their falling paths in the presence of strong rising air currents. As a parcel of rising air ascends, the growing particles within it move until they become large enough to fall relative to the air. As the air parcel ascends, particles fall out at each successive height. The remaining lighter particles disperse laterally over a larger area due to the diverging airflow. Convective air movements create concentrated reflectivity peaks in the radar pattern because most of the precipitation mass falls within a few kilometers of the updraft centers (Houghton, 1968; Houze, 1997). The irregular blank bands visible in the vertical MRR profiles (Fig. 5) could be attributed to the lateral dispersion of remaining particles. The concentrated high reflectivity values (Fig. 5) illustrate this pattern, which typically occurs close to the surface and indicates the occurrence of Zmax.
Variations in the isotopic composition of the rainfall reflect changes in this mechanism of raindrop formation (Sun et al., 2022; Aggarwal et al., 2016). This is shown by the vertical variation in the Z values of the events on 10 February 2020, 24 February 2021, 9 June 2020, and 5 November 2019 (grey band in Figs. 6– 8). A possible reason for this change is that the process of coalescence during the fall of raindrops towards the surface may have been altered. This can be seen in the higher Zampl values (40 ∼ 50 dBZ), which suggest that water particles were being incorporated into the raindrop during the fall at the surface, resulting in a larger water particle and consequently a higher concentration in the raindrops and the occurrence of Zmax close to the surface. The δ18O values generally increased, while the d-excess decreased, resulting in a change in the isotopic variation pattern, reflecting the diffusive exchange process between the surrounding vapor and the raindrops (Gedzelman and Lawrence, 1990; Celle-Jeanton et al., 2004). In contrast, the isotopic pattern of the events on 1 February 2020 (Fig. 5), 30 January 2020 (Fig. 5), and 23 May 2020 (Fig. 7) exhibited small variation due to the low variability in Z values. Therefore, the main local control on the isotopic variability of intra-events corresponded to the vertical structure of the rainfall event.
The d-excess values decreased and the δ18O values increased at the end of the events on 1 February 2020, 24 February 2021, and 10 February 2020 (dotted black cycle in Figs. 5a and 6a, b, respectively). This was due to the formation of residual rainfall at low altitudes and a decrease in rainfall intensity during the dissipation phase of the convective cell. On 18 November 2020 (Fig. 8b), the δ18O values constantly decreased, illustrating a typical depletion of heavy isotopes based on Rayleigh distillation processes due to the progressive condensation of convective systems. Previous studies have widely observed these mechanisms during intra-events, and both interpretations are supported (Adar et al., 1991; Coplen et al., 2008, 2015; Barras and Simmonds, 2009; Celle-Jeanton et al., 2004; Muller et al., 2015).
This study used high-frequency isotopic composition of rainfall as well as meteorological data to investigate the regional and local mechanisms controlling the isotopic characteristics of convective precipitation. Based on the inter-event analysis, the regional isotopic characteristics are different between summer and autumn–spring seasons. The δwgd is determined by moisture transport mechanisms and convection features. The main factors are the gradual reduction in heavy isotopes along moisture trajectories. The rainfall produced along these tracks was pronounced during summer events, associated with the longer moisture transport pathway from the Amazon forest, producing depleted isotope values. In contrast, reduced autumn and spring rainfall along trajectories is associated with a shorter moisture transport pathway from the Atlantic Ocean and southern Brazil. This produces enriched isotope characteristics and high dwgd values associated with transpiration and soil evaporation along the moisture transport pathway.
Within convective events, the regional δwgd signature was altered by local effects, as shown by the intra-event isotopic evolution. The vertical structure of rainfall, described by the Z parameters in the vertical MRR profile, is the main local control. During the fall of raindrops, a microphysical change can cause a vertical change in Z values, resulting in abrupt variations in isotopic patterns. These findings were supported by significant and strong correlations between the MRR and isotopic parameters in each event. Therefore, the isotopic composition of convective rainfall is controlled by an interplay of regional and local factors. The complex and dynamic conditions of convective rainfall formation across the tropics can be understood using high-frequency analysis. Although high-frequency rainfall sampling is logistically difficult, we encourage future studies of this type in different geographical regions across the tropics to better understand the factors controlling the isotopic composition of convective rainfall during rainy periods. Extensive monitoring of local meteorological parameters and modeling of regional moisture transport to the rainfall collection site, along with the application of more robust below-cloud models, should accompany such studies.
A complete database (isotope characteristics of rainfall as well as selected meteorological parameters characterizing these events) is available at https://doi.org/10.17632/kk3gs8zn4s.1 (dos Santos et al., 2024). Monthly GNIP data are available at https://www.iaea.org/services/networks/gnip (IAEA, 2022). GOES-16 imageries are available at https://home.chpc.utah.edu/~u0553130/Brian_Blaylock/cgi-bin/goes16_download.cgi (University of Utah, 2020). The weather systems are available at https://www.marinha.mil.br/chm/dados-do-smm-cartas-sinoticas/cartas-sinoticas (Navy Hydrographic Centre/Marine Meteorological Service, 2022). Reanalysis data are available at https://cds.climate.copernicus.eu/cdsapp#!/home (Copernicus Climate Change Service, 2022). Global Modeling and Assimilation Office (GMAO) data are available at https://doi.org/10.5067/7MCPBJ41Y0K6 (NASA, 2022). Goddard Earth Sciences Data and Information Services Center (GES DISC) data are available at https://doi.org/10.5067/UO3Q64CTTS1U (AIRS project, 2019).
VdS collected rain samples, processed meteorological data, prepared the figures, wrote the main text, and interpreted and discussed the data. DG reviewed, evaluated, interpreted, and discussed the data. AMDQ reviewed, interpreted, and discussed the data. RSM determined the isotopic data, wrote and reviewed the paper, and interpreted and discussed the data. KR wrote and reviewed the paper and interpreted and discussed the data. OK interpreted and discussed the data. DdAQ processed the radar data.
The contact author has declared that none of the authors has any competing interests.
Publisher's note: Copernicus Publications remains neutral with regard to jurisdictional claims made in the text, published maps, institutional affiliations, or any other geographical representation in this paper. While Copernicus Publications makes every effort to include appropriate place names, the final responsibility lies with the authors.
FAPESP support for the scholarship provided under grant nos. 2019/03467-3 and 2021/10538-4 is acknowledged. Ana María Durán-Quesada acknowledges the time for analysis and writing provided under the UCR C1038 project. The authors acknowledge Troy Gilmore for English language revision of a previous version of the paper.
This work was funded by the São Paulo Research Foundation (FAPESP (grant no. 2018/06666-4)) and by the International Atomic Energy Agency (grant no. CRP-F31006).
This paper was edited by Thijs Heus and reviewed by three anonymous referees.
Adar, E. M., Karnieli, A., Sandler, B. Z., Issar, A., Wolf, M., and Landsman, L.: A mechanical sequential rain sampler for isotopic and chemical analysis, Final Scientific Rep., Contract 5542/RO/Rb, IAEA, Vienna, Austria, 32 pp., 1991.
Adler, R. F. and Fenn, D. D.: Thunderstorm vertical velocities estimated from satellite data, American, 36, 1747–1754, https://doi.org/10.1175/1520-0469(1979)036,1747:TVVEFS.2.0.CO;2, 1979.
Adler, R. F. and Mack, R. A.: Thunderstorm cloud top dynamics as inferred from satellite observations and a cloud top parcel model, Am. Meteorol. Soc., 43, 1945–1960, https://doi.org/10.1175/1520-0469(1986)043,1945:TCTDAI.2.0.CO;2, 1986.
Aemisegger, F., Spiegel, J. K., Pfahl, S., Sodemann, H., Eugster, W., and Wernli, H.: Isotope meteorology of cold front passages: A case study combining observations and modeling, Geophys. Res. Lett., 42, 5652–5660, https://doi.org/10.1002/2015GL063988, 2015.
Aggarwal, P. K., Romatschke, U., Araguas-Araguas, L., Belachew, D., Longstaffe, F. J., Berg, P., Schumacher, C., and Funk, A.: Proportions of convective and stratiform precipitation revealed in water isotope ratios, Nat. Geosci., 9, 624–629, https://doi.org/10.1038/ngeo2739, 2016.
AIRS project: Aqua/AIRS L3 Daily Standard Physical Retrieval (AIRS-only) 1 degree ×1 degree V7.0, Greenbelt, MD, USA, Goddard Earth Sciences Data and Information Services Center (GES DISC) [data set], https://doi.org/10.5067/UO3Q64CTTS1U, 2019.
Barras, V. and Simmonds, I.: Observation and modeling of stable water isotopes as diagnostics of rainfall dynamics over southeastern Australia, J. Geophys. Res.-Atmos., 114, 1–17, https://doi.org/10.1029/2009JD012132, 2009.
Bony, S., Risi, C., and Vimeux, F.: Influence of convective processes on the isotopic composition (δ18O and δD) of precipitation and water vapor in the tropics: 1. Radiative-convective equilibrium and Tropical Ocean–Global Atmosphere–Coupled Ocean-Atmosphere Response Experiment (TOGA-CO, J. Geophys. Res.-Atmos., 113, 1–21, https://doi.org/10.1029/2008JD009942, 2008.
Breugem, A. J., Wesseling, J. G., Oostindie, K., and Ritsema, C. J.: Meteorological aspects of heavy precipitation in relation to floods – An overview, Earth-Sci. Rev., 204, 103171, https://doi.org/10.1016/j.earscirev.2020.103171, 2020.
Brown, D., Worden, J., and Noone, D.: Comparison of atmospheric hydrology over convective continental regions using water vapor isotope measurements from space, J. Geophys. Res.-Atmos., 113, 1–17, https://doi.org/10.1029/2007JD009676, 2008.
Bruning, E., Tillier, C. E., Edgington, S. F., Rudlosky, S. D., Zajic, J., Gravelle, C., et al.: Meteorological imagery for thegeostationary lightning mapper, J. Geophys. Res.-Atmos., 124, 14258–14,309, https://doi.org/10.1029/2019JD030874, 2019.
Celle-Jeanton, H., Gonfiantini, R., Travi, Y., and Sol, B.: Oxygen-18 variations of rainwater during precipitation: application of the Rayleigh model to selected rainfalls in Southern France, J. Hydrol., 289, 165–177, https://doi.org/10.1016/j.jhydrol.2003.11.017, 2004.
Copernicus Climate Change Service: ERA5 hourly data on single levels from 1940 to present, https://cds.climate.copernicus.eu/cdsapp#!/home (last access: December 2022), 2022.
Coplen, T. B., Neiman, P. J., White, A. B., Landwehr, J. M., Ralph, F. M., and Dettinger, M. D.: Extreme changes in stable hydrogen isotopes and precipitation characteristics in a landfalling Pacific storm, Geophys. Res. Lett., 35, L21808, https://doi.org/10.1029/2008GL035481, 2008.
Coplen, T. B., Neiman, P. J., White, A. B., Ralph, F. M., Coplen, T. B., Neiman, P. J., White, A. B., and Ralph, F. M.: Categorisation of northern California rainfall for periods with and without a radar brightband using stable isotopes and a novel automated precipitation collector Categorisation of northern California rainfall, Tellus B, 76, 28574, https://doi.org/10.3402/tellusb.v67.28574, 2015.
da Silva, G. J., Berg, E. C., Calijuri, M. L., dos Santos, V. J., Lorentz, J. F., and Carmo Alves, S. do: Aptitude of areas planned for sugarcane cultivation expansion in the state of São Paulo, Brazil: a study based on climate change effects, Agriculture, Ecosystems & Environment, 305, 107164, https://doi.org/10.1016/j.agee.2020.107164, 2021.
Dansgaard, W.: Stable isotopes in precipitation, Tellus, 16, 436–468, https://doi.org/10.3402/tellusa.v16i4.8993, 1964.
de Vries, A. J., Aemisegger, F., Pfahl, S., and Wernli, H.: Stable water isotope signals in tropical ice clouds in the West African monsoon simulated with a regional convection-permitting model, Atmos. Chem. Phys., 22, 8863–8895, https://doi.org/10.5194/acp-22-8863-2022, 2022.
Donat, M. G., Alexander, L. V., Yang, H., Durre, I., Vose, R., Dunn, R. J. H., Willett, K. M., Aguilar, E., Brunet, M., Caesar, J., Hewitson, B., Jack, C., Klein Tank, A. M. G., Kruger, A. C., Marengo, J., Peterson, T. C., Renom, M., Oria Rojas, C., Rusticucci, M., Salinger, J., Elrayah, A. S., Sekele, S. S., Srivastava, A. K., Trewin, B., Villarroel, C., Vincent, L. A., Zhai, P., Zhang, X., and Kitching, S.: Updated analyses of temperature and precipitation extreme indices since the beginning of the twentieth century: The HadEX2 dataset, J. Geophys. Res.-Atmos., 118, 2098–2118, https://doi.org/10.1002/jgrd.50150, 2013.
dos Santos, V., Sánchez-Murillo, R., and Gastmans, D.: High-frequency stratiform and convective rainfall isotope and meteorological database from Rio Claro, Brazil, Mendeley Data, V1, 2024, https://doi.org/10.17632/kk3gs8zn4s.1, 2024.
Endries, J. L., Perry, L. B., Yuter, S. E., Seimon, A., Andrade-Flores, M., Winkelmann, R., Quispe, N., Rado, M., Montoya, N., Velarde, F., and Arias, S.: Radar-observed characteristics of precipitation in the tropical high andes of Southern Peru and Bolivia, J. Appl. Meteorol. Clim., 57, 1441–1458, https://doi.org/10.1175/JAMC-D-17-0248.1, 2018.
Froehlich, K., Gibson, J. J., and Aggarwal, P. K.: Deuterium excess in precipitation and its climatological significance, International Atomic Energy Agency (IAEA), Report IAEA-CSP–13/P, 10, 54–66, https://inis.iaea.org/search/search.aspx?orig_q=RN:34017972 (last access: October 2022), 2002.
Gadgil, S.: The Indian monsoon and its variability, Annu. Rev. Earth Pl. Sc., 31, 429–467, https://doi.org/10.1146/annurev.earth.31.100901.141251, 2003.
Galewsky, J., Schneider, M., Diekmann, C., Semie, A., Bony, S., Risi, C., Emanuel, K., and Brogniez, H.: The influence of convective aggregation on the stable isotopic composition of water vapor, AGU Advances, 4, 1–16, https://doi.org/10.1029/2023AV000877, 2023.
García-Santos, S., Sánchez-Murillo, R., Peña-Paz, T., Chirinos-Escobar, M. J., Hernández-Ortiz, J. O., Mejía-Escobar, E. J., and Ortega, L.: Water stable isotopes reveal a complex rainfall to groundwater connectivity in central Honduras, Sci. Total Environ., 844, https://doi.org/10.1016/j.scitotenv.2022.156941, 2022.
Garreaud, R. D.: Cold air incursions over subtropical South America: Mean structure and dynamics, Mon. Weather Rev., 128, 2544–2559, https://doi.org/10.1175/1520-0493(2000)128<2544:caioss>2.0.co;2, 2000.
Gat, J. R. and Matsui, E.: Atmospheric water balance in the Amazon Basin: An isotopic evapotranspiration model, J. Geophys. Res., 96, 13179–13188, https://doi.org/10.1029/91JD00054, 1991.
Gedzelman, S. D. and Lawrence, J. R.: The Isotopic Composition of Precipitatin from Two Extratropical Cyclones, Am. Meteorol. Soc., 118, 495–509, https://doi.org/10.1175/1520-0493(1990)118<0495:TICOPF>2.0.CO;2, 1990.
Gimeno, L., Drumond, A., Nieto, R., Trigo, R. M., and Stohl, A.: On the origin of continental precipitation, Geophys. Res. Lett., 37, 1–7, https://doi.org/10.1029/2010GL043712, 2010.
Gimeno, L., Vázquez, M., Eiras-Barca, J., Sorí, R., Stojanovic, M., Algarra, I., Nieto, R., Ramos, A. M., Durán-Quesada, A. M., and Dominguez, F.: Recent progress on the sources of continental precipitation as revealed by moisture transport analysis, Earth-Sci. Rev., 201, 103070, https://doi.org/10.1016/j.earscirev.2019.103070, 2020.
Graf, P., Wernli, H., Pfahl, S., and Sodemann, H.: A new interpretative framework for below-cloud effects on stable water isotopes in vapour and rain, Atmos. Chem. Phys., 19, 747–765, https://doi.org/10.5194/acp-19-747-2019, 2019.
Han, X., Lang, Y., Wang, T., Liu, C.-Q., Li, F., Wang, F., Guo, Q., Li, S., Liu, M., Wang, Y., and Xu, A.: Temporal and spatial variations in stable isotopic compositions of precipitation during the typhoon Lekima (2019), China, Sci. Total Environ., 762, 143143, https://doi.org/10.1016/j.scitotenv.2020.143143, 2021.
Houghton, H. G.: On Precipitation Mechanisms and their Artificial Modification, J. Appl. Meteorol., 7, 851–859, https://doi.org/10.1175/1520-0450(1968)007<0851:OPMATA>2.0.CO;2, 1968.
Houze, R. A.: Mesoscale Convective Systems, International Geophysics, 104, 237–286, https://doi.org/10.1016/B978-0-12-374266-7.00009-3, 2004.
Houze, R. A. J.: Observed structure of mesoscale convective systems and implications for large-scale heating, Q. J. Roy. Meteor. Soc., 115, 425–461, 1989.
Houze, R. A. J.: Cloud dynamics, Academic Press Limited, International Geophysics 53, Academic Press, https://doi.org/10.1016/0377-0265(87)90017-0, 573 pp., 1993.
Houze, R. A. J.: Stratiform precipitation in regions of convection: A Meteorological Paradox?, B. Am. Meteorol. Soc., 78, 2179–2195, 1997.
IAEA: International Atomic Energy Agency, Global Network of Isotopes in Precipitation (GNIP), https://www.iaea.org/services/networks/gnip (last access: November 2022), 2022.
IPCC: Climate Change 2021: The Physical Science Basis. Contribution of Working Group I to the Sixth Assessment Report of the Intergovernmental Panel on Climate Change, edited by: Masson-Delmotte, V., Zhai, P., Pirani, A., Connors, S. L., Péan, C., Berger, S., Caud, N., Chen, Y., Goldfarb, L., Gomis, M. I., Huang, M., Leitzell, K., Lonnoy, E., Matthews, J. B. R., Maycock, T. K., Waterfield, T., Yelekçi, O., Yu, R., and Zhou, B., Cambridge University Press, Cambridge, United Kingdom and New York, NY, USA, in press, https://doi.org/10.1017/9781009157896, 2021.
Jeelani, G., Deshpande, R. D., Galkowski, M., and Rozanski, K.: Isotopic composition of daily precipitation along the southern foothills of the Himalayas: impact of marine and continental sources of atmospheric moisture, Atmos. Chem. Phys., 18, 8789–8805, https://doi.org/10.5194/acp-18-8789-2018, 2018.
Kastman, J., Market, P., Fox, N., Foscato, A., and Lupo, A.: Lightning and rainfall characteristics in elevated vs. surface based convection in the midwest that produce heavy rainfall, Atmosphere, 8, 36, https://doi.org/10.3390/atmos8020036, 2017.
Klaassen, W.: Radar Observations and Simulation of the Melting Layer of Precipitation, J. Atmos. Sci., 45, 3741–3753, 1988.
Kodama, Y.: Large-scale common features of subtropical precipitation zones (the Baiu Frontal Zone, the SPCZ, and the SACZ) Part I: Characteristics of subtropical frontal zones, J. Meteorol. Soc. Jpn., 70, 813–836, https://doi.org/10.2151/jmsj1965.70.4_813, 1992.
Kurita, N.: Water isotopic variability in response to mesoscale convective system over the tropical ocean, J. Geophys. Res.-Atmos., 118, 10376–10390, https://doi.org/10.1002/jgrd.50754, 2013.
Kurita, N., Ichiyanagi, K., Matsumoto, J., Yamanaka, M. D., and Ohata, T.: The relationship between the isotopic content of precipitation and the precipitation amount in tropical regions, J. Geochem. Explor., 102, 113–122, https://doi.org/10.1016/j.gexplo.2009.03.002, 2009.
Lacour, J. L., Risi, C., Worden, J., Clerbaux, C., and Coheur, P. F.: Importance of depth and intensity of convection on the isotopic composition of water vapor as seen from IASI and TES δD observations, Earth Planet. Sc. Lett., 481, 387–394, https://doi.org/10.1016/j.epsl.2017.10.048, 2018.
Landais, A., Agosta, C., Vimeux, F., Magand, O., Solis, C., Cauquoin, A., Dutrievoz, N., Risi, C., Leroy-Dos Santos, C., Fourré, E., Cattani, O., Jossoud, O., Minster, B., Prié, F., Casado, M., Dommergue, A., Bertrand, Y., and Werner, M.: Abrupt excursion in water vapor isotopic variability during cold fronts at the Pointe Benedicte observatory in Amsterdam Island, EGUsphere [preprint], https://doi.org/10.5194/egusphere-2023-1617, 2023.
Lawrence, J. R., Gedzelman, S. D., Dexheimer, D., Cho, H., Carrie, G. D., Gasparini, R., Anderson, C. R., Bowman, K. P., and Biggerstaff, M. I.: Stable isotopic composition of water vapor in the tropics, J. Geophys. Res.-Atmos., 109, 16, https://doi.org/10.1029/2003JD004046, 2004.
Lee, J. and Fung, I.: “Amount effect” of water isotopes and quantitative analysis of post-condensation processes, Hydrol. Process., 22, 1–8, https://doi.org/10.1002/hyp.6637, 2008.
Lekshmy, P. R., Midhun, M., Ramesh, R., and Jani, R. A.: 18O depletion in monsoon rain relates to large scale organized convection rather than the amount of rainfall, Sci. Rep.-UK, 4, 1–5, https://doi.org/10.1038/srep05661, 2014.
Levin, N. E., Zipser, E. J., and Ceding, T. E.: Isotopic composition of waters from Ethiopia and Kenya: Insights into moisture sources for eastern Africa, J. Geophys. Res.-Atmos., 114, 1–13, https://doi.org/10.1029/2009JD012166, 2009.
Lima, K. C., Satyamurty, P., and Fernández, J. P. R.: Large-scale atmospheric conditions associated with heavy rainfall episodes in Southeast Brazil, Theor. Appl. Climatol., 101, 121–135, https://doi.org/10.1007/s00704-009-0207-9, 2010.
Luiz Silva, W., Xavier, L. N. R., Maceira, M. E. P., and Rotunno, O. C.: Climatological and hydrological patterns and verified trends in precipitation and streamflow in the basins of Brazilian hydroelectric plants, Theor. Appl. Climatol., 137, 353–371, https://doi.org/10.1007/s00704-018-2600-8, 2019.
Machado, L. A. T. and Rossow, W. B.: Structural Characteristics and Radiative Properties of Tropical Cloud Clusters, Mon. Weather Rev., 121, 3234–3260, 1993.
Machado, L. A. T., Rossow, W. B., Guedes, R. L., and Walker, A. W.: Life cycle variations of mesoscale convective systems over the Americas, Mon. Weather Rev., 126, 1630–1654, https://doi.org/10.1175/1520-0493(1998)126<1630:LCVOMC>2.0.CO;2, 1998.
Marengo, J. A., Soares, W. R., Saulo, C., and Nicolini, M.: Climatology of the low-level jet east of the Andes as derived from the NCEP-NCAR reanalyses: Characteristics and temporal variability, J. Climate, 17, 2261–2280, https://doi.org/10.1175/1520-0442(2004)017<2261:COTLJE>2.0.CO;2, 2004.
Marengo, J. A., Ambrizzi, T., Alves, L. M., Barreto, N. J. C., Simões Reboita, M., and Ramos, A. M.: Changing Trends in Rainfall Extremes in the Metropolitan Area of São Paulo: Causes and Impacts, Frontiers in Climate, 2, 1–13, https://doi.org/10.3389/fclim.2020.00003, 2020.
Marengo, J. A., Camarinha, P. I., Alves, L. M., Diniz, F., and Betts, R. A.: Extreme Rainfall and Hydro-Geo-Meteorological Disaster Risk in 1.5, 2.0, and 4.0 °C Global Warming Scenarios: An Analysis for Brazil, Frontiers in Climate, 3, 1–17, https://doi.org/10.3389/fclim.2021.610433, 2021.
Mehta, S., Mehta, S. K., Singh, S., Mitra, A., Ghosh, S. K., and Raha, S.: Characteristics of the Z–R Relationships Observed Using Micro Rain Radar (MRR-2) over Darjeeling (27.05° N, 88.26° E): A Complex Terrain Region in the Eastern Himalayas, Pure Appl. Geophys., 177, 4521–4534, https://doi.org/10.1007/s00024-020-02472-6, 2020.
Moerman, J. W., Cobb, K. M., Adkins, J. F., Sodemann, H., Clark, B., and Tuen, A. A.: Diurnal to interannual rainfall δ18O variations in northern Borneo driven by regional hydrology, Earth Planet. Sc. Lett., 369–370, 108–119, https://doi.org/10.1016/j.epsl.2013.03.014, 2013.
Muller, C. L., Baker, A., Fairchild, I. J., Kidd, C., and Boomer, I.: Intra-Event Trends in Stable Isotopes: Exploring Midlatitude Precipitation Using a Vertically Pointing Micro Rain Radar, J. Hydrometeorol., 16, 194–213, https://doi.org/10.1175/JHM-D-14-0038.1, 2015.
Munksgaard, N. C., Kurita, N., Sánchez-Murillo, R., Ahmed, N., Araguas, L., Balachew, D. L., Bird, M. I., Chakraborty, S., Kien Chinh, N., Cobb, K. M., Ellis, S. A., Esquivel-Hernández, G., Ganyaglo, S. Y., Gao, J., Gastmans, D., Kaseke, K. F., Kebede, S., Morales, M. R., Mueller, M., Poh, S. C., Santos, V. dos, Shaoneng, H., Wang, L., Yacobaccio, H., and Zwart, C.: Data Descriptor: Daily observations of stable isotope ratios of rainfall in the tropics, Sci. Rep.-UK, 9, 1–7, https://doi.org/10.1038/s41598-019-50973-9, 2019.
NASA (National Aeronautics and Space Administration): Goddard Earth Sciences Data and Information Services Center (GES DISC) [data set], https://doi.org/10.5067/7MCPBJ41Y0K6, 2022.
Navy Hydrographic Centre/Marine Meteorological Service: Centro de Higrografia da Marinha, Cartas Sinóticas, Governo Federal Brasil [data set], https://www.marinha.mil.br/chm/dados-do-smm-cartas-sinoticas/cartas-sinoticas (last access: December 2022), 2022.
R Core Team: A language and environment for statistical computing, R Foundation for Statistical Computing, Vienna, Austria, https://www.R-project.org/ (last access: December 2022), 2024.
Rao, N. T., Kirankumar, N. V. P., Radhakrishna, B., and Rao, N. D.: Classification of tropical precipitating systems using wind profiler spectral moments. Part I: Algorithm description and validation, J. Atmos. Ocean. Tech., 25, 884–897, https://doi.org/10.1175/2007JTECHA1031.1, 2008.
Ribeiro, B. Z., Machado, L. A. T., Biscaro, T. S., Freitas, E. D., Mozer, K. W., and Goodman, S. J.: An evaluation of the GOES-16 rapid scan for nowcasting in southeastern brazil: Analysis of a severe hailstorm case, Weather Forecast., 34, 1829–1848, https://doi.org/10.1175/WAF-D-19-0070.1, 2019.
Risi, C., Bony, S., and Vimeux, F.: Influence of convective processes on the isotopic composition (δ18O and δD) of precipitation and water vapor in the tropics: 2. Physical interpretation of the amount effect, J. Geophys. Res.-Atmos., 113, 1–12, https://doi.org/10.1029/2008JD009943, 2008.
Risi, C., Bony, S., Vimeux, F., Chongd, M., and Descroixe, L.: Evolution of the stable water isotopic composition of the rain sampled along sahelian squall lines, Q. J. Roy. Meteor. Soc., 136, 227–242, https://doi.org/10.1002/qj.485, 2010.
Risi, C., Noone, D., Frankenberg, C., and Worden, J.: Role of continental recycling in intraseasonal variations of continental moisture as deduced from model simulations and water vapor isotopic measurements, Water Resour. Res., 49, 4136–4156, https://doi.org/10.1002/wrcr.20312, 2013.
Roberts, R. D. and Rutledge, S.: Nowcasting storm initiation and growth using GOES-8 and WSR-88D data, Weather Forecast., 18, 562–584, https://doi.org/10.1175/1520-0434(2003)018<0562:NSIAGU>2.0.CO;2, 2003.
Roca, R. and Fiolleau, T.: Extreme precipitation in the tropics is closely associated with long-lived convective systems, Communications Earth & Environment, 1, 18, https://doi.org/10.1038/s43247-020-00015-4, 2020.
Romatschke, U. and Houze, R. A.: Characteristics of precipitating convective systems accounting for the summer rainfall of tropical and subtropical South America, J. Hydrometeorol., 14, 25–46, https://doi.org/10.1175/JHM-D-12-060.1, 2013.
Rozanski, K., Araguás-Araguás, L., and Gonfiantini, R.: Isotopic Patterns in Modern Global Precipitation, in: Geophysical Monograph Series, edited by: Swart P. K., Lohmann, K. C., McKenzie, J., and Savin, S., American Geophysical Union, ISBN 0-87590-037-2, 1–36, 1993.
Salati, E., Dall'Olio, A., Matsui, E., and Gat, J. R.: Recycling of water in the Amazon Basin: An isotopic study, Water Resour. Res., 15, 1250–1258, https://doi.org/10.1029/WR015i005p01250, 1979.
Sánchez-Murillo, R., Durán-Quesada, A. M., Birkel, C., Esquivel-Hernández, G., and Boll, J.: Tropical precipitation anomalies and d-excess evolution during El Niño 2014-16, Hydrol. Process., 31, 956–967, https://doi.org/10.1002/hyp.11088, 2017.
Sánchez-Murillo, R., Durán-Quesada, A. M., Esquivel-Hernández, G., Rojas-Cantillano, D., Birkel, C., Welsh, K., Sánchez-Llull, M., Alonso-Hernández, C. M., Tetzlaff, D., Soulsby, C., Boll, J., Kurita, N., and Cobb, K. M.: Deciphering key processes controlling rainfall isotopic variability during extreme tropical cyclones, Nat. Commun., 10, 1–10, https://doi.org/10.1038/s41467-019-12062-3, 2019.
Schmit, T. J., Griffith, P., Gunshor, M. M., Daniels, J. M., Goodman, S. J., and Lebair, W. J.: A closer look at the ABI on the goes-r series, Bulletin of the Am. Meteorol. Soc., 98, 681–698, https://doi.org/10.1175/BAMS-D-15-00230.1, 2017.
Shapiro, S. S. and Wilk, M. B.: An analysis of variance test for normality (complete samples), Biometrika, 53, 591–611, 1965.
Siqueira, J. R. and Machado, L. A. T.: Influence of the frontal systems on the day-to-day convection variability over South America, J. Climate, 17, 1754–1766, https://doi.org/10.1175/1520-0442(2004)017<1754:IOTFSO>2.0.CO;2, 2004.
Siqueira, J. R., Rossow, W. B., Machado, L. A. T., and Pearl, C.: Structural characteristics of convective systems over South America related to cold-frontal incursions, Mon. Weather Rev., 133, 1045–1064, https://doi.org/10.1175/MWR2888.1, 2005.
Soderberg, K., Good, S. P., O'connor, M., Wang, L., Ryan, K., and Caylor, K. K.: Using atmospheric trajectories to model the isotopic composition of rainfall in central Kenya, Ecosphere, 4, 1–18, https://doi.org/10.1890/ES12-00160.1, 2013.
Stein, A. F., Draxler, R. R., Rolph, G. D., Stunder, B. J. B., Cohen, M. D., and Ngan, F.: Noaa's hysplit atmospheric transport and dispersion modeling system, Bulletin of the Am. Meteorol. Soc., 96, 2059–2077, https://doi.org/10.1175/BAMS-D-14-00110.1, 2015.
Steiner, M. and Smith, J. A.: Convective versus stratiform rainfall: An ice-microphysical and kinematic conceptual model, Atmos. Res., 47–48, 317–326, https://doi.org/10.1016/S0169-8095(97)00086-0, 1998.
Sun, C., Shanahan, T. M., and Partin, J.: Controls on the Isotopic Composition of Precipitation in the South-Central United States, J. Geophys. Res.-Atmos., 124, 8320–8335, https://doi.org/10.1029/2018JD029306, 2019.
Sun, C., Tian, L., Shanahan, T. M., Partin, J. W., Gao, Y., Piatrunia, N., and Banner, J.: Isotopic variability in tropical cyclone precipitation is controlled by Rayleigh distillation and cloud microphysics, Communications Earth & Environment, 3, 1–10, https://doi.org/10.1038/s43247-022-00381-1, 2022.
Taupin, J.-D., Gallaire, R., and Arnaud, Y.: Analyses isotopiques et chimiques des précipitations sahélienne de la région de Niamey au Niger: implications climatologiques, in: Hydrochemistry, Proceedings of the Rabat Symposium, April 1997, IAHS Publ. no. 244, 151–162, 1997.
Thurnherr, I. and Aemisegger, F.: Disentangling the impact of air–sea interaction and boundary layer cloud formation on stable water isotope signals in the warm sector of a Southern Ocean cyclone, Atmos. Chem. Phys., 22, 10353–10373, https://doi.org/10.5194/acp-22-10353-2022, 2022.
Torri, G.: On the Isotopic Composition of Cold Pools in Radiative-Convective Equilibrium, J. Geophys. Res.-Atmos., 126, 1–20, https://doi.org/10.1029/2020JD033139, 2021.
Tremoy, G., Vimeux, F., Soumana, S., Souley, I., Risi, C., Favreau, G., and Oï, M.: Clustering mesoscale convective systems with laser-based water vapor δ18O monitoring in Niamey (Niger), J. Geophys. Res.-Atmos., 119, 5079–5103, https://doi.org/10.1002/2013JD020968, 2014.
Uijlenhoet, R.: Raindrop size distributions and radar reflectivity–rain rate relationships for radar hydrology, Hydrol. Earth Syst. Sci., 5, 615–628, https://doi.org/10.5194/hess-5-615-2001, 2001.
University of Utah: Department of Atmospheric Science, University of Utah, GOES-16/17/18 on Amazon Download Page, https://home.chpc.utah.edu/~u0553130/Brian_Blaylock/cgi-bin/goes16_download.cgi (last access: December 2022), 2020.
van der Ent, R. J. and Tuinenburg, O. A.: The residence time of water in the atmosphere revisited, Hydrol. Earth Syst. Sci., 21, 779–790, https://doi.org/10.5194/hess-21-779-2017, 2017.
Vila, D. A., Machado, L. A. T., Laurent, H., and Velasco, I.: Forecast and tracking the evolution of cloud clusters (ForTraCC) using satellite infrared imagery: Methodology and validation, Weather Forecast., 23, 233–245, https://doi.org/10.1175/2007WAF2006121.1, 2008.
Worden, J., Noone, D., Bowman, K., Beer, R., Eldering, A., Fisher, B., Gunson, M., Goldman, A., Herman, R., Kulawik, S. S., Lampel, M., Osterman, G., Rinsland, C., Rodgers, C., Sander, S., Shephard, M., Webster, C. R., and Worden, H.: Importance of rain evaporation and continental convection in the tropical water cycle, Nature, 445, 528–532, https://doi.org/10.1038/nature05508, 2007.
Worden, S., Fu, R., Chakraborty, S., Liu, J., and Worden, J.: Where Does Moisture Come From Over the Congo Basin?, J. Geophys. Res.-Biogeo., 126, 1–14, https://doi.org/10.1029/2020JG006024, 2021.
World Meteorological Organization: WMO Atlas of Mortality and Economic Losses From Weather, Climate and Water Extremes (1970–2019), WMO, Geneva 2, Switzerland, 90 pp., ISBN 978-92-63-11267-5, 2021.
Zilli, M. T., Carvalho, L. M. V., Liebmann, B., and Silva Dias, M. A.: A comprehensive analysis of trends in extreme precipitation over southeastern coast of Brazil, Int. J. Climatol., 37, 2269–2279, https://doi.org/10.1002/joc.4840, 2017.
Zwart, C., Munksgaard, N. C., Protat, A., Kurita, N., Lambrinidis, D., and Bird, M. I.: The isotopic signature of monsoon conditions, cloud modes, and rainfall type, Hydrol. Process., 32, 2296–2303, https://doi.org/10.1002/hyp.13140, 2018.