the Creative Commons Attribution 4.0 License.
the Creative Commons Attribution 4.0 License.
 | 06 Jun 2024
Long-term variability in black carbon emissions constrained by gap-filled absorption aerosol optical depth and associated premature mortality in China
Wenxin Zhao
Yu Zhao
Yu Zheng
Dong Chen
Jinyuan Xin
Kaitao Li
Huizheng Che
Zhengqiang Li
Mingrui Ma
Yun Hang
Black carbon (BC) plays an important role in air quality, public health, and climate, but its long-term variations in emissions and health effects have been insufficiently understood for China. Here, we present the spatiotemporal evolution of BC emissions and the associated premature mortality in China during 2000–2020 based on an integrated framework combining satellite observations from the Ozone Monitoring Instrument (OMI), an extreme gradient boosting (XGBoost) algorithm, a “top-down” inversion approach, and an exposure–response model. We found that the “bottom-up” approach most likely underestimated BC emissions, particularly in less developed western and remote areas. Pollution controls were estimated to reduce the annual BC emissions by 26 % during 2010–2020, reversing the 8 % growth during 2000–2010. BC emissions in the main coal-producing provinces declined by 2010 but rebounded afterwards. By contrast, provinces with higher economic and urbanization levels experienced emission growth (0.05–0.10 Mg km−2 yr−1) by 2010 and declined greatly (0.07–0.23 Mg km−2 yr−1) during 2010–2020. The national annual BC-associated premature mortality ranged between 733 910 (95 % confidence interval: 676 790–800 250) and 937 980 cases (864 510–1 023 400) for different years. The changing BC emissions contributed to an increase of 78 590 cases (72 520–85 600) during 2000–2005 and a decrease of 133 360 cases (123 150–145 180) during 2010–2015. Strategies differentiated by region are needed for further reducing BC emissions and their health and climate impacts.
- Article
(13284 KB) - Full-text XML
-
Supplement
(2513 KB) - BibTeX
- EndNote


Black carbon (BC), commonly emitted during incomplete combustion of fossil fuels (Bond et al., 2013; Y. Liu et al., 2022; Shindell et al., 2012), is an important species in airborne fine particulate matter (PM2.5). BC poses greater health risks than total PM2.5 due to its absorption of harmful matters (polycyclic aromatic hydrocarbons and volatile organic compounds) and its penetration abilities (Y. Li et al., 2016; Pani et al., 2020; Wang et al., 2014; Xue et al., 2021), and it is a crucial short-lived climate forcer (Harmsen et al., 2020; Samset et al., 2020). With a large population and high energy consumption, China has become a major contributor of global BC emissions (Lu et al., 2019; Wang et al., 2012) and has suffered from BC-associated climate and health effects since the 2000s (Gu et al., 2020; Y. Liu et al., 2022). Compared with widely measured total PM2.5 across the country (Liang et al., 2020; Zhang et al., 2019), fewer BC data are available from ground observations, and the spatiotemporal coverage of BC concentrations is far less sufficient (Cui et al., 2015; Tao et al., 2017). As a result, the long-term evolution of BC pollution and its associated health burden remain unclear.
Alternatively, satellite observations provide broader spatiotemporal coverage of aerosol-related variables (Schutgens et al., 2021), e.g., aerosol absorption optical depth (AAOD) that reflects light extinction due to light-absorbing aerosols including BC. However, most sensors can only monitor total aerosol information rather than individual components (S. S. Li et al., 2016), and cloud cover and surface reflectance lead to considerable missing values and uncertainty (Liang et al., 2020; Zhang et al., 2015). For example, the Ozone Monitoring Instrument (OMI; Stein-Zweers and Veefkind, 2012; https://disc.gsfc.nasa.gov/datasets/OMAEROe_003/summary, last access: 10 March 2022) and the POLarization and Directionality of the Earth's Reflectance instrument (POLDER; https://www.grasp-open.com, last access: 4 May 2022) provided long-term national average AAOD coverage of 9 %–22 % (2005–2020) and 8 %–12 % (2006–2013) in China, respectively. Satellite-derived AAOD needs to be comprehensively processed to fill gaps in the data and to improve its representativeness of BC before it can be effectively applied.
Complete and reliable emission estimates are essential for diagnosing pollution sources and evaluating the benefits of pollution controls. Compared with species generated largely from industrial and energy infrastructures (e.g., SO2 and NOx), BC emissions are more challenging to estimate, as they are commonly from residential and commercial sources that are more difficult to track (Bond et al., 2013; Li et al., 2017; Zhu et al., 2019). Existing “bottom-up” estimates varied between 0.9 and 2.5 Tg yr−1 during 2000–2020, with inconsistent interannual changing patterns (the Multiresolution Emission Inventory for China (MEIC; Tsinghua University, 2023), the Emissions Database for Global Atmospheric Research (EDGAR; European Commission, 2022), Community Emissions Data System (CEDS; McDuffie et al., 2020), the Peking University Fuel Inventory (PKU-Fuel; Wang et al., 2014), Regional Emission inventory in ASia (REAS; Kurokawa and Ohara, 2020), and others (Lu et al., 2011; Lei et al., 2011; Klimont et al., 2009; Qin and Xie, 2012)). The uncertainty of those estimates reached ±360 % due to diverse and quickly changing manufacturing technologies and emission controls (Streets et al., 2003; Wang et al., 2016). Consequently, chemical transport models (CTMs) often underestimate BC concentrations and AAOD, particularly in Asia, ranging from a factor of 2 to a factor of 10 (L. Chen et al., 2019; Hu et al., 2016; Wang, 2015). To overcome this limitation, “top-down” approaches constraining BC emissions with available observations have been developed and applied to correct BC emissions in China (Cohen and Wang, 2014; Evangeliou et al., 2018; Fu et al., 2012; Guerrette and Henze, 2017; Wang et al., 2013; Zhao et al., 2019). However, restricted by insufficient spatiotemporal coverage, studies were usually conducted for individual years/months and showed considerable discrepancies (Wang et al., 2018; Zhang et al., 2015). Incomplete and inconsistent information could hardly be combined to provide full knowledge of long-term BC emissions. Based on the bottom-up emission estimates with great uncertainty and on CTMs, previous studies have evaluated the BC-associated premature mortality in China for limited years (2000, 2013, and 2016; Cui et al., 2022; Qin et al., 2019; Saikawa et al., 2009; Wang et al., 2021). Moreover, the results showed magnitude discrepancy (50 100–1 436 960 cases), and few analyses have evaluated the long-term spatiotemporal variations and driving forces of BC-associated health effects. The influence of human activities on quickly changing BC emissions and their associated health impact is inadequately or inaccurately understood, weakening science-based decision-making for air pollution control.
Herein, we developed an integrated framework combining available satellite observations, an improved machine learning technique, a top-down inversion approach, and an exposure–response model to obtain a panoramic perspective of China's BC emissions and the associated mortality for the past 2 decades. We first predicted full-coverage monthly AAOD for mainland China during 2000–2020 using an extreme gradient boosting (XGBoost) model. Combining this new dataset with air quality and BC light absorption empirical models, we then improved the top-down inversion technique to estimate the interannual changes in BC emissions. We further calculated the BC-associated premature mortality and attributed its interannual changes to individual driving factors. The outcomes highlight an improved BC emission estimation and the influence of human activities on the long-term evolution of BC emissions and the associated health effects, thereby supporting policies coordinating air quality, health, and climate issues.
2.1 Filling gaps in AAOD data using a machine learning algorithm
We applied the XGBoost model to fill gaps in satellite-derived AAOD data at the monthly level during 2000–2020. XGBoost has been widely used in predicting air pollution and shown to outperform various statistical and machine learning models (Liang et al., 2020; S. Liu et al., 2022; Wang et al., 2023; Xiao et al., 2018). The XGBoost algorithm is an additive model based on hundreds of decision tree models. It first builds multiple classification and regression trees and then integrates these trees as a new tree model using an additive function (Liu et al., 2021). The model continues to iteratively improve, and the new tree model generated in each iteration will fit the residual of the previous tree. The complexity of the ensemble model will gradually increase until the training achieves the best results. Different from the boosting approach of XGBoost, the random forest model fits a set of decision trees, and then a majority vote method is taken for final prediction (Lyu et al., 2019). Generally, the XGBoost model requires less training and prediction time and has better performance than the random forest model. The target domain included mainland China at a horizontal resolution of 0.25° × 0.25° (Fig. S1 in the Supplement).
OMI takes advantage of the near-UV algorithm based on the sensitivity of radiances measured in the atmosphere to the varying aerosol species in order to derive AAOD (Zhang et al., 2017). The algorithm excluded the very low AOD values to reduce the uncertainty of the AAOD retrieval at low AOD values. Previous studies have proven the good agreement between OMI AAOD and Aerosol Robotic Network (AERONET) ground observations, as well as other satellite observations (Ahn et al., 2008; Zhang et al., 2017). Here we used OMI-derived AAOD at 483 nm, obtained from the OMAEROe L3 global aerosol product at a horizontal resolution of 0.25° × 0.25° (Stein-Zweers and Veefkind, 2012; https://disc.gsfc.nasa.gov, last access: 10 March 2022), as the dependent variable for model training and validation. For each grid cell, daily AAOD values for no less than 7 d in a given month were averaged as the monthly AAOD value. Owing to its long service time and damage to the satellite sensor, the original spatial coverage of monthly OMI-derived AAOD ranged from 1 % to 53 % and was commonly lower for later years than earlier years. The multiyear average coverage was relatively low in southern China (< 25 %), attributed to cloud cover and high surface reflectance (Fig. S2).
A total of 24 interpretation variables were selected for model training, including aerosol optical, meteorological, geographic, and temporal parameters (Table S1 in the Supplement). Aerosol optical and meteorological parameters were extracted from the Modern-Era Retrospective analysis for Research and Applications, Version 2 (MERRA-2) dataset at a horizontal resolution of 0.625° × 0.5° (https://disc.gsfc.nasa.gov) to reflect the optical properties, transport, and diffusion of pollutants. Here we use the daily MERRA-2 data because the daily average MERRA-2 data were proved to be more reliable than the hourly data when compared with the observation (Xu et al., 2020). As ancillary variables associated with BC emission sources and transport conditions, land-use data were obtained from the Institute of Geographic Sciences and Natural Resources Research, Chinese Academy of Sciences, at a horizontal resolution of 1 × 1 km (https://www.resdc.cn/DOI/DOI.aspx?DOIID=54, last access: 5 June 2024). The elevation data were obtained from the Shuttle Radar Topography Mission at a horizontal resolution of 1 × 1 km (https://www.resdc.cn/data.aspx?DATAID=123, last access: 5 June 2024). These parameters were resampled to the 0.25° × 0.25° grid system by averaging the 1 km resolution data. Details of specific feature selection can be found in Sect. S1 in the Supplement.
To evaluate model performance, we applied a 10-fold cross-validation (CV) to evaluate out-of-sample accuracy. The CV process randomly split training data records into 10 subsets, in which 9 subsets were used to train models and the remaining 1 was used to examine the performance. Through 10 CV repetitions, all of the data records were tested once. Besides, we collected monthly AAOD data from four aerosol monitoring networks to further verify the model reliability, including the Aerosol Robotic Network (AERONET, https://aeronet.gsfc.nasa.gov, last access: 10 March 2022), China Aerosol Remote Sensing Network (CARSNET; Che et al., 2015), Campaign on Atmospheric Aerosol Research Network of China (CARE-China; Xin et al., 2015), and Sun Sky Radiometer Observation Network (SONET; Li et al., 2018), as shown in Fig. S1a. Detailed site descriptions can be found in corresponding studies. Given the complicated technologies and high costs required for measurement operation, instrument maintenance, and calibration, current aerosol monitoring sites are rare and unevenly located in the country. There are clear missing values in the time series, and most measurements we collected focused on the period 2015–2019. All the ground-level AAOD data were interpolated to 483 nm using the Angstrom exponent to independently evaluate the performance of machine learning predictions. Model performance was evaluated with selected statistical indicators including the correlation coefficient (R), normalized mean error (NME; Eq. 1), normalized mean bias (NMB; Eq. 2), and root mean square prediction error (RMSE; Eq. 3):
where X and O indicate the results from XGBoost prediction and OMI observation, respectively, and N is the number of data points.
2.2 Constraining BC emissions with gap-filled AAOD and CTM
We developed a top-down inversion approach to estimate the monthly BC emissions in China during 2000–2020 (see conceptual diagram in Fig. 1). To avoid abundant calculations, 5-year intervals were adopted in the simulation, and January, April, July, and October were selected as representative months of different seasons (widely applied in previous inversion studies; Zhang et al., 2015; Zhao et al., 2019).
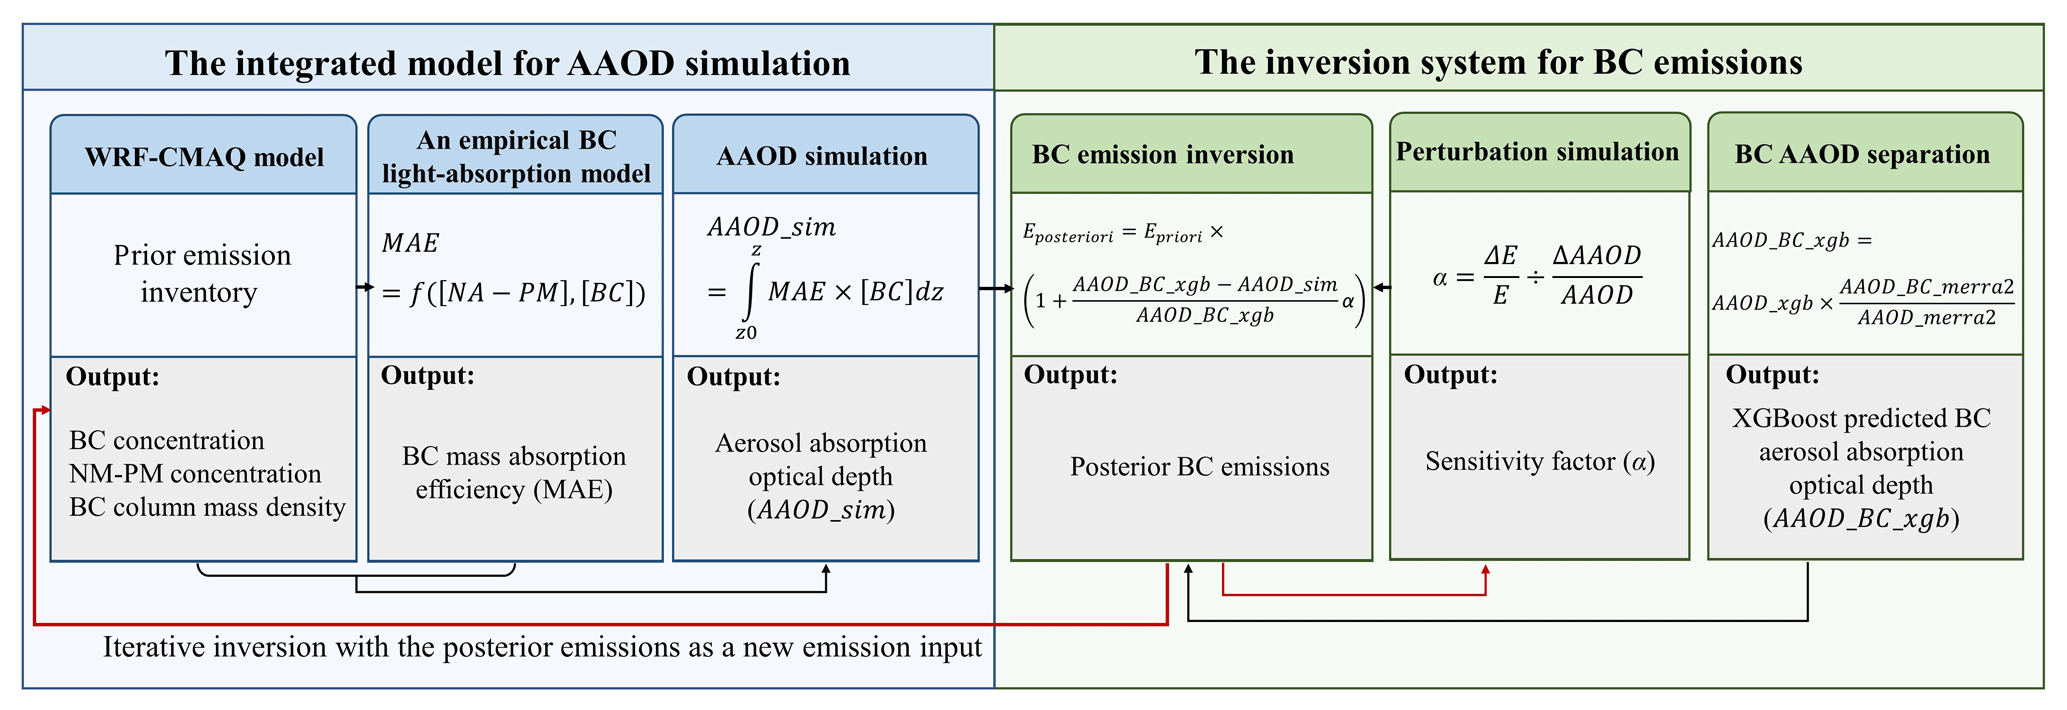
2.2.1 Integrated model for AAOD simulation
We simulated AAOD using the Community Multi-scale Air Quality (CMAQ; US EPA Office of Research and Development, 2015) model version 5.1 and an empirical BC light absorption model. AAOD is defined as the integrated absorption coefficient (m−1) over the atmospheric column, and the absorption coefficient is the product of the mass concentration (g m−3) and mass absorption efficiency of BC (MAE, m2 g−1) (Bond et al., 2013). Prior anthropogenic BC emissions during 2000–2020 were obtained from MEIC (http://www.meicmodel.org, last access: 25 May 2022), and prior BC emissions from open biomass burning (OBB) were obtained from the Global Fire Emissions Database version 4.1s (GFED V4.1s, https://www.geo.vu.nl/~gwerf/GFED/GFED4/, last access: 5 June 2024). First, BC concentrations at different vertical layers were simulated using the CMAQ model at a horizontal resolution of 27 × 27 km (see Sect. S2 for model settings). Based on our previous measurements, we then adopted an empirical model to quantify the enhanced light absorption of the coating on BC particles (D. Chen et al., 2019) and obtained the simulated BC AAOD:
where MAE, AAOD_BC_sim, and [BC] represent the simulated BC MAE, BC AAOD, and BC concentration, respectively; z and z0 represent the simulated top and bottom of the atmosphere (0), respectively; [NA-PM] represents the simulated concentration of total non-absorbing matter (i.e., SO, NO, and organic carbon, OC); i and j represent the number of grids and vertical layers, respectively; dz represents the height of the vertical layer; and m and n represent the year and month, respectively. All parameters and variables shown in the equations are summarized in Table S2.
2.2.2 Inversion system for BC emissions
We developed an inversion system based on the spatiotemporal-dependent relationship between BC emissions and BC AAOD.
As AAOD is attributed to all light-absorbing aerosols, including BC, dust, and brown carbon (BrC), we first separated the contribution of BC to the XGBoost-predicted AAOD obtained in Sect. 2.1 using the fraction of BC in AAOD obtained from MERRA-2:
where AAOD_BC_xgb represents the separated XGBoost BC AAOD, AAOD_xgb represents XGBoost AAOD, AAOD_BC_merra2 represents MERRA-2 BC AAOD, and AAOD_merra2 represents MERRA-2 AAOD. The hourly MERRA-2 data at 0.625° × 0.5° were reallocated to the horizontal resolution of the CMAQ model (27 km) and averaged to a monthly level.
With XGBoost BC AAOD, we inferred monthly BC emissions using Eq. (7):
where Eposterior and Eprior represent posterior and prior BC emissions, respectively; AAOD_BC_sim represents the simulated BC AAOD based on prior BC emissions; and α is a unitless factor representing the sensitivity of changes in BC AAOD to those in BC emissions in each model grid. We carried out a perturbation simulation to obtain α:
where prior and perturbed represent prior and perturbation simulations, respectively; represents a 10 % reduction in prior BC emissions; and AAOD_BC_simperturbed and AAOD_BC_simprior represent the simulated BC AAOD with the perturbation and prior simulation, respectively.
We adopted the posterior BC emissions as the new BC emission input, repeating the simulation until the NME of BC AAOD from CTM and XGBoost was reduced to < 30 %. We evaluated the CMAQ model performance based on our gap-filled AAOD dataset and available observations of surface BC concentrations collected from 64 published studies (Table S3). The collected BC concentration observations cover various sampling regions in China and the study period from 2000 to 2020. Most studies analyzed BC using well-acknowledged reliable and widely used analyzers, for example, a DRI carbon analyzer or Sunset carbon analyzer. Besides this base case as mentioned above, we conducted four sensitivity tests to recalculate posterior BC emissions in order to explore the uncertainty in the inversion (Sect. S3 and Table S4). We applied the estimated AAOD at a longer wavelength of 865 nm (Test 1), the different dust AAOD fractions (Test 2), the adjusted MAE based on observations (Table S5; Test 3), and the adjusted simulated BC lifetime (Test 4).
2.3 Estimating the associated mortality burden and determining its drivers
A log-linear model was applied to estimate the attributable fraction (AF) of premature mortality to BC exposure (Wang et al., 2021):
where Ci,m represents the posterior simulated average BC concentration of 4 months in year m of grid i, and ΔCi,m represents the difference between Ci,m and the health impact threshold. Due to the lack of reported BC concentration thresholds in current epidemiological studies (Cui et al., 2022), we applied the 1.25 percentile of BC concentrations (suggested by Pani et al., 2020; Wang et al., 2021) as the threshold (0.02 µg m−3). βBC represents the concentration–response coefficient. Here, we used a βBC value of 0.0204 (95 % confidence interval (CI): 0.0187–0.0224) based on a unique cohort study conducted in eastern China (Chen et al., 2021).
The all-cause premature mortality (M) attributable to BC exposure was calculated using Eq. (10) (Wang et al., 2021):
where s represents the population subgroup, P represents the population, PS represents the proportion of the population subgroup to the national population, and B represents the national baseline mortality rate of all-cause diseases. The gridded population data were aggregated from the 1 km population density dataset in WorldPop (WorldPop, 2018; https://doi.org/10.5258/SOTON/WP00674). We corrected the annual total population using Chinese census data obtained from the State Statistics Bureau (https://data.stats.gov.cn/english/, last access: 15 February 2023). The national average population age structure and baseline mortality rate of all-cause diseases were collected from the Global Burden of Disease study (Cohen et al., 2017; https://vizhub.healthdata.org/gbd-results/, last access: 5 June 2024).
We evaluated the impact of each of the four factors in Eq. (10) (three vulnerability factors and BC exposure) on the changing mortality through a series of sensitivity analyses (Cohen et al., 2017; Geng et al., 2021). We established 24 decomposition sequences with the four factors and calculated the mean changing mortality of each factor through all sequences. Moreover, mortality changes attributed to BC exposure were further disaggregated into contributions from BC emissions and meteorological factors using a direct proportion approach with the CMAQ model (Sect. S4).
3.1 Gap-filled AAOD during 2000–2020
3.1.1 Evaluation of XGBoost model performance
By filling the missing values with the XGBoost model, we obtain full coverage of monthly AAOD for China from 2000 to 2020. When evaluated by 10-fold CV, the predicted AAOD shows good agreement with OMI observations, with R = 0.92, RMSE = 0.013, and NMB = −4 % (Fig. 2). A comparison with individual ground measurements further verifies the reliability and robustness of the model across regions and periods, with an RMSE value of 0.017 and NMB of 5 % for all available observations (Table S8). The comparisons with observations at typical individual sites are shown in Fig. S5. Overall, better performance is shown by our predictions compared with other AAOD datasets. As a reference, the RMSE and NMB between MERRA-2 and the same observations are 0.021 and −19 % (Table S8), respectively. In addition to the evaluation for the whole period, Table S9 shows the model performance for each year. The performance of 10-fold CV becomes moderately poorer for more recent years, accompanied by the reduced sampling size of OMI observations. Regarding the ground observations, a better performance appeared in recent years, indicated by the smaller RMSE, and the underestimation in earlier years could probably be attributed to fewer sites being available and more difficulty in data quality control.
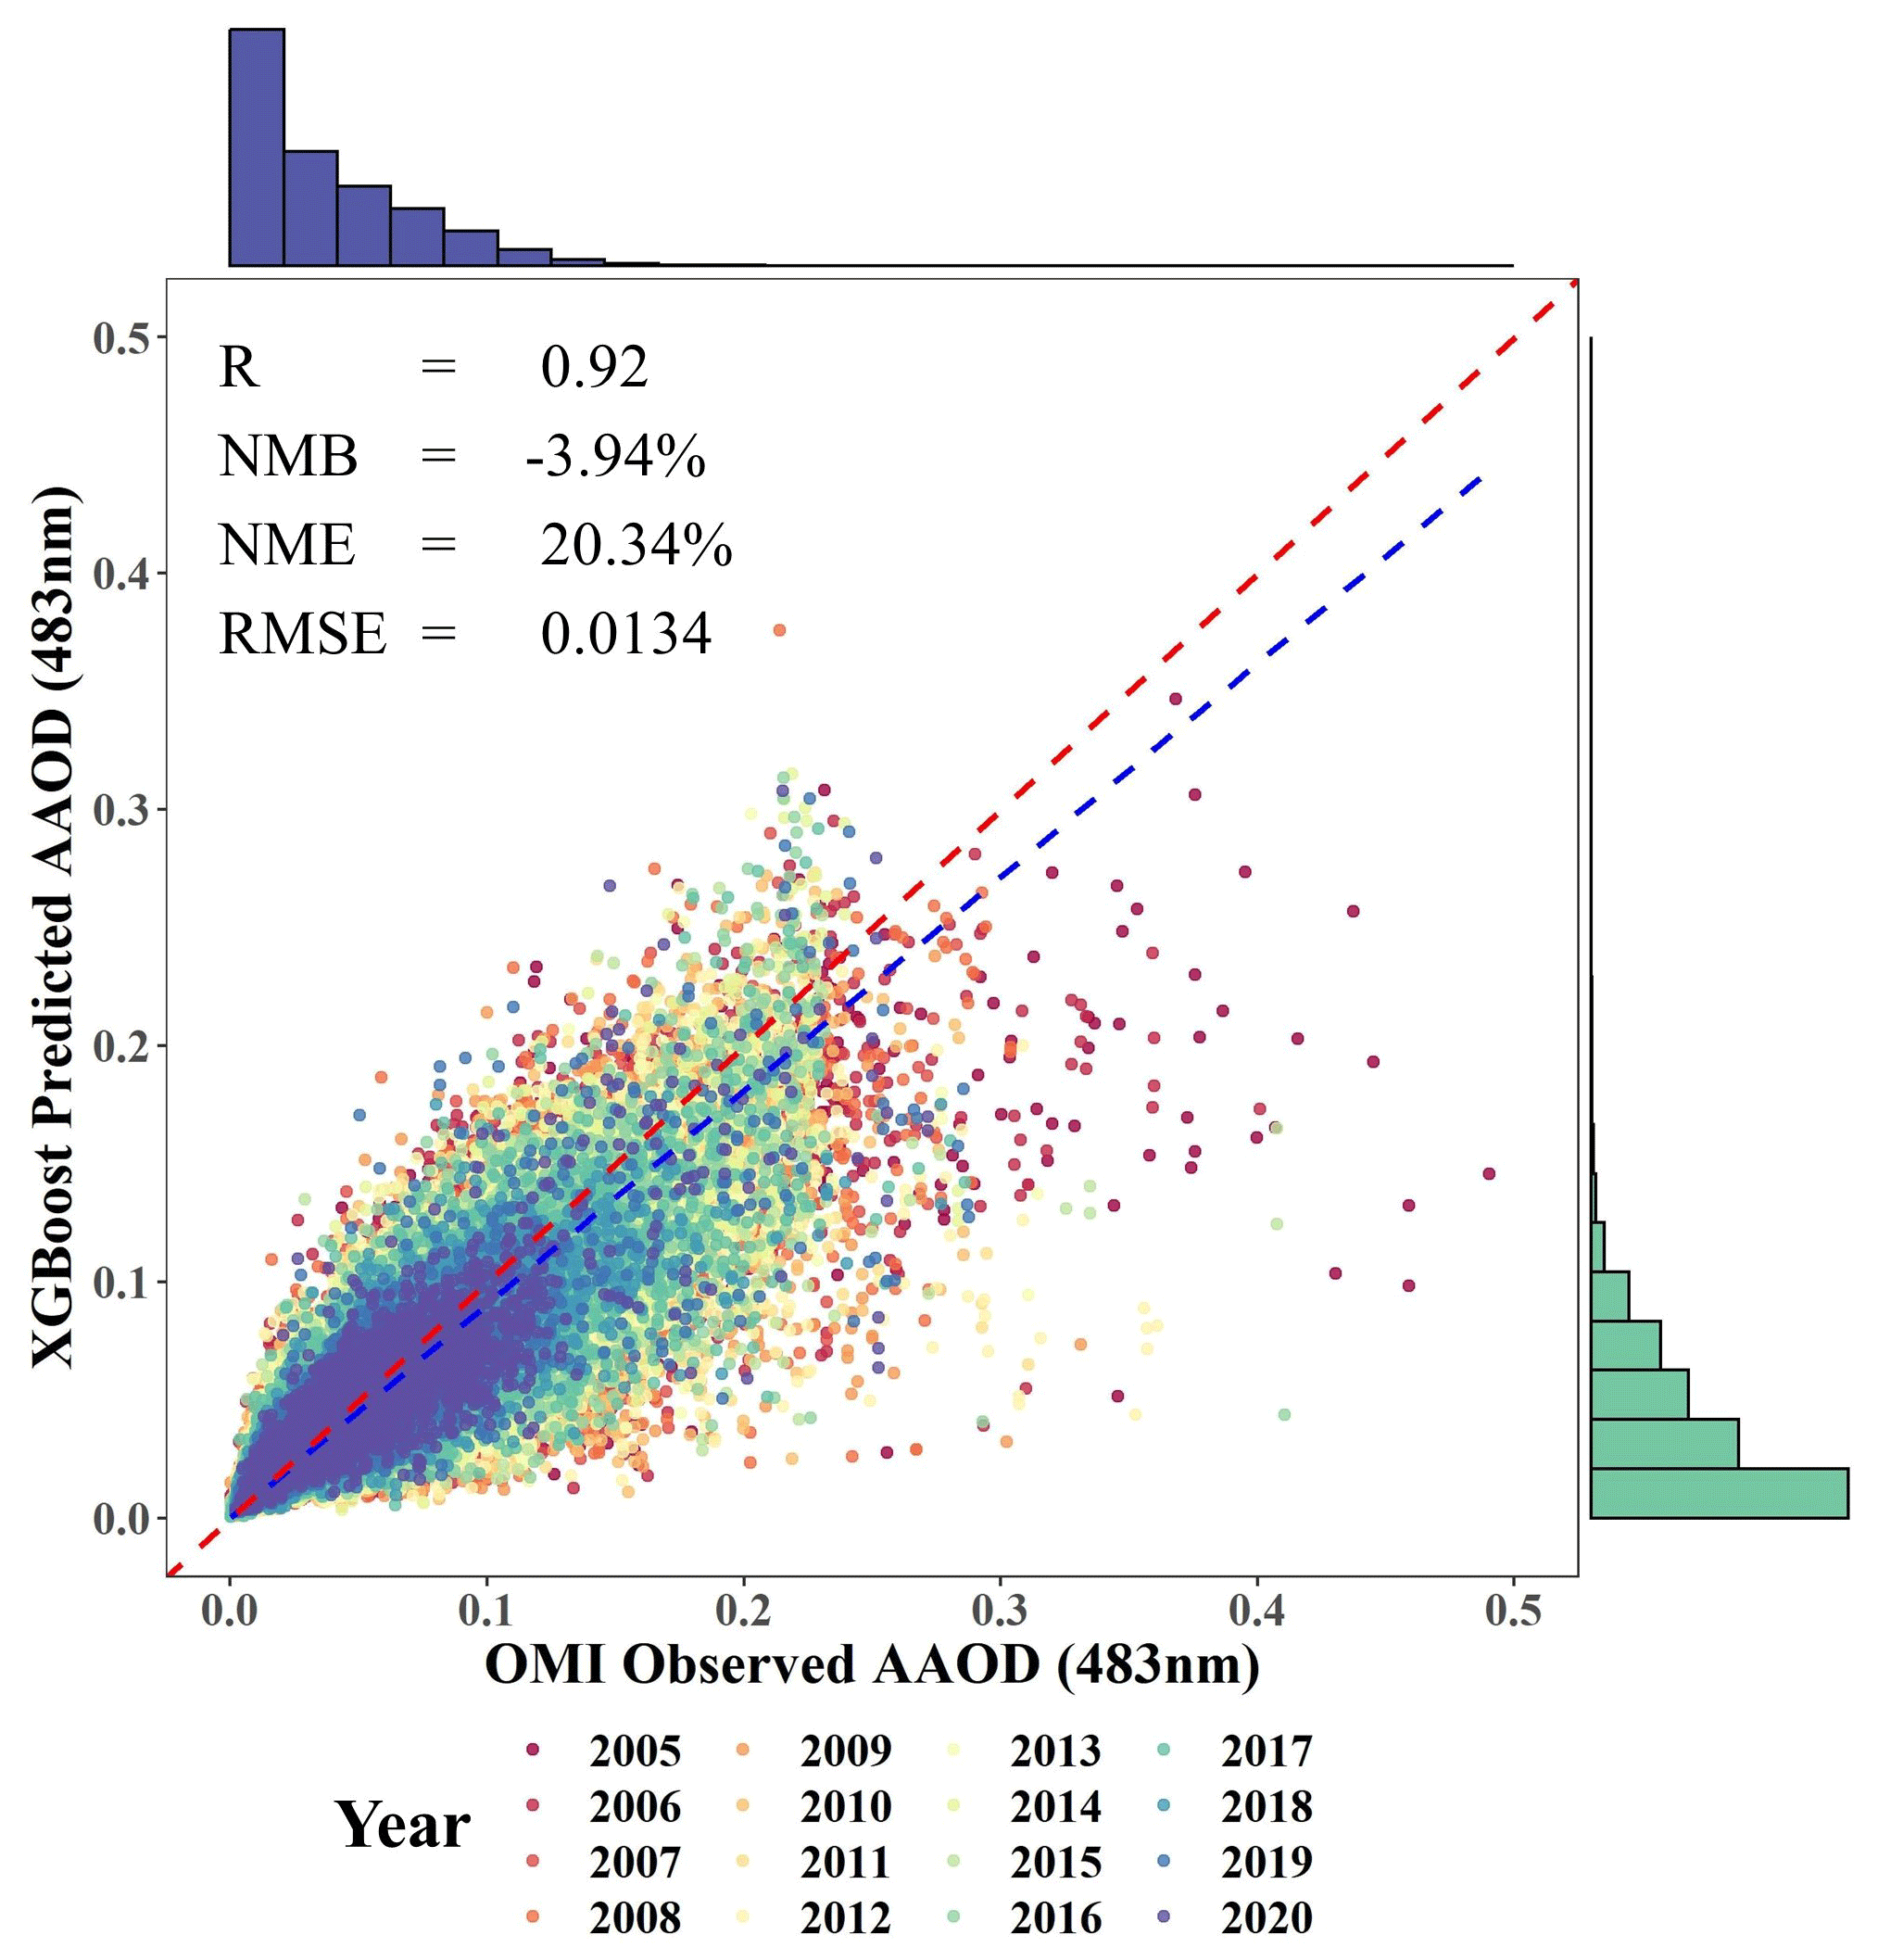
Figure 2Comparison between XGBoost-predicted and OMI-observed AAOD for the period 2005–2020. Different colors of dots represent values for different years. The dashed red line indicates the 1 : 1 line. The dashed blue line indicates the regression line. The interval of bins of the marginal histograms is 0.02.
Besides, the spatial coverage of OMI AAOD influences the training data size for the XGBoost model and thereby the spatiotemporal pattern of gap-filled AAOD. Table S10 shows the XGBoost performance against OMI and ground measurements by OMI coverage. In general, a poorer performance was found for areas with more missing values. When evaluated against ground measurements, for example, the RMSE and NMB for areas with OMI coverage of less than 20 % are 0.019 and 9 %, respectively, and they decline to 0.015 and 3 % for areas with OMI coverage of more than 60 %. All the biases are kept within a limited range. The analysis indicates the satisfactory quality of our gap-filled AAOD dataset, with full spatiotemporal coverage for the research domain and period.
Table S1 summarizes the importance levels of model predictors in the XGBoost model, expressed with three indicators; “Gain” is the most decisive predictor. MERRA-2 AAOD, longitude, latitude, and temporal parameters are identified as the most dominant variables for filling the gap of OMI AAOD. Furthermore, crop coverage is another dominant variable, which reflects the contribution of OBB to light-absorbing aerosol emissions and thereby to AAOD. Specific meteorological parameters – e.g., surface pressure (PS), shortwave radiation flux (SWGDN), evaporation from turbulence (EVAP), and planetary boundary layer height (PBLH) – reflect the surface energy budget, transport, and diffusion of air pollutants and thus play an important role in AAOD prediction.
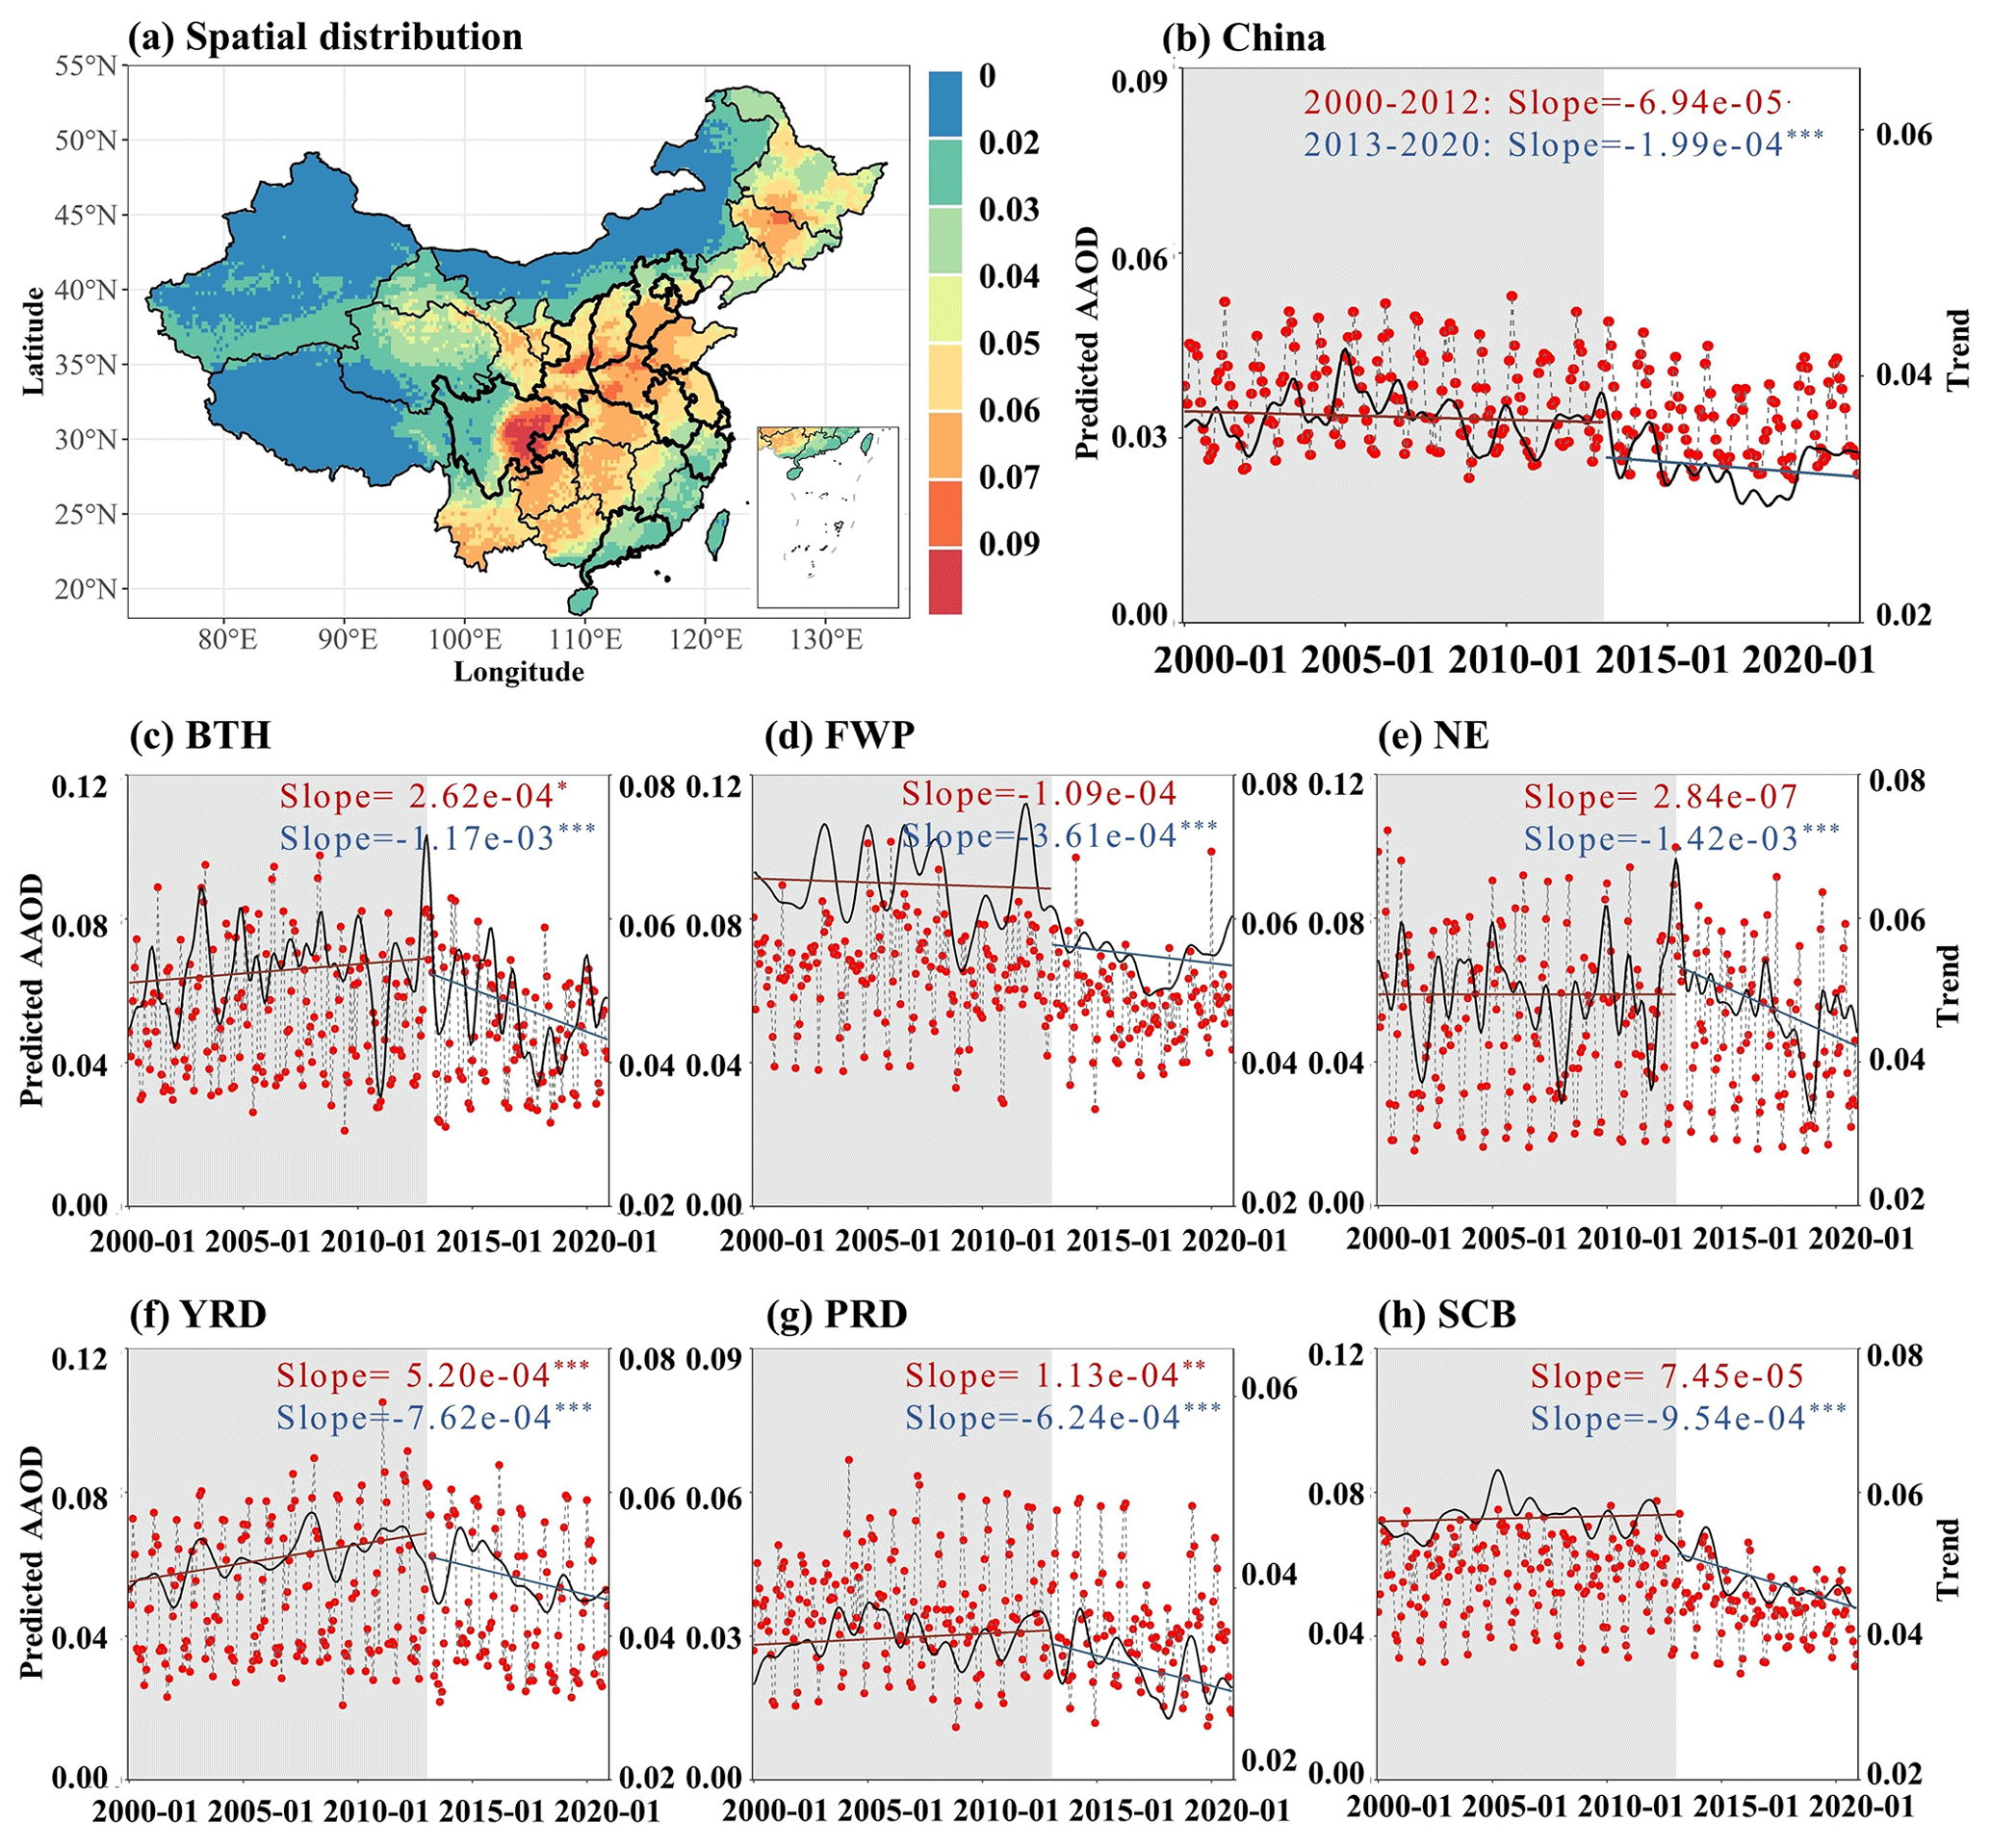
Figure 3(a) Spatial distribution of multiyear average AAOD during 2000–2020 and (b–h) interannual variations of AAOD for China and six key regions during 2000–2020. The gray and white areas represent phase 1 (2000–2012) and phase 2 (2013–2020), respectively. The red dots and dashed line represent time series of monthly AAOD (left vertical axis). The solid black lines represent the interannual variability after removing the seasonal change through time-series decomposition (right vertical axis). The straight red and blue lines present the linear trends of AAOD for different phases (right vertical axis). The annual variation rates (1 yr−1) during different phases with significance levels (∗ p < 0.05, p < 0.01, p < 0.001) are presented. The map data provided by the Resource and Environment Data Cloud Platform are freely available for academic use (https://www.resdc.cn/DOI/DOI.aspx?DOIID=122, last access: 30 May 2024). © Institute of Geographic Sciences and Natural Resources Research, Chinese Academy of Sciences.
3.1.2 Spatiotemporal patterns of XGBoost-predicted AAOD during 2000–2020
Figure 3a illustrates the spatial distribution of the averaged XGBoost-predicted AAOD during 2000–2020. Hot spots mainly existed in eastern China, with a regional average of 0.05, which was higher than the national average of 0.03. The AAOD values of Beijing–Tianjin–Hebei (BTH), Fenwei Plain (FWP), Yangtze River Delta (YRD), Sichuan Basin (SCB), and Northeast China (NE) were 1.4–1.8 times those of the national average, while the value for the Pearl River Delta (PRD) was much closer to the national average (see Fig. S1a for the locations of regions). The relatively small proportion of the rural population to the total population (34 %) and the highly developed economy in PRD might have resulted in limited light-absorbing aerosol emissions.
Figure 3b–h illustrate the interannual variability in the predicted monthly AAOD for China and the key regions during 2000–2020, which were divided into two temporal phases. In phase 1 (2000–2012), the AAOD of China experienced a slight decline (−6.94 × 10⁻⁵ yr−1), while that of key regions showed a moderate increase, except for FWP. The annual AAOD growth of the most economically developed regions (BTH, YRD, and PRD) ranged 1.13 × 10⁻⁴–5.20 × 10⁻⁴ yr−1, larger than that in other regions (SCB and NE, 2.84 × 10⁻⁷–7.54 × 10⁻⁵ yr−1), reflecting the influence of regional differences based on human activities and meteorological conditions. Increasing industrial production and residential combustion led to elevated anthropogenic emissions of light-absorbing aerosols, thereby increasing AAOD values in key regions. However, nationwide increasing precipitation during phase 1 (0.3 g m−2 s−1 yr−1 indicated by MERRA-2) may have enhanced the removal of pollutants and offset the effects of increasing emissions. In addition, strengthened afforestation policies in northern China led to a decline in dust aerosol emissions and thus also a decline in the AAOD values during this period (Middleton, 2019).
In phase 2 (2013–2020), the AAOD of China demonstrated a clear decline (1.99 × 10⁻⁴ yr−1), with faster rates in key regions (3.61 × 10⁻⁴–1.42 × 10⁻³ yr−1). The AAOD decline in key regions in phase 2 was much faster than its growth in phase 1, indicating the benefits of China's air pollution controls, such as implementation of the strictest-ever emission standards in the industrial sector and promotion of clean energy use for household heating and cooking. AAOD growth clearly occurred in northern regions from 2018 onwards, which differed from its continuous decrease in southern regions. The increasing surface wind speed in northern regions elevated the frequency of sandstorms, resulting in greater regional emissions of light-absorbing dust aerosols that partly contributed to AAOD growth (Yang et al., 2021).
3.2 Long-term evolution of constrained BC emissions during 2000–2020
3.2.1 Verification of constrained BC emissions
We find that application of posterior BC emissions constrained by XGBoost-predicted AAOD (described in detail in Sect. 3.2.2) largely improved the model performance of BC concentration and AAOD simulation compared with the use of prior BC emissions.
Showing an acceptable performance in meteorological simulation (Table S11), the CMAQ model presented a clear underestimation of surface BC concentrations based on the prior BC emissions, with the NMB and NME calculated to be −46 % and 53 %, respectively (Fig. 4). Besides, a larger underestimation appeared for the very early and most recent year, with NMB calculated at −59 % and −60 % for 2000 and 2020, respectively (Fig. S6), which may be caused by the larger underestimation of BC emissions in these years (described in detail in Sect. 3.2.2). Application of posterior BC emissions greatly reduced the NMB and NME during the research period to −14 % and 36 %, respectively (Fig. 4). As a reference, the performance meets the benchmark of BC simulation (NMB < ±20 % and NME < 45 %) proposed by Huang et al. (2021). Moreover, improved model performance was achieved for all the years, with largely reduced NMB and NME compared with simulations with the prior emissions (Fig. S6). The larger uncertainty for 2000 may be caused by limited observations and less controlled data quality for earlier years.
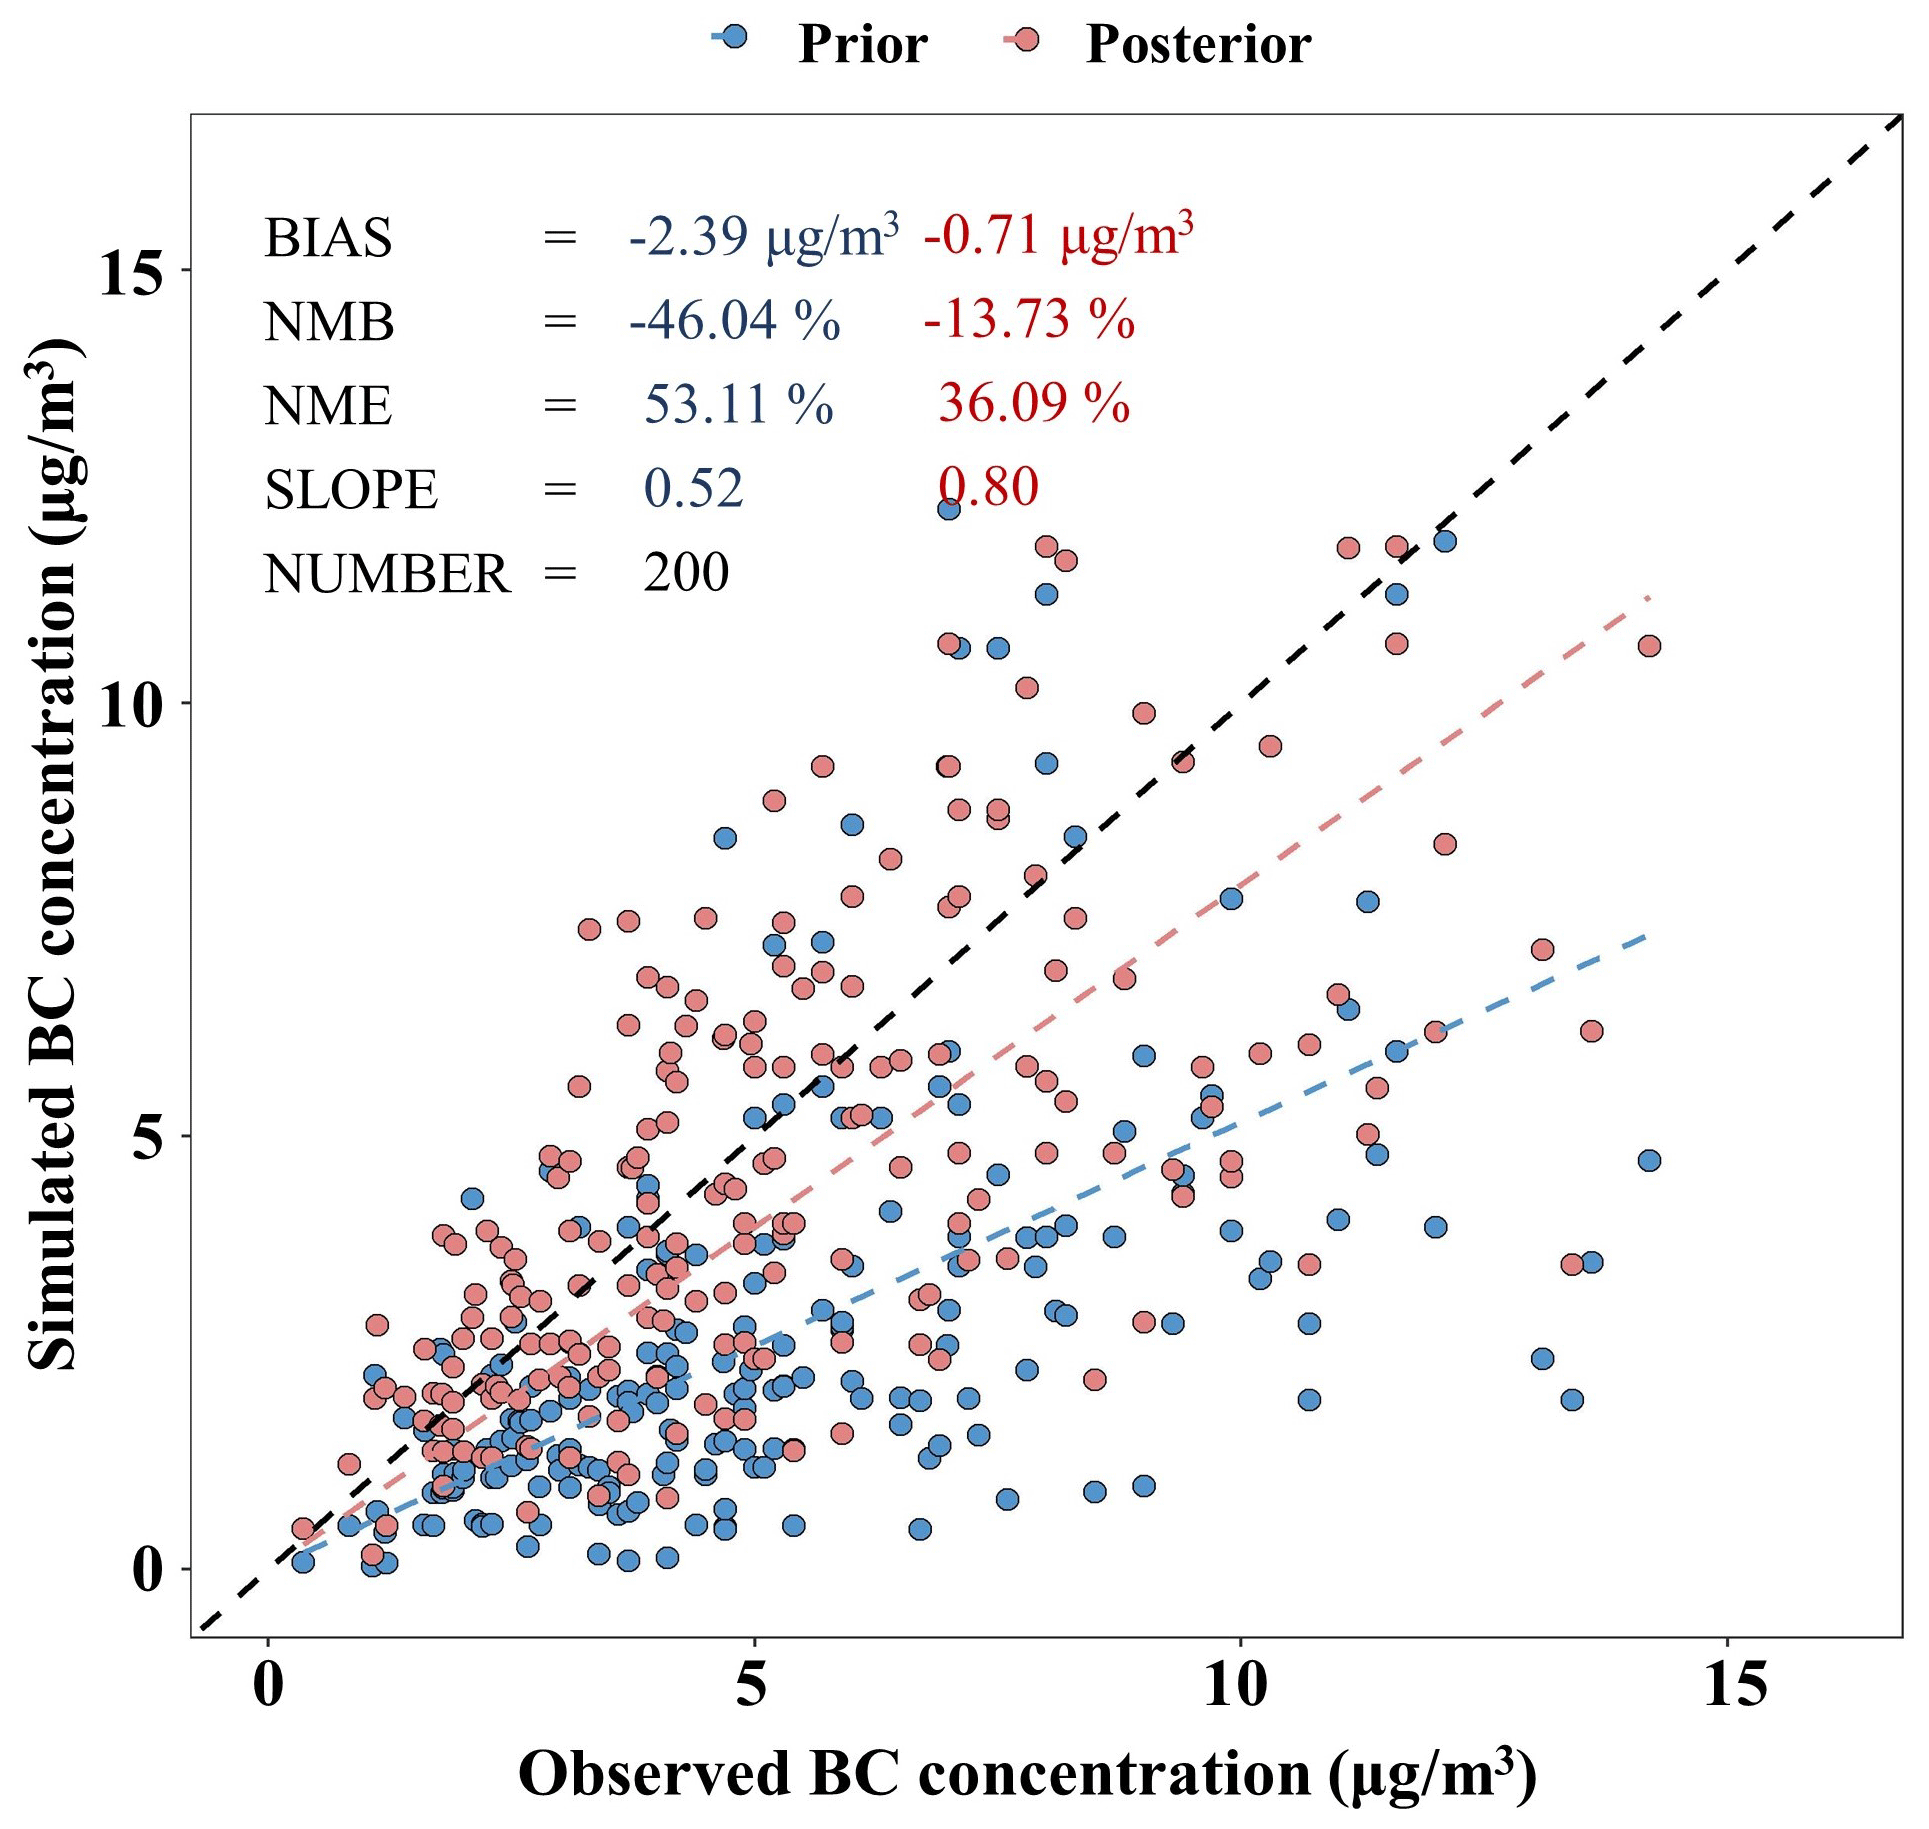
Figure 4Correlation between simulated and observed monthly surface BC concentrations in China. Simulations were conducted based on prior and posterior BC emissions, while observations were collected from publications.
We also compare the simulated and observed BC concentrations by land-use type (Fig. S7). Application of the prior emissions resulted in a greater underestimation of BC concentrations for the forest and grassland regions (NMB: from −51 % to −77 %; NME: from 51 % to 77 %) compared with urban and rural regions (NMB: from −35 % to −51 %; NME: from 47 % to 51 %). The model performance was clearly improved for all the land-use types when the posterior emissions were applied. In particular, the NMB and NME were calculated to range, respectively, from −2 % to −40 % and from 31 % to 52 % for the forest and grassland regions. The evaluation supported our estimates of posterior emissions, not only for areas with insensitive human activities (e.g., urban regions) but also for remote regions.
Similarly, simulation of AAOD based on the prior emissions presented a clear underestimation compared with the OMI-derived observations, with the monthly NMB and NME ranging from −85 % to −29 % and from 34 % to 85 %, respectively (Table S12). As pointed out by Bond et al. (2013), the incorrect assumption of the mixing state of BC in the CTM could result in the general underestimation of MAE and thereby of AAOD. A clear improvement in the performance of AAOD simulation was found when the posterior emissions were applied. The NMB, NME, and RMSE were calculated to range from −11 % to 14 %, from 15 % to 28 %, and from 0.01 to 0.03, respectively, i.e., much smaller values than with the prior emissions, while R was largely elevated from 0.15–0.86 to 0.73–0.95.
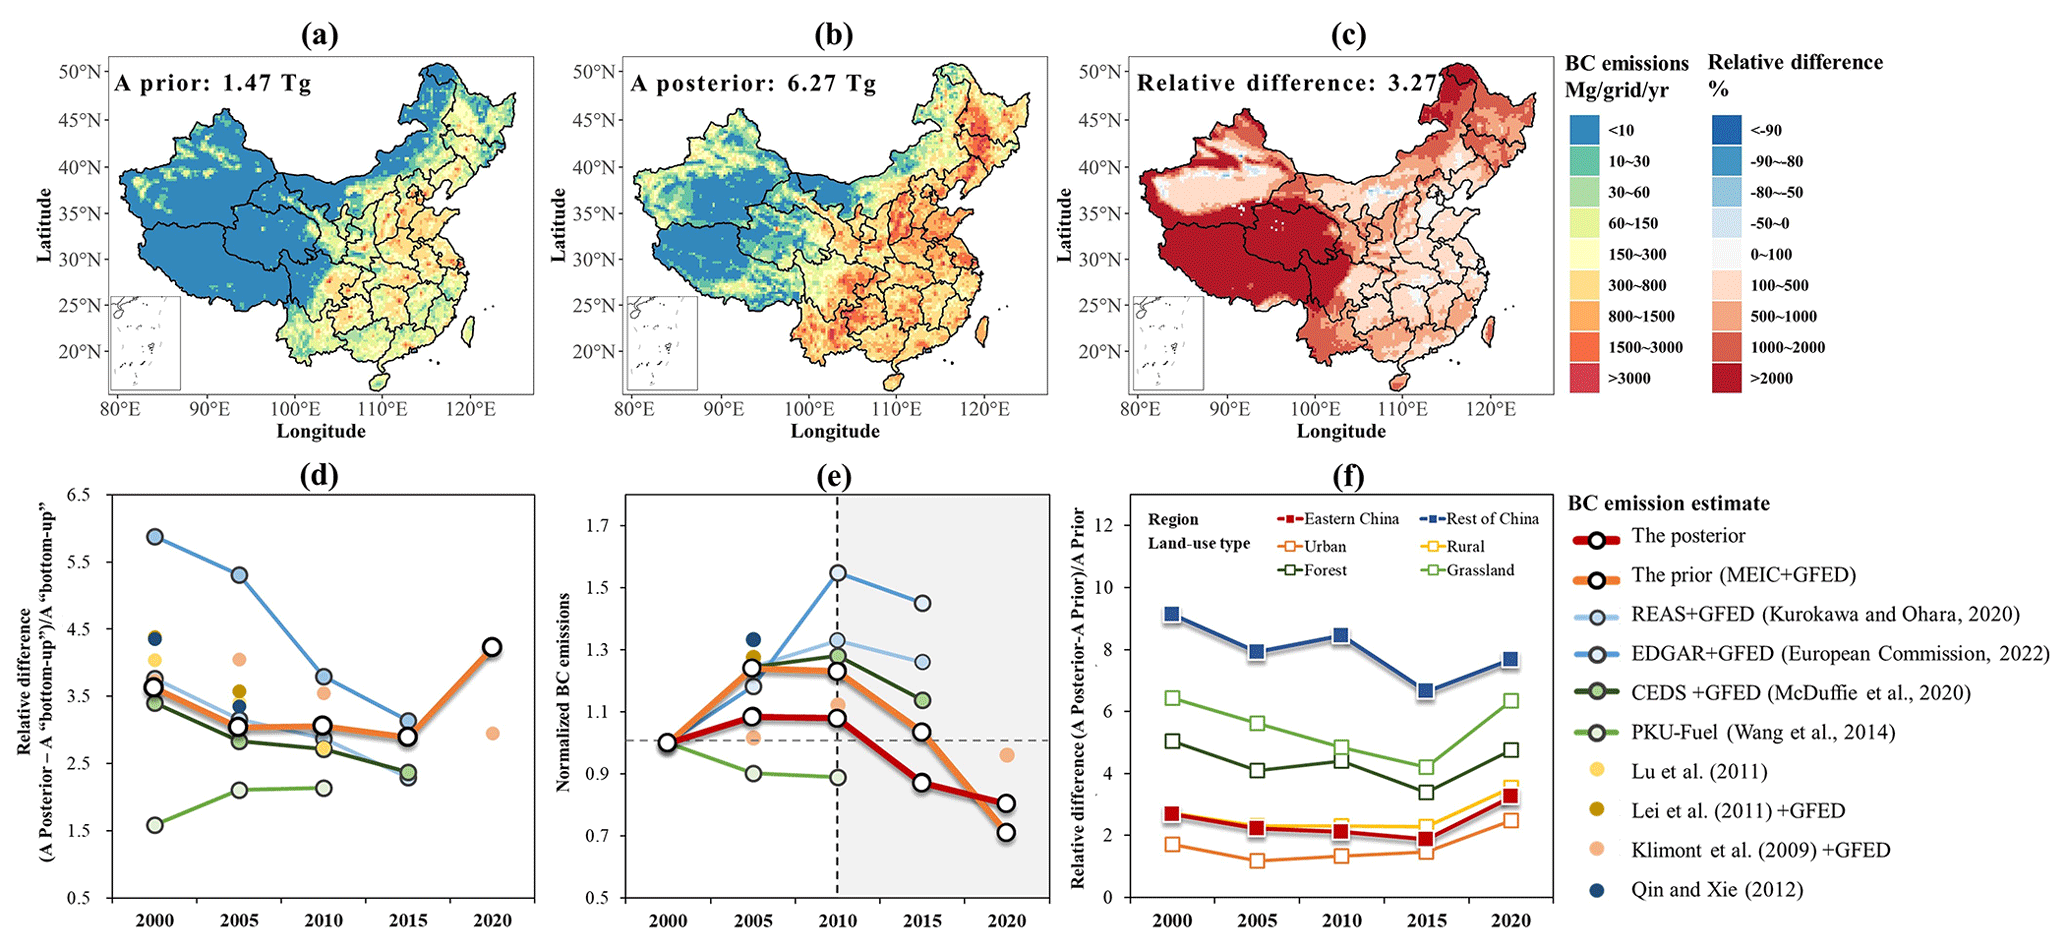
Figure 5Comparisons between posterior and various bottom-up BC emission estimates in China during 2000–2020. (a) Multiyear average spatial distribution of prior BC emissions (MEIC + GFED), (b) posterior BC emissions, and (c) their relative differences. (d) Long-term variability in the relative differences between posterior and various bottom-up BC emission estimates with 5-year intervals. Note that OBB emissions from GFED are added to each anthropogenic emission estimate as the total bottom-up estimate, except for PKU-Fuel, Lu et al. (2011), and Qin and Xie (2012) that include their own OBB emission estimate. (e) Long-term variability in normalized posterior and various bottom-up BC emission estimates (relative to 2000). The gray area indicates the period with declining national BC emissions. (f) Long-term variability in the relative differences between prior (MEIC + GFED) and posterior BC emissions by region and land-use type.
3.2.2 Spatiotemporal patterns of posterior BC emissions and differences between prior and posterior BC emissions
Figure 5a–c present the spatial distribution of multiyear averages of the prior and posterior BC emissions and their relative differences (see details for individual years in Fig. 6). The annual total posterior BC emissions were estimated to increase from 6.48 Tg in 2000 to 7.03 Tg in 2010 and to decrease to 5.21 Tg in 2020. Compared with the prior BC emissions, the posterior BC emissions presented a clear enhancement, with a multiyear average factor (the ratio of the posterior emission difference to prior BC emissions, i.e., (posterior − prior) prior) of 3.3 for the entire country (Fig. 5c). The value declined from 3.7 to 2.7 during 2000–2015 but rose again to 4.1 in 2020 (Fig. 5d). The posterior BC emissions also presented an enhancement compared with other bottom-up estimates of China's BC emissions (sum of anthropogenic and OBB emissions), with the lowest factor of 1.7 for PKU-Fuel (Wang et al., 2014) and the highest factor of 4.1 for EDGAR + GFED (https://edgar.jrc.ec.europa.eu/dataset_ap61, last access: 10 May 2023) (Fig. 5d and Table 1). The comparisons between bottom-up and top-down estimates of BC emissions suggested a possible underestimation of the former, resulting partly from the under-reporting of activity levels and lack of local measurements for specific BC emission factors (EFs; emissions per unit of activity level) (Fu et al., 2012; Guan et al., 2012). In addition, the omission of small fires from satellite observations and the application of global EFs led to an underestimation of biomass burning emissions (Yang and Zhao, 2019). Along with improved energy and economic statistics and the increased number of EF data obtained through field observations, the discrepancy between prior and posterior BC emissions was gradually reduced until 2020. The increased uncertainty in prior BC emissions in 2020 may have resulted partly from an underestimation of increased fuel use owing to residential heating and cooking during the COVID-19 lockdown and quarantine period (Zheng et al., 2020).
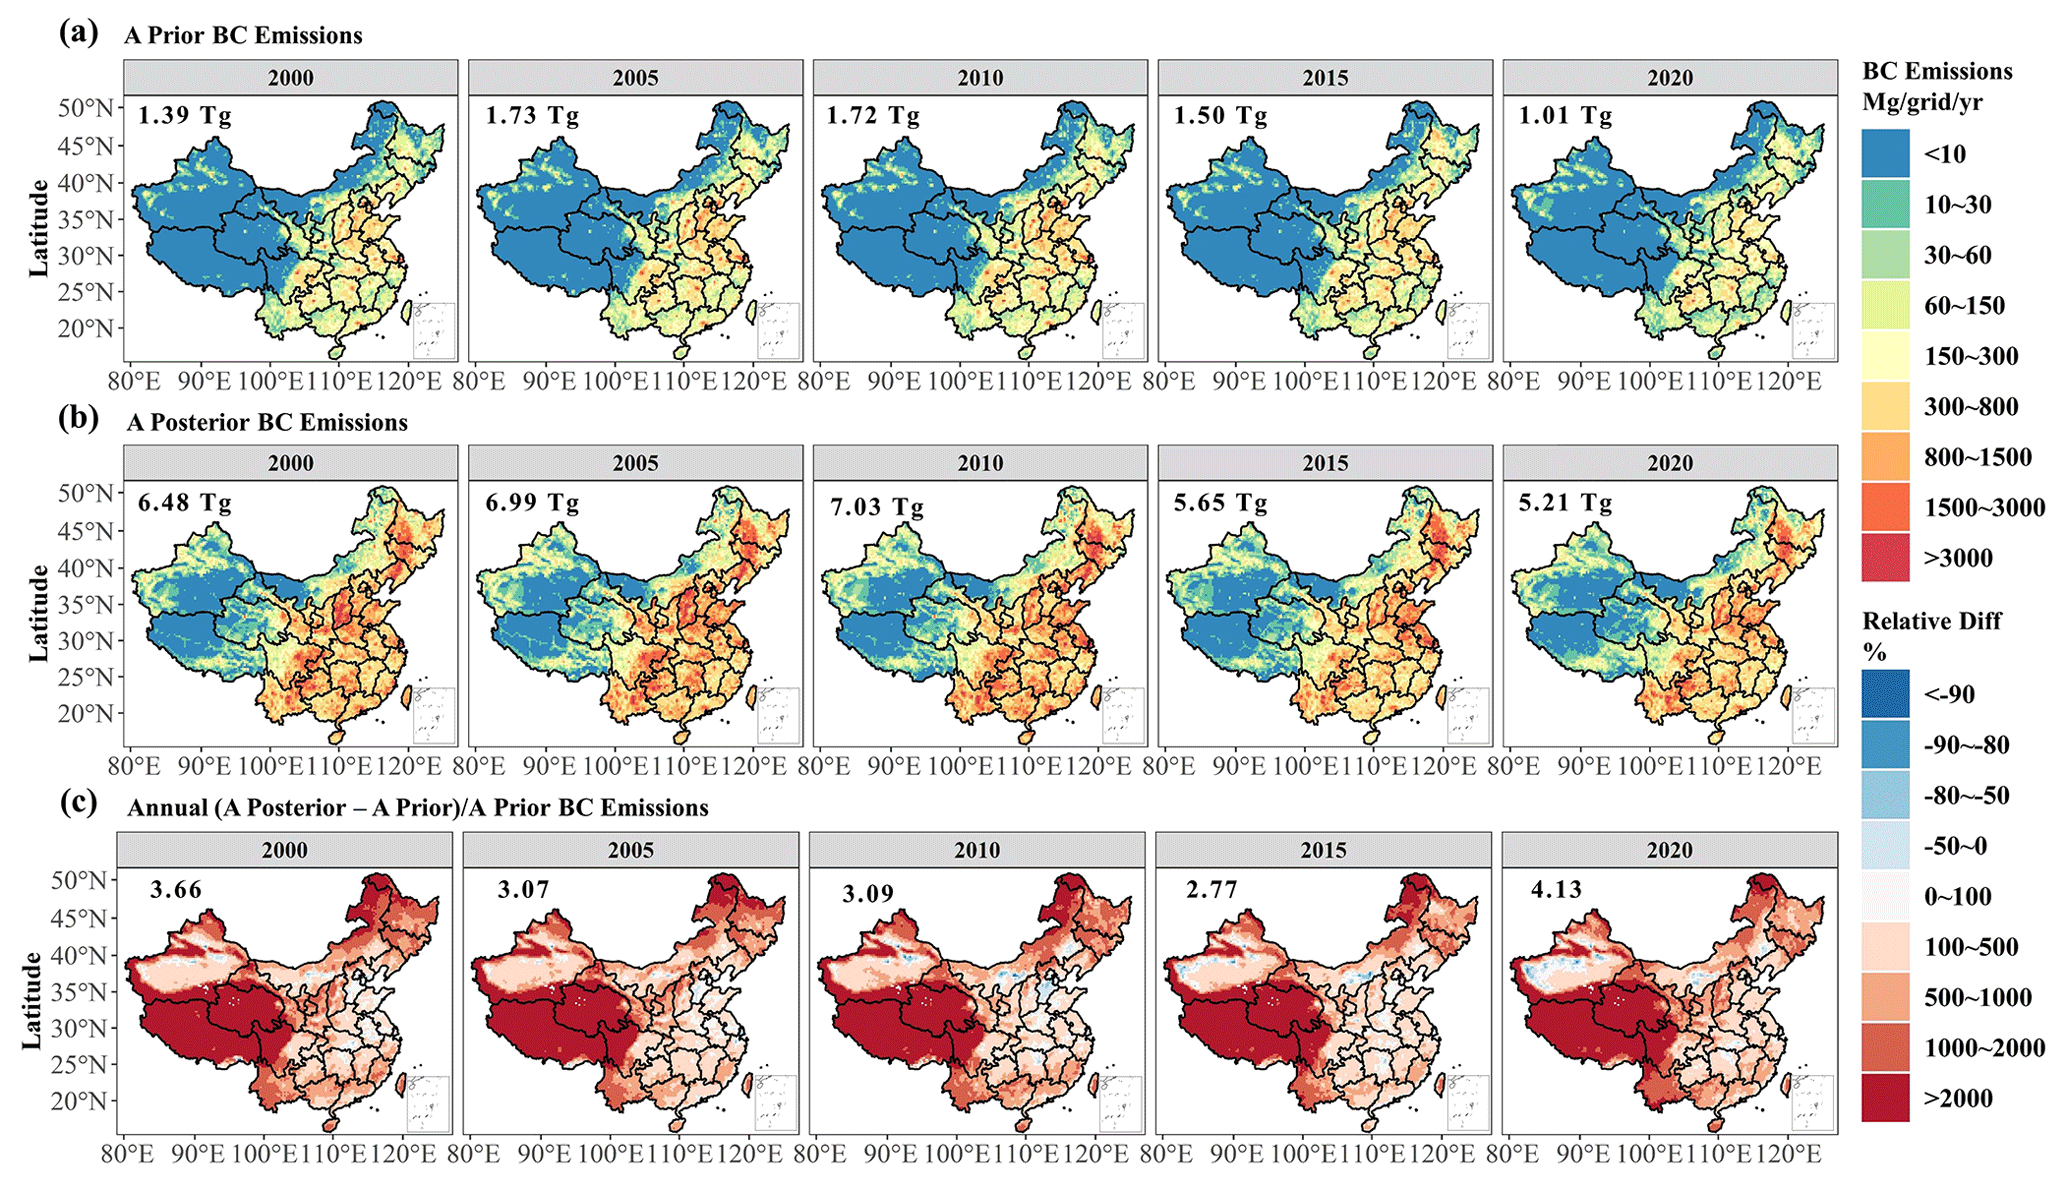
Figure 6The annual (a) prior BC emissions, (b) posterior BC emissions (3 times total emissions of January, April, July, and October), and (c) their relative differences during 2000–2020 (with a 5-year interval).
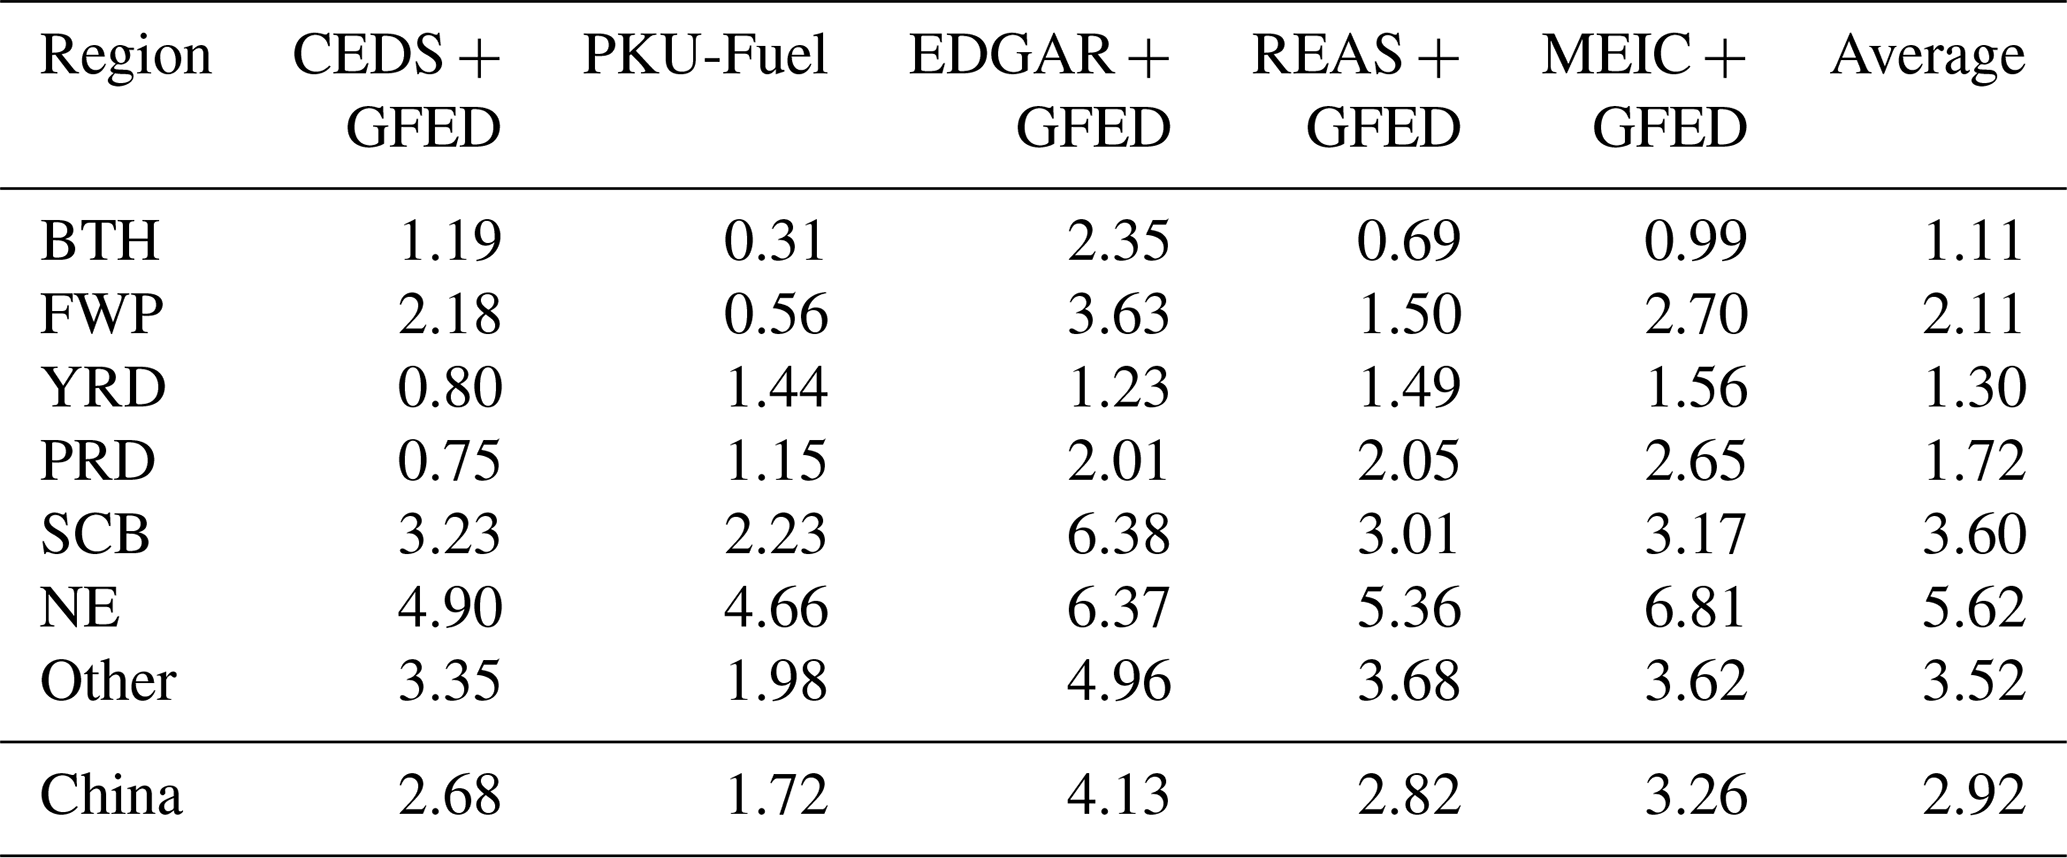
Table 1The multiyear average relative differences between the posterior and various bottom-up estimates of BC emissions by region (unitless). Note that OBB emissions from GFED are added to each anthropogenic emission estimate as the total bottom-up estimate, except for PKU-Fuel which includes its own OBB emission estimate.
The posterior emissions presented a smaller interannual variability compared with the prior and other bottom-up estimates, with a net growth of 8 % during 2000–2010 (the analogous numbers are 12 %–55 % for various bottom-up estimates including 24 % for the prior used in this work, MEIC + GFED) and a decline of 26 % during 2010–2020 (41 % for MEIC + GFED; Fig. 5e). Besides residential sources, prior emission estimate bias may also have occurred in the transportation sector, such as extra emissions derived from inadequately eliminated vehicles with relatively old standards and the use of specific after-treatment technologies (e.g., diesel particulate filters) causing the release of ultrafine particles (Louis et al., 2016).
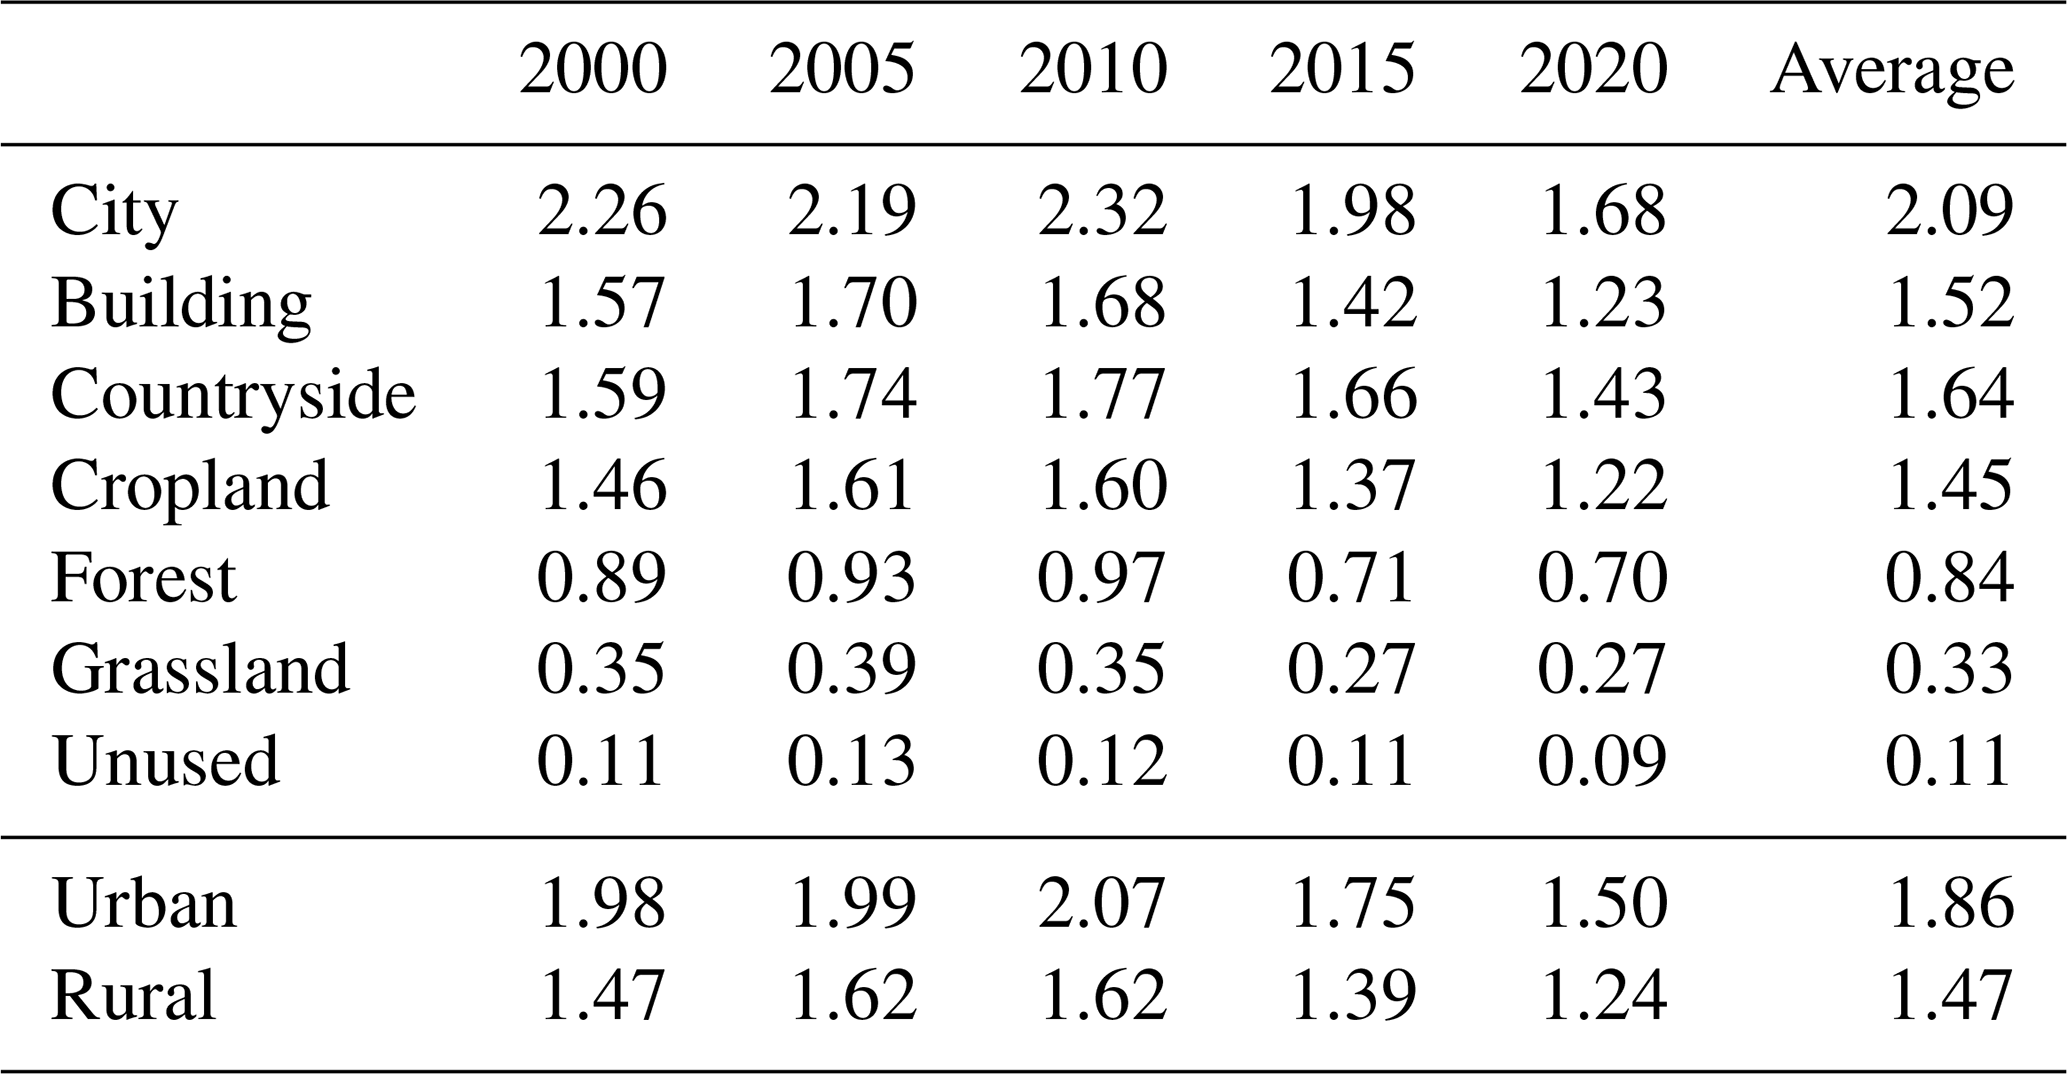
Relatively smaller differences between posterior and prior BC emissions were found in eastern China, with a multiyear average ratio of posterior to prior BC emissions estimated at 2.4, while that for the rest of China reached 8.0 (Fig. 5f). The relative differences between posterior and other bottom-up BC emission estimates were smaller (1.1–2.1) in more economically developed regions (BTH, FWP, YRD, and PRD) but larger (3.5–5.6) in SCB, NE, and other regions (Table 1). To further explore the impact of human activities on BC emissions, we divided the country into different land-use types (Fig. S1b). The multiyear average BC emission intensity in urban areas was estimated at 1.86 Mg km−2 yr−1, i.e., higher than 1.47 Mg km−2 yr−1 in rural areas (Table 2). Industrial production, transportation, and commercial activities generate abundant emissions in urban areas, while straw burning, residential cooking, and heating are important emission sources in rural areas. Smaller BC emission intensity was estimated in regions less influenced by human activities, i.e., 0.84, 0.33, and 0.11 Mg km−2 yr−1 for forest, grassland, and unused regions, respectively. As shown in Fig. 5f, the relative differences between posterior and prior BC emissions were the smallest in urban areas, with a multiyear average enhancement factor of 1.6, followed by rural areas (a factor of 2.6), forest (a factor of 4.3), and grassland (a factor of 5.5). In general, the bottom-up approach could capture information about energy consumption and pollution controls more easily and accurately in regions with more intensive human activities. Such advantages helped reduce the uncertainty in emission estimates for developed urban areas compared with the uncertainty in remote areas. However, current official statistics do not sufficiently report biofuel consumption and are believed to greatly underestimate raw coal consumption in rural areas (Zhi et al., 2017; Zhu et al., 2019). Limited small-fire detection ability via satellite also led to an underestimation of OBB in forest and grassland areas (Schroeder et al., 2008; Yang and Zhao, 2019). Such limitations resulted in a greater underestimation of prior BC emissions in rural and remote regions compared with urban regions (Fig. S7).
Table 2The annual posterior BC emission intensity of different land-use types during 2000–2020 (with a 5-year interval). The annual emission intensity was estimated as 3 times the sum of BC emission intensity of January, April, July, and October. “Urban” includes city and building categories, and “Rural” includes cropland and countryside categories (unit: Mg km−2 yr−1).
Previous limited studies employing top-down approaches estimated China's BC emissions at 5.7, 3.1, and 2.5 Tg yr−1 for 2000, 2006, and 2008 (Cohen and Wang, 2014; Fu et al., 2012; Wang et al., 2016), respectively. These studies presented a 0.6–5 times enhancement of posterior BC emissions compared with prior BC emissions (C. Chen et al., 2019; Cohen and Wang, 2014; Fu et al., 2012; Wang et al., 2016; Zhang et al., 2015), showing a wider range than the results presented in the current study (2.7–4.1). This discrepancy may have resulted from the application of different inversion approaches, observational data, and prior BC emissions. Moreover, the posterior BC emissions applied in previous studies were lower than those used in the current study for corresponding years by a factor of 12 %–64 %. In general, incomplete spatial coverage in previous studies limited the emission inversion capability in regions far from the observational sites.
3.2.3 Influence of social and economic development on BC emissions
To explore the influence of social and economic development on BC emissions, we analyzed the diverse changing patterns in posterior BC emission intensity (Mg km−2) by province, based on the rural population fraction, provincial proportion of coal production to the national total, and industrial gross domestic product (GDP).
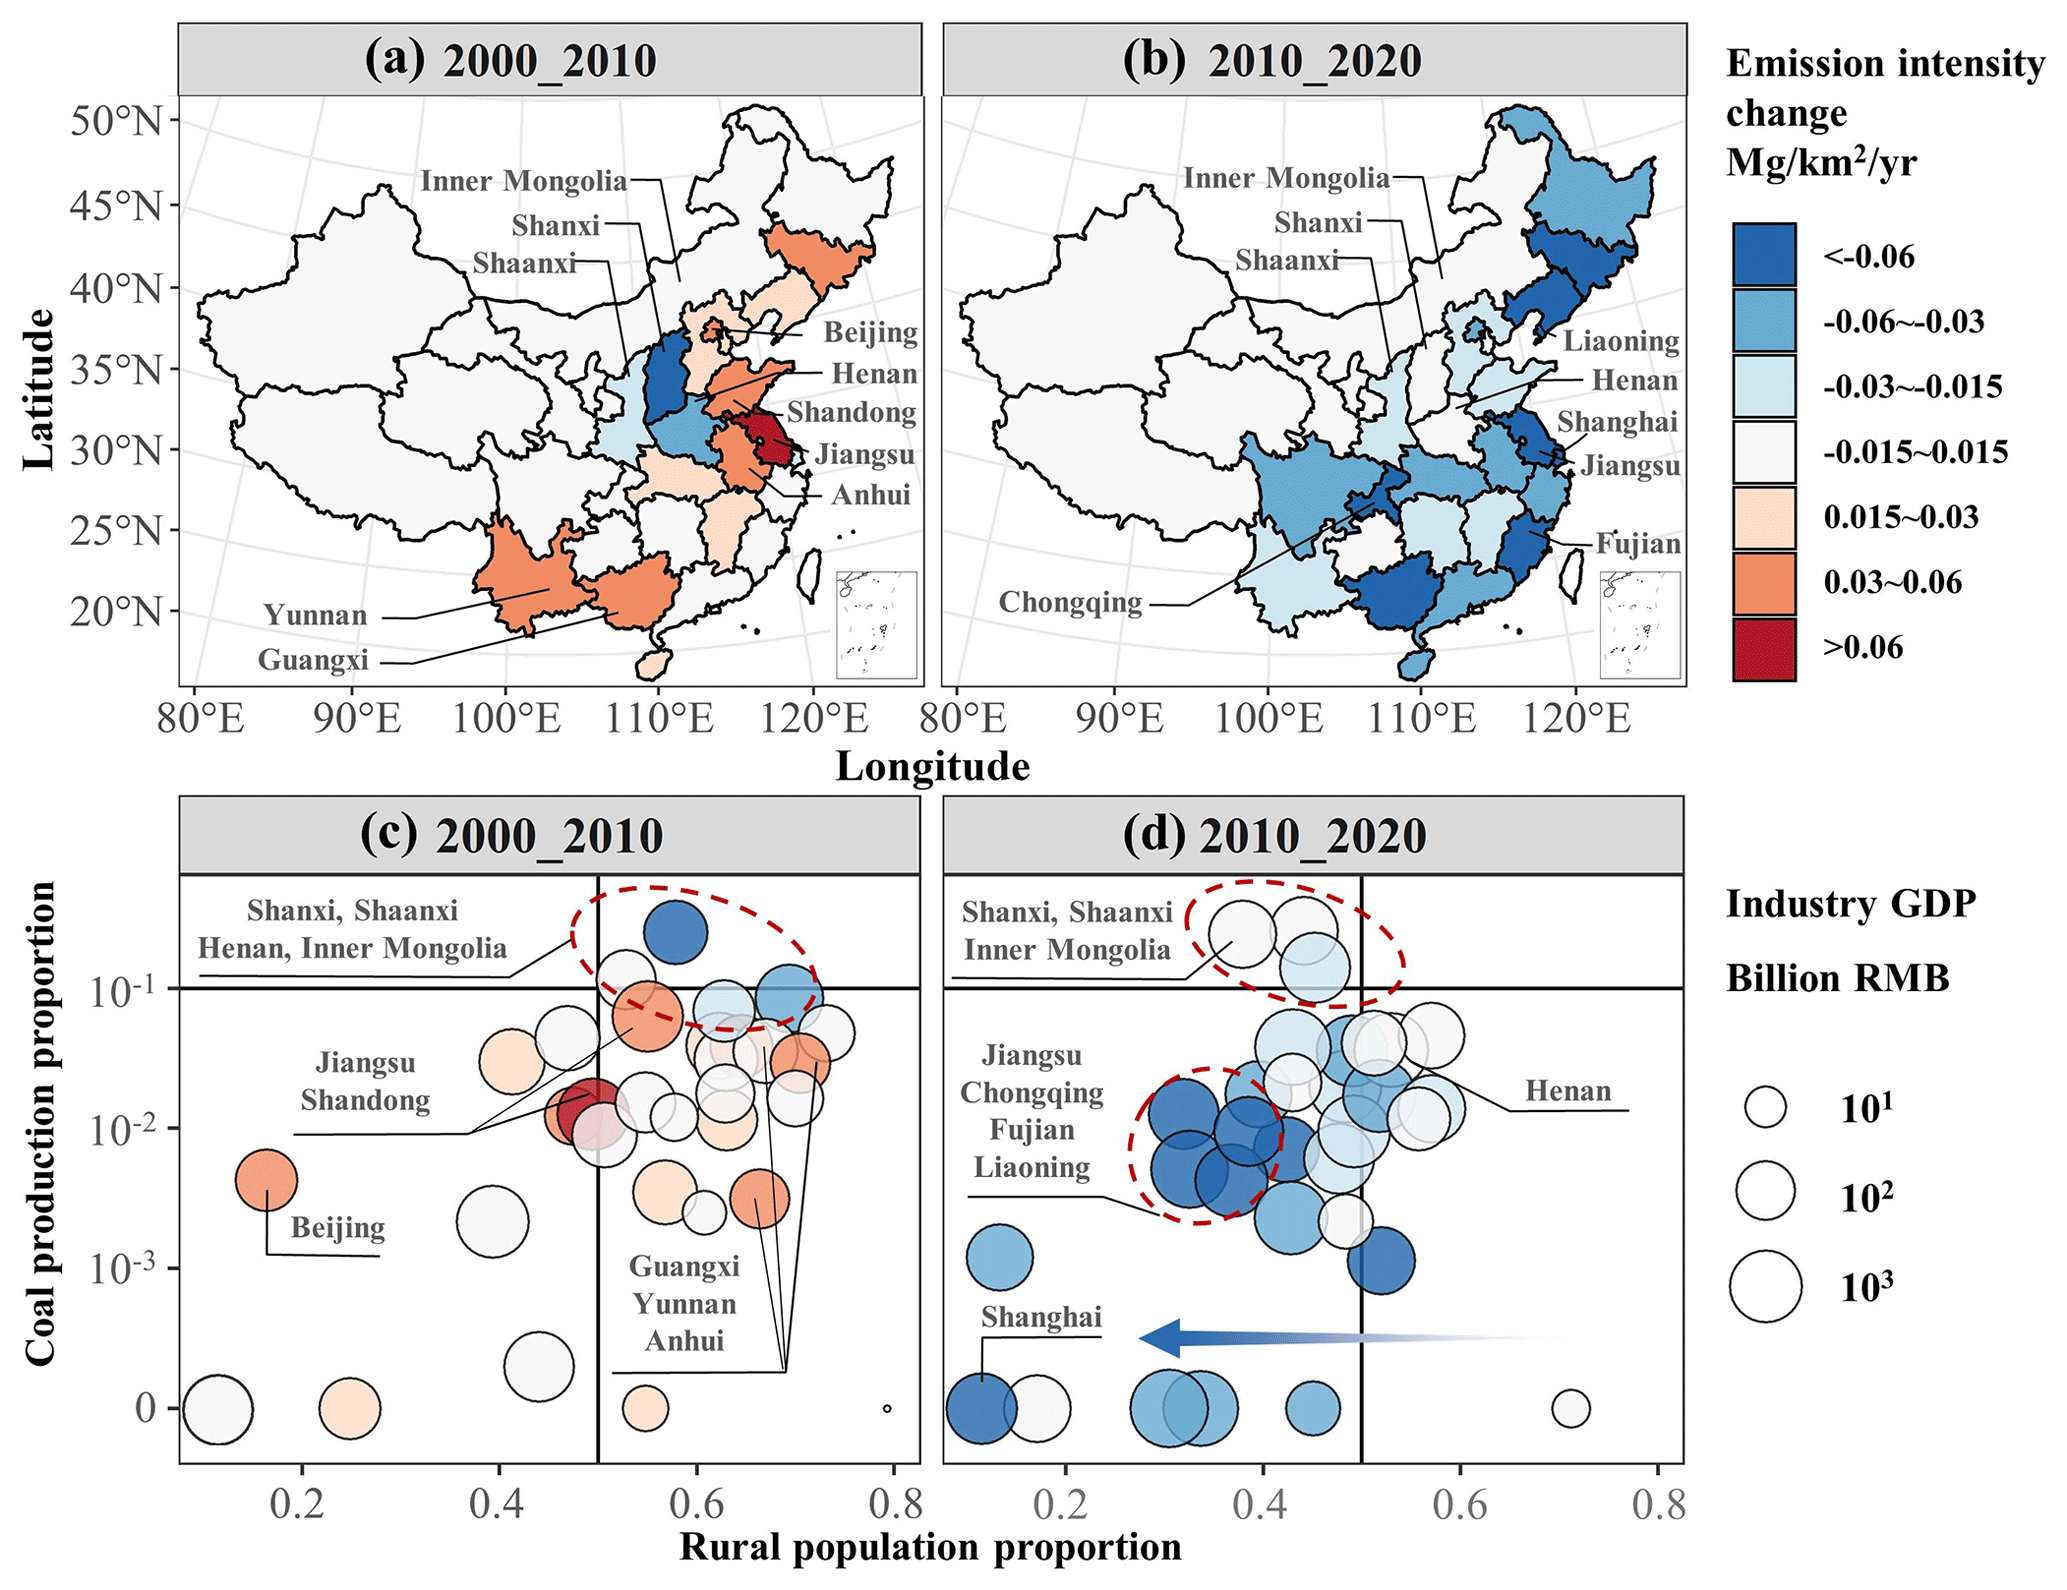
Figure 7Changes in provincial BC emission intensity (annual BC emissions per km2) in posterior BC estimates. (a, b) Spatial distribution of the interannual change rate of BC emission intensity by province during 2000–2010 and 2010–2020. (c, d) Relationships between interannual BC emission intensity change rate and rural population fraction, proportion of coal production, and industrial GDP for each province. The x and y axes present the rural population fraction of each province and the provincial proportion of coal production to the national total for the middle year of the period concerned (i.e., 2005 for (c) and 2015 for (d)), respectively. Circle size represents provincial industrial GDP level. The colors in (c) and (d) are the same as those in (a) and (b). Population, coal production, and GDP statistics were obtained from the National Bureau of Statistics (https://data.stats.gov.cn/english/).
Shanxi, Inner Mongolia, Henan, and Shaanxi were identified as the main coal-producing provinces, collectively contributing 50 % and 68 % to the national total coal production in China during 2000–2010 and 2010–2020, respectively. Shanxi, Henan, and Shaanxi experienced a decline in posterior BC emission intensity during 2000–2010, with annual average decreasing rates estimated at 0.13, 0.03, and 0.02 Mg km−2 yr−1, respectively (Fig. 7a). These provinces have long suffered air pollution from coal burning, and the coal industry's structure and technology were improved earlier than in other provinces. For example, Shanxi eliminated over 7000 small coal mines and an outdated production capacity of 3.85×10⁸ t of coal during 2000–2010 (The Central People's Government of the People's Republic of China, 2011; Han and Wang, 2015). These measures significantly improved coal consumption efficiency, resulting in a sharp decline in BC emission intensity.
In comparison, a slower decline or even growth in BC emission intensity was demonstrated in Shanxi and Henan during 2010–2020, with changing rates of −0.007 and 0.004 Mg km−2 yr−1, respectively (Fig. 7b). Merging and reorganization of the coal industry in these two provinces have enhanced coal production and consumption in recent years, thereby reducing the benefits of BC emission controls. Comparatively faster declines were demonstrated in Inner Mongolia and Shaanxi, with decreasing rates of 0.01 and 0.03 Mg km−2 yr−1, respectively (Fig. 7b). The proportion of coal production in Inner Mongolia and Shaanxi increased from 8 % and 2 % in 2000 to 28 % and 17 % in 2020, respectively, demonstrating the increasingly important role of national coal production in these two provinces (Fig. 7c and d). Compared with Shanxi and Henan, relatively later but greater efforts were made to improve the coal industry's structure in Inner Mongolia and Shaanxi, leading to considerable BC emission reductions after 2010.
Increasing emission intensities were found for most other provinces during 2000–2010, particularly those with high industrial GDP (larger circles in Fig. 7c). Prominent BC emission intensity growth was demonstrated in Jiangsu, Shandong, and Beijing, with the annual average growth rates ranging from 0.05 to 0.10 Mg km−2 yr−1. Intensive industrial production activities in these provinces/cities resulted in quickly increasing emissions. Second to industry-developed regions, Anhui, Guangxi, and Yunnan experienced BC emission growth rates of 0.03–0.05 Mg km−2 yr−1. In these provinces with higher rural population fractions, the enhanced consumption of household solid fuel and limited progress in air pollution controls led to fast BC emission growth, along with an increased demand for living standard improvements.
During 2010–2020, BC emission intensities were estimated to decline for most provinces (Fig. 7b), and faster declines commonly occurred in provinces with higher urbanization and industrial GDP levels (darker blue and larger circles from right to left on the x axis in Fig. 7d). The greatest reductions were demonstrated in Shanghai, Liaoning, Chongqing, Jiangsu, and Fujian, with the decreasing rate ranging from 0.07 to 0.23 Mg km−2 yr−1. During this period, stringent pollution controls in the industrial and transportation sectors took effect, particularly in economically developed and highly urbanized regions, resulting in a faster decline in BC emissions compared with less developed regions. Moreover, the reduced rural population proportion and increased clean energy use jointly restrained household BC emissions.
3.2.4 Comparison of emission and concentration trends for multiple species
We compare the interannual changes in posterior BC emissions with those in national PM2.5, OC, and BC emissions (i.e., prior BC emissions) derived from MEIC, PM2.5 concentrations derived from Tracking Air Pollution in China (http://tapdata.org.cn/, last access: 31 January 2023), and CMAQ-simulated BC concentrations based on posterior BC emissions (Fig. 8). During 2005–2020, the annual BC emissions were estimated to decline by 26 % (posterior BC emissions) or 43 % (prior BC emissions), which was slower than PM2.5 (56 %), and the relative reduction in BC concentrations (14 %) was less than that in PM2.5 (35 %). Compared with total PM2.5, for which the health effects are widely recognized, more attention should be paid to the health effects and control of BC emissions, given their relatively slower decline in ambient concentrations and well-acknowledged higher health risks (Wang et al., 2021; see our estimate on the mortality attributable to BC exposure in Sect. 3.3). Moreover, the comparison between emission trends in warming (BC) and cooling (e.g., OC) species reveals a climate challenge. A faster decline was estimated in OC emissions (47 % during 2005–2020) than in BC emissions, resulting mainly from greatly reduced biofuel use and biomass burning. By contrast, development of the transportation and industrial sectors makes further reductions in BC emissions challenging, and more effective strategies for BC emission controls are urgently needed to restrain climate warming in the future.
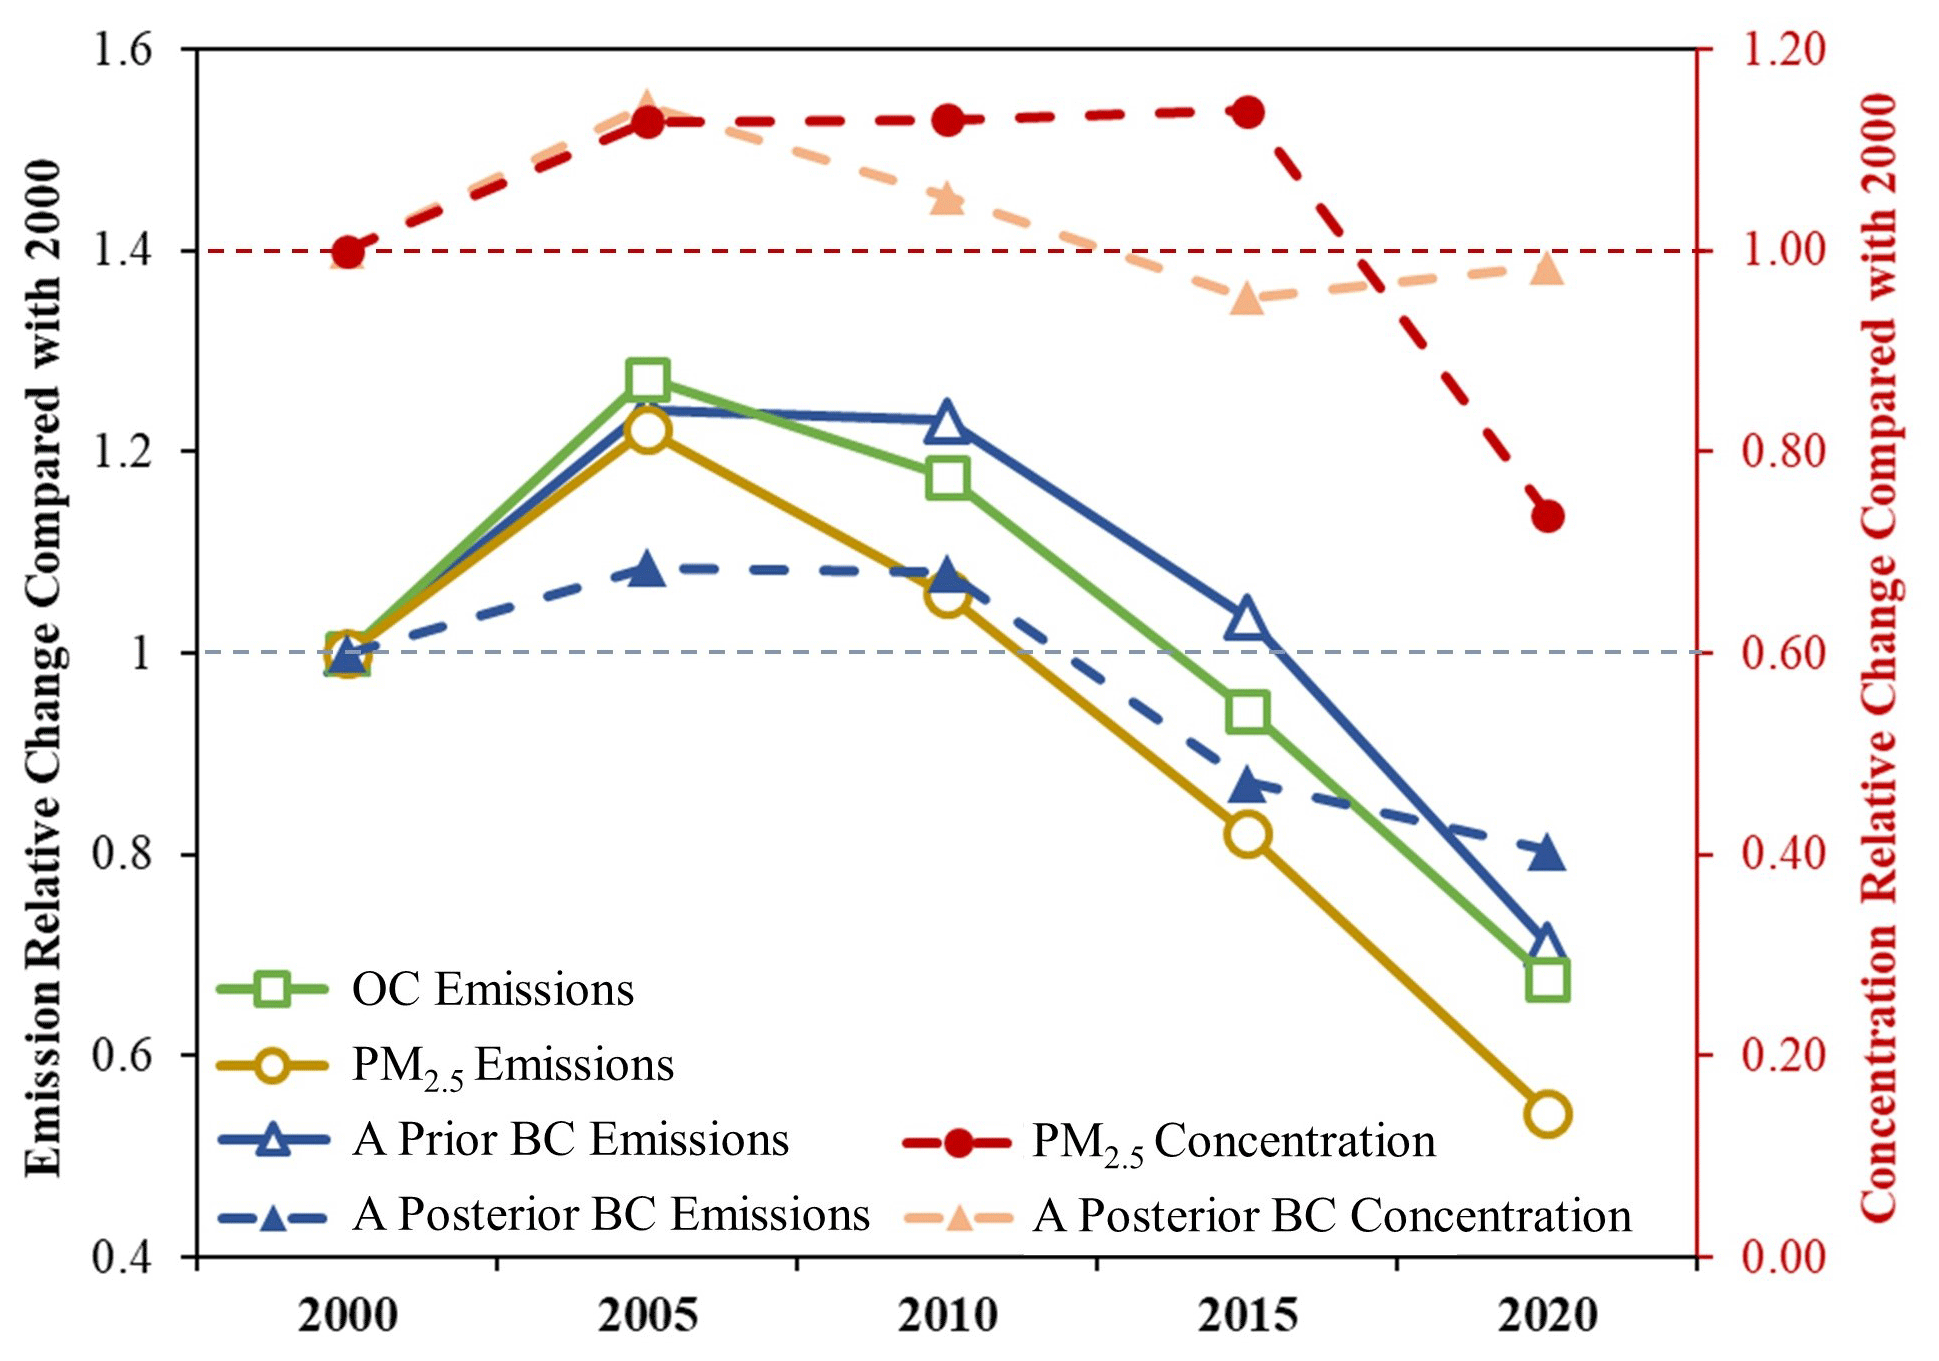
Figure 8Relative changes in the prior and posterior BC, OC, and PM2.5 emissions (left vertical axis) and the posterior BC and PM2.5 concentrations (right vertical axis) during 2000–2020 compared with those of 2000 (with a 5-year interval). OC and PM2.5 emissions are obtained from the Multi-resolution Emission Inventory for China (MEIC, http://www.meicmodel.org). PM2.5 concentrations are obtained from Tracking Air Pollution in China (TAP, http://tapdata.org.cn/, last access: 31 January 2023).
3.3 Mortality attributable to BC exposure and its drivers
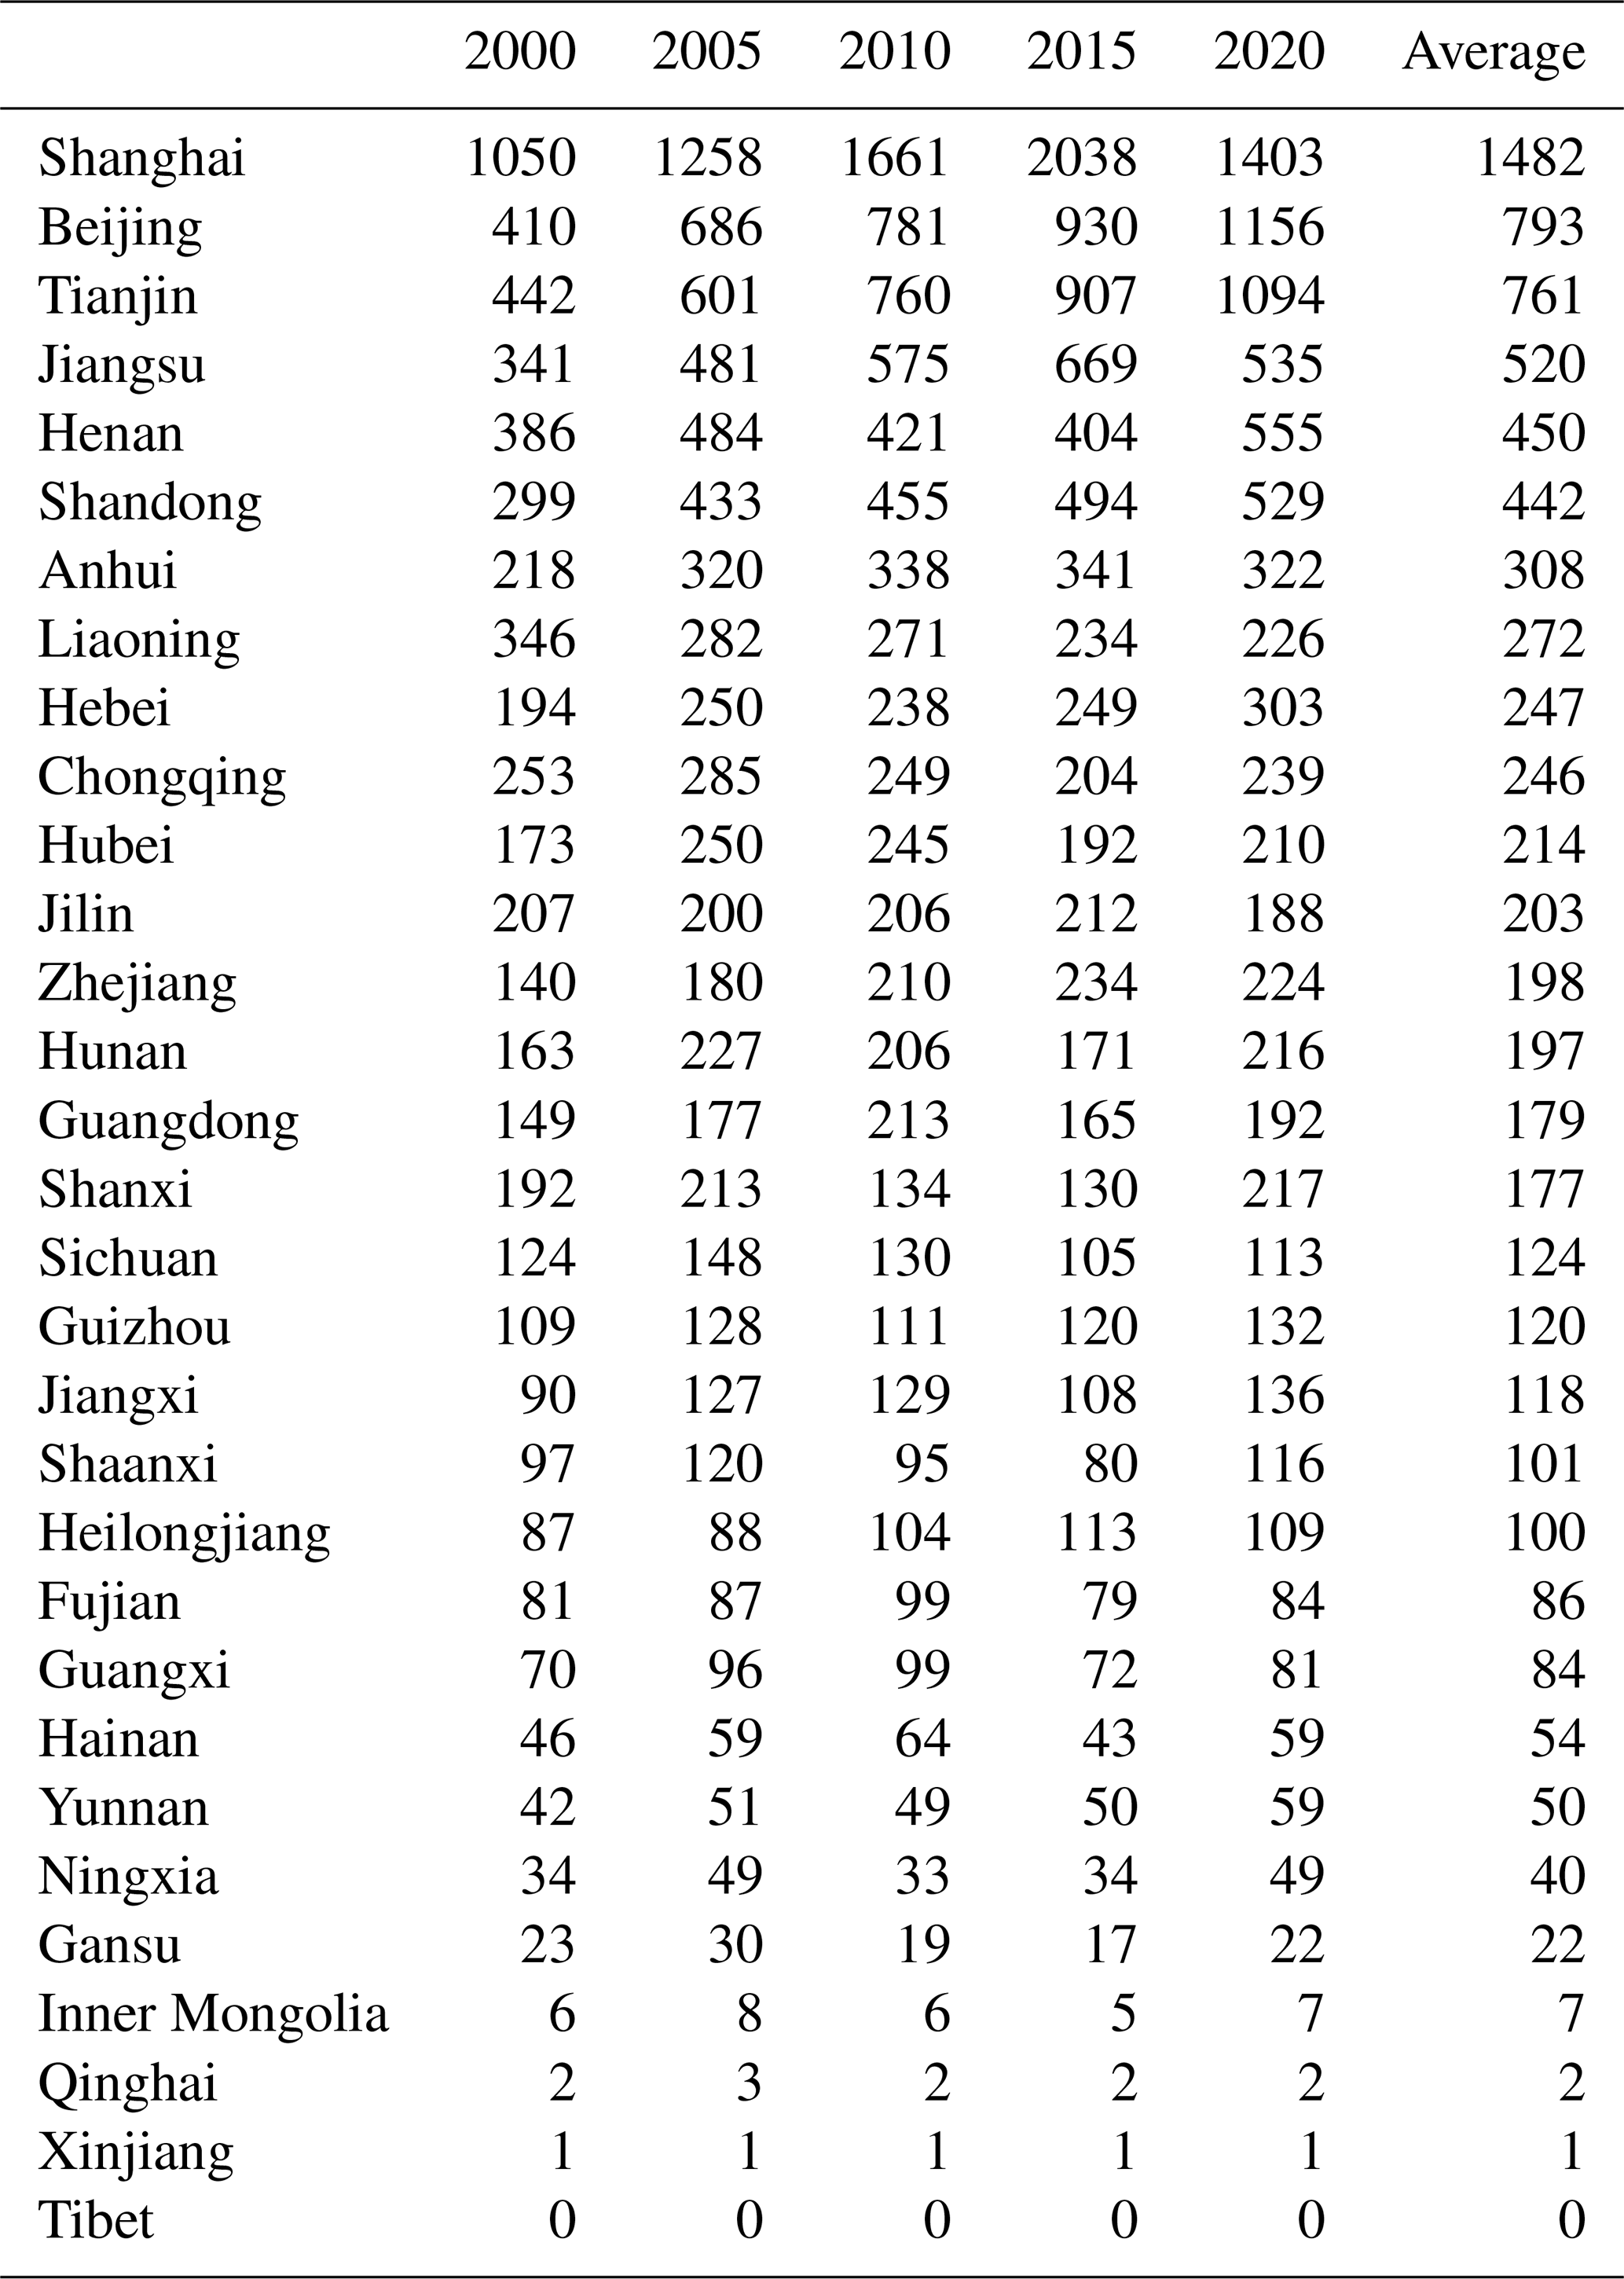
The all-cause premature deaths attributed to BC increased from 733 910 cases (95 % CI: 676 790–800 250) in 2000 to 903 030 cases (832 830–984 530) in 2005, decreased to 857 510 cases (790 500–935 370) in 2015, and finally reached the highest level at 937 980 cases (864 510–1 023 400) in 2020 (Fig. 9). All-cause premature deaths in China attributed to BC exposure were estimated by previous studies to be within the wide range of 50 100–1 436 960 cases, with different BC exposure levels and βBC values used (Cui et al., 2022; Qin et al., 2019; Saikawa et al., 2009; Wang et al., 2021). More premature deaths in eastern China (Fig. S8) were attributed mainly to the relatively high population density and BC exposure from developed industrial and commercial activities (Fig. S9). The highest multiyear average of premature mortality was 1482 cases per 1000 km2 (the all-cause premature deaths attributed to BC per area of 1000 km2) in Shanghai, followed by 793, 761, 520, 450, and 442 cases per 1000 km2 in Beijing, Tianjin, Jiangsu, Henan, and Shandong, respectively (Table 3). These values were much higher than the national average of 86 cases per 1000 km2.
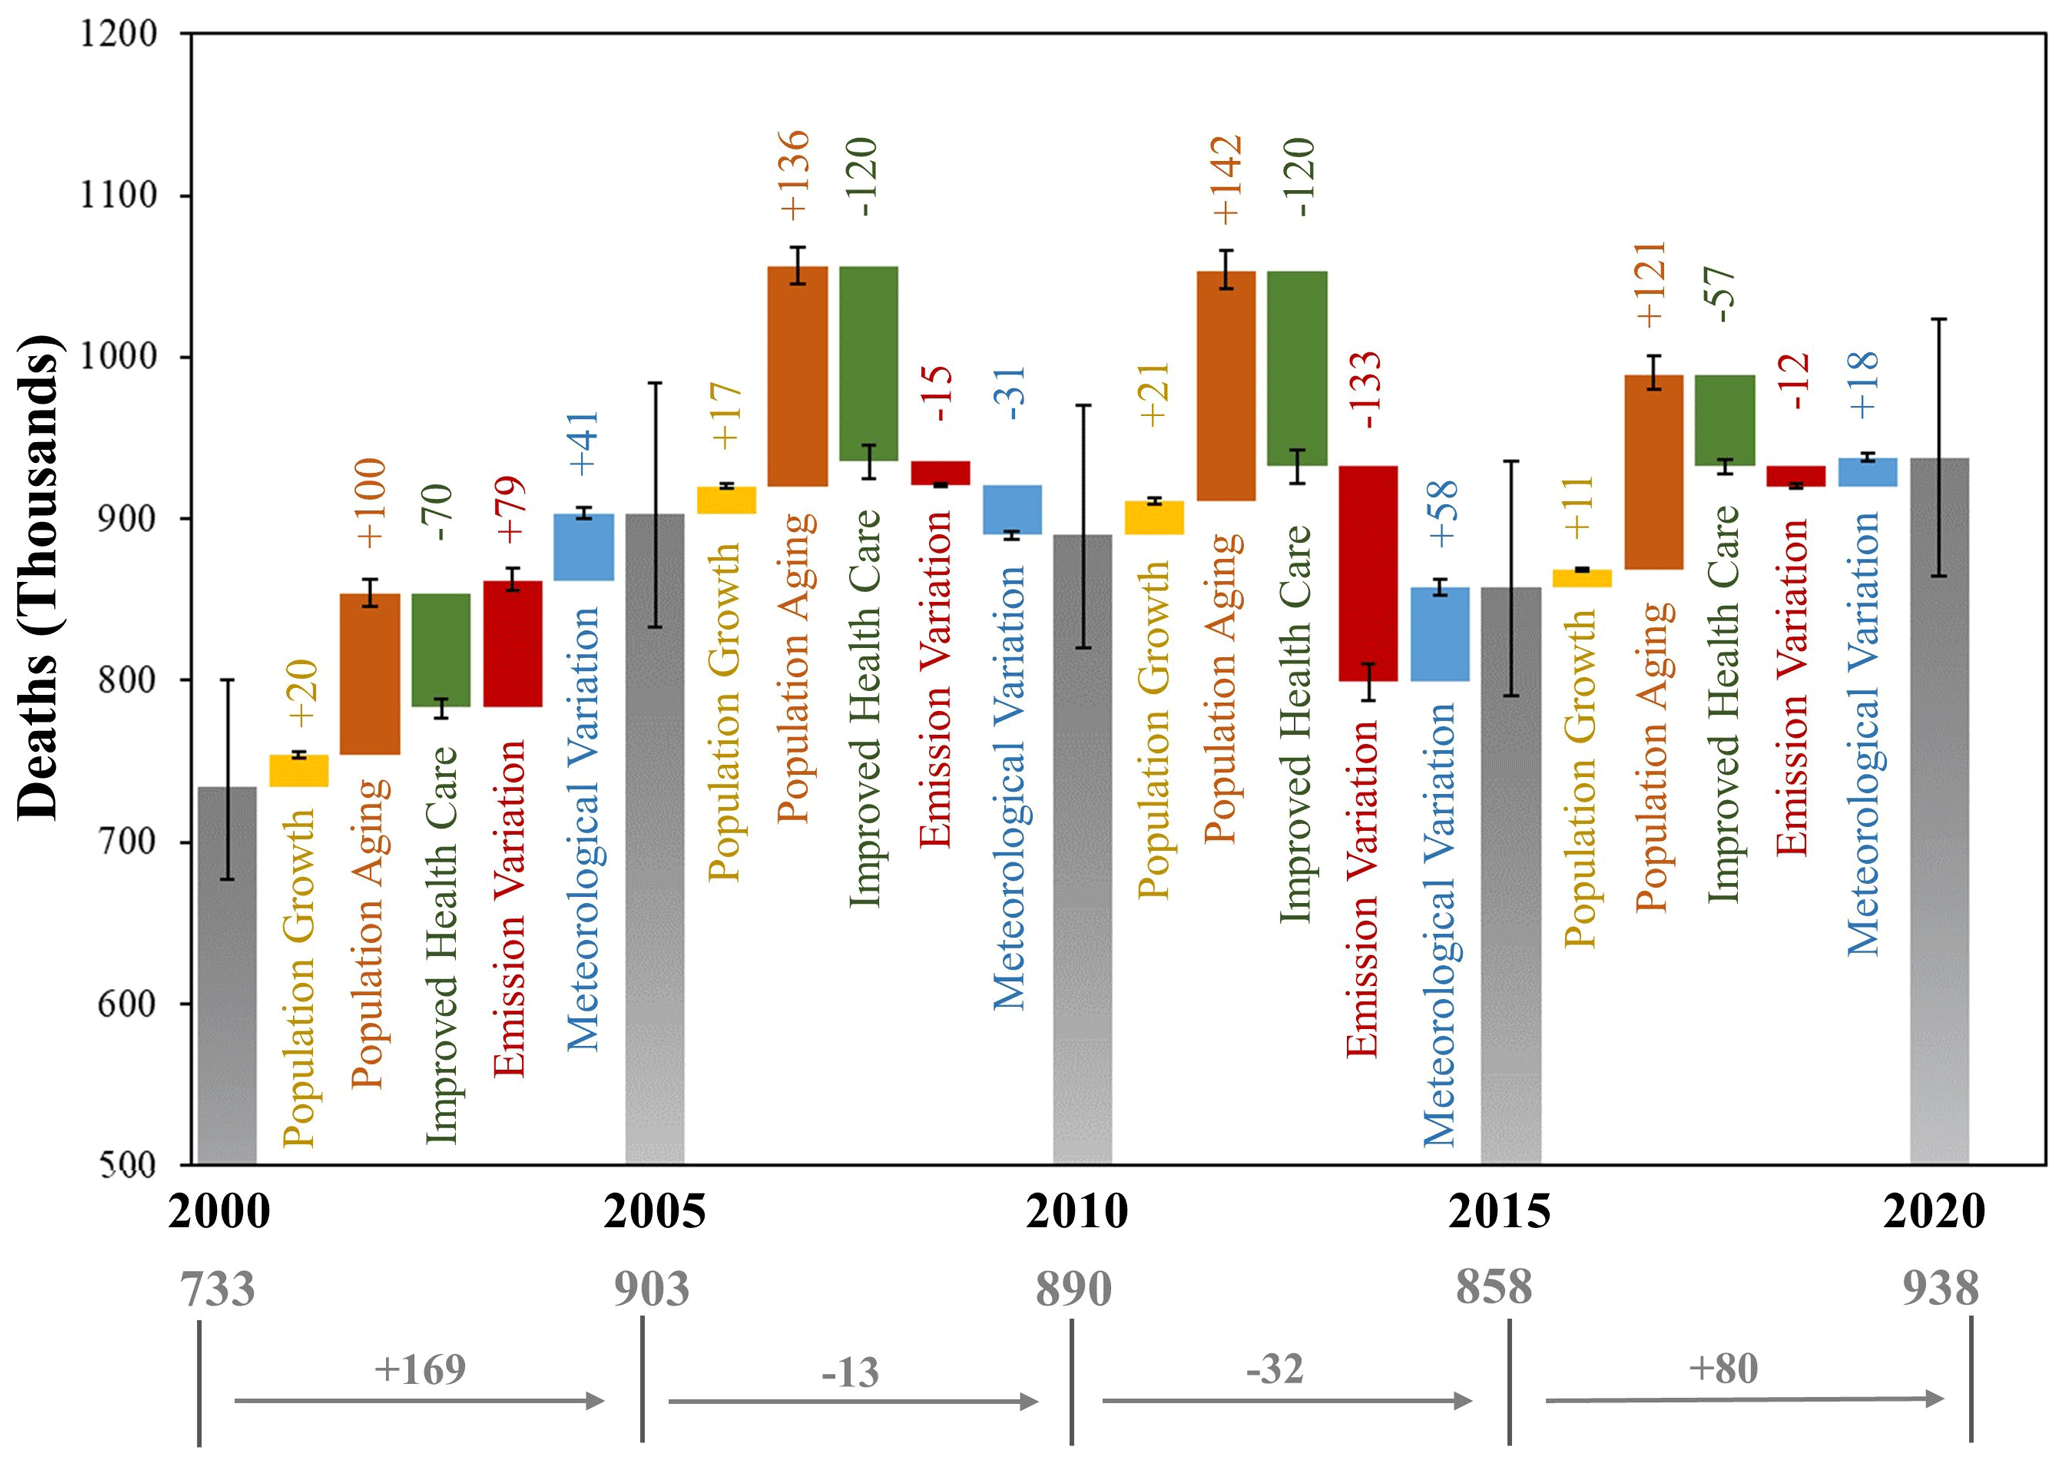
Figure 9Total all-cause premature deaths attributed to BC exposure in China (gray bars) and drivers of changing premature mortality (colored bars) during 2000–2020 (with a 5-year interval). Error bars show the 95 % confidence interval of estimates in this study. The numbers of total all-cause premature deaths are at the bottom of the figure. The contributions of major factors to the national changing mortality are above the colored bars.
Table 3The annual all-cause premature mortality associated with BC exposure by province in mainland China during 2000–2020 with a 5-year interval (unit: cases per 1000 km2). Locations of provinces are shown in Fig. S1a.
Also shown in Fig. 9 are the contributions of major factors to the national changing mortality during 2000–2020 (provincial-level results are presented in Table S13). The changing emission levels played an important role in premature mortality. Along with swift growth in the economy and energy consumption from 2000 to 2010, increasing BC emissions enhanced health risks in China overall and in most provinces. The largest increase in national annual mortality was demonstrated during 2000–2005 (78 590 cases, 95 % CI: 72 520–85 600). However, BC emission reductions in the main coal-producing provinces, i.e., Shanxi, Henan, and Sichuan, led to a decrease in regional health risks during 2005–2010, with declines in annual mortality of 14 320, 13 580, and 8410 cases, respectively. Benefiting from improved air pollution controls from 2010 to 2020, declining health risks associated with BC emission reductions were demonstrated in China overall and in most provinces. The largest decline in national annual mortality associated with BC emission reductions was demonstrated during 2010–2015 (133 360 cases, 123 150–145 180). BC emission rebound in Shanxi and Henan led to elevated regional health risks during 2015–2020, with increases in annual mortality of 7170 and 6190 cases, respectively.
Varying meteorological conditions also affected the health burden. With the exception of 2005–2010, meteorological conditions were estimated to increase BC exposure and the associated mortality for most of the research period, particularly in eastern China (Fig. S10). Among vulnerability factors, population aging contributed most to the increased BC-related health burden, elevating the annual national mortality by 99 800–142 310 cases for the various 5-year intervals. Population growth contributed modestly to the increased health burden in most provinces, with annual national total changes of 10 940–21 230 cases. Exceptions included Sichuan and Hubei, where reduced populations resulted in declining mature mortality. Improved healthcare partly offset the adverse effect, with the annual avoided deaths increasing from 70 100 cases during 2000–2005 to 120 440 cases during 2010–2015. This positive effect shrank to 56 690 cases during 2015–2020. With increased population aging and reduced potential of medical care improvement, greater BC emission abatement will be needed to further prevent health damage.
3.4 Uncertainty analysis
The uncertainties in our results are mainly attributed to (a) separating the contribution of BC to AAOD, (b) simulating BC AAOD based on WRF-CMAQ and the empirical light absorption model, (c) lacking diurnal information of observed BC AAOD, and (d) estimating the premature mortality attributable to BC. Due to the limited number of studies reporting spatiotemporal variability in BrC and dust light absorption in China, we separated BC AAOD based on the MERRA-2 dataset, which may underestimate BrC light absorption at 483 nm (Buchard et al., 2017). Herein, the multiyear average BrC share in AAOD was estimated at 16 % (MERRA-2) in eastern China (Fig. S11), lower than that based on observations (18 %–44 %; S. Chen et al., 2019; Li et al., 2019; Zhu et al., 2021). Notably, the multiyear average of posterior BC emissions using AAOD at a longer wavelength (865 nm) with little BrC effect was estimated to be 11 % lower than that using 483 nm (Test 1 in Text S3 and Fig. 10). The posterior BC emissions based on the dust light absorption fraction in AAOD from Copernicus Atmosphere Monitoring Service (CAMS), which was only half that of MERRA-2 (Fig. S3), were estimated to be very close to those of Test 1 (Test 2 in Text S3 and Fig. 10). In addition, we adopted an empirical model based on observations from one city to simulate MAE. Even with improved performance compared with the average level of multiple CTMs at the global scale (Gliß et al., 2021), our model underestimated MAE and presented smaller regional heterogeneity than existing observations, most likely due to the limited spatial extrapolation ability. When MAE was modified according to available observations across the country, the multiyear average of posterior BC emissions was estimated to be 10 % lower than that without MAE modification (Test 3 in Text S3 and Fig. 10). Besides, the removal processes in CMAQ also affect the BC lifetime simulation and thereby its atmospheric column concentration and emission inversion. The simulated lifetime of 4.7 d in the base case is within the range of 3.8–11.4 d reported by previous studies (Fig. S4; Bond et al., 2013; Vignati et al., 2010). By adjusting the simulated BC lifetime to the multi-model average level (5.5 d; Gliß et al., 2021), the posterior emissions were estimated to be 4 % smaller than those of the base case (Text S3 and Fig. 10). Although modest uncertainties were revealed by the above sensitivity tests, they did not change the main findings of this study, with similar interannual variabilities between the base and sensitivity test cases (Fig. 10). These uncertainties should be reduced with improved spatiotemporal coverage of BC, BrC, and dust light absorption observations. Another limitation of the inversion system was the missing diurnal information of observed AAOD. Since OMI could only provide AAOD at 13:30 LT (local time), we could not capture the diurnal distribution of BC emissions. The Geostationary Environment Monitoring Spectrometer (GEMS; Kim et al., 2020) was launched in 2020 and provided hourly daytime observations of aerosols. This can potentially be helpful for improving the temporal accuracy of BC emission inversion in the future.
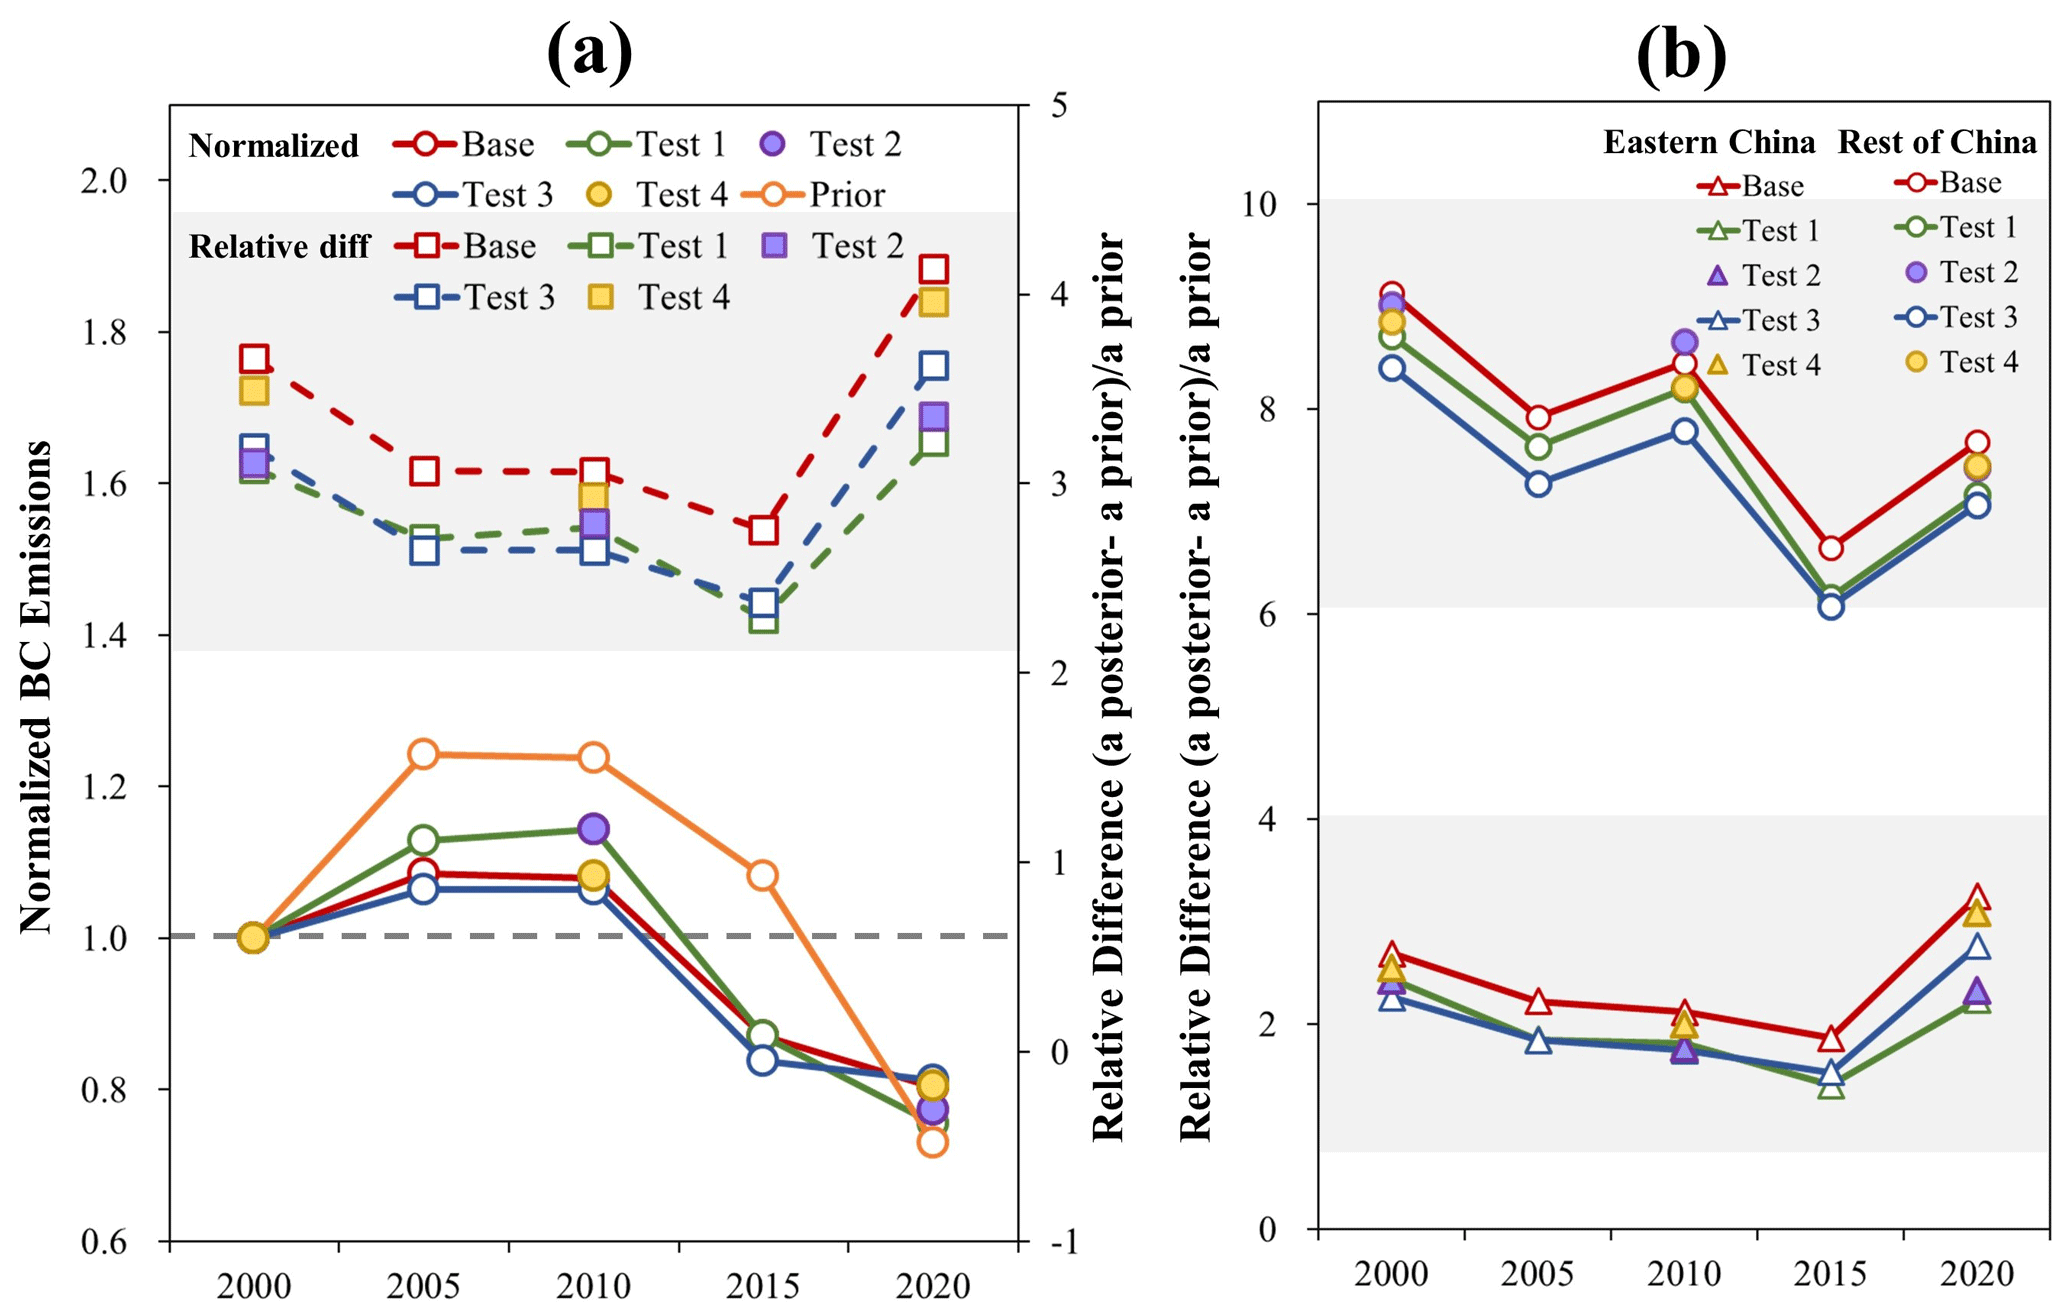
Figure 10(a) Long-term variability in the normalized prior and posterior BC emissions in China during 2000–2020 (compared with 2000, solid lines with left vertical axis, with a 5-year interval) and relative difference between the posterior and prior emissions (dashed lines with right vertical axis) for the base case, Test 1, Test 2, Test 3, and Test 4. (b) Relative difference in eastern China and the rest of China for the base case (red lines and marks), Test 1 (green lines and marks), Test 2 (purple lines and marks), Test 3 (blue lines and marks), and Test 4 (yellow lines and marks).
Furthermore, the health impact estimation could be biased by rare domestic βBC values in China. Previous studies commonly adopted the same functions as PM2.5 (Saikawa et al., 2009) or βBC values obtained from American or European studies (Wang et al., 2021), resulting in large uncertainty. Herein, we relied on a unique cohort study in China and calculated the all-cause premature deaths attributed to BC at 733 910–937 980 per year. The βBC values obtained from national-scale studies in the US and Europe indicate a 10-fold difference (220 980–2 386 060 per year, Table S14), similar to the estimation conducted in the US (Y. Li et al., 2016). More domestic epidemiological studies focusing on BC emissions are expected to further reduce the uncertainty.
Compared with previous studies with nonconsecutive or incomparable estimates, this study provides a panoramic view of the spatiotemporal patterns of AAOD, BC emissions, and the associated mortality in China for the past 2 decades. We found that the bottom-up approach most likely underestimated BC emissions, particularly in less developed western and remote areas. Our findings also reveal the influence of human activities on the evolution of BC emissions and the remarkable emission abatement resulting from the implementation of national pollution controls, particularly in developed regions. Pollution controls were estimated to reduce the annual BC emissions by 26 % during 2010–2020, reversing the 8 % growth during 2000–2010. However, the benefits were smaller than those previously estimated employing the bottom-up approach, which most likely overestimated progress in pollution controls for certain sources, such as the transportation sector and residential solid fuel burning. The long-term BC emission trends in this study address both health and climate risks combined with the effects of other short-lived aerosol species.
The energy transition path to achieve China's goal of peak emissions and carbon neutrality provides an opportunity to further reduce BC emissions. Compared with developed regions, the energy transition and emission abatement is more challenging in coal-producing and less urbanized regions; thus, region-specific emission controls should be formulated. For the main coal-producing provinces, BC emissions have declined much slower than those in economically developed provinces or even rebounded along with increased industrial production capacity and energy demand in recent years. As China's traditional energy base, these provinces need to accelerate energy infrastructure adjustments and reduce their dependence on coal through, for example, the development of photovoltaic and wind power. In addition, aggressively promoting advanced manufacturing technology is recommended. For example, expanding the coal chemical industry chain could shift the role of coal consumption from traditional fuel to raw material, thus achieving its clean utilization (e.g., coal liquefaction and gasification technique). For less urbanized regions, solid fuel, including coal, firewood, and crop residues, remains the major energy source, and actual BC emissions in rural areas could be greatly underestimated compared with those in urban areas. Expansion of natural gas and electricity use for cooking and heating could effectively limit BC emissions in these regions. These efforts can be supported through better infrastructure development and subsidy policy design in the future.
The multiyear gap-filled AAOD data at a horizontal resolution of 0.25° and posterior BC emissions at a horizontal resolution of 27 km are available at http://www.airqualitynju.com/En/Data/List/Datadownload (Zhao, 2024). The OMI AAOD was obtained from https://doi.org/10.5067/Aura/OMI/DATA3004 (Stein-Zweers and Veefkind, 2012). The MERRA-2 data were obtained from https://doi.org/10.5067/FH9A0MLJPC7N (Global Modeling and Assimilation Office, 2023). The land-use data were obtained from https://www.resdc.cn/DOI/DOI.aspx?DOIID=54 (Xu et al., 2024). The elevation data were obtained from https://www.resdc.cn/data.aspx?DATAID=123 (Institute of Geographic Sciences and Natural Resources Research, Chinese Academy of Sciences, 2024). The ground AAOD observation from AERONET was obtained from https://aeronet.gsfc.nasa.gov/new_web/download_all_v3_aod.html (NASA Goddard Space Flight Center, 2024). The ground AAOD observations from SONET, CARSNET, and CARE-China are available upon request to the corresponding author. The prior anthropogenic BC emissions were obtained from http://meicmodel.org.cn/?page_id=560 (Tsinghua University, 2023). The prior BC emissions from open biomass burning were obtained from https://www.geo.vu.nl/~gwerf/GFED/GFED4 (Randerson et al., 2017). The gridded population data were obtained from https://doi.org/10.5258/SOTON/WP00674 (WorldPop, 2018). The annual total population of China was obtained from https://data.stats.gov.cn/english/easyquery.htm?cn=C01 (National Bureau of Statistics, 2024). The national average population age structure and baseline mortality rate of all-cause diseases were obtained from https://vizhub.healthdata.org/gbd-results (Global Health Data Exchange, 2021). The gridded BC emissions of the Emissions Database for Global Atmospheric Research (EDGAR) were obtained from https://edgar.jrc.ec.europa.eu/dataset_ap61 (European Commission, 2022). The code of the CMAQ 5.1 model was obtained from https://doi.org/10.5281/zenodo.1079909 (US EPA Office of Research and Development, 2015).
The supplement related to this article is available online at: https://doi.org/10.5194/acp-24-6593-2024-supplement.
WZ developed the methodology, conducted the research, performed the analyses, and wrote the draft. YZha developed the strategy, designed the research, and revised the manuscript. DC and MM provided the support for air quality modeling. HC, YZhe, JX, ZL, KL, and YH provided the support for the AAOD data.
The contact author has declared that none of the authors has any competing interests.
Publisher’s note: Copernicus Publications remains neutral with regard to jurisdictional claims made in the text, published maps, institutional affiliations, or any other geographical representation in this paper. While Copernicus Publications makes every effort to include appropriate place names, the final responsibility lies with the authors. Regarding the maps used in this paper, please note that Figs. 3 and 5–7 contain disputed territories.
This work was sponsored by the National Key Research and Development Program of China (grant no. 2023YFC3709802), National Natural Science Foundation of China (grant no. 42177080), and Key Research and Development Programme of Jiangsu Province (grant no. BE2022838). We thank Qiang Zhang from Tsinghua University for the emission data (MEIC) and Cheng Huang from Shanghai Academy of Environmental Sciences (SAES) for the BC observation data. We also appreciate Jiandong Wang from Nanjing University of Information Science Information Science and Technology for advice on BC lifetime analysis.
This research has been supported by the National Key Research and Development Program of China (grant no. 2023YFC3709802), National Natural Science Foundation of China (grant no. 42177080), and Key Research and Development Programme of Jiangsu Province (grant no. BE2022838).
This paper was edited by Dantong Liu and reviewed by two anonymous referees.
Ahn, C., Torres, O., and Bhartia, P. K.: Comparison of Ozone Monitoring Instrument UV Aerosol Products with Aqua/Moderate Resolution Imaging Spectroradiometer and Multiangle Imaging Spectroradiometer observations in 2006, J. Geophys. Res.-Atmos., 113, D16S27, https://doi.org/10.1029/2007jd008832, 2008.
Bond, T. C., Doherty, S. J., Fahey, D. W., Forster, P. M., Berntsen, T., DeAngelo, B. J., Flanner, M. G., Ghan, S., Karcher, B., Koch, D., Kinne, S., Kondo, Y., Quinn, P. K., Sarofim, M. C., Schultz, M. G., Schulz, M., Venkataraman, C., Zhang, H., Zhang, S., Bellouin, N., Guttikunda, S. K., Hopke, P. K., Jacobson, M. Z., Kaiser, J. W., Klimont, Z., Lohmann, U., Schwarz, J. P., Shindell, D., Storelvmo, T., Warren, S. G., and Zender, C. S.: Bounding the role of black carbon in the climate system: A scientific assessment, J. Geophys. Res.-Atmos., 118, 5380–5552, https://doi.org/10.1002/jgrd.50171, 2013.
Buchard, V., Randles, C. A., da Silva, A. M., Darmenov, A., Colarco, P. R., Govindaraju, R., Ferrare, R., Hair, J., Beyersdorf, A. J., Ziemba, L. D., and Yu, H.: The MERRA-2 Aerosol Reanalysis, 1980 Onward. Part II: Evaluation and Case Studies, J. Climate, 30, 6851–6872, https://doi.org/10.1175/jcli-d-16-0613.1, 2017.
Che, H., Zhang, X.-Y., Xia, X., Goloub, P., Holben, B., Zhao, H., Wang, Y., Zhang, X.-C., Wang, H., Blarel, L., Damiri, B., Zhang, R., Deng, X., Ma, Y., Wang, T., Geng, F., Qi, B., Zhu, J., Yu, J., Chen, Q., and Shi, G.: Ground-based aerosol climatology of China: aerosol optical depths from the China Aerosol Remote Sensing Network (CARSNET) 2002–2013, Atmos. Chem. Phys., 15, 7619–7652, https://doi.org/10.5194/acp-15-7619-2015, 2015.
Chen, C., Dubovik, O., Henze, D. K., Chin, M., Lapyonok, T., Schuster, G. L., Ducos, F., Fuertes, D., Litvinov, P., Li, L., Lopatin, A., Hu, Q., and Torres, B.: Constraining global aerosol emissions using POLDER/PARASOL satellite remote sensing observations, Atmos. Chem. Phys., 19, 14585–14606, https://doi.org/10.5194/acp-19-14585-2019, 2019.
Chen, D., Zhao, Y., Lyu, R. T., Wu, R. R., Dai, L., Zhao, Y., Chen, F., Zhang, J., Yu, H., and Guan, M.: Seasonal and spatial variations of optical properties of light absorbing carbon and its influencing factors in a typical polluted city in Yangtze River Delta, China, Atmos. Environ., 199, 45–54, https://doi.org/10.1016/j.atmosenv.2018.11.022, 2019.
Chen, L., Gao, Y., Zhang, M., Fu, J. S., Zhu, J., Liao, H., Li, J., Huang, K., Ge, B., Wang, X., Lam, Y. F., Lin, C.-Y., Itahashi, S., Nagashima, T., Kajino, M., Yamaji, K., Wang, Z., and Kurokawa, J.: MICS-Asia III: multi-model comparison and evaluation of aerosol over East Asia, Atmos. Chem. Phys., 19, 11911–11937, https://doi.org/10.5194/acp-19-11911-2019, 2019.
Chen, S., Russell, L. M., Cappa, C. D., Zhang, X., Kleeman, M. J., Kumar, A., Liu, D., and Ramanathan, V.: Comparing black and brown carbon absorption from AERONET and surface measurements at wintertime Fresno, Atmos. Environ., 199, 164–176, https://doi.org/10.1016/j.atmosenv.2018.11.032, 2019.
Chen, Y., Chen, R., Chen, Y., Dong, X., Zhu, J., Liu, C., van Donkelaar, A., Martin, R. V., Li, H., Kan, H., Jiang, Q., and Fu, C.: The prospective effects of long-term exposure to ambient PM2.5 and constituents on mortality in rural East China, Chemosphere, 280, 130740, https://doi.org/10.1016/j.chemosphere.2021.130740, 2021.
Cohen, A. J., Brauer, M., Burnett, R., Anderson, H. R., Frostad, J., Estep, K., Balakrishnan, K., Brunekreef, B., Dandona, L., Dandona, R., Feigin, V., Freedman, G., Hubbell, B., Jobling, A., Kan, H., Knibbs, L., Liu, Y., Martin, R., Morawska, L., Pope, C. A., Shin, H., Straif, K., Shaddick, G., Thomas, M., van Dingenen, R., van Donkelaar, A., Vos, T., Murray, C. J. L., and Forouzanfar, M. H.: Estimates and 25-year trends of the global burden of disease attributable to ambient air pollution: an analysis of data from the Global Burden of Diseases Study 2015, Lancet, 389, 1907–1918, https://doi.org/10.1016/s0140-6736(17)30505-6, 2017.
Cohen, J. B. and Wang, C.: Estimating global black carbon emissions using a top-down Kalman Filter approach, J. Geophys. Res.-Atmos., 119, 307–323, https://doi.org/10.1002/2013jd019912, 2014.
Cui, C., Liu, Y., Chen, L., Liang, S., Shan, M., Zhao, J., Liu, Y., Yu, S., Sun, Y., Mao, J., Zhang, H., Gao, S., and Ma, Z.: Assessing public health and economic loss associated with black carbon exposure using monitoring and MERRA-2 data, Environ. Pollut., 313, 120190, https://doi.org/10.1016/j.envpol.2022.120190, 2022.
Cui, H., Mao, P., Zhao, Y., Nielsen, C. P., and Zhang, J.: Patterns in atmospheric carbonaceous aerosols in China: emission estimates and observed concentrations, Atmos. Chem. Phys., 15, 8657–8678, https://doi.org/10.5194/acp-15-8657-2015, 2015.
European Commission: Emissions Database for Global Atmospheric Research (EDGAR), European Commission, release EDGAR v6.1_AP (1970–2018) of May 2022, Joint Research Center (EC-JRC)/Netherlands Environmental Assessment Agency (PBL) [data set], https://edgar.jrc.ec.europa.eu/dataset_ap61 (last access: 10 May 2023), 2022.
Evangeliou, N., Thompson, R. L., Eckhardt, S., and Stohl, A.: Top-down estimates of black carbon emissions at high latitudes using an atmospheric transport model and a Bayesian inversion framework, Atmos. Chem. Phys., 18, 15307–15327, https://doi.org/10.5194/acp-18-15307-2018, 2018.
Fu, T.-M., Cao, J. J., Zhang, X. Y., Lee, S. C., Zhang, Q., Han, Y. M., Qu, W. J., Han, Z., Zhang, R., Wang, Y. X., Chen, D., and Henze, D. K.: Carbonaceous aerosols in China: top-down constraints on primary sources and estimation of secondary contribution, Atmos. Chem. Phys., 12, 2725–2746, https://doi.org/10.5194/acp-12-2725-2012, 2012.
Geng, G., Zheng, Y., Zhang, Q., Xue, T., Zhao, H., Tong, D., Zheng, B., Li, M., Liu, F., Hong, C., He, K., and Davis, S. J.: Drivers of PM2.5 air pollution deaths in China 2002–2017, Nat. Geosci., 14, 645–650, https://doi.org/10.1038/s41561-021-00792-3, 2021.
Gliß, J., Mortier, A., Schulz, M., Andrews, E., Balkanski, Y., Bauer, S. E., Benedictow, A. M. K., Bian, H., Checa-Garcia, R., Chin, M., Ginoux, P., Griesfeller, J. J., Heckel, A., Kipling, Z., Kirkevåg, A., Kokkola, H., Laj, P., Le Sager, P., Lund, M. T., Lund Myhre, C., Matsui, H., Myhre, G., Neubauer, D., van Noije, T., North, P., Olivié, D. J. L., Rémy, S., Sogacheva, L., Takemura, T., Tsigaridis, K., and Tsyro, S. G.: AeroCom phase III multi-model evaluation of the aerosol life cycle and optical properties using ground- and space-based remote sensing as well as surface in situ observations, Atmos. Chem. Phys., 21, 87–128, https://doi.org/10.5194/acp-21-87-2021, 2021.
Global Health Data Exchange: The national average population age structure and baseline mortality rate of all-cause diseases, Institute for Health Metrics and Evaluation [data set], https://vizhub.healthdata.org/gbd-results (last access: 5 June 2024), 2021.
Global Modeling and Assimilation Office (GMAO): MERRA-2 tavgM_2d_aer_Nx: 2d, Monthly mean, Time-averaged, Single-Level, Assimilation, Aerosol Diagnostics V5.12.4, Greenbelt, MD, USA, Goddard Earth Sciences Data and Information Services Center (GES DISC) [data set], https://doi.org/10.5067/FH9A0MLJPC7N, 2023.
Gu, Y. F., Zhang, W. S., Yang, Y. J., Wang, C., Streets, D. G., and Yim, S. H. L.: Assessing outdoor air quality and public health impact attributable to residential black carbon emissions in rural China, Resour. Conserv. Recycl., 159, 104812, https://doi.org/10.1016/j.resconrec.2020.104812, 2020.
Guan, D., Liu, Z., Geng, Y., Lindner, S., and Hubacek, K.: The gigatonne gap in China's carbon dioxide inventories, Nat. Clim. Change, 2, 672–675, https://doi.org/10.1038/nclimate1560, 2012.
Guerrette, J. J. and Henze, D. K.: Four-dimensional variational inversion of black carbon emissions during ARCTAS-CARB with WRFDA-Chem, Atmos. Chem. Phys., 17, 7605–7633, https://doi.org/10.5194/acp-17-7605-2017, 2017.
Han, Y. and Wang, Y.: Study on development, trend and countermeasures of coal industry in Shanxi province, China Economist, 318, 22–25, 2015 (in Chinese).
Harmsen, M. J. H. M., van Dorst, P., van Vuuren, D. P., van den Berg, M., Van Dingenen, R., and Klimont, Z.: Co-benefits of black carbon mitigation for climate and air quality, Clim. Change, 163, 1519-1538, https://doi.org/10.1007/s10584-020-02800-8, 2020.
Hu, Z., Zhao, C., Huang, J., Leung, L. R., Qian, Y., Yu, H., Huang, L., and Kalashnikova, O. V.: Trans-Pacific transport and evolution of aerosols: evaluation of quasi-global WRF-Chem simulation with multiple observations, Geosci. Model Dev., 9, 1725–1746, https://doi.org/10.5194/gmd-9-1725-2016, 2016.
Huang, L., Zhu, Y., Zhai, H., Xue, S., Zhu, T., Shao, Y., Liu, Z., Emery, C., Yarwood, G., Wang, Y., Fu, J., Zhang, K., and Li, L.: Recommendations on benchmarks for numerical air quality model applications in China – Part 1: PM2.5 and chemical species, Atmos. Chem. Phys., 21, 2725–2743, https://doi.org/10.5194/acp-21-2725-2021, 2021.
Institute of Geographic Sciences and Natural Resources Research, Chinese Academy of Sciences: National DEM data at resolution of 1 km, 500 m and 250 m in China, Resource and Environmental Science Data Platform [data set], https://www.resdc.cn/data.aspx?DATAID=123, last access: 5 June 2024.
Kim, J., Jeong, U., Ahn, M.-H., Kim, J. H., Park, R. J., Lee, H., Song, C. H., Choi, Y.-S., Lee, K.-H., Yoo, J.-M., Jeong, M.-J., Park, S. K., Lee, K.-M., Song, C.-K., Kim, S.-W., Kim, Y. J., Kim, S.-W., Kim, M., Go, S., Liu, X., Chance, K., Chan Miller, C., Al-Saadi, J., Veihelmann, B., Bhartia, P. K., Torres, O., Abad, G. G., Haffner, D. P., Ko, D. H., Lee, S. H., Woo, J.-H., Chong, H., Park, S. S., Nicks, D., Choi, W. J., Moon, K.-J., Cho, A., Yoon, J., Kim, S.-k., Hong, H., Lee, K., Lee, H., Lee, S., Choi, M., Veefkind, P., Levelt, P. F., Edwards, D. P., Kang, M., Eo, M., Bak, J., Baek, K., Kwon, H.-A., Yang, J., Park, J., Han, K. M., Kim, B.-R., Shin, H.-W., Choi, H., Lee, E., Chong, J., Cha, Y., Koo, J.-H., Irie, H., Hayashida, S., Kasai, Y., Kanaya, Y., Liu, C., Lin, J., Crawford, J. H., Carmichael, G. R., Newchurch, M. J., Lefer, B. L., Herman, J. R., Swap, R. J., Lau, A. K. H., Kurosu, T. P., Jaross, G., Ahlers, B., Dobber, M., McElroy, C. T., and Choi, Y.: New Era of Air Quality Monitoring from Space: Geostationary Environment Monitoring Spectrometer (GEMS), B. Am. Meteorol. Soc., 101, E1–E22, https://doi.org/10.1175/bams-d-18-0013.1, 2020.
Klimont, Z., Cofala, J., Xing, J., Wei, W., Zhang, C., Wang, S., Kejun, J., Bhandari, P., Mathur, R., Purohit, P., Rafaj, P., Chambers, A., Amann, M., and Hao, J.: Projections of SO2, NOx and carbonaceous aerosols emissions in Asia, Tellus B, 61B, 602-617, https://doi.org/10.1111/j.1600-0889.2009.00428.x, 2009.
Kurokawa, J. and Ohara, T.: Long-term historical trends in air pollutant emissions in Asia: Regional Emission inventory in ASia (REAS) version 3, Atmos. Chem. Phys., 20, 12761–12793, https://doi.org/10.5194/acp-20-12761-2020, 2020.
Lei, Y., Zhang, Q., He, K. B., and Streets, D. G.: Primary anthropogenic aerosol emission trends for China, 1990–2005, Atmos. Chem. Phys., 11, 931–954, https://doi.org/10.5194/acp-11-931-2011, 2011.
Li, M., Liu, H., Geng, G. N., Hong, C. P., Liu, F., Song, Y., Tong, D., Zheng, B., Cui, H. Y., Man, H. Y., Zhang, Q., and He, K. B.: Anthropogenic emission inventories in China: a review, Natl. Sci. Rev., 4, 834–866, https://doi.org/10.1093/nsr/nwx150, 2017.
Li, S. S., Yu, C., Chen, L. F., Tao, J. H., Letu, H., Ge, W., Si, Y. D., and Liu, Y.: Inter-comparison of model-simulated and satellite-retrieved componential aerosol optical depths in China, Atmos. Environ., 141, 320–332, https://doi.org/10.1016/j.atmosenv.2016.06.075, 2016.
Li, Y., Henze, D. K., Jack, D., Henderson, B. H., and Kinney, P. L.: Assessing public health burden associated with exposure to ambient black carbon in the United States, Sci. Total Environ., 539, 515–525, https://doi.org/10.1016/j.scitotenv.2015.08.129, 2016.
Li, Z., Tan, H., Zheng, J., Liu, L., Qin, Y., Wang, N., Li, F., Li, Y., Cai, M., Ma, Y., and Chan, C. K.: Light absorption properties and potential sources of particulate brown carbon in the Pearl River Delta region of China, Atmos. Chem. Phys., 19, 11669–11685, https://doi.org/10.5194/acp-19-11669-2019, 2019.
Li, Z. Q., Xu, H., Li, K. T., Li, D. H., Xie, Y. S., Li, L., Zhang, Y., Gu, X. F., Zhao, W., Tian, Q. J., Deng, R. R., Su, X. L., Huang, B., Qiao, Y. L., Cui, W. Y., Hu, Y., Gong, C. L., Wang, Y. Q., Wang, X. F., Wang, J. P., Du, W. B., Pan, Z. Q., Li, Z. Z., and Bu, D.: Comprehensive Study of Optical, Physical, Chemical, and Radiative Properties of Total Columnar Atmospheric Aerosols over China: An Overview of Sun–Sky Radiometer Observation Network (SONET) Measurements, B. Am. Meteorol. Soc., 99, 739–755, https://doi.org/10.1175/BAMS-D-17-0133.1, 2018.
Liang, F. C., Xiao, Q. Y., Huang, K. Y., Yang, X. L., Liu, F. C., Li, J. X., Lu, X. F., Liu, Y., and Gu, D. F.: The 17-y spatiotemporal trend of PM2.5 and its mortality burden in China, P. Natl. Acad. Sci. USA, 117, 25601–25608, https://doi.org/10.1073/pnas.1919641117, 2020.
Liu, B., Tan, X., Jin, Y., Yu, W., and Li, C.: Application of RR-XGBoost combined model in data calibration of micro air quality detector, Sci. Rep., 11, 15662, https://doi.org/10.1038/s41598-021-95027-1, 2021.
Liu, S., Geng, G., Xiao, Q., Zheng, Y., Liu, X., Cheng, J., and Zhang, Q.: Tracking Daily Concentrations of PM2.5 Chemical Composition in China since 2000, Environ. Sci. Technol., 56, 16517–16527, https://doi.org/10.1021/acs.est.2c06510, 2022.
Liu, Y., Wang, M., Qian, Y., and Ding, A.: A Strong Anthropogenic Black Carbon Forcing Constrained by Pollution Trends Over China, Geophys. Res. Lett., 49, e2022GL098965, https://doi.org/10.1029/2022gl098965, 2022.
Louis, C., Liu, Y., Tassel, P., Perret, P., Chaumond, A., and André, M.: PAH, BTEX, carbonyl compound, black-carbon, NO2 and ultrafine particle dynamometer bench emissions for Euro 4 and Euro 5 diesel and gasoline passenger cars, Atmos. Environ., 141, 80–95, https://doi.org/10.1016/j.atmosenv.2016.06.055, 2016.
Lu, Y., Wang, Q. G., Zhang, X. H., Qian, Y., and Qian, X.: China's black carbon emission from fossil fuel consumption in 2015, 2020, and 2030, Atmos. Environ., 212, 201–207, https://doi.org/10.1016/j.atmosenv.2019.04.032, 2019.
Lu, Z., Zhang, Q., and Streets, D. G.: Sulfur dioxide and primary carbonaceous aerosol emissions in China and India, 1996–2010, Atmos. Chem. Phys., 11, 9839–9864, https://doi.org/10.5194/acp-11-9839-2011, 2011.
Lyu, B., Hu, Y., Zhang, W., Du, Y., Luo, B., Sun, X., Sun, Z., Deng, Z., Wang, X., Liu, J., Wang, X., and Russell, A. G.: Fusion Method Combining Ground-Level Observations with Chemical Transport Model Predictions Using an Ensemble Deep Learning Framework: Application in China to Estimate Spatiotemporally-Resolved PM2.5 Exposure Fields in 2014–2017, Environ. Sci. Technol., 53, 7306–7315, https://doi.org/10.1021/acs.est.9b01117, 2019.
McDuffie, E. E., Smith, S. J., O'Rourke, P., Tibrewal, K., Venkataraman, C., Marais, E. A., Zheng, B., Crippa, M., Brauer, M., and Martin, R. V.: A global anthropogenic emission inventory of atmospheric pollutants from sector- and fuel-specific sources (1970–2017): an application of the Community Emissions Data System (CEDS), Earth Syst. Sci. Data, 12, 3413–3442, https://doi.org/10.5194/essd-12-3413-2020, 2020.
Middleton, N.: Variability and Trends in Dust Storm Frequency on Decadal Timescales: Climatic Drivers and Human Impacts, Geosciences, 9, 261, https://doi.org/10.3390/geosciences9060261, 2019.
NASA Goddard Space Flight Center: AEROSOL OPTICAL DEPTH (V3)-SOLAR, Aerosol robotic network (AERONET) [data set], https://aeronet.gsfc.nasa.gov/new_web/download_all_v3_aod.html, last access: 5 June 2024.
National Bureau of Statistics: National total population of China, National Bureau of Statistics of China [data set], https://data.stats.gov.cn/english/easyquery.htm?cn=C01, last access: 5 June 2024.
Pani, S. K., Wang, S.-H., Lin, N.-H., Chantara, S., Lee, C.-T., and Thepnuan, D.: Black carbon over an urban atmosphere in northern peninsular Southeast Asia: Characteristics, source apportionment, and associated health risks, Environ. Pollut., 259, 113871, https://doi.org/10.1016/j.envpol.2019.113871, 2020.
Qin, Y. and Xie, S. D.: Spatial and temporal variation of anthropogenic black carbon emissions in China for the period 1980–2009, Atmos. Chem. Phys., 12, 4825–4841, https://doi.org/10.5194/acp-12-4825-2012, 2012.
Qin, Y., Fang, Y. Y., Li, X. Y., Naik, V., Horowitz, L. W., Liu, J. F., Scovronick, N., and Mauzerall, D. L.: Source attribution of black carbon affecting regional air quality, premature mortality and glacial deposition in 2000, Atmos. Environ., 206, 144–155, https://doi.org/10.1016/j.atmosenv.2019.02.048, 2019.
Randerson, J. T., van der Werf, G. R., Giglio, L., Collatz, G. J., and Kasibhatla, P. S.: Global Fire Emissions Database, Version 4.1 (GFEDv4), ORNL DAAC, Oak Ridge, Tennessee, USA [data set], https://www.geo.vu.nl/~gwerf/GFED/GFED4 (last access: 5 June 2024), 2017.
Saikawa, E., Naik, V., Horowitz, L. W., Liu, J., and Mauzerall, D. L.: Present and potential future contributions of sulfate, black and organic carbon aerosols from China to global air quality, premature mortality and radiative forcing, Atmos. Environ., 43, 2814–2822, https://doi.org/10.1016/j.atmosenv.2009.02.017, 2009.
Samset, B. H., Fuglestvedt, J. S., and Lund, M. T.: Delayed emergence of a global temperature response after emission mitigation, Nat. Commun., 11, 3261, https://doi.org/10.1038/s41467-020-17001-1, 2020.
Schroeder, W., Prins, E., Giglio, L., Csiszar, I., Schmidt, C., Morisette, J., and Morton, D.: Validation of GOES and MODIS active fire detection products using ASTER and ETM+ data, Remote Sens. Environ., 112, 2711–2726, https://doi.org/10.1016/j.rse.2008.01.005, 2008.
Schutgens, N., Dubovik, O., Hasekamp, O., Torres, O., Jethva, H., Leonard, P. J. T., Litvinov, P., Redemann, J., Shinozuka, Y., de Leeuw, G., Kinne, S., Popp, T., Schulz, M., and Stier, P.: AEROCOM and AEROSAT AAOD and SSA study – Part 1: Evaluation and intercomparison of satellite measurements, Atmos. Chem. Phys., 21, 6895–6917, https://doi.org/10.5194/acp-21-6895-2021, 2021.
Shindell, D., Kuylenstierna, J. C. I., Vignati, E., van Dingenen, R., Amann, M., Klimont, Z., Anenberg, S. C., Muller, N., Janssens-Maenhout, G., Raes, F., Schwartz, J., Faluvegi, G., Pozzoli, L., Kupiainen, K., Höglund-Isaksson, L., Emberson, L., Streets, D., Ramanathan, V., Hicks, K., Oanh, N. T. K., Milly, G., Williams, M., Demkine, V., and Fowler, D.: Simultaneously Mitigating Near-Term Climate Change and Improving Human Health and Food Security, Science, 335, 183–189, https://doi.org/10.1126/science.1210026, 2012.
Stein-Zweers, D. and Veefkind, P.: OMI/Aura Multi-wavelength Aerosol Optical Depth and Single Scattering Albedo L3 1 day Best Pixel in 0.25 degree x 0.25 degree V3, NASA Goddard Space Flight Center, Goddard Earth Sciences Data and Information Services Center (GES DISC) [data set], https://doi.org/10.5067/Aura/OMI/DATA3004, 2012.
Streets, D. G., Yarber, K. F., Woo, J. H., and Carmichael, G. R.: Biomass burning in Asia: Annual and seasonal estimates and atmospheric emissions, Global Biogeochem. Cy., 17, 1–20, https://doi.org/10.1029/2003gb002040, 2003.
Tao, J., Zhang, L., Cao, J., and Zhang, R.: A review of current knowledge concerning PM2.5 chemical composition, aerosol optical properties and their relationships across China, Atmos. Chem. Phys., 17, 9485–9518, https://doi.org/10.5194/acp-17-9485-2017, 2017.
The Central People's Government of the People's Republic of China: Shanxi Province eliminated more than 200 million tons of backward coal production capacity from 2008 to 2010, The Central People's Government of the People's Republic of China, http://www.gov.cn/jrzg/2011-05/12/content_1862911.htm (last access: 20 January 2023), 2011 (in Chinese).
Tsinghua University: The Multi-resolution Emission Inventory for China (MEIC), Tsinghua University [data set], http://meicmodel.org.cn/?page_id=560 (last access: 25 May 2022), 2023.
US EPA Office of Research and Development: CMAQv5.1 (5.1), Zenodo [code], https://doi.org/10.5281/zenodo.1079909, 2015.
Vignati, E., Karl, M., Krol, M., Wilson, J., Stier, P., and Cavalli, F.: Sources of uncertainties in modelling black carbon at the global scale, Atmos. Chem. Phys., 10, 2595–2611, https://doi.org/10.5194/acp-10-2595-2010, 2010.
Wang, P., Wang, H., Wang, Y. Q., Zhang, X. Y., Gong, S. L., Xue, M., Zhou, C. H., Liu, H. L., An, X. Q., Niu, T., and Cheng, Y. L.: Inverse modeling of black carbon emissions over China using ensemble data assimilation, Atmos. Chem. Phys., 16, 989–1002, https://doi.org/10.5194/acp-16-989-2016, 2016.
Wang, R.: Global Emission Inventory and Atmospheric Transport of Black Carbon: Evaluation of the Associated Exposure, Springer, Berlin Heidelberg, ISBN 978-3-662-46479-3, 2015.
Wang, R., Tao, S., Wang, W., Liu, J., Shen, H., Shen, G., Wang, B., Liu, X., Li, W., Huang, Y., Zhang, Y., Lu, Y., Chen, H., Chen, Y., Wang, C., Zhu, D., Wang, X., Li, B., Liu, W., and Ma, J.: Black carbon emissions in China from 1949 to 2050, Environ. Sci. Technol., 46, 7595–7603, https://doi.org/10.1021/es3003684, 2012.
Wang, R., Tao, S., Balkanski, Y., Ciais, P., Boucher, O., Liu, J., Piao, S., Shen, H., Vuolo, M. R., Valari, M., Chen, H., Chen, Y., Cozic, A., Huang, Y., Li, B., Li, W., Shen, G., Wang, B., and Zhang, Y.: Exposure to ambient black carbon derived from a unique inventory and high-resolution model, P. Natl. Acad. Sci. USA, 111, 2459–2463, https://doi.org/10.1073/pnas.1318763111, 2014.
Wang, R., Andrews, E., Balkanski, Y., Boucher, O., Myhre, G., Samset, B. H., Schulz, M., Schuster, G. L., Valari, M., and Tao, S.: Spatial Representativeness Error in the Ground-Level Observation Networks for Black Carbon Radiation Absorption, Geophys. Res. Lett., 45, 2106–2114, https://doi.org/10.1002/2017GL076817, 2018.
Wang, X., Wang, Y. X., Hao, J. M., Kondo, Y., Irwin, M., Munger, J. W., and Zhao, Y. J.: Top-down estimate of China's black carbon emissions using surface observations: Sensitivity to observation representativeness and transport model error, J. Geophys. Res.-Atmos., 118, 5781–5795, https://doi.org/10.1002/jgrd.50397, 2013.
Wang, Y., Li, X., Shi, Z., Huang, L., Li, J., Zhang, H., Ying, Q., Wang, M., Ding, D., Zhang, X., and Hu, J.: Premature Mortality Associated with Exposure to Outdoor Black Carbon and Its Source Contributions in China, Resour. Conserv. Recycl., 170, 105620, https://doi.org/10.1016/j.resconrec.2021.105620, 2021.
Wang, Y., Zhao, Y., Liu, Y., Jiang, Y., Zheng, B., Xing, J., Liu, Y., Wang, S., and Nielsen, C. P.: Sustained emission reductions have restrained the ozone pollution over China, Nat. Geosci., 16, 967–974, https://doi.org/10.1038/s41561-023-01284-2, 2023.
WorldPop: The spatial distribution of population density in China, School of Geography and Environmental Science, University of Southampton; Department of Geography and Geosciences, University of Louisville; Departement de Geographie, Universite de Namur and Center for International Earth Science Information Network (CIESIN), Columbia University [data set], https://doi.org/10.5258/SOTON/WP00674, 2018.
Xiao, Q. Y., Chang, H. H., Geng, G. N., and Liu, Y.: An Ensemble Machine-Learning Model To Predict Historical PM2.5 Concentrations in China from Satellite Data, Environ. Sci. Technol., 52, 13260–13269, https://doi.org/10.1021/acs.est.8b02917, 2018.
Xin, J., Wang, Y., Pan, Y., Ji, D., Liu, Z., Wen, T., Wang, Y., Li, X., Sun, Y., Sun, J., Wang, P., Wang, G., Wang, X., Cong, Z., Song, T., Hu, B., Wang, L., Tang, G., Gao, W., Guo, Y., Miao, H., Tian, S., and Wang, L.: The Campaign on Atmospheric Aerosol Research Network of China: CARE-China, B. Am. Meteorol. Soc., 96, 1137–1155, https://doi.org/10.1175/BAMS-D-14-00039.1, 2015.
Xu, X., Yang, X., Zhu, B., Tang, Z., Wu, H., and Xie, L.: Characteristics of MERRA-2 black carbon variation in east China during 2000–2016, Atmos. Environ., 222, 117140, https://doi.org/10.1016/j.atmosenv.2019.117140, 2020.
Xu, X. L., Liu, J. Y., Zhang, S. W., Li, R. D., Yan, C. Z., and Wu, S. X.: Remote sensing data of multi-period land use monitoring in China, Institute of Geographic Sciences and Natural Resources Research, Chinese Academy of Sciences [data set], https://www.resdc.cn/DOI/DOI.aspx?DOIID=54, last access: 5 June 2024.
Xue, T., Zheng, Y., Li, X., Liu, J., Zhang, Q., and Zhu, T.: A component-specific exposure-mortality model for ambient PM2.5 in China: findings from nationwide epidemiology based on outputs from a chemical transport model, Faraday Discuss., 226, 551–568, https://doi.org/10.1039/d0fd00093k, 2021.
Yang, J., Zhao, T. L., Cheng, X. G., Ren, Z. H., Meng, L., He, Q., Tan, C. H., Zhu, Y., Zhu, C. Z., and Wu, Z. Y.: Temporal and spatial variations of sandstorm and the related meteorological influences over northern China from 2000 to 2019, Acta Sci. Circum., 41, 2966–2975, https://doi.org/10.13671/j.hjkxxb.2021.0234, 2021 (in Chinese).
Yang, Y. and Zhao, Y.: Quantification and evaluation of atmospheric pollutant emissions from open biomass burning with multiple methods: a case study for the Yangtze River Delta region, China, Atmos. Chem. Phys., 19, 327–348, https://doi.org/10.5194/acp-19-327-2019, 2019.
Zhang, L., Henze, D. K., Grell, G. A., Carmichael, G. R., Bousserez, N., Zhang, Q., Torres, O., Ahn, C., Lu, Z., Cao, J., and Mao, Y.: Constraining black carbon aerosol over Asia using OMI aerosol absorption optical depth and the adjoint of GEOS-Chem, Atmos. Chem. Phys., 15, 10281–10308, https://doi.org/10.5194/acp-15-10281-2015, 2015.
Zhang, L., Henze, D. K., Grell, G. A., Torres, O., Jethva, H., and Lamsal, L. N.: What factors control the trend of increasing AAOD over the United States in the last decade?, J. Geophys. Res.-Atmos., 122, 1797–1810, https://doi.org/10.1002/2016jd025472, 2017.
Zhang, Q., Zheng, Y., Tong, D., Shao, M., Wang, S., Zhang, Y., Xu, X., Wang, J., He, H., Liu, W., Ding, Y., Lei, Y., Li, J., Wang, Z., Zhang, X., Wang, Y., Cheng, J., Liu, Y., Shi, Q., Yan, L., Geng, G., Hong, C., Li, M., Liu, F., Zheng, B., Cao, J., Ding, A., Gao, J., Fu, Q., Huo, J., Liu, B., Liu, Z., Yang, F., He, K., and Hao, J.: Drivers of improved PM2.5 air quality in China from 2013 to 2017, P. Natl. Acad. Sci. USA, 116, 24463–24469, https://doi.org/10.1073/pnas.1907956116, 2019.
Zhao, X., Zhao, Y., Chen, D., Li, C., and Zhang, J.: Top-down estimate of black carbon emissions for city clusters using ground observations: a case study in southern Jiangsu, China, Atmos. Chem. Phys., 19, 2095–2113, https://doi.org/10.5194/acp-19-2095-2019, 2019.
Zhao, Y.: Multiyear gap-filled AAOD and posterior BC emissions for China in 2000–2020, Air Quality Nju [data set], http://www.airqualitynju.com/En/Data/List/Datadownload, last access: 31 May 2024.
Zheng, B., Geng, G., Ciais, P., Davis Steven, J., Martin Randall, V., Meng, J., Wu, N., Chevallier, F., Broquet, G., Boersma, F., van der, A. R., Lin, J., Guan, D., Lei, Y., He, K., and Zhang, Q.: Satellite-based estimates of decline and rebound in China's CO2 emissions during COVID-19 pandemic, Sci. Adv., 6, eabd4998, https://doi.org/10.1126/sciadv.abd4998, 2020.
Zhi, G., Zhang, Y., Sun, J., Cheng, M., Dang, H., Liu, S., Yang, J., Zhang, Y., Xue, Z., Li, S., and Meng, F.: Village energy survey reveals missing rural raw coal in northern China: Significance in science and policy, Environ. Pollut., 223, 705–712, https://doi.org/10.1016/j.envpol.2017.02.009, 2017.
Zhu, C. S., Qu, Y., Huang, H., Chen, J., Dai, W. T., Huang, R. J., and Cao, J. J.: Black Carbon and Secondary Brown Carbon, the Dominant Light Absorption and Direct Radiative Forcing Contributors of the Atmospheric Aerosols Over the Tibetan Plateau, Geophys. Res. Lett., 48, 1–9, https://doi.org/10.1029/2021gl092524, 2021.
Zhu, X., Yun, X., Meng, W., Xu, H., Du, W., Shen, G., Cheng, H., Ma, J., and Tao, S.: Stacked Use and Transition Trends of Rural Household Energy in Mainland China, Environ. Sci. Technol., 53, 521–529, https://doi.org/10.1021/acs.est.8b04280, 2019.