the Creative Commons Attribution 4.0 License.
the Creative Commons Attribution 4.0 License.
 | 29 May 2024
Modeling atmospheric brown carbon in the GISS ModelE Earth system model
Maegan A. DeLessio
Kostas Tsigaridis
Susanne E. Bauer
Jacek Chowdhary
Gregory L. Schuster
Brown carbon (BrC) is an absorbing organic aerosol (OA), primarily emitted through biomass burning (BB), which exhibits light absorption unique to both black carbon (BC) and other organic aerosols. Despite many field and laboratory studies seeking to constrain BrC properties, the radiative forcing (RF) of BrC is still highly uncertain. To better understand its climate impact, we introduced BrC to the One-Moment Aerosol (OMA) module of the GISS ModelE Earth system model (ESM). We assessed ModelE sensitivity to primary BrC processed through a novel chemical aging scheme and to secondary BrC formed from biogenic volatile organic compounds (BVOCs). Initial results show that BrC typically contributes a top-of-the-atmosphere (TOA) radiative effect of 0.04 W m−2. Sensitivity tests indicate that explicitly simulating BrC (separating it from other OAs), including secondary BrC, and simulating chemical bleaching of BrC contribute distinguishable radiative effects and should be accounted for in BrC schemes. This addition of prognostic BrC to ModelE allows greater physical and chemical complexity in OA representation with no apparent trade-off in model performance, as the evaluation of ModelE aerosol optical depth against Aerosol Robotic Network (AERONET) and Moderate Resolution Imaging Spectroradiometer (MODIS) retrieval data, with and without the BrC scheme, reveals similar skill in both cases. Thus, BrC should be explicitly simulated to allow more physically based chemical composition, which is crucial for more detailed OA studies like comparisons to in situ measurement campaigns. We include a summary of best practices for BrC representation within ModelE at the end of this paper.
- Article
(10625 KB) - Full-text XML
- BibTeX
- EndNote


Carbonaceous aerosols are important, short-lived climate forcers. Black carbon (BC), a strongly absorbing carbonaceous aerosol produced from fuel and biomass burning (BB), contributes a significant positive radiative forcing (RF) to the atmosphere (Hansen et al., 1997; Jacobson, 2001; Ramanathan and Carmichael, 2008; Bond et al., 2013). The Sixth Assessment Report (AR6) of the Intergovernmental Panel on Climate Change (IPCC, 2023) estimates a BC effective RF of 0.11 W m−2 (Szopa et al., 2021). BB also emits organic aerosols (OAs) (Ito and Penner, 2005), another type of carbonaceous aerosol, which cool the atmosphere at an estimated RF of −0.21 W m−2 (Szopa et al., 2021). Beyond BB, secondary production is a key source of OAs: isoprene and other biogenic or anthropogenic volatile organic compounds (VOCs) partition and react in the atmosphere to form secondary organic aerosols (SOAs; Shrivastava et al., 2017; Mahilang et al., 2021).
As warming temperatures and changes in precipitation drive increases in wildfire frequency and intensity (Flannigan et al., 2009; Keywood et al., 2013), and emission controls and cleaner technologies lead to a further reduction in other aerosol sources (Bauer et al., 2022), carbonaceous aerosols, including OAs, could possibly become more prominent. Observations at Whiteface Mountain, downwind of the US West Coast BB region, have already shown an increase in OAs found in cloud water over the last 10 years, suggesting a growing influence of wildfire smoke (Lawrence et al., 2023). SOAs from biogenic VOCs (BVOCs) are also expected to grow in importance; the SOA burden could possibly be greater than that of sulfate aerosols by 2100 (Tsigaridis and Kanakidou, 2007). Despite their growing importance, OAs still pose a large gap in aerosol modeling: the IPCC Sixth Assessment Report estimated an OA RF uncertainty of 0.23 W m−2, about the same magnitude as the cooling effect itself (Szopa et al., 2021). Improving the physical and chemical parameterization of OAs in climate models can allow better calculation of OA forcing. To make such an improvement, light absorption of brown carbon aerosols must be accounted for.
Brown carbon (BrC) refers to the subset of OAs that absorb light (Andreae and Gelencsér, 2006). Since the chemical composition, and therefore absorptivity, of these aerosols vary greatly, BrC can be best thought of as a classification of aerosols, rather than a specific compound or compound class. Typically, BrC contains absorbing organic chromophores such as nitroaromatics, polyaromatic hydrocarbons (PAHs), or lignin-derived compounds (Samburova et al., 2016; Lin et al., 2018; Fleming et al., 2020). It is emitted by smoldering fires and other incomplete combustion (McMeeking et al., 2009; Chakrabarty et al., 2010). Though its main source is BB, secondary BrC can form through gaseous and aqueous reactions as SOAs (Lee et al., 2014).
BrC has a spectrally dependent absorption in the UV-to-visible wavelength range, strongly absorbing in the UV and near-UV but much less in the rest of the visible spectrum, hence its color and name (Andreae and Gelencsér, 2006; Laskin et al., 2015). It is this absorption pattern that distinguishes BrC from BC, which is co-emitted by fires (Lack et al., 2012; Saleh et al., 2014; Pokhrel et al., 2016), as BC is a stronger absorber across all visible wavelengths and into the near-IR (Bond and Bergstrom, 2006). There are recent laboratory and field studies that have observed “dark BrC”, suggesting a distinct class of refractory, highly absorbing BrC (Hoffer et al., 2017; Saleh et al., 2018; Corbin et al., 2019; Chakrabarty et al., 2023), also co-emitted with BC, that can be best described as resembling tar balls (Pósfai et al., 2004; Alexander et al., 2008). Because there is limited observation and characterization of these aerosols, we have no way of knowing how to include their emissions as a portion of organics in ModelE. Additionally, initial work by Chakrabarty et al. (2023) suggests its single-scattering albedo (SSA) and absorption Ångström exponent (AAE) are indistinguishable from that of BC. Given we have no knowledge of how to treat these aerosols, beyond the same as BC, we did not explicitly represent this subset of BrC.
Like most aerosols, BrC undergoes processing, or aging, in the atmosphere. Heterogenous oxidation by hydroxyl (OH) and nitrate (NO3) radicals can lead to functionalization of BrC compounds (Cheng et al., 2020; Schnitzler et al., 2020), while aqueous oxidation can form oligomeric BrC (Hems et al., 2020). These processes cause an increase in absorption, known as browning. Further oxidation by OH, photolysis, or ozonolysis results in fragmentation of BrC compounds and subsequent decreases in absorption, known as bleaching (Hems et al., 2021). Laboratory studies have shown that primary BrC undergoes browning followed by bleaching, while secondary BrC only bleaches (Zhao et al., 2015). Other properties of BrC can also change with chemical aging. Volatility typically decreases with functionalization (browning) and increases with fragmentation (bleaching). As a direct result of this chemical processing, molecular weight typically increases with browning and decreases with bleaching (Di Lorenzo and Young, 2016; Di Lorenzo et al., 2017).
Most literature on BrC properties, such as composition, absorption, size, and atmospheric processing, has come from laboratory studies of BrC proxies or lab burns (Saleh et al., 2014; Di Lorenzo and Young, 2016; Liu et al., 2016; Tang et al., 2016; Lin et al., 2018; Al Nimer et al., 2019; Shetty et al., 2019; Wong et al., 2019; C. Li et al., 2020). In situ BrC absorption, mass, and size distribution have been measured during flight campaigns like DC3 and SEAC4RS (Zhang et al., 2017), ATom (Zeng et al., 2020), WE-CAN (Zeng et al., 2021), and FIREX-AQ (Washenfelder et al., 2022; Zeng et al., 2022), in or downwind of fires. There have also been several studies that have retrieved BrC aerosol properties from observations outside of laboratories and flight campaigns. These studies utilized retrieval data from the Aerosol Robotic Network (AERONET; Arola et al., 2011, 2015; Schuster et al., 2016) or IMPROVE (Chow et al., 2018) ground-based networks, as well as satellite retrievals (L. Li et al., 2020, 2022), relying on the differences in optical properties, or optical properties and size, between BrC and other absorbing aerosols, like BC and dust.
There have been several studies that have modeled BrC in chemical transport models, all of which either use GEOS-Chem (Park et al., 2010; Wang et al., 2014, 2018; Saleh et al., 2015; Jo et al., 2016; Tuccella et al., 2020; Carter et al., 2021; Zhu et al., 2021) or IMPACT (Feng et al., 2013; Lin et al., 2014). Only three studies have shown implementations of BrC in Earth system/climate models (Brown et al., 2018; Zhang et al., 2020; Drugé et al., 2022). Both Brown et al. (2018) and Zhang et al. (2020) simulated BrC using the Community Atmosphere Model within the Community Earth System Model (CESM), while Drugé et al. (2022) used the Centre National de Recherches Météorologiques (CNRM) climate model. Zhang and Drugé separately simulated BrC from other OAs. Zhang treated a prescribed portion of OAs as brown, and Drugé assumed BB OAs are brown and fossil fuel OAs are non-absorbing. In contrast, Brown regarded BrC and OAs as all one species. All three studies included a bleaching parameterization for BrC, though none included a browning parameterization.
In this study, we present the first implementation of BrC aerosols in the GISS ModelE Earth system model (Kelley et al., 2020; Bauer et al., 2020). We introduced BrC into the One-Moment Aerosol (OMA) module of ModelE by defining four key properties or processes: BB emissions of primary BrC, formation of secondary BrC, optical properties of BrC tracers, and chemical aging of primary BrC. This constitutes an improvement in simulating OA absorption in ModelE, as BrC was previously not explicitly represented, and all OAs were assumed to be slightly absorbing (Koch, 2001), consistent with other treatments of OAs (Chin et al., 2002; Kinne, 2019). The chemical aging scheme developed in this study (see Sect. 2.2.4) is the first to simulate aging through oxidant-driven mass transfer between tracers of different optical properties, rather than the typical approach of parameterizing optical properties as a function of time in the atmosphere, allowing the formation of more complex, realistic OA mixtures. This is also the first study to account for browning, in addition to bleaching, in a chemical aging scheme. We estimated the radiative effect of BrC aerosols and performed sensitivity tests to determine the extent each defined BrC parameter changes this. Instead of a direct evaluation of BrC, which requires comparison to flight campaign and retrieval data, extensive work that will be presented in a future study, we evaluated general model performance with BrC aerosols. To do this, we compared simulated total aerosol optical depth and absorbing aerosol optical depth to ground-based data from the Aerosol Robotic Network (AERONET) and satellite data from the Moderate Resolution Imaging Spectroradiometer (MODIS) instruments.
2.1 The GISS ModelE Earth System Model
This study used version 2.1 of the GISS ModelE Earth system model, ModelE2.1. The horizontal and vertical resolution of the atmosphere in ModelE2.1 is 2° in latitude by 2.5° in longitude with 40 vertical layers from the surface to 0.1 hPa. ModelE includes multiple aerosol schemes (Bauer et al., 2020). We used the One-Moment Aerosol (OMA) module because it includes more detailed OA chemistry. OMA is fully interactive within ModelE in terms of emissions, chemistry, transport, removal, and climate. Aerosol–radiation interactions (ARIs) and aerosol–cloud interactions (ACIs) are calculated within the radiation and cloud schemes, where the size-dependent scattering properties of clouds and aerosols are computed from Mie scattering. To account for aerosol swelling with water vapor, dry aerosol size, relative humidity, aerosol hygroscopicity, and the refractive index of water are used, with Köhler theory as a base for calculation, to obtain the wet aerosol radius and complex refractive index. Apart from swelling with water, there is no internal mixing in OMA radiative calculations – all aerosols are regarded as externally mixed. Wet aerosol size and the real and imaginary refractive indices are then used to find corresponding aerosol scattering, asymmetry, and light extinction values in pre-calculated Mie look-up tables. These optical properties, computed for 6 wavelength bands in the shortwave (SW) and 33 in the longwave (LW), are used to calculate ARIs (Bauer et al., 2010). With regard to ACIs, OMA only includes the first indirect effect (Bauer et al., 2020).
OMA is a mass-based scheme in which aerosols are assumed to have prescribed and constant size distributions. Aerosol components represented are sulfate, nitrate, ammonium, dust, sea salt, and carbonaceous aerosols. Carbonaceous aerosols include BC and OAs, which are each separated into aerosols from non-BB anthropogenic and BB sources. OMA also simulates the formation of biogenic SOAs, discussed further in Sect. 2.2.2. Within the original ModelE radiation, anthropogenic and BB OAs, as well as SOAs, are regarded as having the same optical properties, with all organics treated as slightly absorbing in the UV–visible (UV–VIS) wavelength band using an imaginary refractive index (kOA) of 0.014. Sea salt, dimethyl sulfide (leading to methanesulfonic acid), isoprene (leading to SOAs), and dust emission fluxes are calculated interactively, while all remaining anthropogenic and BB fluxes are prescribed by the Community Emissions Data System (CEDS; Hoesly et al., 2018).
This study made use of both climatological and nudged transient simulations. Climatological simulations were used to assess model sensitivity to BrC representation (see Sect. 2.3.1) and utilized CEDS emissions for aerosols from BB, as used in CMIP6 (Hoesly et al., 2018). CEDS BB emissions are identical to the Global Fire Emissions Database (GFED) version 4 (van der Werf et al., 2017; McDuffie et al., 2020) for the years 1997–2014. Nudged transient simulations were used to compare model output to AERONET and MODIS retrieval data (see Sect. 2.3.2) and utilized the Global Fire Assimilation System version 1.2 (GFAS1.2) for BB aerosol emissions (Kaiser et al., 2012). GFAS1.2 was used, rather than other fire emission inventories, as it allows the implementation of plume injection height in each grid cell, rather than the ModelE default of all BB emissions injected uniformly in the boundary layer, and also has daily emissions, instead of the monthly emissions in CEDS (Freitas et al., 2007; Sofiev et al., 2012). It should be noted that, on average, globally, GFED4 OA emissions have been shown to be lower than those of GFAS1.2. Regionally, GFAS1.2 showed higher emissions in the Temperate North America (TENA), Southern-Hemisphere South America (SHSA), Boreal Asia (BOAS), southeast Asia (SEAS), and Equatorial Asia (EQAS) BB regions (Pan et al., 2020). This resulted in higher OA emissions in our transient simulations compared to in our climatological simulations (approximately 25.9 vs. 24.6 Tg yr−1, on average). Transient simulations were nudged towards 3-hourly winds prescribed by Modern-Era Retrospective Analysis for Research and Applications, version 2 (MERRA-2; Gelaro et al., 2017).
2.2 Brown carbon scheme
To simulate BrC, we defined emissions, formation of secondary BrC, its optical properties, and its chemical aging in the atmosphere. In this scheme, we regard total OAs as consisting of non-absorbing OAs and BrC; any organic absorption is attributed to BrC. The following sections discuss our methodology for estimating parameters in each of these scheme components. Since BrC is a broad classification of aerosols, there is a large degree of variability in observed properties. As a result, the parameters we present here, though based on laboratory and field studies of BrC, are inherently uncertain.
2.2.1 Emissions
BrC was introduced as a new set of aerosol tracers into the OMA module of ModelE2.1. Primary BrC aerosols are emitted by attributing a proportion of BB emissions from OAs to BrC. This is equivalent to assuming a certain proportion of BB OAs are absorbing, rather than non-absorbing and completely scattering. This study used prescribed BB emissions from the CEDS fire emission inventory for sensitivity tests and GFAS1.2 for evaluation against AERONET and MODIS retrieval data. CEDS was employed in sensitivity tests for consistency with CMIP6, while GFAS was used for better accuracy of OA spatiotemporal variability (due to injection height and daily data, as previously mentioned) and therefore a better comparison with retrieval data. Though the current ModelE implementations of both emission inventories do not differentiate BB fuel types, the mass ratio of absorbing to non-absorbing, or BrC-to-OA, emissions will vary globally with different vegetation biomes. For instance, Jo et al. (2016) estimated that croplands have the highest BrC-to-OA mass ratio, between 0.4 and 0.946 depending on assumed aerosol AAE, and woody savannahs and shrublands have the lowest, between 0.046 and 0.123, with forests falling somewhere in the middle (0.093–0.135 boreal, 0.088–0.211 temperate, and 0.128–0.312 tropical). To find a representative global value, we looked to emission ratios used by other BrC modeling studies in addition to estimating a ratio from CEDS emissions used in ModelE. Literature values of global average BrC-to-OA mass ratios vary between 0.15–0.92, with an approximate average of 0.35 (Feng et al., 2013; Wang et al., 2014; Jo et al., 2016; Zhang et al., 2020).
To determine our own value of BrC-to-OA mass ratio, BrC emissions (EBrC) were parameterized as a function of the global mean BC-to-OA BB emissions ratio from the CEDS inventory, following Eq. (1) (Saleh et al., 2014) and Eq. (2) (Zhang et al., 2020):
where EOA and EBC are OA and BC emissions in kg C; kBrC, 550 nm is the imaginary refractive index (RI) of BrC at 550 nm; ρ is the aerosol density in g m−3; and MAE is the mass absorption efficiency of BrC in m2 g−1, for which we use a value of 1 m2 g−1 (McMeeking, 2008; Jo et al., 2016; Zhang et al., 2020). Since all organic absorption in our scheme is attributed to BrC, we use kBrC in place of the kOA specified by Saleh et al. (2014) for Eq. (1). It is also important to note that emission inputs for organic aerosols are in units of mass of carbon, while the ModelE output, and most of this discussion, uses total organic aerosol mass. To convert between these, ModelE uses an organic carbon (OC)-to-OA ratio of 1:1.4 (Tsigaridis et al., 2014). Equation (1) expresses the BrC imaginary RI as a function of the EBC to EOA ratio because fires with higher modified combustion efficiency (MCE), and therefore greater BC emissions, have been shown to produce more-absorbing OAs (Saleh et al., 2014; Liu et al., 2020). As all organic absorption is from BrC, Eq. (2) uses the imaginary RI from Eq. (1), which indicates the extent of OA absorption, and a BrC MAE value to determine how many BrC emissions would be needed to account for this absorption. Using this, we calculated area-weighted global mean BrC emissions of . Given total BB OA emissions of , we got an average BrC-to-OA emitted mass ratio of 0.366. Since this is close to the average mass ratio used in other BrC modeling studies, we chose 0.35 as the proportion of BB OA emissions attributed to BrC, making up approximately 10 % of total OA mass (0.11 Tg burden) in ModelE. This value served as a starting point from which we conducted model sensitivity tests, as described in Sect. 2.3.1. We also applied the parameterization described in Eqs. (1) and (2) globally (see Fig. A1), looking at the BrC-to-OA emissions ratio in each grid cell rather than the global average, and found that 0.15–0.55 (15 %–55 % BB organic emissions are brown) captures the entire range of estimated ratios and should be explored in these sensitivity tests.
2.2.2 Secondary biogenic brown carbon
The formation of SOAs from biogenic VOCs (BVOCs) was already represented in ModelE prior to this work. Briefly, BVOCs such as isoprene and terpenes are oxidized by hydroxyl and nitrate radicals and by ozone. A two-product model is utilized to account for VOC and reactive-nitrate (NOx) conditions in SOA formation. This results in two aerosol species from each biogenic precursor: isoprene and α-pinene (representing terpenes). The yield within a model grid cell of the two products changes with the NOx-to-VOC ratio (Tsigaridis and Kanakidou, 2007).
To account for secondary BrC, the model radiation scheme was modified to consider the four biogenic SOA products separately from other OAs. This ensured a distinct, non-zero imaginary RI could be assigned to each tracer, allowing them to be absorbing. The actual values of these RIs will be discussed in Sect. 2.2.3. With this configuration, brown SOAs make up approximately 50 % of total OA mass (0.57 Tg burden). SOAs formed from anthropogenic, aromatic precursors have also been shown to be absorbing in the atmosphere (Liu et al., 2016). Aromatic SOAs are not yet represented in ModelE, since they are small contributors to the global OA budget (Tsigaridis and Kanakidou, 2003). Despite their smaller burden, aromatic SOAs are typically more absorbing than biogenic SOAs (Liu et al., 2016), creating a potentially low bias in secondary BrC absorption.
2.2.3 Brown carbon optical properties
The imaginary RI in the visible wavelength band was the key property used to distinguish BrC from other OAs in ModelE radiative transfer calculations. The imaginary RI determines to what extent our BrC tracers are absorbing. Given the primary purpose of this study is to improve the representation of aerosol absorption, the real RI of BrC, which drives aerosol scattering, was kept the same as that of OAs (nOA) in all ModelE radiation bands. Additionally, since BrC demonstrates limited absorption past 800 nm (Laskin et al., 2015), only the imaginary RI for BrC in the UV–visible (UV–VIS) radiation band (300–770 nm) was modified; the optical properties of BrC in all other radiation bands are the same as those of OAs. The use of wide radiation bands, rather than distinct wavelengths, in radiation calculations poses a limitation for BrC representation: in the current implementation, ModelE is not able to capture the spectral dependence of BrC absorption in UV–VIS wavelengths, so a direct comparison of aerosol optical depth (AOD) and absorbing aerosol optical depth (AAOD) values from the literature at UV/near-UV wavelengths, where BrC absorption is maximized, is not possible without assuming an AAE. Instead, ModelE simulates one spectrally weighted average value in the UV–VIS band, indicative of λ=550 nm. In terms of radiative flux and forcing, using a spectrally weighted average for the BrC RI and calculating mean forcing across the wider UV–VIS band is approximately equivalent to defining BrC optical properties in narrower wavelength bins, within the band, and summing bin-forcing contributions. This is because, while BrC absorption increases into the UV, solar irradiance is much lower at shorter wavelengths, so resolving BrC radiative flux in the UV has limited impact on that of the total band. Thus, the use of one spectrally weighted RI should not pose a limitation for estimating the net BrC radiative effect.
Just as differing biomes produce different BrC-to-OA emission ratios, the imaginary RI of primary BrC varies with combustion conditions and fuel type (Fleming et al., 2020). In ModelE, however, only one imaginary RI can be defined for each wavelength band of a tracer for AOD and forcing calculations. We used two parameterizations to estimate a range of the representative imaginary RI for BB BrC. The first parameterization consisted of two steps. Firstly, it used the Kramers–Kronig (KK) relations for a damped harmonic (Moosmüller et al., 2011) to compute spectra of the real RI (n) and imaginary RI (k) for absorbing matter at each wavelength in the UV–VIS between 350 and 770 nm. These relations are given by
where a is a constant, γ is a line width parameter, ν is the frequency of incident light (), and ν0 () is the resonance frequency of the oscillator. Sumlin et al. (2018) show that these relations can reproduce measurements for the imaginary RI of BrC peat smoke (kBrC). Figure 1 provides such a fit for measurements of smoke emitted from smoldering combustion of Alaskan peatland (sample AK 4-8” 5 % MC from their study, s−2, s−1, λ0=308 nm). Also shown in Fig. 1 is the solar spectral irradiance of the UV–VIS band, for reference. Taking the solar-spectrum-weighted average of these kBrC values gave an imaginary RI value of approximately 0.003 for the UV–VIS band.
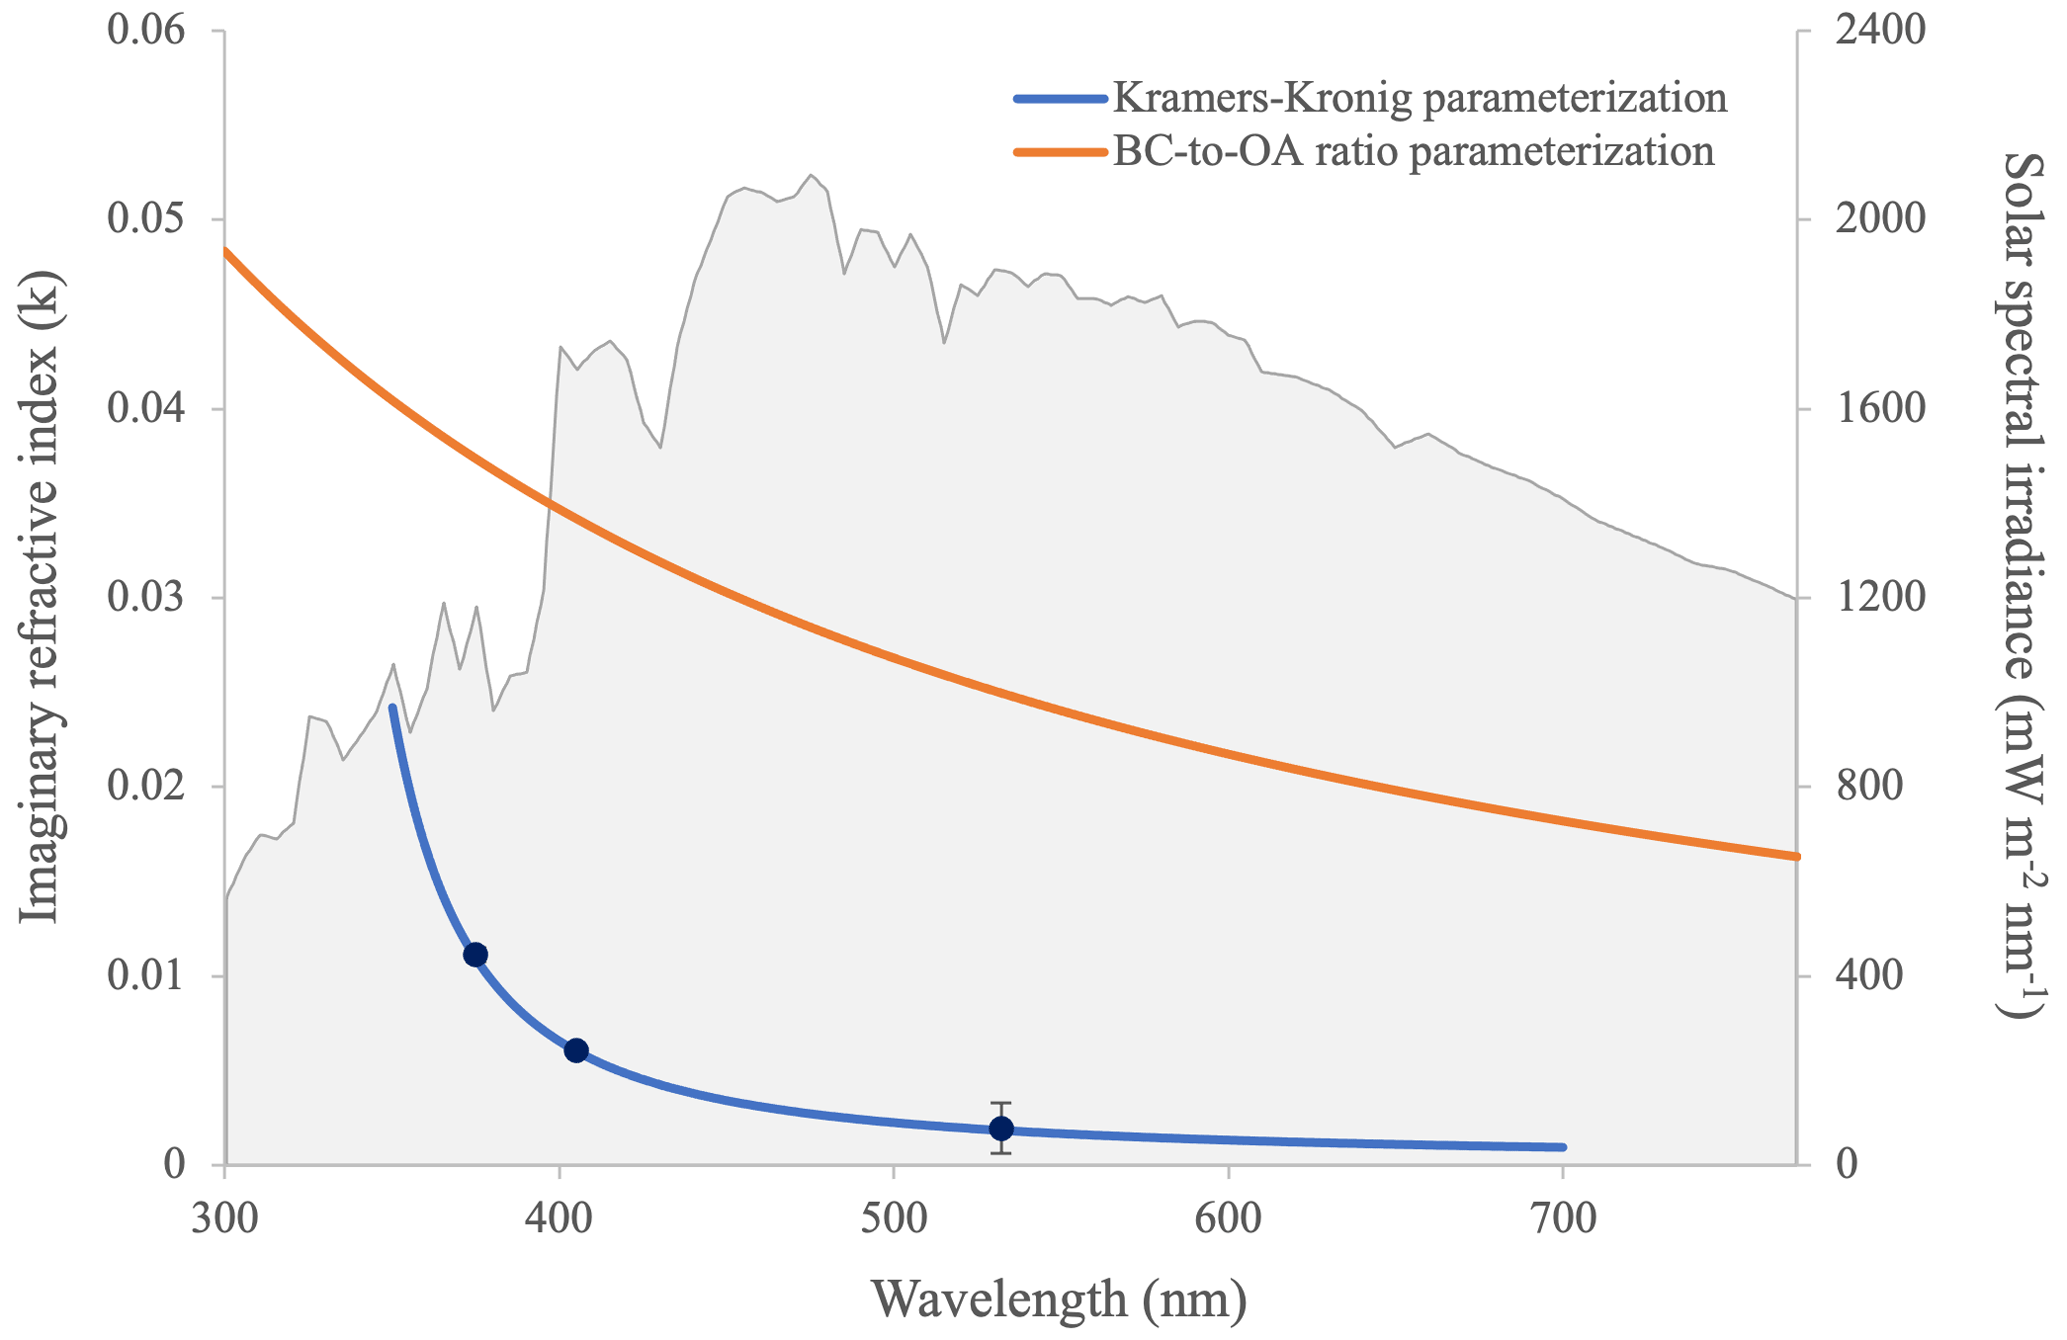
Figure 1Imaginary refractive indices (RIs) across the 300 to 770 nm range for the Kramers–Kronig (KK) parameterization (blue) and BC-to-OA ratio parameterization (orange) used to estimate the primary BrC UV–VIS-band imaginary RI. Note that data for the first parameterization are only provided from 350 to 700 nm. KK parameters used here are s−2, s−1, λ0=308 nm, and a BrC to non-absorbing host volume mixing ratio of 11 %. These are applied to sample AK 4-8” 5 % MC from Sumlin et al. (2018), shown as points along the blue line with data uncertainty displayed in error bars. The solar spectral irradiance of the UV–VIS band is also shown here (gray) for reference. The derived imaginary RI of secondary BrC is not displayed here, as the MAE data used were not continuous across this wavelength range and resulting RI values are much lower than those of primary BrC (< 0.002).
Sumlin et al. (2018) also show that the KK relations alone underestimate the real RI, nBrC, of BrC peat smoke. This problem can be solved by volume-mixing the KK results for the RI of smoldering peat smoke with the RI (nHM) of a non-absorbing host matter (HM) – the second step in this parameterization. Choosing nHM=1.50 with a volume-mixing ratio of fHM=89 % for our HM led to a good fit with nBrC spectra and maintained the fit of kBrC spectra in the UV–VIS part of the spectrum. Furthermore, taking the solar-spectrum-weighted average of these nBrC spectra, which ranged from nBrC, 350 nm=1.84 to nBrC, 700 nm=1.49, led to a UV–VIS averaged nBrC≈1.53, equal to the ModelE default nOA This supports our assumption stated above that the real RI of BrC is kept the same as that of OAs in all radiation bands of ModelE.
The second parameterization is the same as that used to determine BrC emissions, where the imaginary RI is a function of the BC-to-OA emissions, in kg C, ratio from the CEDS inventory (Eq. 1). We calculated a spectral absorption exponent (Lyapustin et al., 2021; Go et al., 2022), expressed below as w, according to Eq. (5) (Saleh et al., 2015):
Our estimate of w, which defines the spectral dependence of BrC absorption, was 1.15. This is close to the average value in Saleh et al. (2014) of 1.6 and lower than other reported values of 3.9 (Kirchstetter et al., 2004) and 5.4–5.7 (Mok et al., 2016). Lower spectral dependence, using this parameterization, is correlated with higher BC-to-OA ratios and therefore a higher imaginary RI (Saleh et al., 2014). This w value was then used to determine the RI across all UV–VIS wavelengths (Eq. 6; Saleh et al., 2015):
The resulting imaginary RI can also be seen in Fig. 1. A solar-spectrum-weighted average of values from this calculation, following Eq. (5), gave an imaginary RI of approximately 0.03. Imaginary RIs of both 0.003 and 0.03 are consistent with the range of values used by other BrC modeling studies, with kBrC=0.003 representing weakly absorbing BrC at the bottom of the range and kBrC=0.03 representing strongly absorbing BrC at the top of the range, as expected with a low w value (Feng et al., 2013; Lin et al., 2014). A moderately absorbing case was also defined at the midpoint of this range, with kBrC=0.0165.
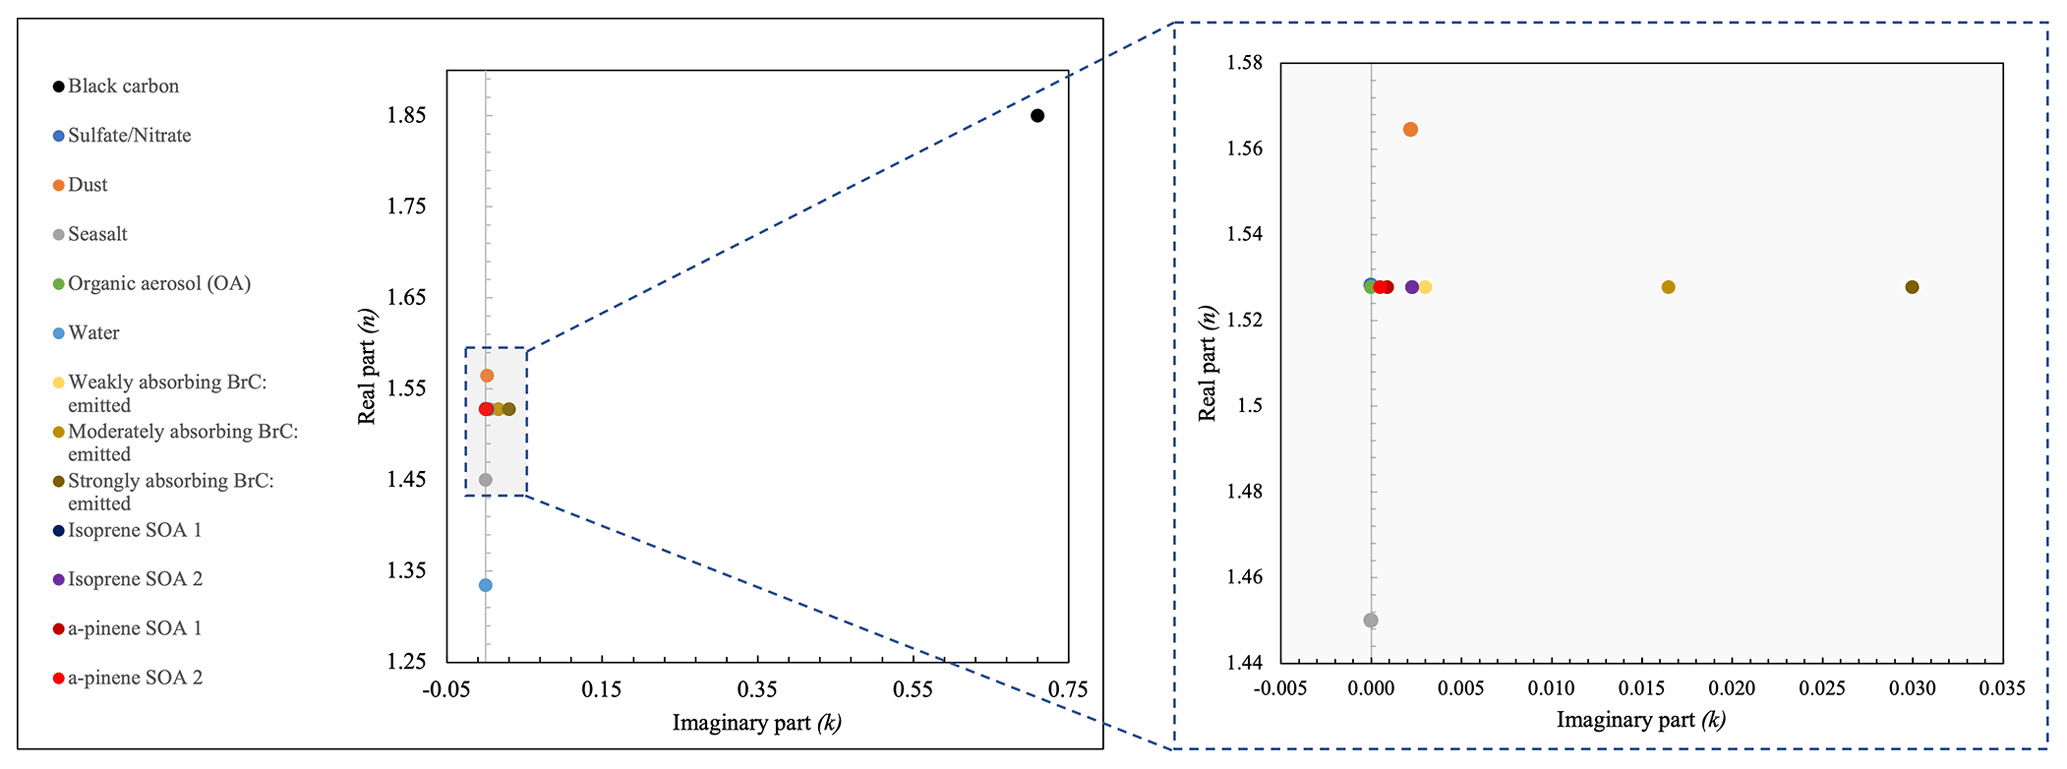
Figure 2UV–VIS-band-averaged complex refractive index of ModelE aerosol tracers. All BrC tracers have the same real refractive index as OAs.
For biogenic SOAs, we used values of MAE for isoprene and α-pinene SOAs measured under both high- and low-NOx conditions from Liu et al. (2016) to calculate the imaginary RI. The two SOA tracers for each BVOC in ModelE do not directly correlate with high and low NOx. Rather, each tracer has a specified mass yield given NOx conditions at the time and the location of formation. We converted these tracer mass yields to molar yields and then solved a system of equations to determine the MAE of each tracer: for either isoprene or α-pinene, the MAE of a low- or high-NOx SOA (from Liu et al., 2016) was set to equal the sum of the two tracers' low- or high-NOx molar yields multiplied by the respective tracer MAEs (solved for). The resulting MAE values were converted to the imaginary RI according to Eq. (7) (Zhang et al., 2020):
Solar-spectrum-weighted averages across all UV–VIS wavelengths were taken, and the resulting imaginary RIs can be seen in Fig. 2, along with RIs for primary BrC and other aerosol tracers, and are listed in Table A1, for reference. Other BrC properties defined in ModelE are listed in Table 1.
Table 1BrC physical properties used in ModelE. Each property is the same as other OAs originally in ModelE (Koch, 2001). These values are consistent with estimates of BrC properties from previous laboratory studies and BrC reviews (Zhang et al., 2013; Lin et al., 2014; Laskin et al., 2015; Froyd et al., 2019).
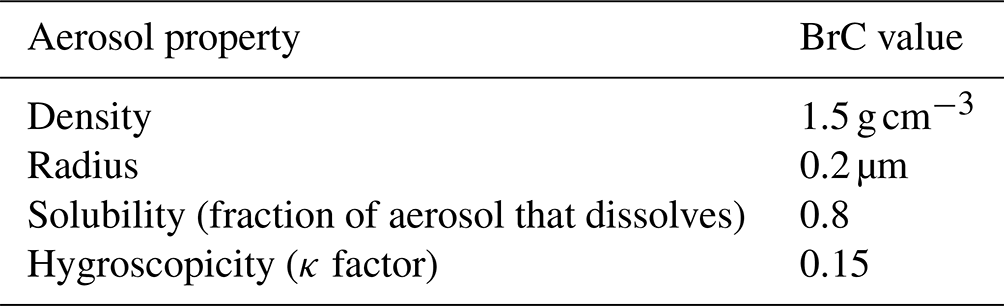
These physical properties were kept constant to maintain consistency with ModelE default OA representation and ensure no change in total organic mass burden with the introduction of the BrC scheme. The solubility of BrC, for example, is left at 0.8, which is higher than some literature estimates (Laskin et al., 2015) but within reported ranges (Zhang et al., 2013) because a lower value would result in an increase in BrC, and therefore total OA, burden. An increase in organic mass, compared to the model default, would result in an increase in scattering and a substantial cooling effect, negating the purpose of the BrC scheme, which is to account for OA absorption and the subsequent warming effect. Thus, we changed only organic optical properties to represent BrC – the total organic mass burden was not changed.
2.2.4 Chemical aging scheme
Since the objective of this work is to capture OA absorption, we focused only on changing BrC optical properties with aging. As such, all properties in Table 1 are kept constant. To simulate the atmospheric processing of BrC, we created an oxidant-initiated chemical aging scheme that does not require us to track the change in the RI, and therefore absorption, over time. Instead, two aged BrC tracers were introduced in ModelE, in addition to the emitted one: one with higher absorption and one with lower absorption in relation to emitted BrC. The “browner” BrC is assumed to have 150 % emitted BrC absorption efficiency, while the less-absorbing BrC is assumed to have 20 %. The threshold value of 20 % relative absorption was based on laboratory studies of oxidized BrC proxies (Fleming et al., 2020; Hems et al., 2021) and is close to the threshold value used in other modeling studies (Wang et al., 2018). A relative absorption of 150 % is used as it is near the middle of the range of reported photo enhancement in laboratory studies (Zhong and Jang, 2014; Hems et al., 2021). Iterative Mie calculations were used to determine what imaginary RI, varied from that of emitted BrC, produces the relative absorption efficiencies (150 % and 20 %) of each aged tracer. This was done for all three primary BrC cases described earlier: weakly, moderately, and strongly absorbing.
BrC browning is represented as the transfer of emitted (primary) BrC mass to the more-absorbing BrC tracer. This is followed by bleaching, with mass transfer from the more-absorbing to the least-absorbing BrC. Mass transfer between tracers occurs at a rate determined by a second-order rate constant for each reaction of BrC with hydroxyl and nitrate radicals and with ozone (see Table A2). We used first-order rate constants defined by Hems et al.'s (2021) kinetic model of BrC processing and their assumed concentrations of oxidants to calculate these second-order rate constants. This chemical aging scheme is illustrated in Fig. 3.
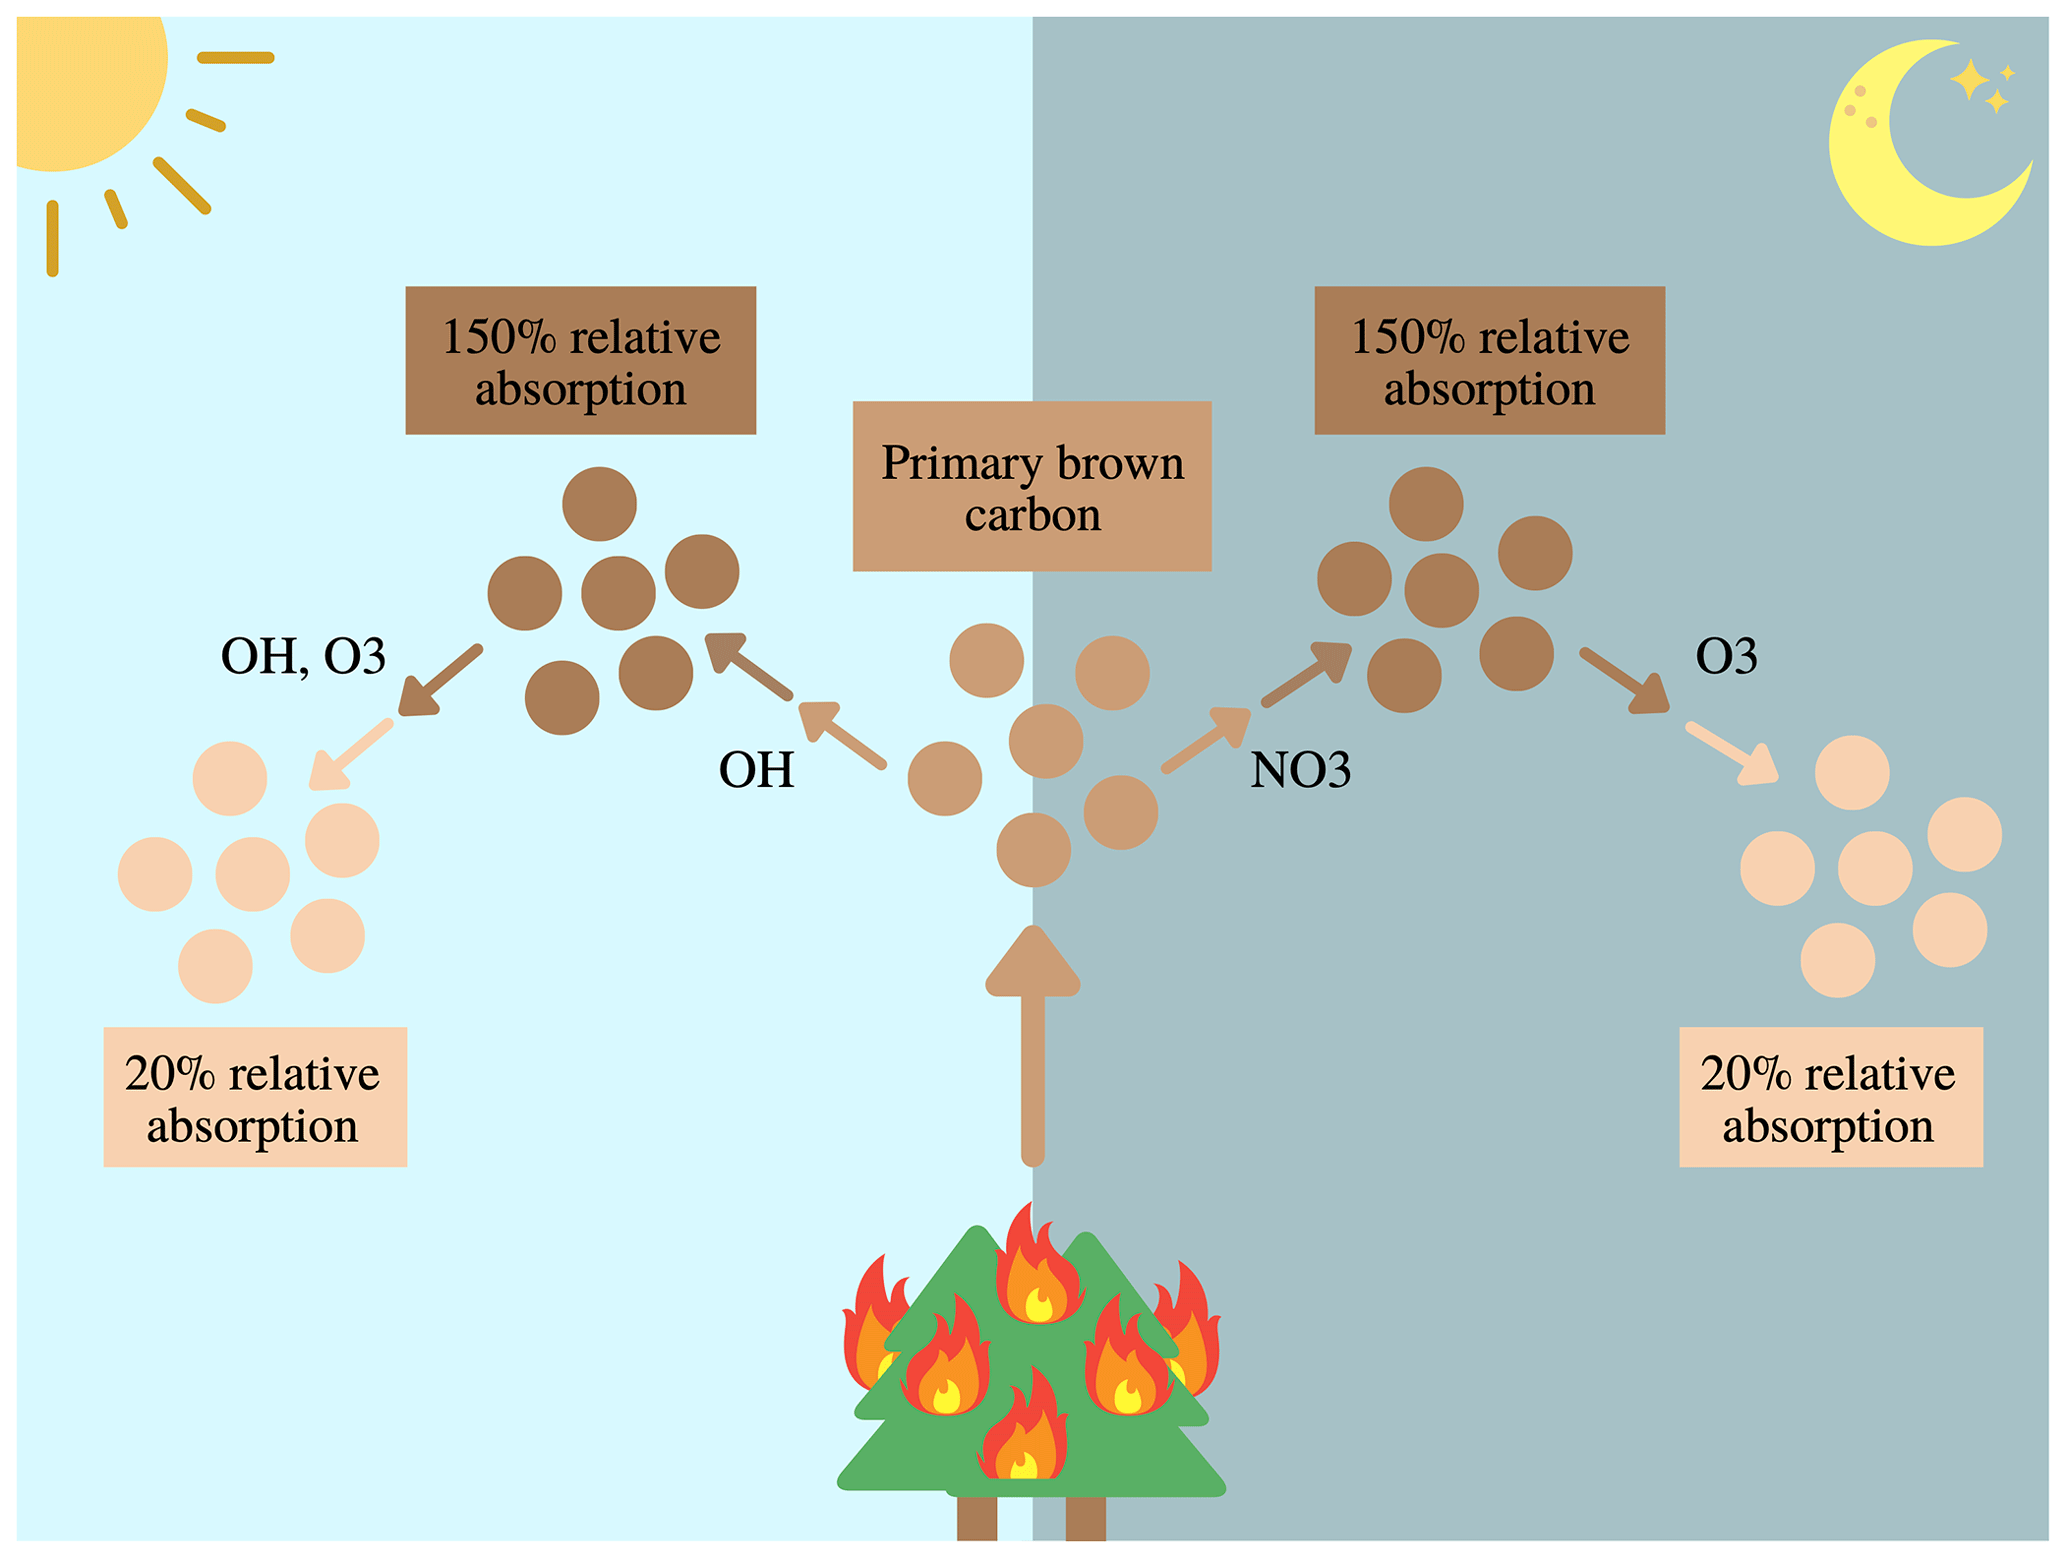
Figure 3Chemical aging scheme of primary BrC in GISS ModelE. The large arrow represents emission of BrC mass from BB, while smaller arrows represent mass transfer between BrC types.
The typical chemical lifetimes of ModelE-simulated emitted and “browner” BrC in this scheme are 9.36 h and 6.79 min, respectively, meaning the entire aging process occurs on average over about 10 h. This is consistent in magnitude with atmospheric lifetimes predicted by laboratory studies, with browning occurring over several hours and rapid bleaching on the order of 1 h or less (Zhao et al., 2015; Hems et al., 2021). Because hydroxyl radicals are only prominent during the day and nitrate radicals during the night, the separate consideration of each of these oxidants allows an oxidant-based diurnal simulation of BrC aging. Considering only the reactions occurring at night (nitrate browning and ozone bleaching), based on first-order rates from Hems et al. (2021), we would expect emitted BrC to have a chemical lifetime of about 40 h and “browner” BrC to have a lifetime of about 18 min, compared to 14.6 h and 17 min, respectively, for just daytime reactions. This greatly extends the length of the total aging process, which is consistent with literature that has suggested a slow build-up of more-absorbing BrC overnight (C. Li et al., 2020).
The total radiative effect of all three BrC tracers, considered together, represents the effect of BrC that has been emitted and then aged heterogeneously in the atmosphere. The design of this aging scheme is unique in global BrC modeling; no other studies have simulated browning, and all but one of those with bleaching parameterized BrC absorption to decay with time (Zhang et al., 2020), or time and hydroxyl concentration (Brown et al., 2018; Wang et al., 2018; Tuccella et al., 2020; Carter et al., 2021), rather than simulating different types of BrC tracers. Drugé et al. (2022) is the only other BrC modeling study to simulate aging through the transfer of aerosols between bins with different optical properties, though they used a set lifetime, while we used local oxidant concentrations to determine the rate of transfer (aging).
Our aging scheme is missing two key processes. Firstly, it only represents heterogenous aging. While there is laboratory evidence that BrC also undergoes in-cloud processing (Hems et al., 2021), this has not yet been introduced in ModelE. The addition of in-cloud, also referred to as multi-phase, processing would likely accelerate the overall rate of BrC aging: according to Hems' kinetic model, including aqueous reactions would shorten browning lifetime to approximately 3 h and have limited effect on bleaching lifetime. Secondly, biogenic brown SOAs do not currently undergo aging, though studies suggest bleaching of absorbing SOAs occurs in the atmosphere at similar rates to primary BrC (Zhao et al., 2015; Liu et al., 2016). Our current BrC aging scheme is incompatible with ModelE's biogenic SOA parameterization: BrC is aged by moving mass from one tracer to another, but this violates the two-product model that produces SOAs (Tsigaridis and Kanakidou, 2007). A different approach to chemical aging, one in which the semi-volatile nature of the aerosol is considered, must be developed to account for secondary BrC bleaching. Without this, we may be overestimating SOA contribution to BrC absorption: laboratory studies suggest aging reduces SOA absorption by at least 50 % (Liu et al., 2016). As such, we plan to include SOA aging in future work.
2.3 Model assessment
This BrC scheme was assessed in two ways. Firstly, an investigation of the radiative effect of BrC and its uncertain parameters used in ModelE, defined in the previous section, was performed through sensitivity tests. Next, ModelE-simulated total aerosol properties, with BrC representation included, were evaluated through comparison to AERONET and MODIS retrieval data. This latter evaluation serves to contextualize ModelE BrC-included simulations and broadly assess the model's ability to capture aerosol properties. The purpose of sensitivity tests of parameters and assessment of model performance for total aerosol properties was to understand the overall impact of BrC on ModelE ARIs. With this understanding, ModelE with the BrC scheme can be used for future, more detailed studies of BB aerosols.
2.3.1 ModelE BrC sensitivity tests
We conducted sensitivity tests to quantify the radiative effect of BrC representation in ModelE as a function of a range of the uncertain parameters described in Sect. 2.2. The following BrC processes and parameters were investigated: BB emission fraction, inclusion of brown biogenic SOAs, primary BrC optical properties, and chemical aging of primary BrC. We varied these, changing just one property at a time, from what we consider the base case for representation: 35 % of BB OA emissions are brown, biogenic SOAs are defined as brown, primary BrC has moderate absorption, and both browning and bleaching processes are included. We also ran two simulations where BrC was not explicitly represented: one in which all organics are considered non-absorbing (our control case) and one in which all organics are somewhat brown with a non-zero imaginary RI, as is the default case for organics in ModelE. The details of each simulation are included in Table 2.
Table 2BrC representation parameters for each sensitivity test simulation, where k is the imaginary RI of an aerosol in the ModelE UV–VIS radiation band (300–770 nm). Simulations 1 and 2 are the two cases in which BrC is not explicitly represented, with 1 being the control case where no organics are brown and 2 being the current model default where all organics are slightly brown. Note, for this default case, we have adjusted the value of kOA from 0.014 to 0.00567 to be consistent with OA treatment in other models (Tsigaridis and Kanakidou, 2018). Simulation 5 is the base case for BrC representation, using parameters established in Sect. 2.2. Simulations 3 and 5 are identical except for their treatment of secondary BrC: either excluded (simulation 3) or included (simulation 5). Simulations 4 and 6 test the effect of changing primary BrC optical properties (compared to simulation 5). Simulations 7 and 8 (compared to simulation 5) test the effect of changing the OA BB emission percentage considered brown. Simulations 9–11 (compared to simulation 5) test the effect of BrC chemical aging processes.
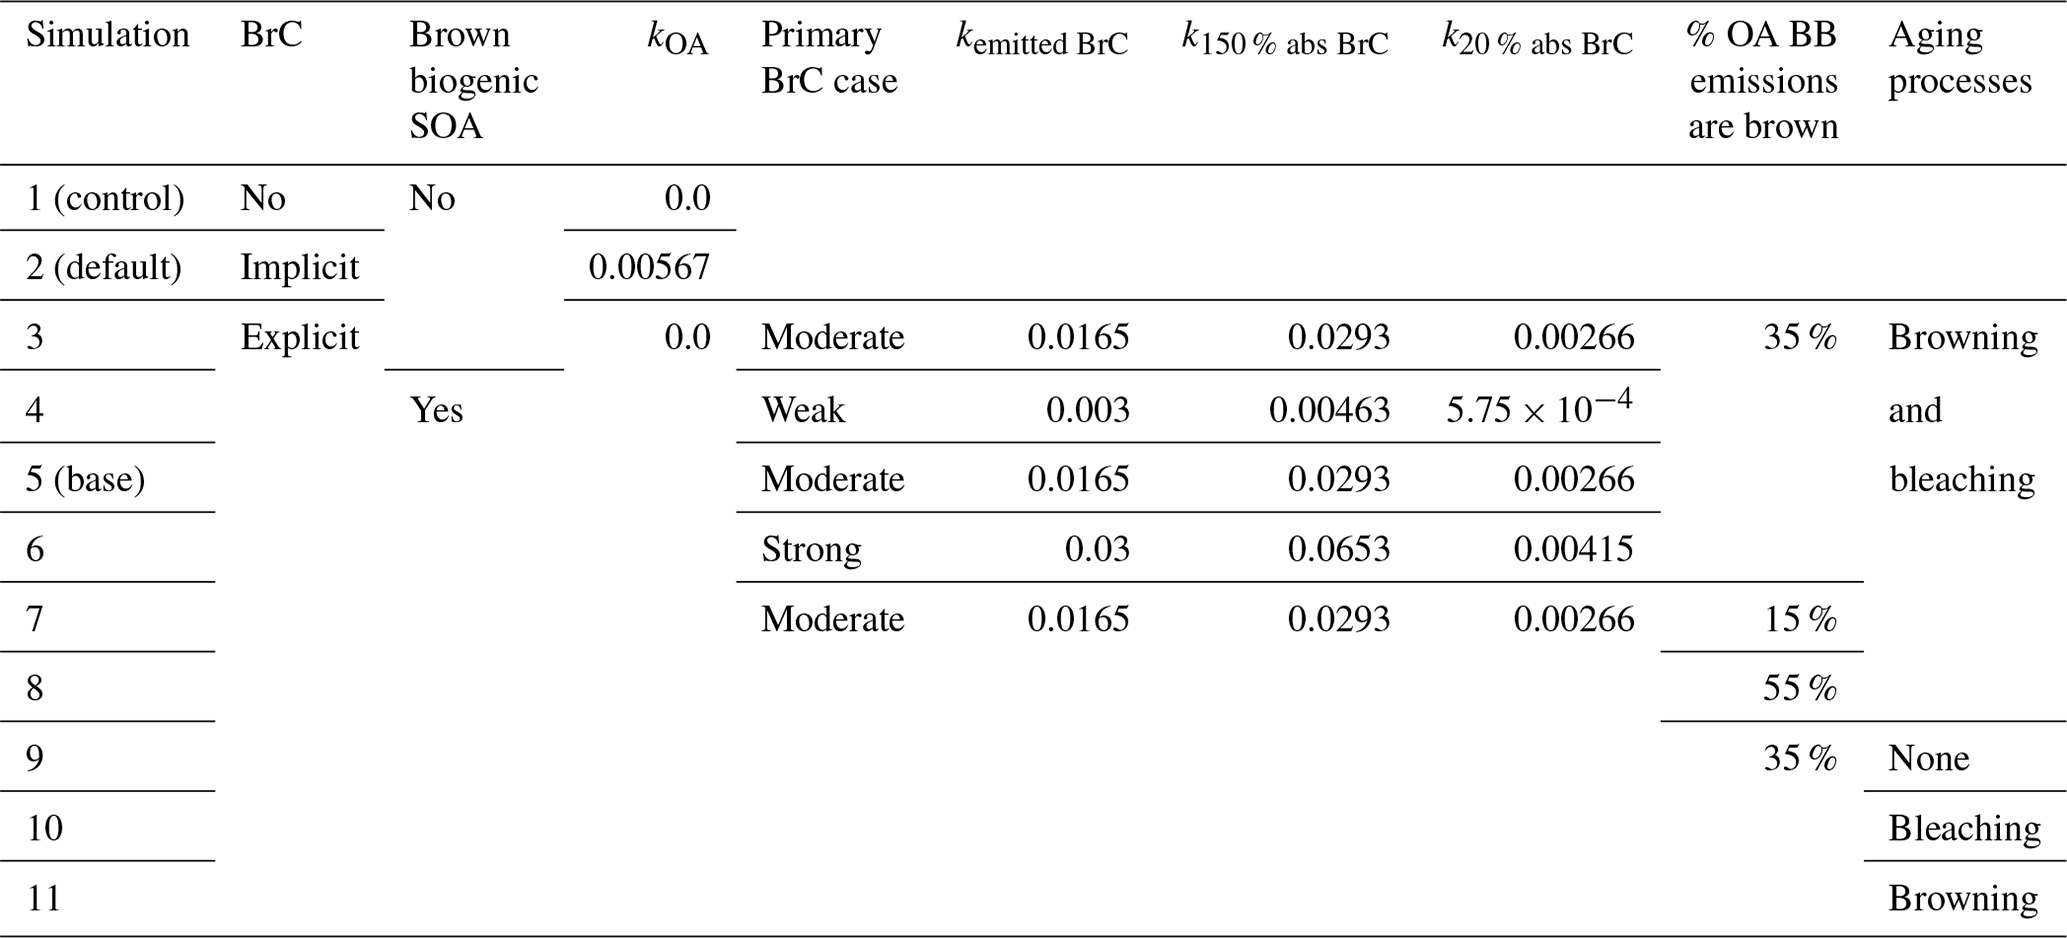
The purpose of this testing, in addition to estimating BrC's radiative effect, was to understand the relative importance of each of the BrC processes included in the model and how sensitive model results are against a plausible range in each one of them. We should note that, while the relative absorptions of aged BrC tracers are also uncertain parameters, we did not vary these in sensitivity tests, focusing first on the impact of simply including or excluding aging processes.
All tests were run using climatological simulations representative of a decadal mean centered around the year 2000, using 3 years for spin-up and 15 years for analysis. Results are reported as global averages over the 15-year analysis period, with standard deviation serving as a metric of the internal variability in the model. We calculated the direct radiative effect of BrC as the difference between a simulation and the control, top-of-atmosphere (TOA) radiative forcing (RF). ModelE RF is the difference between including a tracer in model radiation calculations and not including one, via double calls to model radiation, at every time step. This was done for each simulation i (see Table 2) other than the control, following Eq. (8):
where RE is the direct radiative effect. This definition of radiative effect should be distinguished from effective radiative forcing, also commonly reported in modeling studies, which is the present-day radiative effect of a tracer compared to its pre-industrial effect, allowing the atmosphere to adjust to perturbations from that tracer (Hansen et al., 2005).
We expect BrC aerosols to mainly impact ARIs; ACIs are likely only impacted marginally through the effect absorbing aerosols have on atmospheric stability and clouds, referred to as semi-direct effects. The interaction of aerosols on clouds via cloud condensation nuclei (CCN) changes are simulated in the model, but since BrC maintains the same solubility and hygroscopicity as other organics, and since we did not add organic mass to ModelE, we do not expect BrC representation to change CCN and have an impact on ACIs discernible from simulation noise. Additionally, only the direct effect of the UV–VIS radiation band (300–770 nm) was considered, as BrC refractive indices mainly differ from other organics in this band, and we would not expect a radiative effect beyond it.
2.3.2 Evaluation against global aerosol retrieval data
We evaluated the model's ability to capture total aerosol extinction and absorption when employing the new BrC scheme through comparison to retrievals of total aerosol optical depth (AOD) and absorbing aerosol optical depth (AAOD). This comparison was performed globally and regionally in BB regions during peak fire months. We chose to focus on BB as it is a key source of BrC (Chakrabarty et al., 2010; McMeeking et al., 2009), and initial model results showed that OAs, including BrC, are concentrated in BB regions (see Fig. 4).
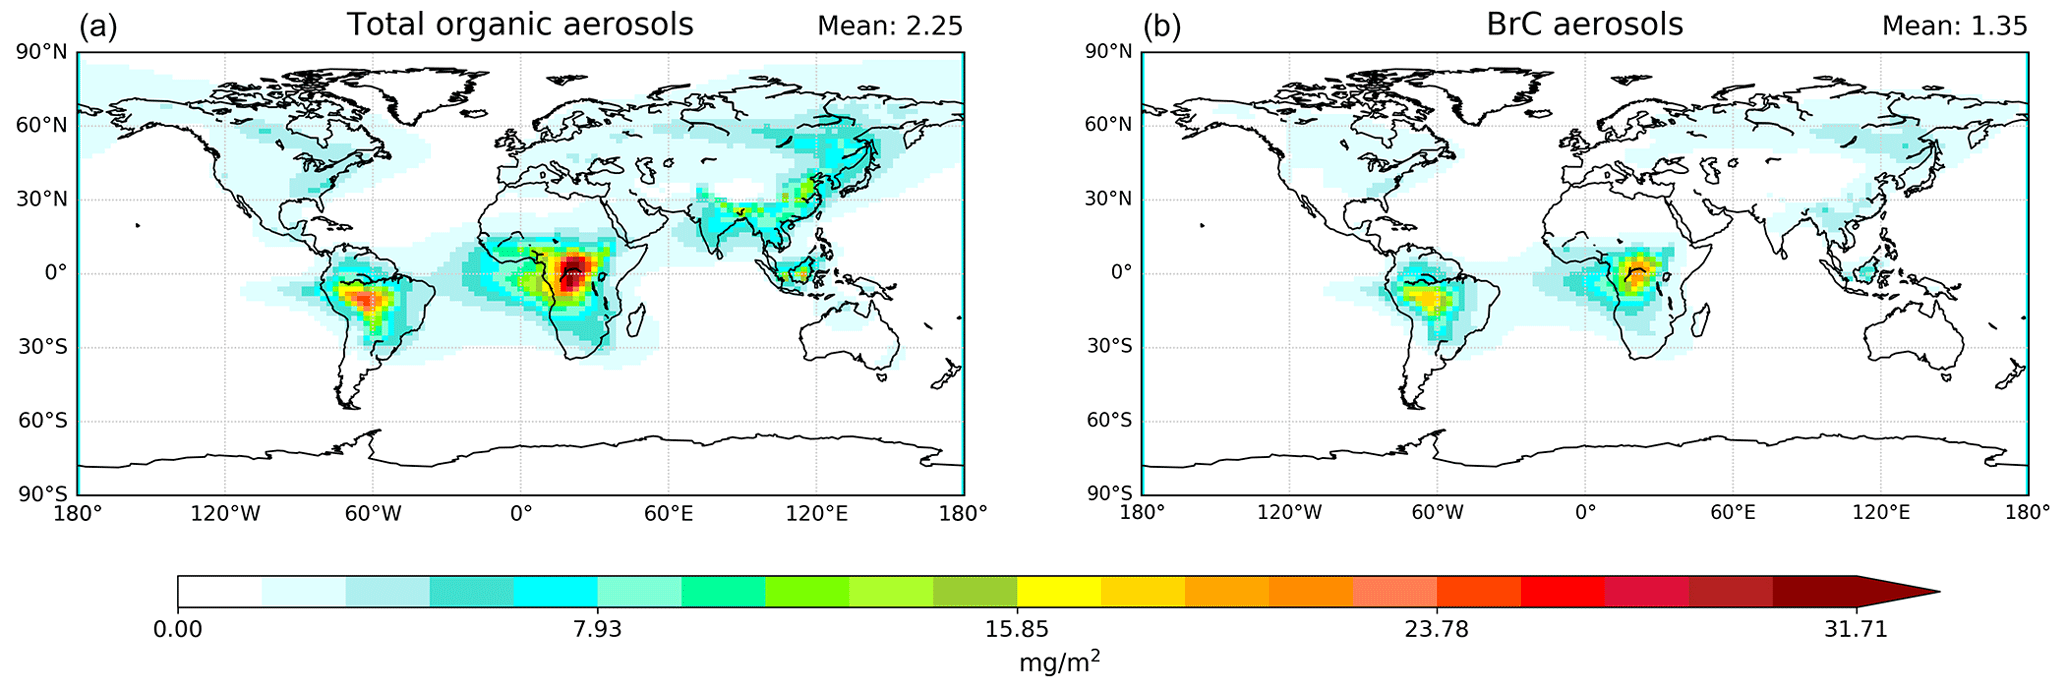
Figure 4Annual average of total OA (a) and BrC aerosol (b) column burden under base case BrC representation, as described in Sect. 2.2. Both maps demonstrate that organic and BrC aerosols are concentrated in BB regions of the Amazon, central/Southern-Hemisphere Africa, and southeast and equatorial Asia. As BrC aerosols consist of biogenic SOAs, in addition to BB emissions, high concentrations are also apparent in regions with high emissions of BVOCs. Similarly, industrial organic emissions contribute to total organic aerosol concentrations outside of BB regions. This map represents an annual average of a climatological simulation, which is a decadal mean centered around the year 2000, so seasonal variations and emissions from BB regions that may have been prominent in certain years, like the western United States and Australia, are not visible.
To further determine the effect of BrC in ModelE, beyond Sect. 2.3.1, this comparison was performed against a control simulation in addition to a simulation of the base case of BrC representation, where BrC parameters used were taken from simulations 1 and 5 in Table 2, respectively. The goal was to determine if BrC representation changes model performance against retrieval data. Unlike sensitivity tests which make use of climatological simulations, this comparison was done with nudged transient simulations using MERRA2 meteorology, to allow a better match to the actual observed period, and GFAS1.2 BB emissions, as stated in Sect. 2.1.
The Aerosol Robotic Network, or AERONET, consists of several hundred sun- and sky-scanning radiometers. Direct sun measurements and sky radiances are taken at typical wavelengths of 0.44, 0.675, 0.87, and 1.02 µm. AOD is a direct measurement product, while almucantar scans allow size distribution and absorption retrieval products. We made use of Version 3, Level 2 (L2) inversion product data, which require, in addition to cloud screening, pairs of measurements with the same scattering angles to agree within 20 %, at least 14 of these angular pairs to survive, and AOD at 0.44 µm (440 nm) to be greater than 0.4 for an AAOD retrieval to be considered. AAOD and AAE are linked to retrieved size distributions and refractive indices through Mie theory or T-matrix theory and are reported as column-integrated values (Sinyuk et al., 2020). The AOD measurements we used are coincident, meaning they were taken simultaneously with an almucantar scan.
We compared monthly averages of AERONET L2 AOD and AAOD over a 10-year period, 2007–2016, to clear-sky, UV–VIS-band optical depth simulated by ModelE. Since a solar-spectrum-weighted average of wavelengths in the UV–VIS band is approximately 550 nm, we used the AE and AAE provided in L2 data to calculate the AERONET optical depth values at 550 nm (Schuster et al., 2006). Monthly mean averages of AAOD were computed considering only months at a site with at least 10 d of daily averaged AOD440 nm>0.4. Since retrieved AAOD values are highly uncertain with low-AOD conditions, this method aims to avoid considering months with too few reliable AAOD measurements (Dubovik et al., 2000). In addition to AERONET retrieval data, we compared ModelE-simulated AOD to column AOD at 550 nm from the Moderate Resolution Imaging Spectroradiometer (MODIS) instrument on the Terra satellite over the same 10-year period of 2007–2016. The benefit of using MODIS data, in addition to AERONET, is that it takes measurements over 36 spectral channels, allowing better cloud screening and high accuracy over land and oceans (Levy and Hsu, 2015). We used the Collection 6 Dark Target and Deep Blue combined product from the Terra satellite, with a resolution of 1° by 1°, for this analysis. The Dark Target AOD product covers global oceans and dark surfaces of continents, such as vegetated areas, while the Deep Blue product includes retrievals over additional brighter land types (Levy et al., 2013).
We focused on optical depth at 550 nm, rather than a shorter wavelength, because the purpose of this evaluation was to assess general model ability to capture total aerosol optical properties, essentially seeing if the BrC scheme improves or impairs overall model performance. For this reason, we worked within the current confines of ModelE radiation, which produces output in broad wavelength bands, as mentioned in Sects. 2.1 and 2.2.3, indicative of 550 nm in the UV–VIS band. Analysis at a shorter wavelength would require assuming an Ångström exponent for ModelE BrC optical depth, introducing further uncertainty to the parameter space. We will do such analysis in a future study, where BrC absorption will be evaluated extensively.
When narrowing analysis to peak BB regions and months, we looked at BrC emission hotspots, Southern-Hemisphere South America (SHSA), Southern-Hemisphere Africa (SHAF), southeast Asia (SEAS), and equatorial Asia (EQAS) (Laskin et al., 2015) – regions prone to BB and increasingly relevant in recent years – Temperate North America (TENA), Boreal North America (BONA), and Australia (AUST), as well as Boreal Asia (BOAS) to complement the analysis of BONA (Fig. 5).
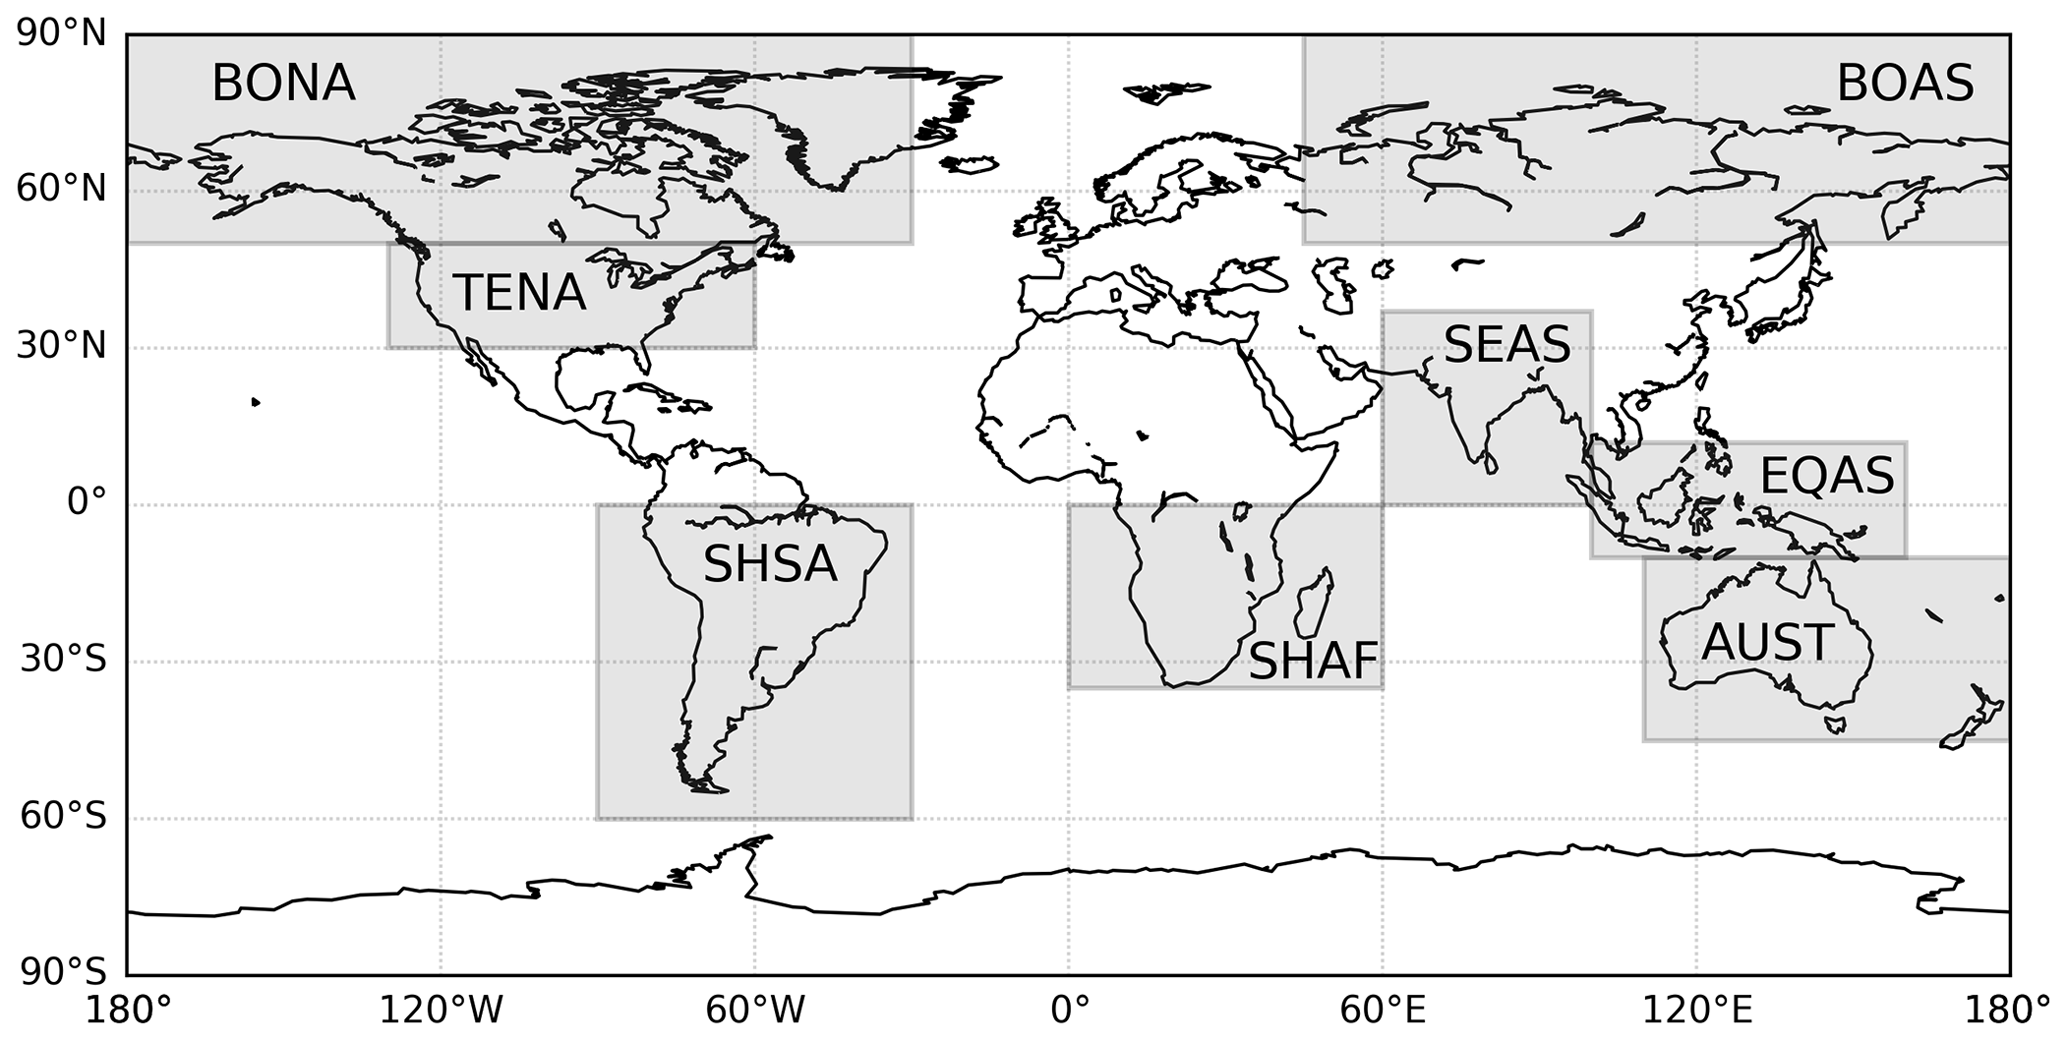
Figure 5Map showing the eight BB regions used in this study, following regionalization defined in Pan et al. (2020).
The peak fire months for these regions are, broadly, boreal spring for BOAS and SEAS; boreal summer for TENA and BONA; and austral spring for SHSA, SHAF, EQAS, and AUST (Pan et al., 2020). The exact months regarded as peak fire periods for each region of analysis and fire types that dominate in each region can be found in Table A3. We did not consider the Northern-Hemisphere Africa region in this focused analysis, as any AOD comparisons would be strongly affected by dust, making the interpretation of BB-only results difficult.
3.1 Changes in aerosol absorption and optical depth with BrC parameterization
We used global averages of aerosol single-scattering albedo (SSA) from the model sensitivity tests to assess the effect of BrC representation on aerosol absorption in ModelE; lower SSA indicates more-absorbing aerosols. There is almost no change – a decrease of 0.001 – in the global average total aerosol SSA with the introduction of BrC aerosols, which is expected, since global absorption is dominated by BC and dust. Additionally, there is limited observable change in the spatial distribution of total SSA, and therein the spatial distribution of total AOD and total AAOD, across all sensitivity tests (see Fig. 6).
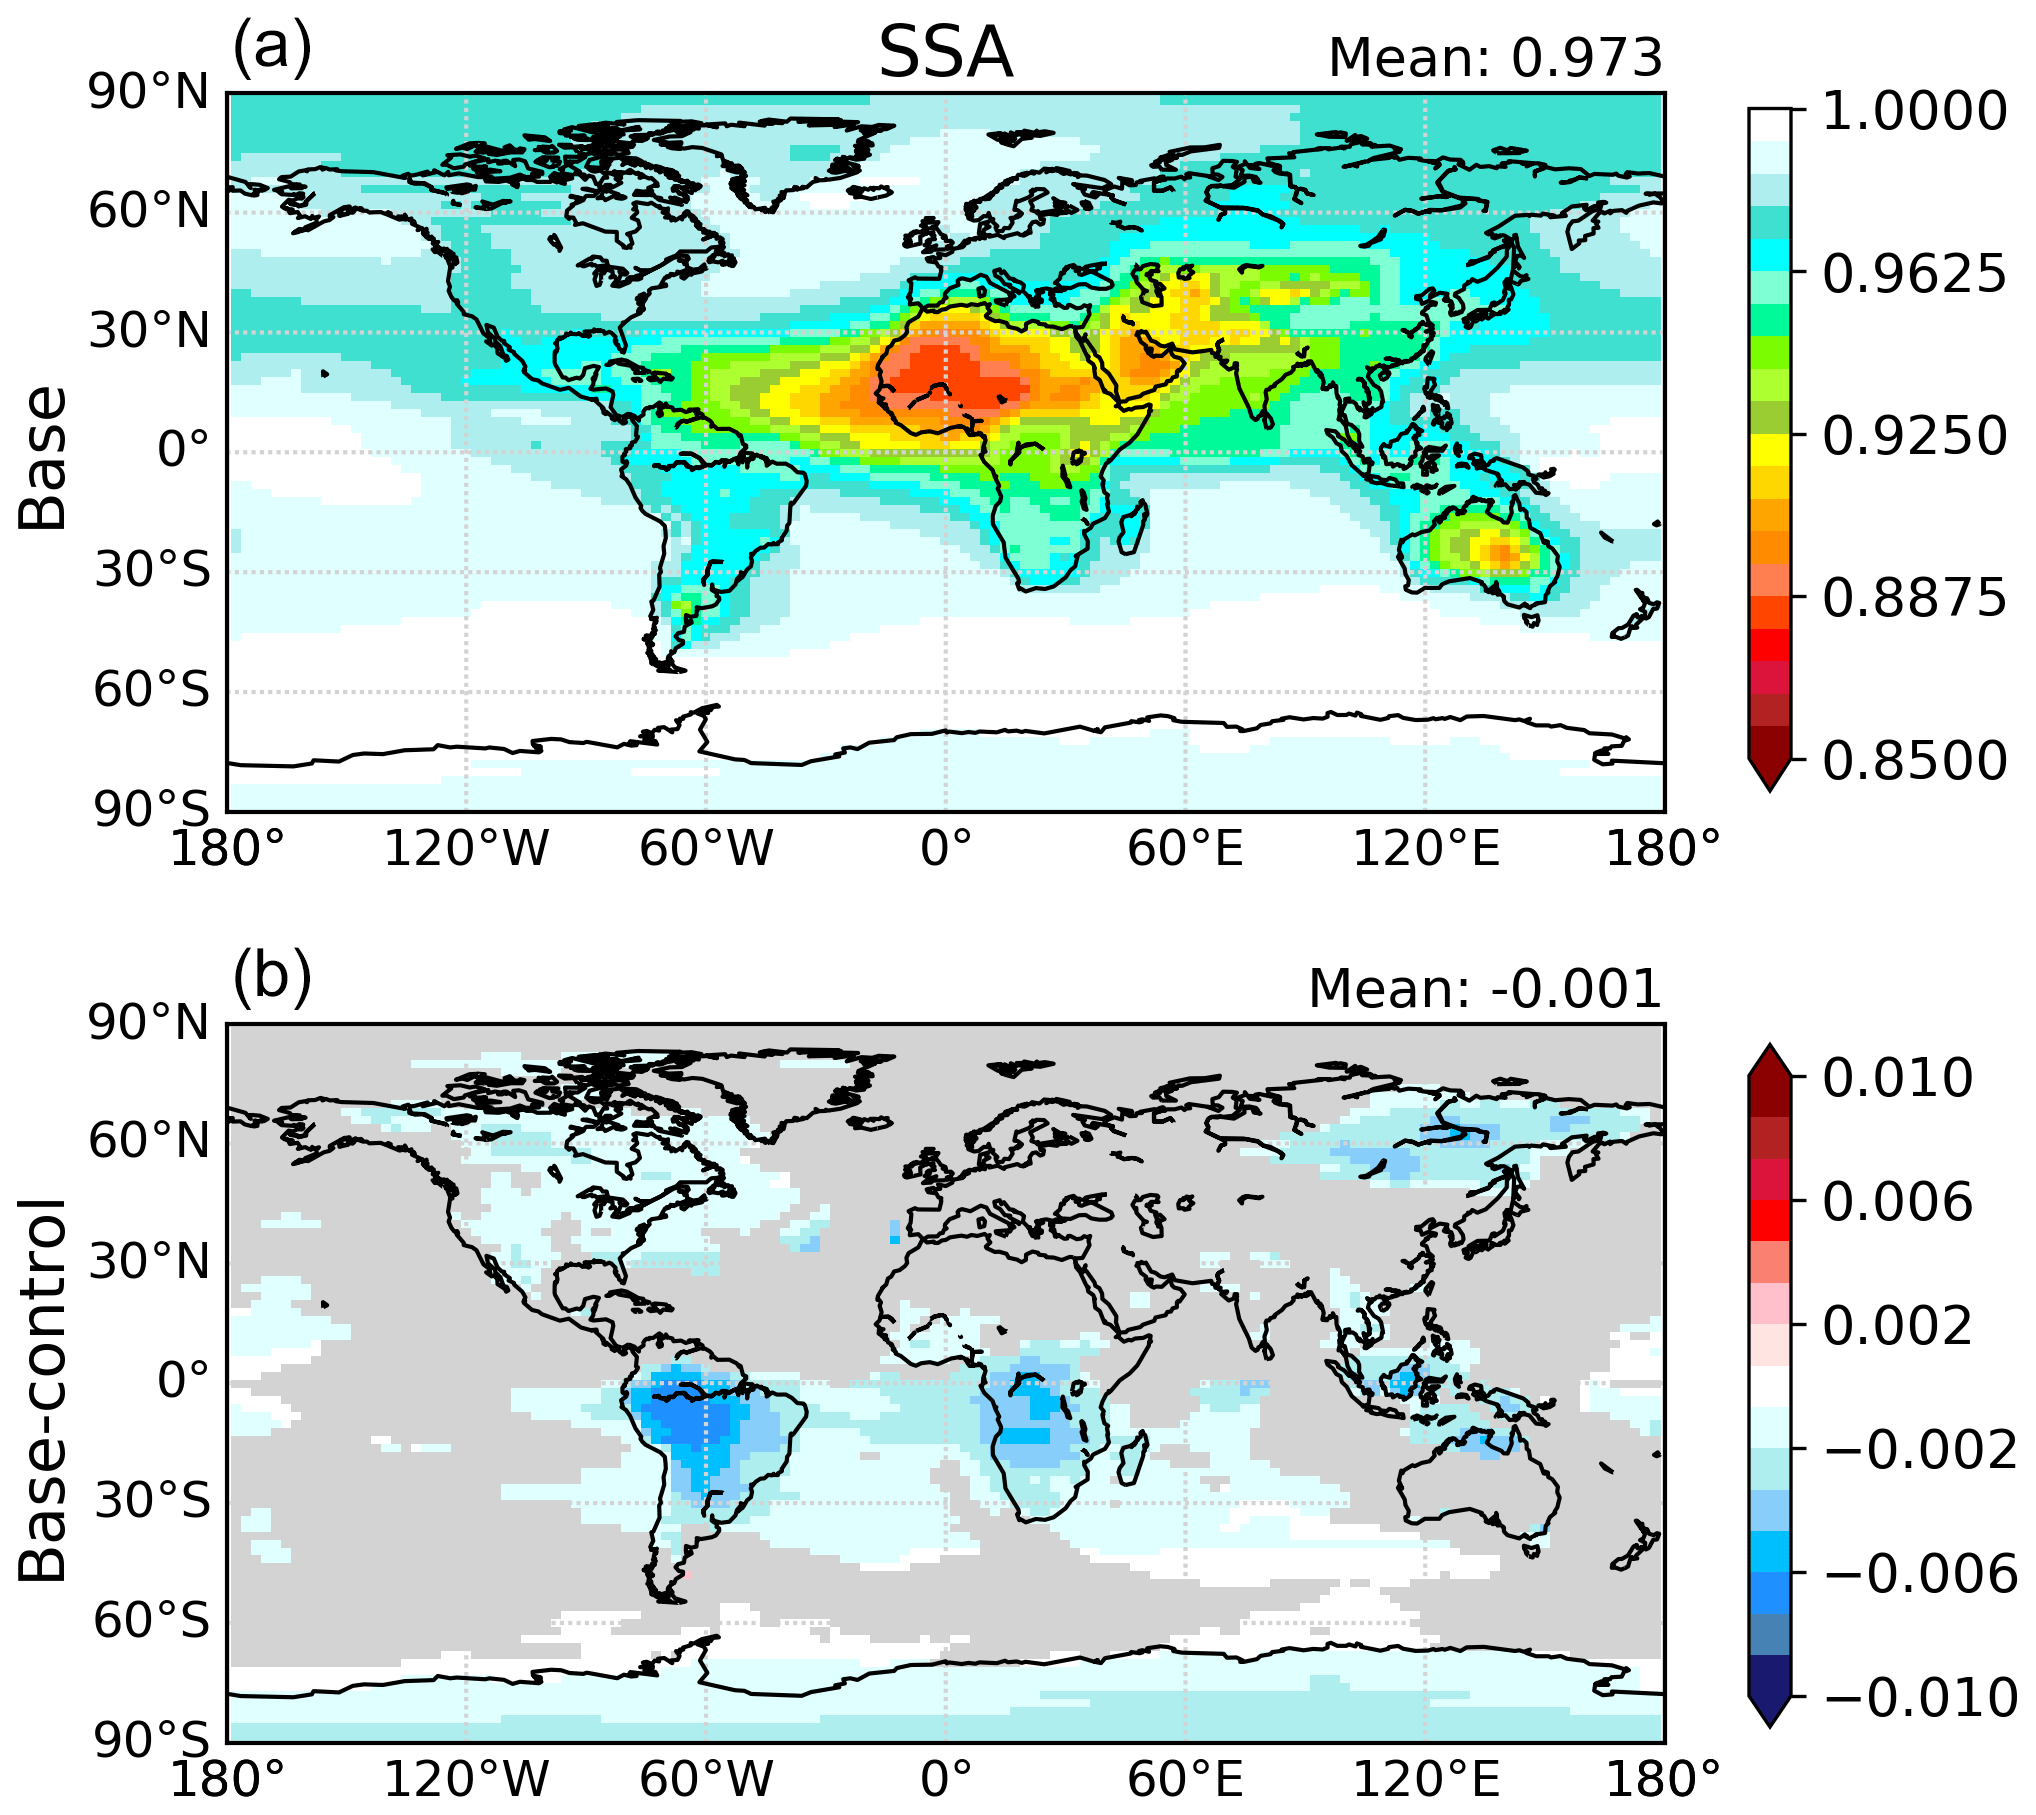
Figure 6(a) Total aerosol SSA, in the UV–VIS band, in the ModelE climatology simulation for the base case of BrC representation (Sim. 5 in Table 2). Global distribution of SSA in the control case, with no BrC simulated and all organics treated as non-absorbing (Sim. 1 in Table 2), is not pictured, as it appears identical to that of the base case. (b) Difference in total SSA between base and control case simulations. Only data at 95 % confidence level or higher, with differences attributable to changes in OA treatment rather than random noise, are shown – remaining data are grayed out. Though there is no apparent change in spatial distribution of total SSA, there are small changes in SSA magnitude in regions where BrC and OA aerosols are highly concentrated (see Fig. 4).
While BrC has a limited effect on total aerosol absorptivity, it does influence total OA absorption. In general, total OA SSA decreases with more-absorbing organics, due to either a greater amount or more-absorbing BrC simulated. This can be seen in Fig. 7: compared to the control case where no BrC is represented and all OAs are regarded as non-absorbing, SSA decreases when either (a) secondary BrC is included, (b) primary BrC changes from weakly to strongly absorbing, (c) the BrC-to-OA BB emissions ratio increases, or (d) primary BrC aging is excluded.
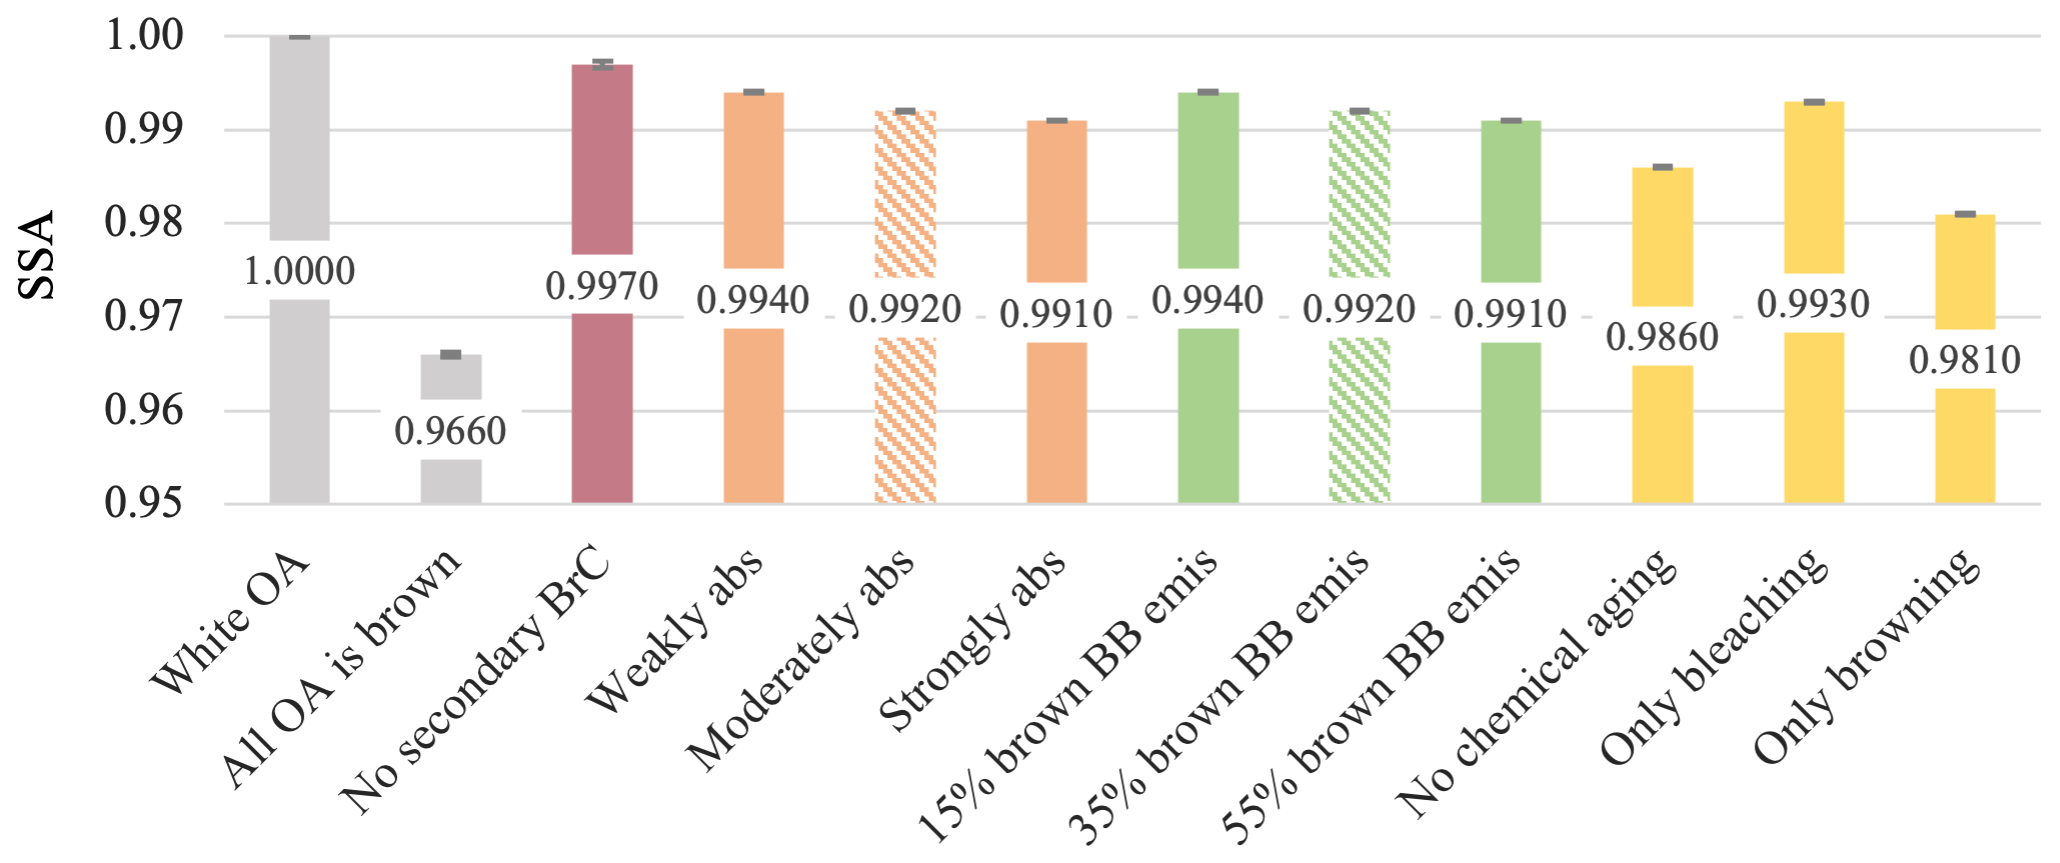
Figure 7Global annual average of total OA SSA, in the UV–VIS band, across sensitivity test simulations. The dashed bars show the base case simulation (this is shown twice for ease of comparison to other simulations). The effect of each varied property can be seen by comparing the simulated SSA to those of the control case and the base case. Error bars show the standard deviation of OA SSA and can be interpreted as the variability in each 15 year-long simulation. Gray: two simulations – control and default – where BrC is not explicitly represented. Red: properties and processes consistent with the base case except secondary BrC is not included. Orange: consistent with base case except for the primary BrC RI which varies between weakly, moderately, and strongly absorbing cases. Green: BrC-to-OA emissions ratio is varied, increasing from 15 % to 55 %. Yellow: primary BrC chemical scheme is varied, with no aging, only bleaching, and only browning simulated.
For the latter case, considering only bleaching leads to the highest SSA of all aging sensitivities because there is no “browner” BrC simulated. Additionally, since bleaching is a much faster process than browning, excluding browning allows primary BrC to move to the bleached state quicker: the chemical lifetime of primary BrC is reduced from 9.36 h to just 10.3 min. On the diurnal timescale, this is like BrC just bleaching in the daytime rather than building up and browning over several hours during the night.
The model's default case shows that assuming all OAs are brown, where we do not separately represent BrC and apply one non-zero imaginary RI to all OAs, results in the largest decrease in OA SSA. This default case and the simulations with only browning as the chemical aging process are not atmospherically realistic; only a fraction of OAs, not all, have been observed to absorb light, and the absorbing portion has been observed, both in lab and field studies, to bleach (Cubison et al., 2011; Laskin et al., 2015; Junghenn Noyes et al., 2020, 2022; Hems et al., 2021). We include these cases in our analysis, in addition to all other sensitivity test simulations, to bound BrC uncertainty.
Figure 8 shows that BrC optical depth follows the same patterns as total OA SSA: inclusion of secondary BrC, moving from weakly to strongly absorbing cases, increasing the BrC-to-OA emissions ratio, and removing bleaching increase BrC AAOD. BrC AOD only changes when more OA mass is regarded as brown.
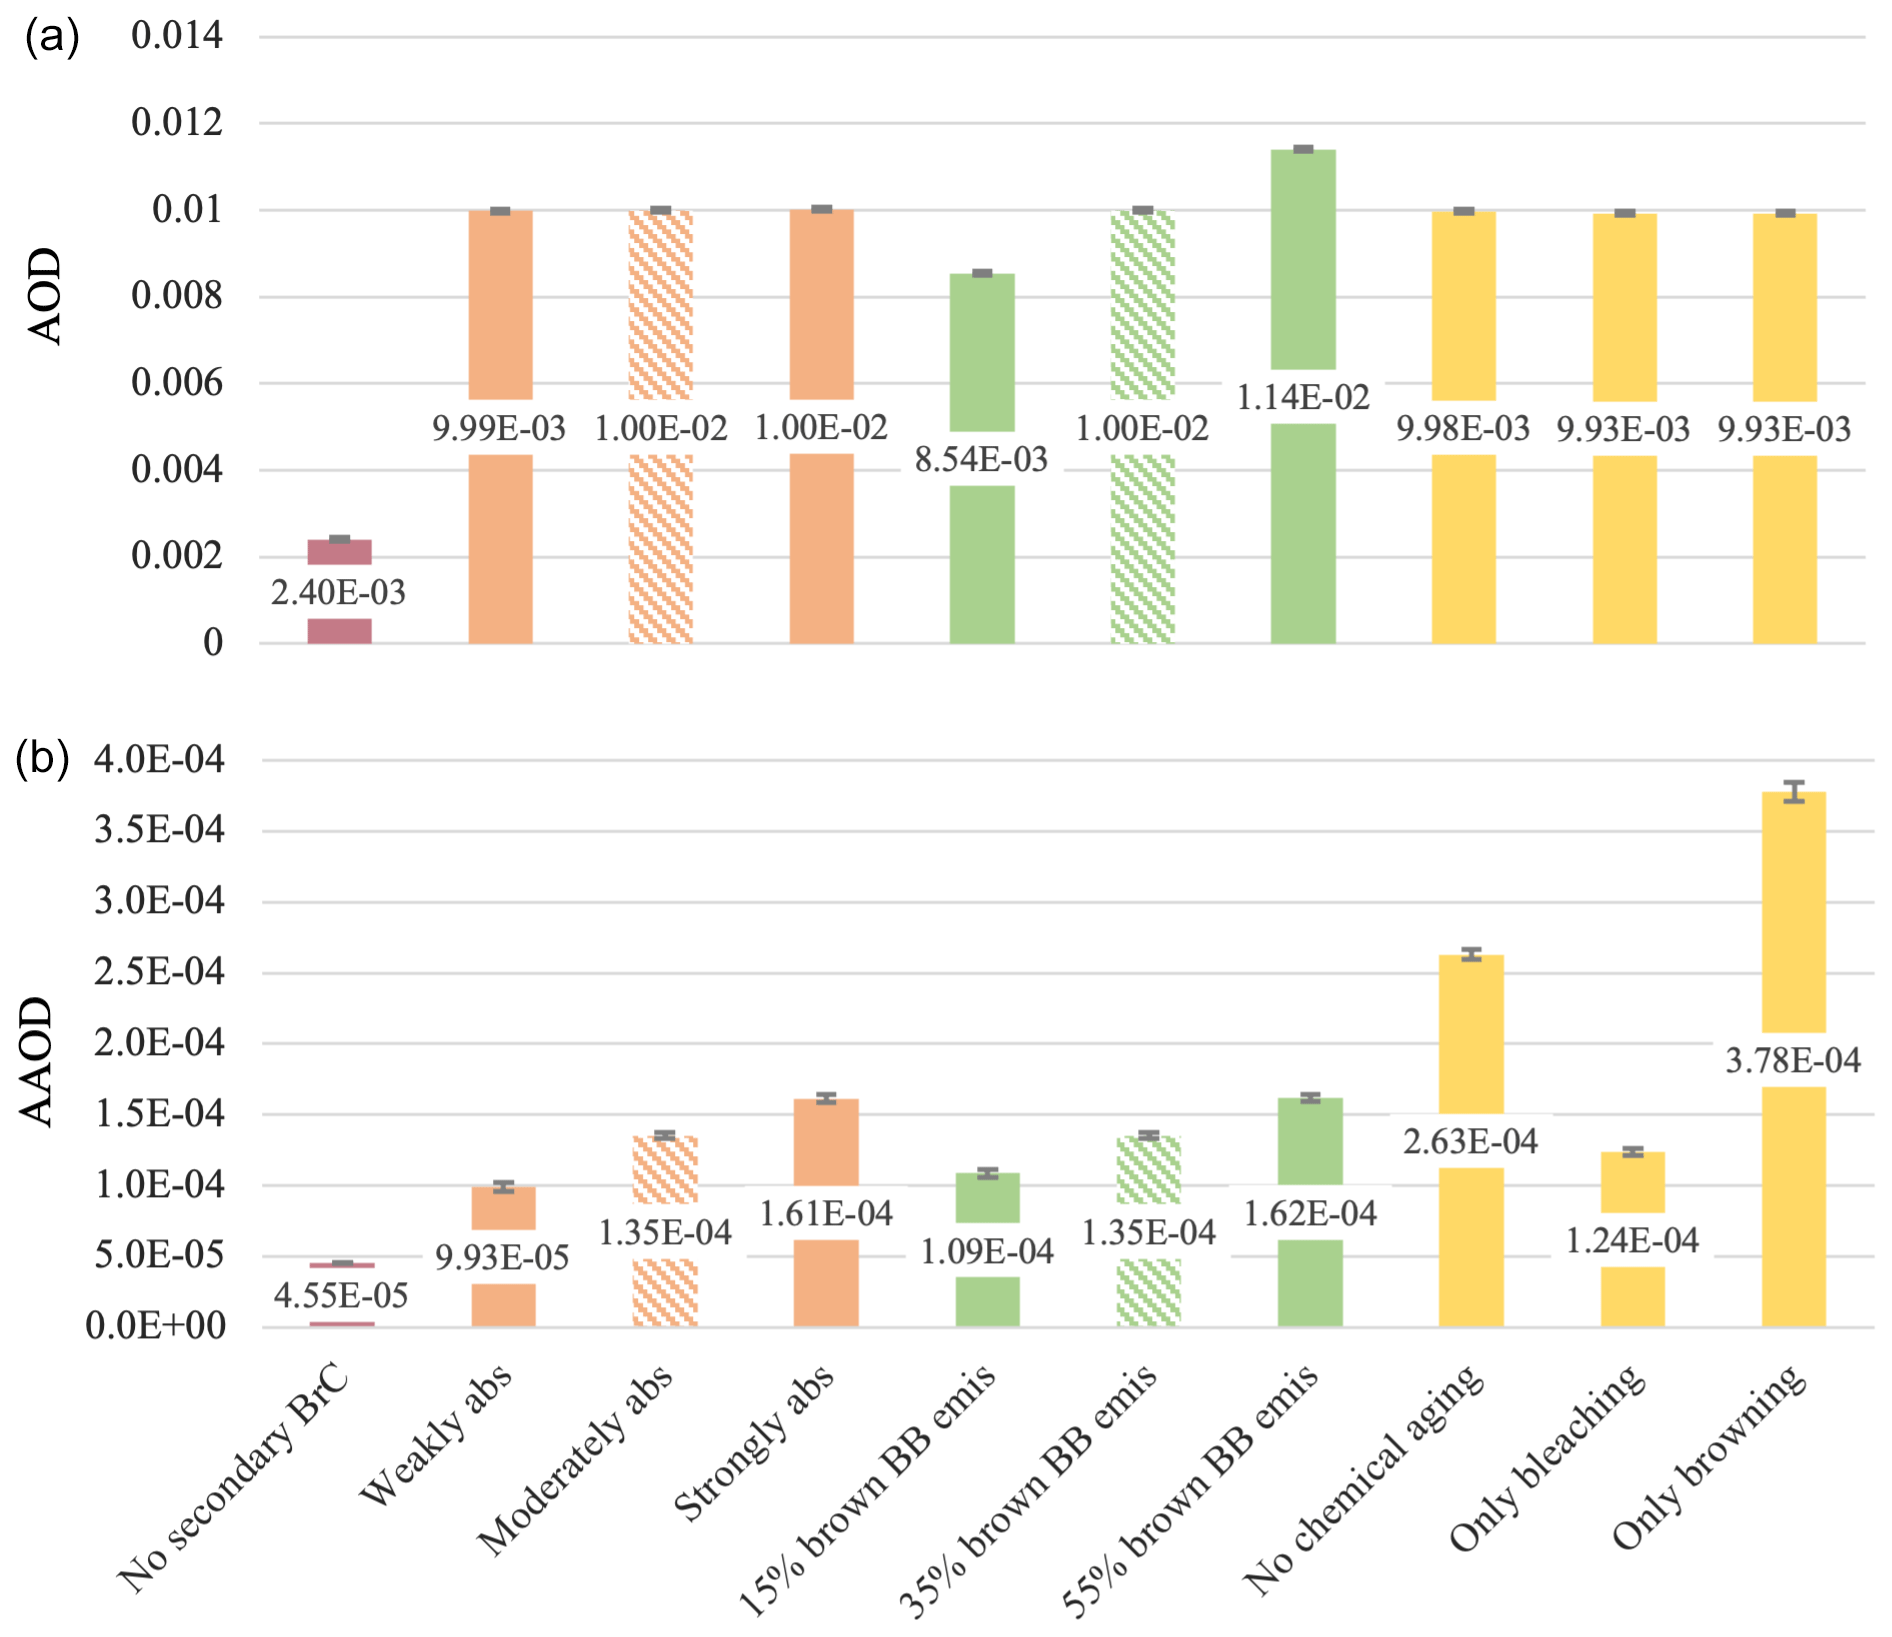
Figure 8(a) Total BrC UV–VIS AOD across each sensitivity test. (b) Total BrC UV–VIS AAOD. Error bars show the standard deviations (variability of each simulation across repeated years of simulation); different-colored bars indicate a different BrC property varied; and dashed bars indicate the base case of BrC representation (shown twice for ease of comparison to other simulations), consistent with Fig. 7. The ModelE default case is not displayed here as it does not explicitly simulate BrC; therefore no BrC optical depth could be calculated.
3.2 Evaluation of ModelE optical depth against retrieval data
Figure 9 shows the comparison of ModelE-simulated aerosol optical properties, with and without the BrC scheme, against AERONET retrieval data. As described in Sect. 2.3.2, these are nudged transient simulations with interannual variability, rather than climatological, and used GFAS1.2 BB emissions, rather than CEDS. This scatterplot comparison and the linear regression analysis accompanying each plot were done in the log10 space, rather than the linear space, as AOD is known to be approximately log-normally distributed, and any statistical analysis should reflect that (O'Neill et al., 2000; Sayer and Knobelspiesse, 2019).
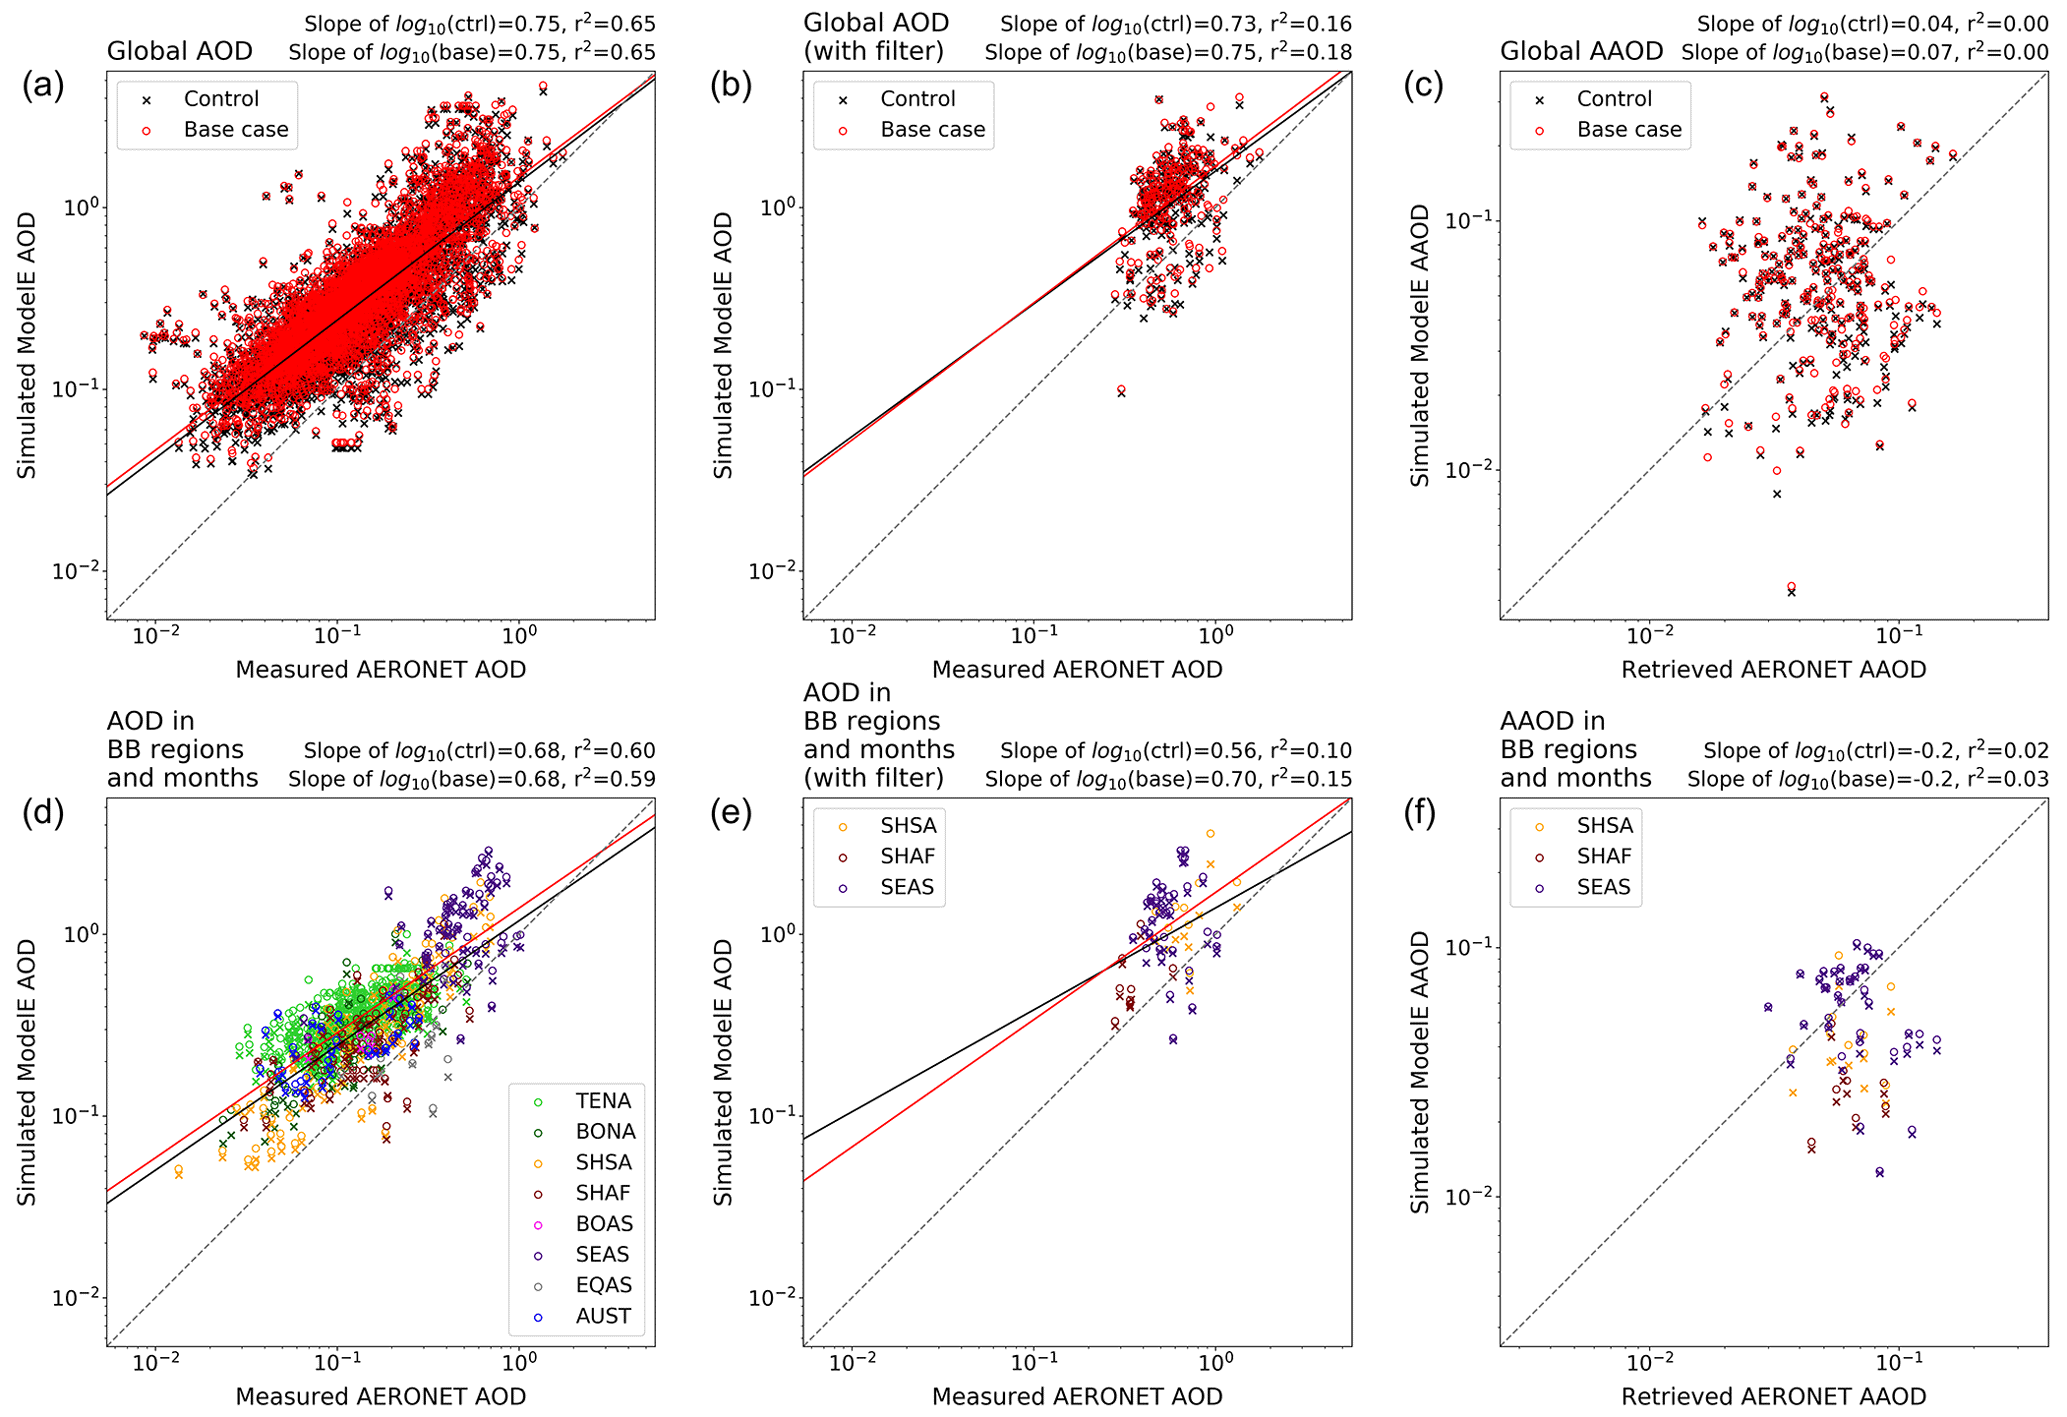
Figure 9Simulated ModelE optical depth at 550 nm (spectrally weighted average of the UV–VIS band) plotted in the log10 space against retrieved AERONET optical depth. Each point corresponds to the optical depth of 1 month, averaged across the 2007–2016 period, at an AERONET site and in the corresponding grid cell in ModelE. ModelE control case optical depth values are shown as x's, while base case values are shown as o's. The slope and r2 of the linear regression are displayed on the top-right corner of each plot, and regression lines are included for all AOD plots. All AODs included are coincident. (a) AOD values at all available AERONET sites. (d) AOD in BB regions during months considered peak for BB, with each color representing a different region. (b) AOD at all available AERONET sites after AOD440 nm<0.4 were removed. This is included to show corresponding AOD at the sites available for AAOD analysis. (e) AOD in BB regions and months with AOD440 nm<0.4 removed. Note that TENA, BONA, BOAS, EQAS, and AUST regions have been eliminated because of the AOD440 nm threshold. (c) AAOD values at all available AERONET sites after months with fewer than 10 d of AOD440 nm>0.4 were removed. (f) AAOD, with the same filter applied as the top-right plot, in BB regions and months. As in the bottom-center plot, five BB regions have been eliminated.
Across all six plots, there appears to be limited difference between the ModelE-simulated control case and base case optical depth, shown as x's and o's, respectively. Linear regression analysis for both AOD and AAOD (their log10 values), on both global and BB-region scales, shows minimal to no change in regression slope and r2 value when BrC is explicitly simulated. This suggests similar model skill against AERONET, with or without BrC representation. Furthermore, this supports results discussed in Sect. 3.1: total AOD and AAOD were found to have no apparent change across all sensitivity tests, including the control case. The lack of change in total AOD with the addition of BrC is not surprising, as no new aerosol mass was introduced in the model. Additionally, OAs and BrC have the same real RI; therefore scattering remains largely the same. Limited change in total AAOD is also expected as total AAOD is usually dominated by either BC or dust aerosols, as mentioned in Sect. 3.1 and demonstrated in Fig. 10.
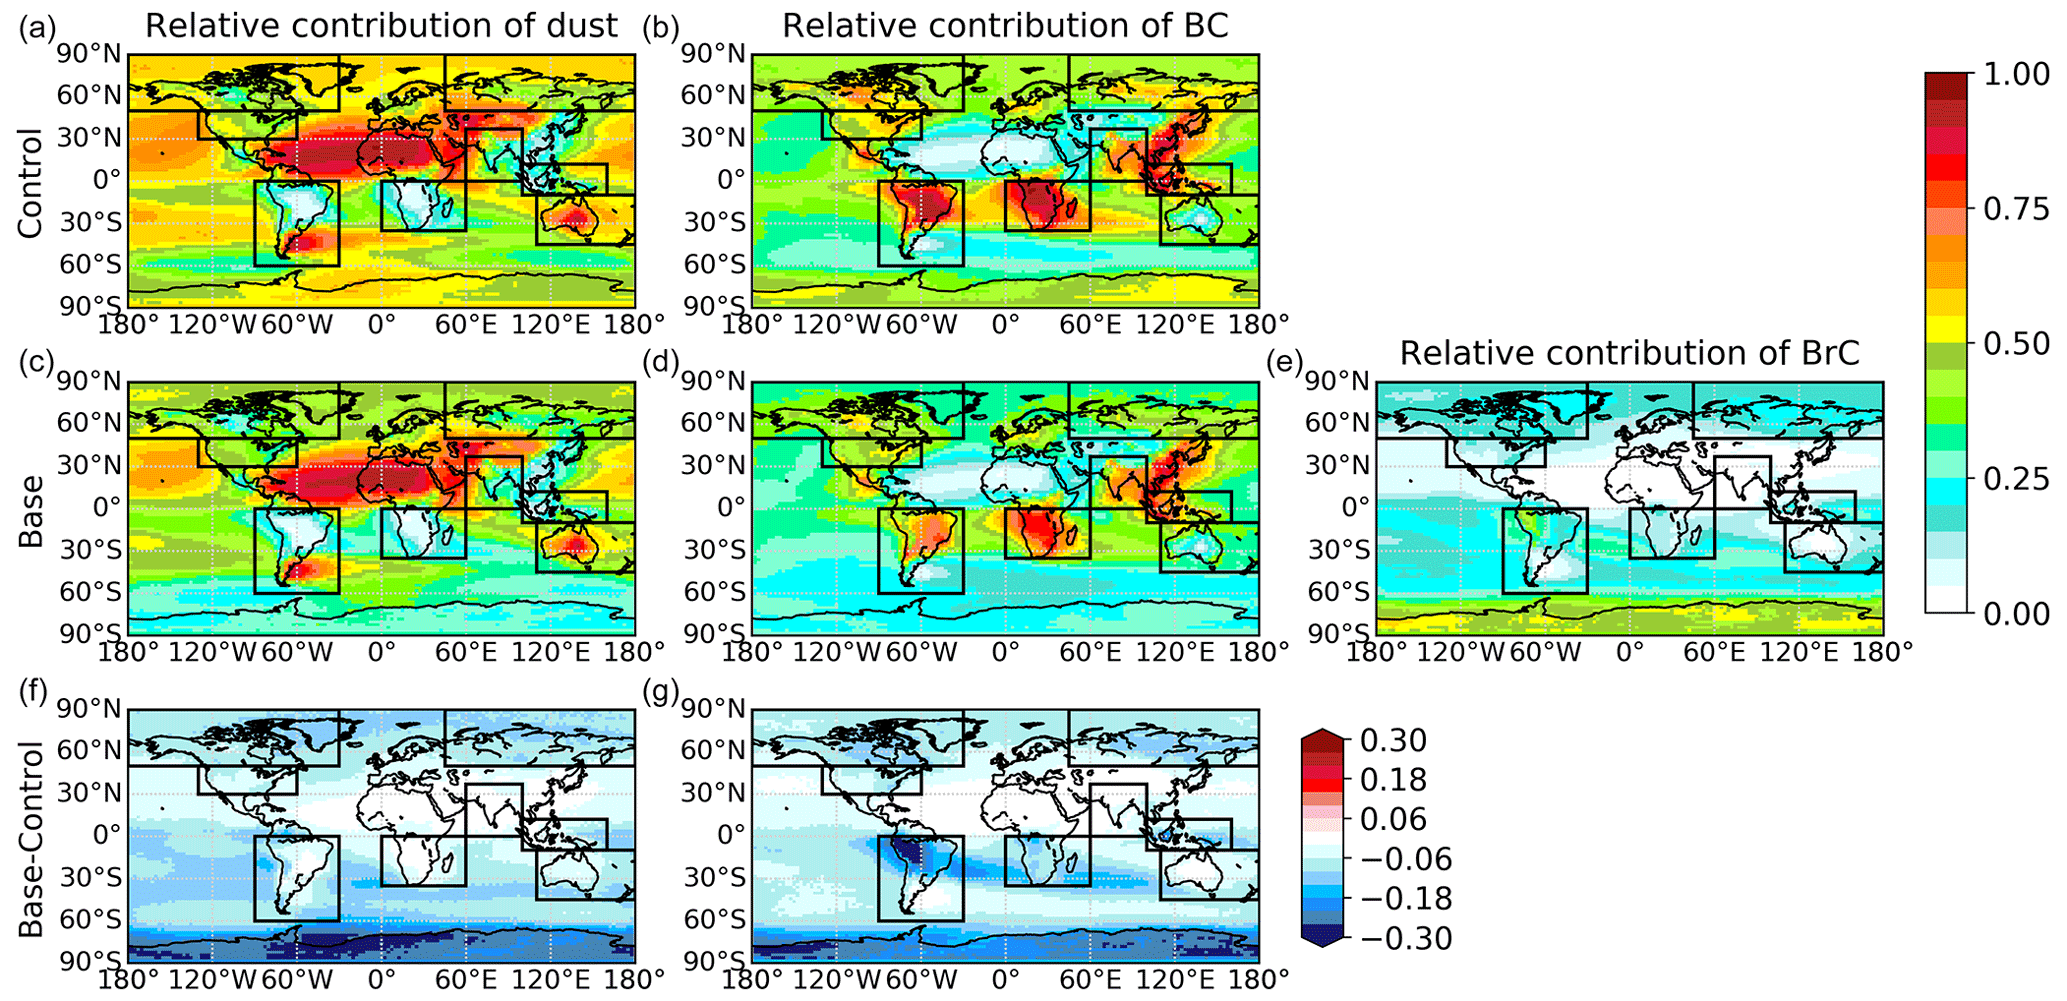
Figure 10Average over the 2007–2016 period of ModelE light-absorbing dust (a, c, f), BC (b, d, g), and BrC (e) contribution to total UV–VIS AAOD in control (a, b) and base (c–e) simulations, with each BB region of interest, identified in Sect. 2.3.2, outlined in black. (f, g) Difference in dust and BC contributions between base and control cases. Relative contribution of BrC in BB regions appears to come from a greater reduction in BC, rather than in dust.
Of the BB regions that we have focused our analysis on, AAOD is dominated by BC in most (SHSA, SHAF, TENA, BONA, BOAS, and EQAS), while dust dominates in AUST, and both BC and dust dominate in SEAS. BrC seems to account for the majority of AAOD only over the Antarctic, where brown SOAs in the remote free troposphere may be contributing more than dust or BC to the near-zero aerosol absorption occurring (Hu et al., 2013; Sand et al., 2017). It bears reminding that this comparison used retrieved AAOD at 550 nm, as that is the indicative wavelength of the ModelE UV–VIS wavelength band (see start of Sect. 2.2.3). If we were able to resolve total AAOD within ModelE at shorter wavelengths, for instance 365 nm, we would likely see BrC have a much larger relative contribution to total AAOD. This would particularly be the case over the BB regions currently dominated by spectrally flat BC absorption. Therefore, it is possible that model performance between control and base case simulations would differ if we looked at UV and near-UV wavelengths, something we are currently unable to do within the ModelE radiation scheme.
Returning to Fig. 9, the left column demonstrates that, on both a global scale and within BB regions and months, ModelE tends to overestimate AOD relative to AERONET measurement, with greater overestimates at lower AOD values. The center column of Fig. 9 shows the same AOD data as the left column with the data coverage filter for AAOD applied: all AOD values at 440 nm below 0.4 were removed. With this filter, data from TENA, BONA, BOAS, EQAS, and AUST are lost, along with the strong linear relationship between retrieved and simulated data. Despite this, we can still see the ModelE overestimation of AOD, as most data points fall above the one-to-one line. Finally, looking at the right column of Fig. 9, the AERONET and ModelE AAOD comparison shows a large spread of AAOD values with no apparent linear relationship. Though the model appears to underestimate AAOD in the SHAF region and in some sites in SHSA and SEAS, the limited sites with data make it difficult to draw any meaningful conclusions. Furthermore, this data scatter is mostly caused by dust and BC, rather than BrC, which shows minimal variability in AAOD (see Fig. 8).
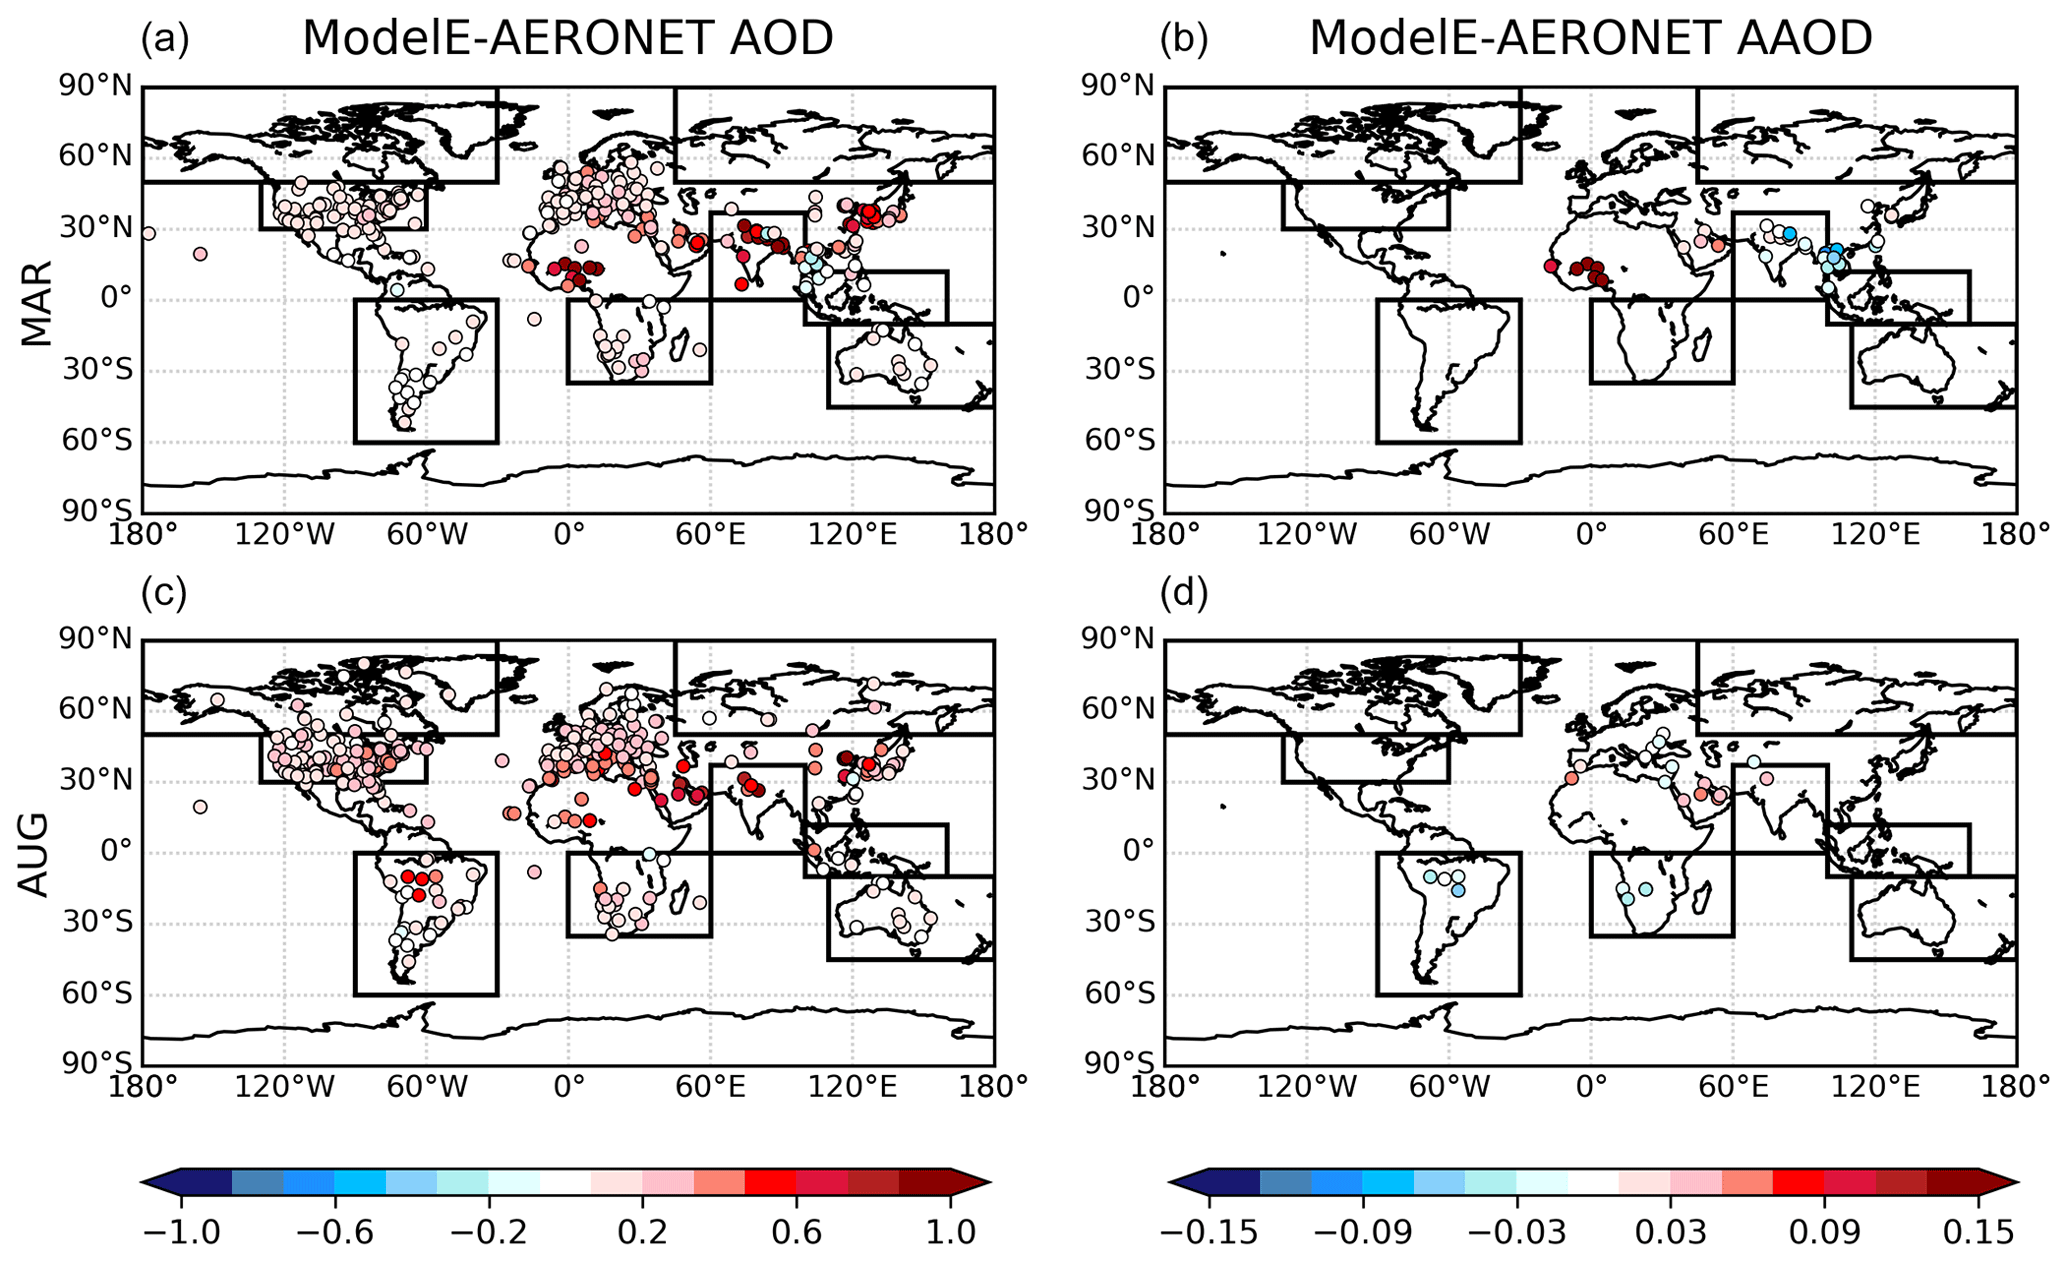
Figure 11Map of model optical depth bias, where each point corresponds to the difference in ModelE base case and AERONET optical depth, at 550 nm, at an AERONET site, averaged over the 2007–2016 period, for the months of March (a, b) and August (c, d). March and August are displayed as, together, they overlap with the BB season of almost all regions of interest.
Figure 11 shows the global distributions of the ModelE bias in AOD and AAOD, relative to AERONET, for the months of March and August. This confirms the findings of Fig. 9: AOD bias maps show a global pattern of overestimation. While there are a limited number of sites in the AAOD bias maps, there does appear to be negative bias at some sites in the SHAF, SHSA, and SEAS BB regions. Again, due to the sparse data, no definitive conclusions can be drawn from this.
Evaluation of ModelE optical depth against MODIS retrieval data supports the conclusions from that of AERONET. Firstly, there is no apparent difference between ModelE-simulated control case and base case AOD when compared to MODIS, confirming that model skill is unchanged with BrC representation (see Fig. A2). ModelE also tends to overestimate AOD relative to MODIS, consistent with AERONET results. A comparison to MODIS data gives a clearer understanding of this model bias, as we get a global picture with better spatial coverage, shown in Fig. 12.
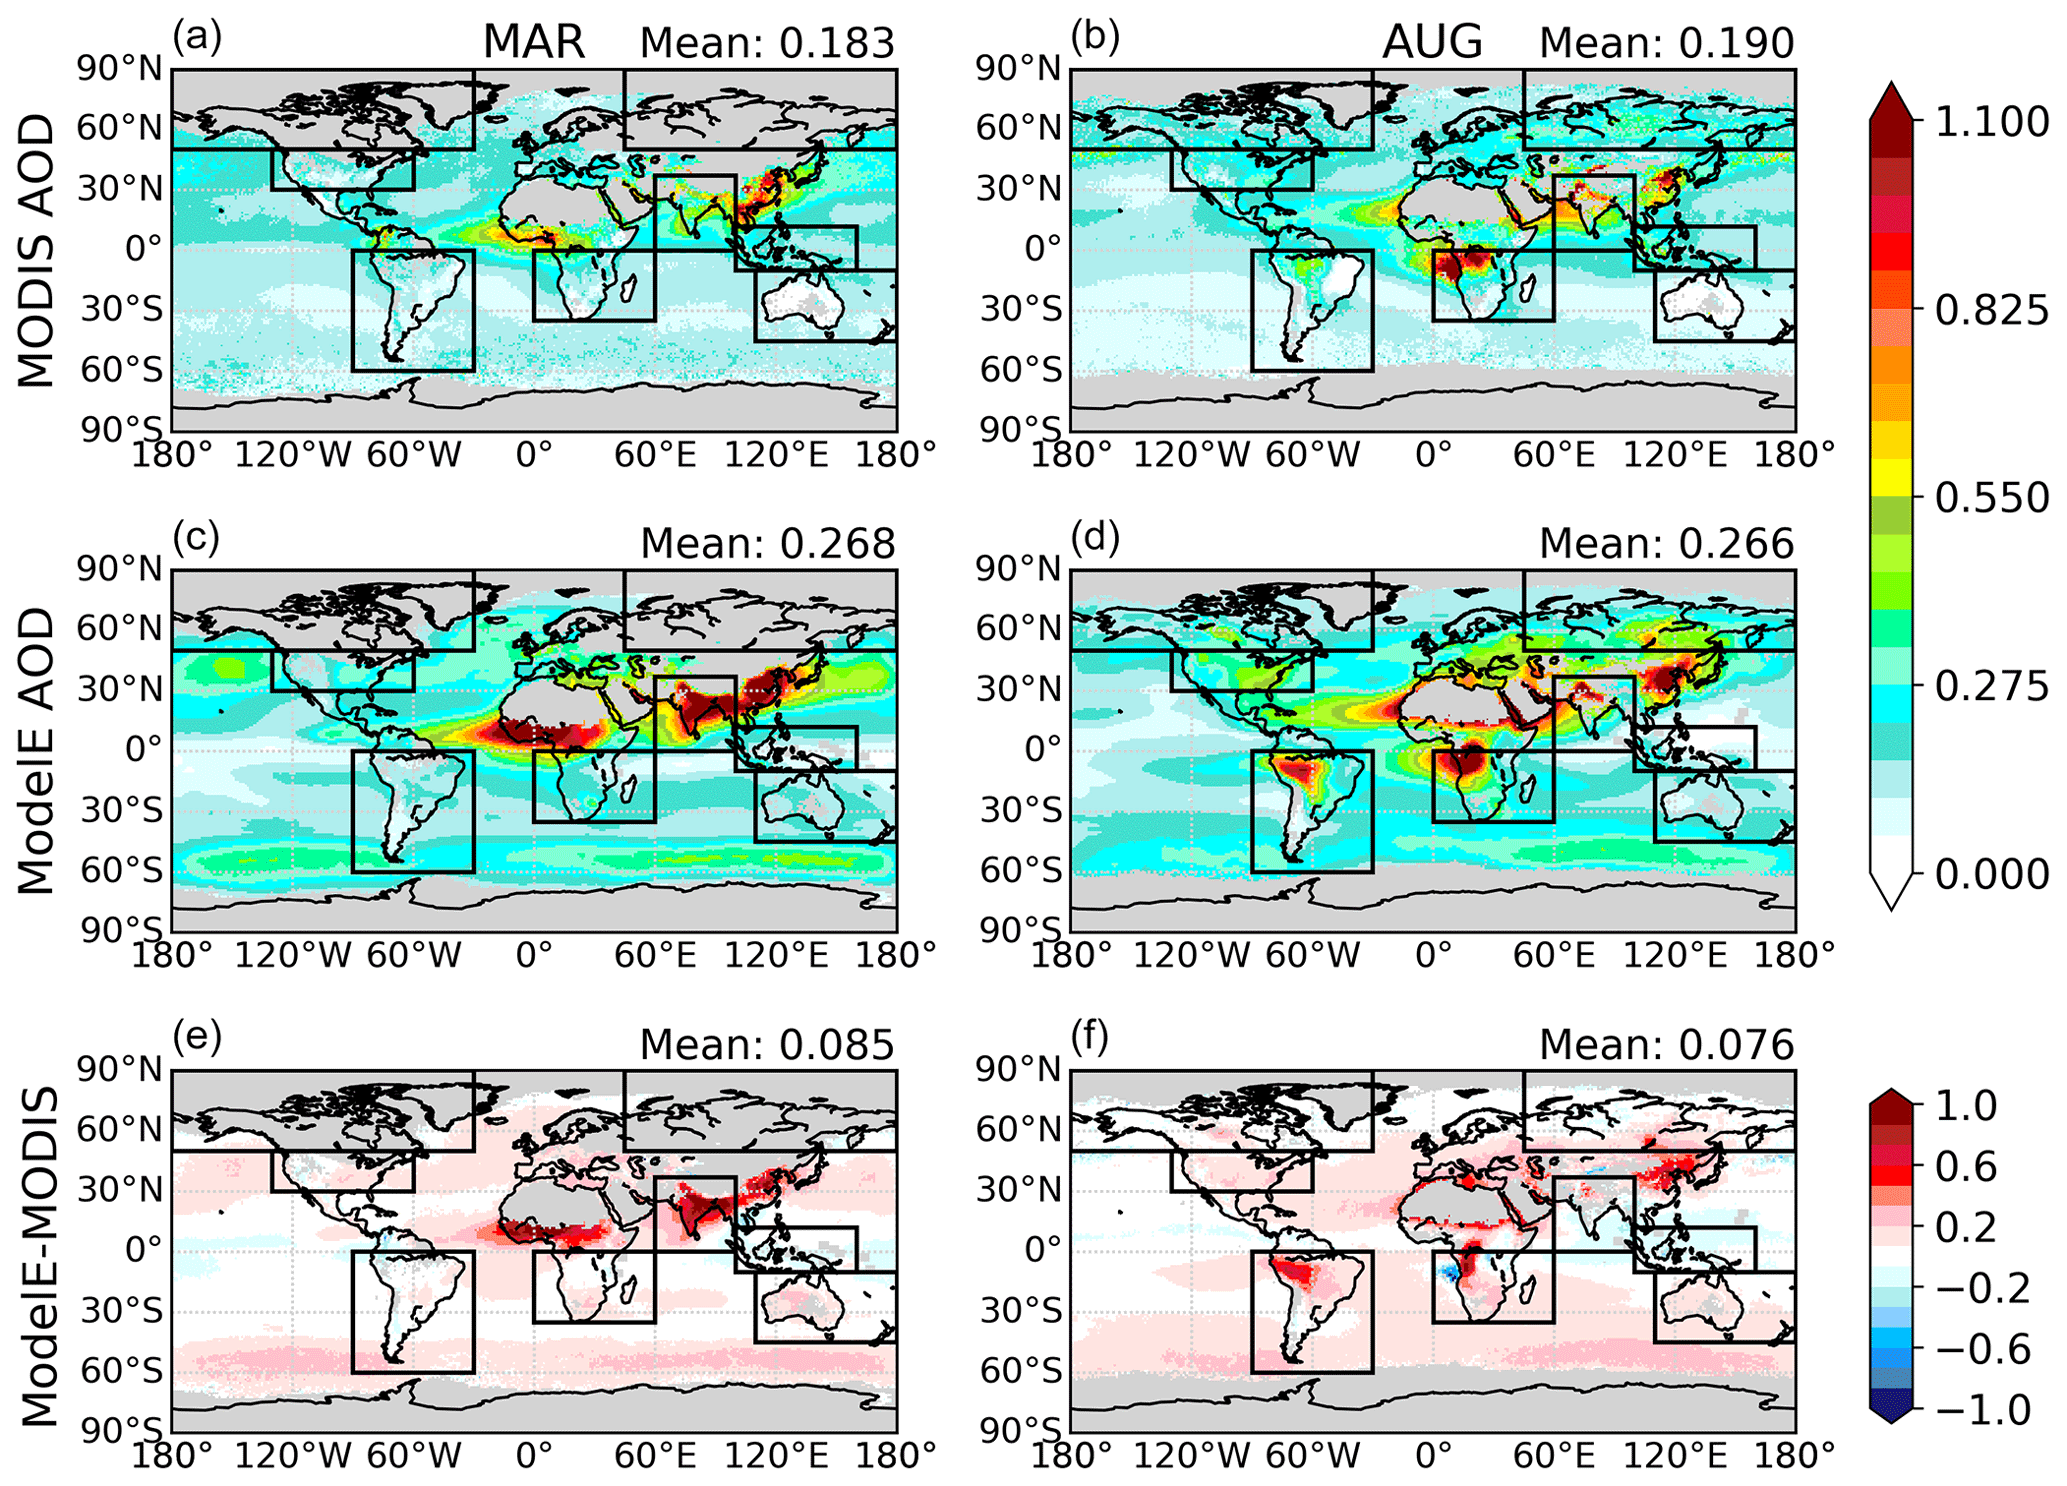
Figure 12(a, b) MODIS AOD at 550 nm averaged over the 2007–2016 period. (c, d) Average ModelE base case AOD, re-gridded through bilinear interpolation to match the 1°-by-1° resolution of MODIS data. Grid cells corresponding to those that do not have MODIS data are removed (shown in gray). (e, f) Model AOD bias, calculated as the difference between ModelE base case and MODIS. The left column shows results for the month of March, while the right column shows results for the month of August, consistent with Fig. 11. BB regions of interest are outlined in black.
In the bottom row, we can see a positive model bias over regions heavily influenced by sea salt aerosols, like the Southern Ocean, and over northern Africa, which is influenced primarily by dust. Such bias in dust and sea salt aerosols was not observed in previous CMIP6 model evaluation with MODIS comparison (Bauer et al., 2020), but the ModelE radiation scheme has since been updated with a change in optical calculation, including a more accurate treatment of aerosol hydration using Köhler theory. The ModelE natural emissions have not yet been retuned following this change. This suggests that the model AOD overestimation is different from previous results due to a change in model parameterization, not the BrC scheme presented here.
A strong positive bias can be seen over SEAS in March, which falls in the BB season of the region. Similarly, a slightly weaker, though still prominent, positive bias can be seen over part of SHSA in August. Since this occurs during the BB season of each respective region, it may indicate an overestimation of BB emissions. EQAS appears to be the only BB region in which ModelE underestimates AOD: this can be seen as a slightly negative bias over the region in Fig. 12 and is further supported by Fig. A2. Since this bias appears stronger in August, during the peak of EQAS BB activity, this may be due to an underestimation of emissions from peat burning, which dominates BB in the region (van der Werf et al., 2017). To summarize, this analysis has afforded interesting insight into ModelE AOD biases, suggesting that the observed differences between retrieved and simulated optical depth is largely a result of changes in model implementation rather than BrC representation. We do not expect these biases to overpower BrC-driven changes in total AOD, because the BrC contribution to total AOD is small – approximately 5 % of average total AOD in the base case – and, as previously stated, there was no distinguishable change in total AOD across all sensitivity test simulations, including the control case.
3.3 BrC radiative effect
In the base case simulation, ModelE total OA radiative forcing (RF) is −0.42 ± 0.01 W m−2. This can be compared to the organic RF of the control and default cases of −0.46 ± 0.01 and −0.32 ± 0.01 W m−2, respectively. Variabilities presented here are calculated as the standard deviation across repeated years of each simulated case. The introduction of absorption does not shift organic aerosols from negative to positive RF, since BrC is a weak absorber when integrated across a wide wavelength range. Instead, representation of BrC or the attribution of absorption to all organics result in a reduction in the total organic cooling effect. The direct radiative effect of BrC in the base case simulation, calculated according to Eq. (8), is 0.04 ± 0.01 W m−2. For reference, Table 3 shows the TOA instantaneous direct RF of other ModelE-simulated accumulation-mode aerosols.
Table 3Global annual average instantaneous TOA direct RF of ModelE accumulation-mode aerosol species. Net RF was calculated as the sum of shortwave and longwave forcings.
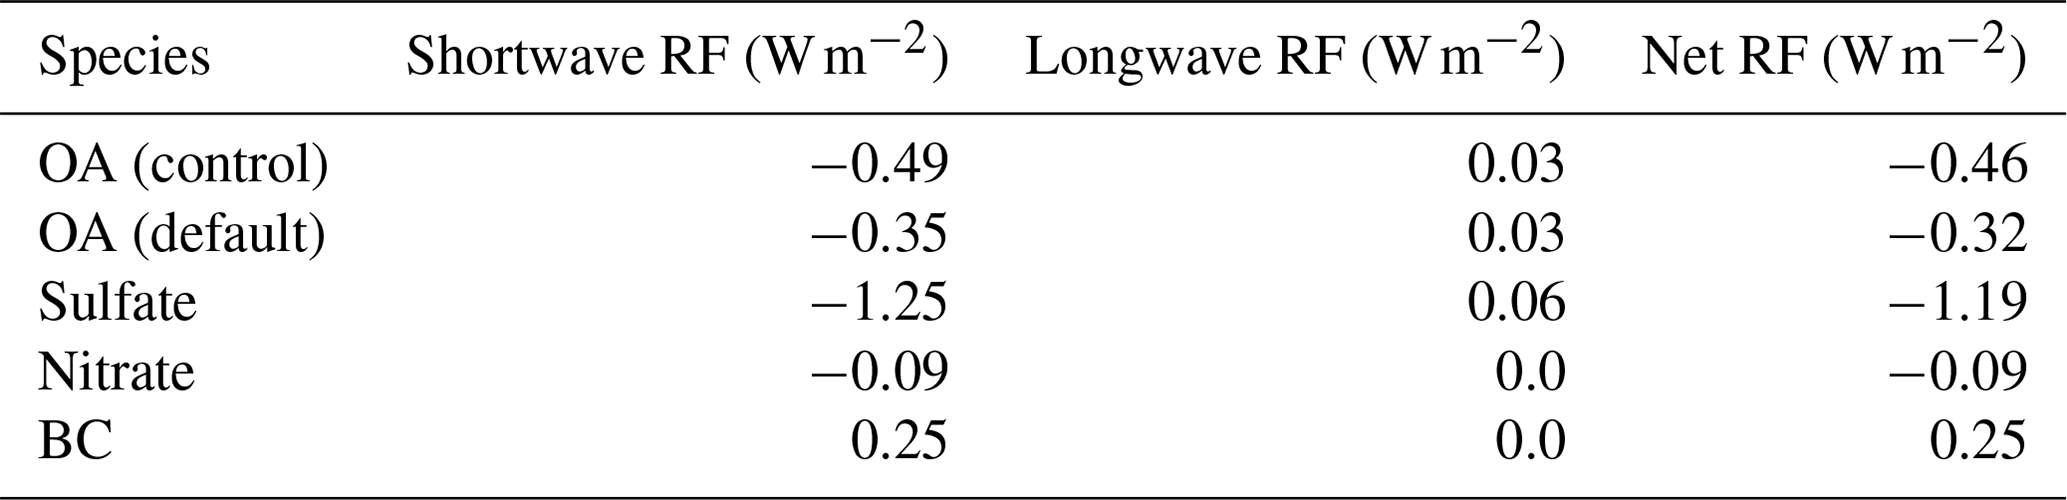
BC aerosols have a large, positive RF (all from the shortwave). This can be compared to BrC, which contributes a relatively small radiative effect. Figure 13 shows the global spatial distribution of this BrC effect, which is consistent with maps of total organic and BrC aerosols (see Fig. 4).
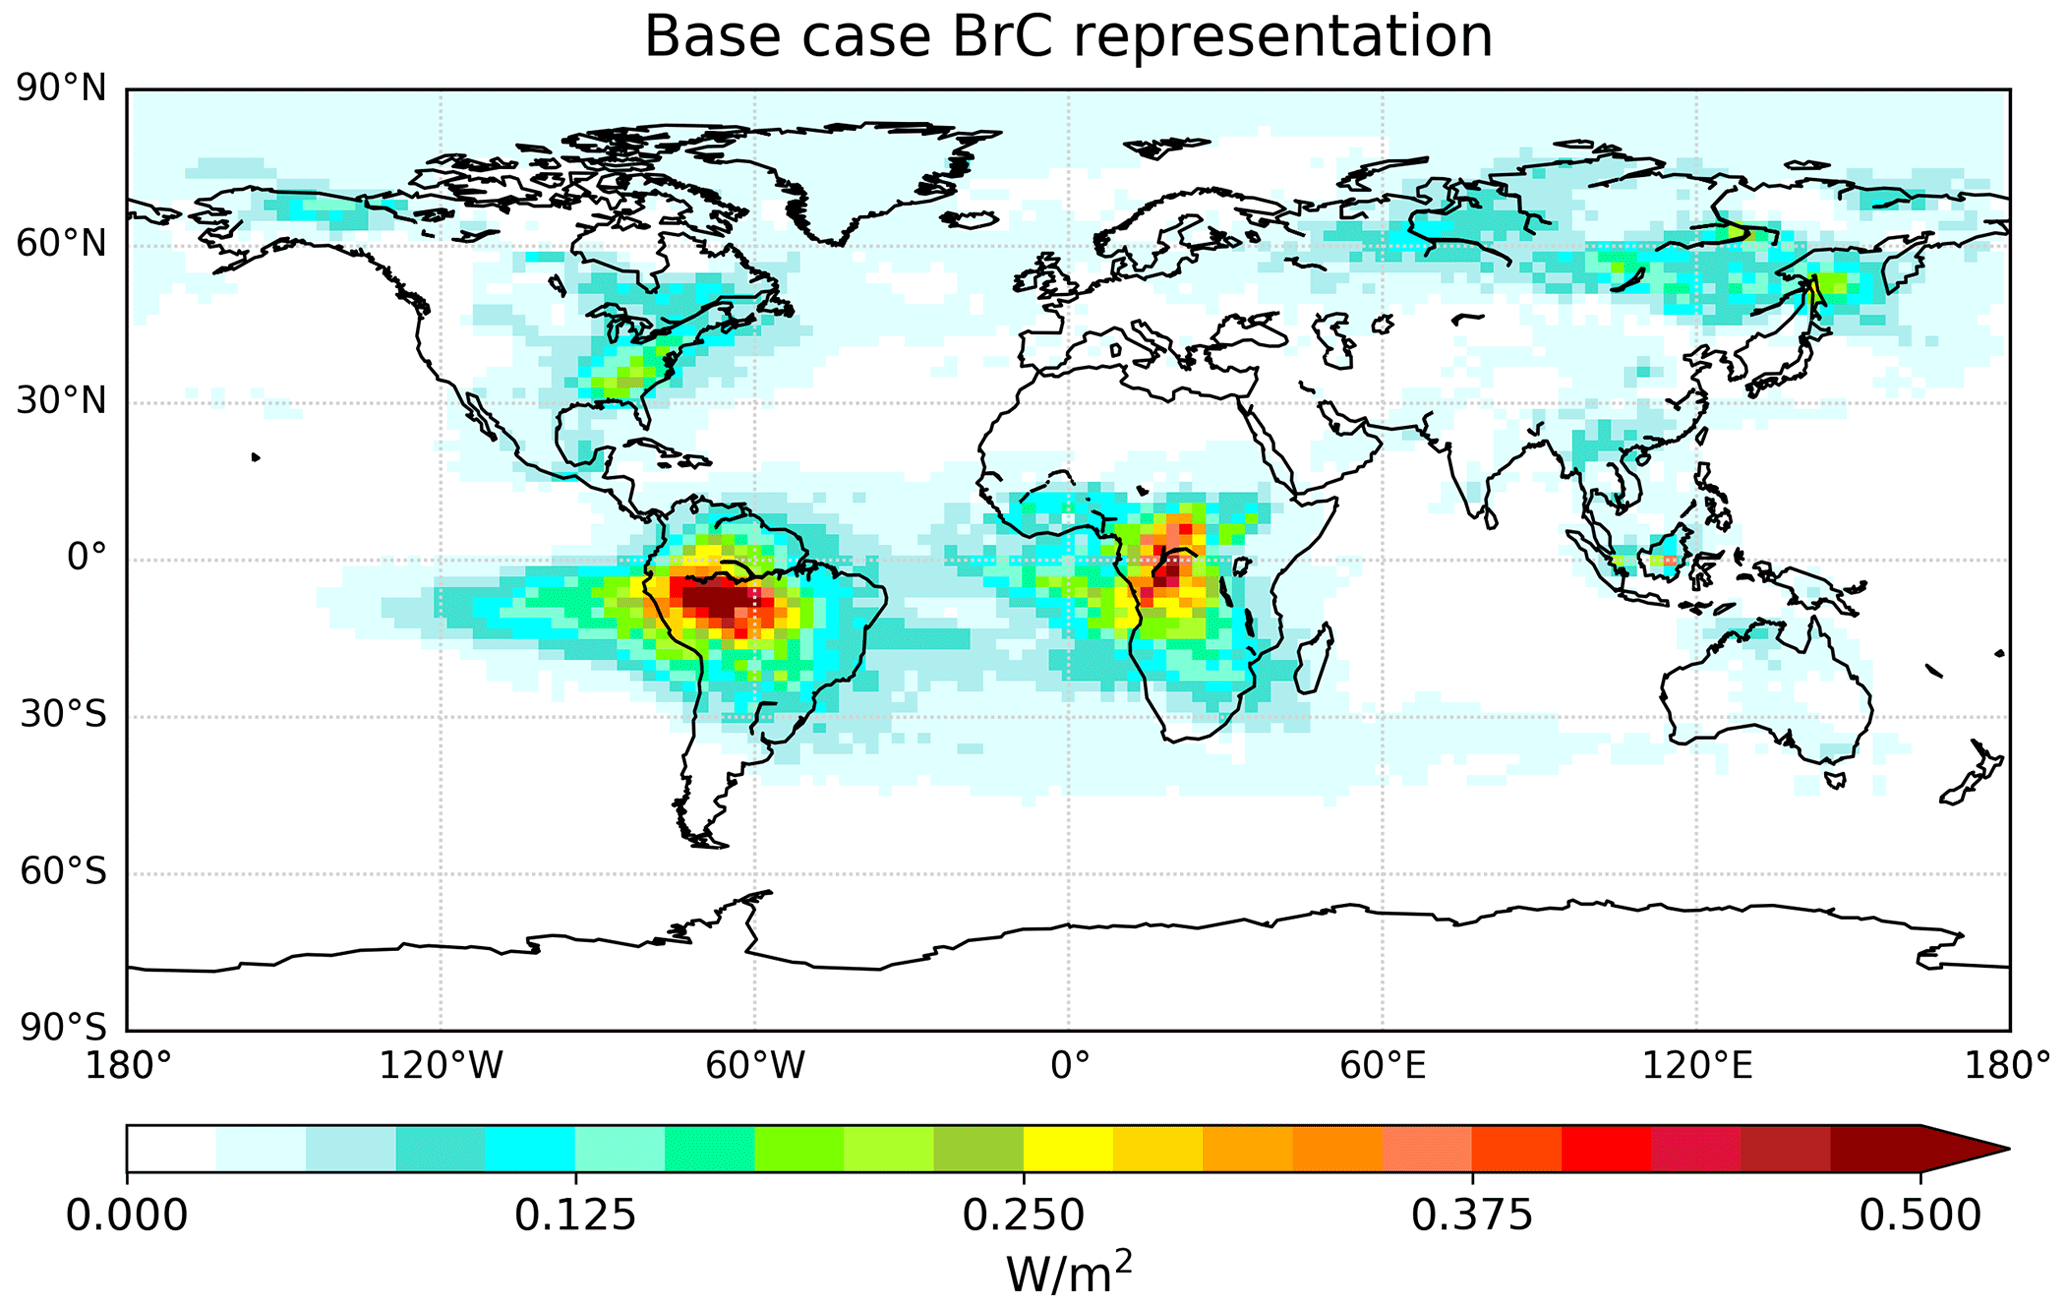
Figure 13Annual average of BrC radiative effect in W m−2, calculated according to Eq. (8).
3.3.1 Comparison of BrC radiative effect with previous studies
Our estimate of BrC radiative effect can be compared to similar BrC modeling studies. A wide range of radiative effects are reported across previous studies because of the variability in the treatment of BrC and/or OA absorption. Furthermore, different studies use different metrics to quantify BrC's impact on Earth's radiative budget, with some reporting radiative effect, as we have calculated, and others reporting instantaneous or effective RF. It is important to keep these variable treatments and climate metrics in mind, as they pose a limitation to direct comparison between modeling studies. To compare our scheme with literature values that report organic mass in Tg C, we converted ModelE mass and emission output in Tg OA, using the previously mentioned OC-to-OA ratio of 1.4.
As stated previously, there are three studies that have implemented BrC in an Earth system model. Two of these studies, using CESM (Brown et al., 2018) and CNRM (Drugé et al., 2022), calculated BrC effective radiative forcing of ARIs (ERFARI). Brown et al. (2018) calculated an ERFARI of 0.13 W m−2 without BrC bleaching and 0.06 W m−2 with bleaching, while Drugé et al. (2022) reported 0.029 W m−2 with bleaching. The lower ERF reported by Drugé et al. (2022) may be a result of the different treatment of the BrC-to-OA fraction: Brown et al. (2018) treated all BrC and OAs the same, while Drugé et al. (2022) defined BB OAs as BrC and fossil fuel OAs as non-absorbing. Both studies used the same parameterization for the imaginary RI (see Eq. 1), with a global average k550 nm around 0.02. Though we cannot directly compare these studies to ours, as they calculated ERF, our estimated BrC effect of 0.04 W m−2 is similar in magnitude, with small differences likely attributable to differing BrC treatments. Brown et al. (2018) had a slightly larger global average BrC burden of 1.56 mg m−2 compared to ours of 1.35 mg m−2, a larger imaginary RI compared to ours of 0.0165, and a subsequently larger BrC effect. While Drugé et al. (2022) similarly used an imaginary RI larger than ours, they did not consider SOAs to be brown, and they reported lower BrC emissions of approximately 1.73 Tg yr−1 compared to ours of 8.6 Tg yr−1 (or 6.14 Tg C yr−1, given the ModelE OC-to-OA ratio of 1.4), resulting in a lower estimate of the BrC effect.
Zhang et al. (2020) is the third study to use an ESM, CESM in particular, and presented the most similar approach to ours: primary BrC was regarded as a fraction of OAs, SOAs were considered brown, and a photobleaching parameterization was used. They also used the same approach to calculate the BrC direct radiative effect, allowing a direct comparison to ours. Their treatment of BrC differed in that they used a BrC-to-OA emission factor of 23 %, rather than 35 %; considered aromatic SOAs brown, rather than biogenic SOAs; and used a higher imaginary refractive index of kBrC, 550 nm=0.045, rather than our moderately absorbing case of kBrC, 550 nm=0.0165. With this treatment, Zhang et al. (2020) calculated a BrC radiative effect of 0.1 W m−2, which is larger than our base case estimate of 0.04 W m−2. This is likely due to the higher imaginary refractive index applied to both primary and secondary BrC: they reported similar BrC emissions of 6.7 Tg C yr−1, and, while our production of brown SOAs is much larger than theirs (16.1 vs. 4.1 Tg C yr−1), all ModelE SOAs have an imaginary RI less than 0.002, much lower than their singular RI used.
Other studies have estimated the BrC instantaneous radiative effect using chemical transport models (CTMs) – either GEOS-Chem or IMPACT. Though these studies all differ in their treatment of BrC, they can be grouped according to whether they consider all OAs brown or treat BrC as a fraction of OAs. Studies that do not differentiate between BrC and other BB OAs report a TOA BrC radiative effect between 0.048–0.57 W m−2 (Lin et al., 2014; Saleh et al., 2015; Wang et al., 2018), while studies that treat BrC as a fraction of OAs report between 0.04–0.29 W m−2 (Park et al., 2010; Feng et al., 2013; Wang et al., 2014; Jo et al., 2016; Tuccella et al., 2020; Carter et al., 2021). Our calculated radiative effect is at the lower end of this reported value range.
3.3.2 ModelE sensitivity to BrC parameterization
In all sensitivity cases, BrC representation produces a reduction in organic cooling, or an effective warming. The actual magnitude of this effect, however, varies across simulations. Figure 14 shows the direct radiative effect and variability, expressed as standard deviation, of each BrC simulation.
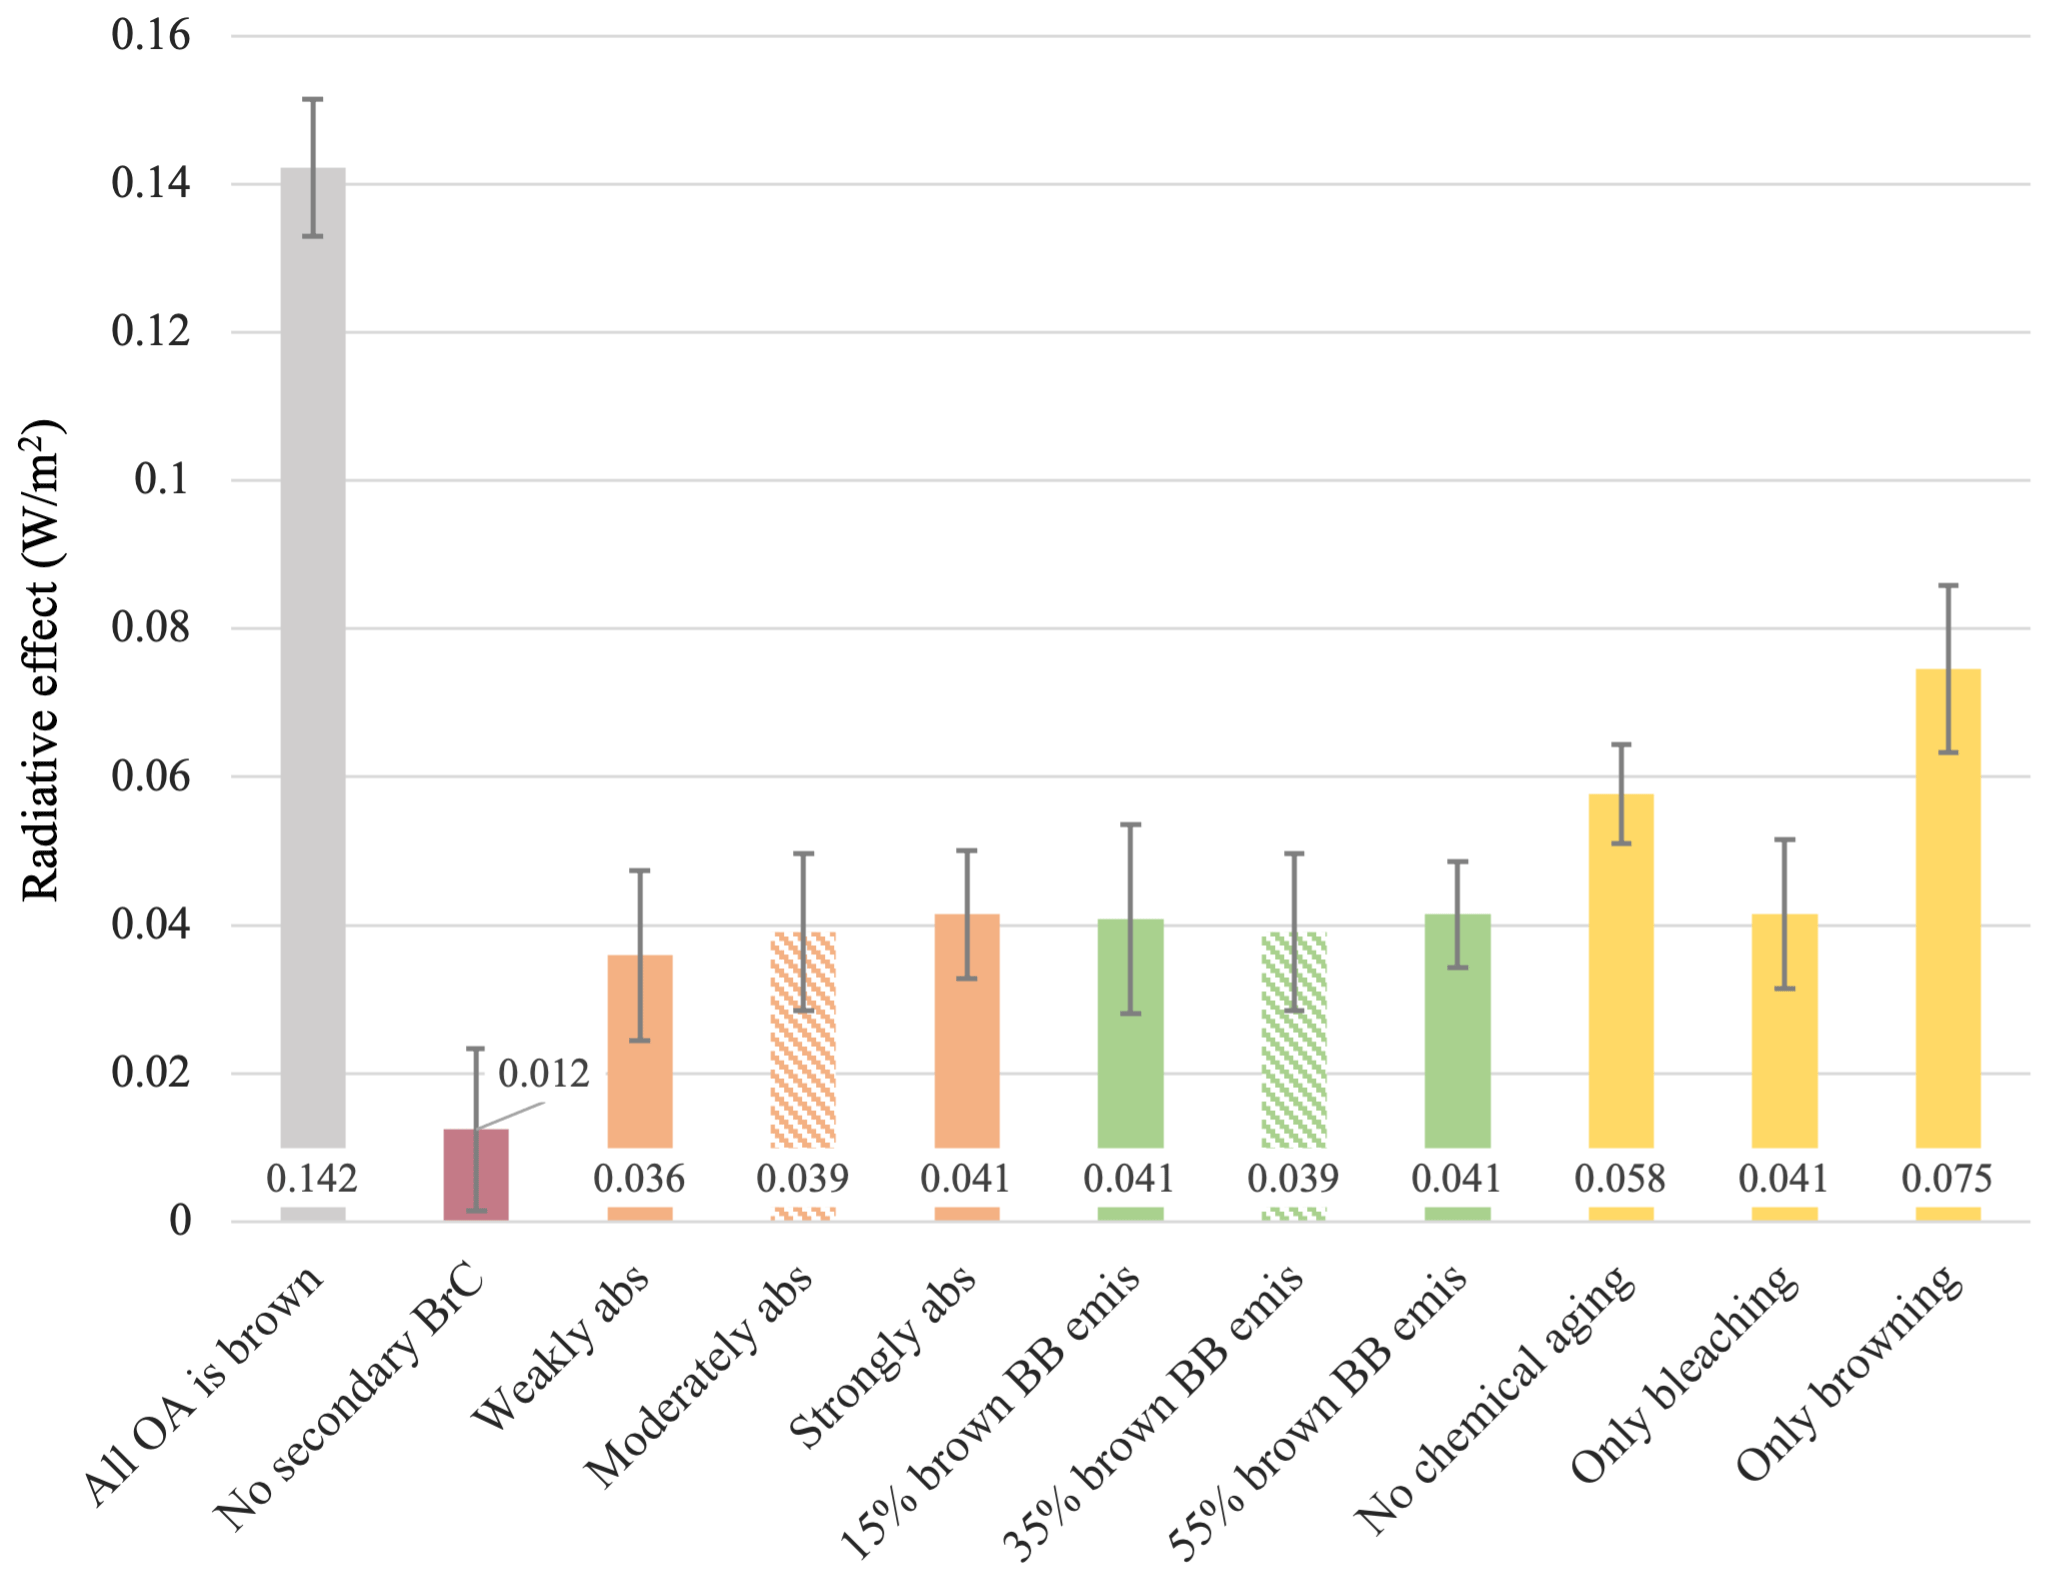
Figure 14Global, annual average radiative effect of each BrC simulation, calculated according to Eq. (8). Error bars show the standard deviations, which can be interpreted as the variability of each simulation across repeated years of simulation. Different-colored bars indicate a different BrC property varied, and dashed bars indicate the base case of BrC representation (this is shown twice for ease of comparison to other simulations), consistent with Figs. 7 and 8.
Comparing the case with no secondary BrC to the base case, we can see that attributing absorption to SOAs has a clear warming effect, since the magnitude nearly triples. Excluding chemical aging processes or only including browning also has a strong warming effect, compared to the base case. Changing the optical properties of primary BrC, either to the weakly absorbing or strongly absorbing case; varying the BB BrC-to-OA emissions ratio; and including only bleaching rather than both browning and bleaching do not produce distinctly different radiative effects from the base case. Finally, the default case where all OAs are slightly brown shows substantial warming relative to the base case where only some organics are considered brown. Referring to Fig. 8, which shows BrC AOD and AAOD across the same simulations, we see that, while AAOD is much smaller in magnitude, it is clearly the larger driver in changing simulation radiative effect. There is also larger internal variability in BrC radiative effect, compared to BrC optical depth, which we attribute to variability in simulated meteorology.
The sensitivity analysis presented in Fig. 14 shows that separating BrC from other organics through explicit representation, including secondary BrC, and simulating a chemical bleaching process have a distinguishable effect on ModelE BrC warming. Thus, each of these properties should be accounted for in BrC representation, and they should be the primary target for future BrC lab and field research to better constrain them. Since the base case BrC chemistry, browning followed by bleaching, is indistinguishable from the case with only bleaching, simulating browning appears unnecessary on the scale of global annual averages, if the only interest is BrC radiative effect. Such limited sensitivity to browning makes sense: BrC can only have a radiative effect when there is insolation, and browner BrC is short-lived during the daytime, so bleaching is the dominant process with regard to radiative effect. This further suggests refining the relative absorption value of browned BrC, now 150 %, may not be necessary for this scope of study. Additionally, variation in the primary BrC refractive index and BrC-to-OA emissions ratio does not show distinguishable effects, suggesting it is not critical to define precise values for these properties.
Since the BrC effect has a strong spatial inhomogeneity (see Fig. 13), the analysis demonstrated in Fig. 14 was repeated within the BB regions and seasons discussed in Sect. 2.3.2. For examples of this analysis in the SHSA and AUST regions, see Figs. A3 and A4. Within BB regions, the BrC radiative effect across all test cases is larger, appearing to scale linearly from the global annual effect. This makes sense, given BrC aerosols are more highly concentrated near BB sources and low elsewhere (see Fig. 4). Furthermore, since there is no regional difference in defined BrC physical or optical properties, an effect proportional to the global average would be expected, with minimal differences resulting from regional SOAs and oxidant concentrations (affecting concentration of secondary BrC and rate of primary BrC aging). It should be noted that narrowing the spatial and temporal scales of analysis also results in larger internal variability. As such, sensitivity tests are not distinguishable from one another, and no additional conclusions can be drawn from this regional analysis.
3.4 Study limitations
There are processes influencing BrC in the atmosphere that were not included in the work presented here, posing limitations to our estimate of the BrC radiative effect. Firstly, chemical aging of secondary BrC was not simulated, despite laboratory studies showing secondary BrC undergoes bleaching. As mentioned in Sect. 2.2.4, our current BrC aging scheme does not account for the semi-volatile nature of SOAs; therefore it cannot be used to bleach secondary BrC. This may cause the SOA contribution to BrC warming to be overestimated, as SOA absorption should decrease by at least 50 % during the day, so we plan to include this in future work. Aqueous-phase aging of BrC, which has faster rates of browning and similar rates of bleaching compared to heterogenous aging (Zhao et al., 2015; Hems et al., 2021), was also not included. Faster browning, with limited change in bleaching, may increase BrC-induced warming. On the global annual scale of analysis presented here, however, it may not have a discernible effect, just as browning, which resulted in a build-up of more-absorbing BrC overnight, showed no distinguishable effect in sensitivity tests.
Another limitation of this scheme is that water-soluble and water-insoluble fractions of BrC were not differentiated or characterized with different optical properties and aging. This was done to be consistent with pre-existing OA representation in ModelE, as BB OAs and biogenic SOAs are not differentiated by solubility or hygroscopicity (Koch, 2001), and, as mentioned in Sect. 2.2.3, changes to prescribed BrC solubility affect the total organic burden and skew estimates of the BrC radiative effect. Studies have shown, however, that water-insoluble BrC can be more absorbing than water-soluble BrC (Chen and Bond, 2010; Liu et al., 2013; Laskin et al., 2015; Satish et al., 2020). It is possible that chemical aging also differs between these two BrC types, for instance darker water-insoluble BrC being more resistant to bleaching, since reactions may proceed faster in the aqueous phase (Hems et al., 2021). Accounting for these differences in BrC solubility types could change model sensitivity to refractive index and aging. Further study on aging in water-soluble and water-insoluble conditions could clarify the potential impact of not differentiating BrC by solubility within ModelE.
While missing aging processes may cause an overestimation of the BrC radiative effect, there are some sources of BrC that were not introduced into ModelE, resulting in a possible underestimation of BrC absorption and therein radiative effect. SOAs originating from aromatic precursors have been shown to absorb light (Liu et al., 2016). ModelE, however, does not yet have aromatic gases explicitly represented and therefore does not have the ability to simulate aromatic SOAs. Additionally, as mentioned in the introduction to this study, recent work has identified a darker, more refractory, less-soluble subset of BrC closely resembling tar balls (Saleh et al., 2018). These aerosols have been shown to absorb not just in the UV–VIS wavelength range but also in the near-IR (Hoffer et al., 2017; Corbin et al., 2019; Chakrabarty et al., 2023). Since our representation of BrC only accounts for absorption in the 300 to 770 nm range, this tar ball subset of BrC could constitute an important source of organic warming in longer wavelengths. Further attention should be given to the sources and optical properties of this subset to allow for incorporation into climate modeling.
Carbonaceous aerosols like OAs are expected to grow in importance as climate forcers, as wildfire frequency and intensity increase with climate change, yet OA forcing still contributes a large uncertainty (± 0.23 W m−2) to Earth system models (Flannigan et al., 2009; Keywood et al., 2013; Tsigaridis and Kanakidou, 2018; Szopa et al., 2021). To improve the physical and chemical correctness of OAs and allow better calculation of OA forcing, light absorption of BrC aerosols must be accounted for in climate models. We presented the first implementation of BrC in the GISS ModelE ESM. BrC was introduced to ModelE through the definition of four properties or processes: the BB BrC-to-OA emissions ratio, the attribution of absorption to biogenic SOAs, the imaginary RI of primary and secondary BrC, and a unique chemical aging scheme for primary BrC. We conducted sensitivity tests in which these properties were varied to, firstly, estimate the average radiative effect of BrC and, secondly, understand how that effect may change across a reasonable range of uncertain parameters. Finally, ModelE performance with BrC aerosols was evaluated by comparing simulated total AOD and AAOD to retrieval data from AERONET and MODIS.
Both sensitivity tests and evaluation against retrieval data showed BrC has no discernible effect on total AOD and AAOD. There was no observable change in total AOD, AAOD, or therein SSA, between the control simulation with no BrC and all sensitivity test simulations. Furthermore, comparison to retrieved optical depth showed similar model skill with and without BrC. Biases in ModelE AOD, namely an overestimation compared to retrieval AOD, were identified in this study, but these were attributed to changes in model implementation, not the BrC scheme presented here. While BrC did not change model performance in terms of optical depth, it did reduce the total cooling effect of OAs, contributing a net TOA radiative effect of 0.04 ± 0.01 W m−2, based on the global annual average of our base case simulation. Therefore, the physical and chemical complexity introduced by BrC may not be necessary to improve ModelE AOD or AAOD performance, but it should be included to increase the accuracy of OA radiative forcing estimates.
With regard to BrC parameters that were represented in this study, sensitivity tests showed that separating BrC from other organics, including secondary BrC, and simulating chemical bleaching had distinguishable radiative effects, and, as these properties are consistent with laboratory studies, they should be accounted for. Because bleaching has been identified as a key process, the effect of varying the threshold absorption of primary BrC should be investigated in future work. Variation in the primary BrC imaginary RI and BrC-to-OA emission ratio, as well as simulation of chemical browning, did not show distinguishable effects. This indicated that in the scope of the global annual average radiative effect, it is not critical to precisely define values for these properties, and browning can be ignored. On smaller spatial and temporal scales, however, these may be of greater importance. Since model evaluation with total AOD and AAOD provided no insight into BrC properties, our next step is to further constrain this parameter space.
There have been in situ measurements of BrC absorption, in or downwind of fires, measured during flight campaigns (Zhang et al., 2017; Zeng et al., 2020, 2021, 2022; Washenfelder et al., 2022), and retrievals of BrC properties, mass, and optical depth, from the AERONET and IMPROVE ground-based networks (Arola et al., 2011, 2015; Schuster et al., 2016; Chow et al., 2018) and satellite data (L. Li et al., 2020, 2022). These can be used to directly evaluate ModelE BrC representation. In a future study, which is already underway, we will present model evaluation against such in situ measurements of BrC absorption in addition to a retrieval of BrC AOD and AAOD from AERONET (Schuster et al., 2016). We perform these comparisons either at 550 nm, when provided by the data, or at more BrC-relevant wavelengths by applying AAE suggested by campaign principal investigators (PIs) to ModelE output. By comparing these BrC-specific data to those of ModelE, we hope to constrain the BrC parameter space defined here, specifically evaluate performance of BrC absorption, and further improve OA representation.
Based on the findings and conclusions of this study, we present best practices for representing BrC in ModelE. With the aim of balancing accuracy with computational cost, we specifically discuss the degree of complexity needed. This summary is a product of model sensitivity tests (see Sect. 3.3.2); when the BrC radiative effect of test simulations is distinguishable, we choose parameters based in literature analysis, which were identified and derived in Sect. 2.2. Our best practices for the ModelE scheme are inherently dependent on the research objective of simulating BrC aerosols.
If the objective is to capture total AOD and AAOD at 550 nm, the irradiance-weighted average wavelength in the solar spectrum, no explicit BrC representation is needed. However, the same cannot be said for capturing total optical depth at shorter UV and near-UV wavelengths, where BrC absorption is maximized and likely contributes more to total AAOD. If the research objective is to estimate the global annual average TOA BrC radiative effect, BrC should be explicitly represented, biogenic SOAs should be treated as brown (though much less absorbing than primary BrC), and a BrC bleaching process should be simulated. In this case, the BrC-to-OA emissions ratio and the imaginary refractive index of primary BrC at 550 nm do not need to be strictly defined. We can instead apply a reasonable range for these parameters: 15 %–55 % for the BrC-to-OA BB emissions proportion and 0.003–0.03 for kBrC, 550 nm, derived in Sect. 2.2.1 and 2.2.3, respectively. Regarding regional studies of the BrC radiative effect, though our regional sensitivity analysis yielded no additional conclusions, parameterizations for kBrC, 550 nm and the BrC-to-OA emissions ratio can be tailored to specific BB regions given prior knowledge of regional BC and OA emissions. This would allow a region-specific, likely narrower range of parameters to be utilized. Finally, if the research objective is to capture the diurnal variability in OA absorption, a browning process should be included in addition to the processes and parameters for the global radiative effect case. Both browning and bleaching processes should be linked to and driven by hydroxyl, nitrate oxidant, and ozone, concentrations, to allow the build-up of more-absorbing BrC at night via nitrate oxidation and more rapid aging during the day.
Table A1UV–VIS-band-averaged complex refractive index of ModelE BrC tracers. For details of the calculation of these values, see Sect. 2.2.3.
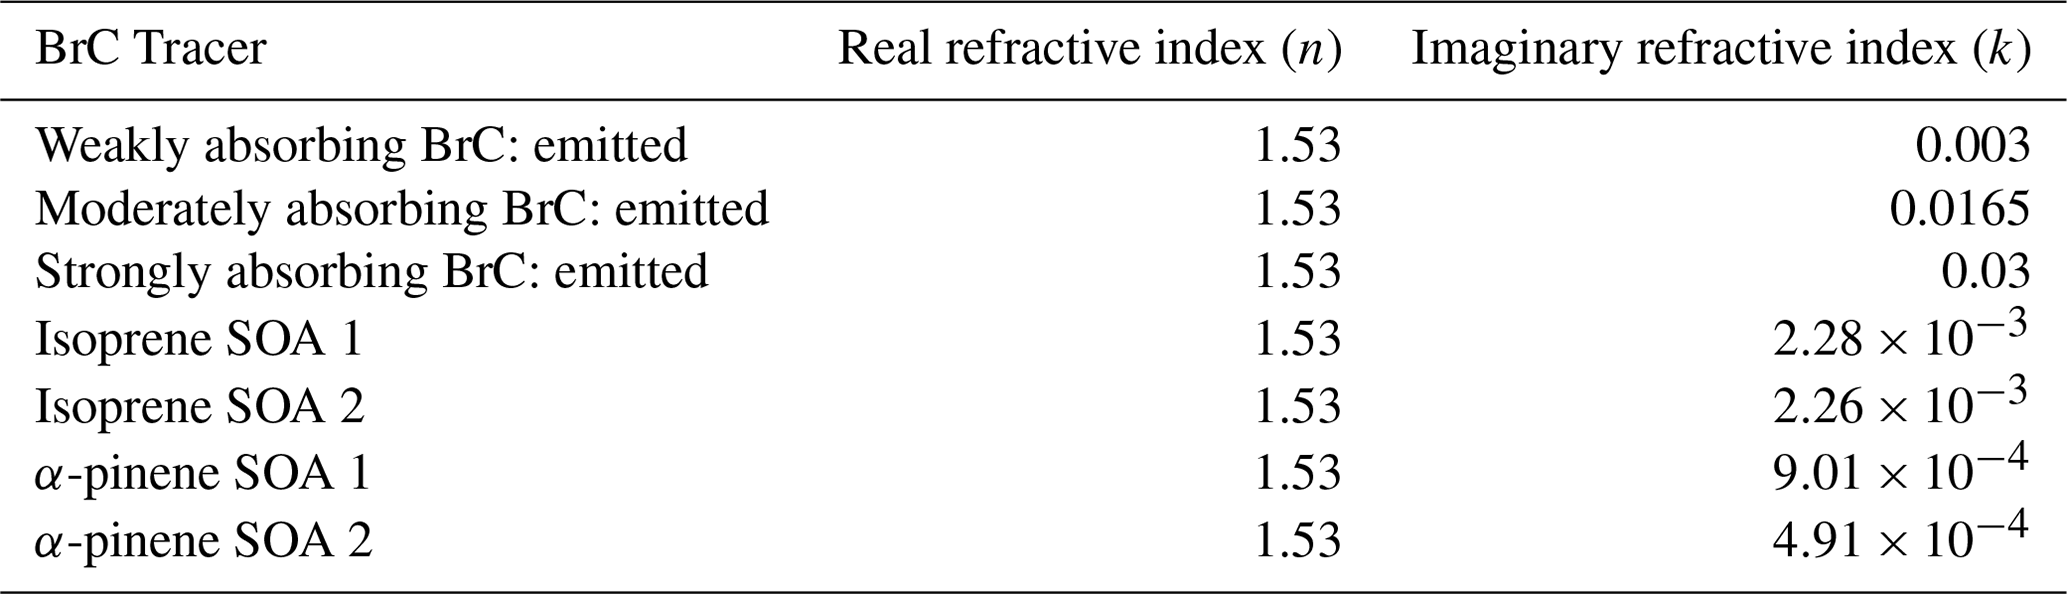
Table A2ModelE prescribed second-order rate constant for each BrC aging reaction driven by atmospheric oxidants. Constants are derived from a kinetic model provided by Hems et al. (2021).
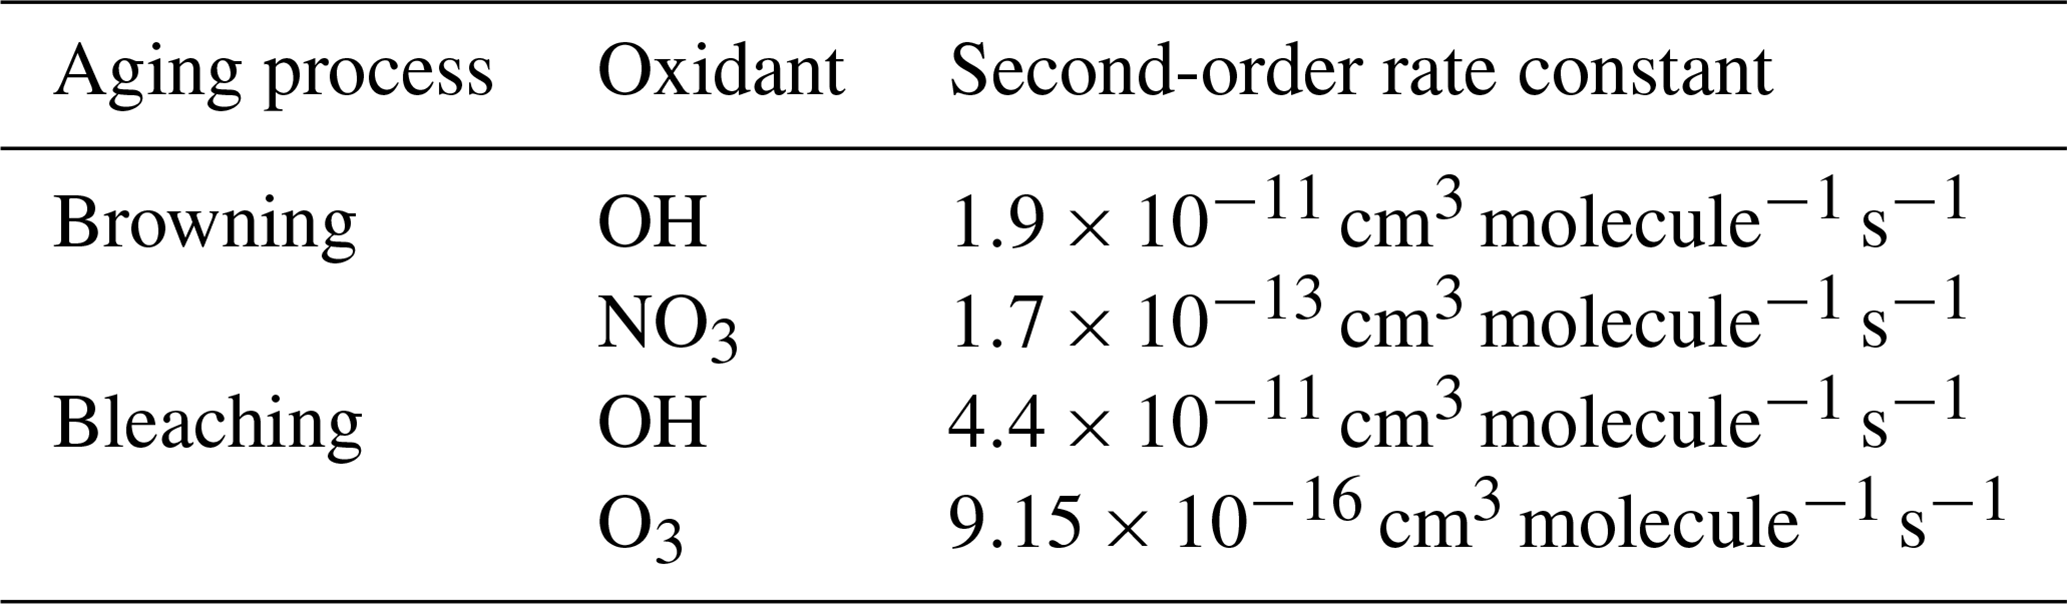
Table A3Months regarded as the peak fire period for each biomass burning region in model evaluation against AERONET and MODIS data. Months are based on periods of peak emission as discussed in Pan et al. (2020), while dominant fire sources are taken from van der Werf et al. (2017) and listed in decreasing order of fire carbon emissions magnitude.
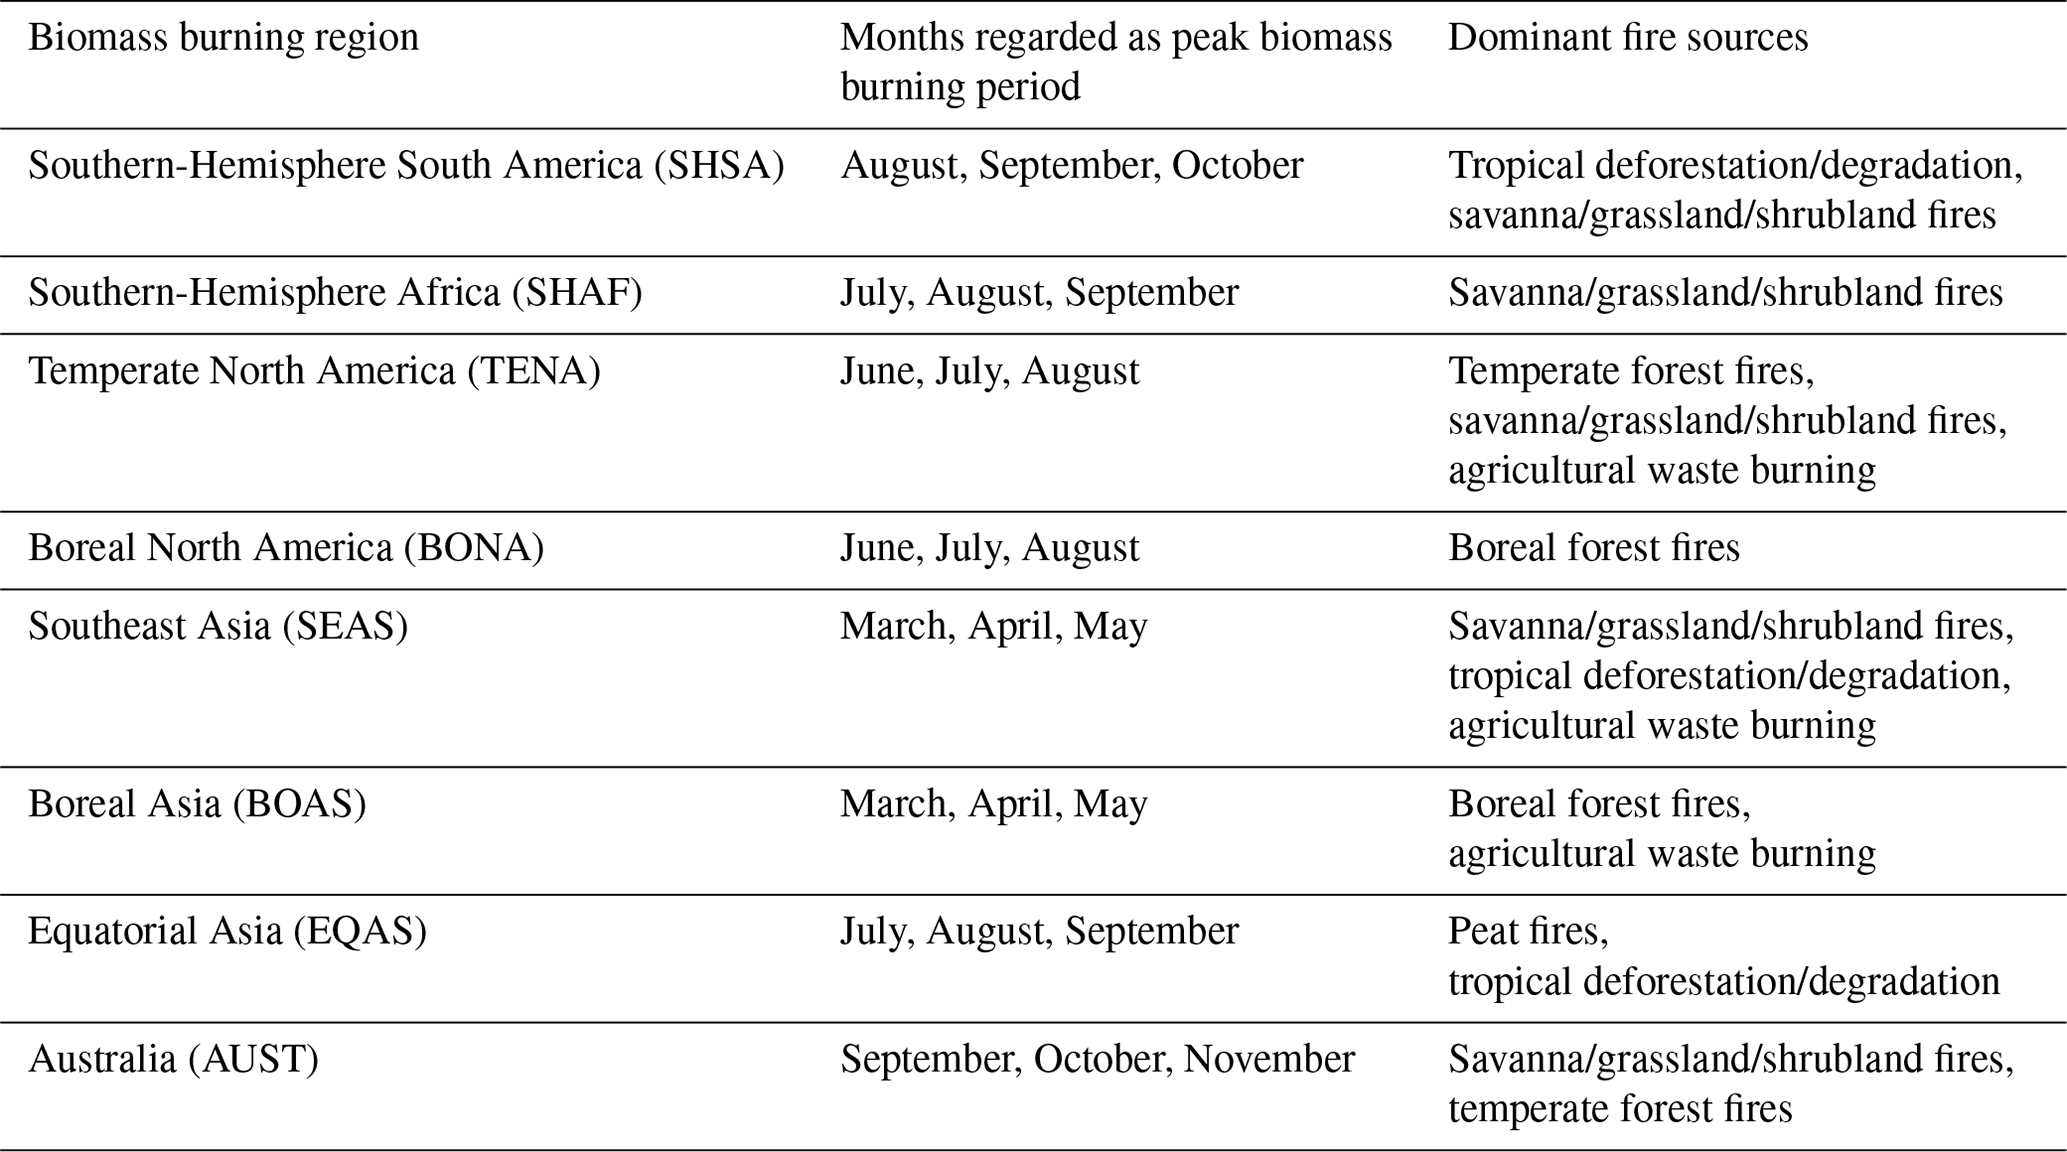
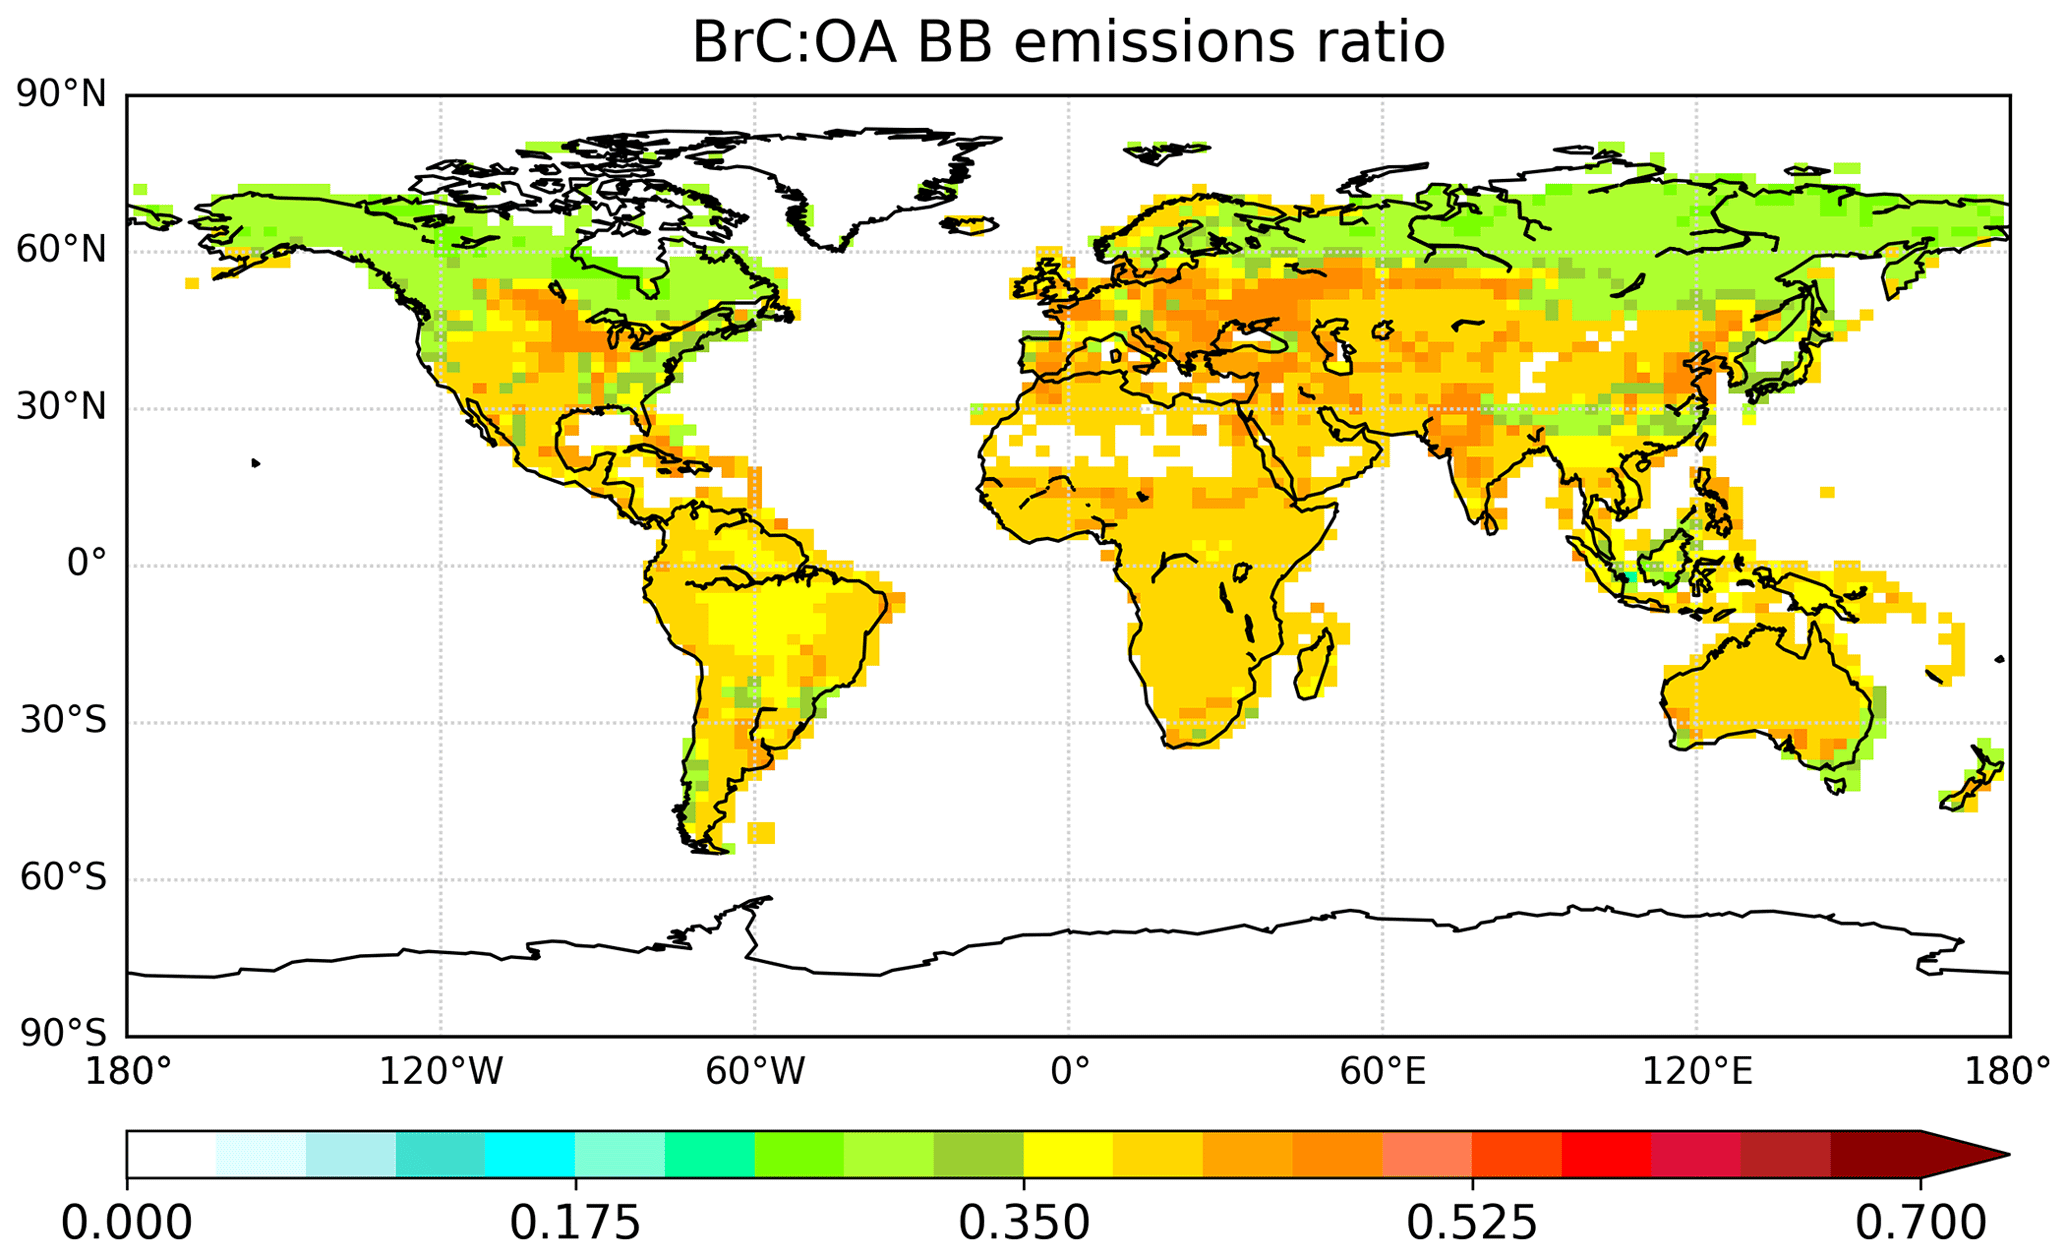
Figure A1BrC-to-OA emissions ratio, calculated according to Eqs. (1) and (2) using BC and OA emissions from the CEDS BB inventory (year 2000 climatological monthly emissions averaged over the entire year). The white space shows where BC or OA emissions are zero.
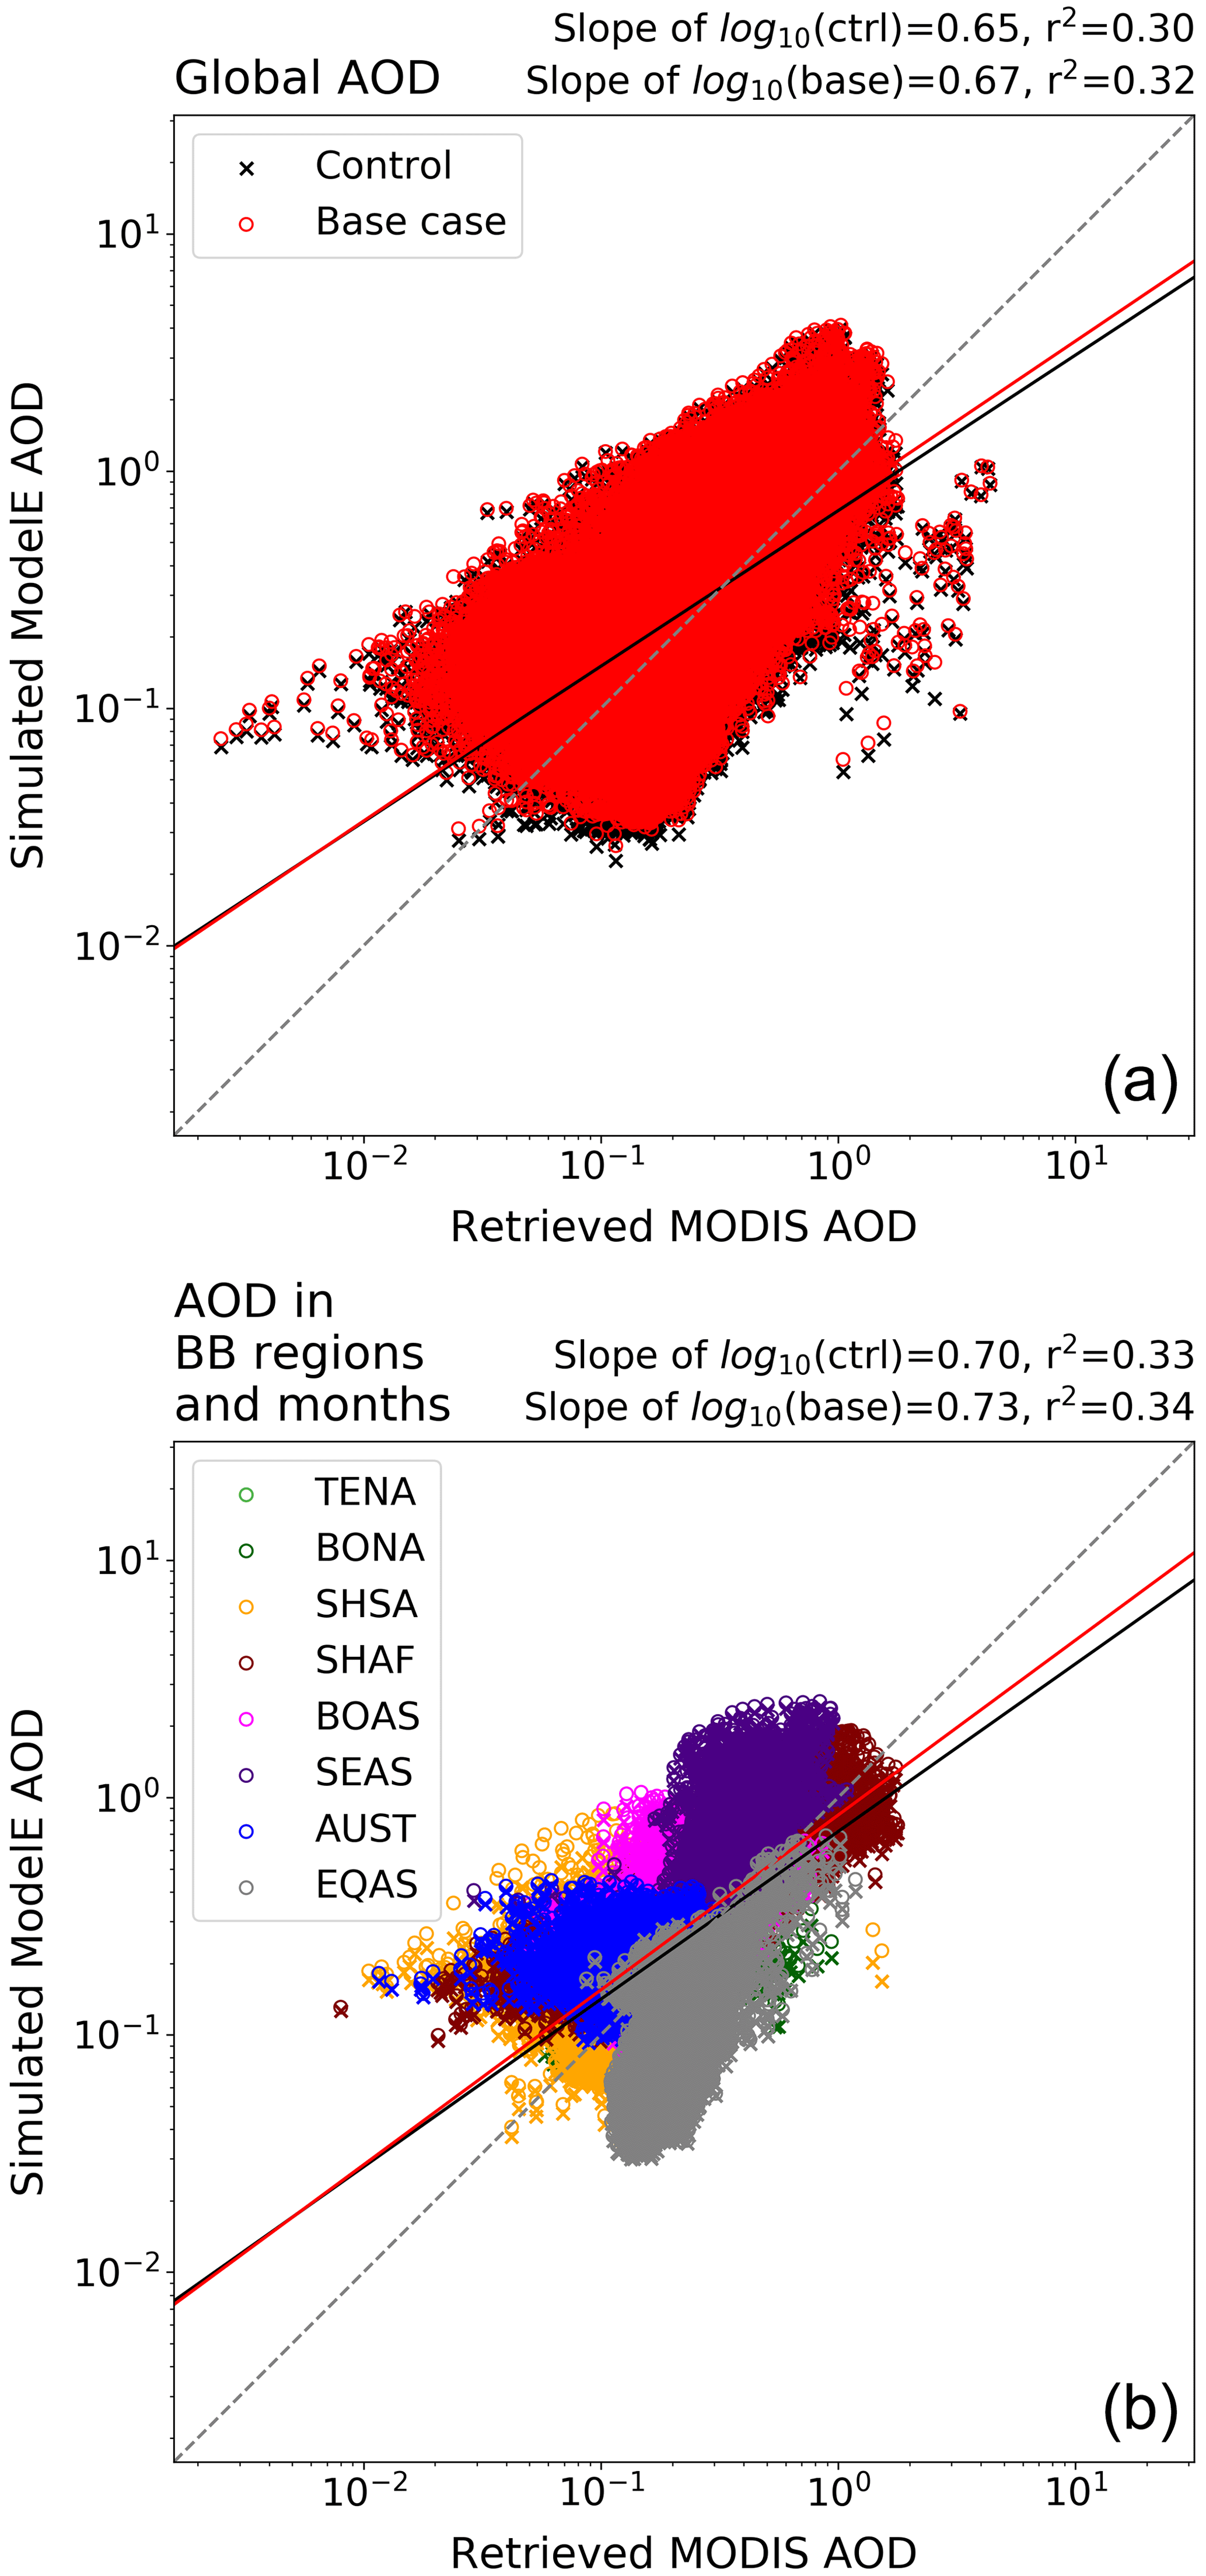
Figure A2Simulated ModelE optical depth at 550 nm plotted in the log10 space against retrieved MODIS optical depth. Each point corresponds to the optical depth in 1 month, averaged across the 2007–2016 period, in each grid cell (ModelE has been re-gridded to match MODIS' 1° by 1° resolution). ModelE control case optical depth values are shown as x's, while base case values are shown as o's. The slope and r2 of the linear regression are displayed on the top-right corner of each plot, and regression lines are included within each plot. Panel (a) shows global AOD values. Panel (b) shows AOD in BB regions during months considered peak for BB, with each color representing a different region.
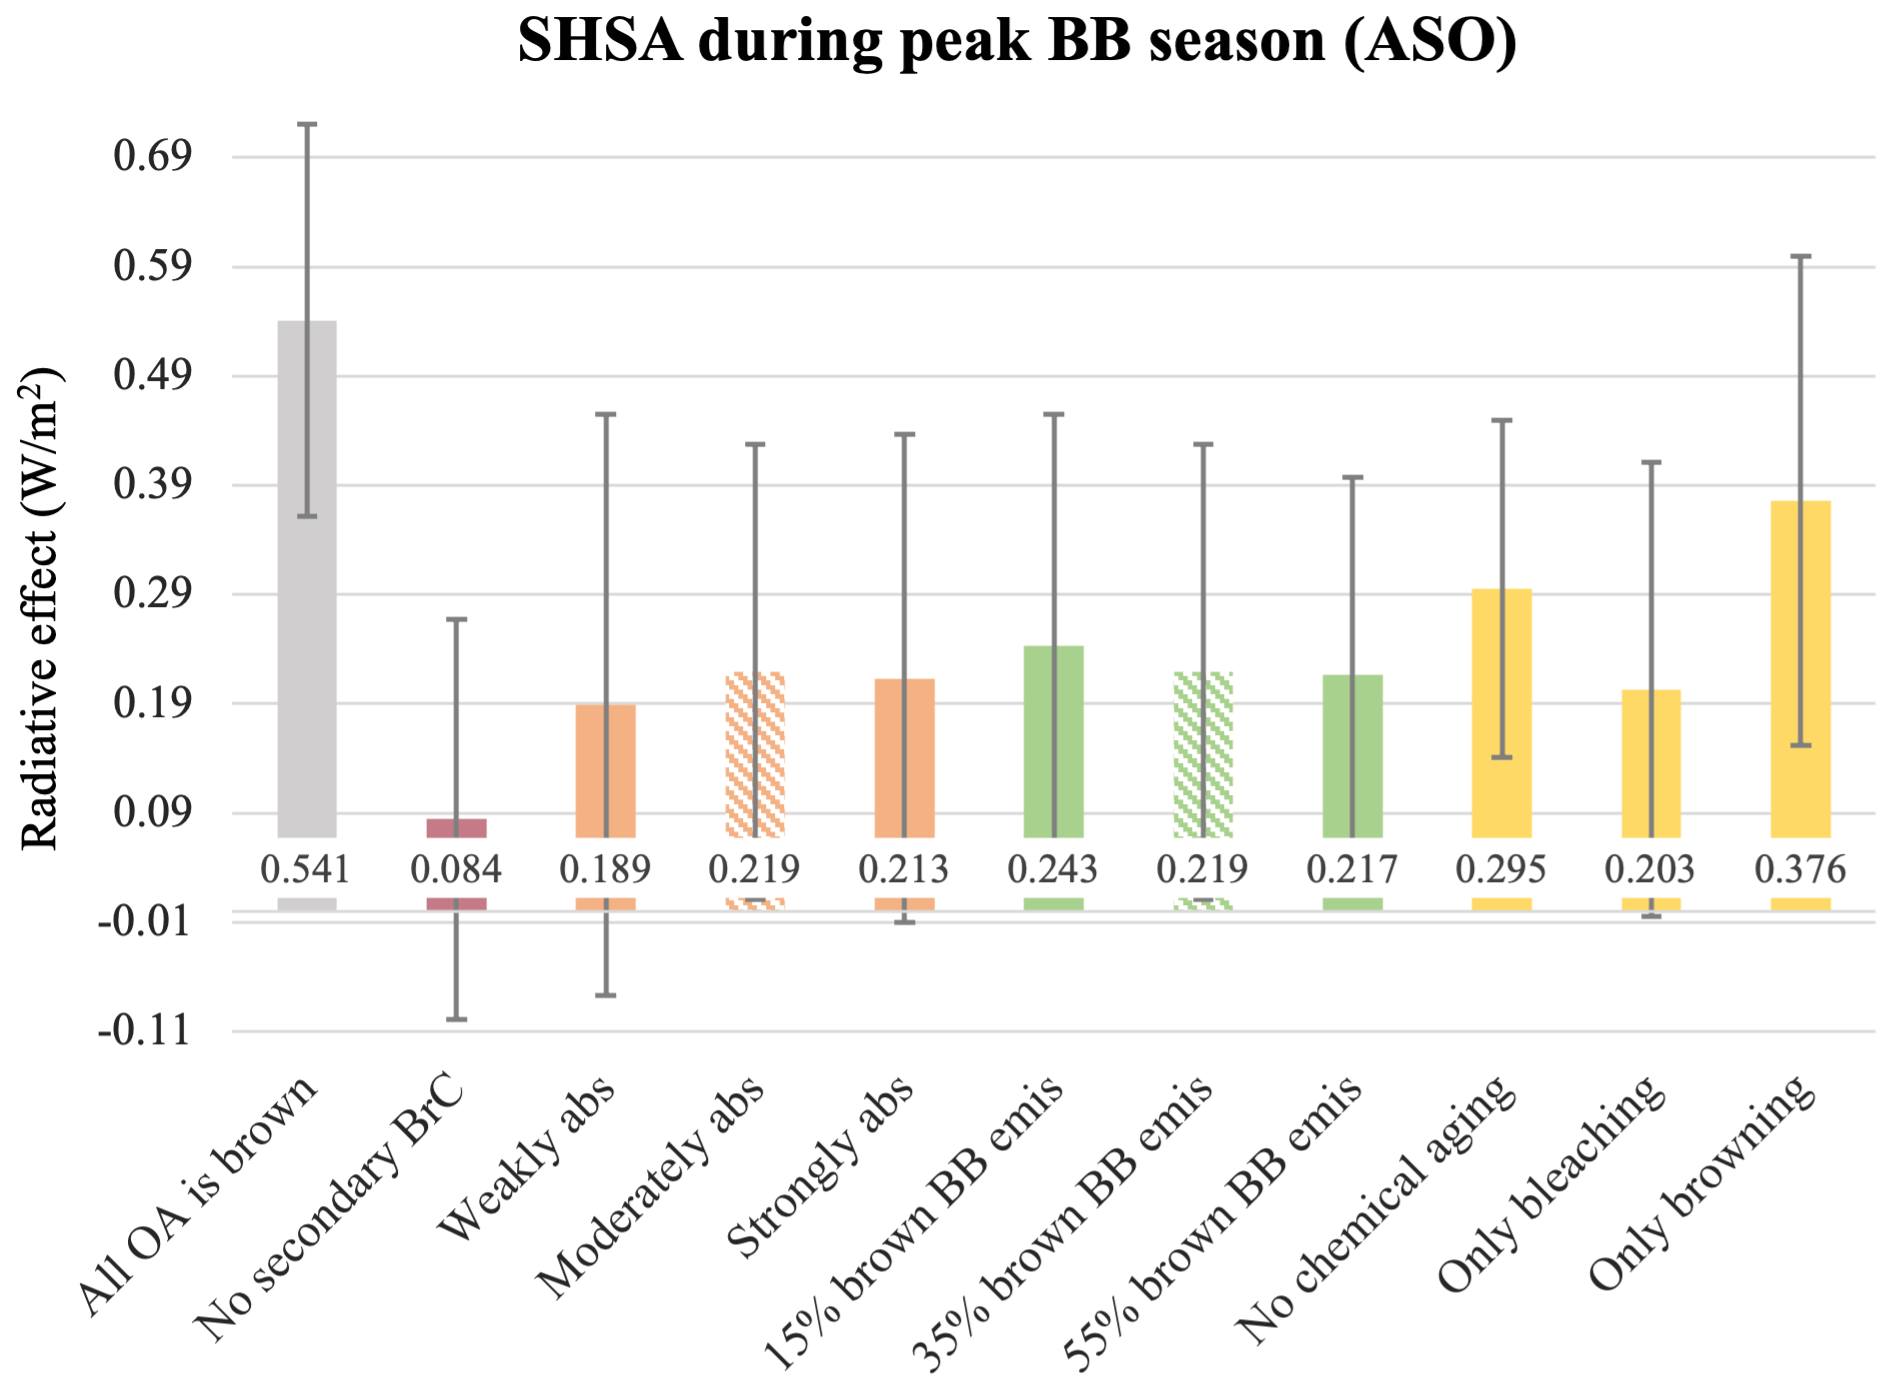
Figure A3Radiative effect of each BrC simulation, averaged within the Southern-Hemisphere South America (SHSA) BB region across months of peak fire activity – August, September, and October (ASO; see Table A2). Consistent with Fig. 14, the BrC effect is calculated according to Eq. (8). Error bars show the standard deviations (variability of each simulation across repeated years of simulation), different-colored bars indicate a different BrC property varied, and dashed bars indicate the base case of BrC representation (shown twice for ease of comparison to other simulations), consistent with Figs. 7, 8, and 14.
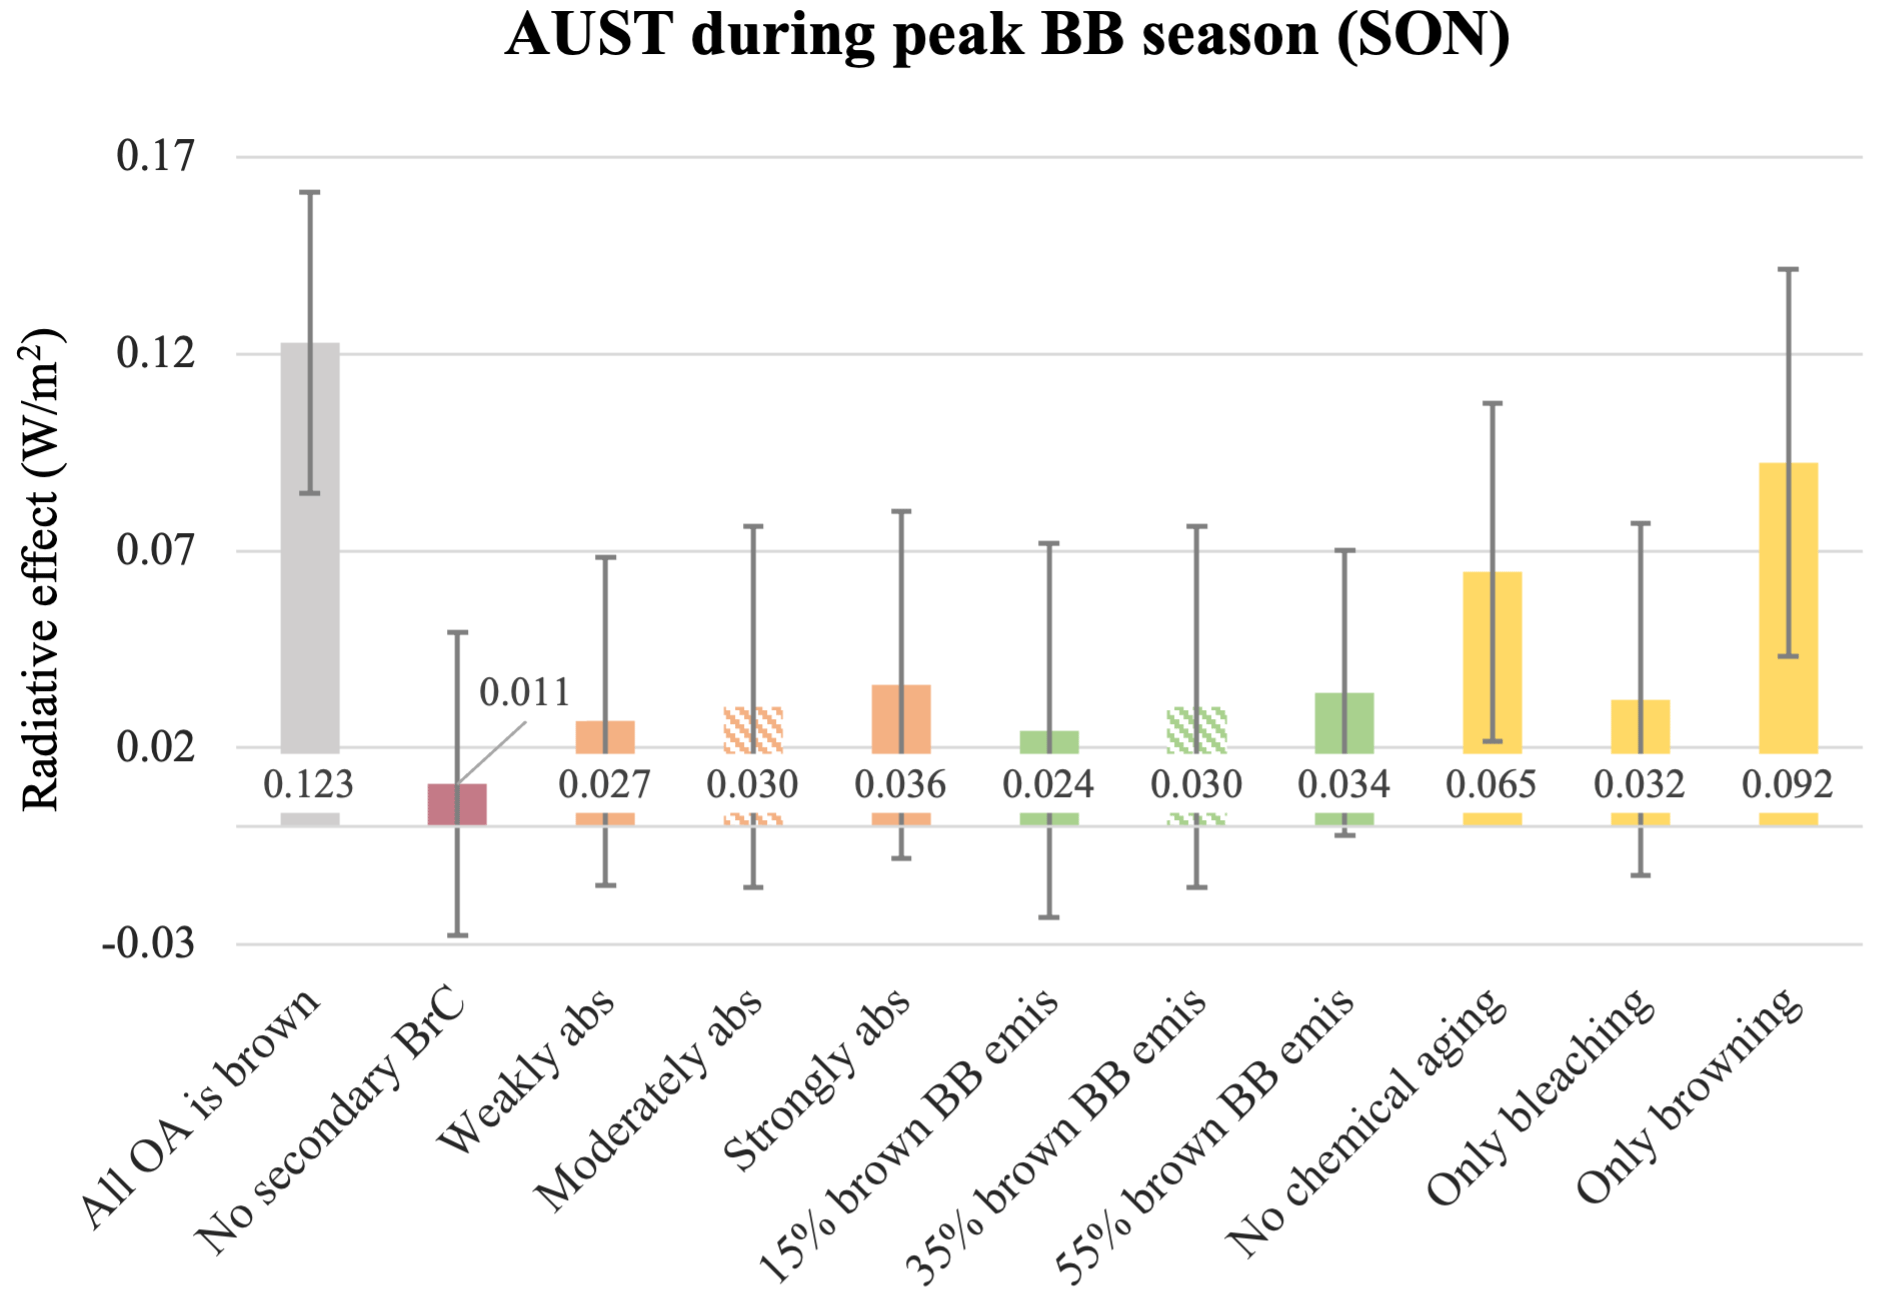
Figure A4Radiative effect of each BrC simulation, averaged within the Australia (AUST) BB region across months of peak fire activity – September, October, and November (SON; see Table A2). The BrC effect is calculated according to Eq. (8), and displayed error bars, bar color, and dashed bars are consistent with Figs. 7, 8, 14, and A3.
The GISS ModelE code is publicly available at https://simplex.giss.nasa.gov/snapshots/ (National Aeronautics and Space Administration, 2024); the most recent public version is E2.1.2. The Fortran code used for the simulations described in this study, along with the model output, the Alaskan peat sample input, and the fitted data (see discussion on “first parameterization” in Sect. 2.2.3), is available at https://doi.org/10.5281/zenodo.8342620 (DeLessio et al., 2023). The model code can be found in the file titled “modelE_code_092723.tar.gz”, the model output is in the file titled “ModelESimAndEmisData.tar.gz”, and the Alaskan peat data are in the Excel file titled “KK Parameterization-AK Peat.xlsx”. Model simulation data are averaged over specified time periods and included as netCDF files; individual file names start with the period averaged over and end with the simulation type (“SensitivitySim{#}” or “transient_{ctrl/base}case”). The CEDS emissions file used for Eq. (1) (see Sect. 2.2.1), titled “CMIP6_CEDS_BBURNemis_forEq1.nc”, is also included with these simulation data. MERRA-2 reanalysis data are available at https://doi.org/10.5067/QBZ6MG944HW0 (GMAO, 2015). AERONET data are available at https://aeronet.gsfc.nasa.gov/cgi-bin/webtool_inv_v3?stage=3®ion=United_States_East&state=Maryland&site=GSFC&place_code=10&if_polarized=0 (AERONET, 2023). Lastly, MODIS data are available at https://doi.org/10.5067/MODIS/MOD04_L2.006 (Levy and Hsu, 2015).
MAD, KT, and SEB conceived the study. All model development was done by MAD, guided by KT and SEB. JC fit the Alaskan peat data to inform the BrC RI and drafted the language describing the parameterization (see Sect. 2.2.3). GLS provided guidance on the use of AERONET retrieval data for ModelE comparison. MAD conducted all model simulations and analysis, created all figures, and drafted the first version of this paper. All authors contributed to later drafts.
At least one of the (co-)authors is a member of the editorial board of Atmospheric Chemistry and Physics. The peer-review process was guided by an independent editor, and the authors also have no other competing interests to declare.
Publisher's note: Copernicus Publications remains neutral with regard to jurisdictional claims made in the text, published maps, institutional affiliations, or any other geographical representation in this paper. While Copernicus Publications makes every effort to include appropriate place names, the final responsibility lies with the authors.
Climate modeling at GISS is supported by the NASA Modeling, Analysis, and Prediction Program. Maegan A. DeLessio acknowledges support from the Future Investigators in NASA Earth and Space Science and Technology program (grant no. 80NSSC22K1442). Kostas Tsigaridis and Jacek Chowdhary acknowledge support from the Plankton, Aerosol, Cloud, ocean Ecosystem project (grant no. 80NSSC20M0205). Maegan A. DeLessio and Jacek Chowdhary acknowledge helpful discussions with Hans Moosmüller on the complex refractive index spectra of BrC in atmospheric combustion aerosols. Maegan A. DeLessio acknowledges useful guidance from Róisín Commane and Faye McNeill. We thank the principal investigators (PIs) of the AERONET network and their staff for establishing and maintaining the different sites used in this investigation. The Terra/MODIS Aerosol L2 dataset was acquired from the Level-1 and Atmosphere Archive & Distribution System (LAADS) Distributed Active Archive Center (DAAC), located in the Goddard Space Flight Center in Greenbelt, Maryland. We thank the PIs, Rob Levy and Christina Hsu, for making available their aerosol dataset. Resources supporting this work were provided by the NASA High-End Computing (HEC) Program through the NASA Center for Climate Simulation (NCCS) at Goddard Space Flight Center.
This research has been supported by the National Aeronautics and Space Administration (grant nos. 80NSSC22K1442 and 80NSSC20M0205).
This paper was edited by Pedro Jimenez-Guerrero and reviewed by two anonymous referees.
AERONET: Data Download Tool, AERONET [data set], https://aeronet.gsfc.nasa.gov/cgi-bin/webtool_inv_v3?stage=3®ion=United_States_East&state=Maryland&site=GSFC&place_code=10&if_polarized=0, last access: 10 May 2023.
Al Nimer, A., Rocha, L., Rahman, M. A., Nizkorodov, S. A., and Al-Abadleh, H. A.: Effect of Oxalate and Sulfate on Iron-Catalyzed Secondary Brown Carbon Formation, Environ. Sci. Technol., 53, 6708–6717, https://doi.org/10.1021/acs.est.9b00237, 2019.
Alexander, D. T. L., Crozier, P. A., and Anderson, J. R.: Brown Carbon Spheres in East Asian Outflow and Their Optical Properties, Science, 321, 833–836, https://doi.org/10.1126/science.1155296, 2008.
Andreae, M. O. and Gelencsér, A.: Black carbon or brown carbon? The nature of light-absorbing carbonaceous aerosols, Atmos. Chem. Phys., 6, 3131–3148, https://doi.org/10.5194/acp-6-3131-2006, 2006.
Arola, A., Schuster, G., Myhre, G., Kazadzis, S., Dey, S., and Tripathi, S. N.: Inferring absorbing organic carbon content from AERONET data, Atmos. Chem. Phys., 11, 215–225, https://doi.org/10.5194/acp-11-215-2011, 2011.
Arola, A., Schuster, G. L., Pitkänen, M. R. A., Dubovik, O., Kokkola, H., Lindfors, A. V., Mielonen, T., Raatikainen, T., Romakkaniemi, S., Tripathi, S. N., and Lihavainen, H.: Direct radiative effect by brown carbon over the Indo-Gangetic Plain, Atmos. Chem. Phys., 15, 12731–12740, https://doi.org/10.5194/acp-15-12731-2015, 2015.
Bauer, S. E., Menon, S., Koch, D., Bond, T. C., and Tsigaridis, K.: A global modeling study on carbonaceous aerosol microphysical characteristics and radiative effects, Atmos. Chem. Phys., 10, 7439–7456, https://doi.org/10.5194/acp-10-7439-2010, 2010.
Bauer, S. E., Tsigaridis, K., Faluvegi, G., Kelley, M., Lo, K. K., Miller, R. L., Nazarenko, L., Schmidt, G. A., and Wu, J.: Historical (1850–2014) Aerosol Evolution and Role on Climate Forcing Using the GISS ModelE2.1 Contribution to CMIP6, J. Adv. Model. Earth Sy., 12, e2019MS001978, https://doi.org/10.1029/2019MS001978, 2020.
Bauer, S. E., Tsigaridis, K., Faluvegi, G., Nazarenko, L., Miller, R. L., Kelley, M., and Schmidt, G.: The Turning Point of the Aerosol Era, J. Adv. Model. Earth Sy., 14, e2022MS003070, https://doi.org/10.1029/2022MS003070, 2022.
Bond, T. C. and Bergstrom, R. W.: Light Absorption by Carbonaceous Particles: An Investigative Review, Aerosol Sci. Tech., 40, 27–67, https://doi.org/10.1080/02786820500421521, 2006.
Bond, T. C., Doherty, S. J., Fahey, D. W., Forster, P. M., Berntsen, T., DeAngelo, B. J., Flanner, M. G., Ghan, S., Kärcher, B., Koch, D., Kinne, S., Kondo, Y., Quinn, P. K., Sarofim, M. C., Schultz, M. G., Schulz, M., Venkataraman, C., Zhang, H., Zhang, S., Bellouin, N., Guttikunda, S. K., Hopke, P. K., Jacobson, M. Z., Kaiser, J. W., Klimont, Z., Lohmann, U., Schwarz, J. P., Shindell, D., Storelvmo, T., Warren, S. G., and Zender, C. S.: Bounding the role of black carbon in the climate system: A scientific assessment, J. Geophys. Res.-Atmos., 118, 5380–5552, https://doi.org/10.1002/jgrd.50171, 2013.
Brown, H., Liu, X., Feng, Y., Jiang, Y., Wu, M., Lu, Z., Wu, C., Murphy, S., and Pokhrel, R.: Radiative effect and climate impacts of brown carbon with the Community Atmosphere Model (CAM5), Atmos. Chem. Phys., 18, 17745–17768, https://doi.org/10.5194/acp-18-17745-2018, 2018.
Carter, T. S., Heald, C. L., Cappa, C. D., Kroll, J. H., Campos, T. L., Coe, H., Cotterell, M. I., Davies, N. W., Farmer, D. K., Fox, C., Garofalo, L. A., Hu, L., Langridge, J. M., Levin, E. J. T., Murphy, S. M., Pokhrel, R. P., Shen, Y., Szpek, K., Taylor, J. W., and Wu, H.: Investigating Carbonaceous Aerosol and Its Absorption Properties From Fires in the Western United States (WE-CAN) and Southern Africa (ORACLES and CLARIFY), J. Geophys. Res.-Atmos., 126, e2021JD034984, https://doi.org/10.1029/2021JD034984, 2021.
Chakrabarty, R. K., Moosmüller, H., Chen, L.-W. A., Lewis, K., Arnott, W. P., Mazzoleni, C., Dubey, M. K., Wold, C. E., Hao, W. M., and Kreidenweis, S. M.: Brown carbon in tar balls from smoldering biomass combustion, Atmos. Chem. Phys., 10, 6363–6370, https://doi.org/10.5194/acp-10-6363-2010, 2010.
Chakrabarty, R. K., Shetty, N. J., Thind, A. S., Beeler, P., Sumlin, B. J., Zhang, C., Liu, P., Idrobo, J. C., Adachi, K., Wagner, N. L., Schwarz, J. P., Ahern, A., Sedlacek, A. J., Lambe, A., Daube, C., Lyu, M., Liu, C., Herndon, S., Onasch, T. B., and Mishra, R.: Shortwave absorption by wildfire smoke dominated by dark brown carbon, Nat. Geosci., 16, 683–688, https://doi.org/10.1038/s41561-023-01237-9, 2023.
Chen, Y. and Bond, T. C.: Light absorption by organic carbon from wood combustion, Atmos. Chem. Phys., 10, 1773–1787, https://doi.org/10.5194/acp-10-1773-2010, 2010.
Cheng, Z., Atwi, K. M., Yu, Z., Avery, A., Fortner, E. C., Williams, L., Majluf, F., Krechmer, J. E., Lambe, A. T., and Saleh, R.: Evolution of the light-absorption properties of combustion brown carbon aerosols following reaction with nitrate radicals, Aerosol Sci. Tech., 54, 849–863, https://doi.org/10.1080/02786826.2020.1726867, 2020.
Chin, M., Ginoux, P., Kinne, S., Torres, O., Holben, B. N., Duncan, B. N., Martin, R. V., Logan, J. A., Higurashi, A., and Nakajima, T.: Tropospheric Aerosol Optical Thickness from the GOCART Model and Comparisons with Satellite and Sun Photometer Measurements, J. Atmos. Sci., 59, 461–483, https://doi.org/10.1175/1520-0469(2002)059<0461:TAOTFT>2.0.CO;2, 2002.
Chow, J. C., Watson, J. G., Green, M. C., Wang, X., Chen, L.-W. A., Trimble, D. L., Cropper, P. M., Kohl, S. D., and Gronstal, S. B.: Separation of brown carbon from black carbon for IMPROVE and Chemical Speciation Network PM2.5 samples, J. Air Waste Manage., 68, 494–510, https://doi.org/10.1080/10962247.2018.1426653, 2018.
Corbin, J. C., Czech, H., Massabò, D., de Mongeot, F. B., Jakobi, G., Liu, F., Lobo, P., Mennucci, C., Mensah, A. A., Orasche, J., Pieber, S. M., Prévôt, A. S. H., Stengel, B., Tay, L.-L., Zanatta, M., Zimmermann, R., El Haddad, I., and Gysel, M.: Infrared-absorbing carbonaceous tar can dominate light absorption by marine-engine exhaust, npj Clim. Atmos. Sci., 2, 1–10, https://doi.org/10.1038/s41612-019-0069-5, 2019.
Cubison, M. J., Ortega, A. M., Hayes, P. L., Farmer, D. K., Day, D., Lechner, M. J., Brune, W. H., Apel, E., Diskin, G. S., Fisher, J. A., Fuelberg, H. E., Hecobian, A., Knapp, D. J., Mikoviny, T., Riemer, D., Sachse, G. W., Sessions, W., Weber, R. J., Weinheimer, A. J., Wisthaler, A., and Jimenez, J. L.: Effects of aging on organic aerosol from open biomass burning smoke in aircraft and laboratory studies, Atmos. Chem. Phys., 11, 12049–12064, https://doi.org/10.5194/acp-11-12049-2011, 2011.
DeLessio, M., Tsigaridis, K., Bauer, S., Chowdhary, J., and Schuster, G.: Modeling atmospheric brown carbon in the GISS ModelE Earth system model, Zenodo [code], https://doi.org/10.5281/zenodo.8342620, 2023.
Di Lorenzo, R. A. and Young, C. J.: Size separation method for absorption characterization in brown carbon: Application to an aged biomass burning sample, Geophys. Res. Lett., 43, 458–465, https://doi.org/10.1002/2015GL066954, 2016.
Di Lorenzo, R. A., Washenfelder, R. A., Attwood, A. R., Guo, H., Xu, L., Ng, N. L., Weber, R. J., Baumann, K., Edgerton, E., and Young, C. J.: Molecular-Size-Separated Brown Carbon Absorption for Biomass-Burning Aerosol at Multiple Field Sites, Environ. Sci. Technol., 51, 3128–3137, https://doi.org/10.1021/acs.est.6b06160, 2017.
Drugé, T., Nabat, P., Mallet, M., Michou, M., Rémy, S., and Dubovik, O.: Modeling radiative and climatic effects of brown carbon aerosols with the ARPEGE-Climat global climate model, Atmos. Chem. Phys., 22, 12167–12205, https://doi.org/10.5194/acp-22-12167-2022, 2022.
Dubovik, O., Smirnov, A., Holben, B. N., King, M. D., Kaufman, Y. J., Eck, T. F., and Slutsker, I.: Accuracy assessments of aerosol optical properties retrieved from Aerosol Robotic Network (AERONET) Sun and sky radiance measurements, J. Geophys. Res., 105, 9791–9806, https://doi.org/10.1029/2000JD900040, 2000.
Feng, Y., Ramanathan, V., and Kotamarthi, V. R.: Brown carbon: a significant atmospheric absorber of solar radiation?, Atmos. Chem. Phys., 13, 8607–8621, https://doi.org/10.5194/acp-13-8607-2013, 2013.
Flannigan, M. D., Krawchuk, M. A., de Groot, W. J., Wotton, B. M., and Gowman, L. M.: Implications of changing climate for global wildland fire, Int. J. Wildland Fire, 18, 483, https://doi.org/10.1071/WF08187, 2009.
Fleming, L. T., Lin, P., Roberts, J. M., Selimovic, V., Yokelson, R., Laskin, J., Laskin, A., and Nizkorodov, S. A.: Molecular composition and photochemical lifetimes of brown carbon chromophores in biomass burning organic aerosol, Atmos. Chem. Phys., 20, 1105–1129, https://doi.org/10.5194/acp-20-1105-2020, 2020.
Freitas, S. R., Longo, K. M., Chatfield, R., Latham, D., Silva Dias, M. A. F., Andreae, M. O., Prins, E., Santos, J. C., Gielow, R., and Carvalho Jr., J. A.: Including the sub-grid scale plume rise of vegetation fires in low resolution atmospheric transport models, Atmos. Chem. Phys., 7, 3385–3398, https://doi.org/10.5194/acp-7-3385-2007, 2007.
Froyd, K. D., Murphy, D. M., Brock, C. A., Campuzano-Jost, P., Dibb, J. E., Jimenez, J.-L., Kupc, A., Middlebrook, A. M., Schill, G. P., Thornhill, K. L., Williamson, C. J., Wilson, J. C., and Ziemba, L. D.: A new method to quantify mineral dust and other aerosol species from aircraft platforms using single-particle mass spectrometry, Atmos. Meas. Tech., 12, 6209–6239, https://doi.org/10.5194/amt-12-6209-2019, 2019.
Gelaro, R., McCarty, W., Suárez, M. J., Todling, R., Molod, A., Takacs, L., Randles, C. A., Darmenov, A., Bosilovich, M. G., Reichle, R., Wargan, K., Coy, L., Cullather, R., Draper, C., Akella, S., Buchard, V., Conaty, A., da Silva, A. M., Gu, W., Kim, G.-K., Koster, R., Lucchesi, R., Merkova, D., Nielsen, J. E., Partyka, G., Pawson, S., Putman, W., Rienecker, M., Schubert, S. D., Sienkiewicz, M., and Zhao, B.: The Modern-Era Retrospective Analysis for Research and Applications, Version 2 (MERRA-2), J. Climate, 30, 5419–5454, https://doi.org/10.1175/JCLI-D-16-0758.1, 2017.
Global Modeling and Assimilation Office (GMAO): MERRA-2 inst3_3d_asm_Np: 3d,3-Hourly,Instantaneous,Pressure-Level,Assimilation,Assimilated Meteorological Fields V5.12.4, Greenbelt, MD, USA, Goddard Earth Sciences Data and Information Services Center (GES DISC), https://doi.org/10.5067/QBZ6MG944HW0, 2015.
Go, S., Lyapustin, A., Schuster, G. L., Choi, M., Ginoux, P., Chin, M., Kalashnikova, O., Dubovik, O., Kim, J., da Silva, A., Holben, B., and Reid, J. S.: Inferring iron-oxide species content in atmospheric mineral dust from DSCOVR EPIC observations, Atmos. Chem. Phys., 22, 1395–1423, https://doi.org/10.5194/acp-22-1395-2022, 2022.
Hansen, J., Sato, M., and Ruedy, R.: Radiative forcing and climate response, J. Geophys. Res.-Atmos., 102, 6831–6864, https://doi.org/10.1029/96JD03436, 1997.
Hansen, J., Sato, M., Ruedy, R., Nazarenko, L., Lacis, A., Schmidt, G. A., Russell, G., Aleinov, I., Bauer, M., Bauer, S., Bell, N., Cairns, B., Canuto, V., Chandler, M., Cheng, Y., Del Genio, A., Faluvegi, G., Fleming, E., Friend, A., Hall, T., Jackman, C., Kelley, M., Kiang, N., Koch, D., Lean, J., Lerner, J., Lo, K., Menon, S., Miller, R., Minnis, P., Novakov, T., Oinas, V., Perlwitz, Ja., Perlwitz, Ju., Rind, D., Romanou, A., Shindell, D., Stone, P., Sun, S., Tausnev, N., Thresher, D., Wielicki, B., Wong, T., Yao, M., and Zhang, S.: Efficacy of climate forcings, J. Geophys. Res.-Atmos., 110, D18104, https://doi.org/10.1029/2005JD005776, 2005.
Hems, R. F., Schnitzler, E. G., Bastawrous, M., Soong, R., Simpson, A. J., and Abbatt, J. P. D.: Aqueous Photoreactions of Wood Smoke Brown Carbon, ACS Earth Space Chem., 4, 1149–1160, https://doi.org/10.1021/acsearthspacechem.0c00117, 2020.
Hems, R. F., Schnitzler, E. G., Liu-Kang, C., Cappa, C. D., and Abbatt, J. P. D.: Aging of Atmospheric Brown Carbon Aerosol, ACS Earth Space Chem., 5, 722–748, https://doi.org/10.1021/acsearthspacechem.0c00346, 2021.
Hoesly, R. M., Smith, S. J., Feng, L., Klimont, Z., Janssens-Maenhout, G., Pitkanen, T., Seibert, J. J., Vu, L., Andres, R. J., Bolt, R. M., Bond, T. C., Dawidowski, L., Kholod, N., Kurokawa, J.-I., Li, M., Liu, L., Lu, Z., Moura, M. C. P., O'Rourke, P. R., and Zhang, Q.: Historical (1750–2014) anthropogenic emissions of reactive gases and aerosols from the Community Emissions Data System (CEDS), Geosci. Model Dev., 11, 369–408, https://doi.org/10.5194/gmd-11-369-2018, 2018.
Hoffer, A., Tóth, Á., Pósfai, M., Chung, C. E., and Gelencsér, A.: Brown carbon absorption in the red and near-infrared spectral region, Atmos. Meas. Tech., 10, 2353–2359, https://doi.org/10.5194/amt-10-2353-2017, 2017.
Hu, Q.-H., Xie, Z.-Q., Wang, X.-M., Kang, H., He, Q.-F., and Zhang, P.: Secondary organic aerosols over oceans via oxidation of isoprene and monoterpenes from Arctic to Antarctic, Sci. Rep.-UK, 3, 2280, https://doi.org/10.1038/srep02280, 2013.
IPCC: Summary for Policymakers, in: Climate Change 2023: Synthesis Report. Contribution of Working Groups I, II and III to the Sixth Assessment Report of the Intergovernmental Panel on Climate Change, edited by: Core Writing Team, Lee, H., and Romero, J., IPCC, Geneva, Switzerland, 1–34, https://doi.org/10.59327/IPCC/AR6-9789291691647.001, 2023.
Ito, A. and Penner, J. E.: Historical emissions of carbonaceous aerosols from biomass and fossil fuel burning for the period 1870–2000, Global Biogeochem. Cy., 19, GB2028, https://doi.org/10.1029/2004GB002374, 2005.
Jacobson, M. Z.: Strong radiative heating due to the mixing state of black carbon in atmospheric aerosols, Nature, 409, 695–697, https://doi.org/10.1038/35055518, 2001.
Jo, D. S., Park, R. J., Lee, S., Kim, S.-W., and Zhang, X.: A global simulation of brown carbon: implications for photochemistry and direct radiative effect, Atmos. Chem. Phys., 16, 3413–3432, https://doi.org/10.5194/acp-16-3413-2016, 2016.
Junghenn Noyes, K. T., Kahn, R. A., Limbacher, J. A., Li, Z., Fenn, M. A., Giles, D. M., Hair, J. W., Katich, J. M., Moore, R. H., Robinson, C. E., Sanchez, K. J., Shingler, T. J., Thornhill, K. L., Wiggins, E. B., and Winstead, E. L.: Wildfire Smoke Particle Properties and Evolution, From Space-Based Multi-Angle Imaging II: The Williams Flats Fire during the FIREX-AQ Campaign, Remote Sens.-Basel, 12, 3823, https://doi.org/10.3390/rs12223823, 2020.
Junghenn Noyes, K. T., Kahn, R. A., Limbacher, J. A., and Li, Z.: Canadian and Alaskan wildfire smoke particle properties, their evolution, and controlling factors, from satellite observations, Atmos. Chem. Phys., 22, 10267–10290, https://doi.org/10.5194/acp-22-10267-2022, 2022.
Kaiser, J. W., Heil, A., Andreae, M. O., Benedetti, A., Chubarova, N., Jones, L., Morcrette, J.-J., Razinger, M., Schultz, M. G., Suttie, M., and van der Werf, G. R.: Biomass burning emissions estimated with a global fire assimilation system based on observed fire radiative power, Biogeosciences, 9, 527–554, https://doi.org/10.5194/bg-9-527-2012, 2012.
Kelley, M., Schmidt, G. A., Nazarenko, L. S., Bauer, S. E., Ruedy, R., Russell, G. L., Ackerman, A. S., Aleinov, I., Bauer, M., Bleck, R., Canuto, V., Cesana, G., Cheng, Y., Clune, T. L., Cook, B. I., Cruz, C. A., Del Genio, A. D., Elsaesser, G. S., Faluvegi, G., Kiang, N. Y., Kim, D., Lacis, A. A., Leboissetier, A., LeGrande, A. N., Lo, K. K., Marshall, J., Matthews, E. E., McDermid, S., Mezuman, K., Miller, R. L., Murray, L. T., Oinas, V., Orbe, C., García-Pando, C. P., Perlwitz, J. P., Puma, M. J., Rind, D., Romanou, A., Shindell, D. T., Sun, S., Tausnev, N., Tsigaridis, K., Tselioudis, G., Weng, E., Wu, J., and Yao, M.: GISS-E2.1: Configurations and Climatology, J. Adv. Model. Earth Sy., 12, e2019MS002025, https://doi.org/10.1029/2019MS002025, 2020.
Keywood, M., Kanakidou, M., Stohl, A., Dentener, F., Grassi, G., Meyer, C. P., Torseth, K., Edwards, D., Thompson, A. M., Lohmann, U., and Burrows, J.: Fire in the Air: Biomass Burning Impacts in a Changing Climate, Crit. Rev. Env. Sci. Tech., 43, 40–83, https://doi.org/10.1080/10643389.2011.604248, 2013.
Kinne, S.: The MACv2 aerosol climatology, Tellus B, 71, 1–21, https://doi.org/10.1080/16000889.2019.1623639, 2019.
Kirchstetter, T. W., Novakov, T., and Hobbs, P. V.: Evidence that the spectral dependence of light absorption by aerosols is affected by organic carbon, J. Geophys. Res.-Atmos., 109, D21208, https://doi.org/10.1029/2004JD004999, 2004.
Koch, D.: Transport and direct radiative forcing of carbonaceous and sulfate aerosols in the GISS GCM, J. Geophys. Res.-Atmos., 106, 20311–20332, https://doi.org/10.1029/2001JD900038, 2001.
Lack, D. A., Langridge, J. M., Bahreini, R., Cappa, C. D., Middlebrook, A. M., and Schwarz, J. P.: Brown carbon and internal mixing in biomass burning particles, P. Natl. Acad. Sci. USA, 109, 14802–14807, https://doi.org/10.1073/pnas.1206575109, 2012.
Laskin, A., Laskin, J., and Nizkorodov, S. A.: Chemistry of Atmospheric Brown Carbon, Chem. Rev., 115, 4335–4382, https://doi.org/10.1021/cr5006167, 2015.
Lawrence, C. E., Casson, P., Brandt, R., Schwab, J. J., Dukett, J. E., Snyder, P., Yerger, E., Kelting, D., VandenBoer, T. C., and Lance, S.: Long-term monitoring of cloud water chemistry at Whiteface Mountain: the emergence of a new chemical regime, Atmos. Chem. Phys., 23, 1619–1639, https://doi.org/10.5194/acp-23-1619-2023, 2023.
Lee, H. J. (Julie), Aiona, P. K., Laskin, A., Laskin, J., and Nizkorodov, S. A.: Effect of Solar Radiation on the Optical Properties and Molecular Composition of Laboratory Proxies of Atmospheric Brown Carbon, Environ. Sci. Technol., 48, 10217–10226, https://doi.org/10.1021/es502515r, 2014.
Levy, R. and Hsu, C.: MODIS Atmosphere L2 Aerosol Product, NASA MODIS Adaptive Processing System, Goddard Space Flight Center, USA [data set], https://doi.org/10.5067/MODIS/MOD04_L2.006, 2015.
Levy, R. C., Mattoo, S., Munchak, L. A., Remer, L. A., Sayer, A. M., Patadia, F., and Hsu, N. C.: The Collection 6 MODIS aerosol products over land and ocean, Atmos. Meas. Tech., 6, 2989–3034, https://doi.org/10.5194/amt-6-2989-2013, 2013.
Li, C., He, Q., Hettiyadura, A. P. S., Käfer, U., Shmul, G., Meidan, D., Zimmermann, R., Brown, S. S., George, C., Laskin, A., and Rudich, Y.: Formation of Secondary Brown Carbon in Biomass Burning Aerosol Proxies through NO3 Radical Reactions, Environ. Sci. Technol., 54, 1395–1405, https://doi.org/10.1021/acs.est.9b05641, 2020.
Li, L., Che, H., Derimian, Y., Dubovik, O., Schuster, G. L., Chen, C., Li, Q., Wang, Y., Guo, B., and Zhang, X.: Retrievals of fine mode light-absorbing carbonaceous aerosols from POLDER/PARASOL observations over East and South Asia, Remote Sens. Environ., 247, 111913, https://doi.org/10.1016/j.rse.2020.111913, 2020.
Li, L., Derimian, Y., Chen, C., Zhang, X., Che, H., Schuster, G. L., Fuertes, D., Litvinov, P., Lapyonok, T., Lopatin, A., Matar, C., Ducos, F., Karol, Y., Torres, B., Gui, K., Zheng, Y., Liang, Y., Lei, Y., Zhu, J., Zhang, L., Zhong, J., Zhang, X., and Dubovik, O.: Climatology of aerosol component concentrations derived from multi-angular polarimetric POLDER-3 observations using GRASP algorithm, Earth Syst. Sci. Data, 14, 3439–3469, https://doi.org/10.5194/essd-14-3439-2022, 2022.
Lin, G., Penner, J. E., Flanner, M. G., Sillman, S., Xu, L., and Zhou, C.: Radiative forcing of organic aerosol in the atmosphere and on snow: Effects of SOA and brown carbon, J. Geophys. Res.-Atmos., 119, 7453–7476, https://doi.org/10.1002/2013JD021186, 2014.
Lin, P., Fleming, L. T., Nizkorodov, S. A., Laskin, J., and Laskin, A.: Comprehensive Molecular Characterization of Atmospheric Brown Carbon by High Resolution Mass Spectrometry with Electrospray and Atmospheric Pressure Photoionization, Anal. Chem., 90, 12493–12502, https://doi.org/10.1021/acs.analchem.8b02177, 2018.
Liu, D., He, C., Schwarz, J. P., and Wang, X.: Lifecycle of light-absorbing carbonaceous aerosols in the atmosphere, npj Clim. Atmos. Sci., 3, 1–18, https://doi.org/10.1038/s41612-020-00145-8, 2020.
Liu, J., Bergin, M., Guo, H., King, L., Kotra, N., Edgerton, E., and Weber, R. J.: Size-resolved measurements of brown carbon in water and methanol extracts and estimates of their contribution to ambient fine-particle light absorption, Atmos. Chem. Phys., 13, 12389–12404, https://doi.org/10.5194/acp-13-12389-2013, 2013.
Liu, J., Lin, P., Laskin, A., Laskin, J., Kathmann, S. M., Wise, M., Caylor, R., Imholt, F., Selimovic, V., and Shilling, J. E.: Optical properties and aging of light-absorbing secondary organic aerosol, Atmos. Chem. Phys., 16, 12815–12827, https://doi.org/10.5194/acp-16-12815-2016, 2016.
Lyapustin, A., Go, S., Korkin, S., Wang, Y., Torres, O., Jethva, H., and Marshak, A.: Retrievals of Aerosol Optical Depth and Spectral Absorption From DSCOVR EPIC, Frontiers in Remote Sensing, 2, 645794, https://doi.org/10.3389/frsen.2021.645794, 2021.
Mahilang, M., Deb, M. K., and Pervez, S.: Biogenic secondary organic aerosols: A review on formation mechanism, analytical challenges and environmental impacts, Chemosphere, 262, 127771, https://doi.org/10.1016/j.chemosphere.2020.127771, 2021.
McDuffie, E. E., Smith, S. J., O'Rourke, P., Tibrewal, K., Venkataraman, C., Marais, E. A., Zheng, B., Crippa, M., Brauer, M., and Martin, R. V.: A global anthropogenic emission inventory of atmospheric pollutants from sector- and fuel-specific sources (1970–2017): an application of the Community Emissions Data System (CEDS), Earth Syst. Sci. Data, 12, 3413–3442, https://doi.org/10.5194/essd-12-3413-2020, 2020.
McMeeking, G. R.: The optical, chemical, and physical properties of aerosols and gases emitted by the laboratory combustion of wildland fuels, Colorado State University, UMI 3346483, 2008.
McMeeking, G. R., Kreidenweis, S. M., Baker, S., Carrico, C. M., Chow, J. C., Collett Jr., J. L., Hao, W. M., Holden, A. S., Kirchstetter, T. W., Malm, W. C., Moosmüller, H., Sullivan, A. P., and Wold, C. E.: Emissions of trace gases and aerosols during the open combustion of biomass in the laboratory, J. Geophys. Res.-Atmos., 114, D19210., https://doi.org/10.1029/2009JD011836, 2009.
Mok, J., Krotkov, N. A., Arola, A., Torres, O., Jethva, H., Andrade, M., Labow, G., Eck, T. F., Li, Z., Dickerson, R. R., Stenchikov, G. L., Osipov, S., and Ren, X.: Impacts of brown carbon from biomass burning on surface UV and ozone photochemistry in the Amazon Basin, Sci. Rep.-UK, 6, 36940, https://doi.org/10.1038/srep36940, 2016.
Moosmüller, H., Chakrabarty, R. K., Ehlers, K. M., and Arnott, W. P.: Absorption Ångström coefficient, brown carbon, and aerosols: basic concepts, bulk matter, and spherical particles, Atmos. Chem. Phys., 11, 1217–1225, https://doi.org/10.5194/acp-11-1217-2011, 2011.
National Aeronautics and Space Administration: GISS ModelE Source Code Snapshots, NASA [code], https://simplex.giss.nasa.gov/snapshots/ (last access: 21 March 2024), 2024.
O'Neill, N. T., Ignatov, A., Holben, B. N., and Eck, T. F.: The lognormal distribution as a reference for reporting aerosol optical depth statistics; Empirical tests using multi-year, multi-site AERONET Sunphotometer data, Geophys. Res. Lett., 27, 3333–3336, https://doi.org/10.1029/2000GL011581, 2000.
Pan, X., Ichoku, C., Chin, M., Bian, H., Darmenov, A., Colarco, P., Ellison, L., Kucsera, T., da Silva, A., Wang, J., Oda, T., and Cui, G.: Six global biomass burning emission datasets: intercomparison and application in one global aerosol model, Atmos. Chem. Phys., 20, 969–994, https://doi.org/10.5194/acp-20-969-2020, 2020.
Park, R. J., Kim, M. J., Jeong, J. I., Youn, D., and Kim, S.: A contribution of brown carbon aerosol to the aerosol light absorption and its radiative forcing in East Asia, Atmos. Environ., 44, 1414–1421, https://doi.org/10.1016/j.atmosenv.2010.01.042, 2010.
Pokhrel, R. P., Wagner, N. L., Langridge, J. M., Lack, D. A., Jayarathne, T., Stone, E. A., Stockwell, C. E., Yokelson, R. J., and Murphy, S. M.: Parameterization of single-scattering albedo (SSA) and absorption Ångström exponent (AAE) with EC / OC for aerosol emissions from biomass burning, Atmos. Chem. Phys., 16, 9549–9561, https://doi.org/10.5194/acp-16-9549-2016, 2016.
Pósfai, M., Gelencsér, A., Simonics, R., Arató, K., Li, J., Hobbs, P. V., and Buseck, P. R.: Atmospheric tar balls: Particles from biomass and biofuel burning, J. Geophys. Res.-Atmos., 109, D06213, https://doi.org/10.1029/2003JD004169, 2004.
Ramanathan, V. and Carmichael, G.: Global and regional climate changes due to black carbon, Nat. Geosci., 1, 221–227, https://doi.org/10.1038/ngeo156, 2008.
Saleh, R., Robinson, E. S., Tkacik, D. S., Ahern, A. T., Liu, S., Aiken, A. C., Sullivan, R. C., Presto, A. A., Dubey, M. K., Yokelson, R. J., Donahue, N. M., and Robinson, A. L.: Brownness of organics in aerosols from biomass burning linked to their black carbon content, Nat. Geosci., 7, 647–650, https://doi.org/10.1038/ngeo2220, 2014.
Saleh, R., Marks, M., Heo, J., Adams, P. J., Donahue, N. M., and Robinson, A. L.: Contribution of brown carbon and lensing to the direct radiative effect of carbonaceous aerosols from biomass and biofuel burning emissions, J. Geophys. Res.-Atmos., 120, 10285–10296, https://doi.org/10.1002/2015JD023697, 2015.
Saleh, R., Cheng, Z., and Atwi, K.: The Brown–Black Continuum of Light-Absorbing Combustion Aerosols, Environ. Sci. Tech. Let., 5, 508–513, https://doi.org/10.1021/acs.estlett.8b00305, 2018.
Samburova, V., Connolly, J., Gyawali, M., Yatavelli, R. L. N., Watts, A. C., Chakrabarty, R. K., Zielinska, B., Moosmüller, H., and Khlystov, A.: Polycyclic aromatic hydrocarbons in biomass-burning emissions and their contribution to light absorption and aerosol toxicity, Sci. Total Environ., 568, 391–401, https://doi.org/10.1016/j.scitotenv.2016.06.026, 2016.
Sand, M., Samset, B. H., Balkanski, Y., Bauer, S., Bellouin, N., Berntsen, T. K., Bian, H., Chin, M., Diehl, T., Easter, R., Ghan, S. J., Iversen, T., Kirkevåg, A., Lamarque, J.-F., Lin, G., Liu, X., Luo, G., Myhre, G., Noije, T. V., Penner, J. E., Schulz, M., Seland, Ø., Skeie, R. B., Stier, P., Takemura, T., Tsigaridis, K., Yu, F., Zhang, K., and Zhang, H.: Aerosols at the poles: an AeroCom Phase II multi-model evaluation, Atmos. Chem. Phys., 17, 12197–12218, https://doi.org/10.5194/acp-17-12197-2017, 2017.
Satish, R., Rastogi, N., Singh, A., and Singh, D.: Change in characteristics of water-soluble and water-insoluble brown carbon aerosols during a large-scale biomass burning, Environ. Sci. Pollut. R., 27, 33339–33350, https://doi.org/10.1007/s11356-020-09388-7, 2020.
Sayer, A. M. and Knobelspiesse, K. D.: How should we aggregate data? Methods accounting for the numerical distributions, with an assessment of aerosol optical depth, Atmos. Chem. Phys., 19, 15023–15048, https://doi.org/10.5194/acp-19-15023-2019, 2019.
Schnitzler, E. G., Liu, T., Hems, R. F., and Abbatt, J. P. D.: Emerging investigator series: heterogeneous OH oxidation of primary brown carbon aerosol: effects of relative humidity and volatility, Environ. Sci.-Proc. Imp., 22, 2162–2171, https://doi.org/10.1039/D0EM00311E, 2020.
Schuster, G. L., Dubovik, O., and Holben, B. N.: Angstrom exponent and bimodal aerosol size distributions, J. Geophys. Res.-Atmos., 111, D07207, https://doi.org/10.1029/2005JD006328, 2006.
Schuster, G. L., Dubovik, O., and Arola, A.: Remote sensing of soot carbon – Part 1: Distinguishing different absorbing aerosol species, Atmos. Chem. Phys., 16, 1565–1585, https://doi.org/10.5194/acp-16-1565-2016, 2016.
Shetty, N. J., Pandey, A., Baker, S., Hao, W. M., and Chakrabarty, R. K.: Measuring light absorption by freshly emitted organic aerosols: optical artifacts in traditional solvent-extraction-based methods, Atmos. Chem. Phys., 19, 8817–8830, https://doi.org/10.5194/acp-19-8817-2019, 2019.
Shrivastava, M., Cappa, C. D., Fan, J., Goldstein, A. H., Guenther, A. B., Jimenez, J. L., Kuang, C., Laskin, A., Martin, S. T., Ng, N. L., Petaja, T., Pierce, J. R., Rasch, P. J., Roldin, P., Seinfeld, J. H., Shilling, J., Smith, J. N., Thornton, J. A., Volkamer, R., Wang, J., Worsnop, D. R., Zaveri, R. A., Zelenyuk, A., and Zhang, Q.: Recent advances in understanding secondary organic aerosol: Implications for global climate forcing, Rev. Geophys., 55, 509–559, https://doi.org/10.1002/2016RG000540, 2017.
Sinyuk, A., Holben, B. N., Eck, T. F., Giles, D. M., Slutsker, I., Korkin, S., Schafer, J. S., Smirnov, A., Sorokin, M., and Lyapustin, A.: The AERONET Version 3 aerosol retrieval algorithm, associated uncertainties and comparisons to Version 2, Atmos. Meas. Tech., 13, 3375–3411, https://doi.org/10.5194/amt-13-3375-2020, 2020.
Sofiev, M., Ermakova, T., and Vankevich, R.: Evaluation of the smoke-injection height from wild-land fires using remote-sensing data, Atmos. Chem. Phys., 12, 1995–2006, https://doi.org/10.5194/acp-12-1995-2012, 2012.
Sumlin, B. J., Heinson, Y. W., Shetty, N., Pandey, A., Pattison, R. S., Baker, S., Hao, W. M., and Chakrabarty, R. K.: UV–Vis–IR spectral complex refractive indices and optical properties of brown carbon aerosol from biomass burning, J. Quant. Spectrosc. Ra., 206, 392–398, https://doi.org/10.1016/j.jqsrt.2017.12.009, 2018.
Szopa, S., Naik, V., Adhikary, B., Artaxo, P., Berntsen, T., Collins, W. D., Fuzzi,S., Gallardo, L., Kiendler-Scharr, A., Klimont, Z., Liao, H., Unger, N., and Zanis, P.: Short-Lived Climate Forcers, in: Climate Change 2021: The Physical Science Basis. Contribution of Working Group I to the Sixth Assessment Report of the Intergovernmental Panel on Climate Change, edited by: Masson-Delmotte, V., Zhai, P., Pirani, A., Connors, S. L., Péan, C., Berger, S., Caud, N., Chen, Y., Goldfarb, L., Gomis, M. I., Huang, M., Leitzell, K., Lonnoy, E., Matthews, J. B. R., Maycock, T. K., Waterfield, T., Yelekçi, O., Yu, R., and Zhou, B., Cambridge University Press, Cambridge, United Kingdom and New York, NY, USA, 817–922, https://doi.org/10.1017/9781009157896.008, 2021.
Tang, M., Alexander, J. M., Kwon, D., Estillore, A. D., Laskina, O., Young, M. A., Kleiber, P. D., and Grassian, V. H.: Optical and Physicochemical Properties of Brown Carbon Aerosol: Light Scattering, FTIR Extinction Spectroscopy, and Hygroscopic Growth, J. Phys. Chem. A, 120, 4155–4166, https://doi.org/10.1021/acs.jpca.6b03425, 2016.
Tsigaridis, K. and Kanakidou, M.: Global modelling of secondary organic aerosol in the troposphere: a sensitivity analysis, Atmos. Chem. Phys., 3, 1849–1869, https://doi.org/10.5194/acp-3-1849-2003, 2003.
Tsigaridis, K. and Kanakidou, M.: Secondary organic aerosol importance in the future atmosphere, Atmos. Environ., 41, 4682–4692, https://doi.org/10.1016/j.atmosenv.2007.03.045, 2007.
Tsigaridis, K. and Kanakidou, M.: The Present and Future of Secondary Organic Aerosol Direct Forcing on Climate, Curr. Clim. Change Rep., 4, 84–98, https://doi.org/10.1007/s40641-018-0092-3, 2018.
Tsigaridis, K., Daskalakis, N., Kanakidou, M., Adams, P. J., Artaxo, P., Bahadur, R., Balkanski, Y., Bauer, S. E., Bellouin, N., Benedetti, A., Bergman, T., Berntsen, T. K., Beukes, J. P., Bian, H., Carslaw, K. S., Chin, M., Curci, G., Diehl, T., Easter, R. C., Ghan, S. J., Gong, S. L., Hodzic, A., Hoyle, C. R., Iversen, T., Jathar, S., Jimenez, J. L., Kaiser, J. W., Kirkevåg, A., Koch, D., Kokkola, H., Lee, Y. H., Lin, G., Liu, X., Luo, G., Ma, X., Mann, G. W., Mihalopoulos, N., Morcrette, J.-J., Müller, J.-F., Myhre, G., Myriokefalitakis, S., Ng, N. L., O'Donnell, D., Penner, J. E., Pozzoli, L., Pringle, K. J., Russell, L. M., Schulz, M., Sciare, J., Seland, Ø., Shindell, D. T., Sillman, S., Skeie, R. B., Spracklen, D., Stavrakou, T., Steenrod, S. D., Takemura, T., Tiitta, P., Tilmes, S., Tost, H., van Noije, T., van Zyl, P. G., von Salzen, K., Yu, F., Wang, Z., Wang, Z., Zaveri, R. A., Zhang, H., Zhang, K., Zhang, Q., and Zhang, X.: The AeroCom evaluation and intercomparison of organic aerosol in global models, Atmos. Chem. Phys., 14, 10845–10895, https://doi.org/10.5194/acp-14-10845-2014, 2014.
Tuccella, P., Curci, G., Pitari, G., Lee, S., and Jo, D. S.: Direct Radiative Effect of Absorbing Aerosols: Sensitivity to Mixing State, Brown Carbon, and Soil Dust Refractive Index and Shape, J. Geophys. Res.-Atmos., 125, e2019JD030967, https://doi.org/10.1029/2019JD030967, 2020.
van der Werf, G. R., Randerson, J. T., Giglio, L., van Leeuwen, T. T., Chen, Y., Rogers, B. M., Mu, M., van Marle, M. J. E., Morton, D. C., Collatz, G. J., Yokelson, R. J., and Kasibhatla, P. S.: Global fire emissions estimates during 1997–2016, Earth Syst. Sci. Data, 9, 697–720, https://doi.org/10.5194/essd-9-697-2017, 2017.
Wang, X., Heald, C. L., Ridley, D. A., Schwarz, J. P., Spackman, J. R., Perring, A. E., Coe, H., Liu, D., and Clarke, A. D.: Exploiting simultaneous observational constraints on mass and absorption to estimate the global direct radiative forcing of black carbon and brown carbon, Atmos. Chem. Phys., 14, 10989–11010, https://doi.org/10.5194/acp-14-10989-2014, 2014.
Wang, X., Heald, C. L., Liu, J., Weber, R. J., Campuzano-Jost, P., Jimenez, J. L., Schwarz, J. P., and Perring, A. E.: Exploring the observational constraints on the simulation of brown carbon, Atmos. Chem. Phys., 18, 635–653, https://doi.org/10.5194/acp-18-635-2018, 2018.
Washenfelder, R. A., Azzarello, L., Ball, K., Brown, S. S., Decker, Z. C. J., Franchin, A., Fredrickson, C. D., Hayden, K., Holmes, C. D., Middlebrook, A. M., Palm, B. B., Pierce, R. B., Price, D. J., Roberts, J. M., Robinson, M. A., Thornton, J. A., Womack, C. C., and Young, C. J.: Complexity in the Evolution, Composition, and Spectroscopy of Brown Carbon in Aircraft Measurements of Wildfire Plumes, Geophys. Res. Lett., 49, e2022GL098951, https://doi.org/10.1029/2022GL098951, 2022.
Wong, J. P. S., Tsagkaraki, M., Tsiodra, I., Mihalopoulos, N., Violaki, K., Kanakidou, M., Sciare, J., Nenes, A., and Weber, R. J.: Atmospheric evolution of molecular-weight-separated brown carbon from biomass burning, Atmos. Chem. Phys., 19, 7319–7334, https://doi.org/10.5194/acp-19-7319-2019, 2019.
Zeng, L., Zhang, A., Wang, Y., Wagner, N. L., Katich, J. M., Schwarz, J. P., Schill, G. P., Brock, C., Froyd, K. D., Murphy, D. M., Williamson, C. J., Kupc, A., Scheuer, E., Dibb, J., and Weber, R. J.: Global Measurements of Brown Carbon and Estimated Direct Radiative Effects, Geophys. Res. Lett., 47, e2020GL088747, https://doi.org/10.1029/2020GL088747, 2020.
Zeng, L., Sullivan, A. P., Washenfelder, R. A., Dibb, J., Scheuer, E., Campos, T. L., Katich, J. M., Levin, E., Robinson, M. A., and Weber, R. J.: Assessment of online water-soluble brown carbon measuring systems for aircraft sampling, Atmos. Meas. Tech., 14, 6357–6378, https://doi.org/10.5194/amt-14-6357-2021, 2021.
Zeng, L., Dibb, J., Scheuer, E., Katich, J. M., Schwarz, J. P., Bourgeois, I., Peischl, J., Ryerson, T., Warneke, C., Perring, A. E., Diskin, G. S., DiGangi, J. P., Nowak, J. B., Moore, R. H., Wiggins, E. B., Pagonis, D., Guo, H., Campuzano-Jost, P., Jimenez, J. L., Xu, L., and Weber, R. J.: Characteristics and evolution of brown carbon in western United States wildfires, Atmos. Chem. Phys., 22, 8009–8036, https://doi.org/10.5194/acp-22-8009-2022, 2022.
Zhang, A., Wang, Y., Zhang, Y., Weber, R. J., Song, Y., Ke, Z., and Zou, Y.: Modeling the global radiative effect of brown carbon: a potentially larger heating source in the tropical free troposphere than black carbon, Atmos. Chem. Phys., 20, 1901–1920, https://doi.org/10.5194/acp-20-1901-2020, 2020.
Zhang, X., Lin, Y.-H., Surratt, J. D., and Weber, R. J.: Sources, Composition and Absorption Ångström Exponent of Light-absorbing Organic Components in Aerosol Extracts from the Los Angeles Basin, Environ. Sci. Technol., 47, 3685–3693, https://doi.org/10.1021/es305047b, 2013.
Zhang, Y., Forrister, H., Liu, J., Dibb, J., Anderson, B., Schwarz, J. P., Perring, A. E., Jimenez, J. L., Campuzano-Jost, P., Wang, Y., Nenes, A., and Weber, R. J.: Top-of-atmosphere radiative forcing affected by brown carbon in the upper troposphere, Nat. Geosci., 10, 486–489, https://doi.org/10.1038/ngeo2960, 2017.
Zhao, R., Lee, A. K. Y., Huang, L., Li, X., Yang, F., and Abbatt, J. P. D.: Photochemical processing of aqueous atmospheric brown carbon, Atmos. Chem. Phys., 15, 6087–6100, https://doi.org/10.5194/acp-15-6087-2015, 2015.
Zhong, M. and Jang, M.: Dynamic light absorption of biomass-burning organic carbon photochemically aged under natural sunlight, Atmos. Chem. Phys., 14, 1517–1525, https://doi.org/10.5194/acp-14-1517-2014, 2014.
Zhu, Y., Wang, Q., Yang, X., Yang, N., and Wang, X.: Modeling Investigation of Brown Carbon Aerosol and Its Light Absorption in China, Atmosphere, 12, 892, https://doi.org/10.3390/atmos12070892, 2021.
- Abstract
- Introduction
- Model description and experiments
- Results and discussion
- Conclusions
- Best practices for complexity of BrC representation in ModelE
- Appendix A
- Code and data availability
- Author contributions
- Competing interests
- Disclaimer
- Acknowledgements
- Financial support
- Review statement
- References