the Creative Commons Attribution 4.0 License.
the Creative Commons Attribution 4.0 License.
 | 28 May 2024
Initial atmospheric conditions control transport of volcanic volatiles, forcing and impacts
Herman F. Fuglestvedt
Matthew Toohey
Kirstin Krüger
Volcanic eruptions impact the climate and environment. The volcanic forcing is determined by eruption source parameters, including the mass and composition of volcanic volatiles, eruption season, eruption latitude, and injection altitude. Moreover, initial atmospheric conditions of the climate system play an important role in shaping the volcanic forcing and response. However, our understanding of the combination of these factors, the distinctions between tropical and extratropical volcanic eruptions, and the co-injection of sulfur and halogens remains limited. Here, we perform ensemble simulations of volcanic eruptions at 15 and 64° N in January, injecting 17 Mt of SO2 together with HCl and HBr at 24 km altitude. Our findings reveal that initial atmospheric conditions control the transport of volcanic volatiles from the first month and modulate the subsequent latitudinal distribution of sulfate aerosols and halogens. This results in different volcanic forcing, surface temperature and ozone responses over the globe and Northern Hemisphere extratropics (NHET) among the model ensemble members with different initial atmospheric conditions. NH extratropical eruptions exhibit a larger NHET mean volcanic forcing, surface cooling and ozone depletion compared with tropical eruptions. However, tropical eruptions lead to more prolonged impacts compared with NH extratropical eruptions, both globally and in the NHET. The sensitivity of volcanic forcing to varying eruption source parameters and model dependency is discussed, emphasizing the need for future multi-model studies to consider the influence of initial conditions and eruption source parameters on volcanic forcing and subsequent impacts.
- Article
(8858 KB) - Full-text XML
-
Supplement
(5936 KB) - BibTeX
- EndNote


Explosive volcanic eruptions can inject sulfur dioxide (SO2), halogens, ash and water vapor into the stratosphere, causing significant perturbation of the Earth system. Stratospheric sulfate aerosols formed from injected SO2 reflect incoming solar radiation and absorb longwave radiation, cooling the surface and warming the stratosphere (Robock, 2000; Timmreck, 2012). A lot of studies have been conducted on the explosive eruption of Mt Pinatubo in 1991 (Bluth et al., 1992; Guo et al., 2004; Robock, 2000; Ukhov et al., 2023). However, large uncertainties still exist with respect to quantifying the amount of SO2 injected into the stratosphere based on different observational (Bluth et al., 1992; Grant et al., 1992; Guo et al., 2004) and modeling (Dhomse et al., 2014; Jones et al., 2016; Mills et al., 2016; Niemeier et al., 2009; Quaglia et al., 2023; Stenchikov et al., 2021) studies. To reach the best agreement with Pinatubo volcanic forcing observations, models have used a wide range of SO2 injections from 10 to 20 Tg (Timmreck et al., 2018). Atmosphere–aerosol models are mostly used, either with prescribed sea surface temperature (SST), such as MAECHAM5-HAM (Niemeier et al., 2009) and UM-UKCA (Dhomse et al., 2014), or in a fully coupled configuration with interactive atmosphere, ocean, sea ice and chemistry as well as a high model top, such as CESM-WACCM (Mills et al., 2016). Even when injecting the same SO2 mass, models simulate a different sulfate burden (Marshall et al., 2018) and stratospheric aerosol optical depth (SAOD) (Clyne et al., 2021; Zanchettin et al., 2016). Clyne et al. (2021) and Mills et al. (2017) argued that interactive OH chemistry is essential to accurately simulate the evolution and lifetime of volcanic aerosols. Quaglia et al. (2023) showed that, with interactive aerosol microphysics, different stratospheric transport in different models is the main reason for their disagreement with Pinatubo observations.
Previous modeling studies on volcanic impacts have mostly considered sulfur as the only volcanic volatile injection, ignoring the potential of volcanic halogens reaching the stratosphere (Krüger et al., 2015; Kutterolf et al., 2013, 2015; von Glasow et al., 2009; WMO, 2018). The few studies that simulated volcanic eruptions with co-injection of sulfur and halogens showed different volcanic forcing, ozone and climate responses compared with eruptions with sulfur-only injection (Brenna et al., 2019, 2020; Klobas et al., 2017; Lurton et al., 2018; Ming et al., 2020; Staunton-Sykes et al., 2021). However, these studies modeled different strengths of volcanic eruptions with different atmospheric background conditions. A more systematic model study investigating the impacts of sulfur- and halogen-rich tropical and extratropical eruptions is still lacking.
Different source parameters, including the mass and composition of volcanic volatiles, eruption season, eruption latitude, and eruption altitude, contribute to large uncertainties that shape the forcing and impact of volcanic eruptions (Kravitz and Robock, 2011; Marshall et al., 2019; Metzner et al., 2014; Toohey et al., 2011, 2019; Zhuo et al., 2014, 2021). A key question lies in understanding how eruption latitude affects the forcing and impact of volcanic eruptions. Tropical eruptions have been considered to have a larger climate impact than extratropical eruptions (Myhre et al., 2013; Schneider et al., 2009). However, ice cores and tree ring reconstructions indicate that, compared with historical tropical eruptions, extratropical eruptions have led to larger climate impacts per unit volcanic stratospheric sulfate injection over the Northern Hemisphere (NH), which has been supported by analysis of MAECHAM5-HAM model simulations (Toohey et al., 2019). Nevertheless, the results of this study are limited with regard to the aerosol and climate response, as the ocean temperatures and sea ice were prescribed and the interaction of atmospheric chemistry and the quasi-biennial oscillation (QBO) was missing. Using the fully coupled MPI-ESM model, Zhuo et al. (2021) simulated stronger Northern Hemisphere extratropics (NHET) surface cooling after NH extratropical volcanic eruptions compared with tropical eruptions. However, this study used prescribed SAOD as volcanic forcing, which does not explicitly simulate the chemical, microphysical and dynamical processes of the aerosols that play an important role in shaping the volcanic forcing and subsequent climate impact.
The evolution of stratospheric volcanic materials and the associated radiative forcing has been suggested to depend on the state of the atmosphere at the time of the eruption. The initial spread of volcanic clouds depends on the wind direction at the time of eruption, as evidenced by the different volcanic cloud distributions observed a few weeks after 1982 El Chichón and 1991 Mt Pinatubo eruptions (Robock, 2000). In the stratosphere, the QBO dominates the tropical circulation with alternating easterly and westerly winds (Baldwin et al., 2001). Stratospheric aerosols experience greater lofting and tropical confinement under easterly shear conditions in the QBO region, as opposed to when a westerly shear is present (Trepte and Hitchman, 1992). In the extratropical stratosphere, the initial stability of the polar vortex (PV) largely modulates the evolution and distribution of volcanic materials (Fuglestvedt et al., 2024), which also relates to the seasonal cycle of the Brewer–Dobson circulation (BDC; Butchart, 2014; Toohey et al., 2011) and seasonal variation in the OH concentration at different latitudes (Fuglestvedt et al., 2024; Toohey et al., 2019). Most of these variabilities operate on timescales ranging from hourly to interannual, collectively shaping the evolution and distribution of volcanic materials and subsequently determining volcanic forcing.
The volcanic forcing plays an important role in determining the post-eruption climate response. The initial climate state such as the pre-eruption El Niño–Southern Oscillation (ENSO) state modulates the post-eruption ENSO responses to volcanic eruptions and the surface winter warming pattern (Coupe and Robock, 2021; Khodri et al., 2017; Pausata et al., 2016, 2020). To address the role of the initial climate state, the use of large model ensembles and multi-model comparison is suggested (Zanchettin et al., 2016).
Here, we use a fully coupled Earth system model with interactive atmosphere, ocean, sea ice, and prognostic aerosol microphysics and atmospheric chemistry to simulate Pinatubo-magnitude eruptions at 15 and 64° N in January in a pre-industrial atmosphere. We are particularly interested in how Pinatubo-strength eruptions are affected by a westerly QBO phase, given the QBO disruption and prolonged easterly regime response to a tropical super eruption as modeled by Brenna et al. (2021). In addition, we apply different initial atmospheric conditions, under westerly QBO conditions, which include different ENSO and PV states for our tropical and NH extratropical eruptions with sulfur and halogen injections. We also conduct sensitivity tests with sulfur injections only and with July as the eruption month. In a related study by Fuglestvedt et al. (2024), we analyze the effects of initial PV conditions on the aerosol evolution, volcanic forcing and deposition of NH extratropical eruptions at 64° N. In this study, we address the following questions:
-
How do initial atmospheric conditions influence the transport of volcanic volatiles and volcanic forcing after tropical eruptions, particularly in light of the co-injection of sulfur and halogens into the stratosphere?
-
What differences do tropical and NH extratropical volcanic eruptions have regarding their volcanic forcing and subsequent climate and ozone impacts?
In the following, we describe the data and methods in Sect. 2, including the model description and experimental design. In Sect. 3, we present the results. Section 3.1 shows the transport of SO2 and aerosol controlled by initial atmospheric conditions, which determines the volcanic forcing after tropical eruptions co-injecting sulfur and halogens. In Sect. 3.2, we compare the aerosol evolution, volcanic forcing, climate and ozone impact of tropical and NH extratropical eruptions under different initial atmospheric conditions. The results are discussed in Sect. 4. Finally, we give the summary and conclusions in Sect. 5.
2.1 Model description
This study uses the Community Earth System Model Version 2 (as in Danabasoglu et al., 2020) with the high-top version of the Whole Atmosphere Community Climate Model Version 6 (as in Gettelman et al., 2019). WACCM6 has a horizontal resolution of 0.95° × 1.25° (latitude × longitude), with 70 hybrid sigma-pressure levels extending from the Earth's surface to hPa (∼ 140 km altitude). The ocean component, Parallel Ocean Program version 2 (POP2; Smith et al., 2010), runs at a nominal 1° horizontal resolution, with 60 vertical layers to 5500 m depth. The same grid is used by the Los Alamos National Laboratory sea ice model, version 5 (CICE5; Hunke et al., 2015). The land component is the Community Land Model Version 5 (CLM5; Lawrence et al., 2019), with the Community Ice Sheet Model Version 2.1 (CISM2.1; Lipscomb et al., 2019) as its land ice component.
WACCM6 uses a comprehensive chemistry configuration for the troposphere, stratosphere, mesosphere and lower thermosphere (TSMLT). It includes 231 solution species and 583 chemical reactions with 150 photolytic, gas-phase and heterogeneous reactions relevant for the whole atmosphere (Gettelman et al., 2019). The chemical families include Ox, HOx, NOx, ClOx, BrOx and SOx. Aerosols are treated using the modified Modal Aerosol Model version 4 (MAM4; Liu et al., 2016) which is coupled to cloud microphysics (Liu et al., 2012) and incorporates prognostic stratospheric aerosols (Mills et al., 2016). Validation of SO2 emission and radiative forcing of volcanic eruptions confirms the qualification of the model for simulating volcanic eruptions and stratospheric aerosol geoengineering (Mills et al., 2016, 2017). WACCM6 also includes an internally generated QBO (Gettelman et al., 2019).
For model intercomparison, we also adopt MAECHAM5-HAM (Stier et al., 2005) for sensitivity tests. MAECHAM5-HAM is an aerosol–climate model with a T42 spectral truncation at ∼ 2.8° × 2.8° spatial resolution and 39 vertical levels up to 0.01 hPa (∼ 80 km). The model was run with a free atmosphere and prescribed SSTs. Aerosol processes in the stratosphere are calculated by the HAM aerosol microphysical module (Niemeier et al., 2009; Toohey et al., 2011), which includes aerosol formation and growth via nucleation, condensation, accumulation, coagulation, sedimentation, and final removal processes of wet and dry deposition. HAM uses a prescribed monthly mean OH field. This may affect the conversion of SO2 to SO4, which is dependent on the local consumption of OH. In addition, we also use the modular EVA (Easy Volcanic Aerosol) volcanic forcing generator (Toohey et al., 2016). It prescribes the SAOD and serves as the tool for compiling the volcanic forcing for experiments in Phase 4 of the Paleoclimate Model Intercomparison Project (Jungclaus et al., 2017; Sigl et al., 2015, 2022; Toohey and Sigl, 2017).
2.2 Experimental design
A 56-year spin-up run is conducted under 1850 pre-industrial conditions. From this run, we pick six initial atmospheric conditions to conduct ensemble runs (Table 1). For each condition, we select a range of ENSO conditions, with two respective cases in positive, neutral and negative ENSO states, and with varying QBO westerly and PV strengths. The six cases otherwise represent a random sampling of meteorological variability (see Sect. 2.3). These baseline ensemble experiments include both volcanic sulfur and halogen injections. Tropical eruptions are located at 15° N, 91° W (H-15N-Jan), simulating Central American Volcanic Arc (CAVA) eruptions, while NH extratropical eruptions are located at 64° N, 19° W (H-64N-Jan), simulating eruptions of the Katla volcanic system over Iceland. We use January as the base eruption season, as this is the default for historical volcanic eruptions when the eruption season is unknown in ice-core-based volcanic forcing reconstructions (Sigl et al., 2022; Toohey and Sigl, 2017). Following Toohey et al. (2019), we inject 17 Tg SO2 at 24 km altitude, mimicking a Pinatubo-like eruption, but in an 1850 pre-industrial atmosphere taking the co-injection of sulfur and halogens into account. The injected HCl and HBr masses are based on an estimation of CAVA eruptions (Kutterolf et al., 2013, 2015), assuming a conservative injection efficiency of 10 % for tropical eruptions to the stratosphere (Brenna et al., 2019; Krüger et al., 2015) but applied here for both eruption latitudes for comparability. In addition to the baseline experiments, we also run simulations injecting only SO2 at 15° N (S-15N-Jan) and 64° N (S-64N-Jan) to test the difference between volcanic eruptions with co-injection of sulfur and halogens and sulfur-only injection. Moreover, we run a set of eruptions in July at 15° N (H-15N-Jul and S-15N-Jul) and 64° N (H-64N-Jul and S-64N-Jul) to test the impact of the eruption season on the volcanic forcing and related impacts. Finally, a control run lasting for 30 years without volcanic injection is conducted.
Table 1Summary of model experiments with CESM2-WACCM6 as well as with MAECHAM5-HAM (ECHAM5) and EVA, as stated.
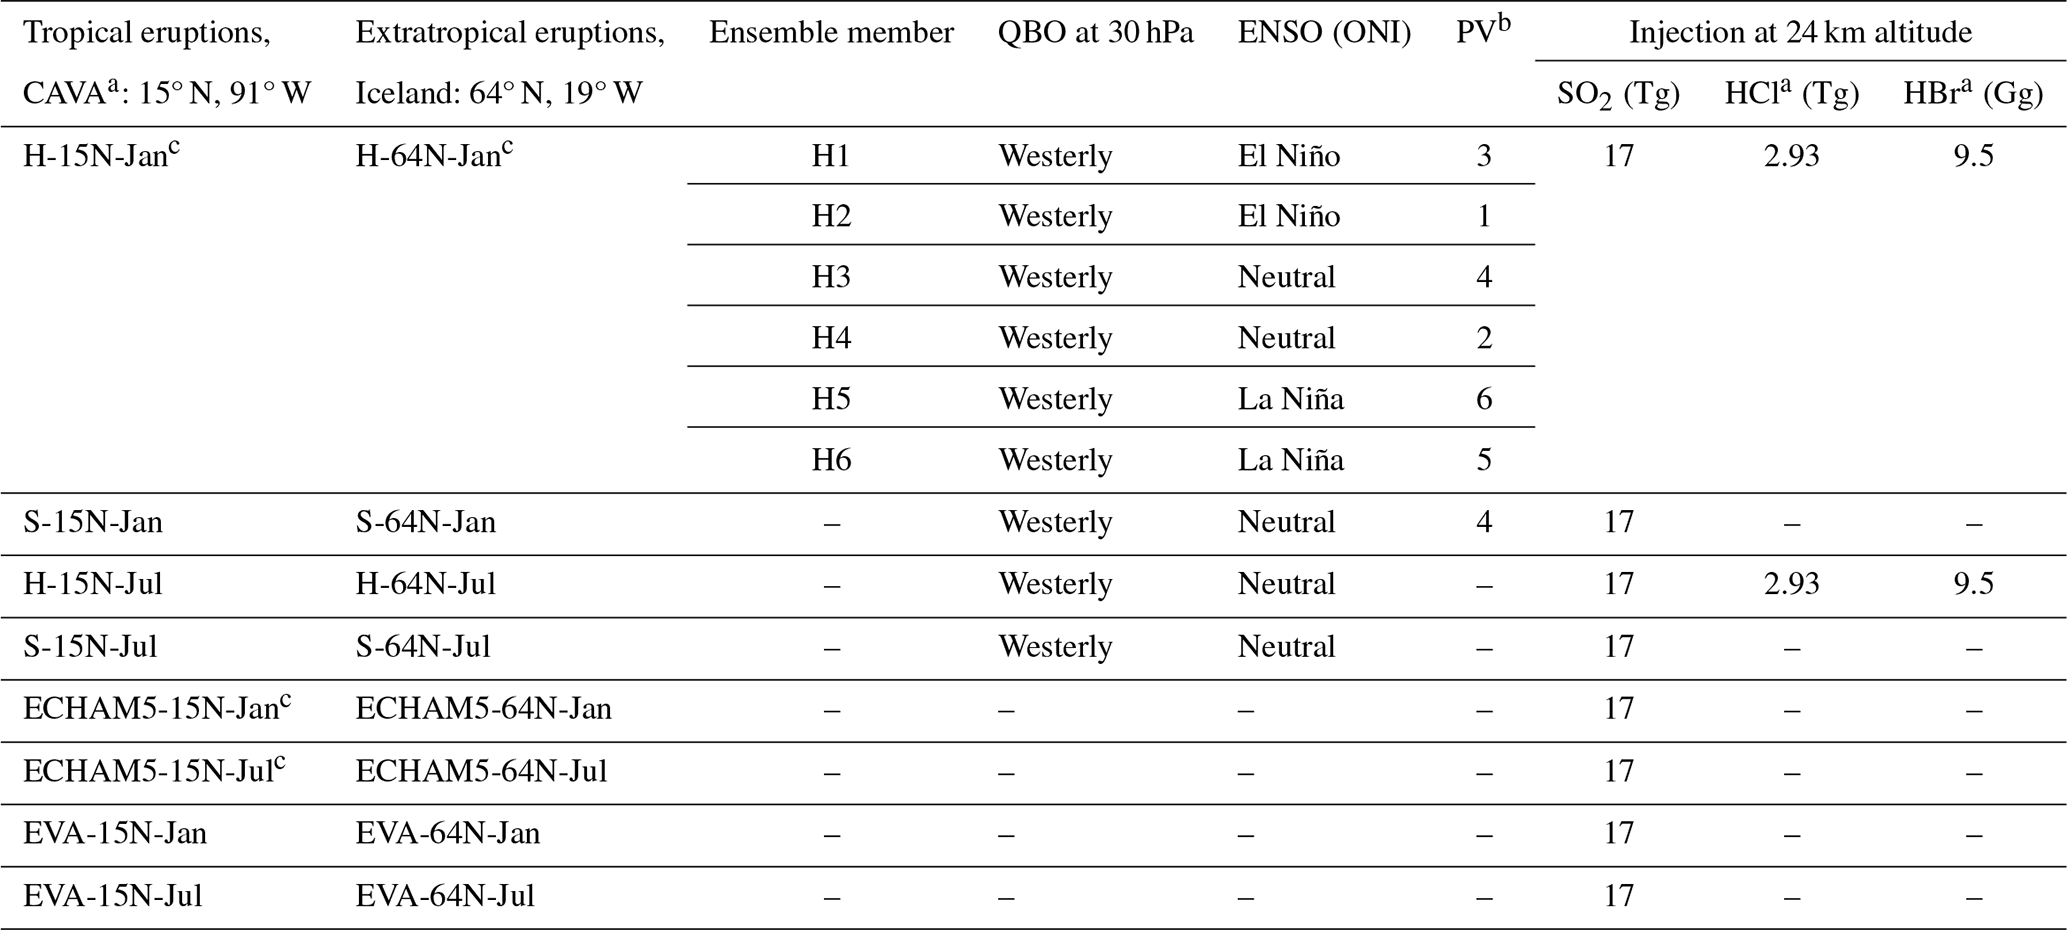
a HCl and HBr masses were scaled based on petrological measurements from Central American Volcanic Arc (CAVA) volcanoes (Kutterolf et al., 2015, 2013), assuming a 10 % injection efficiency to the stratosphere (Krüger et al., 2015; Brenna et al., 2019). b Numbers of initial polar vortex (PV) states as in Fuglestvedt et al. (2024). c Ensemble mean.
For comparison, we use model data from Toohey et al. (2019) simulating volcanic eruptions with 17 Tg SO2 injection at 15° N in both January and July with MAECHAM5-HAM (ECHAM5-15N-Jan and ECHAM5-15N-Jul). For tropical eruptions, we calculate the ensemble mean with five members each. For NH extratropical eruptions at 64° N, two additional runs from ECHAM5-64N-Jan and ECHAM5-64N-Jul are available for comparison (this study). We also calculated the volcanic forcing from EVA (EVA-15N-Jan, EVA-15N-Jul, EVA-64N-Jan and EVA-64N-Jul). The set of experiments is summarized in Table 1.
2.3 Analysis methods
We adopt the Oceanic Niño Index (ONI; https://www.climate.gov/news-features/understanding-climate/climate-variability-oceanic-nino-index, last access: 9 May 2024) to quantify the initial ENSO state. The ONI is calculated from a 3-month running mean of the average sea surface temperature (SST) anomalies over the Niño 3.4 region covering 5° N–5° S and 170–120° W. The SST anomalies are calculated with respect to the 30-year mean of the control run without volcanic eruption. The QBO is calculated with the monthly equatorial mean zonal wind at 30 hPa between 2° N and 2° S.
We present both the ensemble members and the ensemble means of adopted variables to study the volcanic forcing and subsequent impacts. Anomalies are calculated with respect to the 30-year mean of the control run. The ensemble standard deviation is calculated to indicate the spread of the baseline ensemble experiments.
3.1 Initial atmospheric conditions control aerosol transport and volcanic forcing after tropical eruptions
Tropical eruptions have usually been thought to induce stronger surface cooling than extratropical eruptions, as SO2 and formed aerosols are transported to both the Northern and Southern hemispheres. Here, we examine how initial atmospheric conditions affect the transport and evolution of volcanic volatiles and subsequent volcanic forcing after tropical eruptions.
Figure 1a shows the latitudinal and vertical distribution of the SO2 concentration at 30 ppbv in the first month after the 15° N tropical eruptions in January. The contours reveal a range of SO2 dispersion across the six baseline ensemble members. In some simulations, SO2 is strongly contained in the tropical pipe, with stronger vertical ascent, whereas SO2 is strongly mixed into the NH mid-latitudes in others. Accordingly, we labeled the ensemble members H1 to H6 based on the ratio of poleward versus upward transport, calculated by dividing the latitude- and altitude-weighted means of the SO2 concentration in the first month over the regions poleward (20–30 hPa, 30–60° N) and upward (5–15 hPa, 0–30° N) of the injection point (dashed outline in Fig. 1a). Note that this labeling differs from Fuglestvedt et al. (2024), who labeled their ensemble members based on the stability of the PV. During the first month, filaments of high SO2 concentration are pulled towards NH mid-latitudes, as particularly evident in H5 and H6 (Fig. S1 in the Supplement). In contrast, the ensemble members with stronger upwelling exhibit stronger tropical confinement and less distribution towards the NH, as is especially exemplified in H1 (Figs. 1a, S2).
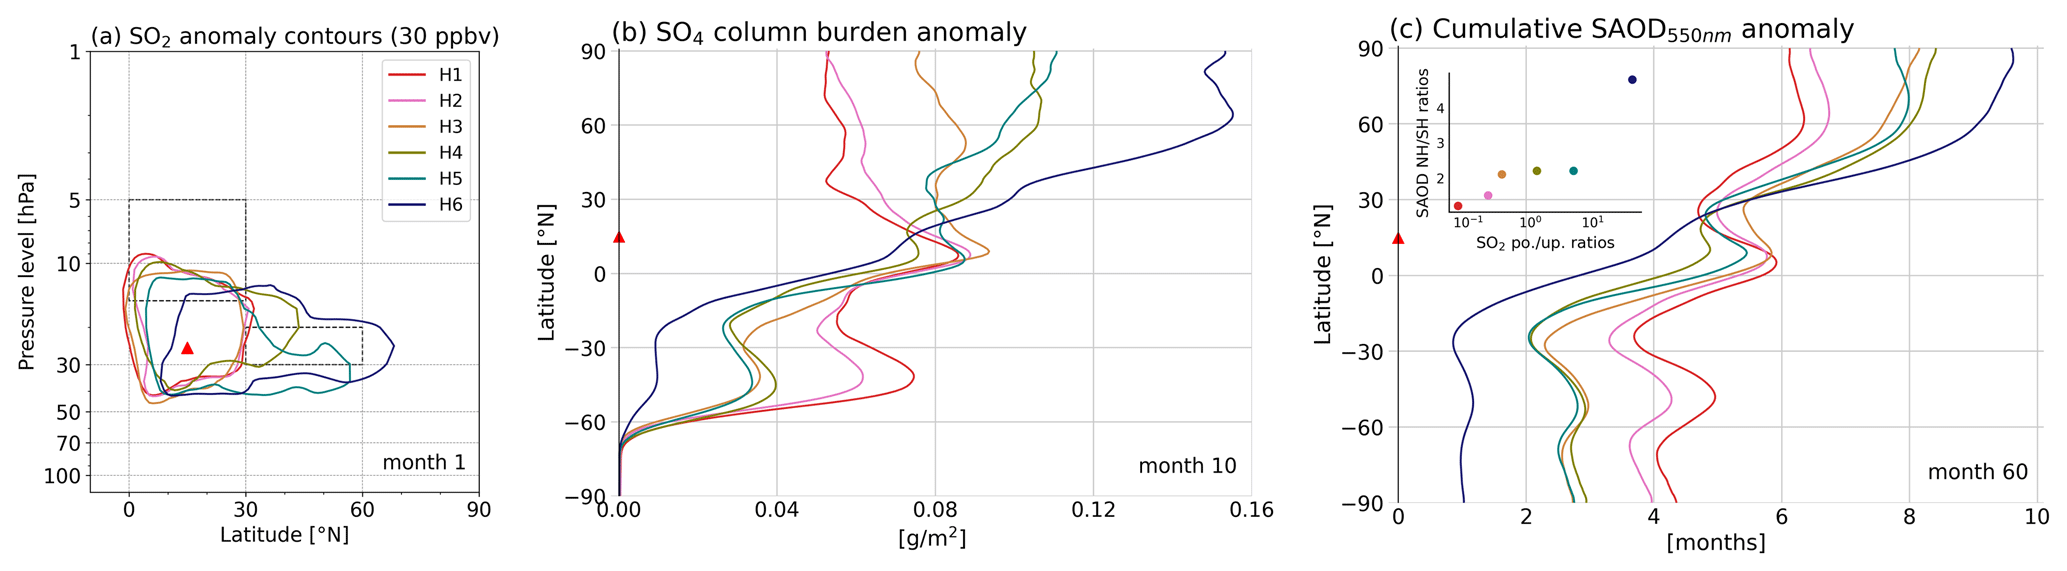
Figure 1The latitudinal and vertical distribution of the SO2 concentration anomaly at 30 ppbv in the 1st month (contour, a), the SO4 column burden anomaly in the 10th month (b) and the cumulative SAOD anomaly at 550 nm in the 60th month (c) for six members of the baseline experiment. The red triangle denotes the eruption latitude at 15° N in panels (a)–(c) as well as the injection altitude at 24 km in panel (a). The inset axis in panel (c) indicates the relationship between the poleward upward ratio of the SO2 concentration anomaly in the 1st month and the NH SH ratio of the cumulative SAOD anomaly in the 60th month.
The latitudinal distribution of SO2 in the first month modulates the subsequent latitudinal distribution of SO4. Figure 1b shows the latitudinal distribution of the SO4 column burden in the 10th month for the six ensemble members. H6 exhibits a greater transport of SO4 to the NH high latitudes between 30 and 90° N, compared with the other members, particularly when contrasted with H1 and H2. Differences in the transport of SO2 and SO4 result in differences in cumulative volcanic forcing in the NH and Southern Hemisphere (SH) high latitudes among the ensemble members (Fig. 1c). H6 shows a pronounced asymmetric volcanic forcing with large meridional forcing differences, e.g., a 60-month cumulative SAOD difference of up to 8.4 months between the NH and the SH. In contrast, H1 exhibits a relatively symmetric volcanic forcing between the hemispheres. Here, even with identical eruption source parameters, tropical volcanic eruptions give rise to differing degrees of hemispheric asymmetry of the volcanic forcing solely due to variations in initial atmospheric conditions. The inset scatterplot clearly illustrates a correlation between the poleward upward ratio of SO2 in the first month and the hemispheric asymmetry of the cumulative SAOD over 60 months. For tropical eruptions, the initial atmospheric conditions control the transport of SO2 from the first month, impact the formation and transport of SO4 in the coming months, and determine the latitudinal distribution of the sulfate aerosol and subsequent volcanic forcing.
The initial atmospheric conditions control not only the SO2 and sulfate aerosol transport but also the volcanic halogen transport. More total chlorine and total bromine are transported to NH high latitudes in H6 compared with H2 and H1 (see Sect. 3.2.3).
The control of initial atmospheric conditions on aerosol and halogen transport and subsequent volcanic forcing is not only evident for tropical eruptions but also for NH extratropical eruptions, although with a different dominating factor. For NH extratropical eruptions at 64° N in January, as shown in our related paper by Fuglestvedt et al. (2024), the initial stability of the PV strongly influences the lifetime of SO2 and the effective radius of SO4 by controlling the dispersion of injected volcanic gases.
3.2 Comparison of tropical and NH extratropical volcanic eruptions with sulfur and halogen injection
3.2.1 The sulfur burden and aerosol evolution determine volcanic forcing
Figure 2 shows time series of the global and NHET total sulfur burden and stratospheric aerosol optical depth (SAOD). The global total sulfur burden initially displays a plateau for both tropical (H-15N-Jan, solid lines) and extratropical (H-64N-Jan, dashed lines) eruptions, followed by declines beginning approximately 9 and 5 months after tropical eruptions and NH extratropical eruptions, respectively (Fig. 2a). The difference in the timing of the start of the decay in sulfur burden between tropical and extratropical eruptions suggests differences in transport processes. Specifically, the NHET total sulfur burden from tropical eruptions exhibits a sharp increase within the initial 4–5 months, followed by a decelerated increase, ultimately peaking at 12–14 months (solid lines in Fig. 2b). Conversely, a continuous decline is visible due to aerosol confinement in the NHET following NH extratropical eruptions (dashed lines in Fig. 2b).
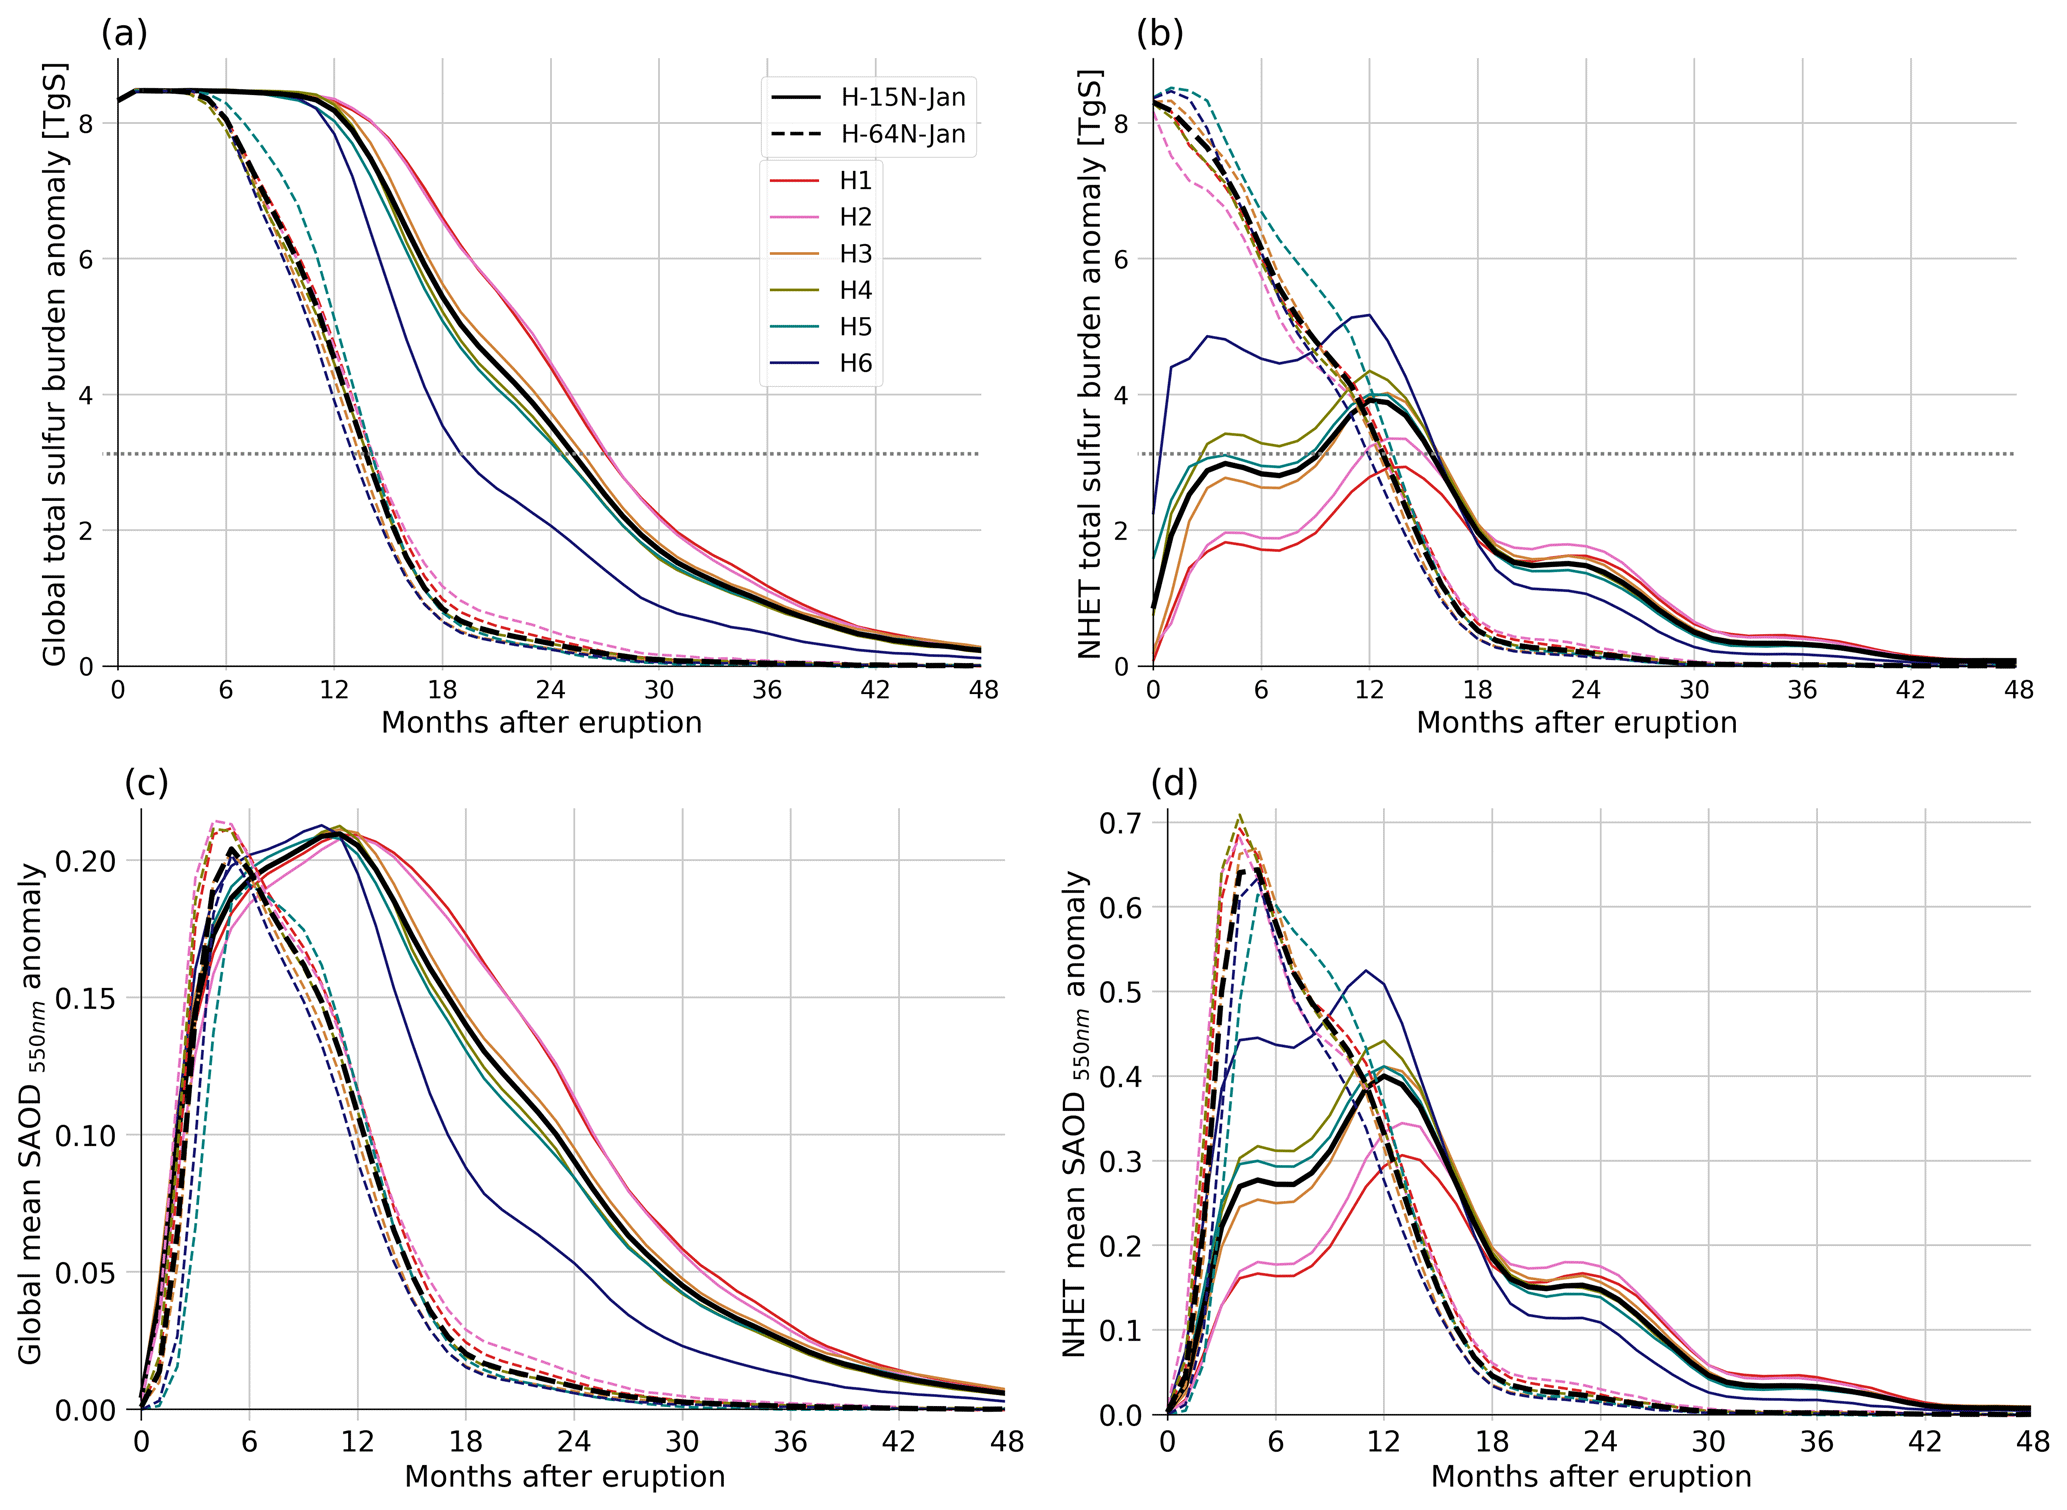
Figure 2Global (a, c) and Northern Hemisphere extratropics (NHET, 30–90° N; b, d) total sulfur burden (a, b) and stratospheric aerosol optical depth (SAOD; c, d). Solid lines and dashed lines denote tropical and NH extratropical eruptions, respectively. Different colors represent different ensemble member realizations. The black lines represent the ensemble means of the baseline experiments. The dotted horizontal gray line in panel (a) represents the e folding of injected sulfur. Note the different axes in panels (c) and (d).
As shown in Fig. 1, the initial atmospheric conditions control the transport of volcanic materials. As a result, the progression of the total sulfur burden exhibits a large spread among the six ensemble members of tropical eruptions (Fig. 2). Four months after the eruption, the NHET total sulfur burden peaks at 1.8 and 4.8 Tg in H1 and H6, respectively. Consequently, 8–10 months later, the peak NHET total sulfur burden is 79 % higher in H6 (5.2 Tg) than in H1 (2.9 Tg) (Fig. 2b). At the same time, the global total sulfur burden exhibits a 42 % longer e-folding time in H1 compared with H6, with respective e-folding times of 27 and 19 months (Fig. 2a).
SO2, SO4, SO4-mass-weighted mean effective radius (Reff) and SAOD evolution are tightly connected and modulated by initial atmospheric conditions (Fig. 2 and Fig. S3 and Sect. S1 in the Supplement). The volcanic forcing is closely related to the sulfur burden, as shown by a similar evolution of the SAOD (Fig. 2c, d) and SO4 (Fig. S3), although fluctuations occur due to variations in effective radius (Fig. S3) with varying scattering efficiency (Lacis, 2015). The maximum global-mean SAOD shows a similar magnitude (∼ 0.2) after tropical and NH extratropical eruptions, but it takes longer to reach the maximum and the forcing lasts longer after tropical eruptions compared with NH extratropical eruptions (Fig. 2c). Due to the wider spread of aerosols, tropical eruptions result in a smaller and delayed peak in the NHET-mean SAOD but a longer-lasting forcing compared with NH extratropical eruptions, after which aerosols are confined in the NHET region (Fig. 2d).
3.2.2 Climate impact
Figure 3 shows the surface temperature response in the ensembles of tropical and NH extratropical eruptions. Global-mean surface temperature shows a maximum cooling of 0.7 K within 23 months, returning to the control run's 2σ-variability range 42 months after tropical eruptions (solid black line in Fig. 3a). Conversely, a maximum cooling of 0.8 K occurs 9 months after extratropical eruptions (dashed black line in Fig. 3c), with temperatures returning to the 2σ-variability range within 24 months. The NHET-mean surface temperature displays a maximum cooling of 2.0 K within 22 months, returning to the 2σ-variability range 37 months after tropical eruptions (solid black line in Fig. 3b). In contrast, a maximum cooling of 2.6 K occurs within 9 months and recovers within 25 months after extratropical eruptions (dashed black line in Fig. 3d). Extratropical eruptions lead to only slightly stronger global-mean cooling but much more pronounced NHET-mean surface cooling than tropical eruptions. However, both the global-mean and NHET-mean surface temperatures show a longer-lasting cooling after tropical eruptions compared with extratropical eruptions.
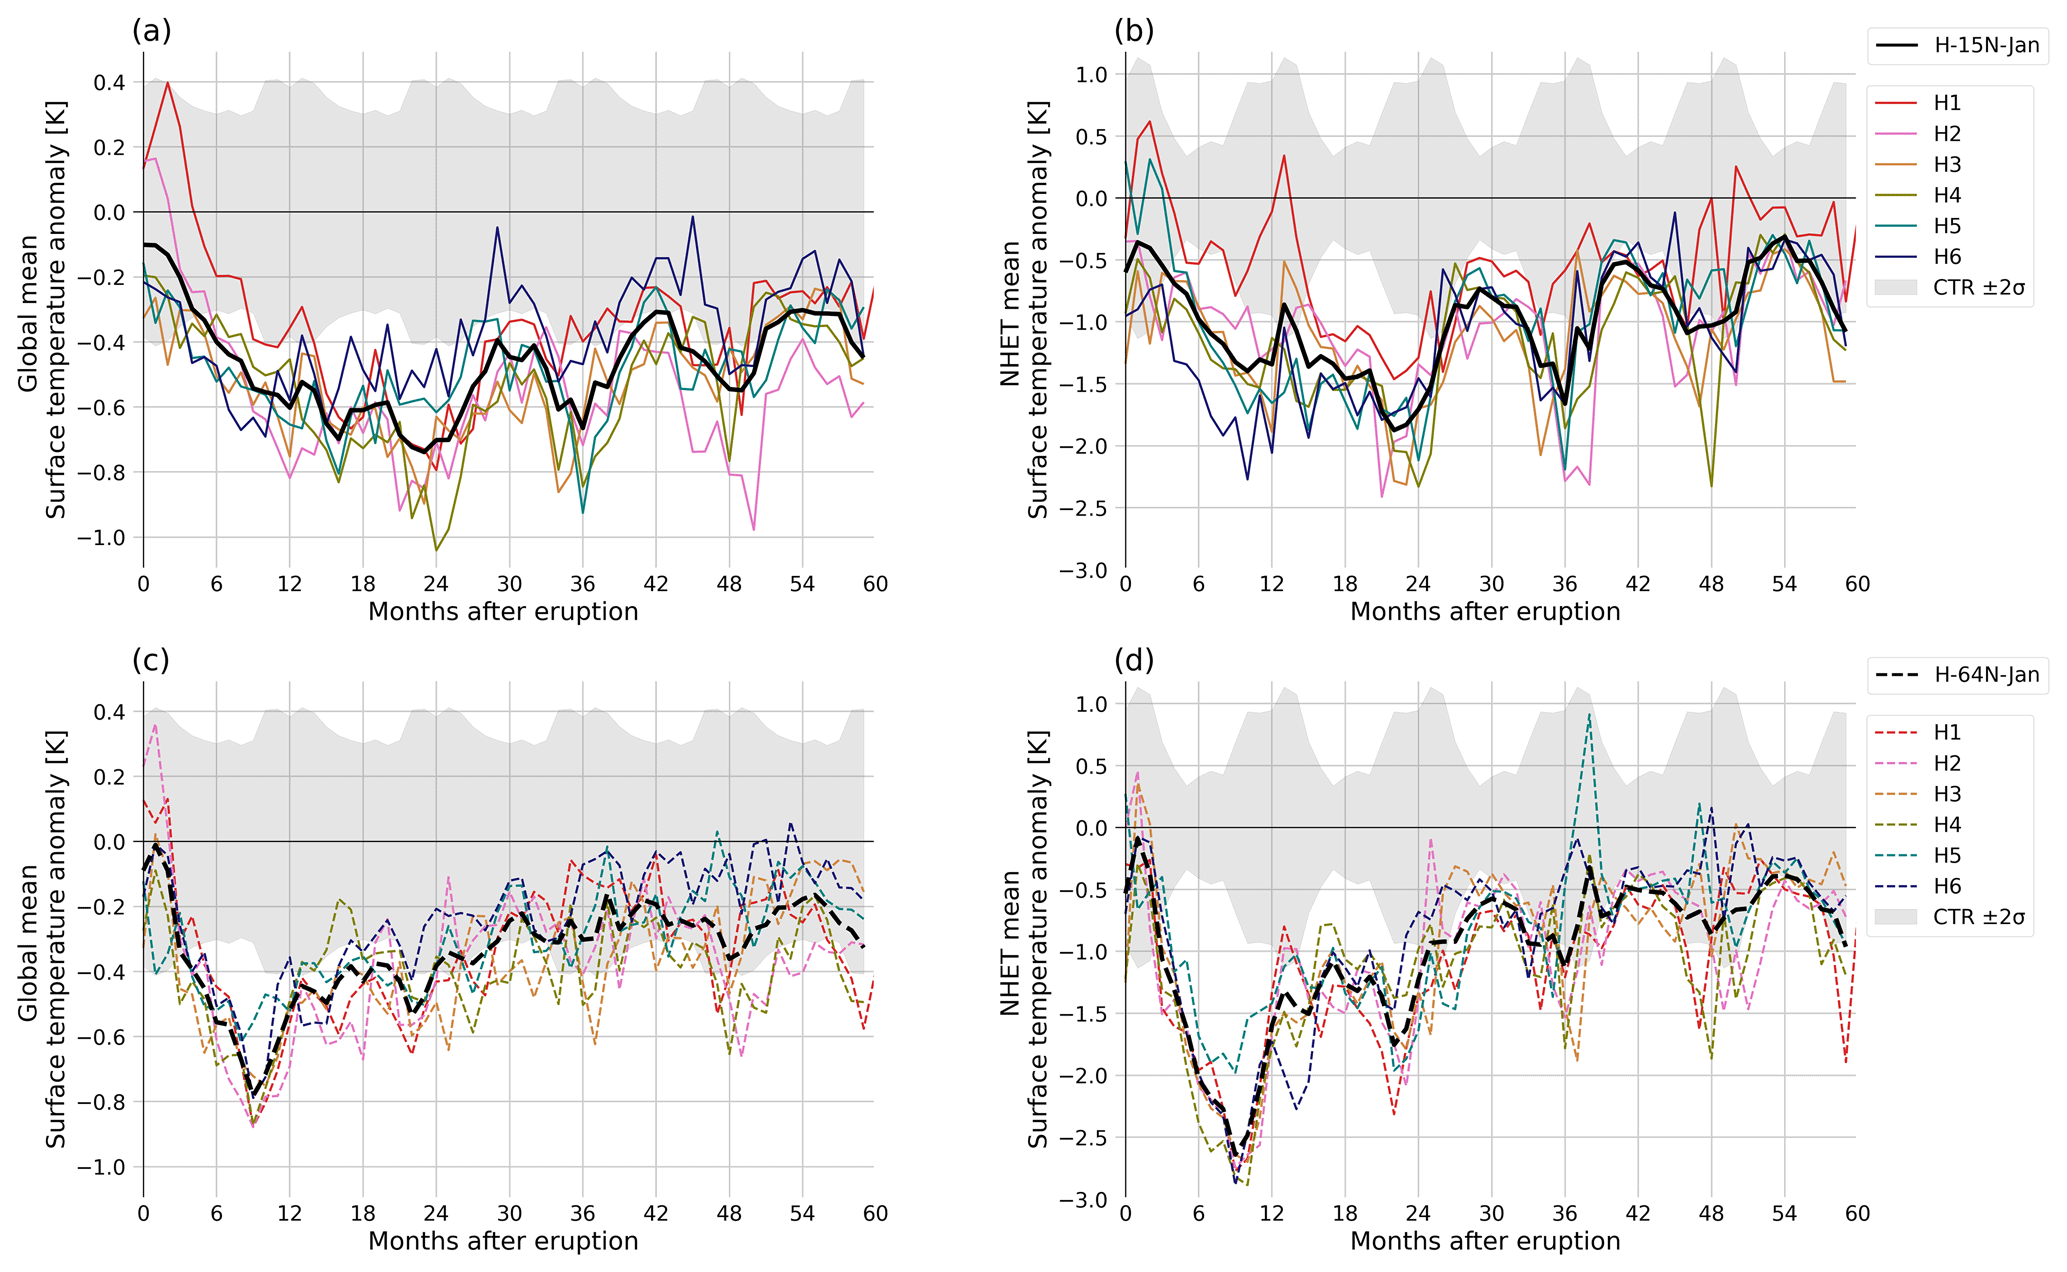
Figure 3Global (a, c) and Northern Hemisphere extratropics (NHET; b, d) mean surface temperature anomaly. Solid lines and dashed lines denote tropical (a–b) and NH extratropical (c–d) eruptions, respectively. Different colors represent different ensemble member realizations. The black lines represent the ensemble means of the baseline experiments. The gray shading represents 2 standard deviations of the control run. Note the different y axes between the left and right panels.
The eruption season plays an important role in the temperature variation. When our simulated volcanoes erupt in January, both global-mean and NHET-mean SAOD peak around 12 months after tropical eruptions (Fig. 2c, d). During boreal winter, less incoming solar radiation reaches the NH, suspending the reduction in net radiation at the top of the atmosphere (TOA) (Fig. S4a, b) and surface temperature. Consequently, the cooling peaks in the second year after tropical eruptions (Fig. 3a, b). Both global-mean and NHET-mean SAOD peak 5 months after NH extratropical eruptions (Fig. 2g, h). This occurs during the boreal summer when the NH experiences its highest solar radiation influx. This synchronization between the largest volcanic forcing and the largest incoming solar radiation leads to the largest reflection of solar radiation (not shown) and a subsequent decrease in the TOA net radiation (Fig. S4c, d), thus resulting in the strongest surface cooling in the first year (Fig. 3c, d).
The surface cooling persists longer after tropical eruptions than NH extratropical eruptions, with variations among the members. Different surface temperature responses in different ensemble members are related to the transport of volcanic volatiles under different initial atmospheric conditions. This is pronounced in the NHET-mean surface temperature responses after tropical eruptions (Fig. 3b). The NHET surface cooling is stronger 5–12 months after the eruption in H6 compared with H1, reflecting the distribution of SO4 into the NH (Fig. 2d).
3.2.3 Halogen–ozone impact
Figure 4 shows the evolution of the total inorganic halogen burden and the ozone response. Injected HCl and HBr (time series in Fig. S5) in the stratosphere reacts with OH to produce chlorine and bromine radicals, reacting with ozone in a catalytic destruction cycle (Solomon, 1999). The global total inorganic chlorine burden shows an e-folding time of 48 and 18 months after tropical and NH extratropical eruptions, respectively, including a plateau at the beginning (Cly in Fig. 4a). Global total inorganic bromine burden (Bry in Fig. 4c) increases for approximately 14 and 6 months after tropical and NH extratropical eruptions, respectively, and it then decreases with e-folding times of 54 and 22 months, respectively. NHET Cly and Bry burdens (solid lines in Fig. 4b and d, respectively) increase for approximately 14 months, followed by a continuous decrease with a slight seasonal variation, indicating the transport of halogens into the NHET after tropical eruptions. Halogens are concentrated in the NHET after NH extratropical eruptions, as NHET Cly and Bry burdens (dashed lines in Fig. 4b and d, respectively) decrease immediately and continuously except for slight variations during the first months. Different ensemble members of tropical eruptions show large differences in the magnitude of the NHET Cly and Bry burden, with a larger peak in H6 than in H1 and H2. This indicates that the control of initial atmospheric conditions on SO2 and aerosol transport is also present for halogen transport. The longer transport time to NH high latitudes after tropical eruptions also contributes to a longer lifetime of both the global and NHET Cly and Bry burden, compared with NH extratropical eruptions (Fig. 4a–d).
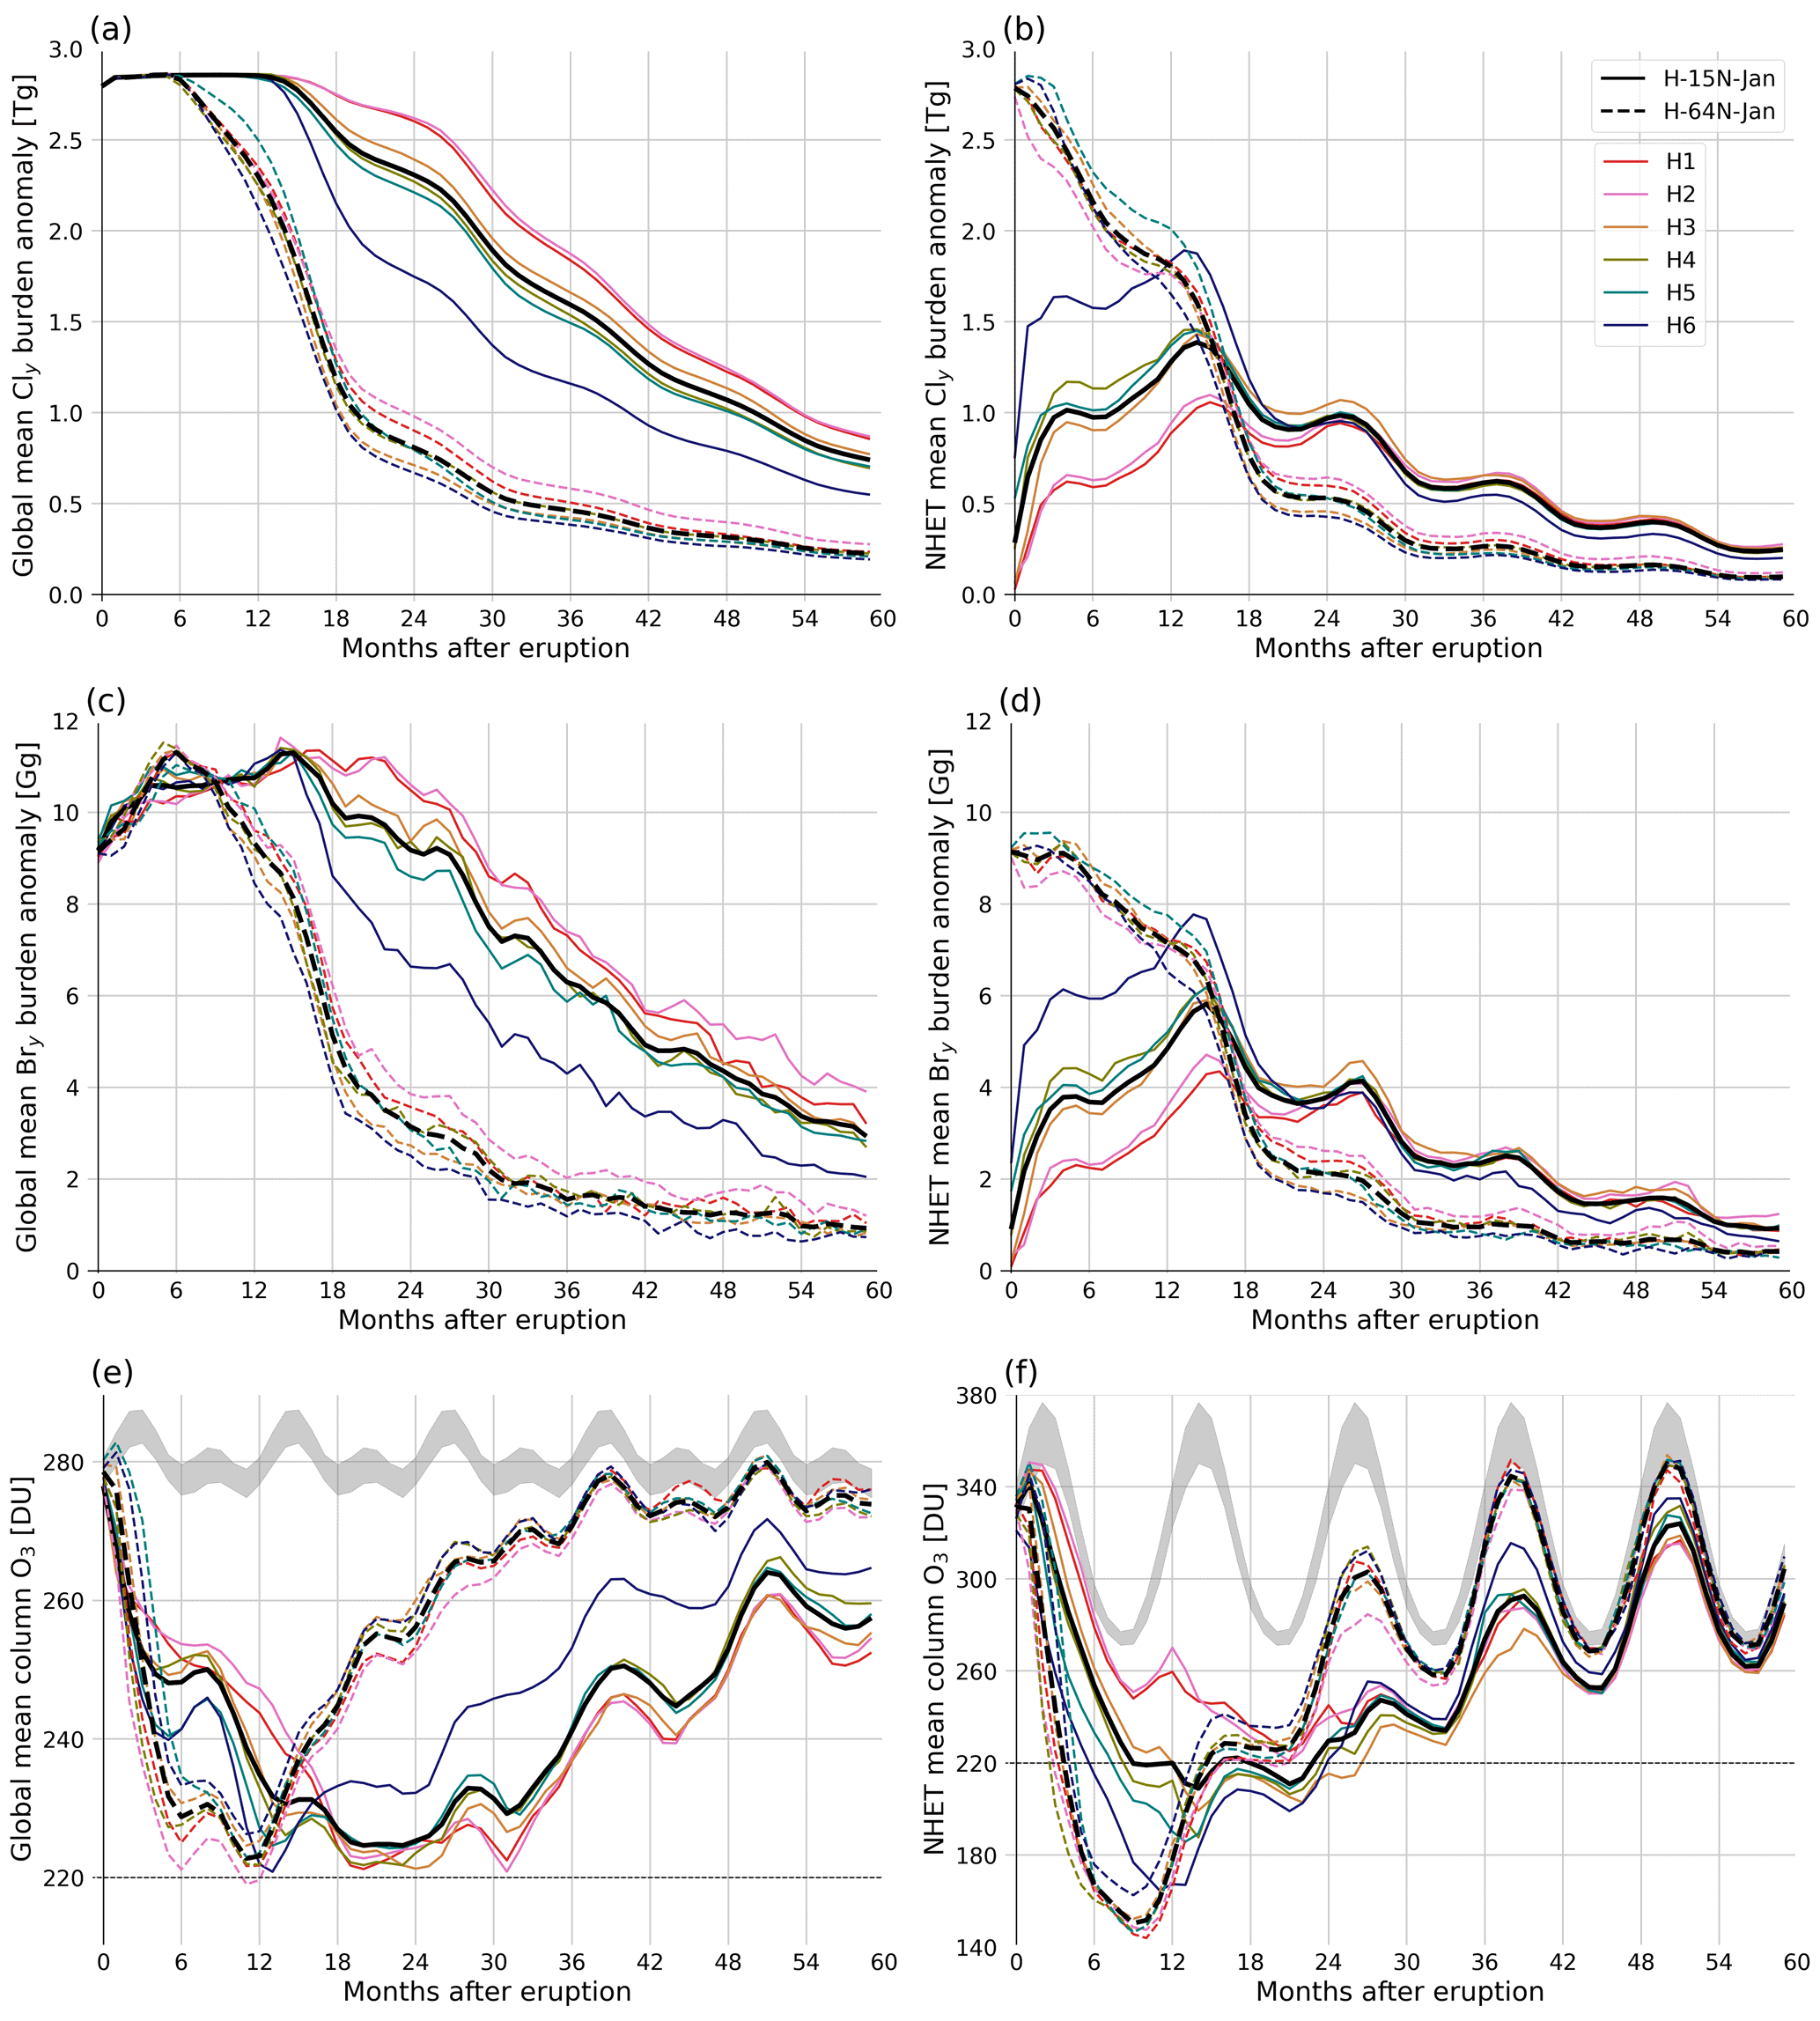
Figure 4Global (a, c, e) and Northern Hemisphere extratropics (NHET; b, d, f) total inorganic chlorine (; a, b) and total inorganic bromine (; c, d) burden anomaly and global and NHET mean column O3 (e, f). Solid lines are variations after tropical eruptions, while dashed lines are variations after NH extratropical eruptions. Different colors represent different ensemble member realizations. The black lines represent the ensemble means of the baseline experiments. The dotted horizontal gray line in panels (a) and (c) represents the e folding of injected halogens. The gray shading in panels (e) and (f) represents 2 standard deviations of the control run.
In response to the eruptions with co-injection of sulfur and halogens, global-mean and NHET-mean column ozone decreases (Fig. 4e, f). Compared to NH extratropical eruptions, tropical eruptions lead to a similar maximum but a delayed peak and longer-lasting global-mean ozone depletion, which lasts over 5 years (Fig. 4e). Due to the confinement of halogens in the NHET region, NH extratropical eruptions lead to a stronger NHET-mean ozone depletion than tropical eruptions, but the ozone depletion lasts longer after tropical eruptions compared with NH extratropical eruptions. Notably, the NHET-mean column ozone drops below 220 DU (Dobson units), projecting NH ozone hole risks after both tropical and NH extratropical eruptions (Fig. 4f). A larger NHET halogen burden (Fig. 4b, 4d) leads to a stronger NHET-mean ozone depletion in H6 than in H1 and H2 after tropical eruptions. Enhanced northward transport of halogens leads to faster removal as well as a lower availability of halogens in the tropics and Southern Hemisphere. Thus, the global-mean halogen burden decreases faster in H6 than in H1 and H2 (Fig. 4a–d). This leads to earlier depletion and recovery of ozone over both the globe and NHET in H6 than in H1 and H2 (Fig. 4e, f).
4.1 Control of initial atmospheric conditions on the transport of volcanic volatiles
We interpret the control of the initial atmospheric conditions on the transport of volcanic volatiles after tropical eruptions to be related to the secondary meridional circulation associated with the QBO (Baldwin et al., 2001) and the “leaky pipe” concept of stratospheric circulation in the tropics (Neu and Plumb, 1999). Figure 1 illustrates that H1 and H2 exhibit enhanced upward transport of SO2, as indicated by a small ratio of poleward upward transport in contrast to H5 and H6 with a larger poleward transport (a large poleward upward ratio). This stronger leak of SO2 out of the tropical pipe (for H5 and H6 in contrast to H1 and H2) is related to a stronger stratospheric secondary meridional circulation with a larger temperature contrast between tropical and NH mid-latitudes (Fig. S6). As pointed out by Ribera et al. (2004), during a strong westerly QBO phase, the enhanced ascent of air in the stratosphere is associated with a cooling anomaly in the equatorial area between 15° S and 15° N, while an opposite warming anomaly in the mid-latitudes between 15 and 55° N is related to an enhanced adiabatic sinking. This is reflected in our model results following tropical eruptions (Fig. S6). In this study, we conducted experiments with a westerly QBO phase at 30 hPa, accompanied by an easterly phase above (Fig. S7). The differences among the ensemble members, particularly regarding the asymmetry of volcanic forcing, might be amplified if varying initial QBO states are considered, such as including a westerly shear.
The control of initial atmospheric conditions on the transport of volcanic volatiles is also evident after NH extratropical eruptions – in this case, primarily controlled by the initial PV state. The northward transport and lifetime of SO2 increases from members 1 to 6 (Fuglestvedt et al., 2024) with increasing initial PV stability. Notably, the order of the ensemble members differs between tropical and NH extratropical eruptions, underlining the different factors controlling the transport of volcanic volatiles following tropical and NH extratropical eruptions. However, in both this study and Fuglestvedt et al. (2024), the ensembles exhibit less northern poleward transport of SO2 in the first to fourth members compared with the fifth and sixth members. H1 and H2 correspond to initial El Niño states, whereas H3 and H4 correspond to neutral ENSO states. The latter two members, H5 and H6, correspond to La Niña states (Table 1). The labeling of the ensemble members, based on the first month's SO2 transport, may correlate with the ENSO state and would also provide insights into the influence of ENSO on the PV. As highlighted in van Loon and Labitzke (1987), El Niño events are typically linked to a warming and weakening of the PV, along with a cooling in the tropical lower stratosphere. Nevertheless, a simultaneous injection of volcanic gases can counteract this ENSO-related cooling, resulting in unusual tropical stratospheric warming. In contrast, La Niña events are often connected with a strengthening of the PV. Future studies with large ensemble simulations should be conducted to investigate the ENSO–PV–volcanic eruption connection.
Overall, we show that initial atmospheric conditions already impact the distribution of volcanic materials in the first month as well as the following evolution and distribution of volcanic aerosols, ultimately shaping the volcanic forcing. Our results reveal the potential to predict the latitudinal distribution of volcanic volatiles and assess the subsequent volcanic forcing and associated climate and environmental impacts after the first month of tropical and NH extratropical eruptions. More models and large ensembles are needed to corroborate these findings and to test how different initial climate states, such as ENSO and the QBO, could impact the distribution of volcanic materials, volcanic forcing and subsequent responses for tropical and extratropical eruptions. The future phase of the Model Intercomparison Project on the climatic response to Volcanic forcing (VolMIP) (Zanchettin et al., 2022) holds potential as a valuable resource for addressing these research needs.
4.2 Comparisons between tropical and NH extratropical eruptions
Based on tree ring proxy data and MAECHAM5-HAM model simulations, Toohey et al. (2019) concluded that, compared with NH extratropical eruptions, tropical eruptions lead to weaker maximum volcanic forcing over the NHET for a given injection height with sulfur-only injection. Figure 5 presents an overall summary of the comparison between tropical and NH extratropical eruptions regarding their maximum volcanic forcing and impacts on surface temperature and ozone. Our fully coupled model results confirm the results from Toohey et al. (2019), also when co-injecting sulfur and halogens and resolving interactive atmospheric chemistry for the simulated volcanic eruptions. However, when considering the time-to-maximum and the lifetime, tropical eruptions cause longer-lasting volcanic forcing and surface cooling compared with NH extratropical eruptions, over both the globe and NHET. The delayed response time after tropical eruptions results from the northward transport of stratospheric aerosols (Fig. 2). Sulfur was the only injected volcanic volatile and OH was prescribed in MAECHAM5-HAM. Thus, the timing difference is lacking for eruptions at different latitudes in Toohey et al. (2019). Including interactive atmospheric chemistry and OH in models can be important in order to simulate the timing of volcanic aerosol evolution, volcanic forcing and subsequent impact, as previously also noted by Mills et al. (2017) and Clyne et al. (2021).
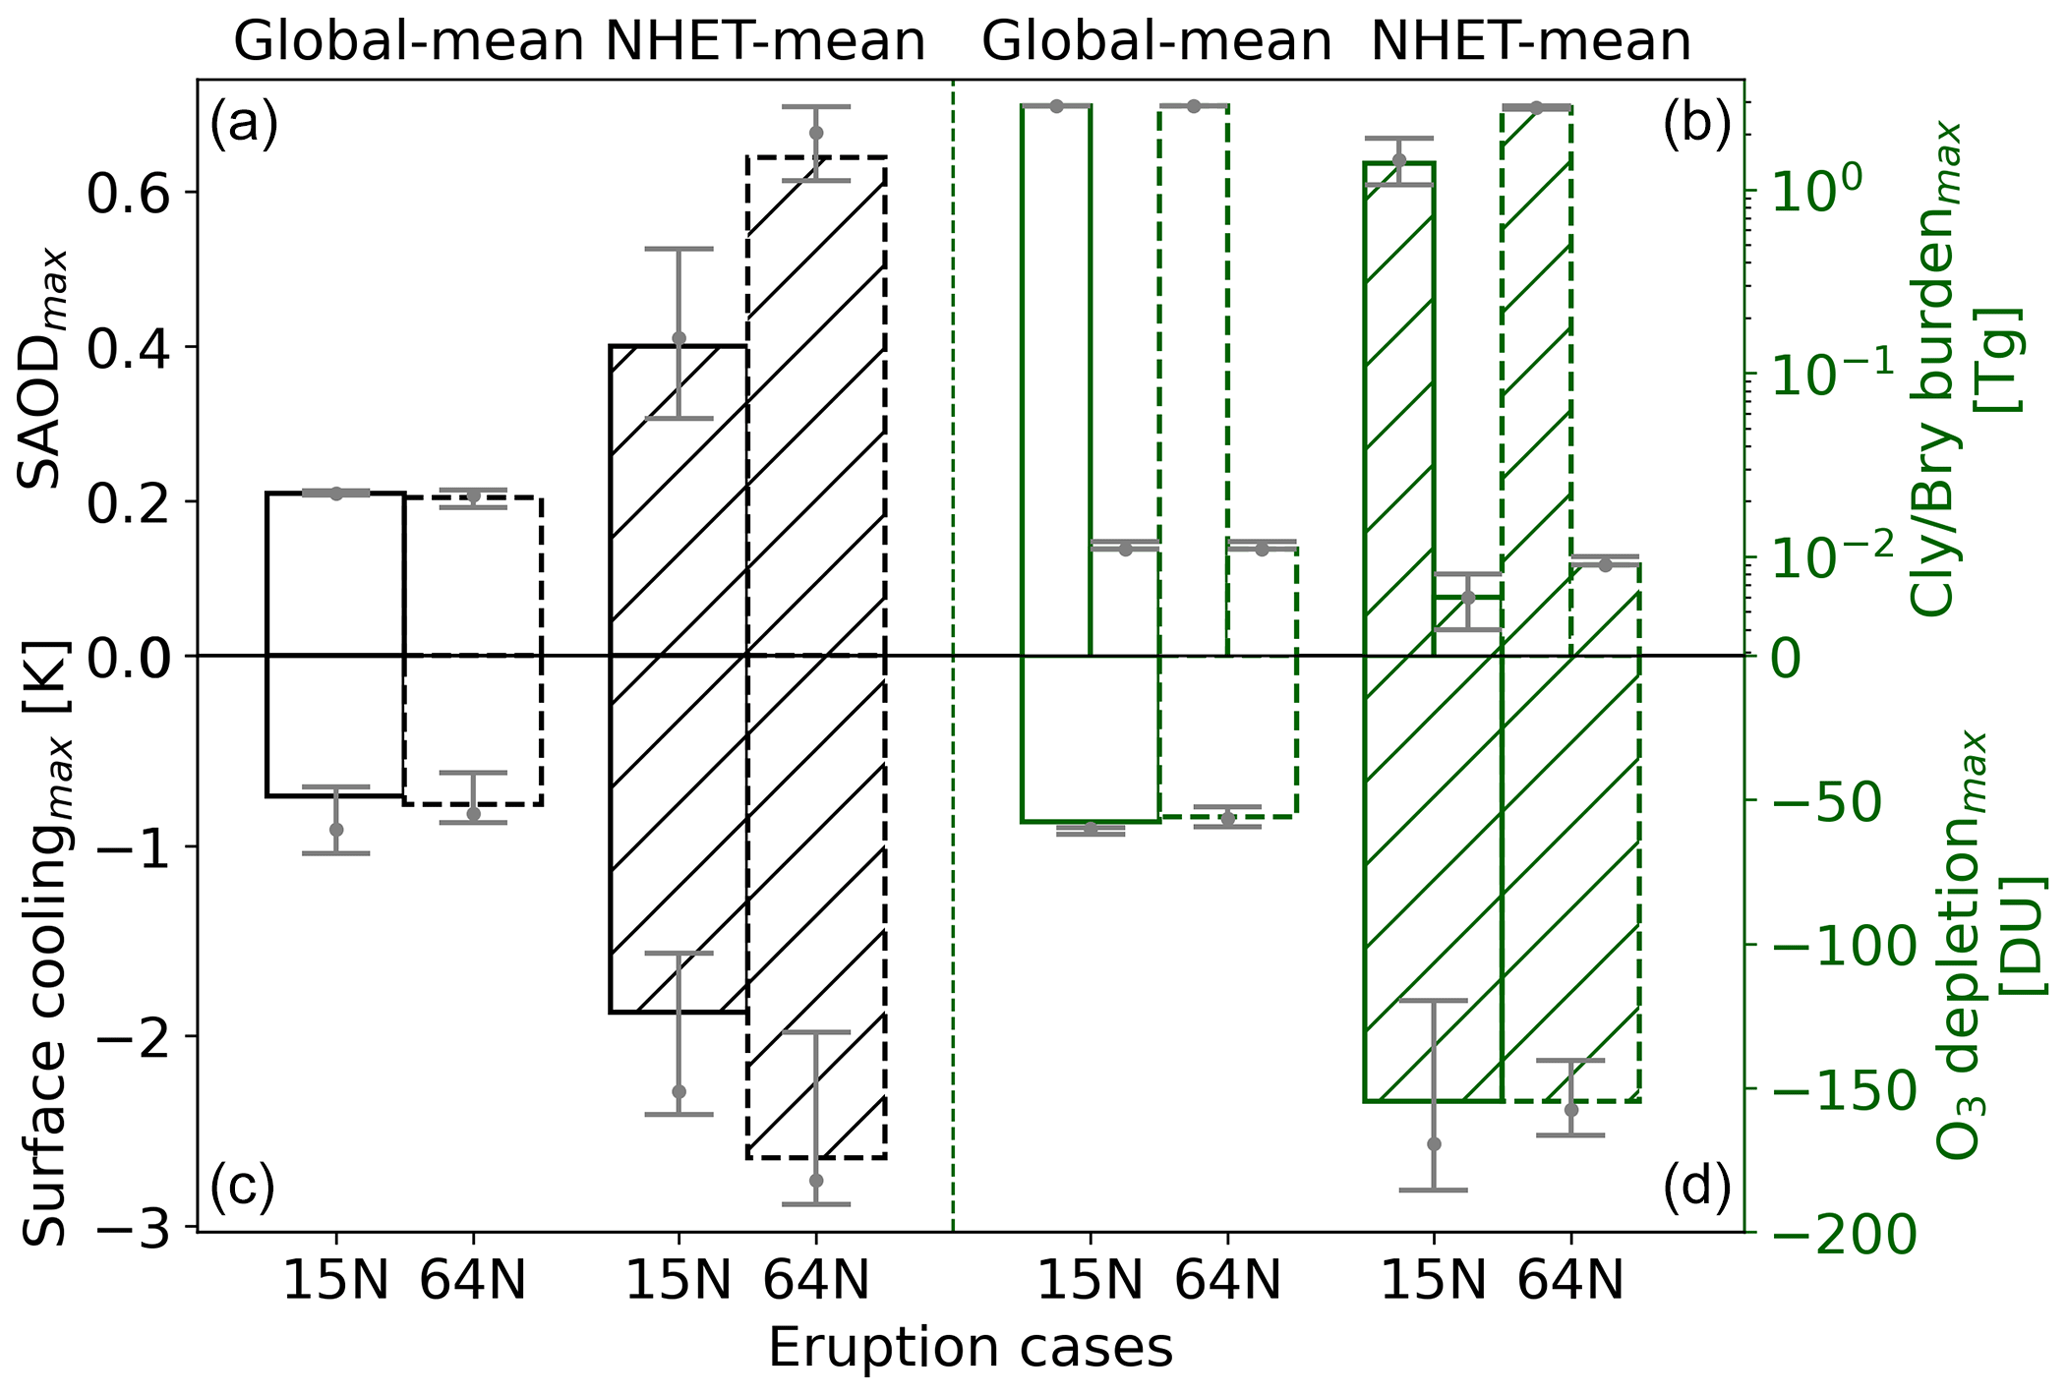
Figure 5Summary of global-mean and NHET-mean maximum volcanic forcing (a), surface cooling (c), halogen burden (b) and ozone depletion (d) between tropical and NH extratropical volcanic eruptions at 15° N (solid bars) and 64° N (dashed bars), respectively. In panel (b), the high and low bars are Cly and Bry, respectively. The gray error bars and gray dots indicate the respective ranges and medians of the six ensemble members of the baseline experiments.
4.3 Sensitivity to varying eruption source parameters
Here, we discuss how sensitive our results are to varying eruption source parameters. Figure 6 shows the global-mean and NHET-mean SAOD, surface temperature and column ozone variations after tropical and NH extratropical eruptions with different volcanic volatile injections and in different seasons. We focus on testing sulfur-only injections and eruptions in July (see Table 1). The simulated maximum global-mean SAOD is 5 % higher in H-15N-Jan than in S-15N-Jan and 10 % higher in H-15N-Jul than in S-15N-Jul (Fig. 6a; H refers to co-injection of sulfur and halogens and S refers to sulfur-only injection). The percentage change in July eruptions closely aligns with the findings of Staunton-Sykes et al. (2021) for a 10 Tg SO2 injection in July, revealing an 11 % higher peak global-mean SAOD when sulfur and halogens were co-injected compared with sulfur-only injection. However, this relationship is also dependent on the eruption latitude. After NH extratropical eruptions, the difference in the global-mean SAOD is limited and differs after eruptions in different seasons (Fig. 6c). The maximum NHET-mean SAOD (Fig. 6b, d) and surface temperature response (Fig. 6e–h) also vary among different experiments with varying volcanic volatiles as well as eruption latitudes and eruption seasons. Nonetheless, these responses are mostly within the range of H-15N-Jan ±2σ and H-64N-Jan ±2σ, indicating a potentially larger impact due to varying initial atmospheric conditions than tested eruption source parameters on the volcanic forcing and subsequent surface cooling.
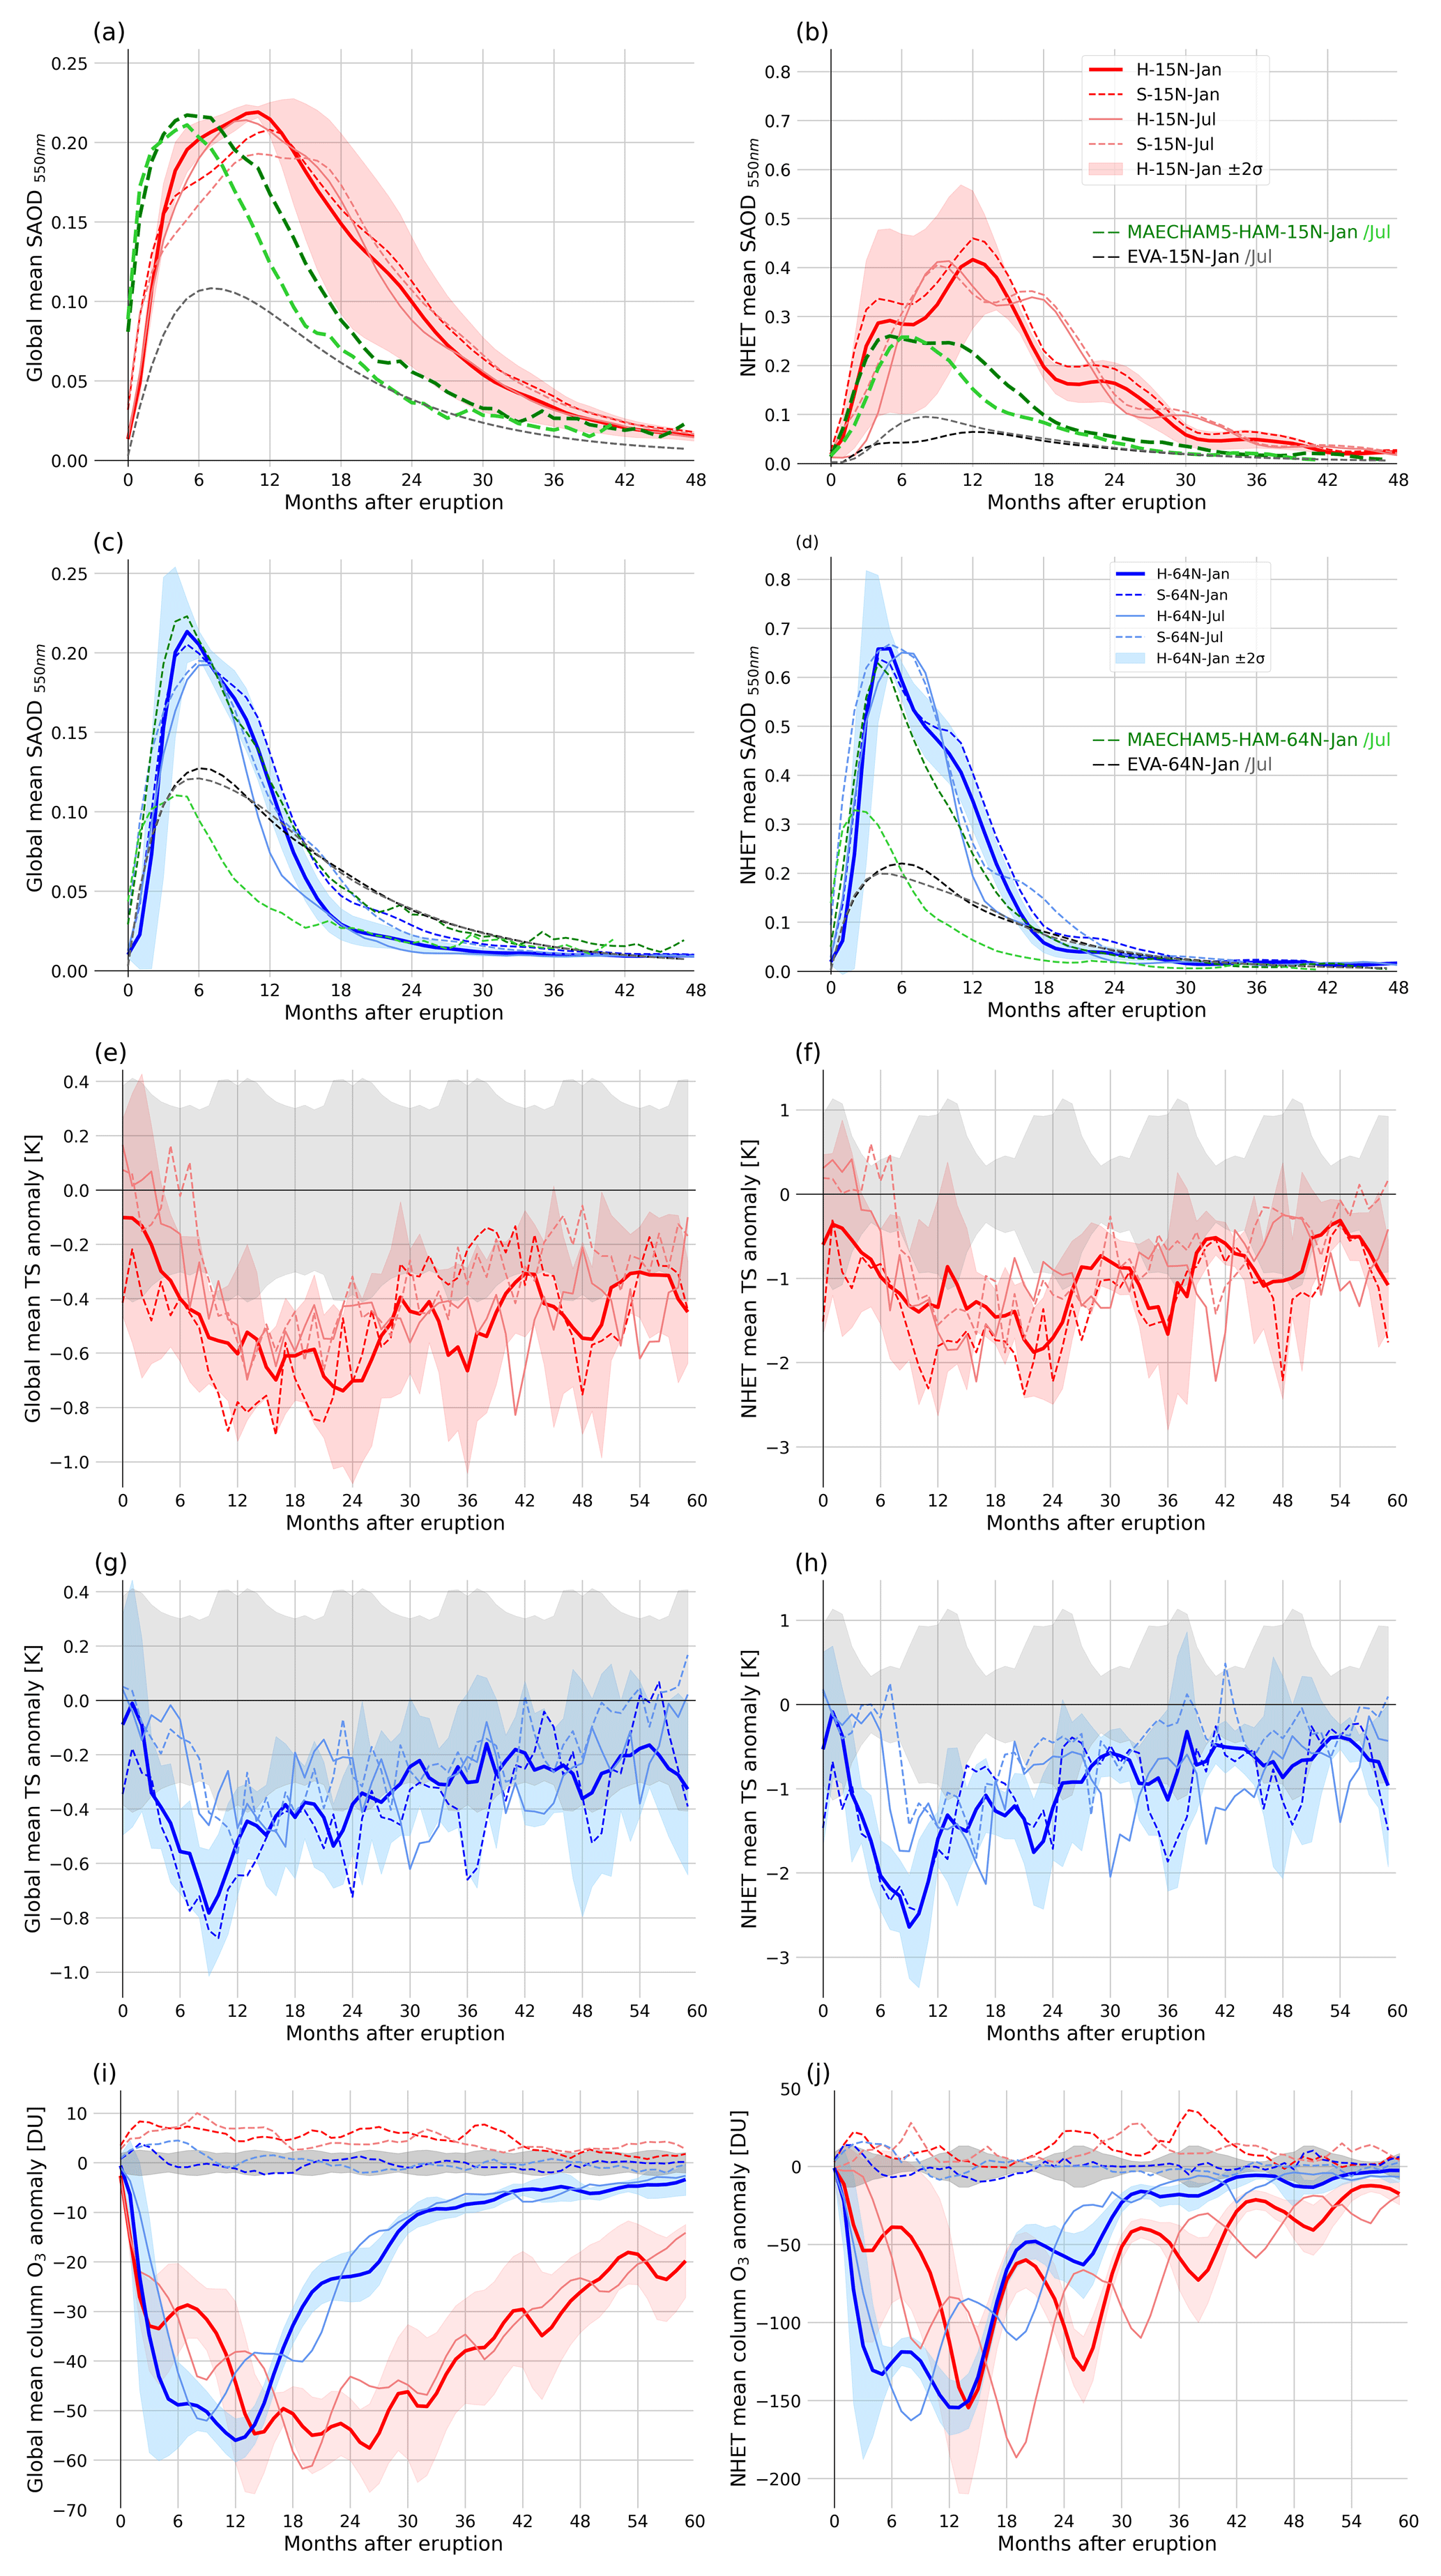
Figure 6Global (a, c, e, g, i) and Northern Hemisphere extratropics (NHET; b, d, f, h, j) mean stratospheric aerosol optical depth (SAOD) at 550 nm (a–d), surface temperature anomaly (e–h) and column ozone anomaly (i, j) after tropical and NH extratropical eruptions. The thick lines and shading denote the ensemble means and 2 standard deviations for the six members' baseline experiment. The thin lines show the sensitivity tests. H refers to the co-injection of sulfur and halogens, whereas S refers to sulfur-only injection. Red and blue colors represent variations after tropical and NH extratropical eruptions, respectively. The solid and dashed lines denote simulated volcanic eruptions with co-injection of sulfur and halogen and sulfur-only injection, respectively. The gray shading in panels (e)–(j) represents 2 standard deviations of the control run. Note the different y axes between the left and right panels.
Varying volcanic volatiles, particularly with or without halogen injection, has a significant impact on stratospheric ozone under pre-industrial conditions. In line with Brenna et al. (2020), volcanic eruptions with co-injection of sulfur and halogens result in substantial ozone depletion (solid lines), whereas volcanic eruptions with sulfur-only injection (dashed lines) slightly increase global and NHET ozone levels (Fig. 6i, j). Co-injection of sulfur and halogens leads to similar maximum ozone depletion after tropical and NH extratropical eruptions in January (H-15N-Jan and H-64N-Jan), but a stronger ozone depletion occurs after the tropical eruption compared with the NH extratropical eruption in July (H-15N-Jul and H-64N-Jul). For eruptions at the same latitude, the maximum ozone loss is larger in H-15N-Jul than in H-15N-Jan but smaller in H-64N-Jul than in H-64N-Jan. The increase in ozone following sulfur-only injections is stronger after tropical eruptions compared with NH extratropical eruptions. Tropical sulfur-only eruptions lead to significant ozone increases (S-15N-Jan and S-15N-Jul), while ozone responses after NH extratropical eruptions (S-64N-Jan and S-64N-Jul) mostly fall within the range of 2 standard deviations of the control run. The impact of tested varying source parameters is generally smaller than the impact of varying initial atmospheric conditions, as the sensitivity experiments mostly fall within the modeled range of H-15N-Jan ±2σ and H-64N-Jan ±2σ. Additional studies with ensembles for the sensitivity tests are needed to further clarify the role of initial atmospheric conditions and varying eruption source parameters in affecting volcanic forcing and subsequent climate and environmental impacts.
In this study, we focused on the co-injection of sulfur and halogens in our baseline experiments and conducted sensitivity tests to examine the impact of sulfur-only injection. Volcanic ash and other volatiles, such as water vapor, can also be injected (LeGrande et al., 2016; Millán et al., 2022; Zhu et al., 2020), which can alter the composition, distribution and volcanic forcing. However, whether these volcanic materials influence the maximum, time-to-maximum and lifetime of volcanic forcing in combination with sulfur and halogen injections has not been studied yet. Future simulations that incorporate these volcanic materials are needed to investigate how they affect the results shown in this study.
4.4 Model dependency
Clyne et al. (2021), Marshall et al. (2018) and Quaglia et al. (2023) showed that the impacts of varying source parameters on volcanic forcing and related climate responses are model dependent. Here, we discuss our model results for sulfur-only injection experiments with MAECHAM5-HAM and EVA (Fig. 6). After tropical eruptions, similar maximum global-mean SAOD emerges after January and July eruptions in MAECHAM5-HAM (green lines) but peaks at least 6 months earlier than in CESM2-WACCM6 (red dashed lines in Fig. 6a). This may relate to the interactive OH in CESM2-WACCM6 (Fig. S8). Maximum NHET-mean SAOD in MAECHAM5-HAM is smaller compared with CESM2-WACCM6 (Fig. 6b). For NH extratropical eruptions, maximum global and NHET-mean SAOD is much smaller after the July eruption compared with the January eruption in MAECHAM5-HAM, but limited differences are shown in CESM2-WACCM6 (Fig. 6c, d). In comparison, EVA (gray lines) generally produces smaller SAOD compared with CESM2-WACCM6 and MAECHAM5-HAM, except for that in MAECHAM5-HAM-64N-Jul (Fig. 6b). The inter-model difference shown in this study agrees with Clyne et al. (2021), in which CESM-WACCM showed the largest maximum global mean, the longest time-to-maximum and the longest duration of the SAOD. Notably, CESM-WACCM produced the smallest global-mean stratospheric effective radius among the models. For Pinatubo-strength simulations, our CESM2-WACCM6 results also indicate a smaller global-mean Reff (0.35 µm) compared with an Reff exceeding 0.4 µm with MAECHAM5-HAM (Toohey et al., 2019). These differences can arise from a different model top, aerosol microphysics or chemistry resolved in model configurations. Zanchettin et al. (2022) showed that, under the VolMIP protocol, the maximum global-mean surface cooling ranges between 0.27 and 0.38 °C in ensemble means of six models simulating the Pinatubo eruption, which is lower than the analyzed 0.5 °C cooling based on HadCRUT5 observational data. In comparison, our CESM2-WACCM6 runs simulate a global-mean maximum cooling of up to 0.6 °C in S-15N-Jul. In line with Zanchettin et al. (2016), CESM2-WACCM6 represents an upper threshold among the models.
In this study, we perform idealized experiments with CESM2-WACCM6 to compare tropical and Northern Hemisphere extratropical volcanic eruptions in terms of the evolution of volcanic volatiles and aerosols, volcanic forcing, and subsequent impacts on surface temperature and ozone. In particular, we consider the co-injection of sulfur and halogens to the stratosphere under 1850 pre-industrial conditions and investigate the sensitivity to initial atmospheric conditions. We ran two sets of baseline experiments with volcanic eruptions in January at 15 and 64° N co-injecting SO2 and halogens (HCl, HBr) into the stratosphere at 24 km altitude. Each set has six ensemble members with westerly QBO and varying ENSO and PV initial states. We also performed sensitivity tests varying volcanic volatiles (sulfur only) and eruption season (July).
Our model results reveal that initial atmospheric conditions control the meridional transport of sulfur and halogens in the first month after the eruptions as well as further modulating the latitudinal distribution of sulfate aerosols, halogens, volcanic forcing and impacts. The baseline experiments, with the same eruption source parameters but different initial atmospheric conditions, show large variations in the volcanic forcing and subsequent climate and ozone impacts. For tropical eruptions, the initial atmospheric conditions also control the hemispheric asymmetry of the volcanic forcing.
Tropical and NH extratropical volcanic eruptions co-injecting SO2 and halogens lead to similar maximum global-mean aerosol forcing, surface cooling and ozone depletion. However, for NHET-mean responses, the NH extratropical eruptions have a larger maximum impact than tropical eruptions. For both global-mean and NHET-mean volcanic forcing, climate and ozone impacts, tropical eruptions take longer to peak and last longer than NH extratropical eruptions. Thus, when evaluating whether tropical or NH extratropical eruptions have larger climate and environmental impacts, it is important to evaluate both the severity and the duration of the impact, as different perspectives can come to different conclusions.
Compared with volcanic eruptions with sulfur-only injection, co-injection of sulfur and halogens leads to large differences in the ozone responses. Under pre-industrial conditions, volcanic eruptions with sulfur-only injections lead to a slight increase in ozone. In contrast, co-injection of sulfur and halogens leads to a significant ozone depletion lasting more than 5 years after tropical eruptions and up to 5 years after NH extratropical eruptions of Pinatubo strength.
Compared with varying the source parameters of volcanic eruptions, varying the initial atmospheric conditions reveals an important impact on the volcanic forcing and subsequent climate and ozone impacts. The impact has a larger variability at the early stage after tropical eruptions than after NH extratropical eruptions, as initial atmospheric conditions lead to large differences in the transport of volcanic volatiles and aerosols from the tropics to high latitudes from as soon as the first post-eruption month. For NH extratropical eruptions, the variability in the surface temperature response increases over time, especially during winter.
Both CESM2-WACCM6 and MAECHAM5-HAM model results show varied global-mean and NHET-mean SAOD with eruptions at different latitudes and in different seasons. Compared to both models, EVA produces similar forcing duration but smaller global-mean and NHET-mean maximum SAOD, with limited variations to different eruption latitudes and eruption seasons. The differences in volcanic forcing revealed here underscore a potential large discrepancy between utilizing Earth system models with interactive atmospheric chemistry and models with prescribed SAOD generated with EVA to examine the influence of varying initial atmospheric conditions and source parameters on volcanic forcing and subsequent impacts.
Initial conditions and eruption source parameters seem to be key for understanding the difference and comparability between simulations and observations of forcing and impacts of volcanic eruptions. Our study highlights the large variability in the volcanic forcing and response with varying initial atmospheric conditions, which is comparable to that with varying eruption source parameters. Multi-model simulations and comparisons are needed to further test our results. Our results point to the necessity of including initial conditions in future VolMIP protocols for better understanding volcanic impacts on the climate and environment.
The CESM2-WACCM6 data generated and analyzed for the current study are available from the NIRD Research Data Archive at https://doi.org/10.11582/2024.00089 (Zhuo, 2024).
The supplement related to this article is available online at: https://doi.org/10.5194/acp-24-6233-2024-supplement.
ZZ, HFF, MT and KK designed the model experiments; ZZ, HFF and MT carried them out. ZZ prepared the manuscript with contributions from all co-authors. KK led the project.
At least one of the (co-)authors is a member of the editorial board of Atmospheric Chemistry and Physics. The peer-review process was guided by an independent editor, and the authors also have no other competing interests to declare.
Publisher’s note: Copernicus Publications remains neutral with regard to jurisdictional claims made in the text, published maps, institutional affiliations, or any other geographical representation in this paper. While Copernicus Publications makes every effort to include appropriate place names, the final responsibility lies with the authors.
This article is part of the special issue “The Model Intercomparison Project on the climatic response to Volcanic forcing (VolMIP) (ESD/GMD/ACP/CP inter-journal SI)”. It is not associated with a conference.
The CESM2-WACCM6 model simulations were performed on resources provided by Sigma2 – the National Infrastructure for High-Performance Computing and Data Storage in Norway. The MAECHAM5-HAM simulations were performed at the German Climate Computing Center (Deutsch Klimazentrum, DKRZ).
This research has been supported by the Research Council of Norway (RCN)–University of Oslo Toppforsk project “VIKINGS” (grant no. 275191) and the German Federal Ministry for Education and Research (BMBF) via the “MiKlip” research program (grant nos. FKZ 01LP130B, 01LP1130A and 01LP1517B).
This paper was edited by Toshihiko Takemura and reviewed by two anonymous referees.
Baldwin, M. P., Gray, L. J., Dunkerton, T. J., Hamilton, K., Haynes, P. H., Randel, W. J., Holton, J. R., Alexander, M. J., Hirota, I., Horinouchi, T., Jones, D. B. A., Kinnersley, J. S., Marquardt, C., Sato, K., and Takahashi, M.: The quasi-biennial oscillation, Rev. Geophys., 39, 179–229, https://doi.org/10.1029/1999RG000073, 2001. a, b
Bluth, G. J. S., Doiron, S. D., Schnetzler, C. C., Krueger, A. J., and Walter, L. S.: Global tracking of the SO2 clouds from the June, 1991 Mount Pinatubo eruptions, Geophys. Res. Lett., 19, 151–154, https://doi.org/10.1029/91GL02792, 1992. a, b
Brenna, H., Kutterolf, S., and Kruger, K.: Global ozone depletion and increase of UV radiation caused by pre-industrial tropical volcanic eruptions, Sci. Rep., 9, 9435, https://doi.org/10.1038/s41598-019-45630-0, 2019. a, b, c
Brenna, H., Kutterolf, S., Mills, M. J., and Krüger, K.: The potential impacts of a sulfur- and halogen-rich supereruption such as Los Chocoyos on the atmosphere and climate, Atmos. Chem. Phys., 20, 6521–6539, https://doi.org/10.5194/acp-20-6521-2020, 2020. a, b
Brenna, H., Kutterolf, S., Mills, M. J., Niemeier, U., Timmreck, C., and Krüger, K.: Decadal Disruption of the QBO by Tropical Volcanic Supereruptions, Geophys. Res. Lett., 48, e2020GL089687, https://doi.org/10.1029/2020gl089687, 2021. a
Butchart, N.: The Brewer-Dobson circulation, Rev. Geophys., 52, 157–184, https://doi.org/10.1002/2013RG000448, 2014. a
Clyne, M., Lamarque, J.-F., Mills, M. J., Khodri, M., Ball, W., Bekki, S., Dhomse, S. S., Lebas, N., Mann, G., Marshall, L., Niemeier, U., Poulain, V., Robock, A., Rozanov, E., Schmidt, A., Stenke, A., Sukhodolov, T., Timmreck, C., Toohey, M., Tummon, F., Zanchettin, D., Zhu, Y., and Toon, O. B.: Model physics and chemistry causing intermodel disagreement within the VolMIP-Tambora Interactive Stratospheric Aerosol ensemble, Atmos. Chem. Phys., 21, 3317–3343, https://doi.org/10.5194/acp-21-3317-2021, 2021. a, b, c, d, e
Coupe, J. and Robock, A.: The Influence of Stratospheric Soot and Sulfate Aerosols on the Northern Hemisphere Wintertime Atmospheric Circulation, J. Geophys. Res.-Atmos., 126, e2020JD034513, https://doi.org/10.1029/2020jd034513, 2021. a
Danabasoglu, G., Lamarque, J. F., Bacmeister, J., Bailey, D. A., DuVivier, A. K., Edwards, J., Emmons, L. K., Fasullo, J., Garcia, R., Gettelman, A., Hannay, C., Holland, M. M., Large, W. G., Lauritzen, P. H., Lawrence, D. M., Lenaerts, J. T. M., Lindsay, K., Lipscomb, W. H., Mills, M. J., Neale, R., Oleson, K. W., Otto-Bliesner, B., Phillips, A. S., Sacks, W., Tilmes, S., Kampenhout, L., Vertenstein, M., Bertini, A., Dennis, J., Deser, C., Fischer, C., Fox-Kemper, B., Kay, J. E., Kinnison, D., Kushner, P. J., Larson, V. E., Long, M. C., Mickelson, S., Moore, J. K., Nienhouse, E., Polvani, L., Rasch, P. J., and Strand, W. G.: The Community Earth System Model Version 2 (CESM2), J. Adv. Model. Earth Syst., 12, e2019MS001916, https://doi.org/10.1029/2019ms001916, 2020. a
Dhomse, S. S., Emmerson, K. M., Mann, G. W., Bellouin, N., Carslaw, K. S., Chipperfield, M. P., Hommel, R., Abraham, N. L., Telford, P., Braesicke, P., Dalvi, M., Johnson, C. E., O'Connor, F., Morgenstern, O., Pyle, J. A., Deshler, T., Zawodny, J. M., and Thomason, L. W.: Aerosol microphysics simulations of the Mt. Pinatubo eruption with the UM-UKCA composition-climate model, Atmos. Chem. Phys., 14, 11221–11246, https://doi.org/10.5194/acp-14-11221-2014, 2014. a, b
Fuglestvedt, H. F., Zhuo, Z., Toohey, M., and Krüger, K.: Volcanic forcing of high-latitude Northern Hemisphere eruptions, npj Clim. Atmos. Sci., 7, 10, https://doi.org/10.1038/s41612-023-00539-4, 2024. a, b, c, d, e, f, g, h
Gettelman, A., Mills, M. J., Kinnison, D. E., Garcia, R. R., Smith, A. K., Marsh, D. R., Tilmes, S., Vitt, F., Bardeen, C. G., McInerny, J., Liu, H. L., Solomon, S. C., Polvani, L. M., Emmons, L. K., Lamarque, J. F., Richter, J. H., Glanville, A. S., Bacmeister, J. T., Phillips, A. S., Neale, R. B., Simpson, I. R., DuVivier, A. K., Hodzic, A., and Randel, W. J.: The Whole Atmosphere Community Climate Model Version 6 (WACCM6), J. Geophys. Res.-Atmos., 124, 12380–12403, https://doi.org/10.1029/2019JD030943, 2019. a, b, c
Grant, W. B., Fishman, J., Browell, E. V., Brackett, V. G., Nganga, D., Minga, A., Cros, B., Veiga, R. E., Butler, C. F., Fenn, M. A., and Nowicki, G. D.: Observations of reduced ozone concentrations in the tropical stratosphere after the eruption of Mt. Pinatubo, Geophys. Res. Lett., 19, 1109–1112, https://doi.org/10.1029/92GL01153, 1992. a
Guo, S., Bluth, G. J. S., Rose, W. I., Watson, I. M., and Prata, A. J.: Re-evaluation of SO2release of the 15 June 1991 Pinatubo eruption using ultraviolet and infrared satellite sensors, Geochem. Geophy. Geosy., 5, Q04001, https://doi.org/10.1029/2003gc000654, 2004. a, b
Hunke, E. C., Lipscomb, W. H., Turner, A. K., Jeffery, N., and Elliott, S.: CICE: The Los Alamos Sea Ice Model. Documentation and Software User’s Manual, Version 5.1, T-3 Fluid Dynamics Group, Los Alamos National Laboratory, Report Tech. Rep. LA-CC-06-012, https://svn-ccsm-models.cgd.ucar.edu/cesm1/alphas/branches/cesm1_5_alpha04c_timers/components/cice/src/doc/cicedoc.pdf (last access: 14 May 2024), 2015. a
Jones, A. C., Haywood, J. M., Jones, A., and Aquila, V.: Sensitivity of volcanic aerosol dispersion to meteorological conditions: A Pinatubo case study, J. Geophys. Res.-Atmos., 121, 6892–6908, https://doi.org/10.1002/2016jd025001, 2016. a
Jungclaus, J. H., Bard, E., Baroni, M., Braconnot, P., Cao, J., Chini, L. P., Egorova, T., Evans, M., González-Rouco, J. F., Goosse, H., Hurtt, G. C., Joos, F., Kaplan, J. O., Khodri, M., Klein Goldewijk, K., Krivova, N., LeGrande, A. N., Lorenz, S. J., Luterbacher, J., Man, W., Maycock, A. C., Meinshausen, M., Moberg, A., Muscheler, R., Nehrbass-Ahles, C., Otto-Bliesner, B. I., Phipps, S. J., Pongratz, J., Rozanov, E., Schmidt, G. A., Schmidt, H., Schmutz, W., Schurer, A., Shapiro, A. I., Sigl, M., Smerdon, J. E., Solanki, S. K., Timmreck, C., Toohey, M., Usoskin, I. G., Wagner, S., Wu, C.-J., Yeo, K. L., Zanchettin, D., Zhang, Q., and Zorita, E.: The PMIP4 contribution to CMIP6 – Part 3: The last millennium, scientific objective, and experimental design for the PMIP4 past1000 simulations, Geosci. Model Dev., 10, 4005–4033, https://doi.org/10.5194/gmd-10-4005-2017, 2017. a
Khodri, M., Izumo, T., Vialard, J., Janicot, S., Cassou, C., Lengaigne, M., Mignot, J., Gastineau, G., Guilyardi, E., Lebas, N., Robock, A., and McPhaden, M. J.: Tropical explosive volcanic eruptions can trigger El Nino by cooling tropical Africa, Nat. Commun., 8, 778, https://doi.org/10.1038/s41467-017-00755-6, 2017. a
Klobas, E. J., Wilmouth, D. M., Weisenstein, D. K., Anderson, J. G., and Salawitch, R. J.: Ozone depletion following future volcanic eruptions, Geophys. Res. Lett., 44, 7490–7499, https://doi.org/10.1002/2017gl073972, 2017. a
Kravitz, B. and Robock, A.: Climate effects of high-latitude volcanic eruptions: Role of the time of year, J. Geophys. Res.-Atmos., 116, D01105, https://doi.org/10.1029/2010JD014448, 2011. a
Krüger, K., Kutterolf, S., and Hansteen, T. H.: Halogen release from Plinian eruptions and depletion of stratospheric ozone, Cambridge University Press, Cambridge, 244–259, https://doi.org/10.1017/CBO9781107415683.020, 2015. a, b, c
Kutterolf, S., Hansteen, T. H., Appel, K., Freundt, A., Krüger, K., Pérez, W., and Wehrmann, H.: Combined bromine and chlorine release from large explosive volcanic eruptions: A threat to stratospheric ozone?, Geology, 41, 707–710, https://doi.org/10.1130/g34044.1, 2013. a, b, c
Kutterolf, S., Hansteen, T. H., Freundt, A., Wehrmann, H., Appel, K., Krüger, K., and Pérez, W.: Bromine and chlorine emissions from Plinian eruptions along the Central American Volcanic Arc: From source to atmosphere, Earth Planet. Sci. Lett., 429, 234–246, https://doi.org/10.1016/j.epsl.2015.07.064, 2015. a, b, c
Lacis, A.: Volcanic aerosol radiative properties, Past Global Changes Magazine, 23, 50–51, https://doi.org/10.22498/pages.23.2.50, 2015. a
Lawrence, D. M., Fisher, R. A., Koven, C. D., Oleson, K. W., Swenson, S. C., Bonan, G., Collier, N., Ghimire, B., van Kampenhout, L., Kennedy, D., Kluzek, E., Lawrence, P. J., Li, F., Li, H., Lombardozzi, D., Riley, W. J., Sacks, W. J., Shi, M., Vertenstein, M., Wieder, W. R., Xu, C., Ali, A. A., Badger, A. M., Bisht, G., van den Broeke, M., Brunke, M. A., Burns, S. P., Buzan, J., Clark, M., Craig, A., Dahlin, K., Drewniak, B., Fisher, J. B., Flanner, M., Fox, A. M., Gentine, P., Hoffman, F., Keppel-Aleks, G., Knox, R., Kumar, S., Lenaerts, J., Leung, L. R., Lipscomb, W. H., Lu, Y., Pandey, A., Pelletier, J. D., Perket, J., Randerson, J. T., Ricciuto, D. M., Sanderson, B. M., Slater, A., Subin, Z. M., Tang, J., Thomas, R. Q., Val Martin, M., and Zeng, X.: The Community Land Model Version 5: Description of New Features, Benchmarking, and Impact of Forcing Uncertainty, J. Adv. Model. Earth Sy., 11, 4245–4287, https://doi.org/10.1029/2018ms001583, 2019. a
LeGrande, A. N., Tsigaridis, K., and Bauer, S. E.: Role of atmospheric chemistry in the climate impacts of stratospheric volcanic injections, Nat. Geosci., 9, 652–655, https://doi.org/10.1038/ngeo2771, 2016. a
Lipscomb, W. H., Price, S. F., Hoffman, M. J., Leguy, G. R., Bennett, A. R., Bradley, S. L., Evans, K. J., Fyke, J. G., Kennedy, J. H., Perego, M., Ranken, D. M., Sacks, W. J., Salinger, A. G., Vargo, L. J., and Worley, P. H.: Description and evaluation of the Community Ice Sheet Model (CISM) v2.1, Geosci. Model Dev., 12, 387–424, https://doi.org/10.5194/gmd-12-387-2019, 2019. a
Liu, X., Easter, R. C., Ghan, S. J., Zaveri, R., Rasch, P., Shi, X., Lamarque, J.-F., Gettelman, A., Morrison, H., Vitt, F., Conley, A., Park, S., Neale, R., Hannay, C., Ekman, A. M. L., Hess, P., Mahowald, N., Collins, W., Iacono, M. J., Bretherton, C. S., Flanner, M. G., and Mitchell, D.: Toward a minimal representation of aerosols in climate models: description and evaluation in the Community Atmosphere Model CAM5, Geosci. Model Dev., 5, 709–739, https://doi.org/10.5194/gmd-5-709-2012, 2012. a
Liu, X., Ma, P.-L., Wang, H., Tilmes, S., Singh, B., Easter, R. C., Ghan, S. J., and Rasch, P. J.: Description and evaluation of a new four-mode version of the Modal Aerosol Module (MAM4) within version 5.3 of the Community Atmosphere Model, Geosci. Model Dev., 9, 505–522, https://doi.org/10.5194/gmd-9-505-2016, 2016. a
Lurton, T., Jégou, F., Berthet, G., Renard, J.-B., Clarisse, L., Schmidt, A., Brogniez, C., and Roberts, T. J.: Model simulations of the chemical and aerosol microphysical evolution of the Sarychev Peak 2009 eruption cloud compared to in situ and satellite observations, Atmos. Chem. Phys., 18, 3223–3247, https://doi.org/10.5194/acp-18-3223-2018, 2018. a
Marshall, L., Schmidt, A., Toohey, M., Carslaw, K. S., Mann, G. W., Sigl, M., Khodri, M., Timmreck, C., Zanchettin, D., Ball, W. T., Bekki, S., Brooke, J. S. A., Dhomse, S., Johnson, C., Lamarque, J.-F., LeGrande, A. N., Mills, M. J., Niemeier, U., Pope, J. O., Poulain, V., Robock, A., Rozanov, E., Stenke, A., Sukhodolov, T., Tilmes, S., Tsigaridis, K., and Tummon, F.: Multi-model comparison of the volcanic sulfate deposition from the 1815 eruption of Mt. Tambora, Atmos. Chem. Phys., 18, 2307–2328, https://doi.org/10.5194/acp-18-2307-2018, 2018. a, b
Marshall, L., Johnson, J. S., Mann, G. W., Lee, L., Dhomse, S. S., Regayre, L., Yoshioka, M., Carslaw, K. S., and Schmidt, A.: Exploring How Eruption Source Parameters Affect Volcanic Radiative Forcing Using Statistical Emulation, J. Geophys. Res.-Atmos., 124, 964–985, https://doi.org/10.1029/2018jd028675, 2019. a
Metzner, D., Kutterolf, S., Toohey, M., Timmreck, C., Niemeier, U., Freundt, A., and Krüger, K.: Radiative forcing and climate impact resulting from SO2 injections based on a 200,000-year record of Plinian eruptions along the Central American Volcanic Arc, Int. J. Earth Sci., 103, 2063–2079, https://doi.org/10.1007/s00531-012-0814-z, 2014. a
Mills, M. J., Schmidt, A., Easter, R., Solomon, S., Kinnison, D. E., Ghan, S. J., Neely, R. R., Marsh, D. R., Conley, A., Bardeen, C. G., and Gettelman, A.: Global volcanic aerosol properties derived from emissions, 1990–2014, using CESM1(WACCM), J. Geophys. Res.-Atmos., 121, 2332–2348, https://doi.org/10.1002/2015jd024290, 2016. a, b, c, d
Mills, M. J., Richter, J. H., Tilmes, S., Kravitz, B., MacMartin, D. G., Glanville, A. A., Tribbia, J. J., Vitt, J.-F. L. F., Schmidt, A., Gettelman, A., Hannay, C., Bacmeister, J. T., and Kinnison, D. E.: Radiative and chemical response to interactive stratospheric sulfate aerosols in fully coupled CESM1(WACCM), J. Geophys. Res.-Atmos., 122, 13061–13078, https://doi.org/10.1002/2017JD027006, 2017. a, b, c
Millán, L., Santee, M. L., Lambert, A., Livesey, N. J., Werner, F., Schwartz, M. J., Pumphrey, H. C., Manney, G. L., Wang, Y., Su, H., Wu, L., Read, W. G., and Froidevaux, L.: The Hunga Tonga-Hunga Ha'apai Hydration of the Stratosphere, Geophys. Res. Lett., 49, e2022GL099381, https://doi.org/10.1029/2022GL099381, 2022. a
Ming, A., Winton, V. H. L., Keeble, J., Abraham, N. L., Dalvi, M. C., Griffiths, P., Caillon, N., Jones, A. E., Mulvaney, R., Savarino, J., Frey, M. M., and Yang, X.: Stratospheric Ozone Changes From Explosive Tropical Volcanoes: Modeling and Ice Core Constraints, J. Geophys. Res.-Atmos., 125, e2019JD032290, https://doi.org/10.1029/2019jd032290, 2020. a
Myhre, G., Shindell, D., Bréon, F.-M., Collins, W., Fuglestvedt, J., Huang, J., Koch, D., Lamarque, J.-F., Lee, D., Men- doza, B., Nakajima, T., Robock, A., Stephens, G., Takemura, T., and Zhang, H.: Anthropogenic and natural radiative forcing, in: Climate Change 2013: The Physical Science Basis. Contribution of Working Group I to the Fifth Assessment Report of the Intergovernmental Panel on Climate Change, edited by: Stocker, T. F., Qin, D., Plattner, G.-K., Tignor, M., Allen, S. K., Boschung, J., Nauels, A., Xia, Y., Bex, V., and Midgley, P. M., Cambridge University Press, Cambridge, United Kingdom and New York, NY, USA, 659–740, https://doi.org/10.1017/CBO9781107415324.018, 2013. a
Neu, J. L. and Plumb, R. A.: Age of air in a “leaky pipe” model of stratospheric transport, J. Geophys. Res.-Atmos., 104, 19243–19255, https://doi.org/10.1029/1999jd900251, 1999. a
Niemeier, U., Timmreck, C., Graf, H.-F., Kinne, S., Rast, S., and Self, S.: Initial fate of fine ash and sulfur from large volcanic eruptions, Atmos. Chem. Phys., 9, 9043–9057, https://doi.org/10.5194/acp-9-9043-2009, 2009. a, b, c
Pausata, F. S. R., Karamperidou, C., Caballero, R., and Battisti, D. S.: ENSO response to high-latitude volcanic eruptions in the Northern Hemisphere: The role of the initial conditions, Geophys. Res. Lett., 43, 8694–8702, https://doi.org/10.1002/2016GL069575, 2016. a
Pausata, F. S. R., Zanchettin, D., Karamperidou, C., Caballero, R., and Battisti, D. S.: ITCZ shift and extratropical teleconnections drive ENSO response to volcanic eruptions, Sci. Adv., 6, eaaz5006, https://doi.org/10.1126/sciadv.aaz5006, 2020. a
Quaglia, I., Timmreck, C., Niemeier, U., Visioni, D., Pitari, G., Brodowsky, C., Brühl, C., Dhomse, S. S., Franke, H., Laakso, A., Mann, G. W., Rozanov, E., and Sukhodolov, T.: Interactive stratospheric aerosol models' response to different amounts and altitudes of SO2 injection during the 1991 Pinatubo eruption, Atmos. Chem. Phys., 23, 921–948, https://doi.org/10.5194/acp-23-921-2023, 2023. a, b, c
Ribera, P., Peña-Ortiz, C., Garcia-Herrera, R., Gallego, D., Gimeno, L., and Hernández, E.: Detection of the secondary meridional circulation associated with the quasi-biennial oscillation, J. Geophys. Res., 109, D18112, https://doi.org/10.1029/2003jd004363, 2004. a
Robock, A.: Volcanic eruptions and climate, Rev. Geophys., 38, 191–219, https://doi.org/10.1029/1998rg000054, 2000. a, b, c
Schneider, D. P., Ammann, C. M., Otto-Bliesner, B. L., and Kaufman, D. S.: Climate response to large, high-latitude and low-latitude volcanic eruptions in the Community Climate System Model, J. Geophys. Res., 114, D15101, https://doi.org/10.1029/2008jd011222, 2009. a
Sigl, M., Winstrup, M., McConnell, J. R., Welten, K. C., Plunkett, G., Ludlow, F., Buntgen, U., Caffee, M., Chellman, N., Dahl-Jensen, D., Fischer, H., Kipfstuhl, S., Kostick, C., Maselli, O. J., Mekhaldi, F., Mulvaney, R., Muscheler, R., Pasteris, D. R., Pilcher, J. R., Salzer, M., Schupbach, S., Steffensen, J. P., Vinther, B. M., and Woodruff, T. E.: Timing and climate forcing of volcanic eruptions for the past 2,500 years, Nature, 523, 543–549, https://doi.org/10.1038/nature14565, 2015. a
Sigl, M., Toohey, M., McConnell, J. R., Cole-Dai, J., and Severi, M.: Volcanic stratospheric sulfur injections and aerosol optical depth during the Holocene (past 11 500 years) from a bipolar ice-core array, Earth Syst. Sci. Data, 14, 3167–3196, https://doi.org/10.5194/essd-14-3167-2022, 2022. a, b
Smith, R., Jones, P., Briegleb, B., Bryan, F., Danabasoglu, G., Dennis, J., Dukowicz, J., Eden, C., Fox-Kemper B.5, Gent, P., Hecht, M., Jayne, S., Jochum, M., Large, W., Lindsay, K., Maltrud, M., Norton, N., Peacock, S., Vertenstein, M., and Yeager, S.: The Parallel Ocean Program (POP) reference manual, Ocean component of the Community Climate System Model (CCSM), Tech. Rep. LAUR-10-01853, LANL Tech. Report, https://www.google.com/url?sa=t&source=web&rct=j&opi=89978449&url=https://www2.cesm.ucar.edu/models/cesm1.0/pop2/doc/sci/POPRefManual.pdf&ved=2ahUKEwjfsu3U3YGGAxVrAjQIHf3oBOAQFnoECBIQAQ&usg=AOvVaw2sWz8qSFKL3FExgnx96bff (last access: 14 May 2024), 2010. a
Solomon, S.: Stratospheric ozone depletion: A review of concepts and history, Rev. Geophys., 37, 275–316, https://doi.org/10.1029/1999rg900008, 1999. a
Staunton-Sykes, J., Aubry, T. J., Shin, Y. M., Weber, J., Marshall, L. R., Luke Abraham, N., Archibald, A., and Schmidt, A.: Co-emission of volcanic sulfur and halogens amplifies volcanic effective radiative forcing, Atmos. Chem. Phys., 21, 9009–9029, https://doi.org/10.5194/acp-21-9009-2021, 2021. a
Stenchikov, G., Ukhov, A., Osipov, S., Ahmadov, R., Grell, G., Cady-Pereira, K., Mlawer, E., and Iacono, M.: How Does a Pinatubo-Size Volcanic Cloud Reach the Middle Stratosphere?, J. Geophys. Res.-Atmos., 126, e2020JD033829, https://doi.org/10.1029/2020jd033829, 2021. a
Stier, P., Feichter, J., Kinne, S., Kloster, S., Vignati, E., Wilson, J., Ganzeveld, L., Tegen, I., Werner, M., Balkanski, Y., Schulz, M., Boucher, O., Minikin, A., and Petzold, A.: The aerosol-climate model ECHAM5-HAM, Atmos. Chem. Phys., 5, 1125–1156, https://doi.org/10.5194/acp-5-1125-2005, 2005. a
Timmreck, C.: Modeling the climatic effects of large explosive volcanic eruptions, WIREs Clim. Change, 3, 545–564, https://doi.org/10.1002/wcc.192, 2012. a
Timmreck, C., Mann, G. W., Aquila, V., Hommel, R., Lee, L. A., Schmidt, A., Brühl, C., Carn, S., Chin, M., Dhomse, S. S., Diehl, T., English, J. M., Mills, M. J., Neely, R., Sheng, J., Toohey, M., and Weisenstein, D.: The Interactive Stratospheric Aerosol Model Intercomparison Project (ISA-MIP): motivation and experimental design, Geosci. Model Dev., 11, 2581–2608, https://doi.org/10.5194/gmd-11-2581-2018, 2018. a
Toohey, M. and Sigl, M.: Volcanic stratospheric sulfur injections and aerosol optical depth from 500 BCE to 1900 CE, Earth Syst. Sci. Data, 9, 809–831, https://doi.org/10.5194/essd-9-809-2017, 2017. a, b
Toohey, M., Krüger, K., Niemeier, U., and Timmreck, C.: The influence of eruption season on the global aerosol evolution and radiative impact of tropical volcanic eruptions, Atmos. Chem. Phys., 11, 12351–12367, https://doi.org/10.5194/acp-11-12351-2011, 2011. a, b, c
Toohey, M., Stevens, B., Schmidt, H., and Timmreck, C.: Easy Volcanic Aerosol (EVA v1.0): an idealized forcing generator for climate simulations, Geosci. Model Dev., 9, 4049–4070, https://doi.org/10.5194/gmd-9-4049-2016, 2016. a
Toohey, M., Krüger, K., Schmidt, H., Timmreck, C., Sigl, M., Stoffel, M., and Wilson, R.: Disproportionately strong climate forcing from extratropical explosive volcanic eruptions, Nat. Geosci., 12, 100–107, https://doi.org/10.1038/s41561-018-0286-2, 2019. a, b, c, d, e, f, g, h, i
Trepte, C. and Hitchman, M.: Tropical stratospheric circulation deduced from satellite aerosol data, Nature, 355, 626–628, https://doi.org/10.1038/355626a0, 1992. a
Ukhov, A., Stenchikov, G., Osipov, S., Krotkov, N., Gorkavyi, N., Li, C., Dubovik, O., and Lopatin, A.: Inverse Modeling of the Initial Stage of the 1991 Pinatubo Volcanic Cloud Accounting for Radiative Feedback of Volcanic Ash, J. Geophys. Res.-Atmos., 128, e2022JD038446, https://doi.org/10.1029/2022JD038446, 2023. a
van Loon, H. and Labitzke, K.: The Southern Oscillation. Part V: The Anomalies in the Lower Stratosphere of the Northern Hemisphere in Winter and a Comparison with the Quasi-Biennial Oscillation, Mon. Weather Rev., 115, 357–369, https://doi.org/10.1175/1520-0493(1987)115<0357:Tsopvt>2.0.Co;2, 1987. a
von Glasow, R., Bobrowski, N., and Kern, C.: The effects of volcanic eruptions on atmospheric chemistry, Chem. Geol., 263, 131–142, https://doi.org/10.1016/j.chemgeo.2008.08.020, 2009. a
WMO: Scientific Assessment of Ozone Depletion: 2018, Global Ozone Research and Monitoring Project, Report No. 58, https://csl.noaa.gov/assessments/ozone/2018/downloads/2018OzoneAssessment.pdf (last access: 9 May 2024), 2018. a
Zanchettin, D., Khodri, M., Timmreck, C., Toohey, M., Schmidt, A., Gerber, E. P., Hegerl, G., Robock, A., Pausata, F. S. R., Ball, W. T., Bauer, S. E., Bekki, S., Dhomse, S. S., LeGrande, A. N., Mann, G. W., Marshall, L., Mills, M., Marchand, M., Niemeier, U., Poulain, V., Rozanov, E., Rubino, A., Stenke, A., Tsigaridis, K., and Tummon, F.: The Model Intercomparison Project on the climatic response to Volcanic forcing (VolMIP): experimental design and forcing input data for CMIP6, Geosci. Model Dev., 9, 2701–2719, https://doi.org/10.5194/gmd-9-2701-2016, 2016. a, b, c
Zanchettin, D., Timmreck, C., Khodri, M., Schmidt, A., Toohey, M., Abe, M., Bekki, S., Cole, J., Fang, S.-W., Feng, W., Hegerl, G., Johnson, B., Lebas, N., LeGrande, A. N., Mann, G. W., Marshall, L., Rieger, L., Robock, A., Rubinetti, S., Tsigaridis, K., and Weierbach, H.: Effects of forcing differences and initial conditions on inter-model agreement in the VolMIP volc-pinatubo-full experiment, Geosci. Model Dev., 15, 2265–2292, https://doi.org/10.5194/gmd-15-2265-2022, 2022. a, b
Zhu, Y., Toon, O. B., Jensen, E. J., Bardeen, C. G., Mills, M. J., Tolbert, M. A., Yu, P., and Woods, S.: Persisting volcanic ash particles impact stratospheric SO2 lifetime and aerosol optical properties, Nat. Commun., 11, 4526, https://doi.org/10.1038/s41467-020-18352-5, 2020. a
Zhuo, Z.: CESM2-WACCM6 simulations of tropical and extratropical volcanic eruptions, Norstore [data set], https://doi.org/10.11582/2024.00089, 2024. a
Zhuo, Z., Gao, C., and Pan, Y.: Proxy evidence for China's monsoon precipitation response to volcanic aerosols over the past seven centuries, J. Geophys. Res.-Atmos., 119, 6638–6652, https://doi.org/10.1002/2013JD021061, 2014. a
Zhuo, Z., Kirchner, I., Pfahl, S., and Cubasch, U.: Climate impact of volcanic eruptions: the sensitivity to eruption season and latitude in MPI-ESM ensemble experiments, Atmos. Chem. Phys., 21, 13425–13442, https://doi.org/10.5194/acp-21-13425-2021, 2021. a, b