the Creative Commons Attribution 4.0 License.
the Creative Commons Attribution 4.0 License.
 | 27 May 2024
The impact of gaseous degradation on the gas–particle partitioning of methylated polycyclic aromatic hydrocarbons
Fu-Jie Zhu
Zi-Feng Zhang
Li-Yan Liu
Pu-Fei Yang
Peng-Tuan Hu
Geng-Bo Ren
Meng Qin
Wan-Li Ma
The partitioning of semi-volatile organic compounds (SVOCs) between gas and particle phases plays a crucial role in their long-range transport and health risk assessment. However, the accurate prediction of the gas–particle (G–P) partitioning quotient () remains a challenge, especially for the light-molecular-weight (LMW) SVOCs due to their upward deviation from equilibrium state. In this study, the phenomenon with the influence of gaseous degradation on G–P partitioning was observed. Based on the diurnal study of concentrations and values for methylated polycyclic aromatic hydrocarbons (Me-PAHs), it was found that the values of methylated naphthalenes (Me-Naps; one type of LMW SVOC) during the daytime were higher than during the nighttime, and the regression lines of log versus log KOA (octanol–air partitioning coefficient) for daytime and nighttime were non-overlapping, which were different from other Me-PAHs. Compared with other diurnal influencing factors, the higher gaseous degradation of Me-Naps in the daytime than in the nighttime should partially explain their special diurnal variation in , which provided a new explanation for the non-equilibrium behavior of for LMW SVOCs. Moreover, the influence of gaseous degradation on the deviation of from equilibrium state was deeply studied based on the steady-state G–P partitioning model considering particulate proportion in emission (ϕ0). The increasing times of influenced by the gaseous degradation deviated from equilibrium state can be calculated by 1 + 13.2ϕ0 × kdeg (kdeg, gaseous degradation rate). The increase in along with the increase in kdeg proved that higher gaseous degradation in the daytime could increase the value. Furthermore, an amplification in ranging from 1.11 to 5.58 times (90 % confidence interval: 1.01 to 14.4) under different ϕ0 values (0 to 1) in the temperature range of −50 to 50 °C was estimated by the Monte Carlo analysis. In summary, it can be concluded that the influence of gaseous degradation should also be considered in the G–P partitioning models of SVOCs, especially for the LMW SVOCs, which provided new insights into the related fields.
- Article
(1338 KB) - Full-text XML
-
Supplement
(3189 KB) - BibTeX
- EndNote


The partitioning of semi-volatile organic compounds (SVOCs) between gas and particle phases, known as gas–particle (G–P) partitioning, is a crucial process for their long-range atmospheric transport (Li et al., 2020; Zhu et al., 2021b) and their entry pathway into the human body (Hu et al., 2021). To investigate the G–P partitioning mechanism of SVOCs, researchers have widely employed the correlation between the G–P partitioning coefficient (KP) at equilibrium state and the octanol–air partition coefficient (KOA) (Ma et al., 2019; Harner and Bidleman, 1998). The prediction of KP based on KOA was conducted in previous studies, which deduced some G–P partitioning models (Qiao et al., 2020). The Harner–Bidleman (H–B) model (Harner and Bidleman, 1998) and the Dachs–Eisenreich (D–E) model (Dachs and Eisenreich, 2000) were successfully applied in the prediction of KP for different SVOCs using the equilibrium-state theory (Wang et al., 2011; Sadiki and Poissant, 2008). In addition, the Li–Ma–Yang (L–M–Y) model (Li et al., 2015) was established based on the steady-state theory, which exhibited good performance in predicting the G–P partitioning quotient () at steady state, particularly for high-molecular-weight (HMW) SVOCs (Qiao et al., 2020; Li et al., 2017; Hu et al., 2020).
Previous studies had found that the deviated from the equilibrium state for both HMW SVOCs (i.e., high log KOA value) (Li et al., 2015; Li and Jia, 2014) and light-molecular-weight (LMW) SVOCs (Ma et al., 2020; Dachs and Eisenreich, 2000). For the HMW SVOCs, the particulate SVOCs were either deposited or removed through dry and wet depositions before reaching equilibrium state, as demonstrated by both the theoretical study (L–M–Y model) and the monitoring study (Mackay et al., 2019; Li et al., 2015), which can be used to explain the deviation. For the LMW SVOCs, the deviated upward from equilibrium state, and the deviation could be multiple orders of magnitude, such as in LMW polycyclic aromatic hydrocarbons (PAHs) (Ma et al., 2019, 2020). Several explanations have been proposed for this deviation of LMW SVOCs. First, the artifacts resulting from the adsorption of gaseous PAHs onto particle filters during atmospheric sampling can increase values (Zhang and Mcmurry, 1991; Hart et al., 1992, 1994). In an early study, the double-filter sampling method demonstrated that gas adsorption onto filters would cause an overestimation of by a factor of 1.2 to 1.6 times (Hart and Pankow, 1994). However, the overestimation is much lower than the deviation with multiple orders of magnitude. Secondly, the enhanced adsorption of gaseous SVOCs onto various phases (e.g., soot phase and inorganic phases) within particles has been extensively documented (Shahpoury et al., 2016; Dachs and Eisenreich, 2000). Some G–P partitioning models were established with the consideration of the enhanced adsorption, such as the D–E model and the poly-parameter linear free energy relationships (pp-LFER) model (Shahpoury et al., 2016; Dachs and Eisenreich, 2000). However, these models cannot fully explain the deviation from equilibrium state for the LMW SVOCs, such as some LMW PAHs (acenaphthylene (Acy), acenaphthene (Ace) and fluorene (Flu)) (Ma et al., 2020).
A recent study delved into the non-equilibrium interplay of G–P partitioning resulting from chemical reactions of SVOCs (Wilson et al., 2021). The study found that when the chemical loss of SVOCs in the gas or particle phase exceeded the replenishment from the particle or gas phase, the values could deviate from equilibrium state (Wilson et al., 2021). According to the findings, the upward deviation of LMW SVOCs from equilibrium state might be caused by the faster chemical loss of SVOCs in the gas phase than by the replenishment from the particle phase. However, further studies are required to confirm this hypothesis. Our previous study provided new insights into the deviation from equilibrium state for several LMW PAHs by studying the diurnal variation in values (Zhu et al., 2022). The study found that the values for the three LMW PAHs (Acy, Ace and Flu) were higher in the daytime than in the nighttime (Zhu et al., 2022). In addition, the chemical reactions of SVOCs were different between the daytime and the nighttime (Ohura et al., 2013). Therefore, the study on the diurnal variation on G–P partitioning between the daytime and the nighttime can be regarded as a special case for a deep understanding of the deviation of LMW SVOCs from equilibrium state.
In order to comprehensively investigate the deviation of the value from equilibrium state for LMW SVOCs, the diurnal variation in concentrations and values for methylated PAHs (Me-PAHs) was calculated in this study. Furthermore, the influence of the gaseous degradation on the deviation of from equilibrium state was quantified based on the theoretical model for both LMW Me-PAHs and PAHs, which provided new insights into the G–P partitioning of SVOCs.
2.1 Sampling method
The detailed information for the sampling method and site can be found in our previous study (Zhu et al., 2021a, 2022). In brief, the sampling program was conducted at an urban location on the rooftop of a 14 m high building in Harbin in northeastern China. Harbin has an obvious seasonal variation, with the heating season from 20 October to 20 April and the non-heating season from 20 April to 20 October. A total of 32 pairs of air samples were collected every 10 d during the daytime (09:00 to 17:00 UTC+8) and nighttime (21:00 to 05:00 UTC+8) from December 2017 to November 2018, which minimized the impact of heavy traffic. Glass fiber filters (GFFs) and polyurethane foam plugs (PUFs) were used to collect particulate and gaseous samples, respectively, using an active air sampler (TE-1000, Tisch Environmental, Ohio, USA) with an air flow rate of 0.24 SD m3 min−1. The GFFs and PUFs were carefully sealed and stored in a refrigerator at −20 °C prior to treatment.
2.2 Analysis procedure of Me-PAHs
The analysis procedure for Me-PAHs was identical to that of PAHs (Zhu et al., 2021a, 2022). In brief, the Soxhlet extraction and active silica gel column were used to extract and purify the GFF and PUF samples. Prior to extraction, four surrogates (naphthalene-D8, fluorene-D10, pyrene-D10 and perylene-D12) were added to all samples. The final extractions were solvent-exchanged into isooctane and concentrated to 1 mL in GC vials with 200 ng quantitation standard (phenanthrene-D10). A total of 49 Me-PAHs were analyzed by an Agilent 7890B gas chromatograph coupled with an Agilent 5977 mass spectrometer detector, with the electron impact ionization and selected ion monitoring mode. Chromatographic resolution was achieved with a DB-5ms capillary chromatographic column (60 m × 0.25 mm i.d. × 0.25 µm film thickness, J&W Scientific). Ultrapure helium gas (> 99.9999 %) was used as the carrier gas at a constant flow rate of 1 mL min−1. An aliquot (2 µL) of the sample was injected into the multi-mode inlet of the GC–MS at 280 °C via the pulsed splitless mode. The column oven temperature program was as follows: hold at 100 °C for 1 min, ramp to 200 °C at 40 °C min−1, hold for 13 min, ramp to 300 °C at 80 °C min−1, hold for 22 min, ramp to 310 at 50 °C min−1, hold for 11 min with the post-run of 310 °C and hold for 3 min. The transfer line temperature was maintained at 280 °C. For the mass spectrometer, the MS source and quadrupole temperatures were set at 230 and 150 °C, respectively. Detailed information and mass spectrometry parameters for the 49 Me-PAHs are summarized in Table S1 in the Supplement. A representative chromatogram is depicted in Fig. S1 in the Supplement.
2.3 Quality assurance/quality control
In order to minimize the errors, rigorous quality assurance/quality control procedures were implemented in the present study. Prior to sampling, GFFs were subjected to a cleaning process involving baking at 450 °C for 6 h, while PUFs were extracted via Soxhlet extraction using dichloromethane for 24 h and hexane for an additional 24 h. All glassware utilized in the experimental process was cleaned with dichloromethane and hexane prior to use. Field blanks were conducted on a monthly basis, and laboratory blanks were added for every 11 samples. The quantitation standard was utilized to correct fluctuations in the corresponding instrument signal. The average recoveries of the four surrogates ranged from 70 % to 110 % for all samples, which were deemed acceptable for the utilization of concentration data without correction via surrogate recoveries. The instrument detection limit (IDL) was calculated as 3 times the signal to noise, with IDLs for all Me-PAHs ranging from 0.0154 to 0.951 ng (Table S1 in the Supplement), utilizing a constant injection volume of 2 µL. Concentrations below IDLs were excluded from further calculations. The recoveries of all Me-PAHs with spiked blank samples ranged from 94 % to 107 %. The final reported concentrations were corrected by the blanks but not corrected with recoveries of spiked blank samples and surrogates. A five-point calibration curve was established using concentrations of 5, 10, 50, 100 and 500 ng mL−1, with the correlation coefficient (r2) exceeding 0.99.
2.4 G–P partitioning quotient
The (m3 µg−1) was calculated based on the following equation:
where CP and CG are the concentrations (ng m−3) of Me-PAHs in the particle phase and gas phase, respectively, and TSP is the concentration of the total suspended particles in air (µg m−3).
In general, the value of log KOA can be calculated using the following equation:
where T is the ambient temperature (K) and A and B are constants.
For most Me-PAHs, the values of A and B were estimated through the utilization of the pp-LFER equation, which relied on the solute descriptors obtained from the UFZ-LSER database (Baskaran et al., 2021; Ulrich et al., 2017). The calculation methods and corresponding parameters have been concisely summarized in Tables S2 and S3 in the Supplement. By utilizing the values of A and B, the value of KOA for Me-PAHs can be obtained by Eq. (2) at any temperature.
2.5 Data analysis method
The statistical analysis was conducted using the SPSS software (version 24.0). Prior to analysis, the normal distribution test was performed via the one-sample Kolmogorov–Smirnov Test. The paired-sample t test was utilized for difference analysis in datasets exhibiting normal distribution, while the Wilcoxon signed-rank test was employed for the non-normal distribution datasets. Results were regarded as statistically significant if the p value was less than 0.05.
3.1 Diurnal variation in concentration
Among the 49 Me-PAHs, 30 Me-PAHs were frequently detected with detection rates exceeding 30 % (Table S1 in the Supplement), and they were considered for further discussion. As depicted in Fig. 1, the total concentrations of 30 Me-PAHs (ΣMe-PAHs) in total phase (particle phase + gas phase) were compared between the daytime and the nighttime in different seasons. A clear diurnal variation with higher concentrations of Me-PAHs during the nighttime than during the daytime was observed. The geometric mean (GM) concentrations (range of 25th % to 75th %) of ΣMe-PAHs were 12.0 ng m−3 (4.51 to 34.6 ng m−3) and 23.6 ng m−3 (7.97 to 69.9 ng m−3) in the daytime and in the nighttime, respectively. Furthermore, the concentrations of ΣMe-PAHs in total phase during the nighttime were significantly higher than those during the daytime (p<0.05), with the GM value of nighttime daytime (N D) ratios of 1.97 for the whole sampling period. Although studies on the diurnal variation in Me-PAHs are limited, similar diurnal variations have also been observed in some previous studies for other PAHs, such as PAHs, chlorinated PAHs, nitrated PAHs and oxygenated PAHs (Cao et al., 2018; Ohura et al., 2013; Zhang et al., 2018; Zhu et al., 2022). It was found that the diurnal variations in emission sources, emission intensity, atmospheric reactions and meteorological effects were responsible for the diurnal variation in SVOC concentrations (Ohura et al., 2013; Zhang et al., 2018).
Moreover, it is noteworthy that distinctly diurnal variations were observed among different phases (gas and particle) and different seasons (heating and non-heating) (Fig. 1). Notably, a significant increase in concentrations during the nighttime compared to during the daytime was observed for the gas phase (p<0.01), while no significant diurnal variation was observed for the particle phase in all seasons and in the heating season. Additionally, the N D ratios were higher in the non-heating season compared to the heating season. For instance, in the non-heating season, the GM N D ratios were 2.14 and 2.15 for the total and gas phases, respectively. However, in the heating season, the GM N D ratios were 1.80 and 1.96 for the total and gas phases, respectively. These findings suggested that gaseous Me-PAHs exhibited more obviously diurnal variation than particulate Me-PAHs and that Me-PAHs in the non-heating season displayed more prominent diurnal variation than in the heating season.
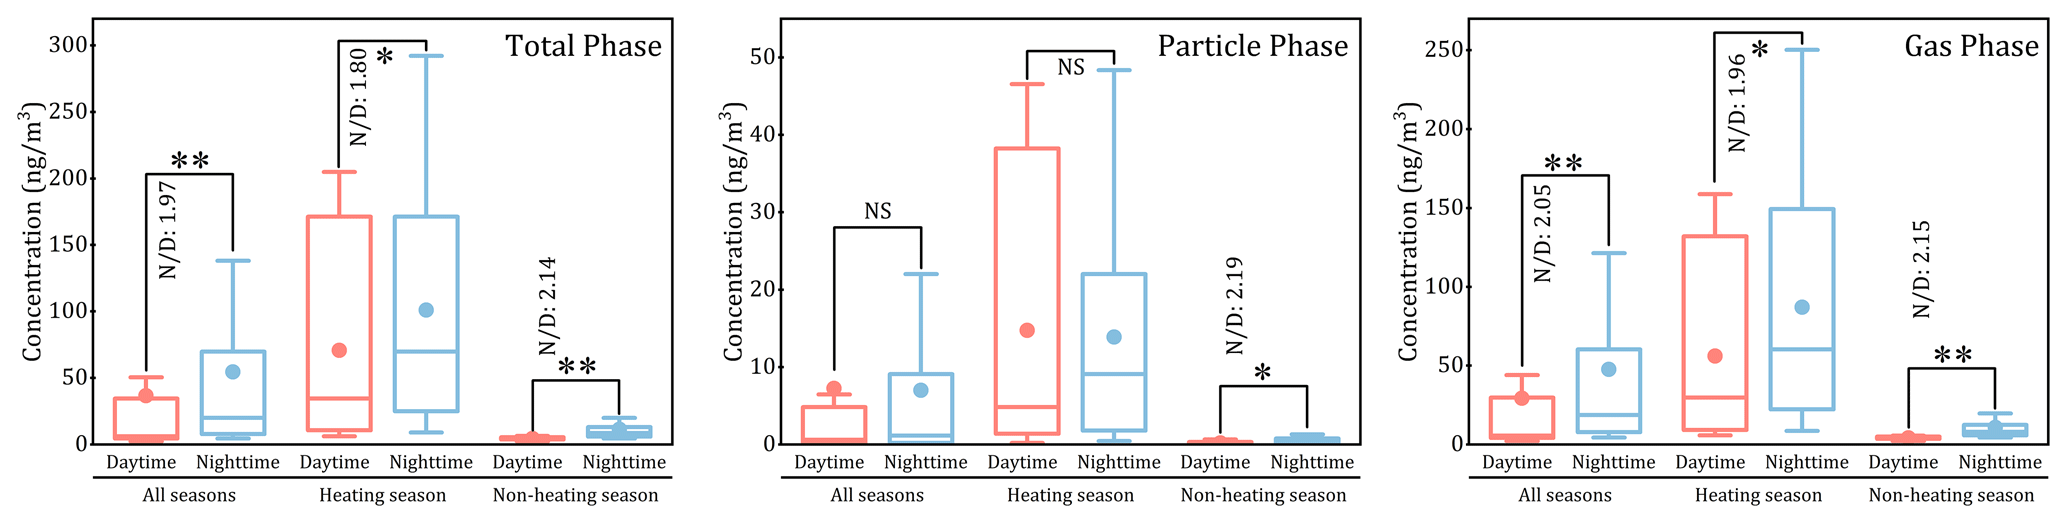
Figure 1Comparison with the concentrations of ΣMe-PAHs between the daytime and nighttime in different seasons for different phases (note: * and represent that the differences are significant at the 0.05 and 0.01 level, respectively; NS represents no significant difference; N D represents the geometric mean value of the nighttime daytime ratio for concentration).
Furthermore, it is interesting to note that individual Me-PAHs also exhibited different diurnal variations. The N D ratios and the GM values of N D ratios for individual Me-PAHs are presented in Table S4 and Fig. S2 in the Supplement. The GM values of N D ratios varied considerably among different Me-PAHs, ranging from 0.347 to 7.30. Regarding the seasonal differences in diurnal variation (Table S4 in the Supplement), the results for most individual Me-PAHs were consistent with those for ΣMe-PAHs, with higher GM values of N D ratios in the non-heating season than in the heating season. With respect to the phase differences in diurnal variation (Table S4 and Fig. S2 in the Supplement), the GM values of N D ratios in the gas phase for methylated naphthalenes (Me-Naps; one type of LMW Me-PAHs) were higher than those in the particle phase in all seasons. This result was consistent with that of ΣMe-PAHs, which could be attributed to the high contribution of Me-Naps to ΣMe-PAHs (mean value: 63 %). However, for other Me-PAHs (Table S4 and Fig. S2 in the Supplement), the N D ratios in the particle phase were similar to or even a little higher than those in the gas phase.
3.2 Diurnal variation in G–P partitioning
In general, the different diurnal variations in the concentrations of SVOCs between the gas phase and the particle phase could cause the diurnal variations in values. As depicted in Fig. 2, compared with other Me-PAHs, several LMW Me-PAHs (such as Me-Naps) exhibited significantly higher log values in the daytime than in the nighttime (p<0.05). However, the other Me-PAHs, like 3-MeBcP, 5,6,4-MeChr and 3,5-MeBaA, had higher log values in the nighttime than in the daytime (p<0.05). The special diurnal variations in the log of Me-Naps can be attributed to the different diurnal variations in their concentrations between the two phases. For example, the N D ratios of concentrations in the gas phase were significantly higher than in the particle phase for Me-Naps, which were different from other Me-PAHs (Fig. S2 in the Supplement).
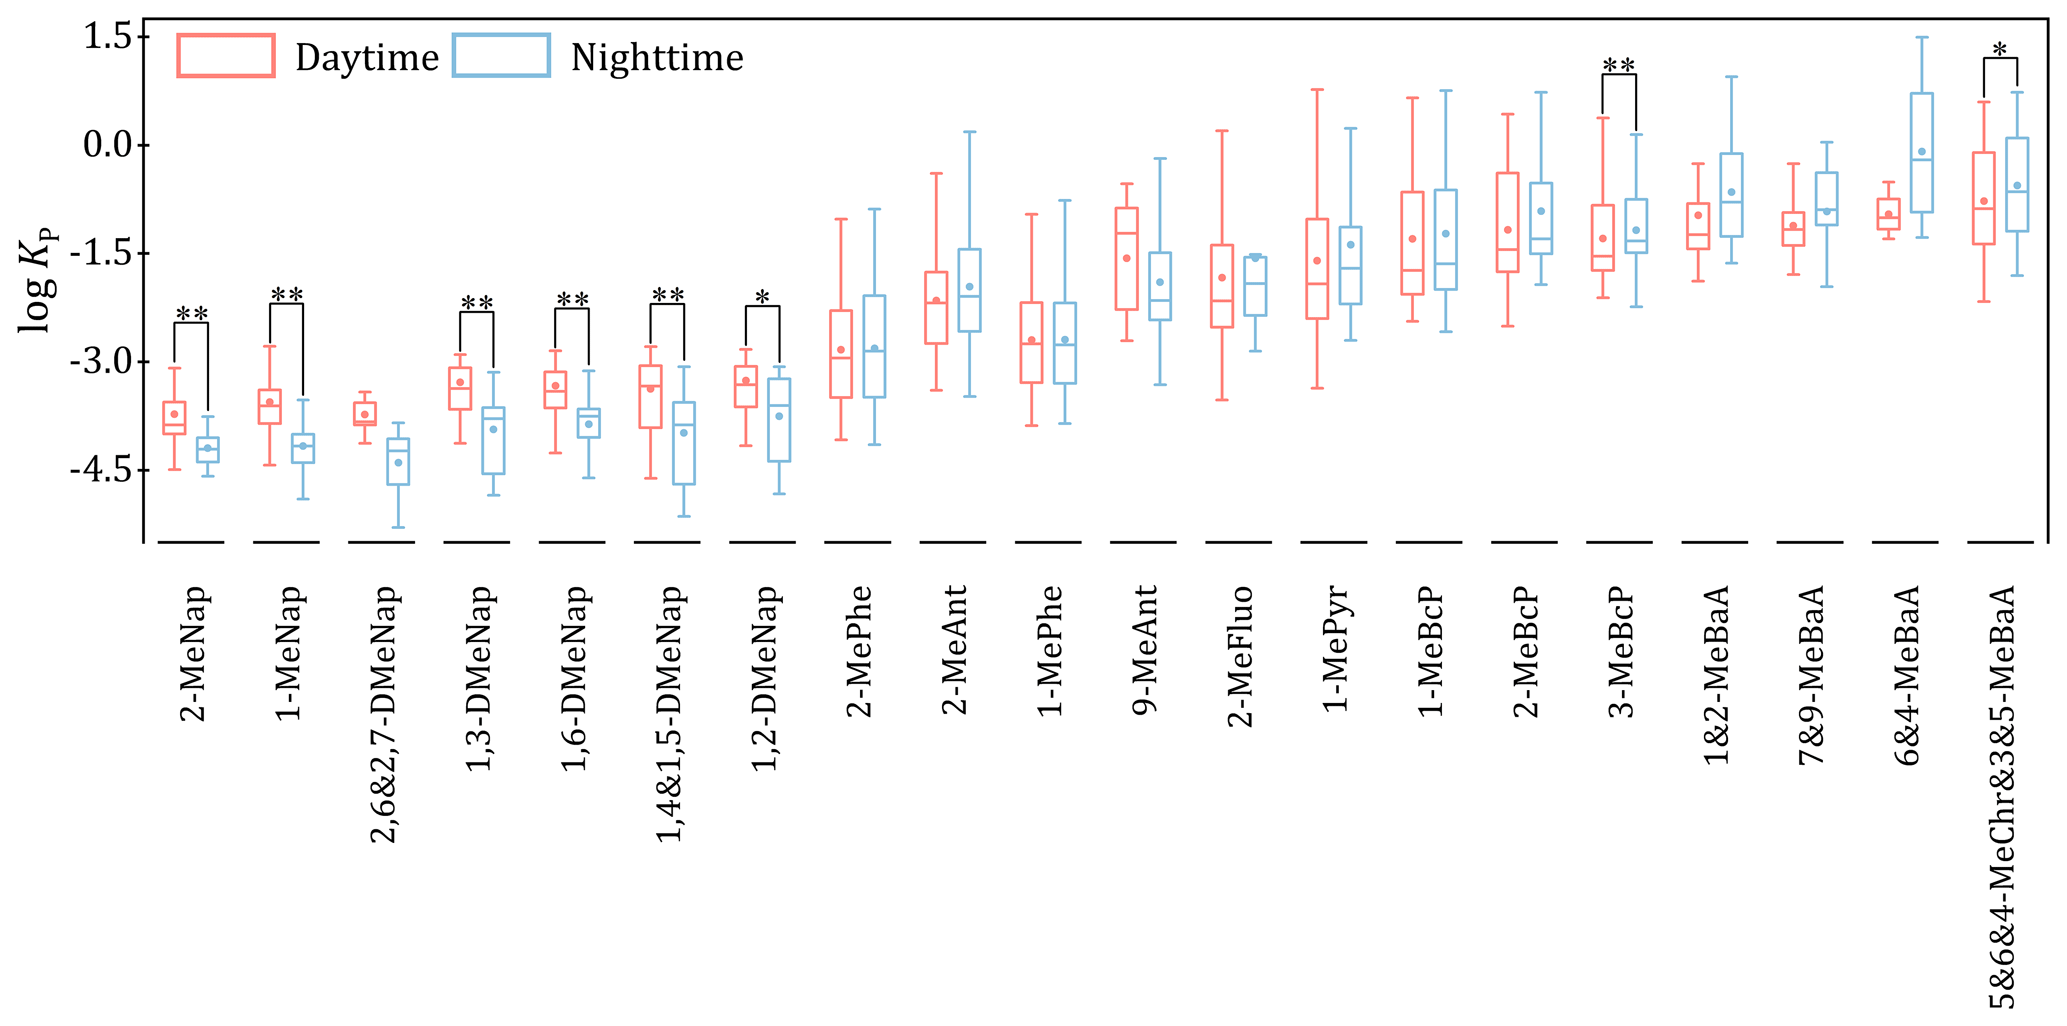
Figure 2Comparison of the values of log for individual Me-PAHs between the daytime and nighttime (note: * and represent that the differences are significant at the 0.05 and 0.01 level, respectively).
In order to deeply investigate the diurnal variations in the G–P partitioning quotient, the regression lines of log against log KOA were compared between the daytime and nighttime. In general, the diurnal variations were also observed for the relationships between log and log KOA for Me-Naps. Interestingly, for these Me-Naps, the regression lines also had obvious diurnal variations that were higher during the daytime compared to during the nighttime (Fig. 3). In contrast, no significant differences were observed in the regression lines for the total Me-PAHs (Fig. S3 in the Supplement) and other individual Me-PAHs (Fig. S4 in the Supplement) between the daytime and nighttime. Given the lower ambient temperatures during the nighttime, higher values during the nighttime compared to the daytime and the overlap of the two regression lines between the daytime and nighttime were expected, just like the total Me-PAHs (Fig. S3 in the Supplement) and other individual Me-PAHs (Fig. S4 in the Supplement). However, the different phenomenon with the regression lines of log against log KOA was observed for Me-Naps (Fig. 3).
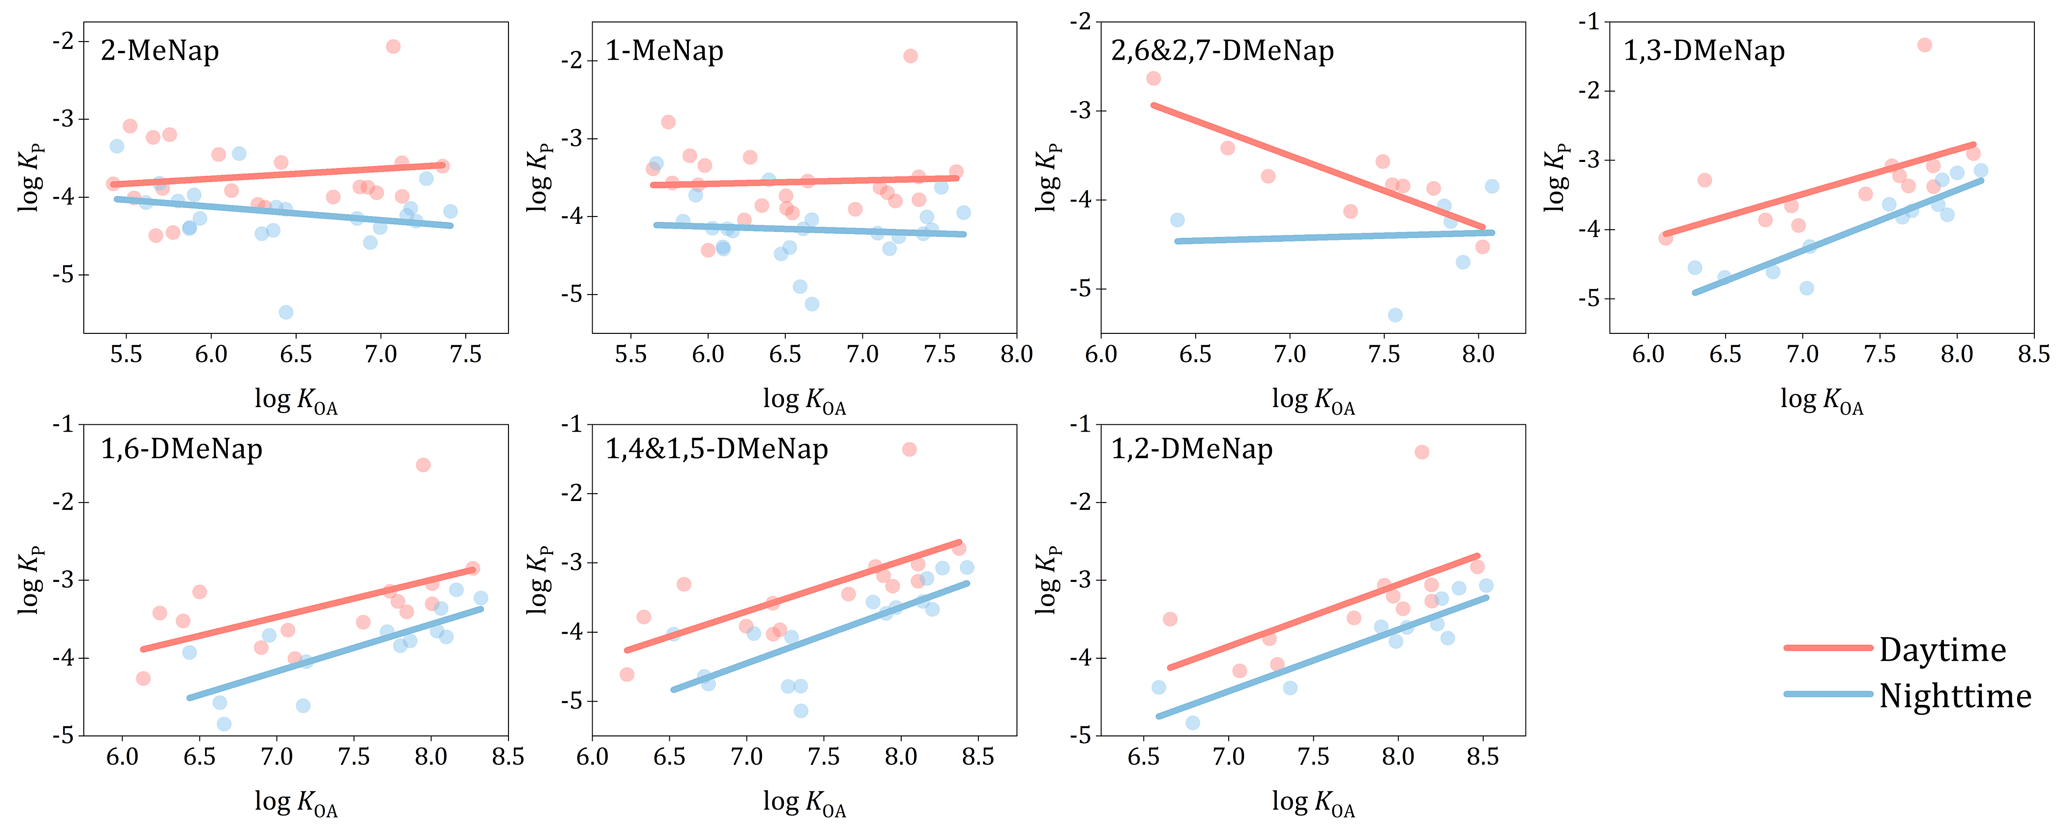
Figure 3The regression lines of log against log KOA between the daytime and nighttime for Me-Naps.
The specific relationships with concentrations between the daytime and nighttime for these Me-Naps can be elucidated by the following equation:
where CP,N and CP,D are the particulate concentrations during the nighttime and daytime, respectively, and CG,N and CG,D are the gaseous concentrations during the nighttime and daytime, respectively.
In addition, no significant difference was observed for TSP concentrations between the daytime and nighttime (GM: 94.5 µg m−3 in the daytime and 90.5 µg m−3 in the nighttime). Therefore, the following relationship can be derived:
where TSPN and TSPD are the TSP concentrations during the nighttime and daytime, respectively, and and are the values during the nighttime and daytime, respectively.
When Eqs. (3) and (4) are considered together, it can be found that the higher N D ratios of concentrations in the gas phase than those in the particle phase could cause higher values during the daytime than during the nighttime. Therefore, the higher log values in the daytime than in the nighttime for Me-Naps (Fig. 2) can be explained by the findings with the values of N D ratios between the particle phase and gas phase (Fig. S2 in the Supplement). The clarification of the influencing factors on the special diurnal variation in the concentrations for these Me-Naps would help us to understand the diurnal variation in G–P partitioning.
As noted in previous studies, the concentrations of SVOCs are influenced by emission intensity, atmospheric reactions and meteorological effects (Ohura et al., 2013; Zhang et al., 2018). In general, emission intensity can impact the concentration of SVOCs in the total phase (gas phase plus particle phase), while it cannot affect the distribution between the two phases when the steady state has been reached. In other words, this factor cannot cause the diurnal variation in the G–P partitioning for Me-Naps. Among meteorological parameters, temperature is the key factor in the G–P partitioning of SVOCs, which could result in the higher values during the nighttime than during the daytime. However, the opposite results were observed for Me-Naps in this study, which suggested the influence of other factors. As mentioned in previous studies, the higher atmospheric reactions in the daytime resulted in lower concentrations of SVOCs in the daytime than in the nighttime (Ohura et al., 2013; Reisen and Arey, 2005), which might also be responsible for the special diurnal variations in the values of Me-Naps. Previous studies also suggested that, when the rate of chemical loss is faster than the process of G–P partitioning (or the degradation in the gas phase exceeds the replenishment from the particle phase), the G–P partitioning may deviate from equilibrium state (Wilson et al., 2021). In addition, the value of increased along with the increase in the chemical loss rate (Wilson et al., 2021). Therefore, it can be concluded that the higher gaseous degradation during the daytime than during the nighttime might result in higher values during the daytime. The observation of the higher for these Me-Naps in the daytime than in the nighttime provided new insight into the deviation of from the equilibrium state for LMW SVOCs.
3.3 Influence of gaseous degradation on of LMW SVOCs
In this section, the new steady-state G–P partitioning model (Zhu et al., 2023) was applied for better understanding the impact of gaseous degradation on the deviation of from equilibrium state. Based on the model, for the LMW SVOCs, the values can be obtained using the following simplified equation, and more detailed information about the equation is presented in Text S1 in the Supplement.
where is the predicted G–P partitioning quotient of the new steady-state G–P partitioning model, KP-HB is the G–P partitioning coefficient calculated from the H–B model (the equilibrium-state model, log KP-HB= log KOA+ log fOM−11.91, where fOM is the organic matter in the particle) (Harner and Bidleman, 1998), ϕ0 is the particulate proportion of SVOCs in emission and kdeg is the degradation rate of SVOCs in gas phase (h−1).
Based on Eq. (5), the value of will increase along with the increase in kdeg. As mentioned above, the gaseous degradation in the daytime was higher than in the nighttime. Therefore, the application of Eq. (5) can demonstrate that the gaseous degradation of Me-Naps could be part of the reason for the higher in the daytime than in the nighttime.
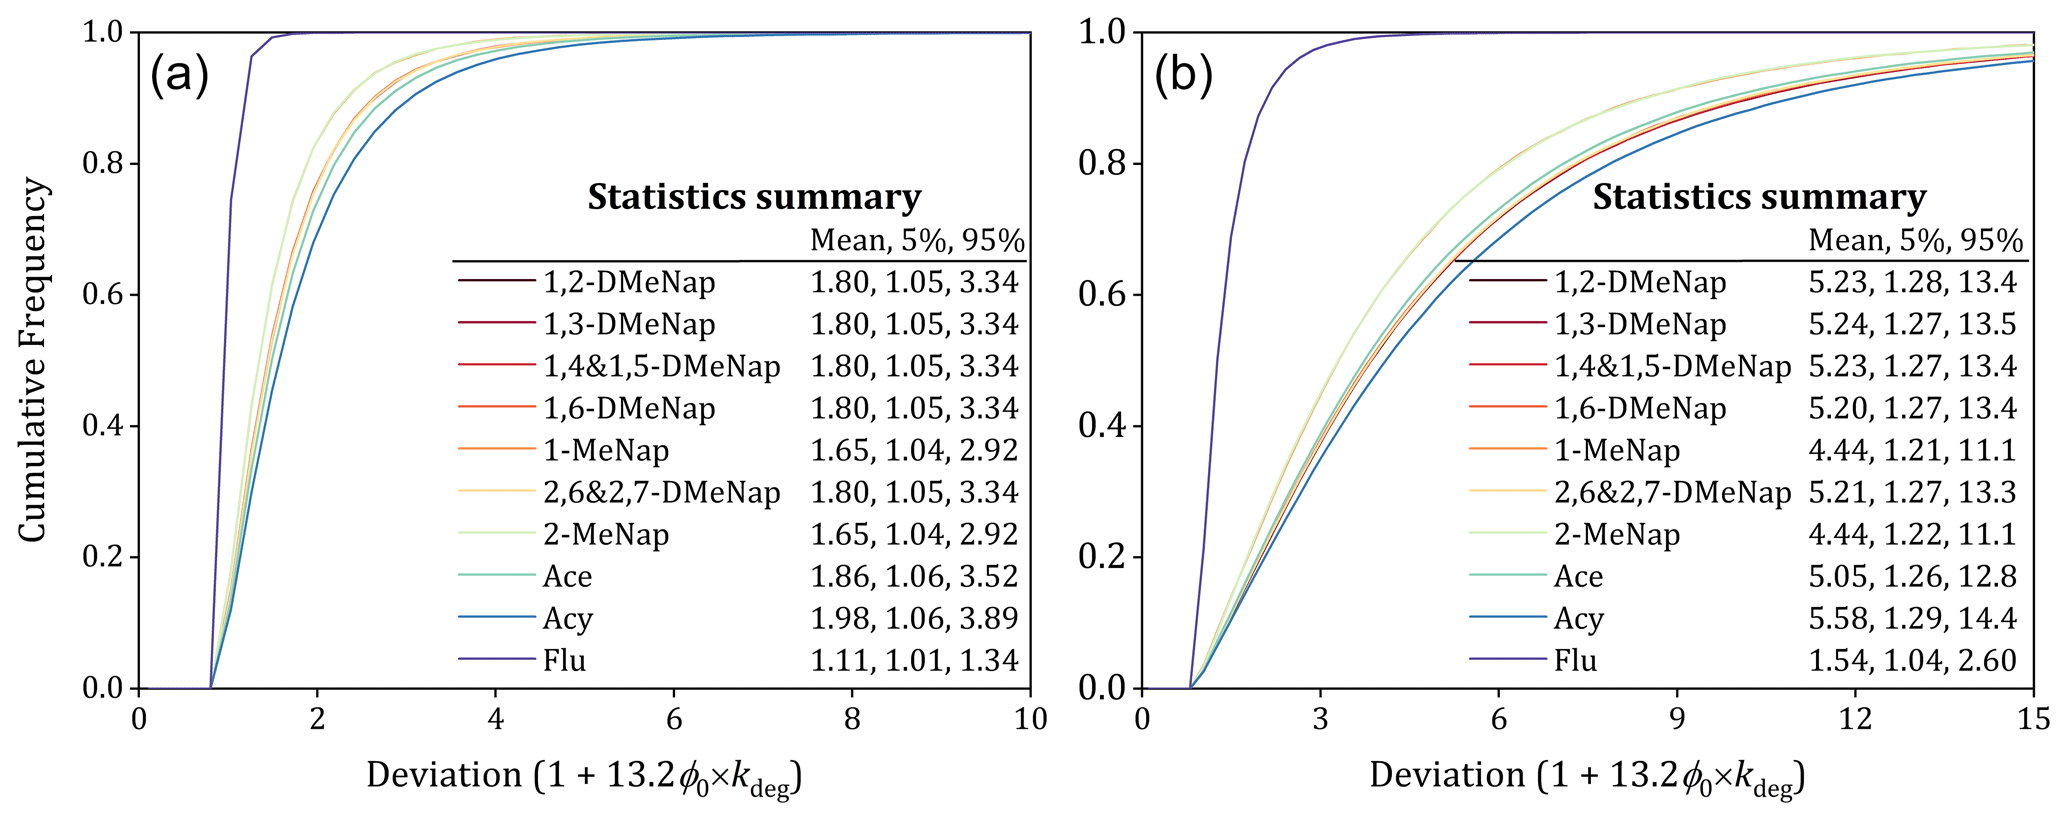
Figure 4The impact of the gaseous degradation on deviation from equilibrium state estimated based on the Monte Carlo analysis at −50 °C (a) and 50 °C (b). The following variables with their distribution patterns and confidence factors (CFs) were considered: ϕ0 (uniform distribution, 0 to 1), kdeg (lognormal distribution) and CF = 3 (Wania and Dugani, 2003).
Furthermore, the deviation with log from equilibrium state (log KP-HB) caused by the gaseous degradation for LMW SVOCs can be estimated using the equation of log (1 + 13.2ϕ0 × kdeg), which is related to kdeg and ϕ0. The kdeg values under 25 °C for the Me-Naps and the three LMW PAHs (Acy, Ace and Flu) were calculated using their half-lives from the Estimation Programs Interface (EPI) Suite (Table S5 in the Supplement). Then, the kdeg values under different temperatures (−50 and 50 °C) were calculated using the following equation (Breivik et al., 2006):
where kdeg_T is the kdeg value at temperature T, kdeg_0 is the kdeg value at 25 °C, EaA is the activation energy in air (10 000 J mol−1), R is the universal gas constant (8.314 J K mol−1), and T and T0 (25 °C) are temperature (K). The minimum and maximum kdeg values for these PAHs under different temperature are summarized in Table S5 in the Supplement.
The increasing times of influenced by the gaseous degradation deviated from equilibrium state can be calculated based on the equation 1 + 13.2ϕ0 × kdeg. To evaluate the impact of the gaseous degradation on the deviated from equilibrium state, the sensitivity analysis at conditions of −50 and 50 °C was separately conducted by the Monte Carlo analysis with 100 000 trials employing the commercial software package Oracle Crystal Ball. Consequently, the range of impact resulting from the gaseous degradation was calculated for individual PAHs, and the results are presented in Fig. 4. It can be found that the mean impact caused by the gaseous degradation on deviation for these PAHs was in the range of 1.11 to 1.98 times (90 % confidence interval: 1.01 to 3.89) (Fig. 4a) and in the range of 1.54 to 5.58 times (90 % confidence interval: 1.04 to 14.4) (Fig. 4b) at −50 and 50 °C, respectively. The influence of the gaseous degradation on the deviation of from equilibrium state could approach 1 order of magnitude, which cannot be ignored for the G–P partitioning of SVOCs.
According to previous studies, adsorption of gaseous SVOCs onto filters during sampling (Hart and Pankow, 1994) and enhanced adsorption of gaseous SVOCs onto various phases (e.g., soot phase) (Dachs and Eisenreich, 2000) can both influence the equilibrium state of G–P partitioning of SVOCs. Additionally, the present study revealed that the gaseous degradation also caused the deviation of from equilibrium state. Therefore, in the present study, the deviation of from equilibrium state caused by these factors was estimated and compared in order to deeply understand the influence of gaseous degradation. As mentioned in the above section, the mean deviation resulting from gaseous degradation was estimated ( to 5.58 times increased). The deviation caused by the influence of the soot phase within the particles was estimated by averaging the difference between the predictions of the H–B model (Harner and Bidleman, 1998) and the D–E model (Dachs and Eisenreich, 2000) for LMW SVOCs with the range of log KOA from 5 to 9. The increasing times of caused by the influence of the soot phase within the particles were in the range of 2.68 to 7.70 times. A previous study pointed out that the effect of the adsorption of gaseous SVOCs onto filters could increase about 1.2 to 1.6 times (Hart and Pankow, 1994). Therefore, it can be found that the deviation of from equilibrium state caused by the gaseous degradation was comparable with that caused by the adsorption of the soot phase, and both were higher than that caused by the adsorption of gaseous SVOCs onto filters. Therefore, it can be concluded that the influence of gaseous degradation should also be considered for the G–P partitioning models of SVOCs, especially for the LMW SVOCs.
In this study, the gaseous degradation was speculated as the reason for the difference in for Me-Naps between the daytime and nighttime, which might result in the deviation of from equilibrium state for LMW SVOCs. In addition, the new steady-state G–P partitioning model was used, which demonstrated that the gaseous degradation could deviate the from equilibrium state. However, there were some limitations in this study. Firstly, the different breakthrough values might occur between the daytime and nighttime, considering their different temperature. The influence of the breakthrough on was calculated, which could result in 1.20 to 1.27 times higher in the daytime than in the nighttime if the breakthrough (17 % to 21 %) only occurred in the daytime and not in the nighttime. However, the increase in caused by the breakthrough cannot fully explain the observed diurnal variation in between the daytime and nighttime in this study (2.95 to 4.65 times). Secondly, the present study only considered the gaseous degradation related to the reaction with hydroxyl radicals. However, the gaseous degradation routes, like the other atmospheric oxidation pathways and photodegradation, were not included, which may lead to an underestimation of the impact of the total gaseous degradation. Thirdly, the previous studies have demonstrated that PAHs can be entrapped within highly viscous, partially forming secondary organic aerosol particles during particle formation (Zelenyuk et al., 2012; Shrivastava et al., 2017), which could cause the non-exchangeable SVOCs within particles. However, the presence and influence of the non-exchangeable SVOCs within particles on the G–P partitioning behavior were not considered in this study. Therefore, it is imperative to conduct studies for other influencing factors on the G–P partitioning behavior of SVOCs in future, such as the total gaseous degradation, the non-exchangeable SVOCs within particles and the advection of air masses.
Code and data are available upon request to the corresponding author.
The supplement related to this article is available online at: https://doi.org/10.5194/acp-24-6095-2024-supplement.
FJZ: conceptualization, methodology, investigation and writing (original draft preparation). ZFZ: methodology and writing (review and editing). LYL: writing (review and editing). PFY: writing (review and editing). PTH: writing (review and editing). GBR: writing (review and editing). MQ: writing (review and editing). WLM: conceptualization, methodology and writing (review and editing).
The contact author has declared that none of the authors has any competing interests.
Publisher’s note: Copernicus Publications remains neutral with regard to jurisdictional claims made in the text, published maps, institutional affiliations, or any other geographical representation in this paper. While Copernicus Publications makes every effort to include appropriate place names, the final responsibility lies with the authors.
The authors are grateful for the valuable referee comments and community comments. In addition, this research has been supported by the Heilongjiang Touyan Innovation Team Program, China.
This research has been supported by the National Natural Science Foundation of China (grant nos. 42077341 and 42377377). This study was partially supported by the High-Level Talent Funding Project of Hebei Province, China (grant no. B2023003020).
This paper was edited by John Liggio and reviewed by two anonymous referees.
Baskaran, S., Lei, Y. D., and Wania, F.: Reliable prediction of the octanol-air partition ratio, Environ. Toxicol. Chem., 40, 3166–3180, https://doi.org/10.1002/etc.5201, 2021.
Breivik, K., Wania, F., Muir, D. C. G., Alaee, M., Backus, S., and Pacepavicius, G.: Empirical and modeling evidence of the long-range atmospheric transport of decabromodiphenyl ether, Environ. Sci. Technol., 40, 4612–4618, https://doi.org/10.1021/es060730s, 2006.
Cao, R., Zhang, H., Geng, N., Fu, Q., Teng, M., Zou, L., Gao, Y., and Chen, J.: Diurnal variations of atmospheric polycyclic aromatic hydrocarbons (PAHs) during three sequent winter haze episodes in Beijing, China, Sci. Total Environ., 625, 1486–1493, https://doi.org/10.1016/j.scitotenv.2017.12.335, 2018.
Dachs, J. and Eisenreich, S. J.: Adsorption onto aerosol soot carbon dominates gas-particle partitioning of polycyclic aromatic hydrocarbons, Environ. Sci. Technol., 34, 3690–3697, https://doi.org/10.1021/es991201, 2000.
Harner, T. and Bidleman, T. F.: Octanol-air partition coefficient for describing particle/gas partitioning of aromatic compounds in urban air, Environ. Sci. Technol., 32, 1494–1502, https://doi.org/10.1021/es970890r, 1998.
Hart, K. M. and Pankow, J. F.: High-volume air sampler for particle and gas sampling, 2. Use of backup filters to correct for the adsorption of gas-phase polycyclic aromatic-hydrocarbons to the front filter, Environ. Sci. Technol., 28, 655–661, https://doi.org/10.1021/es00053a019, 1994.
Hart, K. M., Isabelle, L. M., and Pankow, J. F.: High-volume air sampler for particle and gas sampling, 1. Design and gas sampling performance, Environ. Sci. Technol., 26, 1048–1052, https://doi.org/10.1021/es00029a027, 1992.
Hu, P. T., Su, P. H., Ma, W. L., Zhang, Z. F., Liu, L. Y., Song, W. W., Qiao, L. N., Tian, C. G., Macdonald, R. W., Nikolaev, A., Cao, Z. G., and Li, Y. F.: New equation to predict size-resolved gas-particle partitioning quotients for polybrominated diphenyl ethers, J. Hazard. Mater., 400, 123245, https://doi.org/10.1016/j.jhazmat.2020.123245, 2020.
Hu, P. T., Ma, W. L., Zhang, Z. F., Liu, L. Y., Song, W. W., Cao, Z. G., Macdonald, R. W., Nikolaev, A., Li, L., and Li, Y. F.: Approach to predicting the size-dependent inhalation intake of particulate novel brominated flame retardants, Environ. Sci. Technol., 55, 15236–15245, https://doi.org/10.1021/acs.est.1c03749, 2021.
Li, Y. F., Ma, W. L., and Yang, M.: Prediction of gas/particle partitioning of polybrominated diphenyl ethers (PBDEs) in global air: A theoretical study, Atmos. Chem. Phys., 15, 1669–1681, https://doi.org/10.5194/acp-15-1669-2015, 2015.
Li, Y. F. and Jia, H. L.: Prediction of gas/particle partition quotients of polybrominated diphenyl ethers (PBDEs) in north temperate zone air: An empirical approach, Ecotox. Environ. Safe., 108, 65–71, https://doi.org/10.1016/j.ecoenv.2014.05.028, 2014.
Li, Y. F., Qiao, L. N., Ren, N. Q., Sverko, E., Mackay, D., and Macdonald, R. W.: Decabrominated diphenyl ethers (BDE-209) in Chinese and global air: Levels, gas/particle partitioning, and long-range transport: Is long-range transport of BDE-209 really governed by the movement of particles?, Environ. Sci. Technol., 51, 1035–1042, https://doi.org/10.1021/acs.est.6b05395, 2017.
Li, Y. F., Qiao, L. N., Ren, N. Q., Macdonald, R. W., and Kannan, K.: Gas/particle partitioning of semi-volatile organic compounds in the atmosphere: Transition from unsteady to steady state, Sci. Total Environ., 710, 136394, https://doi.org/10.1016/j.scitotenv.2019.136394, 2020.
Ma, W. L., Zhu, F. J., Liu, L. Y., Jia, H. L., Yang, M., and Li, Y.-F.: PAHs in Chinese atmosphere: Gas/particle partitioning, Sci. Total Environ., 693, 133623, https://doi.org/10.1016/j.scitotenv.2019.133623, 2019.
Ma, W. L., Zhu, F. J., Hu, P. T., Qiao, L. N., and Li, Y.F.: Gas/particle partitioning of PAHs based on equilibrium-state model and steady-state model, Sci. Total Environ., 706, 136029, https://doi.org/10.1016/j.scitotenv.2019.136029, 2020.
Mackay, D., Celsie, A. K. D., and Parnis, J. M.: Kinetic delay in partitioning and parallel particle pathways: Underappreciated aspects of environmental transport, Environ. Sci. Technol., 53, 234–241, https://doi.org/10.1021/acs.est.8b04514, 2019.
Ohura, T., Horii, Y., Kojima, M., and Kamiya, Y.: Diurnal variability of chlorinated polycyclic aromatic hydrocarbons in urban air, Japan, Atmos. Environ., 81, 84–91, https://doi.org/10.1016/j.atmosenv.2013.08.044, 2013.
Qiao, L. N., Hu, P. T., Macdonald, R., Kannan, K., Nikolaev, A., and Li, Y. F.: Modeling gas/particle partitioning of polybrominated diphenyl ethers (PBDEs) in the atmosphere: A review, Sci. Total Environ., 729, 138962, https://doi.org/10.1016/j.scitotenv.2020.138962, 2020.
Reisen, F. and Arey, J.: Atmospheric reactions influence seasonal PAH and nitro-PAH concentrations in the Los Angeles Basin, Environ. Sci. Technol., 39, 64–73, https://doi.org/10.1021/es035454l, 2005.
Sadiki, M. and Poissant, L.: Atmospheric concentrations and gas-particle partitions of pesticides: Comparisons between measured and gas-particle partitioning models from source and receptor sites, Atmos. Environ., 42, 8288–8299, https://doi.org/10.1016/j.atmosenv.2008.07.041, 2008.
Shahpoury, P., Lammel, G., Albinet, A., Sofuoglu, A., Dumanoglu, Y., Sofuoglu, S. C., Wagner, Z., and Zdimal, V.: Evaluation of a conceptual model for gas-particle partitioning of polycyclic aromatic hydrocarbons using polyparameter linear free energy relationships, Environ. Sci. Technol., 50, 12312–12319, https://doi.org/10.1021/acs.est.6b02158, 2016.
Shrivastava, M., Lou, S. J., Zelenyuk, A., Easter, R. C., Corley, R. A., Thrall, B. D., Rasch, P. J., Fast, J. D., Simonich, S. L. M., Shen, H. Z., and Tao, S.: Global long-range transport and lung cancer risk from polycyclic aromatic hydrocarbons shielded by coatings of organic aerosol, P. Natl. Acad. Sci. USA, 114, 1246–1251, https://doi.org/10.1073/pnas.1618475114, 2017.
Ulrich, N., Endo, S., Brown, T. N., Watanabe, N., Bronner, G., Abraham, M. H., and Goss, K.-U.: UFZ-LSER database v 3.2.1 [internet], Leipzig, Germany, Helmholtz Centre for Environmental Research-UFZ, http://www.ufz.de/lserd (last access: 24 April 2024), 2017.
Wang, W. T., Simonich, S. L. M., Wang, W., Giri, B., Zhao, J. Y., Xue, M., Cao, J., Lu, X. X., and Tao, S.: Atmospheric polycyclic aromatic hydrocarbon concentrations and gas/particle partitioning at background, rural village and urban sites in the North China plain, Atmos. Res., 99, 197–206, https://doi.org/10.1016/j.atmosres.2010.10.002, 2011.
Wania, F. and Dugani, C. B.: Assessing the long-range transport potential of polybrominated diphenyl ethers: A comparison of four multimedia models, Environ. Toxicol. Chem., 22, 1252–1261, https://doi.org/10.1002/etc.5620220610, 2003.
Wilson, J., Pöschl, U., Shiraiwa, M., and Berkemeier, T.: Non-equilibrium interplay between gas–particle partitioning and multiphase chemical reactions of semi-volatile compounds: mechanistic insights and practical implications for atmospheric modeling of polycyclic aromatic hydrocarbons, Atmos. Chem. Phys., 21, 6175–6198, https://doi.org/10.5194/acp-21-6175-2021, 2021.
Zelenyuk, A., Imre, D., Beránek, J., Abramson, E., Wilson, J., and Shrivastava, M.: Synergy between secondary organic aerosols and long-range transport of polycyclic aromatic hydrocarbons, Environ. Sci. Technol., 46, 12459–12466, https://doi.org/10.1021/es302743z, 2012.
Zhang, J. M., Yang, L. X., Mellouki, A., Chen, J. M., Chen, X. F., Gao, Y., Jiang, P., Li, Y. Y., Yu, H., and Wang, W. X.: Diurnal concentrations, sources, and cancer risk assessments of PM2.5-bound PAHs, NPAHs, and OPAHs in urban, marine and mountain environments, Chemosphere, 209, 147–155, https://doi.org/10.1016/j.chemosphere.2018.06.054, 2018.
Zhang, X. Q. and McMurry, P. H.: Theoretical analysis of evaporative losses of adsorbed or absorbed species during atmospheric aerosol sampling, Environ. Sci. Technol., 25, 456–459, https://doi.org/10.1021/es00015a012, 1991.
Zhu, F. J., Ma, W. L., Hu, P. T., Zhang, Z. F., and Li, Y. F.: Temporal trends of atmospheric PAHs: Implications for the influence of the clean air action, J. Clean. Prod., 296, 126494, https://doi.org/10.1016/j.jclepro.2021.126494, 2021a.
Zhu, F. J., Ma, W. L., Zhang, Z. F., Yang, P. F., Hu, P. T., Liu, L. Y., and Song, W. W.: Prediction of the gas/particle partitioning quotient of PAHs based on ambient temperature, Sci. Total Environ., 811, 151411, https://doi.org/10.1016/j.scitotenv.2021.151411, 2021b.
Zhu, F. J., Arina, S., Zhang, Z. F., Liu, L. Y., Song, W. W., Cheng, Y., Liu, J. M., and Ma, W. L.: Non-equilibrium influence on G/P partitioning of PAHs: Evidence from the diurnal and nocturnal variation, Chemosphere, 294, 133722, https://doi.org/10.1016/j.chemosphere.2022.133722, 2022.
Zhu, F. J., Hu, P. T., and Ma, W. L.: A new steady-state gas–particle partitioning model of polycyclic aromatic hydrocarbons: Implication for the influence of the particulate proportion in emissions, Atmos. Chem. Phys., 23, 8583–8590, https://doi.org/10.5194/acp-23-8583-2023, 2023.