the Creative Commons Attribution 4.0 License.
the Creative Commons Attribution 4.0 License.
 | 22 May 2024
Bayesian inference-based estimation of hourly primary and secondary organic carbon in suburban Hong Kong: multi-temporal-scale variations and evolution characteristics during PM2.5 episodes
Shan Wang
Kezheng Liao
Zijing Zhang
Yuk Ying Cheng
Qiongqiong Wang
Hanzhe Chen
Observation-based data of primary and secondary organic carbon in ambient particulate matter (PM) are essential for model evaluation, climate and air quality research, health effect assessments, and mitigation policy development. Since there are no direct measurement tools available to quantify primary organic (POC) and secondary organic carbon (SOC) as separate quantities, their estimation relies on inference approaches using relevant measurable PM constituents. In this study, we measured hourly carbonaceous components and major ions in PM2.5 for a year and a half in suburban Hong Kong from July 2020 to December 2021. We differentiated POC and SOC using a novel Bayesian inference approach. The hourly POC and SOC data allowed us to examine temporal characteristics varying from diurnal and weekly patterns to seasonal variations, as well as their evolution characteristics during individual PM2.5 episodes. A total of 65 city-wide PM2.5 episodes were identified throughout the entire study period, with SOC contributions during individual episodes varying from 10 % to 66 %. In summertime typhoon episodes, elevated SOC levels were observed during daytime hours, and high temperature and NOx levels were identified as significant factors contributing to episodic SOC formation. Winter haze episodes exhibited high SOC levels, likely due to persistent influences from regional transport originating from the northern region to the sampling site. Enhanced SOC formation was observed with increase in the nocturnal NO3 radical (indicated by the surrogate quantity of [NO2][O3]) and under conditions characterized by high water content and strong acidity. These results suggest that both NO3 chemistry and acid-catalyzed aqueous-phase reactions likely make notable contributions to SOC formation during winter haze episodes. The methodology employed in this study for estimating POC and SOC provides practical guidance for other locations with similar monitoring capabilities in place. The availability of hourly POC and SOC data is invaluable for evaluating and improving atmospheric models, as well as understanding the evolution processes of PM pollution episodes. This, in turn, leads to more accurate model predictions and a better understanding of the contributing sources and processes.
- Article
(6127 KB) - Full-text XML
-
Supplement
(4781 KB) - BibTeX
- EndNote


Carbonaceous aerosol is a major component of PM2.5 (particulate matter with an aerodynamic diameter of less than 2.5 µm), accounting for 20 %–90 % of its total mass in ambient environment (Seinfeld and Pandis, 1998; Kroll et al., 2011). It has been known to have adverse effects on regional to global climate, air quality, and human health (Nel, 2005; Bond et al., 2013; R. Huang et al., 2014). Carbonaceous components can generally be classified into elemental carbon (EC) and organic carbon (OC). EC refers to the soot-like amorphous carbon emitted directly from incomplete combustion processes (Chow et al., 2010), while OC is a more complex mixture of organic compounds that can be either primarily emitted from anthropogenic sources (e.g., biomass burning, fossil fuel combustion, and cooking) and biogenic sources (e.g., plant debris) or secondarily formed through oxidation reactions (Robinson et al., 2007; Hallquist et al., 2009; Zhao et al., 2007; Christian et al., 2003). Therefore, OC can be further grouped into primary OC (POC) and secondary OC (SOC). Accurately quantifying and estimating POC and SOC through observation-based measurement is the precondition for comprehending their unique characteristics, such as relative contributions, temporal variations, and chemical evolution. This knowledge is crucial for refining atmospheric models and developing more targeted strategies to reduce carbonaceous aerosol emissions, mitigate climate change, and minimize human exposure.
The thermal–optical protocols have been widely used for OC and EC measurements (Klingshirn et al., 2019; Chow et al., 2001). However, accurately determining POC and SOC remains challenging since there are no instrumental tools available for the direct measurement of POC and SOC. Several data treatment methodologies have been developed to estimate POC and SOC levels. One such approach is the chemical mass balance (CMB) receptor model, which apportions POC based on the chemical profile of individual known primary sources, and the unmapped mass is then referred to as SOC (Pachon et al., 2010; Shi et al., 2011; Schauer and Cass, 2000). However, the uncertainty is large due to limited or insufficient information on the SOC source profiles in CMB simulations (Stone et al., 2009). Another widely used receptor model, positive matrix factorization (PMF), apportions the sources of OC based on the comprehensive chemical speciation data (Ke et al., 2008; Jaeckels et al., 2007). Studies have shown that PMF model output may underestimate the contributions of secondary organic aerosols when the specific molecular organic tracers are absent in the input data matrix (Wang et al., 2017; Pachon et al., 2010). These limitations compromise the applicability of receptor models for accurately quantifying the POC and SOC mass. Alternative approaches include the EC tracer method, which relies on the EC-to-OC ratio (Day et al., 2015; Turpin and Huntzicker, 1991), and the multiple linear regression (MLR) model (Blanchard et al., 2008). The former assumes that POC and EC share common combustion sources, allowing the POCEC ratio to serve as an indicator to identify the primary sources, which can be determined by utilizing the minimum ratio (MIN) method (Castro et al., 1999). This assumption is less justified and compromised with naiveté, as observed OCEC ratios can span over an order of magnitude in ambient measurements, which could be affected by measurement artifacts and fluctuate under different meteorological conditions (Yuan et al., 2006). Furthermore, the lack of a widely accepted criterion for percentile selection can bring up the bias to SOC estimation (Wu et al., 2019). The minimum R-squared (MRS) method is a less arbitrary approach to determine the POCEC ratio for primary sources. In the MRS method, the optimal primary POCEC ratio is determined by minimizing the Pearson's correlation coefficient between EC and deduced SOC (Wu and Yu, 2016). The MRS method has been increasingly used in studies with the hourly measurements in various environments (Wu et al., 2019; Yao et al., 2020; Bian et al., 2018). However, it has been proven that the MRS method inevitably yields a POCEC ratio that renders EC and deduced SOC completely uncorrelated. This contradicts our expectation of a weak yet not negligible correlation between EC and SOC, since some SOC species could be formed from precursors co-emitted with EC through combustion activities (Jathar et al., 2013; Gentner et al., 2017; Deng et al., 2020), and both SOC and EC are influenced by regional transport or changes in the boundary layer height. On the other hand, the MLR model is a powerful statistical tool to estimate SOC by considering highly associated variables rather than the difference between measured OC and estimated POC (Kim et al., 2012; Pachon et al., 2010). Another approach, the secondary organic aerosol (SOA) tracer method, utilizes SOA tracer yield data derived from chamber experiments to estimate the SOC and SOA contributions from several precursors (Kleindienst et al., 2012, 2007). However, the availability of SOA tracer data is limited to only a small number of common precursors, leading to a bias in the quantification of SOC mass (Cheng et al., 2021).
Compared to the abovementioned approaches, our research group has recently developed a novel Bayesian inference (BI) method that allows for the quantification of POC and SOC based on measurement data of PM major components (i.e., OC, EC, and major secondary inorganic ions). This approach provides better agreement with tracer-based PMF results than traditional techniques. The principle of this approach can be found in Liao et al. (2023). Briefly, our method differentiates POC and SOC by incorporating prior knowledge and measurement data of major PM components to make probabilistic inferences about the unknown POC and SOC mass. This is achieved by considering the parameters as random variables rather than constants, which distinguishes it from the multiple linear regression model. This innovation in methodology offers the potential for quantifying POC and SOC with higher accuracy and lower computational complexity.
Hong Kong is located in southern China and is part of the Guangdong–Hong Kong–Macau Greater Bay Area (GBA) economic and business hub. Since the implementation of the Clean Air Plan in 2013 by the Hong Kong Environment Bureau, air pollution in Hong Kong has significantly improved (Hong Kong Environment Bureau, 2013). Numerous studies have been conducted to measure variations in chemical speciation components and potential sources over the past few years, but these are mainly based on 24 h offline filter measurements (Hu et al., 2010; Cao et al., 2003; Li et al., 2013). As such, information on POC and SOC in PM2.5 is unavailable down to hourly timescales and for continuous and extended durations covering all seasons. The limited temporal resolution of previous studies has prevented the exploration of diurnal variations and rapid evolutionary processes, which are crucial for understanding SOC formation in the ambient environment. Moreover, long-term continuous measurements are limited in Hong Kong, hindering our comprehensive understanding of episodic events occurring under different seasonal synoptic conditions.
In this study, continuous online monitoring of atmospheric PM2.5 and carbonaceous components (i.e., OC and EC) was carried out at a regional suburban site in Hong Kong for nearly a year and a half from 16 July 2020 to 31 December 2021. The objectives of this study are threefold: (1) to identify the optimal method setup and to derive hourly POC and SOC using the novel Bayesian inference approach; (2) to characterize variations in POC and SOC at multi-temporal scales, including diurnal, weekday–weekend, and seasonal variations, and identify factors influencing SOC formation; and (3) to investigate SOC variations during city-wide high-PM2.5 episodes under different seasonal synoptic conditions. The methodology of this work could serve as a valuable guide for other locations with similar monitoring capabilities. The observation-based POC and SOC data and insights gained regarding pollution processes will provide valuable observation constraints for improving air quality models for our region and other locations.
2.1 Aerosol sampling and measurement
The aerosol measurements were conducted at the Hong Kong University of Science and Technology Air Quality Research Supersite (HKUST supersite), which is located on the HKUST campus. A detailed description of this site can be found in our previous papers (Q. Wang et al., 2022; Li et al., 2022). Briefly, The HKUST supersite is situated on the hillside of Clear Water Bay in the eastern coastal area of Hong Kong (22.33° N, 114.27° E, Fig. S1 in the Supplement). It is ∼ 17 km north of the city center and 2.2 km south of the nearby commercial and urban center of Tseung Kwan O. The sampling site experiences outflow from urban areas in the northwest and southwest directions during 35 % of the sampling period. This location represents a typical suburban site. Surrounding the sampling site are evergreen broadleaved woods that are known to emit high levels of biogenic volatile organic compounds (VOCs) (Tsui et al., 2009). The site is characterized as low to moderately polluted, with limited local anthropogenic emissions originating from a nearby construction site for a dormitory and a small canteen. The construction site operates from Monday to Saturday between 09:00 and 18:00 LT. However, it is important to note that the canteen's operations were scaled down to minimum levels during the study period due to the ongoing pandemic.
The sampling period lasted for nearly a year and a half from 16 July 2020 to 31 December 2021. Multiple online instruments of hourly time resolution or higher were deployed to measure the PM2.5 levels, its major components, and gaseous pollutants and meteorological parameters. Briefly, PM2.5 mass concentrations were measured by a SHARP monitor (Model 5030i; Thermo Fisher Scientific, USA), major water-soluble inorganic ions (sulfate, nitrate, and ammonium) were monitored by a monitor for aerosols and gases in ambient air (MARGA 1S; Metrohm AG, Switzerland), and carbonaceous components (organic carbon, OC, and elemental carbon, EC) were determined by a semicontinuous OC/EC analyzer (model RT-3179; Sunset Laboratory Inc., USA). Gaseous pollutants (O3, NO, and NOx) were measured by gas analyzers (Teledyne API 400A, USA; Ecotech Serinus 40, USA, respectively). Meteorological parameters, including temperature, relative humidity (RH), wind speed (WS), and wind direction (WD) were measured by the 10 m automatic weather station (AWS tower, Model 6000, Belfort Instrument Company, USA). The output data from all the abovementioned instruments were averaged to a resolution of 1 h and appropriately aligned for the subsequent analysis. Hourly SHARP PM2.5 concentrations at the HKUST supersite were corrected due to the measurement bias; for further discussion, see Q. Wang et al. (2022), Wang et al. (2023), and Sect. S1 in the Supplement. The PM2.5 levels and gas pollutant data in a nearby rural station (Tap Mun, MB) ∼ 15 km to the northeast were used as reference for days before October 2020 and after November 2021, during which the respective instruments at our sites were either unavailable or under maintenance. The details in treatment for the missing data can be found in our previous studies (Q. Wang et al., 2022).
2.2 Estimation of secondary and primary organic carbon by the Bayesian inference approach
In this study, the estimation of POC and SOC were performed by the Bayesian inference approach, which is newly developed in our group (Liao et al., 2023). This method relies on only major chemical composition data that are commonly measured. Specifically, the concentrations of primary and secondary OC are calculated based on Eqs. (1) and (2):
where OC and EC are the measured hourly concentrations of OC and EC, respectively; SIA represents one of the major secondary inorganic ions (i.e., , , and ); and K1 and K2 are the POCEC ratio and SOCSIA ratio that are yet to be deduced using Eq. (3), respectively.
where p(K1,K2) is the prior distribution of (K1,K2), is the likelihood function of observation data, and is the posterior distribution to be determined. The BI principle is rooted in Bayes' theorem and embodied in Eq. (3). With the aim of determining the posterior distribution, we first find out the likelihood function of the observation data with respect to the parameters we want to estimate and the prior distribution of such parameters Equation (4) gives the likelihood function in our Bayesian model by assuming a normally distributed error term.
In the above equation, σEC, σOC, and σSIA are the uncertainties for EC, OC, and SIA, respectively. The prior distributions of K1 and K2 are set following Eq. (5), signifying the prior knowledge of these two ratios before analyzing the observation data.
Liao et al. (2023) recommend setting these two prior distributions fairly wide to avoid unnecessary constraints, and the influence from different prior distributions becomes negligible when there are adequate observation data according to their sensitivity analysis. Based on our experience of applying Bayesian inference to estimate POC and SOC, when there are around 10 or more observations in one data set, the estimated posterior distribution of (K1, K2) will be robust enough regardless of the prior distribution. Given that the posterior distribution of (K1, K2) cannot be solved analytically, we resort to Markov chain Monte Carlo (MCMC) sampling for numerical estimation, where we construct a Markov chain whose limit distribution is the same as the posterior distribution of interest. The mean values of (K1, K2) from such sampling are then used to deduce POC and SOC using Eq. (2).
Finally, from basic error propagation analysis, we further define the uncertainties of POC and SOC (i.e., σPOC and σSOC) as per Eq. (6):
Compared to other statistical methods (i.e., the MIN, MRS, and MLR methods), the BI method allows greater flexibility in model establishment and comprehensive consideration of all measurement uncertainties.
2.3 Aerosol liquid water content and acidity estimation
The aerosol water content (AWC) and acidity (pH) were calculated by the thermodynamic equilibrium model ISORROPIA II (Fountoukis and Nenes, 2007). The calculation is performed based on the assumption that the aerosol is in metastable state and at chemical equilibrium between the aerosol and gas phase. The model is set in forward mode, with the inputs from MARGA measured species of aerosol-phase Na+, K+, Mg2+, Ca2+, , , , gas-phase HCl, HNO3, NH3, ambient temperature, and RH. Detailed information and validation of the model calculation are presented in Sect. S2.
3.1 Determination of POC and SOC using the BI method
Considering the emission sources and secondary formation processes would vary from season to season, we quantified POC and SOC in each individual season to account for seasonal variations. The division of seasons was based on upper-level wind direction, sea level pressure, and dew point (Yu, 2002; Wong et al., 2022), as shown in Fig. S4. Specifically, the seasons were 2020 summer (16 July–28 September 2020), 2020 fall (8 October–23 November 2020), 2020–2021 winter (24 November 2020–28 February 2021), 2021 spring (1 March–2 May 2021), 2021 summer (3 May–7 October 2021), 2021 fall (8 October–24 November 2021), and 2021 winter (25 November–31 December 2021). Within each season, the data were further divided into 24 (h)×4 (wind directions) groups by hour and wind direction (i.e., northwestern, northeastern, southwestern, southeastern) to account for the diurnal and wind direction variations. The BI model was then applied to each group of data. The BI method's inherent advantage allows for this fine division of measurement data, which ensures relatively constant K1 and K2 within each group.
Regarding the selection of the optimal SIA species for tracking SOA in the BI method, Liao et al. (2023) found that the simulation results using sulfate or ammonium as the SOC tracer yielded better agreement with the reference results compared to using nitrate. This discrepancy could be attributed to larger measurement artifacts associated with evaporation loss of nitrate in the offline measured data set. For the online measurements, the simulation results using nitrate were also inferior to those using sulfate or ammonium, as the formed SOA is largely retained in the fine particles, while nitrate has propensity to partition onto coarse particles. To further determine the optimal SOC tracers, an uncertainty analysis utilizing an error estimation method was conducted. As shown in Fig. S5a, the absolute concentration and uncertainty of POC were highly correlated and showed minimal difference between BI- and BI-, whereas the uncertainties for SOC were much larger for BI- than BI-. The relative uncertainty, calculated as the uncertainty divided by the concentration, yielded comparable values for POC with both indicators (Fig. S5b), while BI- generated larger relative uncertainties for SOC compared to BI-. This suggests that sulfate is a better tracer for quantifying SOC levels in our data set. This conclusion is further supported by a statistical criterion, the Bayesian information criterion (BIC), which is universally used in model selection. Lower BIC values indicate better modeling results. The BIC values for the three SOC tracers were calculated for each individual season, with sulfate consistently yielding the lowest value (Table S1 in the Supplement). Thus, the BI-derived POC and SOC using sulfate as the SOC tracer are considered to provide more accurate data with lower uncertainties and are consequently adopted in the subsequent analysis. By incorporating the uncertainties of model estimations into data closure, BIC is designed to help evaluate performance among different models applied to the same data set. In future applications of the BI model, where specific tracers for aerosol sources are unavailable, the use of PMF may not be feasible. In such cases, we recommend relying on BIC as a reliable method to choose the most suitable SOC tracer.
Figure 1 shows the distribution and seasonal variations in K1 and K2 values determined for the 24 × 4 groups. The POCEC ratio (K1) is influenced by the predominant primary sources and meteorological conditions. Due to the monsoon shift in Hong Kong, air pollution during summer is primarily under the control of local emissions, while regional transport from the continent to the north has a dominant influence in cold seasons. Hence, different predominant sources for POC and EC in Hong Kong are expected. Additionally, many POC species in PM2.5 are semi-volatile and are subject to gas-phase partitioning equilibrium, leading to more POC retained in the particle phase at lower temperatures. These factors contribute to a higher K1 values in winter compared to summer (Fig. 1a) (p<0.01) and a more pronounced diurnal pattern in summer (Fig. 1b). The diurnal variations of K1 in Fig. 1b align closely with the local rush hours, during which vehicular emissions exert a dominant influence among all primary sources. In comparison to non-vehicular primary sources, carbonaceous materials originating from vehicular sources exhibit much higher levels of EC, resulting in a lower OCEC ratio. During periods of heavy traffic, the overall POCEC ratio decreases, approaching the typical OCEC ratio observed for vehicular emissions. On the other hand, the SOCSIA ratio (K2) is influenced by the sources of their precursors, the strength of secondary formation in the atmosphere, and meteorological parameters. Figure 1a shows that K2 is higher (larger mean values) and less variable (smaller inter-quantile ranges) in winter (p<0.01), and Fig. 1b demonstrates that hourly K2 values are more stable in winter compared to summer. The long-range regional transport during winter could account for the reduced variability in K2 during cold seasons.
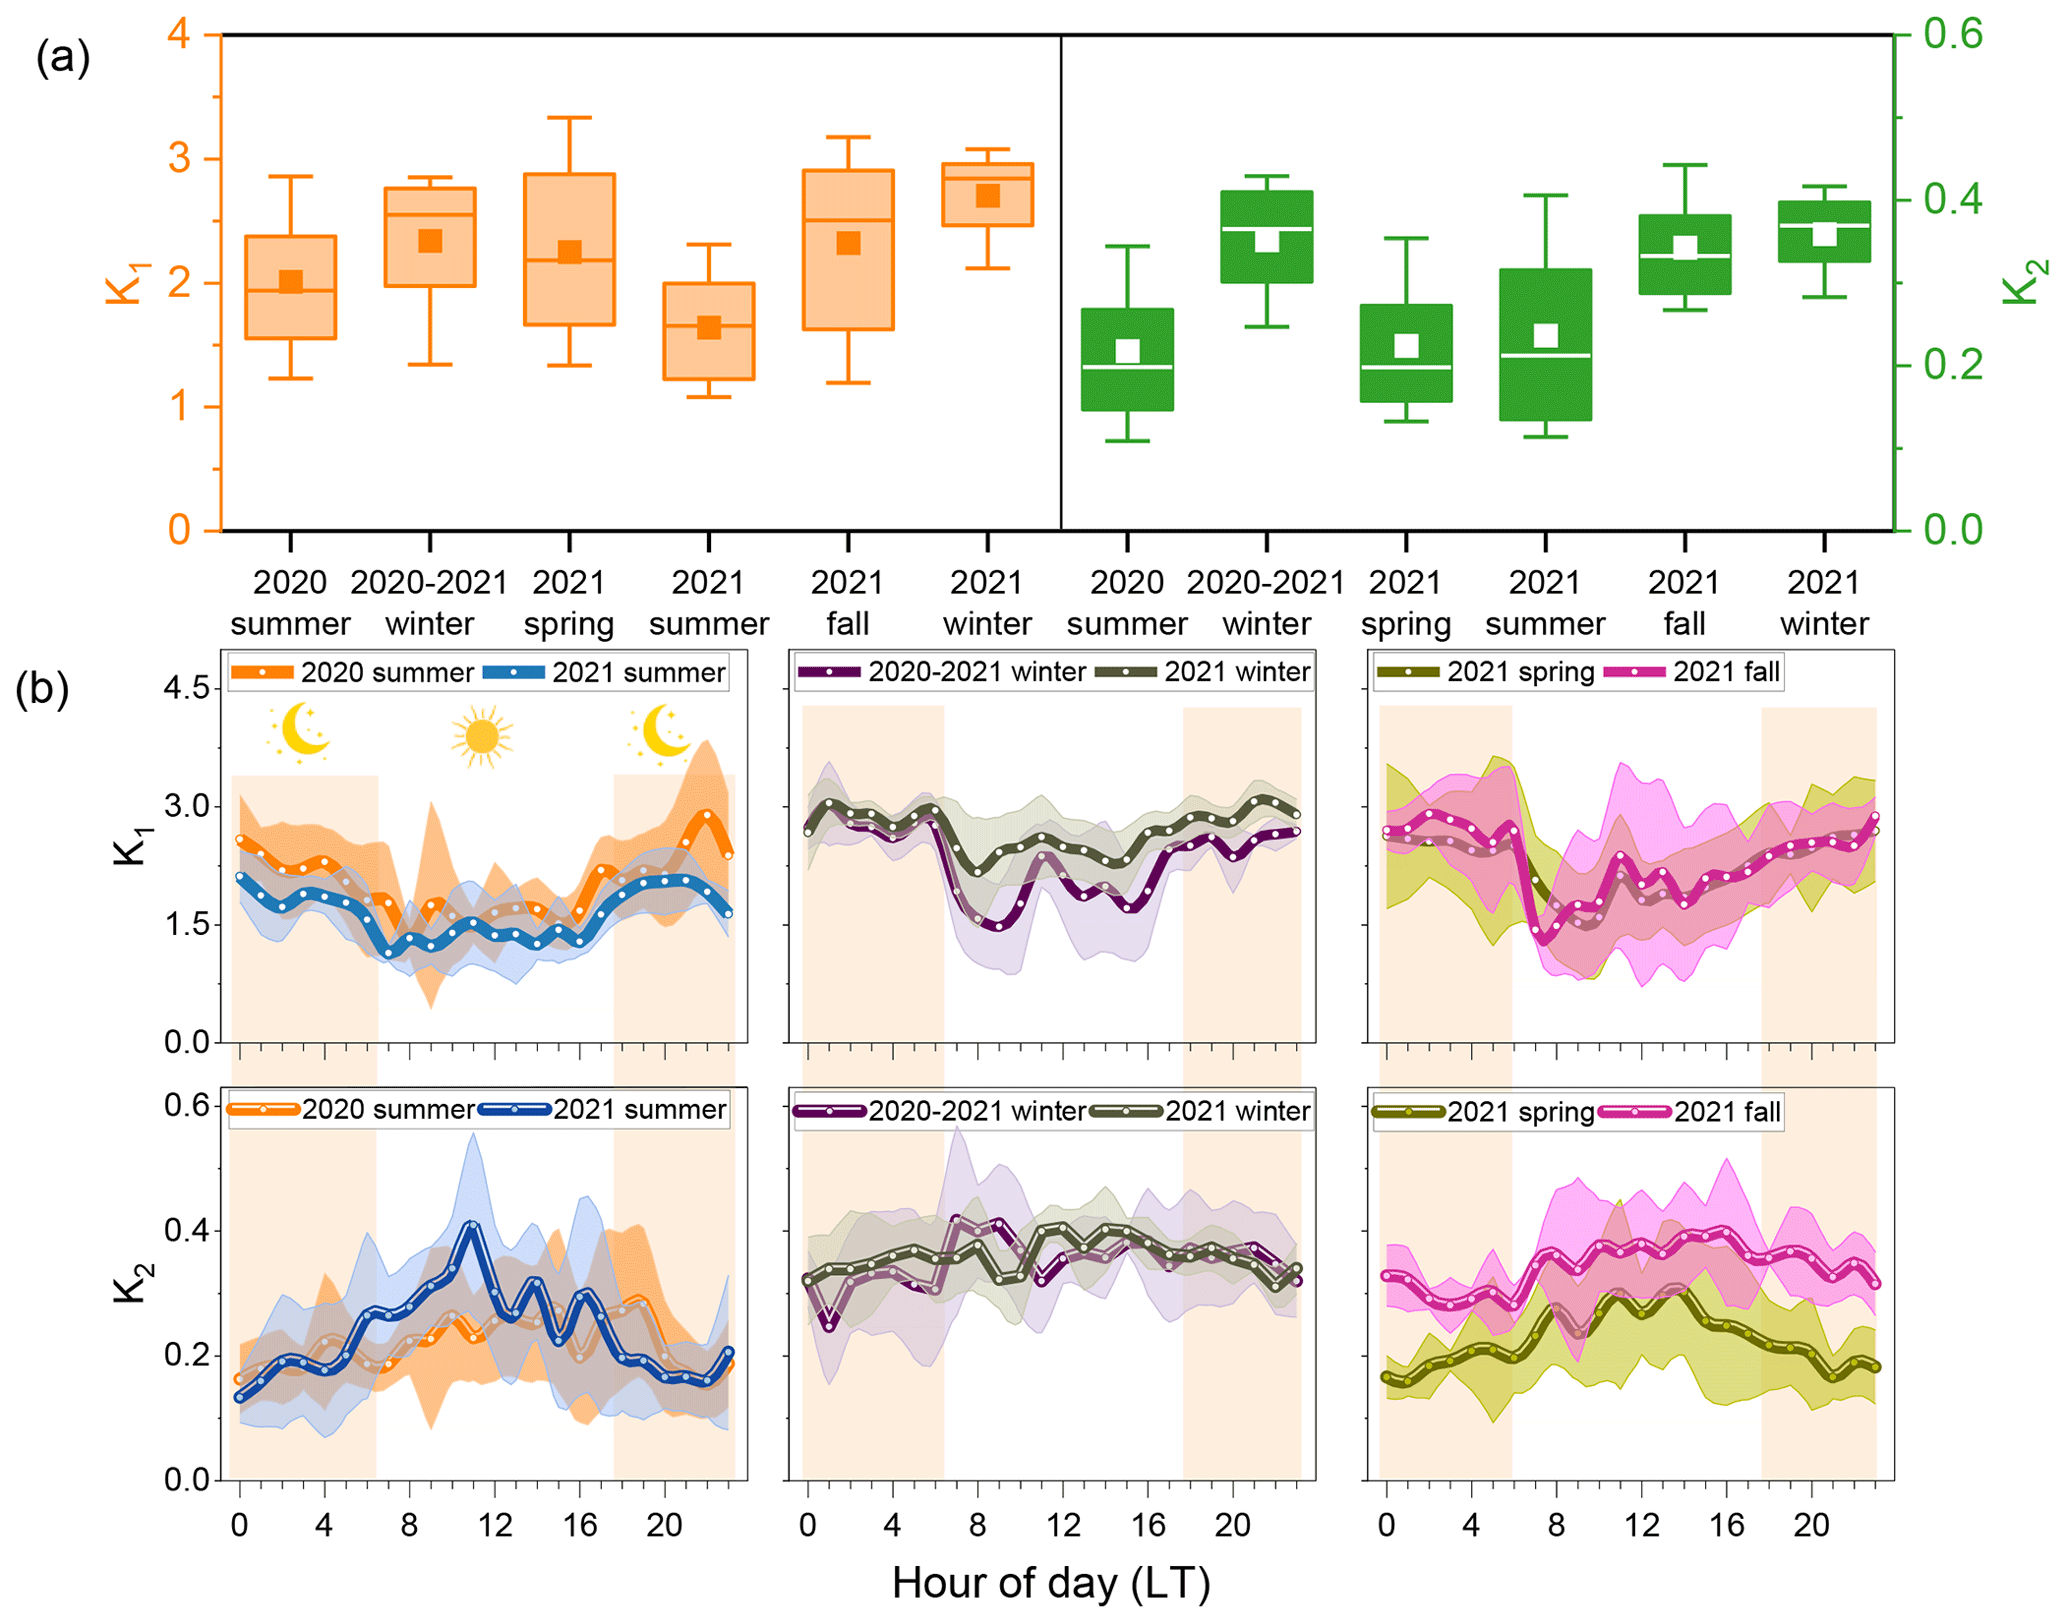
Figure 1(a) Box plot of K1 and K2 values across different seasons (the squares and horizontal lines in the box denote the average and median, respectively; the lower and upper boundaries of the boxes represent the 25th and 75th percentile values, respectively; and the upper and lower whiskers are the 10th and 90th percentile values, respectively). (b) The diurnal variations in K1 and K2 in individual seasons (solid lines represent the average values, while the shaded area indicates standard deviation).
During the periods of 2020–2021 winter and 2021 spring, we have conducted source apportionment analysis using PMF based on a suite of elemental and molecular tracer data in PM2.5. The PMF results provide an independent means to determine POC and SOC. Detailed discussions on the wintertime SOC and POC from PMF are documented in our previous publication (Wang et al., 2023). Figure S6 compares POC and SOC estimates obtained from the BI approach versus the PMF method. Good agreements were observed between the two methods for POC in both seasons (Rp=0.664–0.766). The correlations for SOC simulation showed even stronger agreement with the reference PMF results in winter (Rp=0.859–0.875). However, in spring, the correlations for SOC exhibited a lower correlation coefficient, and comparable results were obtained when using and as tracers for SOC (Fig. S6b). The discrepancy observed in spring could be attributed to the fact that the majority of PMF-resolved SOC was associated with the biogenic secondary organic aerosols factor rather than the secondary sulfate factor.
It is important to highlight that while the BI model demonstrates improved compatibility with PMF results compared to other conventional models, it may not precisely replicate PMF outcomes due to the distinct reaction pathways and formation time spans of SIA and certain SOC components. Considering the similarities in formation pathways, the BI- model would yield more accurate estimations when regional transport has a stronger influence compared to local formation processes. Conversely, when SOC formation pathways are significantly disconnected in time and in space from those of sulfate, the performance of the BI- model would be less satisfactory. For example, in clean regions like the southeastern US and Amazon where SOA measurements were dominated by fast local oxidation chemistry of biogenic VOCs (Xu et al., 2015; Riemer et al., 1998; Langford et al., 2022), sulfate may not serve as a good tracer to track SOA in the BI- model. In urban areas where daytime photochemical processing may play a significant role in SOA formation, e.g., summertime Beijing (Duan et al., 2020), sulfate may also fail as a proper tracer. Thus, an integrative evaluation of available PM composition, along with related air pollutant and meteorological conditions, is recommended to aid identification of a suitable SOC tracer in implementing the BI method and assessing the interpretability of the BI method-derived POC and SOC data.
3.2 Multi-temporal-scale variations in POC and SOC
3.2.1 Annual levels and seasonal variations
Figure 2a shows the time series of meteorological parameters, gaseous pollutants, PM2.5, and the carbonaceous components, including OC, EC, POC, and SOC, over the entire measurement period. The study-wide PM2.5 concentrations ranged from 1.0 to 94 µg m−3 with an average of 14.8 ± 8.8 µg m−3. The PM2.5 levels varied notably from hour to hour, with 14 % exceeding 25 µg m−3. This value (25 µg m−3) is the new PM2.5 annual Interim Target-2 target of the “Air Quality Guidelines (AQG)” recommended by the World Health Organization. It is also the newly proposed “Air Quality Objective” for PM2.5 of the Hong Kong Government (Hong Kong Environment Bureau, 2021). The O3 and NOx concentrations throughout the study period had an average value of 44 ± 19 and 8.9 ± 7.8 ppb, respectively. The concentrations of OC varied from 0.06–15.7 µg C m−3 (avg. 2.8 ± 2.0 µg C m−3), and EC ranged from 0.02–6.4 µg C m−3 (avg. 0.76 ± 0.64 µg C m−3). The average POC was 1.6 ± 1.3 µg C m−3 (range: 0.06 to 12.4 µg C m−3), approximately 2 times the average SOC concentration (avg. 0.92 ± 0.74 µg C m−3; range: 0.02 to 6.8 µg C m−3). Past studies conducted at the same site using offline measurements of filter samples in 2011–2012 (X. H. H. Huang et al., 2014) and 2015 (Chow et al., 2022), as well as online measurements during the winter of 2020 (Wang et al., 2023), also observed higher percentages of POC. The SOC percentage contributions varied under different environments due to the complex sources and formation processes and the meteorological conditions. The percentage contribution of SOC at our sampling site was lower than those measurements in urban Hong Kong and other urban cities (Zhou et al., 2014; Zhu et al., 2021; Li et al., 2020) but comparable to a similar suburban site in Shanghai (M. Wang et al., 2022; S. Wang et al., 2022).
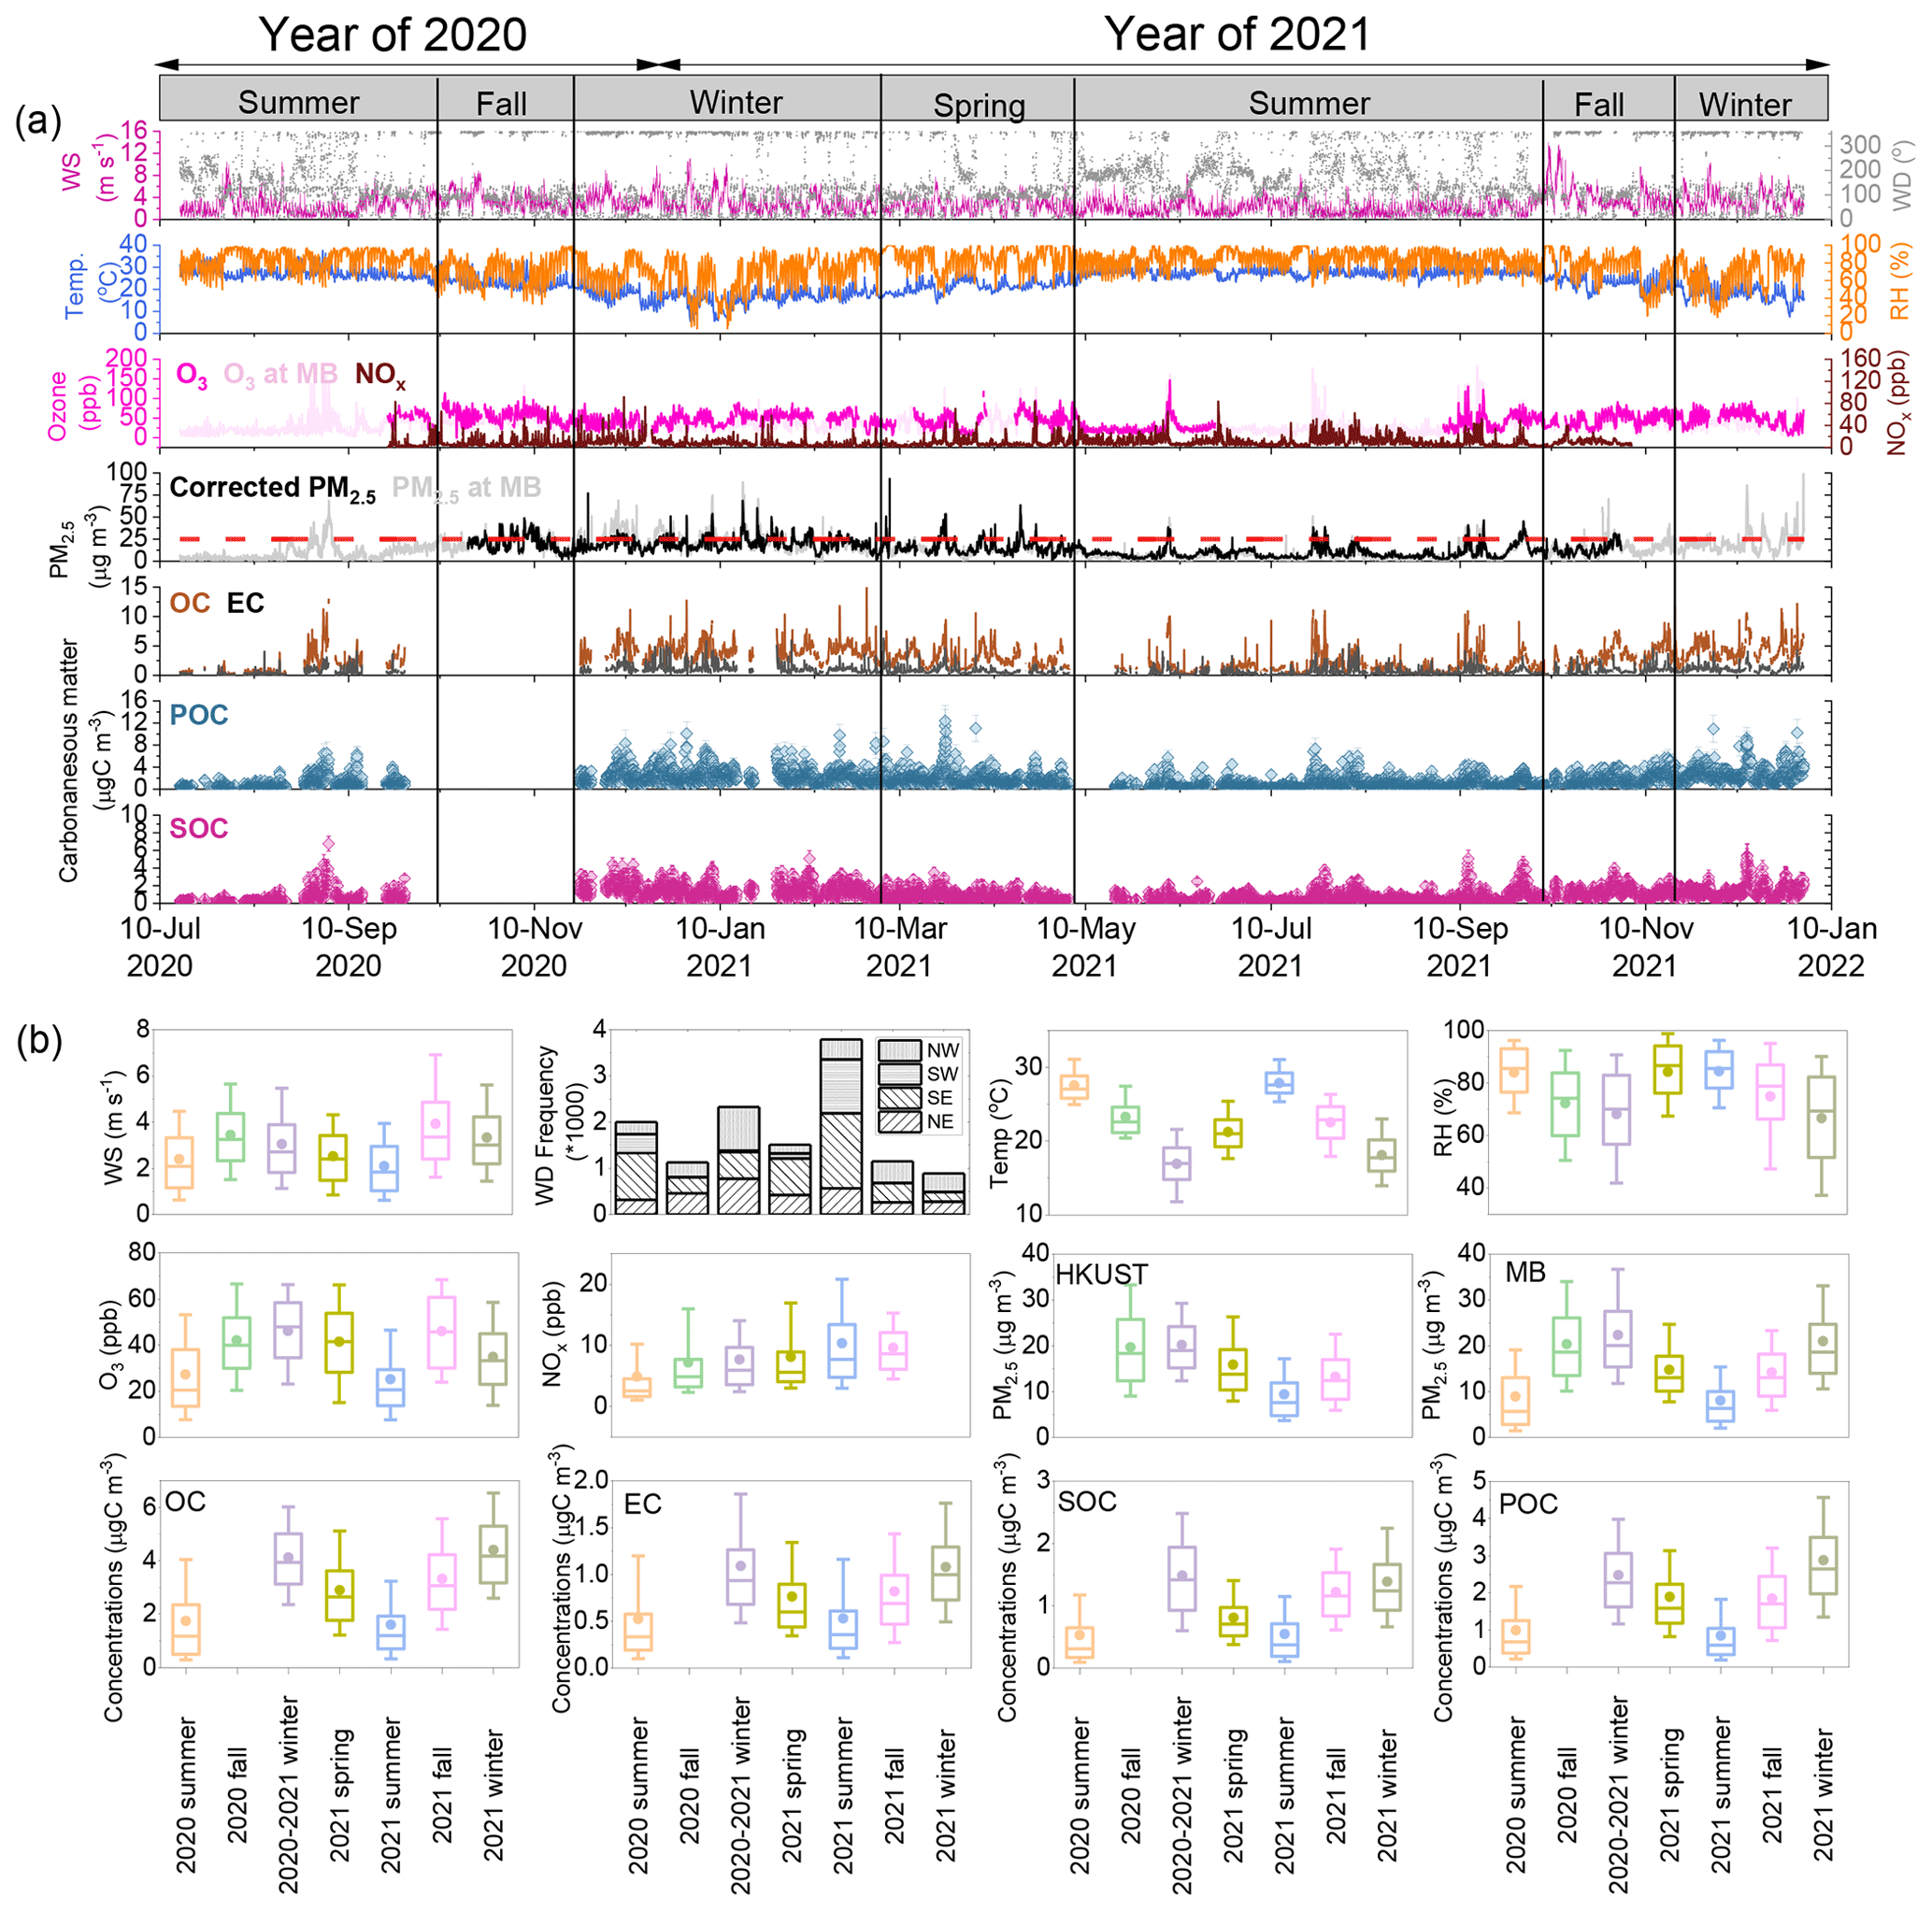
Figure 2(a) Time series of meteorological parameters (wind speed, wind direction, temperature, and RH), gaseous pollutants (O3 and NOx), PM2.5 (the dashed red line marks the WHO AQG IT-4 value), OC and EC, and POC and SOC (the y-axis error bars represent uncertainties derived from BI method). (b) Seasonal variations (the circles and horizontal lines in the box denote the average and median, respectively; the lower and upper boundaries of the boxes represent the 25th and 75th percentile values, respectively; and the upper and lower whiskers are the 10th and 90th percentile values, respectively.) during the observation period (16 July 2020–31 December 2021) at the HKUST supersite.
As a sub-tropical region in the southeastern coastal region of China, the sampling site is under the influence of the seasonal evolution of the East Asian Monsoon system, exhibiting distinctive season-dependent air pollution characteristics. During the summertime, the prevailing wind is from southern oceanic areas, while northwesterly winds dominated in the winter. Spring and autumn are transitional seasons. The RH levels were > 80 % in spring and summer, considerably higher than in fall (∼ 70 %) and winter (∼ 60 %). The wind speeds during winter and fall were higher compared to summer and spring, with the prevailing airflow coming from the northwest (Fig. 2b). These meteorological conditions would favor the transport and dispersion of air pollutants over a larger scale in winter over summer. The seasonal variations in PM2.5 showed higher levels in winter and fall compared to spring and summer. NOx showed the highest levels in the summer and fall of 2021 due to the accumulation of local vehicle emissions from nearby construction activity, while O3 showed distinct variations, with the lowest levels generally being in summer. The summer low ozone is attributed to the prevailing southerly flow introduced by the summer monsoon, which brings less O3 and/or O3 precursor (So and Wang, 2003). In addition, the strong ozone titration effects of higher NOx levels could be also responsible for the decreased O3 levels in summer (Zhang et al., 2013). The seasonal variation trends of OC and EC were consistent with higher concentrations in winter, followed by fall, spring, and summer. Similarly, POC and SOC levels were highest in winter and lowest in summer, showing a difference of ∼ 3 times (2.9 vs. 0.8 µg C m−3 and 1.5 vs. 0.5 µg C m−3, respectively) between the two seasons. With regards to the interannual variations, the levels of PM2.5 and its carbonaceous components exhibited relatively fewer variations, with comparable levels observed in the same season across different years.
3.2.2 Weekend–weekday pattern and diurnal variations
The diurnal variations in PM2.5, O3, NOx, and carbonaceous components over the entire period are shown in Fig. 3. Since the sampling location is situated near a construction site, we conducted a comparative analysis of diurnal variations between weekdays and weekends to evaluate the influence of construction activities on aerosol particles and gas pollutants. PM2.5 displayed minimal disparities between weekdays and weekends, showing flat diurnal cycles across various seasons, except for the winter of 2021. During this particular winter, higher concentrations of PM2.5 were observed at night on weekends compared to weekdays. The diurnal variations in O3 exhibited clear daily trends throughout different seasons, with higher concentrations during daytime and a peak in the late afternoon. These patterns closely correspond to variations in radiation and temperature. The daily variations in NOx showed a clear diurnal pattern with higher daytime concentrations on weekdays, which is characterized by two concentration peaks at 09:00–10:00 and 16:00–18:00 LT, aligning with the traffic peak hours at the start and at the end of a working day at the construction site. Similarly, EC showed two pronounced peaks during the daytime on weekdays across different seasons, further indicating the noticeable impacts of primary traffic emissions on NOx and EC levels, particularly on workdays. Conversely, NOx and EC levels were generally lower on weekends and lacked a distinct diurnal variation. Different from EC, OC showed less difference between weekdays and Sundays. Slightly higher daytime concentrations with a peak around noon were observed in the two summer seasons, which could be attributed to the enhanced photochemical formation of OC. Diurnal cycles of OC were flatter in other seasons. Higher OCEC ratios (Fig. S7d) were observed during weekends across different seasons, providing additional evidence of reduced vehicle emissions on non-working days.
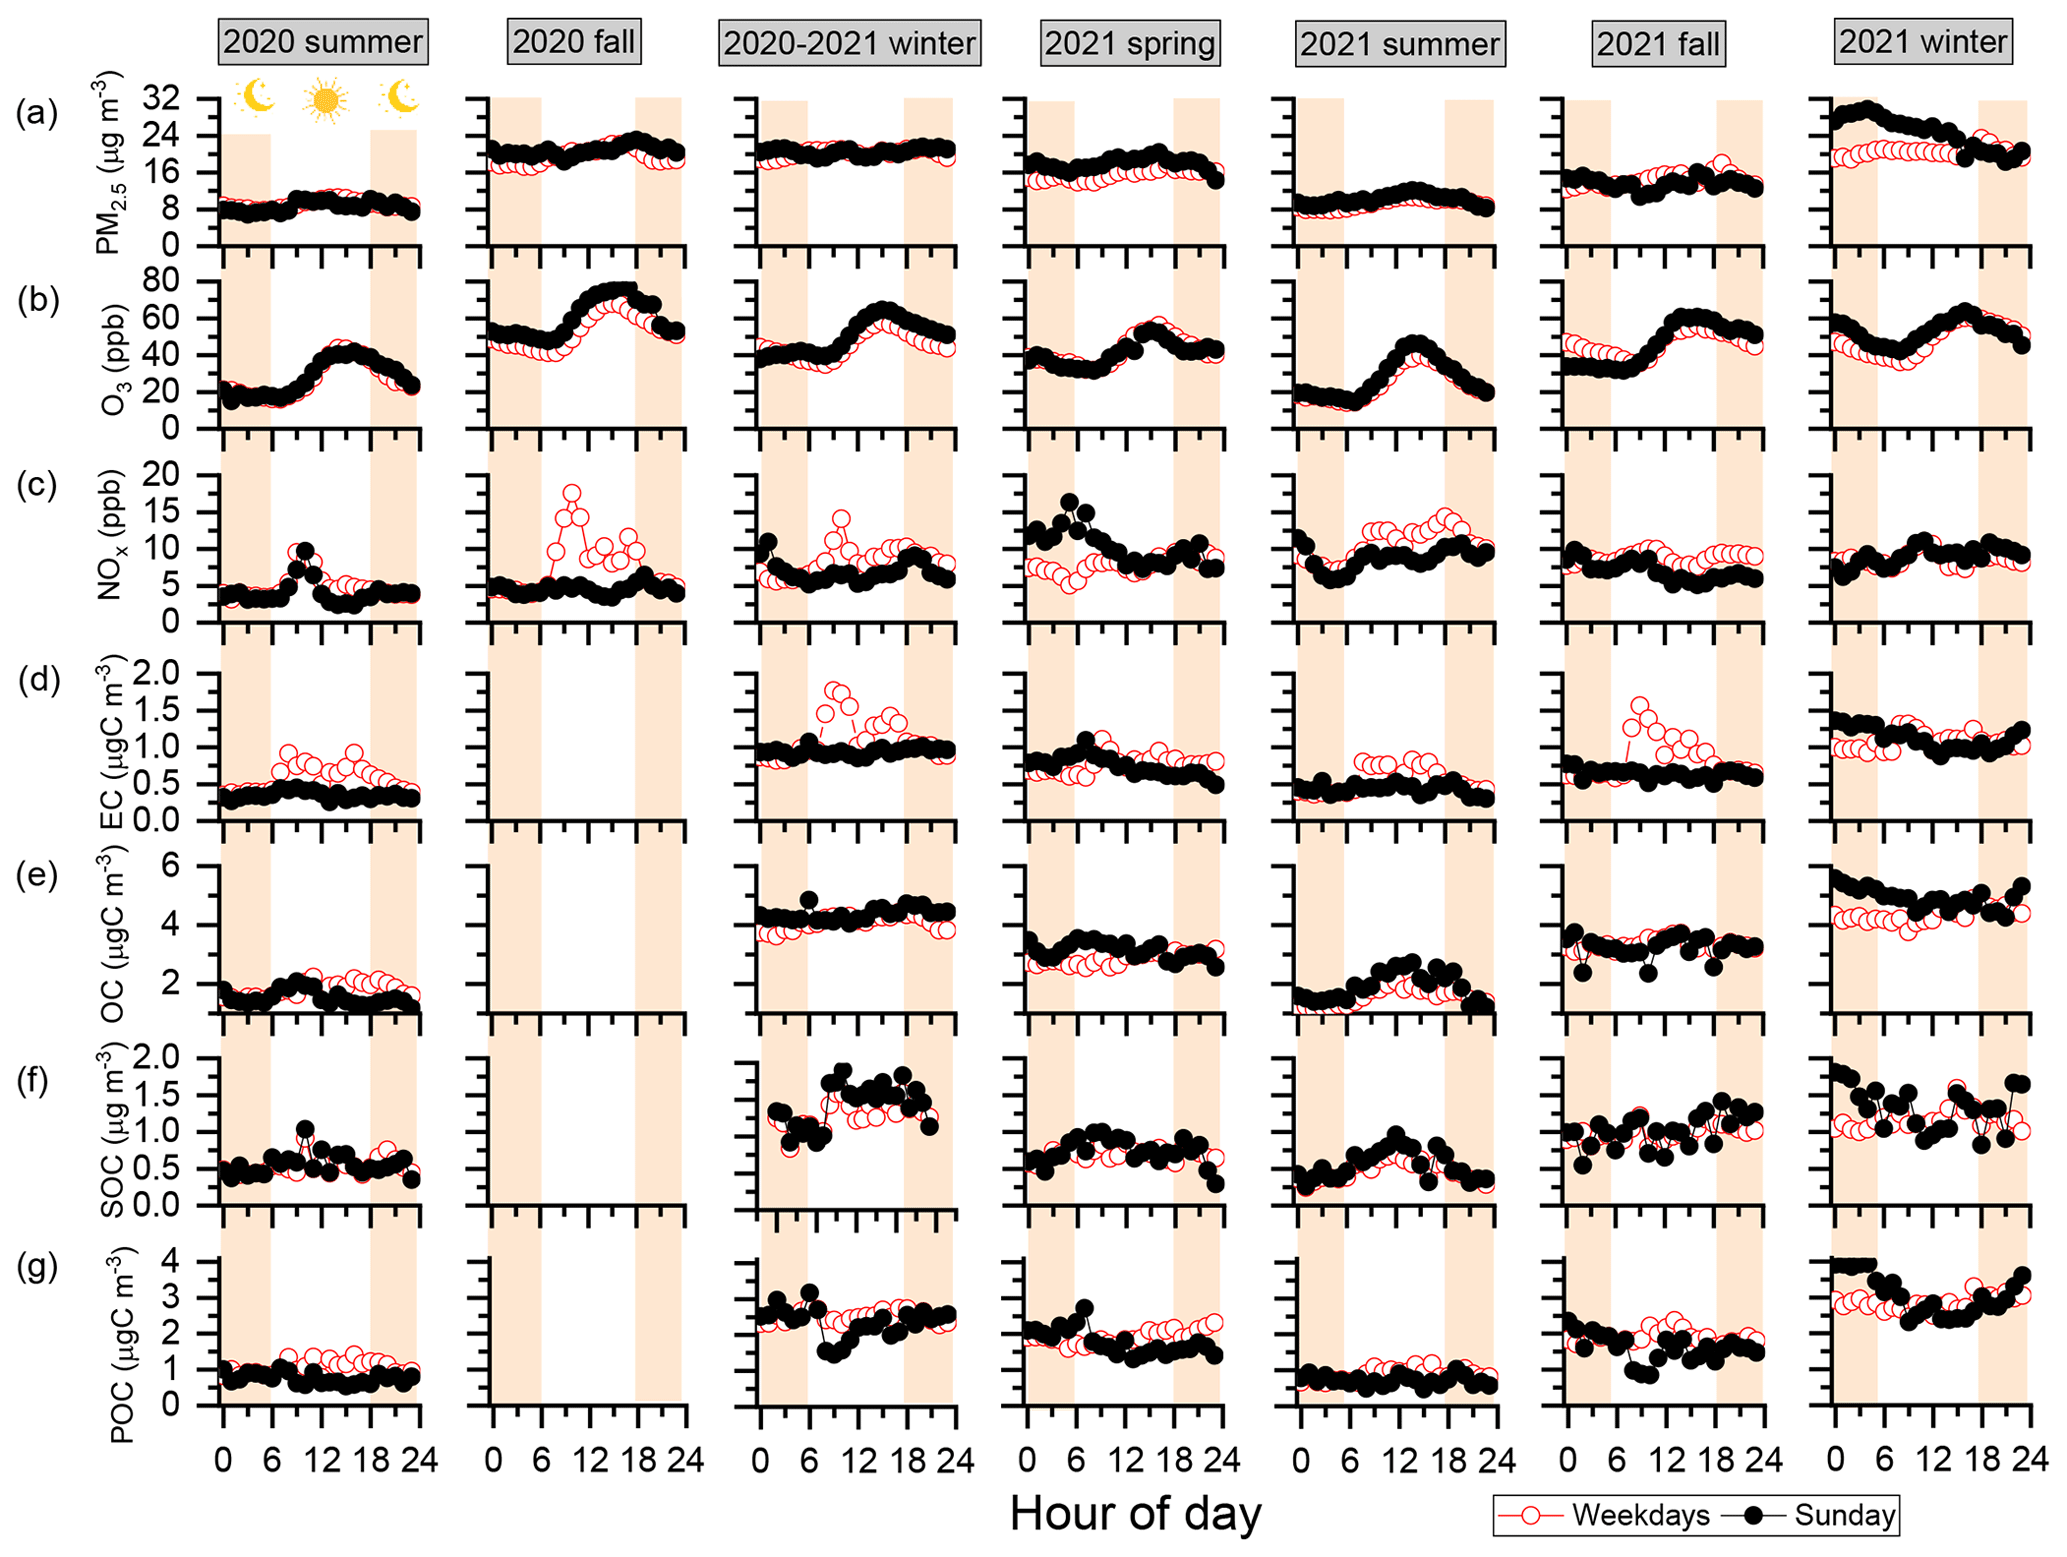
Figure 3Diurnal variations in (a) PM2.5, (b) O3, (c) NOx, (d) OC, (e) EC, (f) POC, and (g) SOC over the entire measurement period. The circles represent the hourly data averaged over weekdays (Monday–Saturday, red) and Sunday (black). The light orange shaded areas represent nighttime periods.
The weekday–weekend patterns of POC and SOC displayed notable distinctions. Specifically, SOC was slightly higher on weekends, whereas an enhancement of POC was found on weekdays across different seasons. Higher levels of O3 were also observed on weekends, likely due to the weak titration effects as a result of reduced NOx from vehicle emissions and other anthropogenic emissions during weekends. This observation suggests that anthropogenic emissions had a stronger influence on POC levels, while SOC levels appeared to be more influenced by the active photochemistry VOC emissions from the nearby broadleaf woods rather than the anthropogenic sources. Regarding diurnal variations, POC exhibited comparable levels during nighttime on both weekdays and weekends, while higher levels were observed during daytime on working days. The much higher POCSOC ratios during daytime on weekdays (Fig. S7e) further evidenced the increased impact of primary emissions on POC. Additionally, the SOC levels showed increased concentrations during daytime on both weekdays and weekends, similar to the daily patterns of O3 as shown in Fig. 3b, indicating the influence of photochemical reactions. It should be noted that SOC formation processes are complex and influenced by various factors, including ambient atmospheric oxidant and precursor levels. Moreover, these reactions are significantly influenced by meteorological parameters. Further investigation into the relationships between SOC formation and the aforementioned factors (i.e., temperature, RH, O3, and NOx) will be described in Sect. 3.3.
3.3 Characterization of SOC formation dependence on meteorological conditions and Ox and NOx levels under different pollution conditions
The data set was divided into five groups based on PM2.5 concentrations in individual seasons to investigate the SOC formation under varying pollution conditions. Specifically, a period of PM2.5<5 µg m−3 represents extremely clean conditions, an interval of represents clean conditions, an interval of µg m−3 represents low-pollution conditions, an interval of µg m−3 represents medium-pollution conditions, and an interval of represents high-pollution conditions. The definition of PM2.5 transition value aligns with the annual AQG level and the Interim Target-2 to Interim Target-4 limits set by WHO. The evolution of SOC with the increase in the meteorological parameters (i.e., temperature and RH) during different seasons within the same pollution conditions is shown in Fig. 4. SOC concentrations were generally low in low-PM conditions but increased significantly with the intensification of pollution. The highest SOC levels were observed in periods with during all seasons, indicating intensive SOC formation contributing to PM2.5 air pollution.
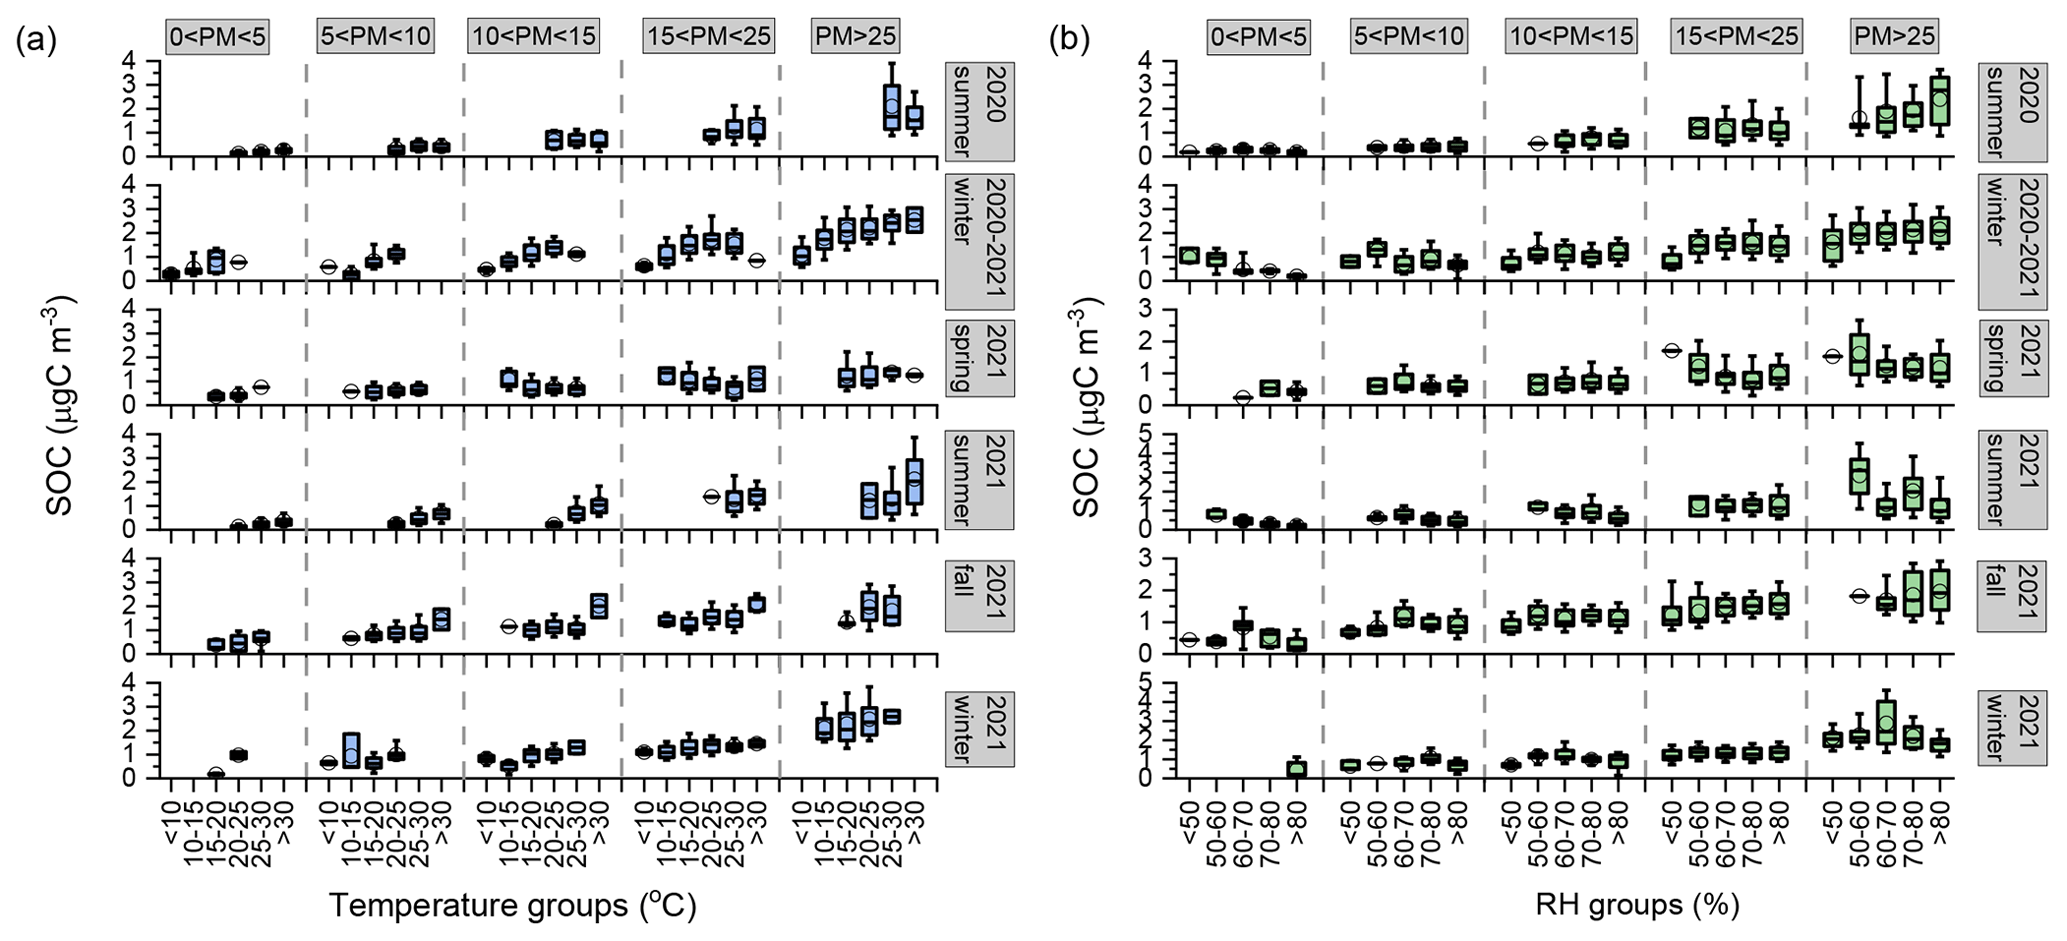
Figure 4Concentrations of SOC as a function of (a) temperature bins and (b) RH bins under different PM2.5 groups in individual seasons during the entire measurement period (the circles and horizontal lines in the box denote the average and median, respectively; the lower and upper boundaries of the boxes represent the 25th and 75th percentile values, respectively; and the upper and lower whiskers are the 10th and 90th percentile values, respectively).
As shown in Fig. 4a, the average concentrations of SOC were lower than 1 µg C m−3 when T<15 °C in all seasons under different pollution conditions, and they increased notably with the increasing temperature, reaching the highest levels at T>30 °C. The peak concentrations were almost twice those at T<10 °C. These results highlight the important role of temperature in boosting the ambient SOC formation. Previous chamber experiments and field observations have found that increasing temperature could not only promote the emissions of biogenic VOCs emissions but also enhance the oxidation reactions (Ding et al., 2011; Svendby et al., 2008). The positive trends were very clear, especially in fall and winter during the pollution conditions (), suggesting that the effects of temperature would be more remarkable on SOC formation in cold seasons. This is further confirmed by the correlation coefficients being stronger in winter and fall (Rp=0.42–0.57) than in spring and summer (Rp=0.10–0.35).
In contrast to temperature dependence, SOC was less sensitive to RH in all seasons and did not exhibit clear trends (Fig. 4b). Under the clean and low-PM-pollution conditions, SOC showed a much flatter trend with the increase in RH. Under medium-PM-pollution conditions, the highest SOC levels were observed in low-RH groups (RH<60 %) and did not change extensively in high-RH groups, while under high-PM-pollution conditions, the responses of SOC to RH groups varied across different seasons. In the summer period, SOC levels showed less variation in 2020, while in 2021 the highest SOC concentrations occurred in the low-RH groups () and then decreased with the increase in RH. The SOC behaviors in the two winter periods were also different, with comparable concentrations across the RH groups in 2020 but much higher SOC levels in the medium RH group in 2021. The SOC behaviors in the spring and fall seasons exhibited fewer variations with the RH groups. The weak relationship between SOC and RH suggested that aqueous-phase chemistry may not be the major formation pathway of SOC in our site, which is different from observations in northern China (Guo et al., 2012; Wang et al., 2012) but similar to a location with comparable site characteristics in suburban Shanghai (M. Wang et al., 2022).
The relationships between SOC and atmospheric oxidant Ox levels under different pollution conditions in individual seasons are shown in Fig. 5a. Atmospheric oxidants Ox (O3+NO2) can be utilized to indicate the ability of atmospheric oxidation associated with photochemical reactions (Kley et al., 1994; Notario et al., 2013). A previous offline measurement study in Hong Kong reported positive correlations between SOC and O3 and highlighted that SOC formation was sensitive to the oxidant levels (Hu et al., 2008). In this study, SOC levels in spring and summer were less sensitive to the Ox under low- and medium-PM-pollution conditions (). However, under high-PM-pollution conditions, the enhancement of SOC with the increase in Ox was only found when Ox<100 ppb; as Ox increased further, SOC started to decline. In winter, SOC levels showed a clear positive trend with increasing Ox, especially under medium- and high-PM-pollution conditions. The daily highest Ox is commonly seen from noon to the late afternoon when the solar radiation is the strongest. The positive correlations of SOC with Ox in winter highlighted that the photochemical formation might remain highly efficient and play an important role in contributing to high SOC levels and air pollution.
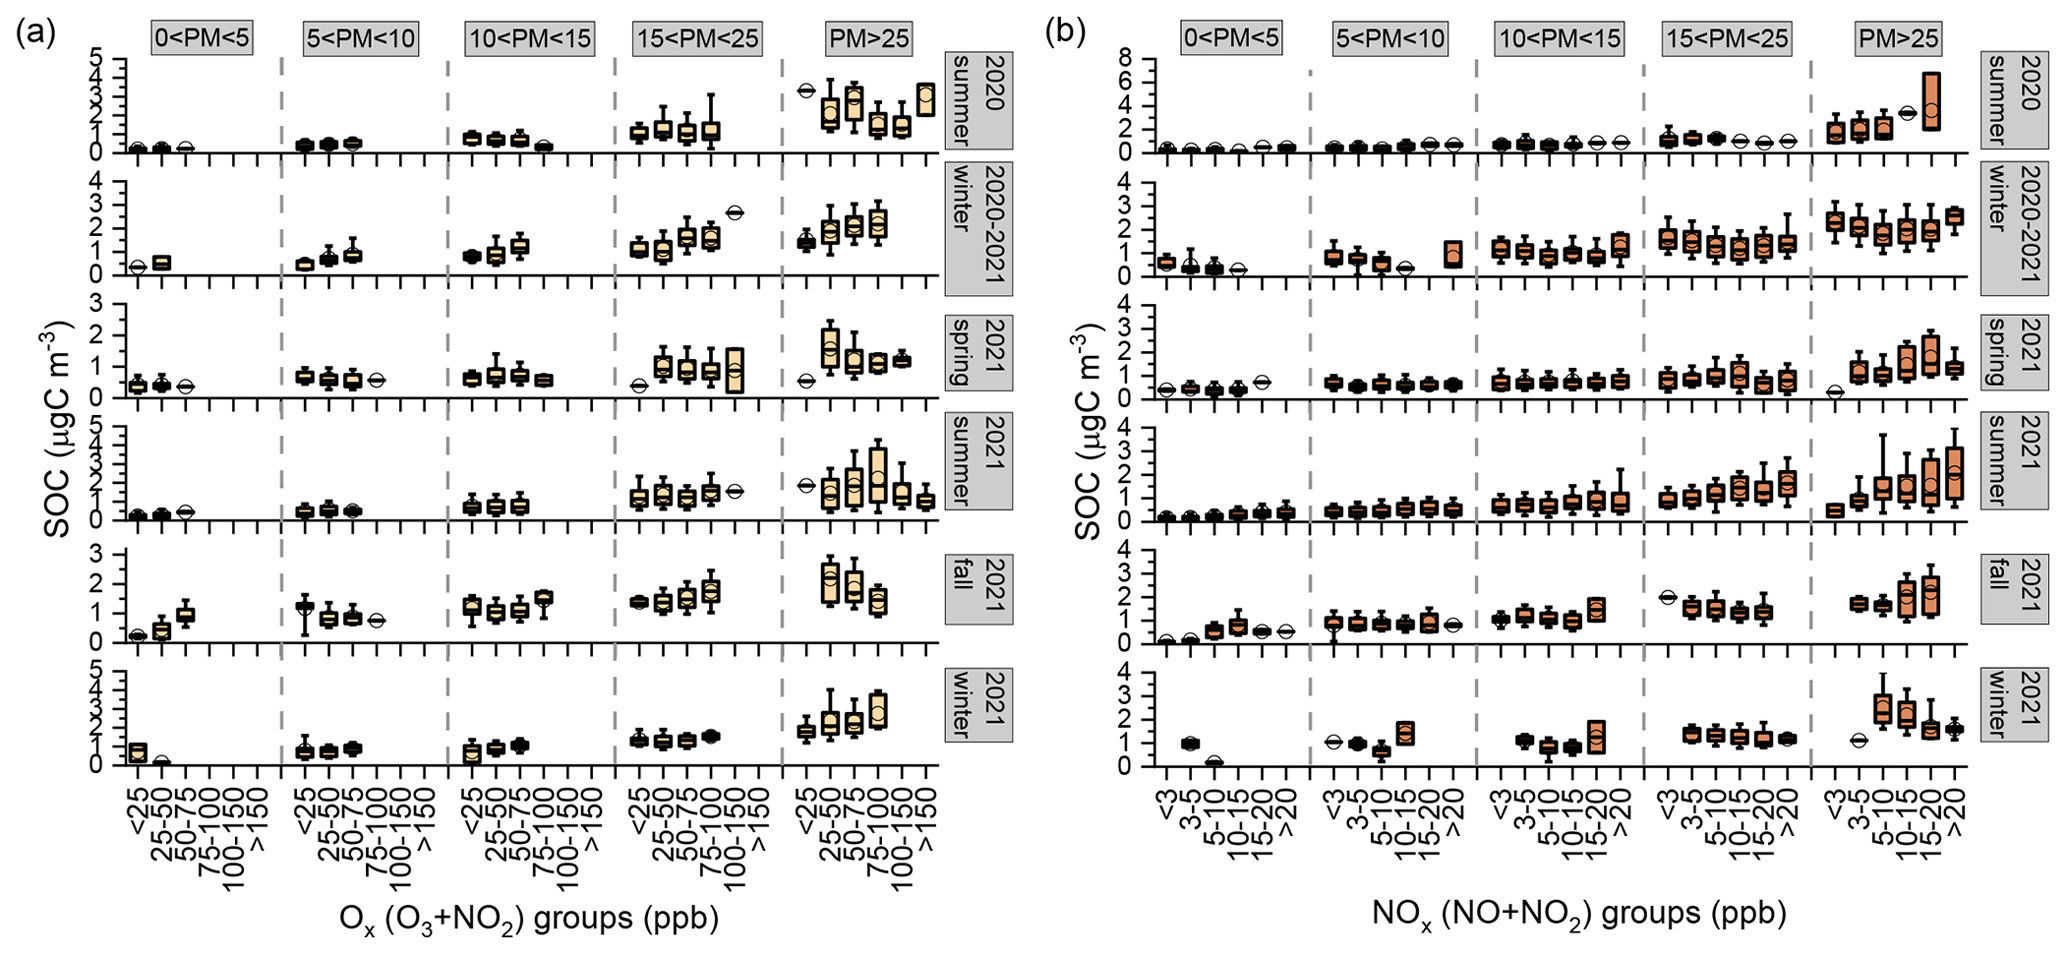
Figure 5Concentrations of SOC as a function of (a) Ox bins and (b) NOx bins under different PM2.5 groups in individual seasons during the entire measurement period (the circles and horizontal lines in the box denote the average and median, respectively; the lower and upper boundaries of the boxes represent the 25th and 75th percentile values, respectively; and the whiskers are the 10th and 90th percentile values, respectively).
The associations of SOC with the NOx are shown in Fig. 5b. Under the clean and medium-pollution conditions, the trends between SOC and NOx were less clear across all the seasons. However, the variations under polluted conditions differed in individual seasons. The concentrations of SOC increased substantially with NOx in the two summer periods under polluted conditions, suggesting that NOx can also be essential to the SOC formation in contributing to photochemical air pollution in summer periods (Roberts, 1990; Fan et al., 2022). However, during the winter seasons, when the air masses were dominated by the long-range air masses originating from northern China, SOC levels were slightly higher in low NOx groups than those in high NOx groups. It is noted that the variations in SOC with NOx were distinct from those of SOC with O3 in summer and winter seasons, especially under high-pollution conditions. These results suggest that the SOC formation pathways are different and might be promoted by various oxidants under different ambient environments.
3.4 Evolution characteristics of SOC during the city-wide PM2.5 episodes
3.4.1 Classification of city-wide PM2.5 episodes
As mentioned above, high SOC levels were observed under pollution conditions with PM2.5 higher than 25 µg m−3. We further extract the pollution hours to examine the SOC features in order to gain insights into its formation mechanisms. We have identified a total of 65 pollution episodes based on a screening method using city-wide air pollutant data from 15 general monitoring stations operated by the Hong Kong Environment Protection Department (HKEPD) rather than a single site. The site characteristics and the geographical locations of the monitoring stations are shown in Fig. S8. The details of this method can be found in our previous publication (Q. Wang et al., 2022). In this work, PM2.5 episodes were identified as periods of hourly concentrations exceeding 25 µg m−3 and lasting 6 consecutive hours or longer at more than three monitoring stations. Figure S9 shows the average concentrations of PM2.5 across the 15 stations and HKUST during individual episodes and those during the non-episode hours. The statistical summary of episode information, PM2.5 averages, meteorological conditions, and gas pollutants (O3 and NOx) during individual episodes are listed in Table S2.
As expected, pollution episodes occurred more often in winter (i.e., 24 in 2020–2021 winter and 7 in 2021–2022 winter) than in summer and fall. This can be attributed to the less wet deposition and elevated contributions from regional transport, which could be further confirmed by the higher wind speed. We also observed 14 episodes in 2021 spring, possibly due to the dust storms from outside Hong Kong (Ding et al., 2005; Wang et al., 2004). The city-wide PM2.5 max-to-min ratios of individual episodes are calculated to investigate the spatial variations (Table S2). A ratio close to 1 indicates the episodic pollution was spatially homogeneous in Hong Kong; a higher value means higher spatial heterogeneity of the episodes across Hong Kong. Generally, the ratios in summer and fall episodes were lower than 2, while higher ratios were observed in winter and spring episodes, indicating the spatial gradient was more notable under the regional influences.
3.4.2 Variations in SOC during the episodes
The average concentrations of gaseous pollutants, PM2.5, POC, and SOC are shown in Fig. 6a–e. In general, the concentrations in non-episode hours were higher in winter and fall than those in spring and summer, suggesting the consistent influences of regional transport. Higher concentrations of O3 were observed in winter and fall episodes, with episode averages of 29–78 ppb, except for EP11, EP20, and EP52. It is noted that NOx levels in these three episodes were much higher than the others. Summer episodes had significantly higher levels, with average concentrations that were more than 2 times those in the other seasons. The mass increment ratio (MIR) is calculated as the mass concentration during the episode divided by that during the non-episode hours in the same season, which could be used as an indicator to evaluate the change in the concentration during the episode. The MIR values of O3 and NOx were generally larger than 1 during the summer and spring episodes (Fig. 6g) and close to 1 during winter. In contrast to the gaseous pollutants, the average concentrations of episodic PM2.5 showed fewer seasonal variations, with slightly lower values in 2021 fall. The MIR values were larger than 1 during the majority of episodes, with the highest values in summer (∼ 2–5) and fall (∼ 1.5–2.2) episodes.
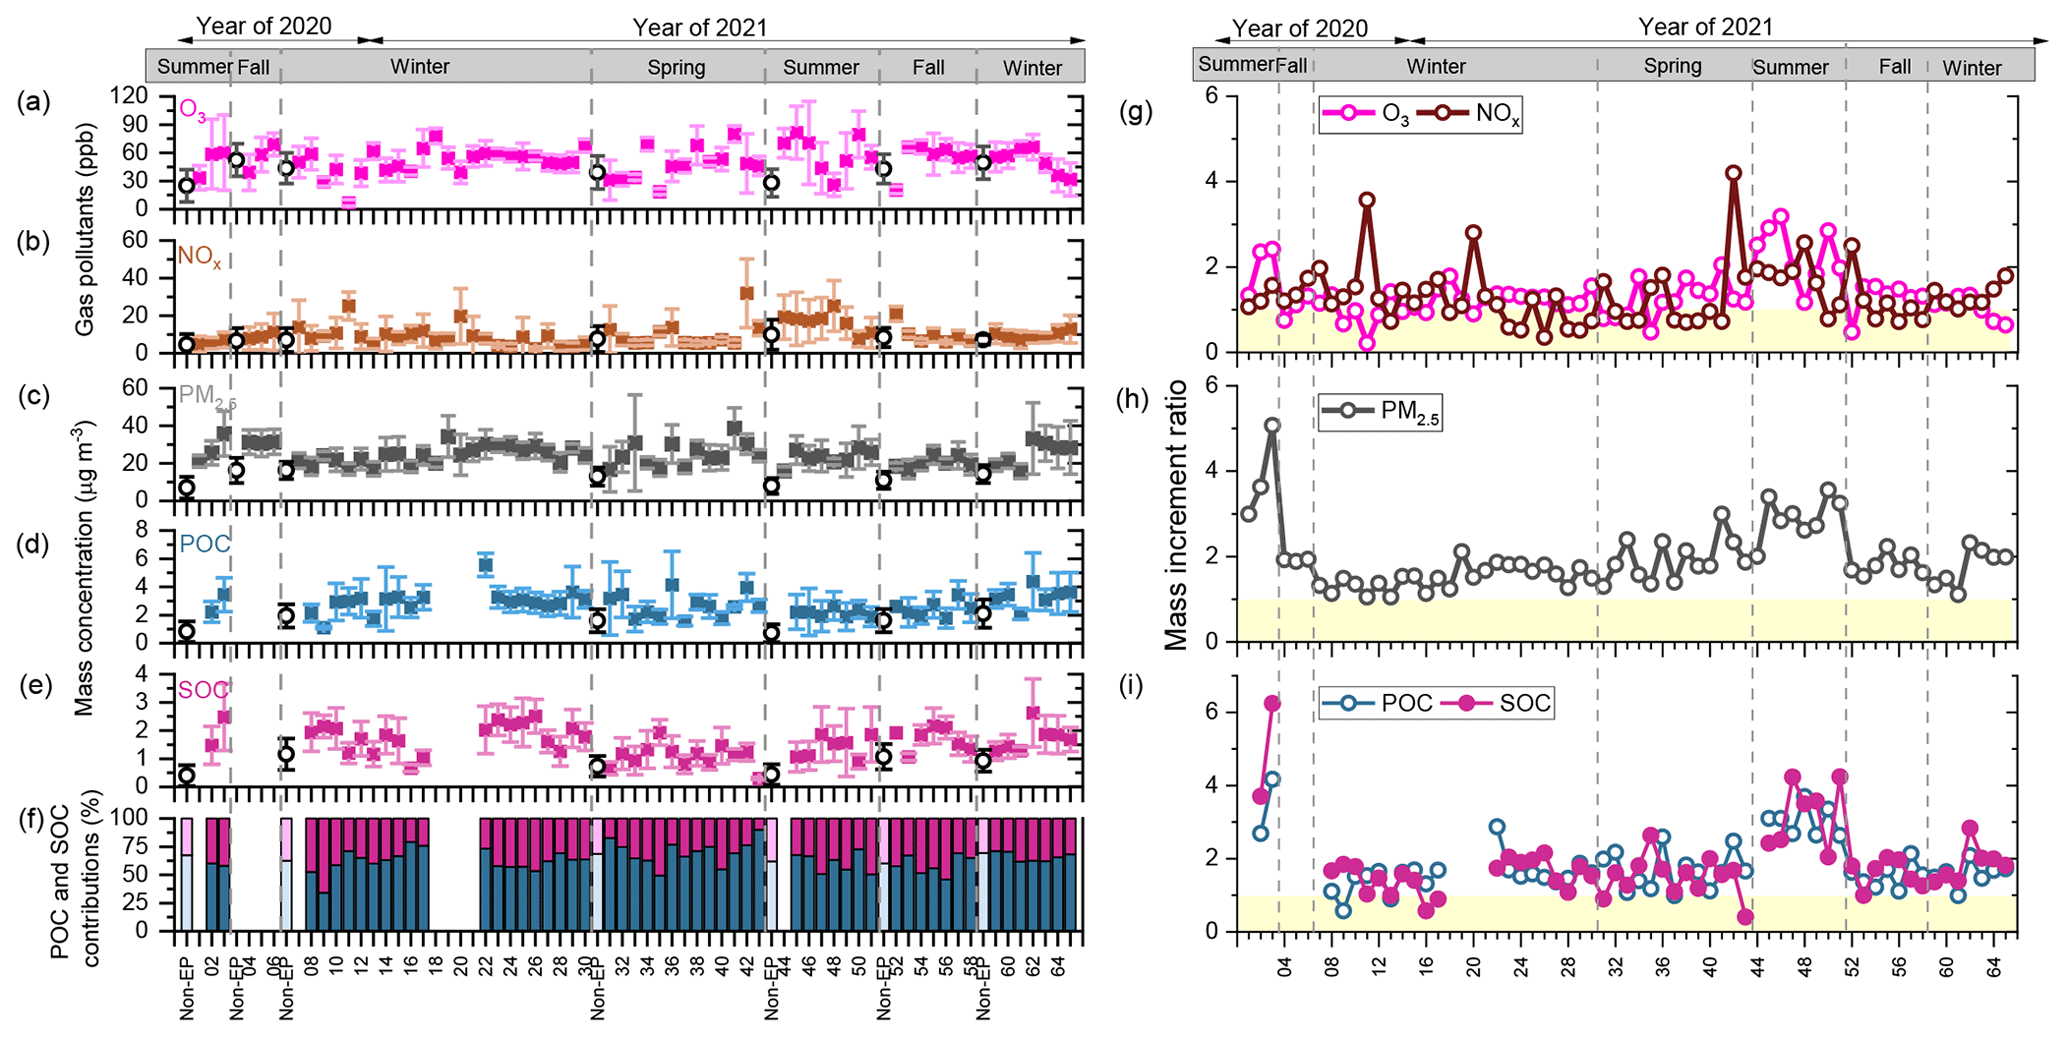
Figure 6Comparison of selected pollutant levels during episodic and non-episodic periods for individual episodes. The comparison parameters include concentrations of (a) O3, (b) NOx, (c) PM2.5, (d) POC, and (e) SOC; (f) POC and SOC percentage contributions; and mass increment ratios of (g) O3 and NOx, (h) PM2.5, and (i) POC and SOC. In panels (a)–(e), the filled squares represent the average values of concentrations during episodes, while the empty circles represent the average of all non-episode hours throughout the individual season; the error bars represent 1 standard deviation of the results. In panels (g)–(i), the light yellow shaded zone marks the mass increment ratios (calculated as mass concentration during the episode divided by that during the non-episode hours in the same season) values of less than 1.
The concentrations of carbonaceous components were much higher during episodes than non-episode hours in the same seasons. POC levels were higher in winter episodes, while SOC showed enhancement across different seasons except spring (Fig. 6d and e). MIR values > 1 were observed for both POC and SOC during summer episodes, with noticeably larger MIR values exceeding 2. Lower MIR values were found in winter seasons, possibly due to the high background levels. The percentage contributions of POC and SOC during individual episodes are shown in Fig. 6f. The SOC mass fraction varied in individual seasons, ranging from 10 % in EP43 to 66 % in EP09. Compared with the corresponding values in non-episode hours, higher SOC percentages were generally found in winter and summer episodes, while they were similar in fall and spring episodes. It is worth noting that the meteorological conditions and major atmospheric oxidants are different in the two seasons, indicating that the formation mechanism differs in the two seasons. Further examination of SOC variations during summer and winter episodes would enhance understanding of SOC formation mechanisms, which will be described in the subsequent sections.
3.4.3 Summer tropical-cyclone-induced episodes
A total of eight episodes were observed during the summer of 2021, with seven of them coinciding with the presence of tropical cyclones. These cyclones included Typhoon Chaiwan (EP45), Typhoon Infa (EP46 and EP47), Tropical Storm Lupit (EP48), Typhoon Chanthu (EP49 and EP50), and Typhoon Mindule (EP51). The tracks of individual tropical cyclones are shown in Fig. S10. It is noted that these tropical cyclones were located east of Hong Kong (near Taiwan). Previous studies have indicated that when a tropical cyclone is situated to the east of Hong Kong, the weather in the region is predominantly influenced by subsidence, resulting in stable air conditions near the ground (Chow et al., 2018; Huang et al., 2006). As shown in Fig. 7, the winds during EP45 to EP51 were characterized by low speeds (< 2 m s−1) and come from multiple directions. These stagnant conditions could suppress the vertical dispersion, leading to the accumulation of air pollutants. Episodic PM2.5 concentrations show a less spatial gradient with an average max-to-min ratio (∼ 1.6, Table S2). Slightly higher concentrations were observed in new town and urban monitoring stations than suburban sites (Fig. S9), consistent with impacts from local urban sources. This suggests that the air pollution during these episodes was likely attributable to local emissions rather than regional transport.
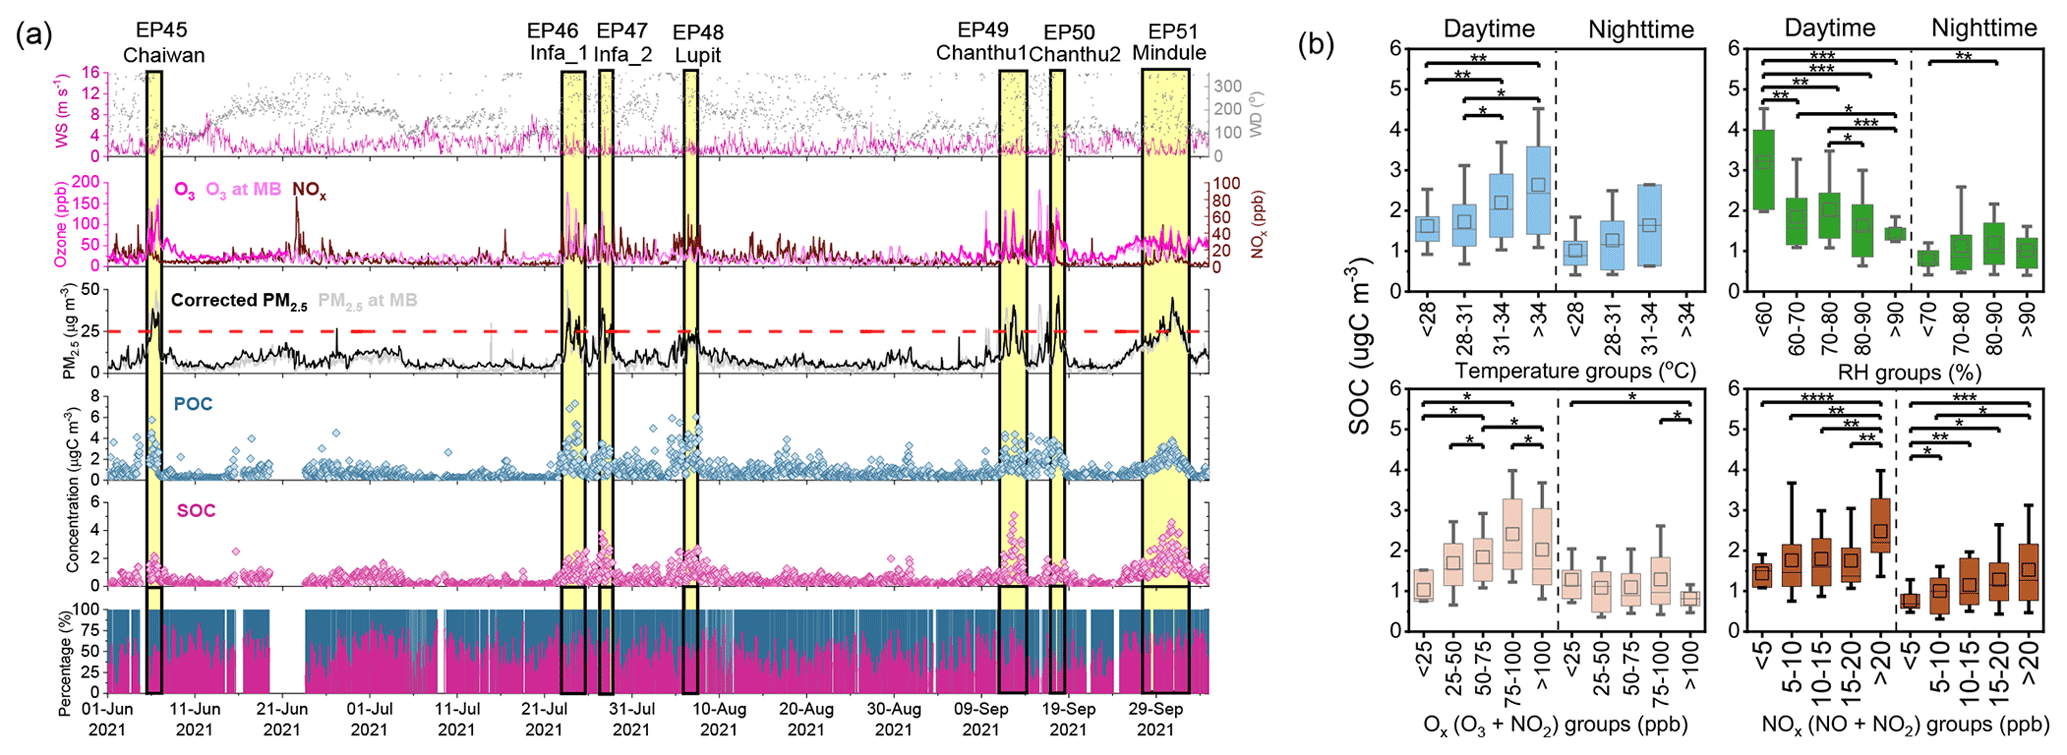
Figure 7SOC variation characteristics during typhoon episodes in summer 2021. (a) Time series of meteorological parameters (wind speed and direction), gaseous pollutants (O3 and NOx), PM2.5 mass concentrations, and POC and SOC levels and their relative percentage contributions, with the yellow shaded area marking individual episode periods of EP45–51. (b) Concentrations of SOC as a function of temperature, RH, and Ox (O3+NO2) and NOx bins, with daytime and nighttime episode hours plotted separately (the squares and horizontal lines in the box denote the average and median, respectively; the lower and upper boundaries of the boxes represent the 25th and 75th percentile values, respectively; and the whiskers are the 10th and 90th percentile values, respectively). Significance levels (p) determined by t test are as follows: p<0.0001, , , ∗ .
Concurrent enhancements of gas pollutants and PM2.5 mass loadings were observed during the episodes (Fig. 7a). PM2.5 concentrations notably increased with typhoon evolution, reaching peak values of nearly 50 µg m−3 except for EP48. The highest O3 levels were observed at noon under the influence of Chaiwan and Chanthu2 (EP45 and EP50, respectively). Extremely low NOx levels were observed in EP50, with an average of 7.7 ppb. POC and SOC levels largely increased during the episodes, with different responses in individual episodes. Specifically, a sharp increase in POC was observed in EP45, but SOC levels did not increase noticeably. Similar results were observed in EP46, EP48, and EP50, with the percentage contributions of SOC ranging from 27 % to 37 %. In contrast, an opposite trend was found in EP47, EP49, and EP51, where SOC exhibited rapid increases, showing higher percentage contributions of 37 %–50 %. It is worth noting that even under the influence of the same typhoon (i.e., EP46 vs. EP47, EP49 vs. EP50), SOC exhibited distinct variations. These could be associated with the moving tracks of the typhoons and their relative locations with respect to Hong Kong.
The relationships of SOC with meteorological parameters and oxidants are investigated during the daytime and nighttime episodic hours. Clear diurnal patterns with higher daytime concentrations were observed (Fig. 7b), which could be associated with high emissions and strong atmospheric oxidation capacity during the daytime. Positive correlations were found between the logarithm of SOC and in both daytime and nighttime episodic hours, with comparable coefficient values (Rp=0.28–0.31, Fig. S11a). SOC levels were comparable during the daytime episodic hours among different RH bins, while during nighttime we observed the increase in SOC with RH raised from 60 % to 90 %, which might be associated with the aqueous-phase reactions.
The responses of SOC to the oxidants are distinctive in the daytime and nighttime episodic hours. We observed the gradual increase in SOC when Ox levels were < 150 ppb during the daytime, but no clear trend was observed during the nighttime; this could be explained by the negligible photooxidation reactions. Previous studies also observed better correlations of SOC with Ox in urban Hong Kong during the daytime (Zhou et al., 2014). SOC levels elevated more rapidly with the increase in NOx than O3 in both daytime and nighttime episodic hours. The average levels of SOC were doubled under conditions of NOx levels exceeding 20 ppb compared to the lowest NOx group, indicating that NOx played a more important role in SOC formation.
3.4.4 Winter haze episodes
In winter, PM2.5 episodes mainly occurred in December. During the winter episodes, northerly winds prevailed, and the wind speed generally exceeded 3 m s−1 (Fig. 8a). The city-wide PM2.5 showed a clear spatial gradient with an average max-to-min ratio (1.6–4.2, Table S2). Higher levels were observed at sites in the northwestern part of the city, followed by the central sites and eastern and southern sites (Fig. S9). This spatial pattern is consistent with the observation that wintertime air pollution in Hong Kong is frequently associated with regional transport coming from the north. Notably, the levels of PM2.5 were higher during the episodes in 2021 (EP10–13) than those in 2020 (EP62–65). This can be attributed to the increased intensity of anthropogenic emissions in 2021, as the pandemic restrictions in China were somewhat relaxed compared to 2020.
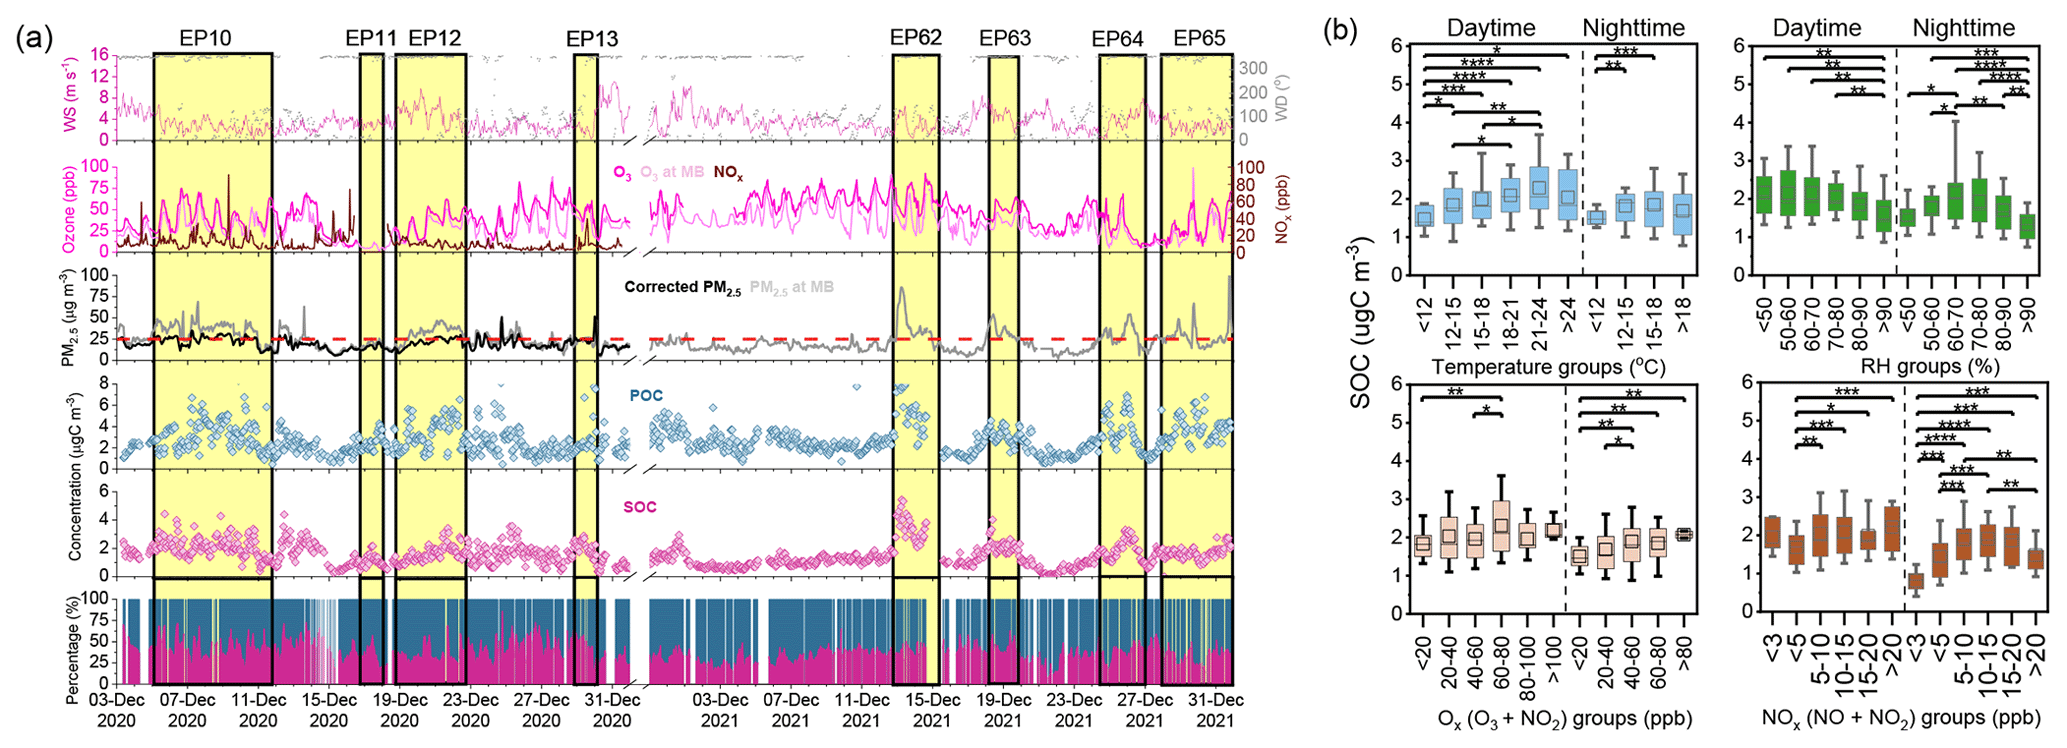
Figure 8SOC variation characteristics during haze episodes in winter 2020 and 2021. (a) Time series of meteorological parameters (wind speed and direction), gaseous pollutants (O3 and NOx), PM2.5 mass concentrations, and POC and SOC levels and their relative percentage contributions, with the yellow shaded area marking individual episodes (EP10–13 and EP62–65). (b) Concentrations of SOC as a function of temperature, RH, Ox (O3+NO2), and NOx bins, with daytime and nighttime episode hours plotted separately (the squares and horizontal lines in the box denote the average and median, respectively; the lower and upper boundaries of the boxes represent the 25th and 75th percentile values, respectively; and the whiskers are the 10th and 90th percentile values, respectively). Significance levels (p) determined by t test are as follows: p<0.0001, , , ∗ .
Regarding POC and SOC, we observed enhancements of POC by 1.5–2 times during episodes compared to non-episode hours in the winter of 2020; however, SOC did not exhibit obvious elevation during these episodes. In the winter episodes of 2021, there was concurrent rapid increase in POC and SOC throughout the progression of the episodes. The highest SOC levels were observed in EP62, coinciding with the highest O3 recorded during that episode (Fig. 8a). The percentage contributions of SOC varied among individual episodes, ranging from 29 % to 41 % in 2020 episodes and 32 % to 38 % in 2021 episodes.
Unlike the summer episodes, the winter episodes exhibited weak diurnal differences, in line with the regional source origin of the pollution, which persisted day and night. Positive correlations of SOC with temperature were only observed during daytime hours, while the correlations were insignificant at night. Similar to summer typhoon episodes, the SOC levels during the nighttime in winter initially increased with RH for the three lowest RH bins from < 50 % to 70 %, then decreased as RH further increased. It is noted that the correlation of SOC with Ox at nighttime was particularly significant during winter episodic hours when the prevailing northerly winds were dominant. The average nocturnal O3 and Ox levels at the sampling site reached around 40 ppb during the nighttime hours. Similar nocturnal O3 enhancements events have been widely observed in recent years in multiple locations in China (He et al., 2022; An et al., 2024), including Hong Kong (Feng et al., 2023). The enhanced levels of nocturnal O3 at the sampling site can increase the ambient oxidation capacity by facilitating the formation of nitrate radical (Brown and Stutz, 2012), thereby promoting the generation of secondary pollutants. The correlations of SOC with NOx during the nighttime (Rp=0.24) were slightly higher than daytime hours (Rp=0.12), highlighting a notable role of nighttime NOx chemistry in SOC formation. Previous studies have suggested that nighttime secondary formation is dependent on the NO3 radical (Nah et al., 2016; Zhang et al., 2015). Feng et al. (2022) measured the nocturnal NO3 radical in Beijing and found that nighttime SOC formation was sensitive to the NO3 radical, providing more direct evidence for the role of NOx through enhancing NO3 radical during nighttime SOC formation. If we use [NO2][O3] as a rough indicator for the production of NO3 radical (Wang et al., 2018), the observed moderate correlation between nighttime SOC with [NO2][O3] (Rp=0.36) in this study implies that SOA formation pathways involving NO3 radials were also active at our site. Previous studies have also pointed out that SOA formation in cloud and aerosol water played a more important role in determining the total SOA amount, especially in regions of high RH conditions (Ervens et al., 2011; Lim et al., 2010). As AWC and acidity are the major factors for aqueous-phase reactions (Jang et al., 2002, 2004), we investigated the relationship between SOC and AWC, as well as aerosol acidity. Table S3 tabulates the average AWC and [H+] levels during episodic hours, calculated separately for daytime and nighttime, showing higher AWC and acidity during the nighttime episodic hours. Figure S12a shows moderate correlations of SOC with AWC and acidity during nighttime (Rp=0.30 and 0.35, respectively). The correlations during daytime were less significant (Rp=0.10 and 0.11, respectively), indicating that aqueous-phase reactions were negligible during the day. These results, along with our analysis, indicate that both NO3 chemistry and acid-catalyzed aqueous-phase reactions may represent notable formation pathways for nighttime SOC during winter haze episodes.
Organic carbonaceous aerosols play a significant role in formulating policies to control PM2.5 pollution given their increasing relative contribution to PM2.5 in the ambient environment. Availability of POC and SOC from observation-based measurements is crucial for refining atmospheric models and developing more effective measures to tackle carbonaceous aerosol pollution and its associated impacts on climate change and public health. In this study, online observations of major components of PM2.5 were conducted from 16 July 2020 to 31 December 2021 at a regional suburban site in Hong Kong. POC and SOC were differentiated using a novel Bayesian inference approach, which yielded results that agree well with those derived from the elemental- and organic-tracer-based PMF method. The model utilizing sulfate as a SOC tracer exhibited the lowest error and Bayesian information criterion (BIC) values, making it a more suitable choice compared to other secondary inorganic ions, such as and . We study the characteristics of aerosol carbonaceous components, including seasonal cycles and diurnal and weekday–weekend patterns, and the influencing factors (i.e., meteorological parameters and oxidant levels) contributing to SOC formation under varied PM pollution conditions. Positive correlation between SOC level and ambient temperature was observed across different seasons. Substantially high SOC levels were associated with increased Ox concentration, especially in winter, highlighting the important role of photochemical reactions even under weak radiation conditions. NOx was found to be significant in contributing to extensive SOC formation under pollution conditions in summer.
A total of 65 city-wide PM2.5 episodes were identified over the entire study period, and the characteristics of POC and SOC varied substantially among the episodes. An in-depth analysis of summer typhoon episodes and winter haze episodes demonstrated the importance of meteorology and oxidant levels in relation to the variations in SOC and formation processes. During summer typhoon episodes, the increased carbonaceous components were largely influenced by local emissions resulting from impacts of the typhoons. Higher SOC levels were observed during the daytime, likely due to enhanced oxidation reactions under high temperatures and stronger solar radiation. In winter haze episodes, the diurnal difference was less obvious as the site was influenced by the continuous regional transport of air pollutants from northern China. Notably, the nighttime aqueous-phase reactions involving the NO3 radical were found to play an important role in SOC formation during the episodic hours.
Overall, our findings demonstrate the diverse facilitating factors contributing to aerosol pollution episodes and highlight the combined influences of meteorology and atmospheric oxidants on SOC formation. These results will be valuable for modeling studies aiming to improve accuracy in evaluating SOC contributions and variations at both city and regional scales. They will also aid the development of target-oriented strategies for air quality improvement.
The hourly carbonaceous components and other chemical speciation data presented in this study are available from the data repository maintained by HKUST: https://doi.org/10.14711/dataset/WYJQD0 (Yu and Wang, 2023).
The supplement related to this article is available online at: https://doi.org/10.5194/acp-24-5803-2024-supplement.
SW: formal analysis, investigation, data curation, visualization, writing – original draft, writing – review and editing. KL: methodology, writing – review and editing. YYC, ZZ, QW and HC: measurement of other major components, data validation. JZY: conceptualization, data curation, project administration, supervision, writing – review and editing.
The contact author has declared that none of the authors has any competing interests.
The content of this study does not necessarily reflect the views and policies of the HKSAR Government nor does the mention of trade names or commercial products constitute an endorsement or recommendation of their use.
Publisher's note: Copernicus Publications remains neutral with regard to jurisdictional claims made in the text, published maps, institutional affiliations, or any other geographical representation in this paper. While Copernicus Publications makes every effort to include appropriate place names, the final responsibility lies with the authors.
Special thanks goes to Penggang Zheng, Xin Feng, and Zhe Wang for providing the gaseous pollutant data at the HKUST supersite.
This research has been supported by the Research Grants Council University Grants Committee (grant nos. R6011-18, 16305418, and C5004-15E) and the Hong Kong University of Science and Technology (grant no. VPRDO19IP01).
This paper was edited by Qi Chen and reviewed by two anonymous referees.
An, C., Li, H., Ji, Y., Chu, W., Yan, X., and Chai, F.: A review on nocturnal surface ozone enhancement: Characterization, formation causes, and atmospheric chemical effects, Sci. Total Environ., 921, 170731, https://doi.org/10.1016/j.scitotenv.2024.170731, 2024.
Bian, Q., Alharbi, B., Shareef, M. M., Husain, T., Pasha, M. J., Atwood, S. A., and Kreidenweis, S. M.: Sources of PM2.5 carbonaceous aerosol in Riyadh, Saudi Arabia, Atmos. Chem. Phys., 18, 3969–3985, https://doi.org/10.5194/acp-18-3969-2018, 2018.
Blanchard, C. L., Hidy, G. M., Tanenbaum, S., Edgerton, E., Hartsell, B., and Jansen, J.: Carbon in southeastern US aerosol particles: Empirical estimates of secondary organic aerosol formation, Atmos. Environ., 42, 6710–6720, https://doi.org/10.1016/j.atmosenv.2008.04.011, 2008.
Bond, T. C., Doherty, S. J., Fahey, D. W., Forster, P. M., Berntsen, T., DeAngelo, B. J., Flanner, M. G., Ghan, S., Karcher, B., Koch, D., Kinne, S., Kondo, Y., Quinn, P. K., Sarofim, M. C., Schultz, M. G., Schulz, M., Venkataraman, C., Zhang, H., Zhang, S., Bellouin, N., Guttikunda, S. K., Hopke, P. K., Jacobson, M. Z., Kaiser, J. W., Klimont, Z., Lohmann, U., Schwarz, J. P., Shindell, D., Storelvmo, T., Warren, S. G., and Zender, C. S.: Bounding the role of black carbon in the climate system: A scientific assessment, J. Geophys. Res.-Atmos., 118, 5380–5552, https://doi.org/10.1002/jgrd.50171, 2013.
Brown, S. S. and Stutz, J.: Nighttime radical observations and chemistry, Chem. Soc. Rev., 41, 6405–6447, https://doi.org/10.1039/c2cs35181a, 2012.
Cao, J., Lee, S. C., Ho, K. F., Zhang, X., Zou, S., Fung, K., Chow, J. C., and Watson, J. G.: Characteristics of carbonaceous aerosol in Pearl River Delta Region, China during 2001 winter period, Atmos. Environ., 37, 1451–1460, https://doi.org/10.1016/s1352-2310(02)01002-6, 2003.
Castro, L. M., Pio, C. A., Harrison, R. M., and Smith, D. J. T.: Carbonaceous aerosol in urban and rural European atmospheres: estimation of secondary organic carbon concentrations, Atmos. Environ., 33, 2771–2781, https://doi.org/10.1016/S1352-2310(98)00331-8, 1999.
Cheng, Y., Ma, Y., and Hu, D.: Tracer-based source apportioning of atmospheric organic carbon and the influence of anthropogenic emissions on secondary organic aerosol formation in Hong Kong, Atmos. Chem. Phys., 21, 10589–10608, https://doi.org/10.5194/acp-21-10589-2021, 2021.
Chow, E. C. H., Li, R. C. Y., and Zhou, W.: Influence of Tropical Cyclones on Hong Kong Air Quality, Adv. Atmos. Sci., 35, 1177–1188, https://doi.org/10.1007/s00376-018-7225-4, 2018.
Chow, J. C., Watson, J. G., Crow, D., Lowenthal, D. H., and Merrifield, T.: Comparison of IMPROVE and NIOSH carbon measurements, Aerosol Sci. Tech., 34, 23–34, https://doi.org/10.1080/027868201300081923, 2001.
Chow, J. C., Watson, J. G., Lowenthal, D. H., Chen, L. W., and Motallebi, N.: Black and organic carbon emission inventories: review and application to California, J. Air Waste Manage., 60, 497–507, https://doi.org/10.3155/1047-3289.60.4.497, 2010.
Chow, W. S., Huang, X. H. H., Leung, K. F., Huang, L., Wu, X., and Yu, J. Z.: Molecular and elemental marker-based source apportionment of fine particulate matter at six sites in Hong Kong, China, Sci. Total Environ., 813, 152652, https://doi.org/10.1016/j.scitotenv.2021.152652, 2022.
Christian, T. J., Kleiss, B., Yokelson, R. J., Holzinger, R., Crutzen, P. J., Hao, W. M., Saharjo, B. H., and Ward, D. E.: Comprehensive laboratory measurements of biomass-burning emissions: 1. Emissions from Indonesian, African, and other fuels, J. Geophys. Res.-Atmos., 108, 4719, https://doi.org/10.1029/2003jd003704, 2003.
Day, M. C., Zhang, M., and Pandis, S. N.: Evaluation of the ability of the EC tracer method to estimate secondary organic carbon, Atmos. Environ., 112, 317–325, https://doi.org/10.1016/j.atmosenv.2015.04.044, 2015.
Deng, W., Fang, Z., Wang, Z., Zhu, M., Zhang, Y., Tang, M., Song, W., Lowther, S., Huang, Z., Jones, K., Peng, P., and Wang, X.: Primary emissions and secondary organic aerosol formation from in-use diesel vehicle exhaust: Comparison between idling and cruise mode, Sci. Total Environ., 699, 134357, https://doi.org/10.1016/j.scitotenv.2019.134357, 2020.
Ding, R., Li, J., Wang, S., and Ren, F.: Decadal change of the spring dust storm in northwest China and the associated atmospheric circulation, Geophys. Res. Lett., 32, L02808, https://doi.org/10.1029/2004gl021561, 2005.
Ding, X., Wang, X. M., and Zheng, M.: The influence of temperature and aerosol acidity on biogenic secondary organic aerosol tracers: Observations at a rural site in the central Pearl River Delta region, South China, Atmos. Environ., 45, 1303–1311, https://doi.org/10.1016/j.atmosenv.2010.11.057, 2011.
Duan, J., Huang, R.-J., Li, Y., Chen, Q., Zheng, Y., Chen, Y., Lin, C., Ni, H., Wang, M., Ovadnevaite, J., Ceburnis, D., Chen, C., Worsnop, D. R., Hoffmann, T., O'Dowd, C., and Cao, J.: Summertime and wintertime atmospheric processes of secondary aerosol in Beijing, Atmos. Chem. Phys., 20, 3793–3807, https://doi.org/10.5194/acp-20-3793-2020, 2020.
Ervens, B., Turpin, B. J., and Weber, R. J.: Secondary organic aerosol formation in cloud droplets and aqueous particles (aqSOA): a review of laboratory, field and model studies, Atmos. Chem. Phys., 11, 11069–11102, https://doi.org/10.5194/acp-11-11069-2011, 2011.
Fan, W., Chen, T., Zhu, Z., Zhang, H., Qiu, Y., and Yin, D.: A review of secondary organic aerosols formation focusing on organosulfates and organic nitrates, J. Hazard. Mater., 430, 128406, https://doi.org/10.1016/j.jhazmat.2022.128406, 2022.
Feng, X., Guo, J., Wang, Z., Gu, D., Ho, K.-F., Chen, Y., Liao, K., Cheung, V. T. F., Louie, P. K. K., Leung, K. K. M., Yu, J. Z., Fung, J. C. H., and Lau, A. K. H.: Investigation of the multi-year trend of surface ozone and ozone-precursor relationship in Hong Kong, Atmos. Environ., 315, 120139, https://doi.org/10.1016/j.atmosenv.2023.120139, 2023.
Feng, Z., Zheng, F., Liu, Y., Fan, X., Yan, C., Zhang, Y., Daellenbach, K. R., Bianchi, F., Petaja, T., Kulmala, M., and Bao, X.: Evolution of organic carbon during COVID-19 lockdown period: Possible contribution of nocturnal chemistry, Sci. Total Environ., 808, 152191, https://doi.org/10.1016/j.scitotenv.2021.152191, 2022.
Fountoukis, C. and Nenes, A.: ISORROPIA II: a computationally efficient thermodynamic equilibrium model for K+–Ca2+–Mg2+–NH–Na+–SO–NO–Cl−–H2O aerosols, Atmos. Chem. Phys., 7, 4639–4659, https://doi.org/10.5194/acp-7-4639-2007, 2007.
Gentner, D. R., Jathar, S. H., Gordon, T. D., Bahreini, R., Day, D. A., El Haddad, I., Hayes, P. L., Pieber, S. M., Platt, S. M., de Gouw, J., Goldstein, A. H., Harley, R. A., Jimenez, J. L., Prevot, A. S., and Robinson, A. L.: Review of Urban Secondary Organic Aerosol Formation from Gasoline and Diesel Motor Vehicle Emissions, Environ. Sci. Technol., 51, 1074–1093, https://doi.org/10.1021/acs.est.6b04509, 2017.
Guo, S., Hu, M., Guo, Q., Zhang, X., Zheng, M., Zheng, J., Chang, C. C., Schauer, J. J., and Zhang, R.: Primary sources and secondary formation of organic aerosols in Beijing, China, Environ. Sci. Technol., 46, 9846–9853, https://doi.org/10.1021/es2042564, 2012.
Hallquist, M., Wenger, J. C., Baltensperger, U., Rudich, Y., Simpson, D., Claeys, M., Dommen, J., Donahue, N. M., George, C., Goldstein, A. H., Hamilton, J. F., Herrmann, H., Hoffmann, T., Iinuma, Y., Jang, M., Jenkin, M. E., Jimenez, J. L., Kiendler-Scharr, A., Maenhaut, W., McFiggans, G., Mentel, Th. F., Monod, A., Prévôt, A. S. H., Seinfeld, J. H., Surratt, J. D., Szmigielski, R., and Wildt, J.: The formation, properties and impact of secondary organic aerosol: current and emerging issues, Atmos. Chem. Phys., 9, 5155–5236, https://doi.org/10.5194/acp-9-5155-2009, 2009.
He, C., Lu, X., Wang, H., Wang, H., Li, Y., He, G., He, Y., Wang, Y., Zhang, Y., Liu, Y., Fan, Q., and Fan, S.: The unexpected high frequency of nocturnal surface ozone enhancement events over China: characteristics and mechanisms, Atmos. Chem. Phys., 22, 15243–15261, https://doi.org/10.5194/acp-22-15243-2022, 2022.
Hong Kong Environment Bureau: A Clean Air Plan for Hong Kong, https://gia.info.gov.hk/general/201303/28/P201303280577_0577_108939.pdf (last access: 17 May 2024), 2013.
Hong Kong Environment Bureau: Clean Air Plan for Hong Kong 2035, https://www.eeb.gov.hk/sites/default/files/pdf/Clean_Air_Plan_2035_eng.pdf (last access: 17 May 2024), 2021.
Hu, D., Bian, Q., Li, T. W. Y., Lau, A. K. H., and Yu, J. Z.: Contributions of isoprene, monoterpenes, β-caryophyllene, and toluene to secondary organic aerosols in Hong Kong during the summer of 2006, J. Geophys. Res.-Atmos., 113, D22206, https://doi.org/10.1029/2008jd010437, 2008.
Hu, D., Bian, Q., Lau, A. K. H., and Yu, J. Z.: Source apportioning of primary and secondary organic carbon in summer PM2.5 in Hong Kong using positive matrix factorization of secondary and primary organic tracer data, J. Geophys. Res.-Atmos., 115, D16204, https://doi.org/10.1029/2009jd012498, 2010.
Huang, J. P., Fung, J. C. H., and Lau, A. K. H.: Integrated processes analysis and systematic meteorological classification of ozone episodes in Hong Kong, J. Geophys. Res.-Atmos., 111, D20309, https://doi.org/10.1029/2005jd007012, 2006.
Huang, R., Zhang, Y., Bozzetti, C., Ho, K. F., Cao, J., Han, Y., Daellenbach, K. R., Slowik, J. G., Platt, S. M., Canonaco, F., Zotter, P., Wolf, R., Pieber, S. M., Bruns, E. A., Crippa, M., Ciarelli, G., Piazzalunga, A., Schwikowski, M., Abbaszade, G., Schnelle-Kreis, J., Zimmermann, R., An, Z., Szidat, S., Baltensperger, U., El Haddad, I., and Prevot, A. S.: High secondary aerosol contribution to particulate pollution during haze events in China, Nature, 514, 218–222, https://doi.org/10.1038/nature13774, 2014.
Huang, X. H. H., Bian, Q., Ng, W. M., Louie, P. K. K., and Yu, J. Z.: Characterization of PM2.5 Major Components and Source Investigation in Suburban Hong Kong: A One Year Monitoring Study, Aerosol Air Qual. Res., 14, 237–250, https://doi.org/10.4209/aaqr.2013.01.0020, 2014.
Jaeckels, J. M., Bae, M. S., and Schauer, J. J.: Positive matrix factorization (PMF) analysis of molecular marker measurements to quantify the sources of organic aerosols, Environ. Sci. Technol., 41, 5763–5769, https://doi.org/10.1021/es062536b, 2007.
Jang, M., Czoschke, N. M., Lee, S., and Kamens, R. M.: Heterogeneous atmospheric aerosol production by acid-catalyzed particle-phase reactions, Science, 298, 814–817, https://doi.org/10.1126/science.1075798, 2002.
Jang, M., Czoschke, N. M., and Northcross, A. L.: Atmospheric organic aerosol production by heterogeneous acid-catalyzed reactions, Chemphyschem, 5, 1647–1661, https://doi.org/10.1002/cphc.200301077, 2004.
Jathar, S. H., Miracolo, M. A., Tkacik, D. S., Donahue, N. M., Adams, P. J., and Robinson, A. L.: Secondary Organic Aerosol Formation from Photo-Oxidation of Unburned Fuel: Experimental Results and Implications for Aerosol Formation from Combustion Emissions, Environ. Sci. Technol., 47, 12886–12893, https://doi.org/10.1021/es403445q, 2013.
Ke, L., Liu, W., Wang, Y., Russell, A. G., Edgerton, E. S., and Zheng, M.: Comparison of PM2.5 source apportionment using positive matrix factorization and molecular marker-based chemical mass balance, Sci. Total Environ., 394, 290–302, https://doi.org/10.1016/j.scitotenv.2008.01.030, 2008.
Kim, W., Lee, H., Kim, J., Jeong, U., and Kweon, J.: Estimation of seasonal diurnal variations in primary and secondary organic carbon concentrations in the urban atmosphere: EC tracer and multiple regression approaches, Atmos. Environ., 56, 101–108, https://doi.org/10.1016/j.atmosenv.2012.03.076, 2012.
Kleindienst, T. E., Jaoui, M., Lewandowski, M., Offenberg, J. H., Lewis, C. W., Bhave, P. V., and Edney, E. O.: Estimates of the contributions of biogenic and anthropogenic hydrocarbons to secondary organic aerosol at a southeastern US location, Atmos. Environ., 41, 8288–8300, https://doi.org/10.1016/j.atmosenv.2007.06.045, 2007.
Kleindienst, T. E., Jaoui, M., Lewandowski, M., Offenberg, J. H., and Docherty, K. S.: The formation of SOA and chemical tracer compounds from the photooxidation of naphthalene and its methyl analogs in the presence and absence of nitrogen oxides, Atmos. Chem. Phys., 12, 8711–8726, https://doi.org/10.5194/acp-12-8711-2012, 2012.
Kley, D., Geiss, H., and Mohnen, V. A.: Tropospheric Ozone at Elevated Sites and Precursor Emissions in the United-States and Europe, Atmos. Environ., 28, 149–158, https://doi.org/10.1016/1352-2310(94)90030-2, 1994.
Klingshirn, C. D., West, Z. J., DeWitt, M. J., Higgins, A., Graham, J., and Corporan, E.: Quantification of elemental and total carbon in combustion particulate matter using thermal-oxidative analysis, J. Air Waste Manage., 69, 1003–1013, https://doi.org/10.1080/10962247.2019.1630025, 2019.
Kroll, J. H., Donahue, N. M., Jimenez, J. L., Kessler, S. H., Canagaratna, M. R., Wilson, K. R., Altieri, K. E., Mazzoleni, L. R., Wozniak, A. S., Bluhm, H., Mysak, E. R., Smith, J. D., Kolb, C. E., and Worsnop, D. R.: Carbon oxidation state as a metric for describing the chemistry of atmospheric organic aerosol, Nat. Chem., 3, 133–139, https://doi.org/10.1038/Nchem.948, 2011.
Langford, B., House, E., Valach, A., Hewitt, C. N., Artaxo, P., Barkley, M. P., Brito, J., Carnell, E., Davison, B., MacKenzie, A. R., Marais, E. A., Newland, M. J., Rickard, A. R., Shaw, M. D., Yáñez-Serrano, A. M., and Nemitz, E.: Seasonality of isoprene emissions and oxidation products above the remote Amazon, Environmental Science: Atmospheres, 2, 230–240, https://doi.org/10.1039/d1ea00057h, 2022.
Li, J., Han, Z., Li, J., Liu, R., Wu, Y., Liang, L., and Zhang, R.: The formation and evolution of secondary organic aerosol during haze events in Beijing in wintertime, Sci. Total Environ., 703, 134937, https://doi.org/10.1016/j.scitotenv.2019.134937, 2020.
Li, J., Yu, X., Li, Q., Wang, S., Cheng, Y. Y., and Yu, J. Z.: Online measurement of aerosol inorganic and organic nitrogen based on thermal evolution and chemiluminescent detection, Atmos. Environ., 271, 118905, https://doi.org/10.1016/j.atmosenv.2021.118905, 2022.
Li, Y., Yu, J. Z., Ho, S. S. H., Schauer, J. J., Yuan, Z., Lau, A. K. H., and Louie, P. K. K.: Chemical characteristics and source apportionment of fine particulate organic carbon in Hong Kong during high particulate matter episodes in winter 2003, Atmos. Res., 120–121, 88–98, https://doi.org/10.1016/j.atmosres.2012.08.005, 2013.
Liao, K., Wang, Q., Wang, S., and Yu, J. Z.: Bayesian Inference Approach to Quantify Primary and Secondary Organic Carbon in Fine Particulate Matter Using Major Species Measurements, Environ. Sci. Technol., 57, 5169–5179, https://doi.org/10.1021/acs.est.2c09412, 2023.
Lim, Y. B., Tan, Y., Perri, M. J., Seitzinger, S. P., and Turpin, B. J.: Aqueous chemistry and its role in secondary organic aerosol (SOA) formation, Atmos. Chem. Phys., 10, 10521–10539, https://doi.org/10.5194/acp-10-10521-2010, 2010.
Nah, T., Sanchez, J., Boyd, C. M., and Ng, N. L.: Photochemical Aging of alpha-pinene and beta-pinene Secondary Organic Aerosol formed from Nitrate Radical Oxidation, Environ. Sci. Technol., 50, 222–231, https://doi.org/10.1021/acs.est.5b04594, 2016.
Nel, A.: Air pollution-related illness: Effects of particles, Science, 308, 804–806, https://doi.org/10.1126/science.1108752, 2005.
Notario, A., Bravo, I., Adame, J. A., Díaz-de-Mera, Y., Aranda, A., Rodríguez, A., and Rodríguez, D.: Variability of oxidants (), and preliminary study on ambient levels of ultrafine particles and VOCs, in an important ecological area in Spain, Atmos. Res., 128, 35–45, https://doi.org/10.1016/j.atmosres.2013.03.008, 2013.
Pachon, J. E., Balachandran, S., Hu, Y. T., Weber, R. J., Mulholland, J. A., and Russell, A. G.: Comparison of SOC estimates and uncertainties from aerosol chemical composition and gas phase data in Atlanta, Atmos. Environ., 44, 3907–3914, https://doi.org/10.1016/j.atmosenv.2010.07.017, 2010.
Riemer, D., Pos, W., Milne, P., Farmer, C., Zika, R., Apel, E., Olszyna, K., Kliendienst, T., Lonneman, W., Bertman, S., Shepson, P., and Starn, T.: Observations of nonmethane hydrocarbons and oxygenated volatile organic compounds at a rural site in the southeastern United States, J. Geophys. Res.-Atmos., 103, 28111–28128, https://doi.org/10.1029/98jd02677, 1998.
Roberts, J. M.: The Atmospheric Chemistry of Organic Nitrates, Atmos. Environ., 24, 243–287, https://doi.org/10.1016/0960-1686(90)90108-Y, 1990.
Robinson, A. L., Donahue, N. M., Shrivastava, M. K., Weitkamp, E. A., Sage, A. M., Grieshop, A. P., and Pandis, S. N.: Rethinking Organic Aerosols: Semivolatile Emissions and Photochemical Aging, Science, 315, 1259–1262, https://doi.org/10.1126/science.1133061, 2007.
Schauer, J. J. and Cass, G. R.: Source apportionment of wintertime gas-phase and particle-phase air pollutants using organic compounds as tracers, Environ. Sci. Technol., 34, 1821–1832, https://doi.org/10.1021/es981312t, 2000.
Seinfeld, J. H. and Pandis, S. N.: Atmospheric Chemistry and Physics: From Air Pollution to Climate Change, Wiley, New York, ISBN-13 978-0471178163, ISBN-10 0471178160, 1998.
Shi, G., Tian, Y., Zhang, Y., Ye, W., Li, X., Tie, X., Feng, Y., and Zhu, T.: Estimation of the concentrations of primary and secondary organic carbon in ambient particulate matter: Application of the CMB-Iteration method, Atmos. Environ., 45, 5692–5698, https://doi.org/10.1016/j.atmosenv.2011.07.031, 2011.
So, K. L. and Wang, T.: On the local and regional influence on ground-level ozone concentrations in Hong Kong, Environ. Pollut., 123, 307–317, https://doi.org/10.1016/s0269-7491(02)00370-6, 2003.
Stone, E. A., Zhou, J. B., Snyder, D. C., Rutter, A. P., Mieritz, M., and Schauer, J. J.: A Comparison of Summertime Secondary Organic Aerosol Source Contributions at Contrasting Urban Locations, Environ. Sci. Technol., 43, 3448–3454, https://doi.org/10.1021/es8025209, 2009.
Svendby, T. M., Lazaridis, M., and Tørseth, K.: Temperature dependent secondary organic aerosol formation from terpenes and aromatics, J. Atmos. Chem., 59, 25–46, https://doi.org/10.1007/s10874-007-9093-7, 2008.
Tsui, J. K.-Y., Guenther, A., Yip, W.-K., and Chen, F.: A biogenic volatile organic compound emission inventory for Hong Kong, Atmos. Environ., 43, 6442–6448, https://doi.org/10.1016/j.atmosenv.2008.01.027, 2009.
Turpin, B. J. and Huntzicker, J. J.: Secondary Formation of Organic Aerosol in the Los-Angeles Basin – a Descriptive Analysis of Organic and Elemental Carbon Concentrations, Atmos. Environ., 25, 207–215, https://doi.org/10.1016/0960-1686(91)90291-E, 1991.
Wang, H., Lu, K., Guo, S., Wu, Z., Shang, D., Tan, Z., Wang, Y., Le Breton, M., Lou, S., Tang, M., Wu, Y., Zhu, W., Zheng, J., Zeng, L., Hallquist, M., Hu, M., and Zhang, Y.: Efficient N2O5 uptake and NO3 oxidation in the outflow of urban Beijing, Atmos. Chem. Phys., 18, 9705–9721, https://doi.org/10.5194/acp-18-9705-2018, 2018.
Wang, M., Duan, Y., Xu, W., Wang, Q., Zhang, Z., Yuan, Q., Li, X., Han, S., Tong, H., Huo, J., Chen, J., Gao, S., Wu, Z., Cui, L., Huang, Y., Xiu, G., Cao, J., Fu, Q., and Lee, S.: Measurement report: Characterisation and sources of the secondary organic carbon in a Chinese megacity over 5 years from 2016 to 2020, Atmos. Chem. Phys., 22, 12789–12802, https://doi.org/10.5194/acp-22-12789-2022, 2022.
Wang, Q., He, X., Huang, X. H. H., Griffith, S. M., Feng, Y., Zhang, T., Zhang, Q., Wu, D., and Yu, J. Z.: Impact of Secondary Organic Aerosol Tracers on Tracer-Based Source Apportionment of Organic Carbon and PM2.5: A Case Study in the Pearl River Delta, China, ACS Earth Sp. Chem., 1, 562–571, https://doi.org/10.1021/acsearthspacechem.7b00088, 2017.
Wang, Q., Wang, S., Cheng, Y. Y., Chen, H., Zhang, Z., Li, J., Gu, D., Wang, Z., and Yu, J. Z.: Chemical evolution of secondary organic aerosol tracers during high-PM2.5 episodes at a suburban site in Hong Kong over 4 months of continuous measurement, Atmos. Chem. Phys., 22, 11239–11253, https://doi.org/10.5194/acp-22-11239-2022, 2022.
Wang, S., Wang, Q., Zhu, S., Zhou, M., Qiao, L., Huang, D., Ma, Y., Lu, Y., Huang, C., Fu, Q., Duan, Y., and Yu, J. Z.: Hourly organic tracers-based source apportionment of PM2.5 before and during the Covid-19 lockdown in suburban Shanghai, China: Insights into regional transport influences and response to urban emission reductions, Atmos. Environ., 289, 119308, https://doi.org/10.1016/j.atmosenv.2022.119308, 2022.
Wang, S., Wang, Q., Cheng, Y. Y., Chen, H., Zhang, Z., Li, J., Feng, X., Wang, Z., and Yu, J. Z.: Molecular and Elemental Tracers-Based Receptor Modeling of PM2.5 in Suburban Hong Kong With Hourly Time-Scale Air Quality Considerations, J. Geophys. Res.-Atmos., 128, e2023JD039875, https://doi.org/10.1029/2023jd039875, 2023.
Wang, X., Dong, Z., Zhang, J., and Liu, L.: Modern dust storms in China: an overview, J. Arid Environ., 58, 559–574, https://doi.org/10.1016/j.jaridenv.2003.11.009, 2004.
Wang, Z., Wang, T., Guo, J., Gao, R., Xue, L., Zhang, J., Zhou, Y., Zhou, X., Zhang, Q., and Wang, W.: Formation of secondary organic carbon and cloud impact on carbonaceous aerosols at Mount Tai, North China, Atmos. Environ., 46, 516–527, https://doi.org/10.1016/j.atmosenv.2011.08.019, 2012.
Wong, Y. K., Liu, K. M., Yeung, C., Leung, K. K. M., and Yu, J. Z.: Measurement report: Characterization and source apportionment of coarse particulate matter in Hong Kong: insights into the constituents of unidentified mass and source origins in a coastal city in southern China, Atmos. Chem. Phys., 22, 5017–5031, https://doi.org/10.5194/acp-22-5017-2022, 2022.
Wu, C. and Yu, J. Z.: Determination of primary combustion source organic carbon-to-elemental carbon (OC / EC) ratio using ambient OC and EC measurements: secondary OC-EC correlation minimization method, Atmos. Chem. Phys., 16, 5453–5465, https://doi.org/10.5194/acp-16-5453-2016, 2016.
Wu, C., Wu, D., and Yu, J. Z.: Estimation and Uncertainty Analysis of Secondary Organic Carbon Using 1 Year of Hourly Organic and Elemental Carbon Data, J. Geophys. Res.-Atmos., 124, 2774–2795, https://doi.org/10.1029/2018jd029290, 2019.
Xu, L., Guo, H., Boyd, C. M., Klein, M., Bougiatioti, A., Cerully, K. M., Hite, J. R., Isaacman-VanWertz, G., Kreisberg, N. M., Knote, C., Olson, K., Koss, A., Goldstein, A. H., Hering, S. V., de Gouw, J., Baumann, K., Lee, S. H., Nenes, A., Weber, R. J., and Ng, N. L.: Effects of anthropogenic emissions on aerosol formation from isoprene and monoterpenes in the southeastern United States, P. Natl. Acad. Sci. USA, 112, 37–42, https://doi.org/10.1073/pnas.1417609112, 2015.
Yao, L., Huo, J., Wang, D., Fu, Q., Sun, W., Li, Q., and Chen, J.: Online measurement of carbonaceous aerosols in suburban Shanghai during winter over a three-year period: Temporal variations, meteorological effects, and sources, Atmos. Environ., 226, 117408, https://doi.org/10.1016/j.atmosenv.2020.117408, 2020.
Yu, J. Z.: Chemical Characterization of Water Soluble Organic Compounds in Particulate Matters in Hong Kong, Hong Kong Environmental Protection Department, https://www.epd.gov.hk/epd/sites/default/files/epd/english/environmentinhk/air/studyrpts/files/wsoc_final_report_v3.pdf (last access: 17 May 2024), 2002.
Yu, J. Z. and Wang, S.: Hourly POC and SOC and other PM2.5 major components (July 2020–December 2021) at the HKUST Supersite, Hong Kong, DataSpace@HKUST [data set], https://doi.org/10.14711/dataset/WYJQD0, 2023.
Yuan, Z. B., Yu, J. Z., Lau, A. K. H., Louie, P. K. K., and Fung, J. C. H.: Application of positive matrix factorization in estimating aerosol secondary organic carbon in Hong Kong and its relationship with secondary sulfate, Atmos. Chem. Phys., 6, 25–34, https://doi.org/10.5194/acp-6-25-2006, 2006.
Zhang, R., Wang, G., Guo, S., Zarnora, M. L., Ying, Q., Lin, Y., Wang, W., Hu, M., and Wang, Y.: Formation of Urban Fine Particulate Matter, Chem. Rev., 115, 3803–3855, https://doi.org/10.1021/acs.chemrev.5b00067, 2015.
Zhang, Y., Mao, H., Ding, A., Zhou, D., and Fu, C.: Impact of synoptic weather patterns on spatio-temporal variation in surface O3 levels in Hong Kong during 1999–2011, Atmos. Environ., 73, 41–50, https://doi.org/10.1016/j.atmosenv.2013.02.047, 2013.
Zhao, Y., Hu, M., Slanina, S., and Zhang, Y.: Chemical compositions of fine particulate organic matter emitted from Chinese cooking, Environ. Sci. Technol., 41, 99–105, https://doi.org/10.1021/es0614518, 2007.
Zhou, S., Wang, T., Wang, Z., Li, W., Xu, Z., Wang, X., Yuan, C., Poon, C. N., Louie, P. K. K., Luk, C. W. Y., and Wang, W.: Photochemical evolution of organic aerosols observed in urban plumes from Hong Kong and the Pearl River Delta of China, Atmos. Environ., 88, 219–229, https://doi.org/10.1016/j.atmosenv.2014.01.032, 2014.
Zhu, S., Wang, Q., Qiao, L., Zhou, M., Wang, S., Lou, S., Huang, D., Wang, Q., Jing, S., Wang, H., Chen, C., Huang, C., and Yu, J. Z.: Tracer-based characterization of source variations of PM2.5 and organic carbon in Shanghai influenced by the COVID-19 lockdown, Faraday Discuss., 226, 112–137, https://doi.org/10.1039/d0fd00091d, 2021.