the Creative Commons Attribution 4.0 License.
the Creative Commons Attribution 4.0 License.
 | 21 May 2024
The 2019 Raikoke eruption as a testbed used by the Volcano Response group for rapid assessment of volcanic atmospheric impacts
Jean-Paul Vernier
Thomas J. Aubry
Claudia Timmreck
Anja Schmidt
Lieven Clarisse
Fred Prata
Nicolas Theys
Andrew T. Prata
Graham Mann
Hyundeok Choi
Simon Carn
Richard Rigby
Susan C. Loughlin
John A. Stevenson
The 21 June 2019 Raikoke eruption (48° N, 153° E) generated one of the largest amounts of sulfur emission to the stratosphere since the 1991 Mt. Pinatubo eruption. Satellite measurements indicate a consensus best estimate of 1.5 Tg for the sulfur dioxide (SO2) injected at an altitude of around 14–15 km. The peak Northern Hemisphere (NH) mean 525 nm stratospheric aerosol optical depth (SAOD) increased to 0.025, a factor of 3 higher than background levels. The Volcano Response (VolRes) initiative provided a platform for the community to share information about this eruption which significantly enhanced coordination efforts in the days after the eruption. A multi-platform satellite observation subgroup formed to prepare an initial report to present eruption parameters including SO2 emissions and their vertical distribution for the modeling community. It allowed us to make the first estimate of what would be the peak in SAOD 1 week after the eruption using a simple volcanic aerosol model. In this retrospective analysis, we show that revised volcanic SO2 injection profiles yield a higher peak injection of the SO2 mass. This highlights difficulties in accurately representing the vertical distribution for moderate SO2 explosive eruptions in the lowermost stratosphere due to limited vertical sensitivity of the current satellite sensors (±2 km accuracy) and low horizontal resolution of lidar observations. We also show that the SO2 lifetime initially assumed in the simple aerosol model was overestimated by 66 %, pointing to challenges for simple models to capture how the life cycle of volcanic gases and aerosols depends on the SO2 injection magnitude, latitude, and height. Using a revised injection profile, modeling results indicate a peak NH monthly mean SAOD at 525 nm of 0.024, in excellent agreement with observations, associated with a global monthly mean radiative forcing of −0.17 W m−2 resulting in an annual global mean surface temperature anomaly of −0.028 K. Given the relatively small magnitude of the forcing, it is unlikely that the surface response can be dissociated from surface temperature variability.
- Article
(8385 KB) - Full-text XML
- BibTeX
- EndNote


After 95 years of dormancy, the Raikoke volcano in the Kuril Islands (Pacific Northwest; 48.292° N, 153.25° E) began a series of explosions at 18:00 UTC on 21 June 2019 lasting around 24 h. Raikoke forms a small uninhabited Island of 2 × 2.5 km which belongs to the Russian Federation, 16 km from Matua Island in the Sea of Okhotsk. Its name originates from the ancient Japanese Ainu language and translates to “hell mouth”, referring to past volcanic eruptions. The first eruption reports of Raikoke originated in the mid-18th century, but it was during the 1788 eruption that one-third of the Island was destroyed (Gorshkov, 1970). The last known eruption was reported in February 1924. Since then, the volcano has remained dormant. The volcano is monitored by the Sakhalin Volcanic Eruption Response Team (SVERT), part of the Institute of Marine Geology, Kamchatka, and the Kamchatka Volcanic Eruption Response Team (KVERT). During the latest eruption, in 2019, the first of a series of eight explosions was reported by KVERT on 21 June at 17:50 UTC and quickly followed 1 h later by a volcanic ash advisory produced by the Tokyo Volcanic Ash Advisory Center (VAAC) which is responsible for providing ash warnings to the International Civil Aviation Organization (ICAO) across the Pacific Northwest (Sennert, 2019). In addition, KVERT, which issues volcano observatory notice warnings for aviation, had flagged the event with an aviation color code red which signifies that an “eruption is underway with significant emission ash into the atmosphere” (see KVERT's website for more information http://www.kscnet.ru/ivs/kvert/van/index?type=1, last access: 23 March 2024). As a result, nearly 40 flights were rerouted to avoid volcanic ash clouds.
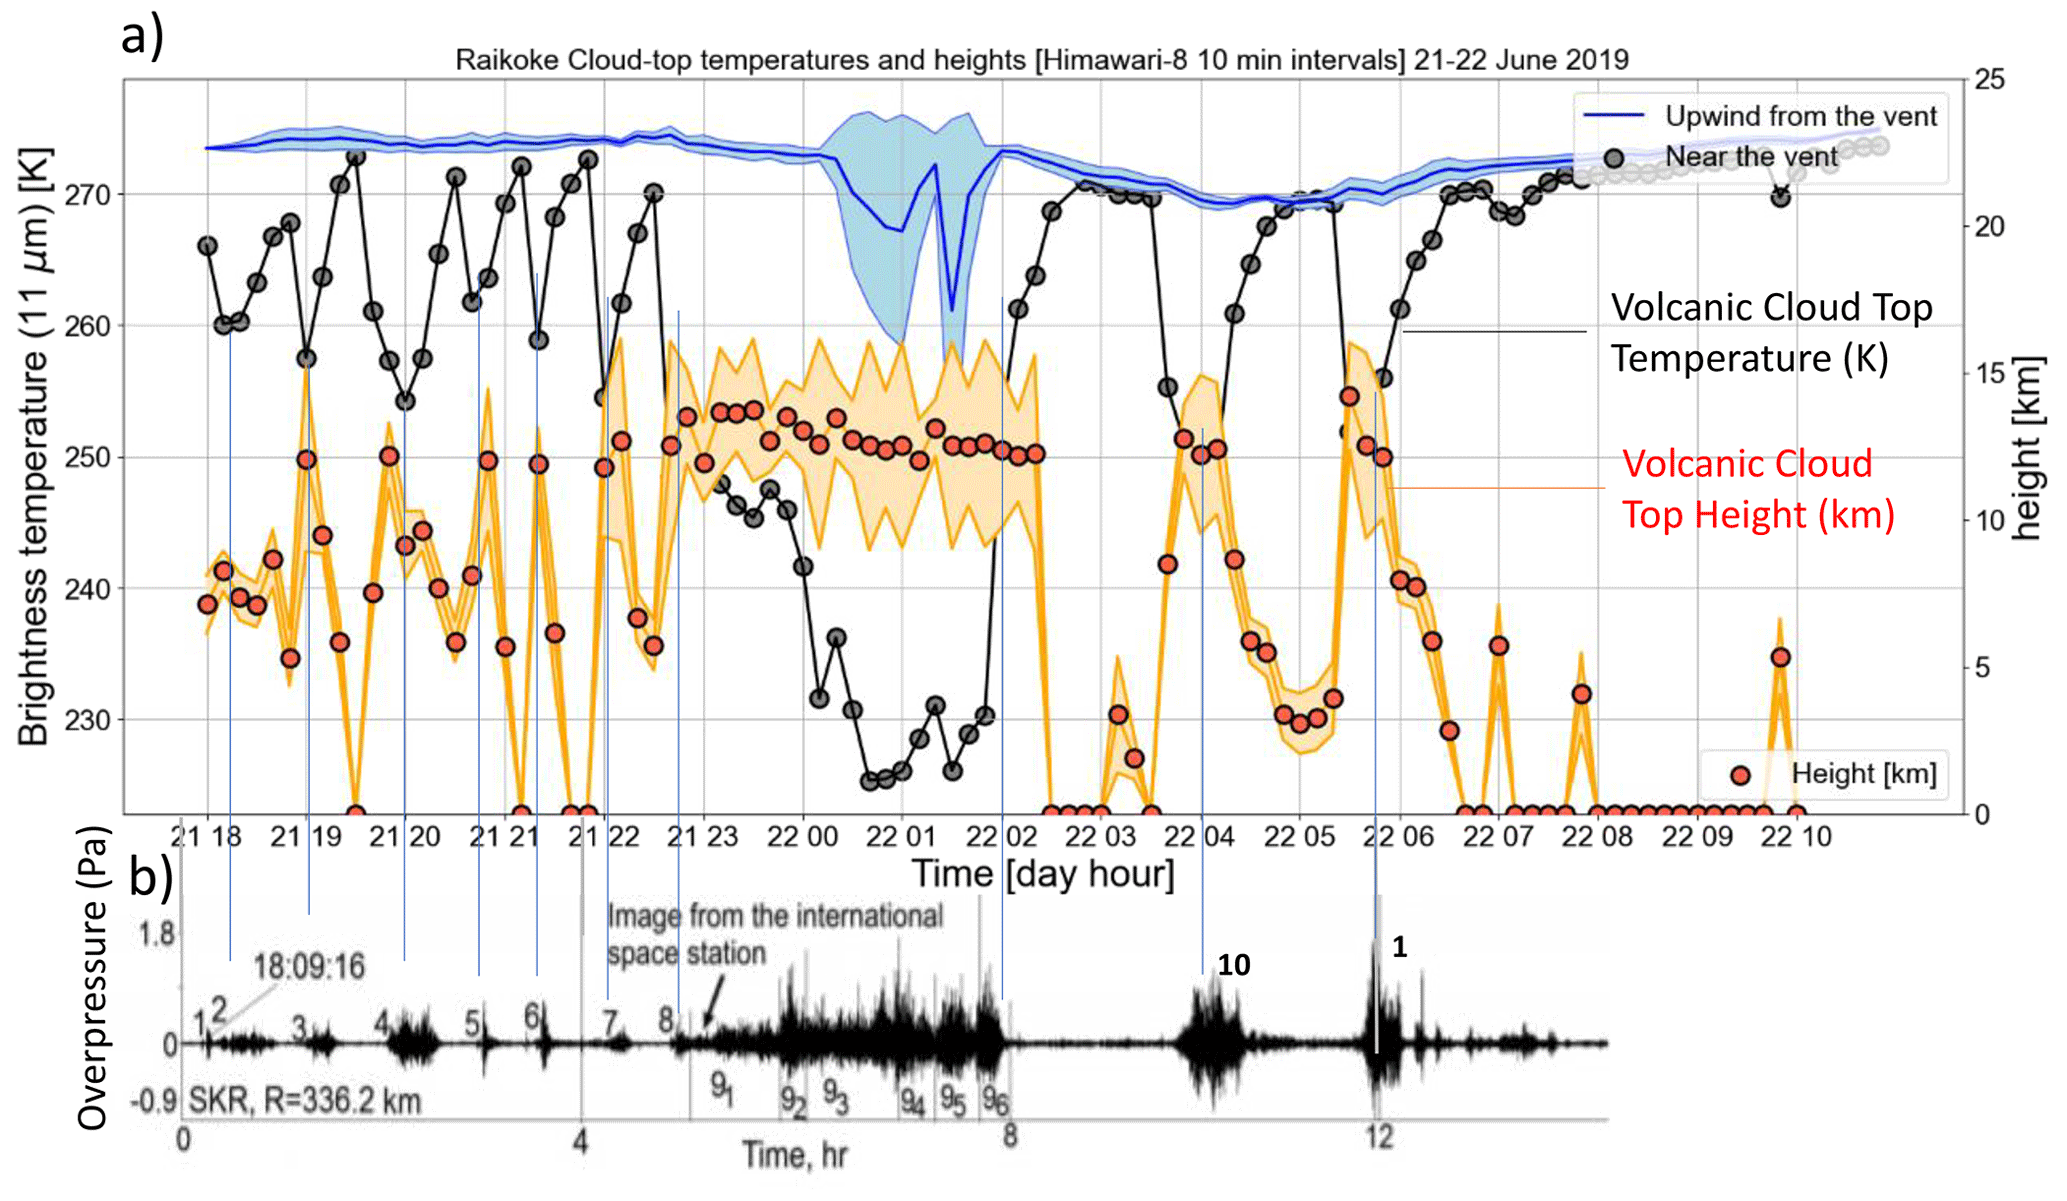
Figure 1Panel (a) shows a time series of Himawari-8 cloud-top brightness temperatures from the 11 µm channel. The blue line corresponds to the mean of 3 × 3 pixels at a point upwind, but close to, the vent. The shaded region represents ±1σ from the mean. The gray dots are brightness temperatures at the pixel closest to the vent. The brightness temperature's (BT) rapid decreases at the vent, which are not coincident with the upwind values, suggest eruptive columns with cold, high cloud tops. The BT values should be read from the left-hand ordinate axis. The orange dots with uncertainties (shaded) correspond to cloud-top height (right-hand ordinate axis) taken from Prata et al. (2022). Panel (b) is modified from Fig. 7 of Firstov et al. (2020) showing InfraSound (IS) signals (overpressure) during the first 12 h after the beginning of the Raikoke eruption which started near 17:53:54 UTC on 21 June 2019 from a ground station on Paramushir Island (SKR, southern tip of Kamchatka). The numbers indicate the separate episodes of the eruption, defined by the records at SKR. The blue lines connect those IS episodes with the observed minimum in cloud-top temperature. R corresponds to the distance between the station and the Raikoke volcano.
Firstov et al. (2020) analyzed the infrasound signal (IS) from overpressure measurements from ground stations in Kamchatka and found a total of 12 explosive episodes (see Fig. 1b). The first eight episodes were followed by a continuous episode (episode nine) which lasted for 3.5 h. Based on IS analysis, episodes are separated into magma fragmentation/nonstationary processes and vent outflow (one to three, seven, nine, and 10) of ash and gas into the atmosphere. They were used to derive a minimal eruption tephra volume of 0.1 km3 allowing us to categorize the eruption as a 4 according to the volcanic explosivity index (VEI) (Firstov et al., 2020). Figure 1a shows cloud-top temperature (11 µm) and associated cloud-top height derived from the Himawari-8 geostationary satellite compared with IS data shown in Fig. 1b. The eruption started at around 18:00 UTC on 21 June 2019 followed by at least eight discrete “bursts” (eruptions) and continuous emissions. An additional two discrete pulses occurred later. The IS analysis coincides very well with the Himawari-8 observations where each IS corresponds to the release of volcanic cloud into the atmosphere. Muser et al. (2020) used one-dimensional volcanic plume models (Mastin, 2007; Folch et al., 2016) to invert the mass eruption rate of ash and initialize the ICON-ART (Zängl et al., 2015) dispersion model to investigate the complex aerosol, dynamic, and radiative processes governing the plume evolution. A more simplistic initialization approach with the dispersion model NAME (Numerical Atmospheric-dispersion Modelling Environment; Beckett et al., 2020) and the aerosol–chemistry–climate model known as the Whole Atmosphere Community Climate Model (WACCM) (Mills et al., 2016) was performed during the VolRes activities shortly after the eruption to assess the early dispersion of the plume.
As part of the scientific response to the eruption, the Volcano Response (VolRes) initiative triggered an initial dialogue among the science community. VolRes is an international working group, within the Stratospheric Sulfur and its Role in Climate (SSiRC), to establish cooperation and community planning, for the next large-magnitude eruption, and it is aligned also with the NASA initiative for the USA-based volcano response plan (Carn et al., 2021). The SSiRC initiative is itself an activity within the SPARC project of the World Climate Research Program (WCRP). Since its inception in 2015, VolRes consists of more than 250 scientists worldwide, from a diverse range of both model and observational expertise, aiming to contribute from the sharing and discussion of information related to the atmospheric impacts of volcanoes. Discussion and sharing via the mailing list is maintained through an archive and Wiki page (https://wiki.earthdata.nasa.gov/display/volres, last access: 23 March 2024), structured according to eruption since 2018.
The discussions on the VolRes forum have mostly been focused on the following: (i) establishing initial estimates of the emitted SO2 and ash, as well as injection height estimates from multiple satellite observation platforms; (ii) the expected impacts on stratospheric aerosol loadings; (iii) factors to consider in modeling the aerosol cloud, with the aim of predicting radiative and climate effects; and (iv) common related findings after other similar eruptions. Several cross-institutional joint operations resulted from the VolRes activity, which also motivated the Raikoke ACP/AMT/GMD inter-journal special issue “Satellite observations, in situ measurements and model simulations of the 2019 Raikoke eruption”. The Raikoke special issue includes a series of publications (Muser et al., 2020; Kloss et al., 2021; Vaughan et al., 2021; de Leeuw et al., 2021; Horváth et al., 2021a, b; Gorkavyi et al., 2021; Inness et al., 2022; Mingari et al., 2022; Osborne et al., 2022; Bruckert et al., 2022; Capponi et al., 2022; Cai et al., 2022; Harvey et al., 2022; Knepp et al., 2022; Prata et al., 2022; Petracca et al., 2022) focusing on the atmospheric impacts of this eruption using satellite low earth orbiting/geostationary nadir and limb observations from UV–visible to far infrared, model simulations, airborne measurements, and ground-based lidar observations.
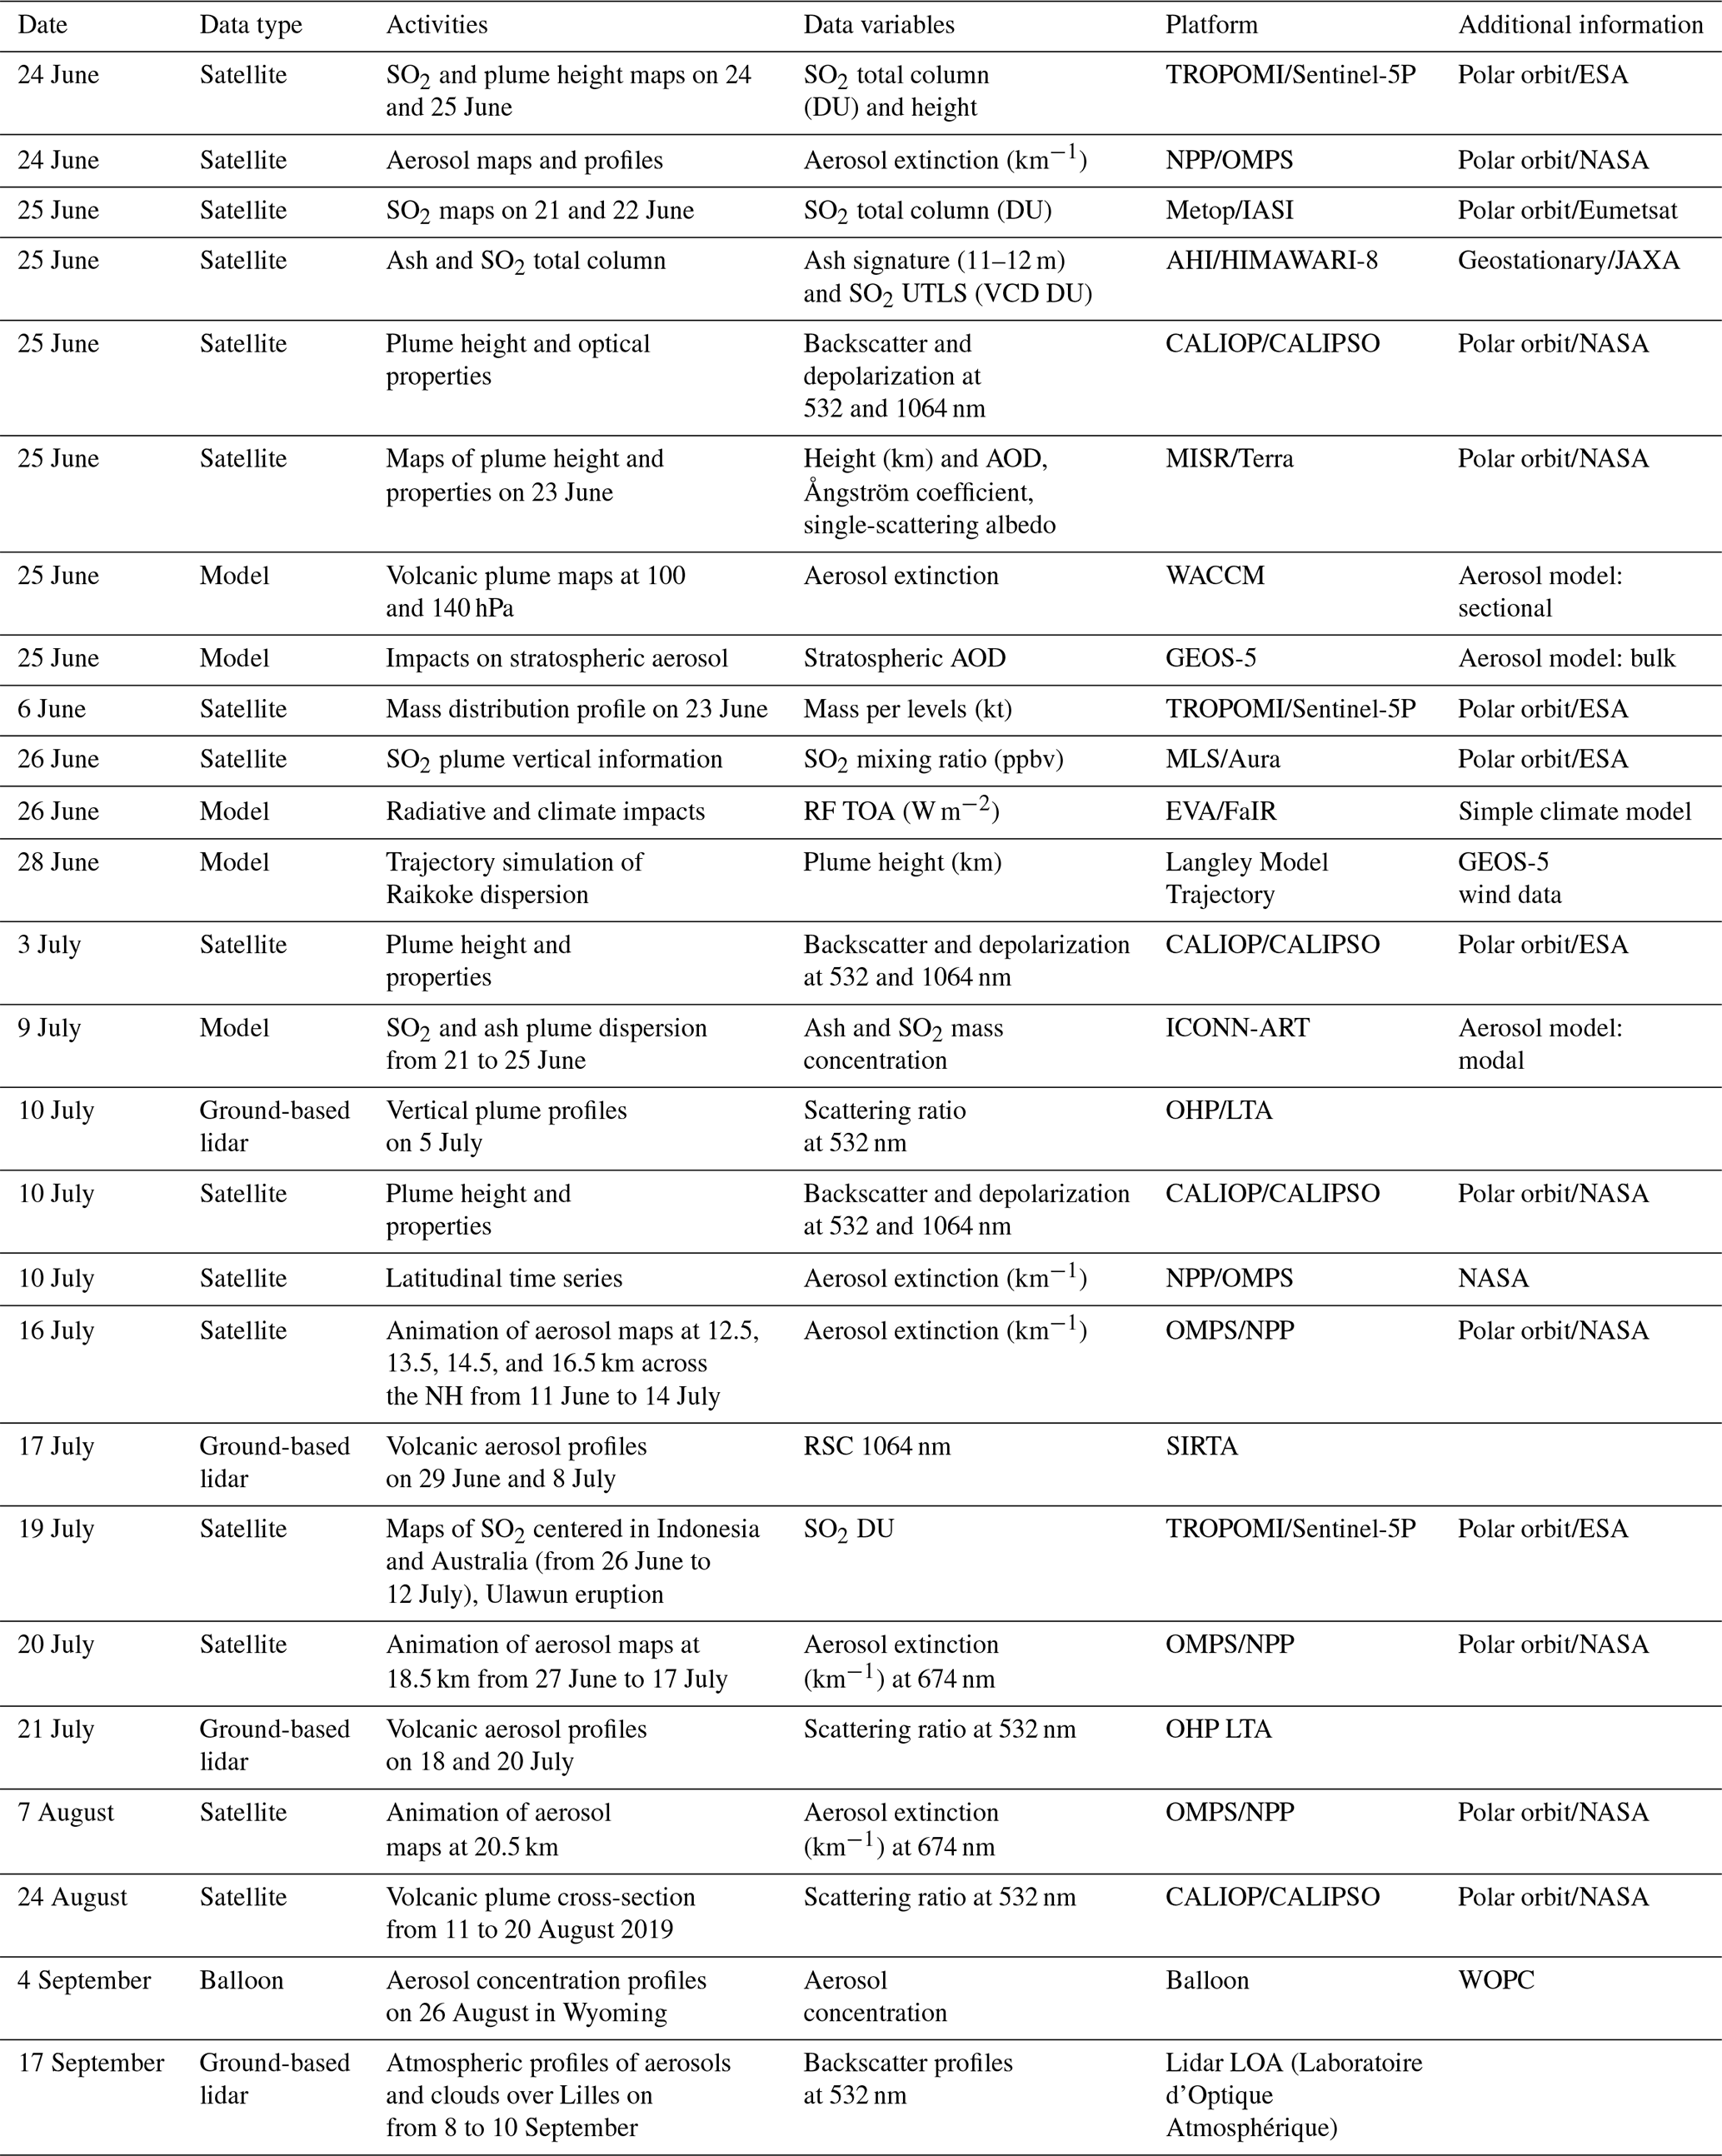
Table 1VolRes activities during the first 2 months after the Raikoke eruption. UTLS stands for upper troposphere–lower stratosphere, VCD stands for vertical column density, AOD stands for aerosol optical depth, RF TOA stands for radiative forcing top of the atmosphere, RSC stands for range-corrected signal.
The goals of this paper are the following.
-
Describe the activities undertaken by the Volcano Response group (https://wiki.earthdata.nasa.gov/display/volres, last access: 23 March 2024) at the time of the 2019 Raikoke eruption. A chronology of these activities is provided in Table 1.
-
Give an overview of the early estimates of the mass of SO2 emitted as well as the associated radiative forcing and temperature response inferred quickly after the eruption.
-
Discuss how revised estimates of SO2 mass and plume height, as well as radiative forcing estimates, differ from the rapid assessment made a week after the eruption.
-
Summarize the findings of the Raikoke special issue and highlight the remaining questions as well as the challenges associated with rapid response to volcanic eruptions in the context of atmospheric impacts.
2.1 Himawari-8
Himawari-8 is a spacecraft developed and operated by the Japan Aerospace Exploration Agency (JAXA). The primary instrument aboard Himawari 8 is the Advanced Himawari Imager (AHI), a 16-channel spectral imager that captures visible light and infrared images of the Asia Pacific region at 500 m horizontal resolution every 10 min. AHI is used to derive the cloud-top temperature and associated cloud-top height associated with the Raikoke eruption.
2.2 TROPOMI
The TROPOspheric Monitoring Instrument (TROPOMI), which is onboard the Sentinel-5 Precursor satellite, provides atmospheric composition measurements (Veefkind et al., 2012) at a high spatial resolution of 3.5 × 5.5 km2. TROPOMI is a hyperspectral sounder with different spectral bands from ultraviolet (UV) to shortwave infrared. TROPOMI provides nearly global coverage in 1 d at 13:30 local time (LT). For a rapid assessment of the total emitted SO2 mass, the operational SO2 product (Theys et al., 2017) was used. A refined analysis was then performed with the scientific SO2 layer height and vertical column joint retrieval of Theys et al. (2022).
2.3 IASI
The Infrared Atmospheric Sounding Interferometer (IASI) is the high-spectral-resolution infrared sounder onboard the operational Metop A-B-C platforms. With a morning and evening overpass (around 09:30 and 21:30 LT), combined with a large swath, the instrument samples the entire globe twice a day. Its footprint is a 12 km diameter circle at nadir viewing angles, gradually increasing to a 20 × 39 km ellipse at the far end of its swath. The SO2 product that was used for rapid assessment is the one detailed in Clarisse et al. (2014). The retrieval algorithm consists of two steps. The first step is to estimate the so-called Z function for each observed spectrum using a set of derivatives (Jacobians) with respect to the SO2 partial columns at varying altitudes. The altitude at which the Z function reaches its maximum is the retrieved SO2 height. In the second step, the estimated SO2 height is used to constrain the IASI SO2 column retrieval. Note that the entire retrieval uses the 7.3 µm absorption band of SO2, which is less affected by ash than the 8.6 µm band. While the altitude algorithm has a general accuracy better than 2 km, it is known to underestimate the SO2 altitude for high SO2 columns. For the refined analysis discussed below, a new experimental product was used that deals better with saturation issues.
2.4 Aqua satellite and AIRS
The atmospheric Infrared Radiation Sounder (AIRS) instrument is onboard the NASA polar-orbiting Aqua satellite at an altitude of about 705 km above the earth's surface with an equatorial crossing time at 01:30 and 13:30 LT (Chahine et al., 2005; Prata and Bernardo, 2007). AIRS provides nearly continuous measurement coverage during 14.5 orbits per day and a 95 % global daily coverage with a swath of 1650 km and a special resolution of 13.5 × 13.5 km at nadir (Tournigand et al., 2020). We use version 7.0 of the AIRS level-2 Support Retrieval product and the results are averaged into 1° × 1° grid cells in this analysis. The brightness temperature difference (BTD; less than −6 K) is used as a proxy of SO2 released from volcanoes. (For more information about the AIRS BTD, see https://docserver.gesdisc.eosdis.nasa.gov/public/project/AIRS/V7_L2_Product_User_Guide.pdf, last access: 23 March 2024, pp. 102–103.)
2.5 CALIPSO and CALIOP
The Cloud–Aerosol Lidar with Orthogonal Polarization (CALIOP), which is onboard the Cloud–Aerosol Lidar and Infrared Pathfinder Satellite Observations (CALIPSO) platform, has been providing aerosol vertical profile measurements of the earth's atmosphere on a global scale since June 2006 (Winker et al., 2010). We use version 4.21 of the CALIOP Level-2 Aerosol Layer and Cloud Layer products, and only quality-screened samples are used in the analysis. Cloud–aerosol discrimination (CAD) is the algorithm that evaluates CALIOP observables to classify layers and assign values between −100 (certainly aerosol) and 100 (certainly cloud). Aerosol layers with a CAD score between −100 and −20 are selected to avoid low confidence (Winker et al., 2013; Tackett et al., 2018). Aerosol layers with the extinction quality control (QC) flag that are not equal to 0, 1, 16, or 18 are rejected to remove low-confidence extinction retrievals. Detailed information on the QC flag can be found in Tackett et al. (2018). In addition, aerosol extinction samples with the extinction uncertainty equal to 99.99 km−1 and all samples at lower altitudes in the profile are rejected to remove unreliable extinctions (Winker et al., 2013).
One of the main activities of a satellite subgroup formed within the framework of VolRes was to derive eruption parameters characterizing SO2 emissions (e.g., mass, bulk height, and injection profiles) as soon as possible so that modelers would be able to run numerical simulations to understand the potential hazards and climate impacts of this eruption. The basic approach to estimate the total mass of SO2 is similar for each satellite-based sensor. First, the process involves retrieving the vertical column density (VCD; measured in molec. cm−2, g m−2, or Dobson units) in each pixel affected by SO2, followed by multiplying by the area of the pixels and integrating all the pixels to calculate the total SO2 loadings. However, there are limitations to this method. Indeed, narrow swath width sensors, timing of the polar orbit, and, in the case of the geostationary sensors, extreme viewing geometry (high satellite zenith angles) and movement out of the field of view will introduce errors (likely underestimations) in the total mass. There are also many assumptions used by the various algorithms that, if not valid, will introduce errors, as will be discussed hereunder. When the VCDs are large (> 500 DU), most algorithms have difficulty in estimating the VCD correctly (Hyman and Pavolonis, 2020; Prata et al., 2021).
Table 2SO2 mass profile (in kt) derived from IASI and TROPOMI for the Raikoke eruption.
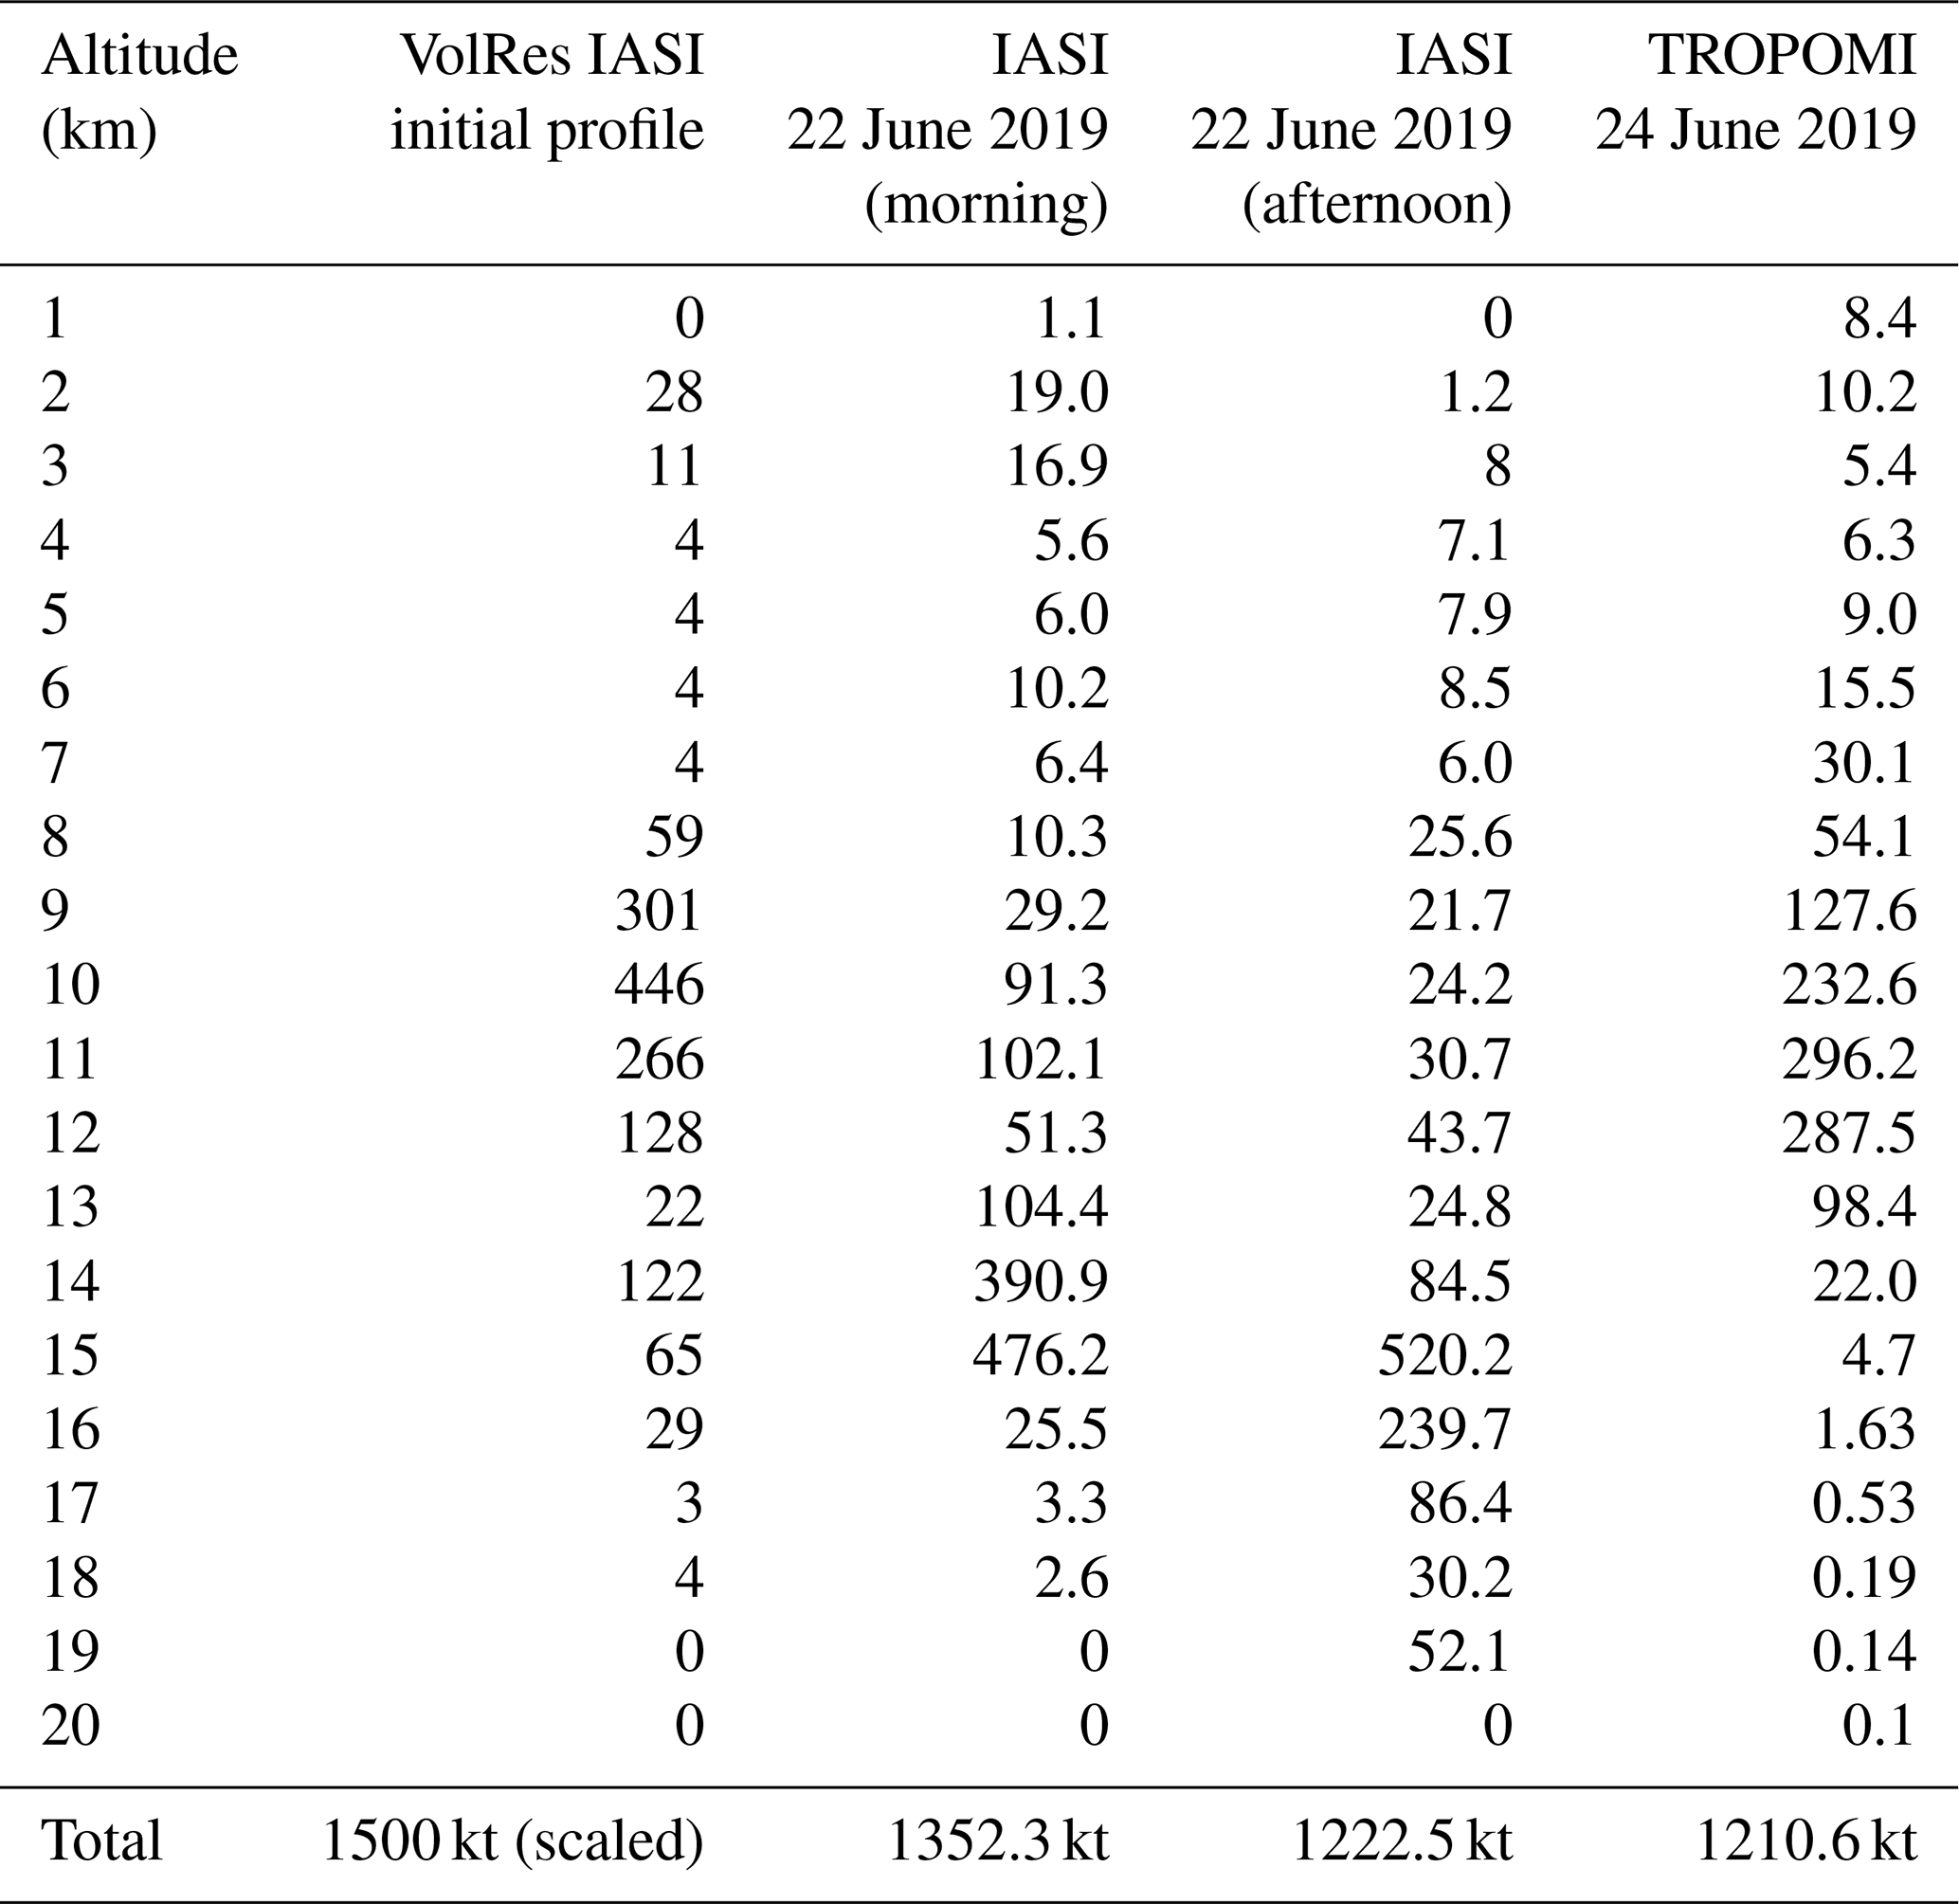
Figure 2 shows the time evolution of the total SO2 mass, during and after the Raikoke eruption, from multiple sensors. The measurements discussed here all assume SO2 in the upper troposphere/lower stratosphere (UTLS; 7–12 km). The SO2 retrieved from Himawari-8 peaks near 1.5 Tg nearly 48 h after the beginning of the eruption and follows a temporal evolution similar to the one derived from low earth orbit (LEO) satellites. Given the likelihood that most satellites underestimated the SO2 mass, we chose at that time the maximum value from Himawari-8 and the upper limits of the other sensors, yielding a 1.5 ± 0.2 Tg estimation. IASI, TROPOMI, and CALIPSO data suggested that SO2 was injected within a large altitude range from the ground up to well into the stratosphere (at least 15 km). In addition to a total mass of SO2 (of 1.5 Tg), the VolRes team issued a provisional vertical distribution of the emitted SO2 mass that could be used by dispersion and climate modelers. To do so, IASI SO2 height measurements on 22 June 2019 were used. The mass altitude indicated that most SO2 was released between 8–12 km with a secondary peak around 14–15 km. Scaled to the proposed 1.5 Tg, the distribution is shown in Fig. 3 and is referred to as the “VolRes profile” (blue line; also see Table 2). For TROPOMI and other low earth orbiting satellites (LEOs), the plume can be partly covered by a given orbit, but using the multiple orbits of 1 d and the fact that they generally overlap, most of the plume is covered. To avoid double counting, the data of 1 full day are usually averaged on a regular latitude–longitude grid before the actual emitted SO2 mass is calculated. An important source of error is the vertical distribution of SO2. In Fig. 2, the retrieved SO2 mass from TROPOMI was calculated by assuming a bulk plume height of 15 km (all plume heights given above sea level unless specified). This assumption can introduce errors (underestimation) in particular for clear-sky scenes and if the SO2 is in the (lower) troposphere, typically below 7 km (see, e.g., Fig. 1 of Theys et al., 2013). TROPOMI has fewer limitations in retrieving very large SO2 columns (> 500 DU) because in that case the spectral range used (360–390 nm) is weakly affected by saturation due to non-linear SO2 absorption (Bobrowski et al., 2010). The main problem is the presence of aerosols which are not explicitly treated in the retrievals (Theys et al., 2017). For ash, the photons cannot penetrate deep into the volcanic cloud (only the cloud-top layer is sensed) and this leads to a strong underestimation of the mass of SO2 (by a factor of 5 or so).
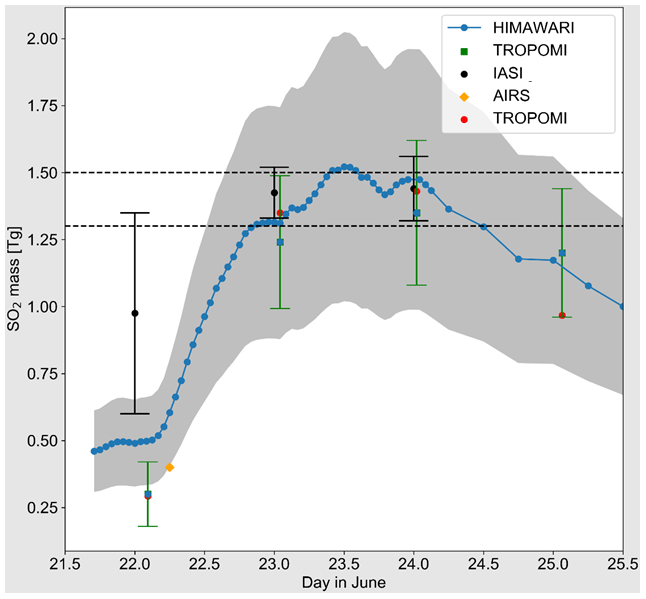
Figure 2Total SO2 mass (in Tg) as a function of time in June 2019 estimated from various satellite sensors for the eruption of Raikoke. The gray-colored region indicates the uncertainty range of the Himawari-8 (AHI) retrievals. A ±20 % uncertainty has been placed on the TROPOMI estimates. The IASI estimates come from different satellites and times of day (i.e., day and night). The vertical lines on these data indicate the range of the estimations. Himawari-8 samples every 10 min. After 24 June, retrievals were performed at longer intervals. Distributed to the scientists associated with VolRes on 28 June 2019.
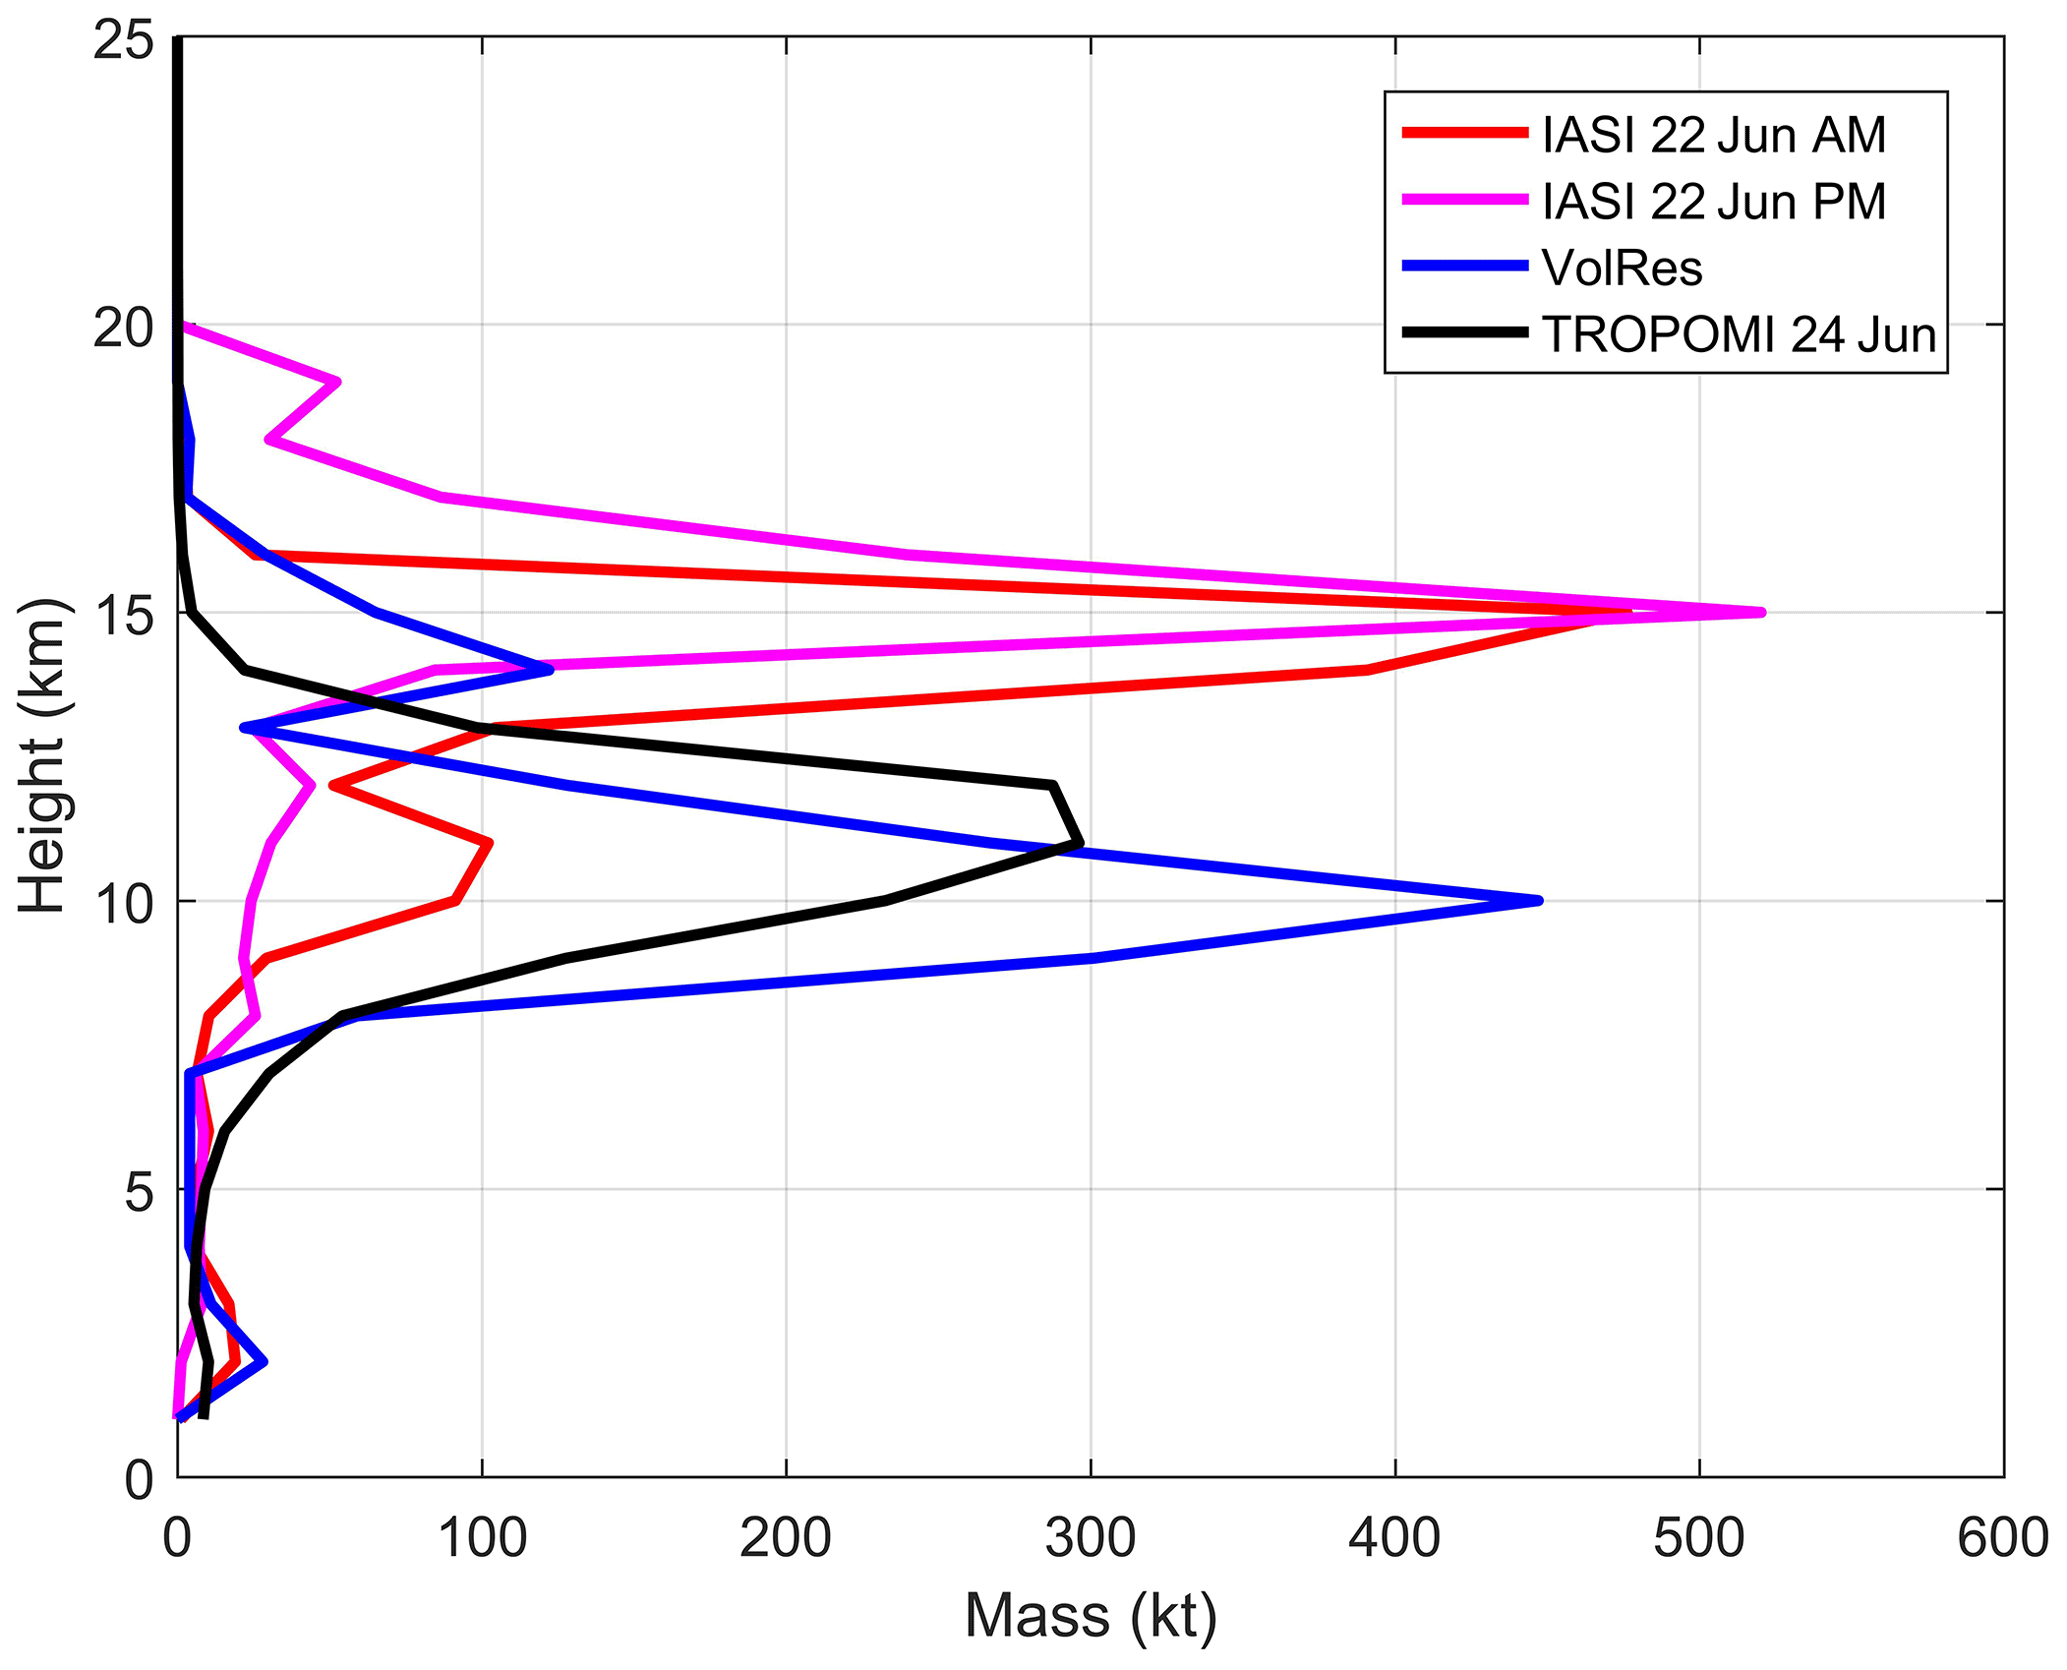
Figure 3SO2 mass altitude distribution from IASI (refined analysis), VolRes (IASI initial estimate), and TROPOMI. The associated data are provided in Table 2. AM (all morning) indicates the data gathered at 09:30 local time (LT), and PM (afternoon) indicates the data at 21:30 LT.
While the accuracy of the IASI SO2 height retrievals is typically better than 2 km, it became clear that the VolRes profile was peaking too low in the atmosphere (e.g., de Leeuw et al., 2021). The main reason for this is related to the SO2 Jacobians used in the retrieval. These Jacobians are precalculated for relatively low SO2 VCDs and are not directly applicable to saturated plumes, as encountered during the Raikoke eruption. Refinement of the IASI algorithm to better account for this dependence on the SO2 loadings has led to an SO2 injection profile with a maximum SO2 peaking at ∼ 14–15 km (see Fig. 3) and a slightly lower total SO2 mass of ∼ 1.3 Tg (even though total mass was estimated for the days after reaching again 1.5 Tg and higher).
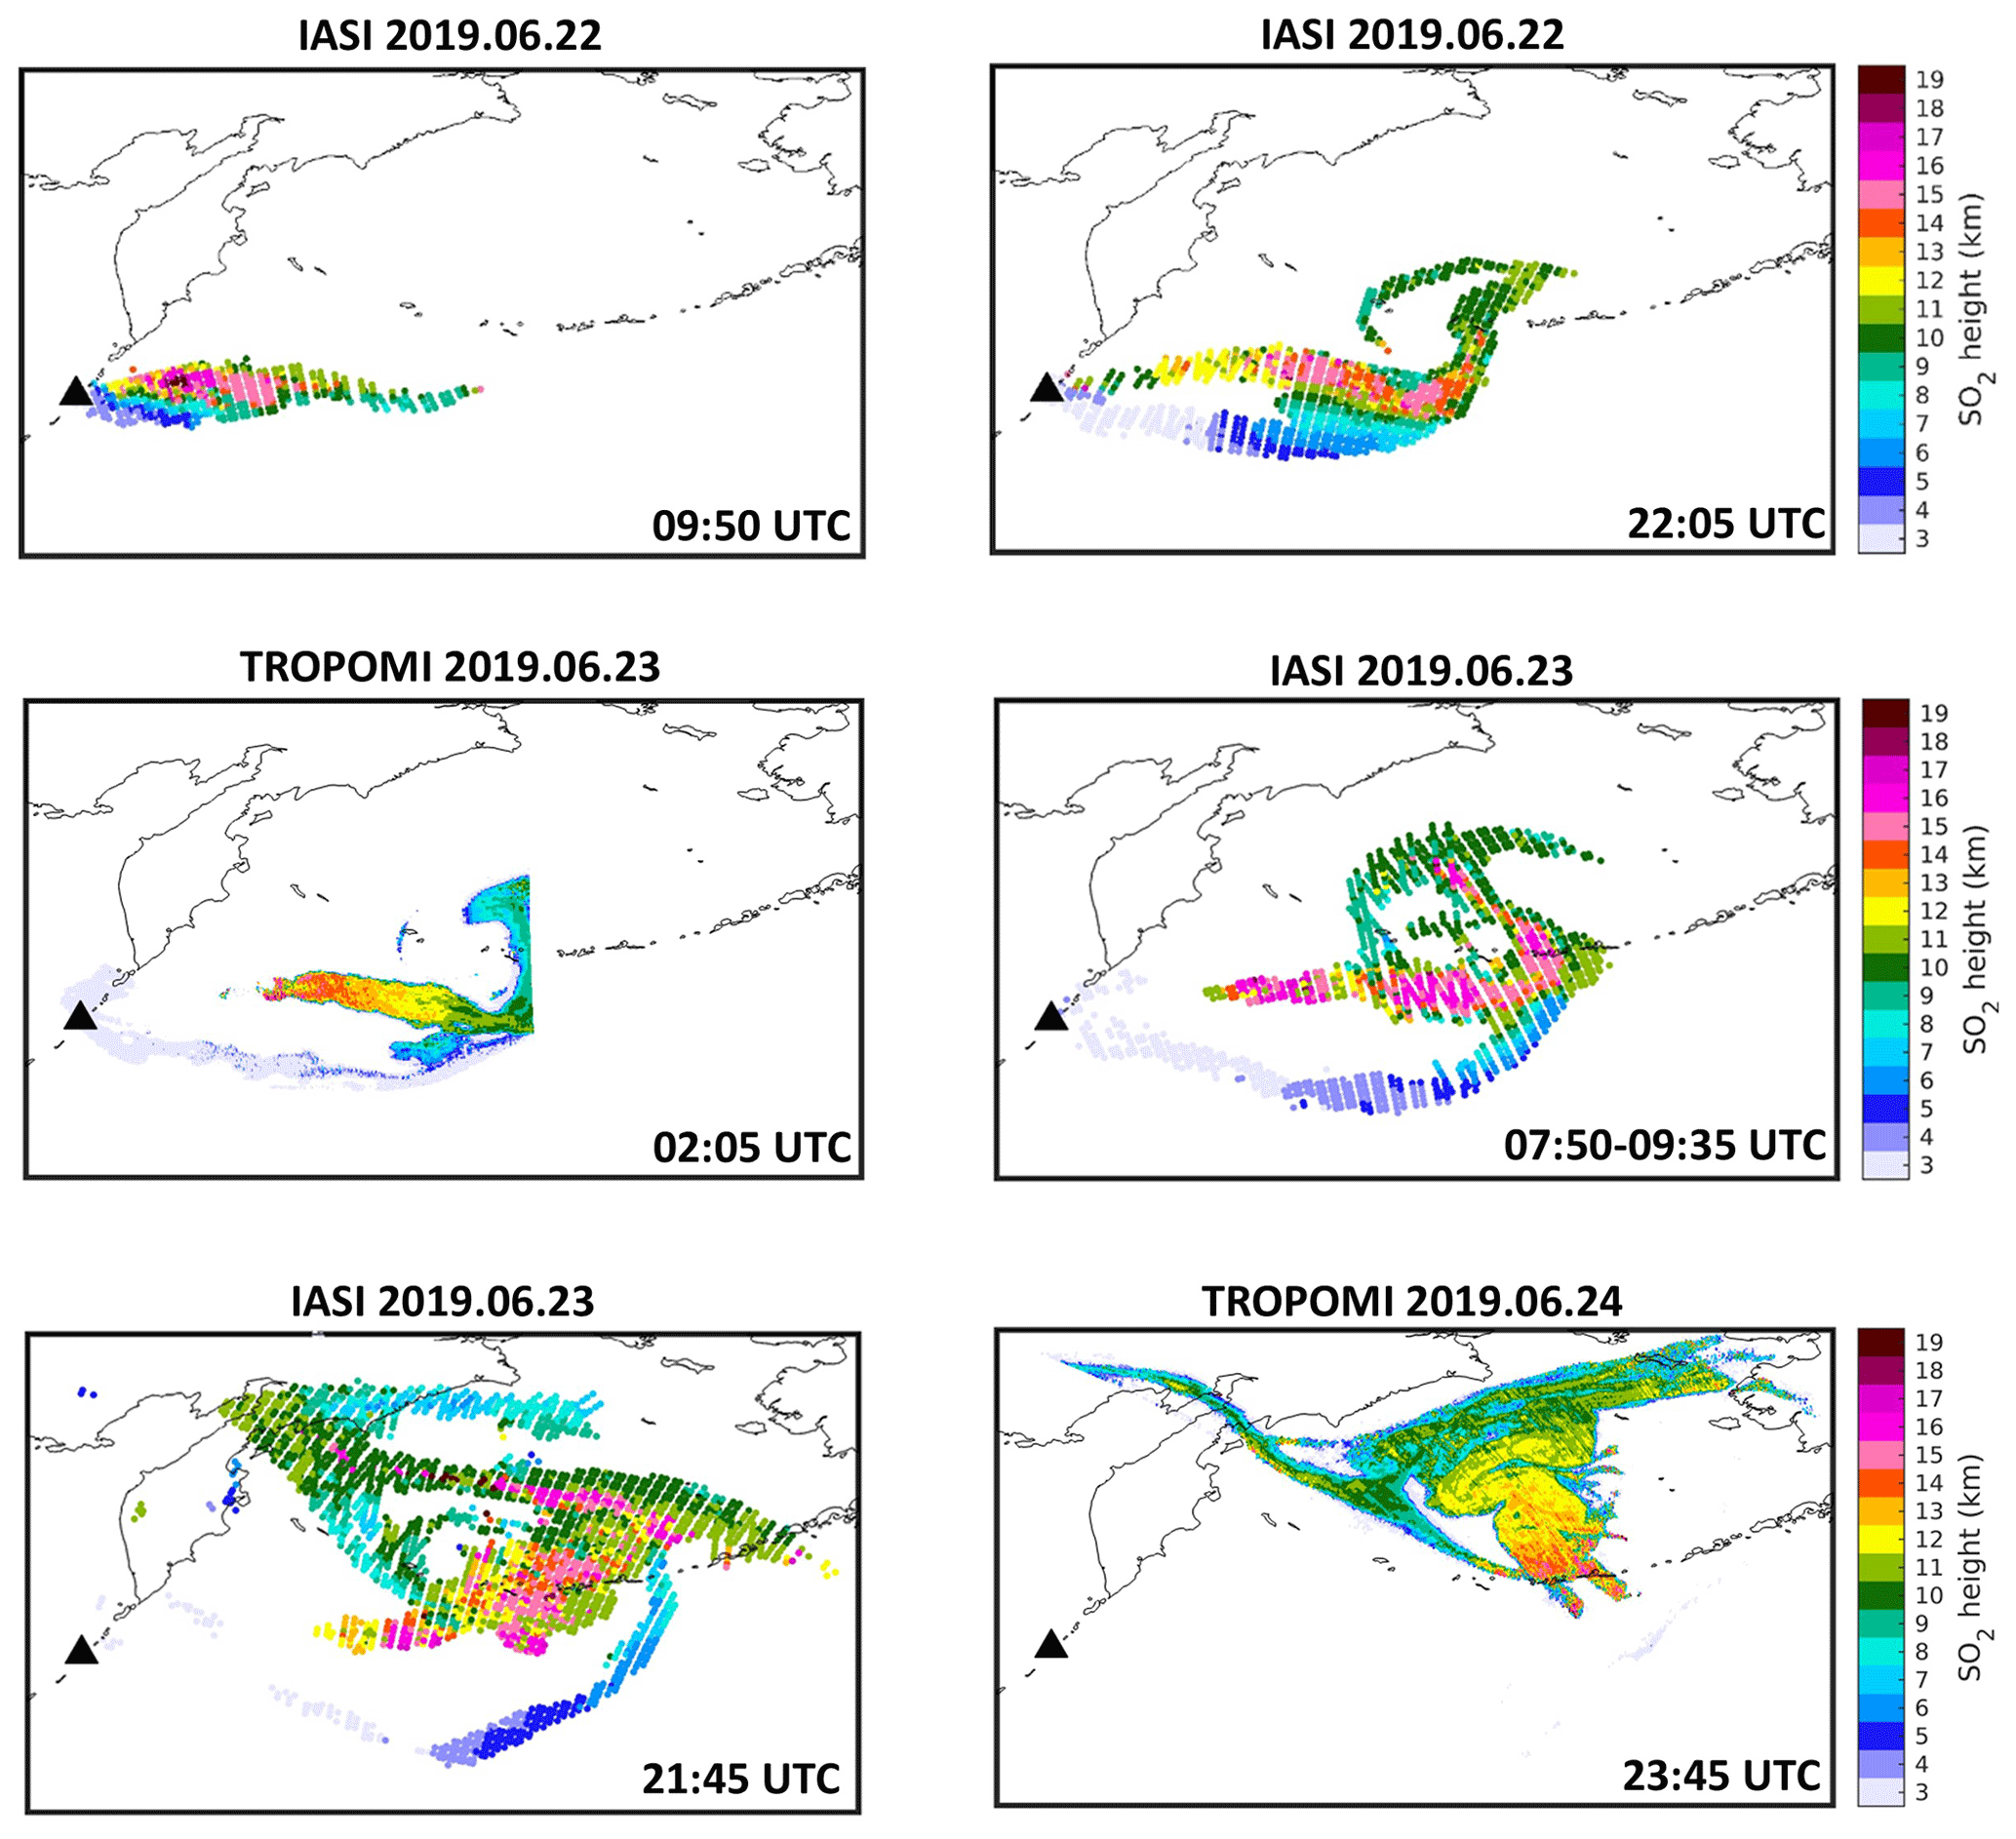
Figure 4Examples of SO2 height retrievals from IASI (refined analysis) and TROPOMI for the Raikoke eruption for 22–24 June 2019. The Raikoke volcano is marked by a black triangle. Approximate overpass times are indicated in each panel.
As an alternative to IASI, ultraviolet observations from the TROPOMI nadir sensor have been used to estimate the SO2 injection profile (Table 2). Conceptually, the retrieval algorithm is like the IASI scheme. It relies on an iterative approach making use of an SO2 optical depth look-up table, where both SO2 height and vertical column are retrieved jointly (Theys et al., 2021). The accuracy of the retrieved SO2 height is of 1–2 km, except when coincident with fresh and optically thick ash plumes for which the estimated height can be strongly biased low. Because of this, the first reliable profile from TROPOMI which covers the full plume is for 24 June 2019. The maximum SO2 height is found at ∼ 11–12 km (Fig. 3) and the total SO2 mass derived is ∼ 1.2 Tg. However, the total mass is likely underestimated because only the pixels with reliable SO2 height retrievals are considered (typically for SO2 columns > 5 DU). Selected examples of retrieved SO2 heights from the two instruments are illustrated in Fig. 4.
Although the estimated SO2 mass from IASI and TROPOMI agree well, the estimated SO2 profiles show rather inconsistent results with a discrepancy of about 3 km for the SO2 center of mass. It should be emphasized that SO2 height retrieval from nadir sensors is challenging in general but for Raikoke in particular. The retrievals and their interpretation might also suffer from different aspects. For instance, the UTLS was characterized by isothermal temperature profiles, which can lead to errors in the IASI height estimates. In addition, the measurement sensitivity is different in the ultraviolet (TROPOMI) than in the thermal infrared (IASI) and depends on the way the photons interact with the volcanic cloud (and the constituents other than SO2). In this respect, the retrieved SO2 height must be considered as effective heights. Moreover, few CALIOP observations were available (see Sect. 6) for evaluating the results for the early stage of the eruption.
Despite these challenges, our injection profile estimates are not in contradiction with results found in the literature:
-
Kloss et al. (2021) reported a 14 km altitude plume height, based on an early OMPS (Ozone Mapping Profiler Suite) aerosol extinction profile, on 22 June 2019.
-
Muser et al. (2020) derived typical altitudes of 8–14 km from MODIS and the Visible Infrared Imaging Radiometer Suite (VIIRS) cloud-top height retrievals.
-
By slightly adapting (assuming higher injection heights) the VolRes profile, de Leeuw et al. (2021) found the best match between modeled and TROPOMI SO2 columns for an injection profile with most of the SO2 between 11 and 14 km.
-
Hedelt et al. (2019) reported SO2 height similar to those of the TROPOMI results shown here, i.e., with the bulk height below 13 km.
-
SO2 height retrievals from the Cross-track Infrared Sounder (CrIS) instrument (Hyman and Pavolonis, 2020) are consistent with plume height as high as 14–17 km in the plume center, but they also show that most of the SO2 mass was emitted under 13 km.
-
Geometric estimation of Raikoke ash column height suggests injection mainly between 5 and 14 km, as well as an overshooting cloud up to 17 km (Horváth et al., 2021b).
-
Microwave Limb Sounder data for 23–27 June indicate SO2 plumes at 11–18 km with maximum columns observed around 14 km (Gorkavyi et al., 2021).
-
Using a Lagrangian transport model combined with TROPOMI and AIRS, Cai et al. (2022) reconstructed an emission profile with a peak at 11 km with a large spread from 6 to 14 km.
-
Prata et al. (2022) found ash clouds at a maximum height of 14.2 km (median height of 10.7 ± 1.2 km) during the main explosive phase.
CALIPSO observations were made publicly available within 24–48 h after the beginning of the eruption, allowing accurate early estimates of the height of downwind plume sections. However, due to the narrow swath (a few hundred meters) of the lidar and consequently low spatial coverage, they may not completely represent the entire plume vertical distribution. Nevertheless, an overpass of the CALIPSO lidar across the plume on 22 June 2019 at 02:15 LT, ∼ 600 km east of the volcano within an SO2 cloud observed by OMPS, shows volcanic layers between 9 and 13.5 km (Prata et al., 2021). A second overpass the next day depicts another volcanic layer between 15 and 16 km. Those observations were used to validate SO2 emission profiles provided to the community 1 week after the eruption. Here, we give a more comprehensive analysis of the plume injection height using a combination of quasi-collocated (less than 1 h apart) SO2 observations from AIRS and detected volcanic layers from CALIOP during the first 2 weeks after the eruption. The brightness temperature difference (1361.44–1433.06 cm−1) is used as a proxy of SO2 released from volcanoes to identify CALIOP data within the SO2 plume.
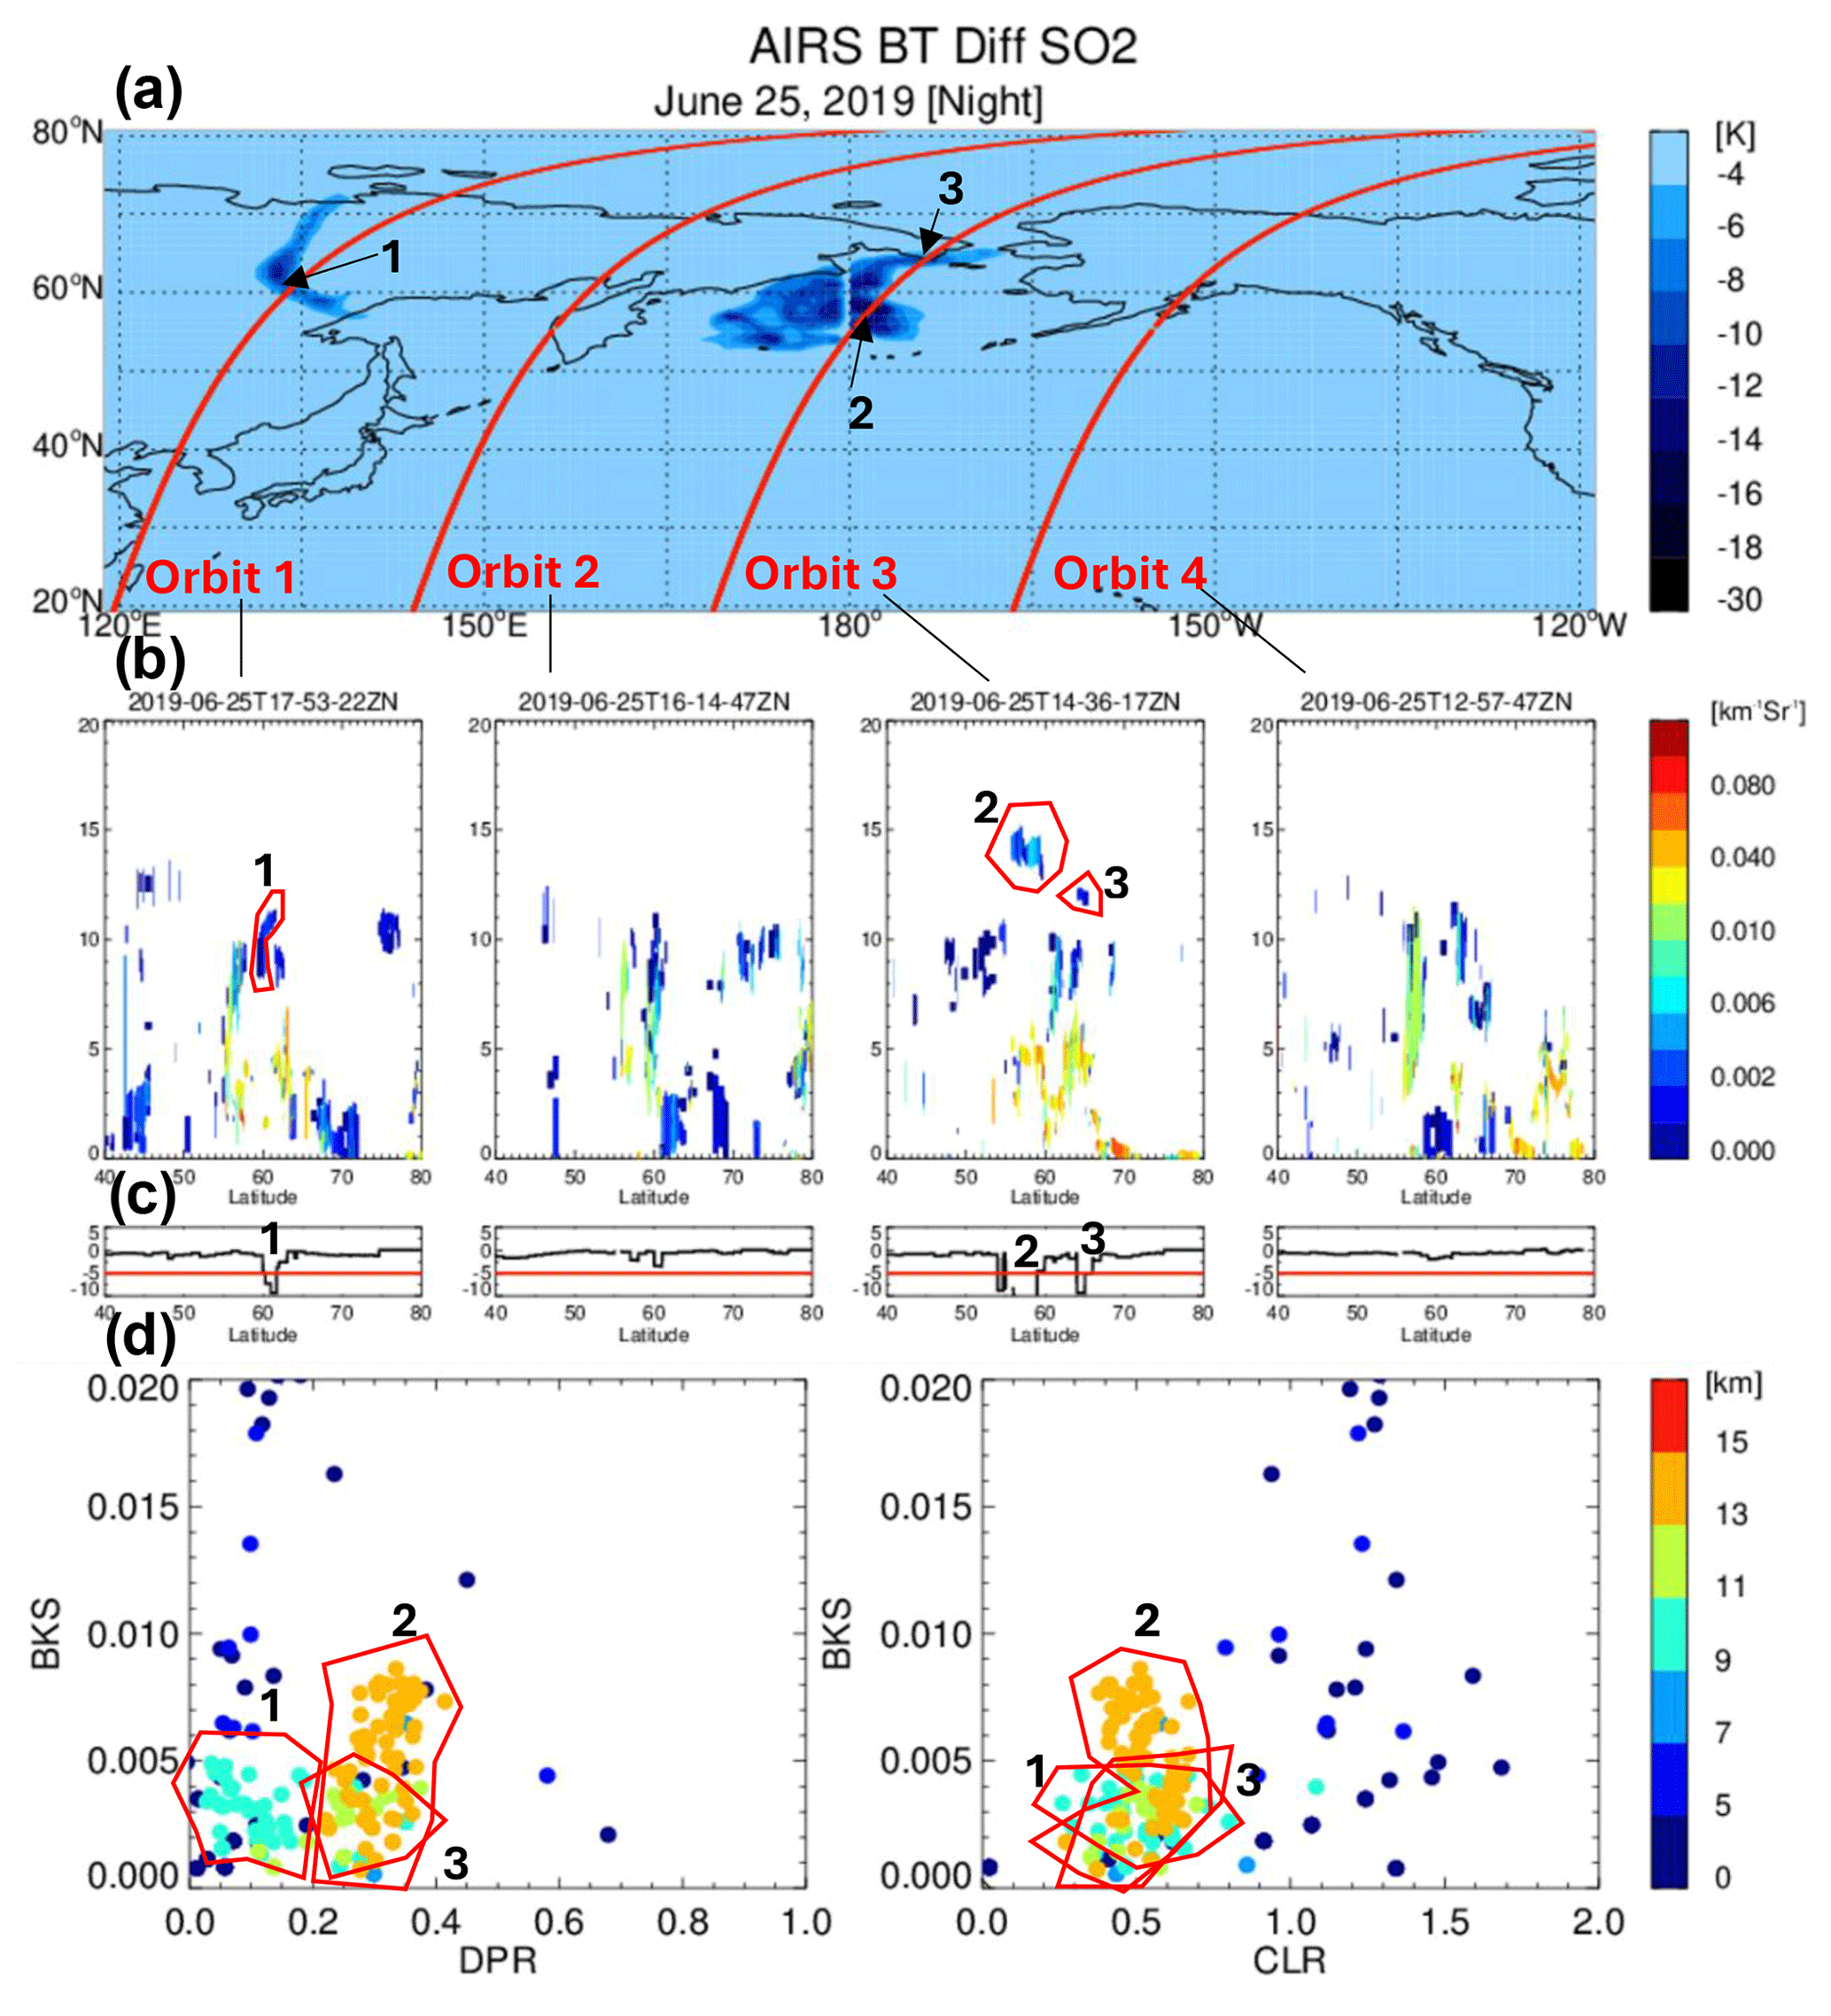
Figure 5Panel (a) shows the AIRS nighttime brightness temperature difference (BTD) (1361.44–1433.06 cm−1) on 25 June 2022 together with four CALIOP ground tracks (red). Panel (b) shows the corresponding aerosol and cloud layer products from the CALIOP level-2 v4.2 product and (c) shows AIRS BTD extracted along the CALIOP orbit tracks. The red line corresponds to the threshold used for detecting volcanic enhancement as displayed in (d) by the three areas outlined in red, which are diagrams of particular backscatter (BKS) as a function of the mean layer particulate depolarization ratio (DPR) (left) and the particulate color ratio (CLR) (right) derived from CALIOP and colored by mid-layer altitudes. Note that in all panels the numerals correspond to the CALIOP intersections.
We combined SO2 information from AIRS quasi-collocated observations from CALIOP to further investigate plume injection height after the Raikoke eruption, assuming that SO2 and volcanic aerosols remained collocated in space and time during the first 10 d after the eruption. Figure 5a shows a map of SO2 derived from AIRS together with CALIOP orbit tracks (red). The corresponding CALIOP level-2 v4.2 cloud and aerosol products are plotted along with BTD extracted along the orbit (Fig. 5b). All corresponding layers (clouds and aerosols) associated with negative BTD (BTD < 6 K; red line in Fig. 5c), indicating the presence of SO2 in the atmospheric column, have been further analyzed to distinguish the volcanic plume. The distinction is based on the diagram of depolarization and color ratio shown in Fig. 5d. Figure 5a shows that CALIOP intersected the plume along two orbit tracks on 25 June. The first intersection was along the 17:53 UTC orbit near 60° N and, on two occasions, between 55 and 65° N along the third orbit (from the left) near 14:36 UTC. The first intersection (numbered “1”) shows the plume near 9–11 km with a weak particulate depolarization ratio (DPR; < 0.2) and a particulate color ratio (CLR) near 0.5. The DPR values suggest a mixture of ash and sulfate aerosols. However, the second set of intersections (numbered “2” and “3”) of the plume show higher DPR near 0.3 and the same CLR as the first intersection, indicating a higher fraction of ash particles resulting in increased DPR values. During those observations, two distinct plumes are visible: the northern intersection near 11–13 km (green in Fig. 5b and d) and a piece at higher altitude (13–15 km) further south (< 60° N).
We visually inspected all CALIOP observations (day and night) between 22 June and 6 July following the same approach and used plume identification criteria when DPR < 0.4 and CLR < 0.7 and altitude > 5 km to remove tropospheric aerosols and ice clouds. Because of the enhanced noise of the daytime observations, we chose to focus this analysis on nighttime data only. Figure 6 shows the daily observations of the Raikoke plume since the eruption and during the subsequent 2 weeks. We note that the plume was observed by CALIOP from 8 to 17 km. The cumulative probability density function (PDF) suggests two main peaks: one near 10–11 km and another smoother peak near 13–15 km. The overall aerosol vertical distribution is consistent with the distribution of SO2 profiles derived with different approaches and instruments just after the eruption (Fig. 3). However, the PDF does not suggest a pronounced peak at a given altitude but rather a flatter distribution as opposed to what is shown in Fig. 3. The PDF does not account for, or is not weighted by, the aerosol loading, which may explain why we do not see a pronounced peak as for the SO2 profiles derived from IASI and TROPOMI. In addition, SO2 and volcanic aerosol layers are assumed to be collocated, but it may not always be the case.
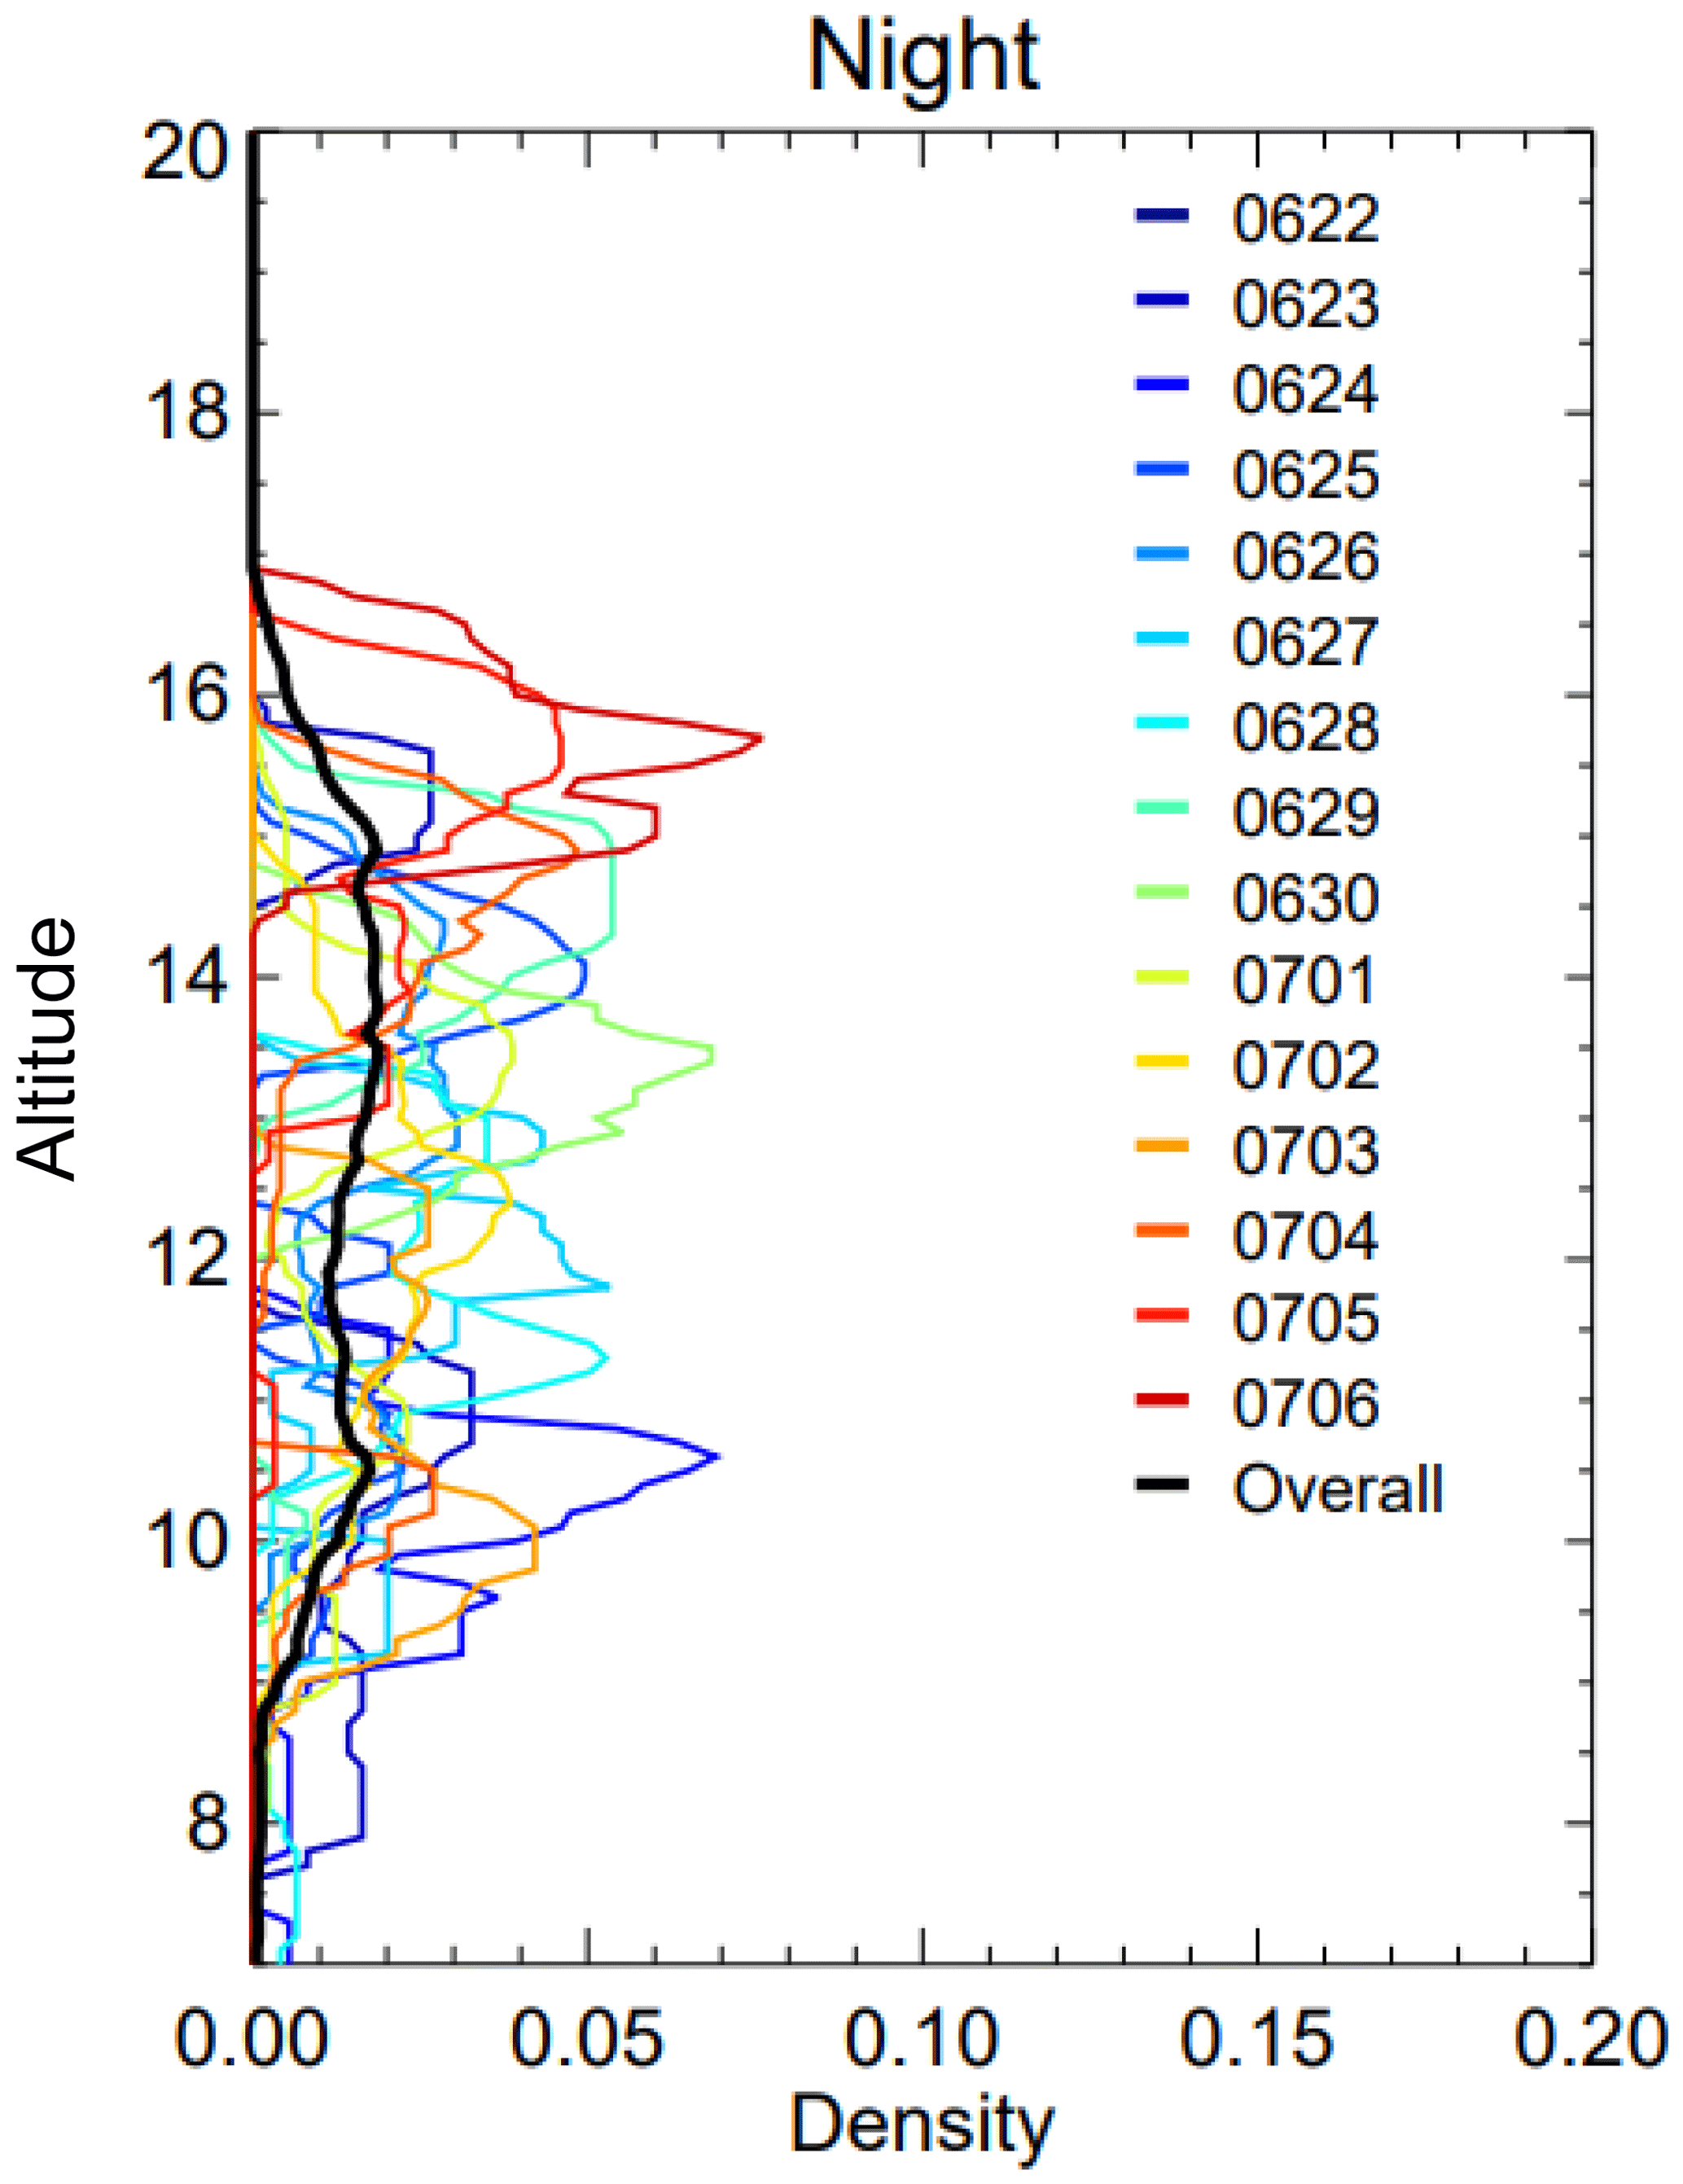
Figure 6Daily nighttime probability density function (PDF) profiles of the mid-layer geometric altitude for volcanic layers observed by CALIOP and AIRS using plume identification criteria when DPR < 0.4 and CLR < 0.7 and altitude > 5 km and BTD < −6 K between 22 June and 6 July. The black line is the overall PDF profile using all nighttime data between 22 June and 6 July.
In the previous sections, we discussed in detail the methods used to derive injection parameters (total SO2 mass, plume height, and SO2 distribution) which will serve as inputs to estimate the radiative and surface temperature responses from the eruption in this section. Key metrics characterizing the climate effects of volcanic eruptions are the peak global mean mid-visible SAOD, the global mean net radiative forcing, and the global mean surface temperature change. One motivation of the VolRes initiative is to provide an estimated magnitude for each of these metrics. In the case of a large-magnitude eruption, these initial indicators of the scale of the climate response would then help to determine whether resources should be directed towards additional measurement campaigns. In addition, the forcing datasets enable the community to run seasonal and decadal forecasts.
The first estimates of the injected SO2 mass and height became available 24–48 h after the 2019 Raikoke eruption, followed 1 week later by an estimate of global mean peak SAOD (6.1), radiative forcing (6.2), and surface temperature (6.3). This section discusses (i) how these estimates were made, (ii) how they compared with observations, and (iii) ongoing improvements to the protocol for rapid projection of volcanic forcing and climate impact.
6.1 Model simulations of aerosol optical properties
We first made projections for SAOD on 25 June 2019 using EVA_H (Aubry et al., 2020), a simple volcanic aerosol model based on inputs of the mass of volcanic SO2 injected, its injection height, and the latitude of an eruption. The first estimates made following the Raikoke eruption used a range of injection heights between 10 and 20 km, and a range of the mass of SO2 of 1–2 Tg, on the basis of first estimates of 14 km and 1.5 Tg of SO2 that initially circulated on the VolRes mailing list (Ghassan Taha and Lieven Clarisse, personal communication, 2019). The corresponding simulated range in peak Northern Hemisphere (NH; 25–90° N) monthly mean SAOD at 525 nm (SAOD525) was 0.015–0.023 (Fig. 7). This range was obtained using Monte Carlo methods, i.e., EVA_H was run thousands of times, randomly resampling the range of injection height and mass. The negligible computational cost of simple models like EVA_H is a key advantage for providing estimates of the volcanic SAOD perturbation and its uncertainties as soon as measurements of the SO2 mass and its injection height become available. The SAOD perturbation was projected to be largely confined to 25–90° N (Fig. 8). SAOD perturbations observed in the tropics and Southern Hemisphere over 2019–2020 (Fig. 8) are primarily driven by stratospheric emissions from the 2019 Ulawun eruptions and the Australian 2019–2020 wildfires (Kloss et al., 2021).
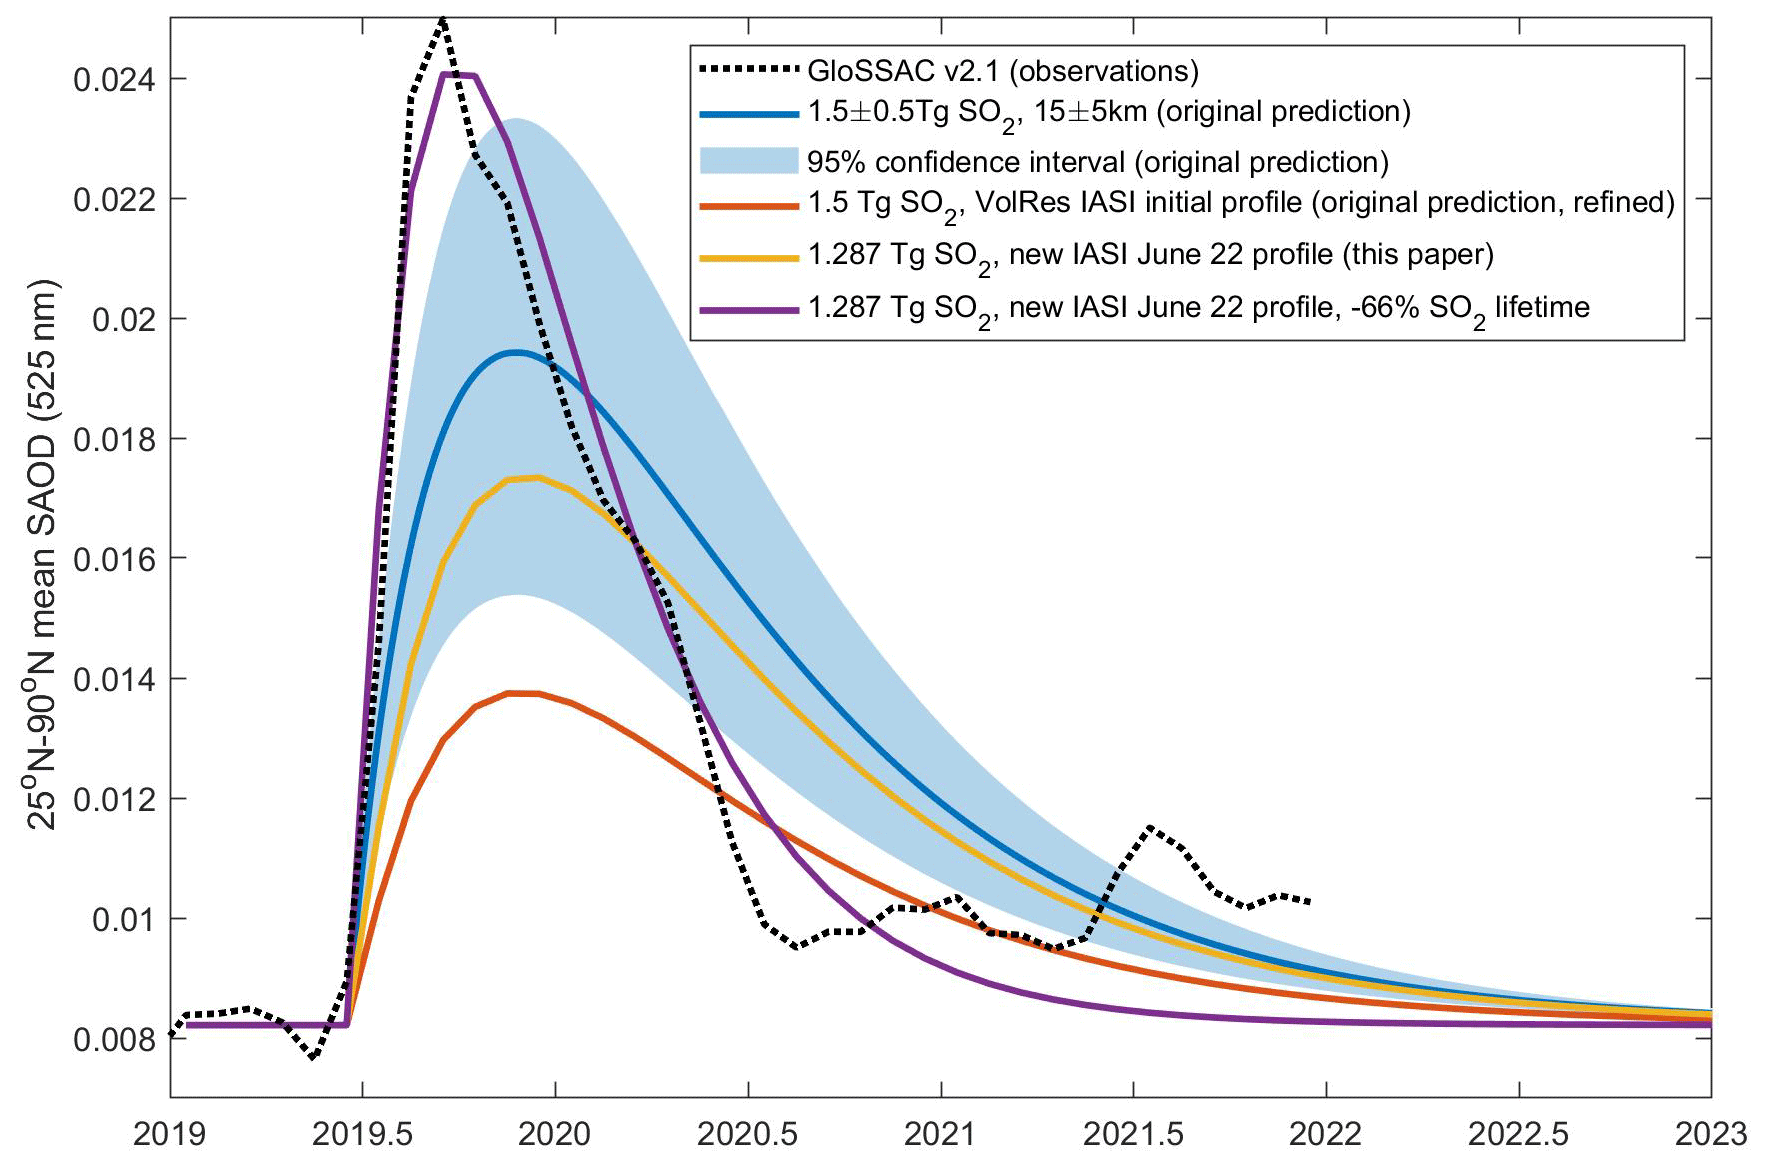
Figure 7Northern Hemisphere (25–90° N) monthly mean SAOD at 525 nm as projected by EVA_H (solid colored lines) and observed (GloSSAC v2.1, dashed black line). The light blue shading and blue line show the first projection made at the time of the eruption and its confidence interval based on an injection height of 15 ± 5 km and SO2 mass of 1.5 ± 0.5 Tg. The orange line shows the second projection made at the time of the eruption using the VolRes IASI initial profile. The yellow line shows a new projection using the new VolRes IASI 22 June profile presented in this study (Fig. 3). The violet line uses the same profile, but the SO2-to-aerosol conversion timescale in EVA_H was reduced by 66 %.
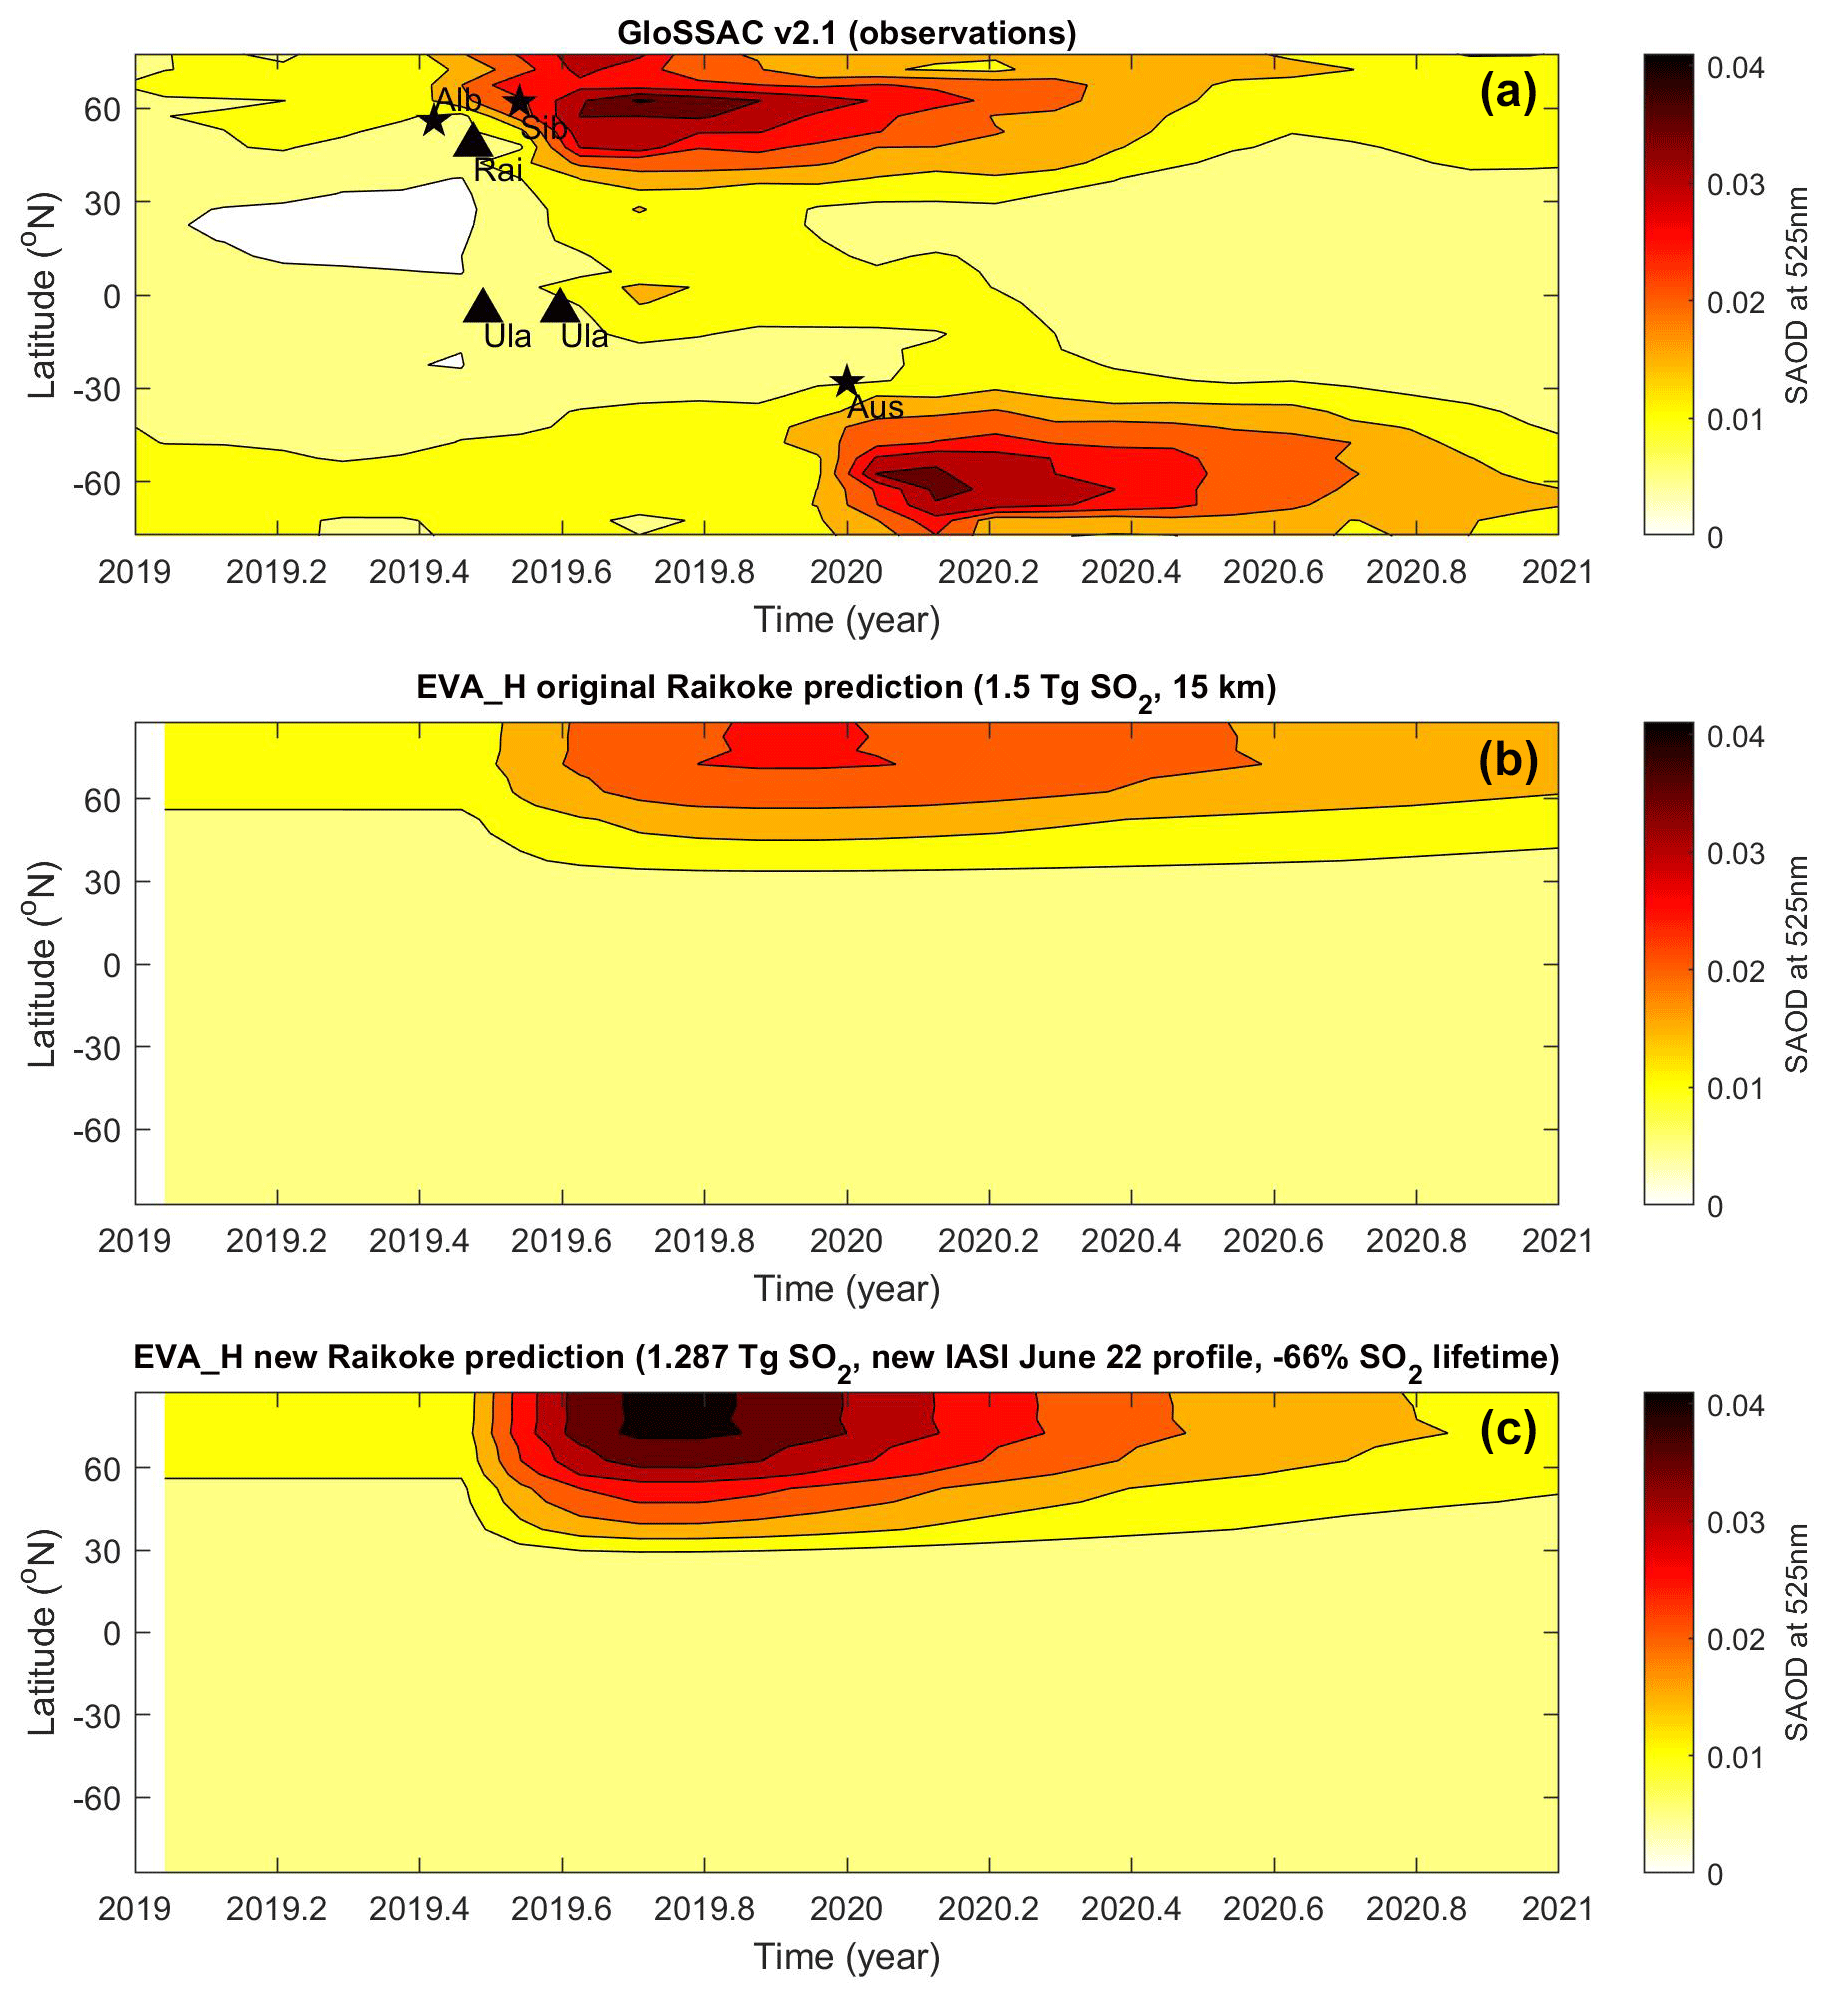
Figure 8SAOD at 525 nm as observed (GloSSAC v2.1) (a) and projected by EVA_H following the 2019 Raikoke eruption (b), as well as using the revised IASI 22 June SO2 profile presented in this paper along with the adjusted (−66 %) SO2-to-aerosol conversion timescale in EVA_H (c). EVA_H was run only with the Raikoke injections, and not with injections associated with the 2019 Ulawun eruptions (denoted by black triangles in a) nor with wildfire events in Alberta (Canada, 2019), Siberia (2019), and Australia (2020) (denoted by black stars in a).
Following the communication of the initial VolRes SO2 profile (Fig. 3) through the VolRes mailing list, EVA_H peak NH monthly mean SAOD525 estimates for Raikoke were revised to an even smaller value of 0.014. Compared with observations from GloSSAC (v2.1) (Kovilakam et al., 2020), this value was largely underestimated as GloSSAC NH monthly mean SAOD525 peaks at 0.025 (Fig. 7, with GloSSAC in excellent agreement with observational values from Kloss et al., 2021) using OMPS-limb data. The new IASI 22 June profile presented in Fig. 3 results in a higher peak NH monthly mean SAOD525 of 0.0175, with the higher proportion of stratospheric SO2 in the new profile more than compensating for the total mass decreasing from 1.5 to 1.29 Tg (average of the two IASI profiles) of SO2. Although the new SO2 emission profile improves agreement with observations, the estimated SAOD525 value is still a substantial underestimate. Furthermore, the characteristic rise and decay timescales of the SAOD525 perturbation are also overestimated by EVA_H (Fig. 7). These mismatches are caused by the constant timescale EVA_H uses for SO2-to-sulfate-aerosol conversion, which is biased towards an 8-month value adequate for the Mt. Pinatubo 1991 eruption (Aubry et al., 2020). If we decrease the value of this timescale by 66 % to 2.8 months in EVA_H, the NH peak SAOD value as well as the characteristic rise and decay timescale of the SAOD perturbation are in excellent agreement with observations for the 2019 Raikoke eruption (Fig. 7). The fact that this model timescale is independent of the eruption characteristics is an already identified weakness of EVA_H that will be addressed in future research (Aubry et al., 2020). This timescale has indeed been shown to depend on the volcanic SO2 mass (e.g., McKeen et al., 1984; Carn et al., 2016), injection altitude and latitude (e.g., Carn et al., 2016; Marshall et al., 2019), as well as co-emission of water vapor (LeGrande et al., 2016) and volcanic ash (Zhu et al., 2020).
6.2 Projection for global mean volcanic forcing
On the same day that SAOD projections were initially provided, Piers Forster independently suggested via the VolRes mailing list (Piers Forster, personal communication, 2019) that the global annual mean net radiative forcing would be at most −0.2 W m−2 (Fig. 9, left) based on a scaling between the estimated SO2 mass of 1.5 Tg for the 2019 Raikoke eruption and the estimated SO2 mass of 15–20 Tg for the 1991 Mt. Pinatubo eruption, which resulted in a global annual mean forcing of −3.2 W m−2 in 1992. This projection was a back-of-the-envelope calculation using simple proportionality arguments and it did not rely on any SAOD estimates. A monthly global mean peak shortwave forcing with a range from −0.16 to −0.11 W m−2 was derived from SAGE III observations (Kloss et al., 2021). The corresponding annual mean net forcing is expected to be much smaller because of the difference between the peak monthly NH mean SAOD and its average value over the first post-eruption year (Fig. 7), as well as the fact that longwave stratospheric volcanic aerosol forcing can offset as much as half of the shortwave forcing (Schmidt et al., 2018). Altogether, the educated guess made for global annual mean radiative forcing was thus likely overestimated.
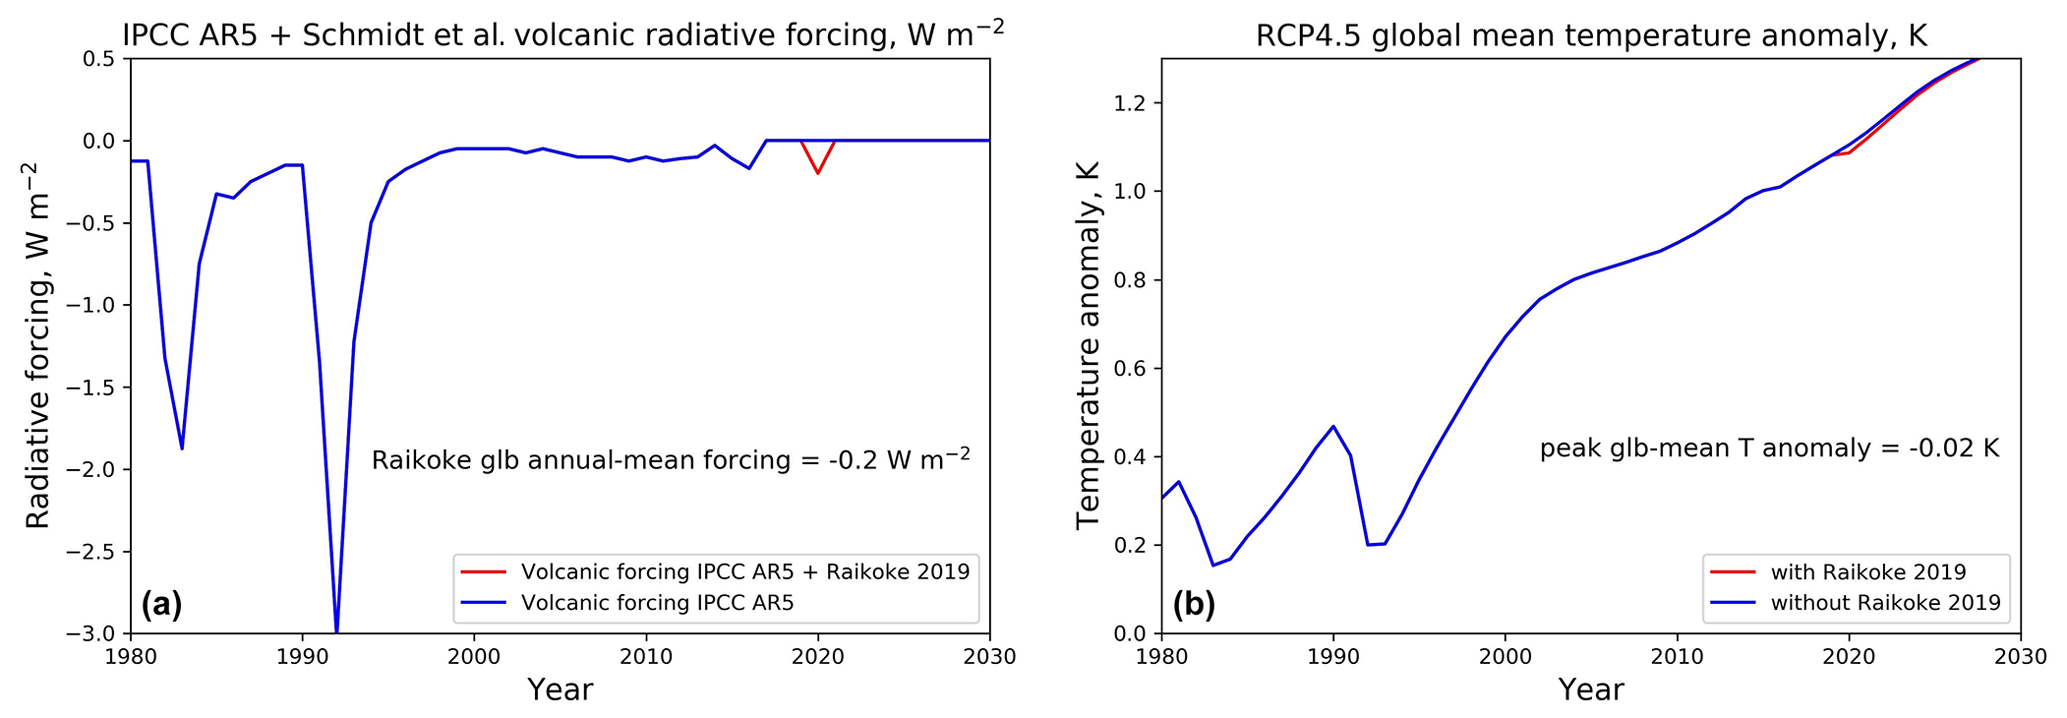
Figure 9Annual global mean volcanic radiative forcing (a) and corresponding annual global mean surface temperature anomaly calculated using the climate response model FaIR (Smith et al., 2018) (b). Blue and red lines show results with and without accounting for the 2019 Raikoke eruption, respectively. This is the original figure shared via the VolRes mailing list on 26 June 2019.
6.3 Projection of the global mean surface temperature response
As the final step, as part of the eruption response, 1 d after the first global annual mean radiative forcing estimate of 0.2 W m−2 was made using proportionality arguments and Mt. Pinatubo measurements (Sect. 6.2; Fig. 9, left), we estimated that the peak global annual mean surface temperature change would be −0.02 K (Fig. 9, right). We obtained this estimate using FaIR, a simple climate model (Smith et al., 2018). Like EVA_H, FaIR has a negligible computational cost enabling rapid estimates of global mean surface temperature change following an eruption and facilitating uncertainty estimation, although the latter was not done for the 2019 Raikoke eruption. The model-projected surface temperature response cannot be compared with measurements owing to difficulties in disentangling such a small forced temperature response from temperature variations related to natural variability.
The Raikoke eruption ended a period without moderate volcanic eruptions in the Northern Hemisphere since Nabro in 2011 (Bourassa et al., 2012; Fairlie et al., 2014; Sawamura et al., 2012) which injected 1.5–2 Tg of SO2 partially distributed between the troposphere and stratosphere. Following the Nabro eruption, the role of deep convection during the summer Asian monsoon was evoked to explain an apparent ascent of the plume (Bourassa et al., 2012) debated by others (Fromm et al., 2013; Vernier et al., 2013) based on initial observations of injection heights. The substantial debate provoked by this eruption clearly demonstrated the complexity of assessing accurately SO2 injection heights and their partition relative to the tropopause. The VolRes initiative substantially helps fill those gaps by providing a coordinated structure to derive injection parameters after the Raikoke eruption. Multiple sensors were used to assess the total SO2 mass and its distribution just 1 week after the eruption (Fig. 3). However, the lack of vertically resolved SO2 information remains a limitation in accurately assessing SO2 plume distribution and the revised estimates proposed here remain with a 2 km uncertainty regarding the exact position of the plume peak, while the initial 1.5 Tg SO2 mass estimate might be slightly overestimated. Advances in measuring SO2 with lidar observations may fill those gaps in the future.
The VolRes team provided eruptive parameters within a week after the eruption that strongly helped modelers to estimate climate response of the Raikoke eruption. The use of simple models, such as EVA_H and FaIR, to project the climate response to an eruption in almost near real time is a powerful way to generate first-order estimates of the perturbations to SAOD and estimates of surface temperatures. Unlike simple proportionality arguments based on the Mt. Pinatubo 1991 eruption, these models can estimate the time (and spatial, for EVA_H) evolution of the response variable, and they account for complexities such as the dependency of SAOD on the SO2 injection latitude and height. Their computationally inexpensive nature also enables a comprehensive quantification of uncertainties related to eruption source parameters, which are often poorly constrained in the days to months following an eruption as highlighted by this special issue, as well as uncertainties in parameters of these empirical models, such as the SO2-to-aerosol conversion timescale in EVA_H (Fig. 7).
One limitation of the application of these models following the Raikoke 2019 event is that they were not applied in concordance, i.e., FaIR was run using an expert guess for the radiative forcing instead of values derived from EVA_H's SAOD estimates (see Sect. 6.2 and 6.3). Following the Raikoke 2019 VolRes response, we combined the simple models EVA_H (for aerosol forcing) and FaIR (for surface temperature response). To do so, we applied simple linear (Schmidt et al., 2018) or exponential (Marshall et al., 2020) relationships to derive the global mean radiative forcing (FaIR's key input) from the global mean SAOD (one of EVA_H's outputs). EVA_H, SAOD radiative forcing scalings, and FaIR were, for example, applied in concordance to estimate the climate impacts from the sulfate aerosols of the January 2022 Hunga Tonga–Hunga Ha'apai (HTHH) eruption. These models have been combined into a single dedicated web tool called Volc2Clim (Schmidt et al., 2023), publicly available at https://volc2clim.bgs.ac.uk/ (last access: 23 March 2023). Applied to Raikoke 2019 using the new injection profile (Fig. 3) and revised SO2-to-sulfate-aerosol conversion timescale, the beta version of Volc2Clim projected a peak global mean of 0.008, −0.17 W m−2, and −0.028 K for monthly mean SAOD, monthly mean radiative forcing and annual mean temperature anomaly. In addition to key metrics, such as global mean SAOD, radiative forcing, and surface temperature, discussed in this section, aerosol optical property fields (dependent on latitude, altitude, and wavelength) are output by Volc2Clim for use in climate models that do not have an interactive stratospheric aerosol scheme. With a web tool for rapid estimation of the global climate response during an eruptive crisis, we hope to support communication among the scientific community (including VolRes), with authorities and the public, which in turn will help to mitigate potential consequences arising from the climate effects of an eruption.
Although Volc2Clim offers new perspectives for rapid response and communication following volcanic eruptions, the simplified nature of the models at their cores means that their results should be considered carefully. As an example, EVA_H currently directly scales the global mean aerosol effective radius from the total mass of aerosol (Aubry et al., 2020). Even for the 1991 Mt. Pinatubo eruption, the aerosol effective radius time evolution lagged behind that of the total mass (e.g., Toohey et al., 2016). Furthermore, Wrana et al. (2023) show that some eruptions injecting less than 1 Tg SO2 into the stratosphere lead to a reduction in aerosol size, a response opposite to that predicted by EVA_H and thus Volc2Clim. Beyond volcanic sulfate aerosol, Volc2Clim currently does not allow us to make climate projections related to co-emission of species such as water vapor or halogen in volcanic plumes, or PyroCumulonimbus (PyroCbs) plumes. Before and after the Raikoke eruption, three significant events affected stratospheric aerosols. Indeed, SO2 injected from the June and August 2019 Ulawun eruptions, as well as smoke from PyroCbs in Canada, made the Raikoke eruption even more challenging to understand. The PyroCbs in Canada produced smoke in the UTLS 1 week before the eruption, but the transport patterns of smoke and volcanic aerosols have been distinct (Osborne et al., 2022), and the likelihood for both plumes to mix is relatively small. The Ulawun eruption injected SO2 which remained relatively confined in the Southern Hemisphere, but we cannot rule out that both plumes got mixed in the tropics (Kloss et al., 2021). The relatively small amount (< 0.1 Tg) of SO2 injected by Ulawun was not considered in the estimates provided in this paper. Another interesting feature observed after the Raikoke eruption was the formation of a distinct plume which rose into the stratosphere. The plume formed a vortex circulation which remained coherent for several weeks (Gorkavyi et al., 2021), rising 10 km into the stratosphere over the course of 2–3 months. While this plume shared similar optical properties to smoke, Knepp et al. (2022) concluded that this layer was mostly composed of large sulfuric acid droplets but did not refute the possible presence of a fine ash component. More recently, Khaykin et al. (2022) found that 24 % of the total SO2 mass was contained in the volcanic vortex with a confined anticyclonic circulation detected by wind Doppler lidar from Aeolus. A warm anomaly of 1 K was also evident on Global Positioning System Radio Occultation (GPS-RO) data demonstrating that the heating of the plume was indeed responsible for its internal circulation and maintenance. Moreover, the properties of the plume observed by CALIOP showed the persistence of ash that likely induced internal heating in the plume, consistent with earlier observations of volcanic clouds after the Kelud and Puyehue–Cordon eruptions (Jensen et al., 2018; Vernier et al., 2013, 2016). While the presence of fine ash in the Raikoke event could likely explain the maintenance of the vortex as observed after PyroCbs events, but with a much faster ascent rate, the interplay between ash and sulfate, as well as the influence on radiative calculations, is still not understood (Vernier et al., 2016; Stenchikov et al., 2021; Zhu et al., 2020). In addition, we cannot fully rule out that remnants of smoke from the PyroCbs in Canada 1 week before the eruption could have played a role in the transport of the plume. The increased lifetime of this plume may have produced a larger climate impact than expected, since this effect is not included in the simple model provided in this paper (Fig. 8). Besides, we cannot rule out that the plume's lesser lifetime maybe have been affected and influenced by wildfires from Siberia during summer 2019 as suggested by Ohneiser et al. (2021).
Finally, the recent eruption of HTHH demonstrated that sub-marine eruptions can inject significant amounts of H2O into the stratosphere (Millán et al., 2022; Vömel et al., 2022; Sellitto et al., 2022) which is known to have more significant oppositive cooling climate effects than sulfate aerosol. Water vapor can reduce the lifetime of SO2 by providing OH radicals and affect aerosol size distribution through condensational growth (Zhu et al., 2022). Such effects are not included in the simple climate estimates provided here and would limit their applicability in the case of HTHH if the climate impacts only of sulfate aerosols are considered.
VolRes is an international, coordinated initiative to study the atmospheric impacts of volcanic eruptions that now involves more than 250 researchers worldwide. The 2019 Raikoke eruption triggered significant responses by the VolRes community through exchanges of information via the mailing list and the preparation of SO2 profile recommendations for modelers made available only one week after the eruption. Our paper gives a brief overview of how the community responded to this volcanic eruption, which is documented extensively in the Raikoke special issue. We then describe how early estimates of SO2 emission and height, fundamental parameters which dictate the plume's lifetime and its impacts, were derived from satellite observations. These estimates were used by VolRes to calculate the SAOD, radiative forcings, and surface temperature changes as part of the initial eruption response. We revisited the initial SO2 injection profiles by addressing saturation effects due to high SO2 column density to improve plume injection height. We highlight the remaining challenges in accurately representing the vertical distribution for moderate SO2 explosive eruptions in the lowermost stratosphere due to the limited vertical sensitivity of the current satellite sensors (±2 km accuracy) and the low horizontal resolution of lidar observations. We found that using revisited SO2 injection height and reduced SO2-to-aerosol conversion timescales in a simple volcanic aerosol model (EVA_H) improves SAOD estimates relative to available observations from the GloSSAC dataset. The protocol for fast estimation of aerosol optical properties, radiative forcing, and surface temperature response to volcanic eruption has since been implemented in a seamless web tool (Volc2Clim; https://volc2clim.bgs.ac.uk/; last access: 23 March 2024). The computationally inexpensive nature of the web tool makes it ideal for rapid assessment of the volcanic climate effect and for propagating large uncertainties that characterize early observations of volcanic clouds. Further development of the underlying simple models and continued use of complex models explicitly modeling aerosol chemistry, microphysics, and transport remain critical given the complex nature of volcanic events. For example, the Raikoke eruption took place in connection with two eruptions of Ulawun in June and August 2019, and just after a PyroCbs event which transported smoke into the stratosphere. These other events were not considered in our original or revised calculations. In addition, the recent HTHH eruption demonstrated that water vapor can also be injected into the stratosphere which can affect SO2 and aerosol lifetime but also with a radiative forcing that is opposite to that of volcanic sulfate aerosols.
The GloSSAC data were obtained from the NASA Langley Research Center Atmospheric Data Center at https://doi.org/10.5067/GLOSSAC-L3-V2.0 (NASA/LARC/SD/ASDC, 2018). The Volc2Clim web tool is available at https://volc2clim.bgs.ac.uk/ (Schmidt et al., 2023b) and the source code is available on Zenodo at https://doi.org/10.5281/zenodo.7602062 (Schmidt et al., 2023a). The source code of the EVA_H volcanic aerosol model is available on GitHub at https://github.com/thomasaubry/EVA_H (Aubry et al., 2020). The source code of the FaIR climate model is available on GitHub at https://github.com/OMS-NetZero/FAIR (Smith et al., 2018). Data used to prepare the figures of this paper can be found at https://doi.org/10.6084/m9.figshare.25136972 (Vernier, 2024).
JPV led the preparation of the paper and participated in the analysis of the CALIPSO data. TJA and AS led the climate model section and provided results from Vol2Clim. SCL and RR and JAS developed part of the Vol2Clim tool. CT and GM helped frame the paper. LC, FP, NT, ATP, and SC analyzed satellite SO2 data. HC analyzed CALIPSO data.
The contact author has declared that none of the authors has any competing interests.
Publisher's note: Copernicus Publications remains neutral with regard to jurisdictional claims made in the text, published maps, institutional affiliations, or any other geographical representation in this paper. While Copernicus Publications makes every effort to include appropriate place names, the final responsibility lies with the authors.
Jean-Paul Vernier and Hyundeok Choi were supported by the NASA ROSES program through the SAGE III Science Team (grant no. 80NSSC21K1195) and the Upper Atmosphere Composition Observations program (grant no. 80NSSC21K1082). Thomas J. Aubry was supported by a global mobility grant from the University of Exeter and a travel award from the Canada–UK foundation. Claudia Timmreck acknowledges support for this research from the Deutsche Forschungsgemeinschaft Research Unit VolImpact (grant no. FOR2820,398006378) within the project VolClim (grant no. TI 344/2-1). Andrew T. Prata received funding from the Natural Environment Research Council (NERC) R4Ash project (grant no. NE/S003843/1). The Volc2Clim tool was supported by the UK Earth System Modelling project, funded by the UKRI – Natural Environment Research Council (NERC) national capability (grant no. NE/N017951/1) and the Met Office, as well as NERC grant nos. NE/S000887/1 (VOL-CLIM) and NE/S00436X/1 (V-PLUS). Graham Mann received funding from the NERC highlight topic consortium project SMURPHS (grant no. NE/N006038/1) and standard grant project MeteorStrat (grant no. NE/R011222/1). Graham Mann received funding from the UK National Centre for Atmospheric Science (NCAS) via the NERC National Capability Long Term Science Multiple Centre on the North Atlantic climate system (ACSIS; NERC grant no. NE/N018001/1) and the Copernicus Atmospheric Monitoring Service (CAMS), one of six services that together form Copernicus, the EU's Earth observation program.
This paper was edited by Bryan N. Duncan and reviewed by two anonymous referees.
Aubry, T. J., Toohey, M., Marshall, L., Schmidt, A., and Jellinek, A. M.: A New Volcanic Stratospheric Sulfate Aerosol Forcing Emulator (EVA_H): Comparison With Interactive Stratospheric Aerosol Models, J. Geophys. Res.-Atmos., 125, e2019JD031303, https://doi.org/10.1029/2019JD031303, 2020 (code available at: https://github.com/thomasaubry/EVA_H, last access: 23 March 2024).
Beckett, F. M., Witham, C. S., Leadbetter, S. J., Crocker, R., Webster, H. N., Hort, M. C., Jones, A. R., Devenish, B. J., and Thomson, D. J.: Atmospheric dispersion modelling at the London VAAC: A review of developments since the 2010 Eyjafjallajökull volcano ash cloud, Atmosphere, 11, 352, https://doi.org/10.3390/atmos11040352, 2020.
Bobrowski, N., Kern, C., Platt, U., Hörmann, C., and Wagner, T.: Novel SO2 spectral evaluation scheme using the 360–390 nm wavelength range, Atmos. Meas. Tech., 3, 879–891, https://doi.org/10.5194/amt-3-879-2010, 2010.
Bourassa, A. E., Robock, A., Randel, W. J., Deshler, T., Rieger, L. A., Lloyd, N. D., Llewellyn, E. J., and Degenstein, D. A.: Large Volcanic Aerosol Load in the Stratosphere Linked to Asian Monsoon Transport, Science, 337, 78–81, https://doi.org/10.1126/science.1219371, 2012.
Bruckert, J., Hoshyaripour, G. A., Horváth, Á., Muser, L. O., Prata, F. J., Hoose, C., and Vogel, B.: Online treatment of eruption dynamics improves the volcanic ash and SO2 dispersion forecast: case of the 2019 Raikoke eruption, Atmos. Chem. Phys., 22, 3535–3552, https://doi.org/10.5194/acp-22-3535-2022, 2022.
Cai, Z., Griessbach, S., and Hoffmann, L.: Improved estimation of volcanic SO2 injections from satellite retrievals and Lagrangian transport simulations: the 2019 Raikoke eruption, Atmos. Chem. Phys., 22, 6787–6809, https://doi.org/10.5194/acp-22-6787-2022, 2022.
Capponi, A., Harvey, N. J., Dacre, H. F., Beven, K., Saint, C., Wells, C., and James, M. R.: Refining an ensemble of volcanic ash forecasts using satellite retrievals: Raikoke 2019, Atmos. Chem. Phys., 22, 6115–6134, https://doi.org/10.5194/acp-22-6115-2022, 2022.
Carn, S. A., Clarisse, L., and Prata, A. J.: Multi-decadal satellite measurements of global volcanic degassing, J. Volcanol. Geoth. Res., 311, 99–134, 2016.
Carn, S. A., Newman, P. A., Aquila, V., Gonnermann, H., and Dufek, J.: Anticipating climate impacts of major volcanic eruptions, Eos, 102, https://doi.org/10.1029/2021EO162730, 2021.
Chahine, M., Barnet, C., Olsen, E. T., Chen, L., and Maddy, E.: On the determination of atmospheric minor gases by the method of vanishing partial derivatives with application to CO2, Geophys. Res. Lett., 32, L22803, https://doi.org/10.1029/2005GL024165, 2005.
Clarisse, L., Coheur, P.-F., Theys, N., Hurtmans, D., and Clerbaux, C.: The 2011 Nabro eruption, a SO2 plume height analysis using IASI measurements, Atmos. Chem. Phys., 14, 3095–3111, https://doi.org/10.5194/acp-14-3095-2014, 2014.
de Leeuw, J., Schmidt, A., Witham, C. S., Theys, N., Taylor, I. A., Grainger, R. G., Pope, R. J., Haywood, J., Osborne, M., and Kristiansen, N. I.: The 2019 Raikoke volcanic eruption – Part 1: Dispersion model simulations and satellite retrievals of volcanic sulfur dioxide, Atmos. Chem. Phys., 21, 10851–10879, https://doi.org/10.5194/acp-21-10851-2021, 2021.
Fairlie, T. D., Vernier, J.-P., Natarajan, M., and Bedka, K. M.: Dispersion of the Nabro volcanic plume and its relation to the Asian summer monsoon, Atmos. Chem. Phys., 14, 7045–7057, https://doi.org/10.5194/acp-14-7045-2014, 2014.
Firstov, P. P., Popov, O. E., Lobacheva, M. A., Budilov, D. I., and Akbashev, R. R.: Wave perturbations in the atmosphere accompanied the eruption of the Raykoke volcano (Kuril Islands) 21–22 June, 2019, http://journal.imgg.ru/web/full/fe2020-1-6.pdf (last access: 2 May 2024), 2020.
Folch, A., Costa, A., and Macedonio, G.: FPLUME-1.0: An integral volcanic plume model accounting for ash aggregation, Geosci. Model Dev., 9, 431–450, https://doi.org/10.5194/gmd-9-431-2016, 2016.
Fromm, M., Nedoluha, G., and Charvát, Z.: Comment on “Large Volcanic Aerosol Load in the Stratosphere Linked to Asian Monsoon Transport”, Science, 339, 647, https://doi.org/10.1126/science.1228605, 2013.
Gorkavyi, N., Krotkov, N., Li, C., Lait, L., Colarco, P., Carn, S., DeLand, M., Newman, P., Schoeberl, M., Taha, G., Torres, O., Vasilkov, A., and Joiner, J.: Tracking aerosols and SO2 clouds from the Raikoke eruption: 3D view from satellite observations, Atmos. Meas. Tech., 14, 7545–7563, https://doi.org/10.5194/amt-14-7545-2021, 2021.
Gorshkov, G. S.: Volcanism and the Upper Mantle; Investigations in the Kurile Island Arc, Plenum Publishing Corp, New York, 385 pp., ISBN-10: 146841769X, ISBN-13: 978-1468417692, 1970.
Harvey, N. J., Dacre, H. F., Saint, C., Prata, A. T., Webster, H. N., and Grainger, R. G.: Quantifying the impact of meteorological uncertainty on emission estimates and the risk to aviation using source inversion for the Raikoke 2019 eruption, Atmos. Chem. Phys., 22, 8529–8545, https://doi.org/10.5194/acp-22-8529-2022, 2022.
Hedelt, P., Efremenko, D. S., Loyola, D. G., Spurr, R., and Clarisse, L.: Sulfur dioxide layer height retrieval from Sentinel-5 Precursor/TROPOMI using FP_ILM, Atmos. Meas. Tech., 12, 5503–5517, https://doi.org/10.5194/amt-12-5503-2019, 2019.
Horváth, Á., Carr, J. L., Girina, O. A., Wu, D. L., Bril, A. A., Mazurov, A. A., Melnikov, D. V., Hoshyaripour, G. A., and Buehler, S. A.: Geometric estimation of volcanic eruption column height from GOES-R near-limb imagery – Part 1: Methodology, Atmos. Chem. Phys., 21, 12189–12206, https://doi.org/10.5194/acp-21-12189-2021, 2021a.
Horváth, Á., Girina, O. A., Carr, J. L., Wu, D. L., Bril, A. A., Mazurov, A. A., Melnikov, D. V., Hoshyaripour, G. A., and Buehler, S. A.: Geometric estimation of volcanic eruption column height from GOES-R near-limb imagery – Part 2: Case studies, Atmos. Chem. Phys., 21, 12207–12226, https://doi.org/10.5194/acp-21-12207-2021, 2021b.
Hyman, D. M. and Pavolonis, M. J.: Probabilistic retrieval of volcanic SO2 layer height and partial column density using the Cross-track Infrared Sounder (CrIS), Atmos. Meas. Tech., 13, 5891–5921, https://doi.org/10.5194/amt-13-5891-2020, 2020.
Inness, A., Ades, M., Balis, D., Efremenko, D., Flemming, J., Hedelt, P., Koukouli, M.-E., Loyola, D., and Ribas, R.: Evaluating the assimilation of S5P/TROPOMI near real-time SO2 columns and layer height data into the CAMS integrated forecasting system (CY47R1), based on a case study of the 2019 Raikoke eruption, Geosci. Model Dev., 15, 971–994, https://doi.org/10.5194/gmd-15-971-2022, 2022.
Jensen, E. J., Woods, S., Lawson, R. P., Bui, T. P., Pfister, L., Thornberry, T. D., Rollins, A. W., Vernier, J.-P., Pan, L. L., Honomichl, S., and Toon, O. B.: Ash Particles Detected in the Tropical Lower Stratosphere, Geophys. Res. Lett., 45, 11483–11489, https://doi.org/10.1029/2018GL079605, 2018.
Khaykin, S. M., de Laat, A. T. J., Godin-Beekmann, S., Hauchecorne A., and Ratynski M.: Unexpected self-lofting and dynamical confinement of volcanic plumes: the Raikoke 2019 case, Sci. Rep., 12, 22409, https://doi.org/10.1038/s41598-022-27021-0, 2022.
Kloss, C., Berthet, G., Sellitto, P., Ploeger, F., Taha, G., Tidiga, M., Eremenko, M., Bossolasco, A., Jégou, F., Renard, J.-B., and Legras, B.: Stratospheric aerosol layer perturbation caused by the 2019 Raikoke and Ulawun eruptions and their radiative forcing, Atmos. Chem. Phys., 21, 535–560, https://doi.org/10.5194/acp-21-535-2021, 2021.
Knepp, T. N., Thomason, L., Kovilakam, M., Tackett, J., Kar, J., Damadeo, R., and Flittner, D.: Identification of smoke and sulfuric acid aerosol in SAGE III/ISS extinction spectra, Atmos. Meas. Tech., 15, 5235–5260, https://doi.org/10.5194/amt-15-5235-2022, 2022.
Kovilakam, M., Thomason, L. W., Ernest, N., Rieger, L., Bourassa, A., and Millán, L.: The Global Space-based Stratospheric Aerosol Climatology (version 2.0): 1979–2018, Earth Syst. Sci. Data, 12, 2607–2634, https://doi.org/10.5194/essd-12-2607-2020, 2020.
LeGrande, A., Tsigaridis, K., and Bauer, S.: Role of atmospheric chemistry in the climate impacts of stratospheric volcanic injections, Nat. Geophys., 9, 652–655, https://doi.org/10.1038/ngeo2771, 2016.
Marshall, L., Johnson, J. S., Mann, G. W., Lee, L., Dhomse, S. S., Regayre, L., Yoshioka, M., Carslaw, K. S., and Schmidt, A.: Exploring how eruption source parameters affect volcanic radiative forcing using statistical emulation, J. Geophys. Res.-Atmos., 124, 964–985, https://doi.org/10.1029/2018JD028675, 2019.
Marshall, L. R., Smith, C. J., Forster, P. M., Aubry, T. J., Andrews, T., and Schmidt, A.: Large variations in volcanic aerosol forcing efficiency due to eruption source parameters and rapid adjustments, Geophys. Res. Lett., 47, e2020GL090241, https://doi.org/10.1029/2020GL090241, 2020.
Mastin, L. G.: A user-friendly one-dimensional model for wet volcanic plumes, Geochem. Geophy. Geosy., 8, Q03014, https://doi.org/10.1029/2006GC001455, 2007.
McKeen, S. A., Liu, S. C., and Kiang, C. S.: On the chemistry of stratospheric SO2 from volcanic eruptions, J. Geophys. Res.-Atmos., 89, 4873–4881, 1984.
Millán, L., Santee, M. L., Lambert, A., Livesey, N. J., Werner, F., Schwartz, M. J., Pumphrey, H.C., Manney, G. L., Wang, Y., Sy, H., Read, W. G., and Froidevaux, L.: The Hunga Tonga-Hunga Ha'apai Hydration of the Stratosphere, Geophys. Res. Lett., 49, e2022GL099381, https://doi.org/10.1029/2022GL099381, 2022.
Mills, M. J., Schmidt, A., Easter, R., Solomon, S., Kinnison, D. E., Ghan, S. J., Neely III, R. R., Marsh, D. R., Conley, A., Bardeen, C. G., and Gettelman, A.: Global volcanic aerosol properties derived from emissions, 1990–2014, using CESM1(WACCM), J. Geophys. Res.-Atmos., 121, 2332–2348, https://doi.org/10.1002/2015JD024290, 2016.
Mingari, L., Folch, A., Prata, A. T., Pardini, F., Macedonio, G., and Costa, A.: Data assimilation of volcanic aerosol observations using FALL3D+PDAF, Atmos. Chem. Phys., 22, 1773–1792, https://doi.org/10.5194/acp-22-1773-2022, 2022.
Muser, L. O., Hoshyaripour, G. A., Bruckert, J., Horváth, Á., Malinina, E., Wallis, S., Prata, F. J., Rozanov, A., von Savigny, C., Vogel, H., and Vogel, B.: Particle aging and aerosol–radiation interaction affect volcanic plume dispersion: evidence from the Raikoke 2019 eruption, Atmos. Chem. Phys., 20, 15015–15036, https://doi.org/10.5194/acp-20-15015-2020, 2020.
NASA/LARC/SD/ASDC: Global Space-based Stratospheric Aerosol Climatology Version 2.0, NASA Langley Atmospheric Science Data Center DAAC [data set], https://doi.org/10.5067/GLOSSAC-L3-V2.0, 2018.
Ohneiser, K., Ansmann, A., Chudnovsky, A., Engelmann, R., Ritter, C., Veselovskii, I., Baars, H., Gebauer, H., Griesche, H., Radenz, M., Hofer, J., Althausen, D., Dahlke, S., and Maturilli, M.: The unexpected smoke layer in the High Arctic winter stratosphere during MOSAiC 2019–2020, Atmos. Chem. Phys., 21, 15783–15808, https://doi.org/10.5194/acp-21-15783-2021, 2021.
Osborne, M. J., de Leeuw, J., Witham, C., Schmidt, A., Beckett, F., Kristiansen, N., Buxmann, J., Saint, C., Welton, E. J., Fochesatto, J., Gomes, A. R., Bundke, U., Petzold, A., Marenco, F., and Haywood, J.: The 2019 Raikoke volcanic eruption – Part 2: Particle-phase dispersion and concurrent wildfire smoke emissions, Atmos. Chem. Phys., 22, 2975–2997, https://doi.org/10.5194/acp-22-2975-2022, 2022.
Petracca, I., De Santis, D., Picchiani, M., Corradini, S., Guerrieri, L., Prata, F., Merucci, L., Stelitano, D., Del Frate, F., Salvucci, G., and Schiavon, G.: Volcanic cloud detection using Sentinel-3 satellite data by means of neural networks: the Raikoke 2019 eruption test case, Atmos. Meas. Tech., 15, 7195–7210, https://doi.org/10.5194/amt-15-7195-2022, 2022.
Prata, A. J. and Bernardo, C.: Retrieval of volcanic SO2 column abundance from Atmospheric Infrared Sounder data, J. Geophys. Res.-Atmos., 112, D20204, https://doi.org/10.1029/2006JD007955, 2007.
Prata, A. T., Mingari, L., Folch, A., Macedonio, G., and Costa, A.: FALL3D-8.0: a computational model for atmospheric transport and deposition of particles, aerosols and radionuclides – Part 2: Model validation, Geosci. Model Dev., 14, 409–436, https://doi.org/10.5194/gmd-14-409-2021, 2021.
Prata, A. T., Grainger, R. G., Taylor, I. A., Povey, A. C., Proud, S. R., and Poulsen, C. A.: Uncertainty-bounded estimates of ash cloud properties using the ORAC algorithm: application to the 2019 Raikoke eruption, Atmos. Meas. Tech., 15, 5985–6010, https://doi.org/10.5194/amt-15-5985-2022, 2022.
Sawamura, P., Vernier, J. P., Barnes, J. E., Berkoff, T. A., Welton, E. J., Alados-Arboledas, L., Navas-Guzmán, F., Pappalardo, G., Mona, L., Madonna, F., Lange, D., Sicard, M., Godin-Beekmann, S., Payen, G., Wang, Z., Hu, S., Tripathi, S. N., Cordoba-Jabonero, C., and Hoff, R. M.: Stratospheric AOD after the 2011 eruption of Nabro volcano measured by lidars over the Northern Hemisphere, Environ. Res. Lett., 7, 034013, https://doi.org/10.1088/1748-9326/7/3/034013, 2012.
Schmidt, A., Mills, M. J., Ghan, S., Gregory, J. M., Allan, R. P., Andrews, T., Bardeen, C. G., Conley, A., Forster, P. M., Gettelman, A., Portmann, R. W., Solomon, S., and Toon, O. B.: Volcanic radiative forcing from 1979 to 2015, J. Geophys. Res.-Atmos., 123, 12491–12508, 2018.
Schmidt, A., Aubry, T., Rigby, R., Stevenson, J. A., and Loughlin, S.: cemac/volc2clim, Zenodo [code], https://doi.org/10.5281/zenodo.7602062, 2023a.
Schmidt, A., Aubry, T. J., Rigby, R., Stevenson, J., and Loughlin, S. C.: Volc2Clim online tool, https://volc2clim.bgs.ac.uk/ (last access: 14 May 2024), 2023b.
Sellitto, P., Podglajen, A., Belhadji, R., Boichu, M., Carboni, E., Cuesta, J., Duchamp, C., Kloss, C., Siddans, R., Bègue, N., Blarel, L., Jegou, F., Khaykin, S., Renard, J.-B., and Legras, B.: The unexpected radiative impact of the Hunga Tonga eruption of 15th January 2022, Com. Ea. & Env., 3, 288, https://doi.org/10.1038/s43247-022-00618-z, 2022.
Sennert, S. K.: Global Volcanism Program, 2019, Report on Raikoke (Russia), Weekly Volcanic Activity Report, 26 June–2 July 2019, Smithsonian Institution and US Geological Survey, https://volcano.si.edu/showreport.cfm?wvar=GVP.WVAR20190626-290250 (last access: 23 March 2024), 2019.
Smith, C. J., Forster, P. M., Allen, M., Leach, N., Millar, R. J., Passerello, G. A., and Regayre, L. A.: FAIR v1.3: a simple emissions-based impulse response and carbon cycle model, Geosci. Model Dev., 11, 2273–2297, https://doi.org/10.5194/gmd-11-2273-2018, 2018 (code available at: https://github.com/OMS-NetZero/FAIR, last access: 23 March 2024).
Stenchikov, G., Ukhov, A., Osipov, S., Ahmadov, R., Grell, G., Cady-Pereira, K., Mlawer, E., and Iacono, M.: How does a Pinatubo-size volcanic cloud reach the middle stratosphere?, J. Geophys. Res.-Atmos., 126, e2020JD033829, https://doi.org/10.1029/2020JD033829, 2021.
Tackett, J. L., Winker, D. M., Getzewich, B. J., Vaughan, M. A., Young, S. A., and Kar, J.: CALIPSO lidar level 3 aerosol profile product: version 3 algorithm design, Atmos. Meas. Tech., 11, 4129–4152, https://doi.org/10.5194/amt-11-4129-2018, 2018.
Theys, N., Campion, R., Clarisse, L., Brenot, H., van Gent, J., Dils, B., Corradini, S., Merucci, L., Coheur, P.-F., Van Roozendael, M., Hurtmans, D., Clerbaux, C., Tait, S., and Ferrucci, F.: Volcanic SO2 fluxes derived from satellite data: a survey using OMI, GOME-2, IASI and MODIS, Atmos. Chem. Phys., 13, 5945–5968, https://doi.org/10.5194/acp-13-5945-2013, 2013.
Theys, N., De Smedt, I., Yu, H., Danckaert, T., van Gent, J., Hörmann, C., Wagner, T., Hedelt, P., Bauer, H., Romahn, F., Pedergnana, M., Loyola, D., and Van Roozendael, M.: Sulfur dioxide retrievals from TROPOMI onboard Sentinel-5 Precursor: algorithm theoretical basis, Atmos. Meas. Tech., 10, 119–153, https://doi.org/10.5194/amt-10-119-2017, 2017.
Theys, N., Fioletov, V., Li, C., De Smedt, I., Lerot, C., McLinden, C., Krotkov, N., Griffin, D., Clarisse, L., Hedelt, P., Loyola, D., Wagner, T., Kumar, V., Innes, A., Ribas, R., Hendrick, F., Vlietinck, J., Brenot, H., and Van Roozendael, M.: A sulfur dioxide Covariance-Based Retrieval Algorithm (COBRA): application to TROPOMI reveals new emission sources, Atmos. Chem. Phys., 21, 16727–16744, https://doi.org/10.5194/acp-21-16727-2021, 2021.
Theys, N., Lerot, C., Brenot, H., van Gent, J., De Smedt, I., Clarisse, L., Burton, M., Varnam, M., Hayer, C., Esse, B., and Van Roozendael, M.: Improved retrieval of SO2 plume height from TROPOMI using an iterative Covariance-Based Retrieval Algorithm, Atmos. Meas. Tech., 15, 4801–4817, https://doi.org/10.5194/amt-15-4801-2022, 2022.
Toohey, M., Stevens, B., Schmidt, H., and Timmreck, C.: Easy Volcanic Aerosol (EVA v1.0): an idealized forcing generator for climate simulations, Geosci. Model Dev., 9, 4049–4070, https://doi.org/10.5194/gmd-9-4049-2016, 2016.
Tournigand, P.-Y., Cigala, V., Lasota, E., Hammouti, M., Clarisse, L., Brenot, H., Prata, F., Kirchengast, G., Steiner, A. K., and Biondi, R.: A multi-sensor satellite-based archive of the largest SO2 volcanic eruptions since 2006, Earth Syst. Sci. Data, 12, 3139–3159, https://doi.org/10.5194/essd-12-3139-2020, 2020.
Vaughan, G., Wareing, D., and Ricketts, H.: Measurement Report: Lidar measurements of stratospheric aerosol following the 2019 Raikoke and Ulawun volcanic eruptions, Atmos. Chem. Phys., 21, 5597–5604, https://doi.org/10.5194/acp-21-5597-2021, 2021.
Veefkind, J. P., Aben, I., McMullan, K., Förster, H., de Vries, J., Otter, G., Claas, J., Eskes, H. J., de Haan, J. F., Kleipool, Q., van Weele, M., Hasekamp, O., Hoogeveen, R., Landgraf, J., Snel, R., Tol, P., Ingmann, P., Voors, R., Kruizinga, B., Vink, R., Visser, H., and Levelt, P. F.: TROPOMI on the ESA Sentinel-5 Precursor: A GMES mission for global observations of the atmospheric composition for climate, air quality and ozone layer applications, Remote Sens. Environ., 120, 70–83, https://doi.org/10.1016/j.rse.2011.09.027, 2012.
Vernier, J.-P.: VolRes-Raikoke-ACP-2024-data, figshare [data set], https://doi.org/10.6084/m9.figshare.25136972, 2024.
Vernier, J.-P., Fairlie, T. D., Murray, J. J., Tupper, A., Trepte, C., Winker, D., Pelon, J., Garnier, A., Jumelet, J., Pavolonis, M., Omar, A. H., and Powell, K. A.: An advanced system to monitor the 3D structure of diffuse volcanic ash clouds, J. Appl. Meteorol. Clim., 52, 2125–2138, https://doi.org/10.1175/JAMC-D-12-0279.1, 2013.
Vernier, J.-P., Fairlie, T. D., Deshler, T., Natarajan, M., Knepp, T., Foster, K., Wienhold, F. G., Bedka, K. M., Thomason, L., and Trepte, C.: In situ and space-based observations of the Kelud volcanic plume: The persistence of ash in the lower stratosphere, J. Geophys. Res., 121, 11104–11118, https://doi.org/10.1002/2016JD025344, 2016.
Vömel, H., Evan, S., and Tully, M.: Water vapor injection into the stratosphere by Hunga Tonga-Hunga Ha'apai, Science, 377, 1444–1447, https://doi.org/10.1126/science.abq2299, 2022.
Winker, D. M., Pelon, J., Coakley, J. A., Ackerman, S. A., Charlson, R. J., Colarco, P. R., Flamant, P., Fu, Q., Hoff, R. M., Kittaka, C., Kubar, T. L., Le Treut, H., Mccormick, M. P., Mégie, G., Poole, L., Powell, K., Trepte, C., Vaughan, M. A., and Wielicki, B. A.: The CALIPSO Mission, Bull. Am. Meteorol. Soc., 91, 1211–1230, https://doi.org/10.1175/2010BAMS3009.1, 2010.
Winker, D. M., Tackett, J. L., Getzewich, B. J., Liu, Z., Vaughan, M. A., and Rogers, R. R.: The global 3-D distribution of tropospheric aerosols as characterized by CALIOP, Atmos. Chem. Phys., 13, 3345–3361, https://doi.org/10.5194/acp-13-3345-2013, 2013.
Wrana, F., Niemeier, U., Thomason, L. W., Wallis, S., and von Savigny, C.: Stratospheric aerosol size reduction after volcanic eruptions, Atmos. Chem. Phys., 23, 9725–9743, https://doi.org/10.5194/acp-23-9725-2023, 2023.
Zängl, G., Reinert, D., Rípodas, P., and Baldauf, M.: The ICON (ICOsahedral Non-hydrostatic) modelling framework of DWD and MPI-M: Description of the non-hydrostatic dynamical core, Q. J. Roy. Meteor. Soc., 141, 563–579, https://doi.org/10.1002/qj.2378, 2015.
Zhu, Y., Toon, O. B., Jensen, E. J., Bardeen, C. G., Mills, M. J., Tolbert, M. A., Yu, P., and Woods, S.: Persisting volcanic ash particles impact stratospheric SO2 lifetime and aerosol optical properties, Nat. Commun. 11, 4526, https://doi.org/10.1038/s41467-020-18352-5, 2020.
Zhu, Y., Bardeen, C. G., Tilmes, S., Mills, M. J., Wang, X., Harvey, V. L., Taha, G., Kinnison, D., Portmann, R. W., Yu, P., Rosenlof, K. H., Avery, M., Kloss, C., Li, C., Glanville, A. S., Millán, L., Deshler, T., Krotkov, N., and Toon, O. B.: Perturbations in stratospheric aerosol evolution due to the water-rich plume of the 2022 Hunga-Tonga eruption, Commun. Earth Environ., 3, 248, https://doi.org/10.1038/s43247-022-00580-w, 2022.
- Abstract
- Introduction
- Satellite datasets
- Early reports of injection parameters 1 week after the eruption
- Revision and improvements in injection parameters
- New plume injection analysis derived from CALIPSO and AIRS
- Rapid projections of the aerosol forcing and the global mean surface temperature response
- Discussion
- Conclusion
- Code and data availability
- Author contributions
- Competing interests
- Disclaimer
- Financial support
- Review statement
- References