the Creative Commons Attribution 4.0 License.
the Creative Commons Attribution 4.0 License.
 | 16 May 2024
Attribution of aerosol particle number size distributions to main sources using an 11-year urban dataset
Philip K. Hopke
Source apportionment was performed using size-segregated atmospheric particle number concentrations (PNCs) in 27 size channels over a diameter range of 6–1000 nm augmented by air pollutants with a time resolution of 1 h in Budapest for 11 full years. The input dataset was treated for the effect of the local meteorology using dispersion correction. Both the uncorrected dataset and corrected dataset were evaluated using positive matrix factorization for separate seasons. Six source types including nucleation, two road vehicle emission sources separated into a semi-volatile fraction and a solid-core fraction, a diffuse urban source, a secondary inorganic aerosol (SIA) source, and an ozone-associated secondary aerosol source were identified, characterized and quantified. The dispersion correction did not considerably change the profiles, diel variations or patterns of the sources, while it substantially modified the relative shares of the nucleation source in all seasons. The mean relative contributions of the traffic emissions (60 %) indicate that on-road motor vehicles were the leading source of particle numbers. The nucleation was responsible for 24 % of the PNC annually as a lower estimate. It exhibited a compound character consisting of photochemically induced nucleation and traffic-related nucleation. Its contributions were the highest in spring and the lowest in winter. The shares of the urban diffuse and SIA source types were the largest in autumn and winter and in spring and summer, respectively, but they were typically ⪅ 10 %. The O3-associated secondary aerosol made up the smallest (⪅ 3 %) contributions. The conditional bivariate probability function analysis showed considerable spatial variations in the source origin. The combination of the size-segregated particle number concentrations, wide overall range of the size channels, considerably long dataset, dispersion correction and modelling over separate seasons led jointly to a unique adaptation of the source apportionment and yielded novel and valuable insights into the urban aerosol sources and processes both for Budapest and in general.
- Article
(2786 KB) - Full-text XML
-
Supplement
(6475 KB) - BibTeX
- EndNote


Particulate matter (PM) plays a vital role in urban air quality worldwide. It is often quantified by the mass of particles that belong to the key pollutants or criteria air pollutants (EU EEA, 2023; US EPA, 2023). Coarse- and accumulation-mode particles make up most PM mass, whereas the mass contribution of the ultrafine (UF) particles (traditionally defined as d < 100 nm) is negligible (e.g. Salma et al., 2002) despite the fact that UF particles make up > 80 % of total particle numbers in cities (Trechera et al., 2023). At relatively low PM mass and high UF particle concentrations, it is the particle number that better represents the potential danger to human health compared to the PM mass. There are toxicological (Oberdörster et al., 2005; HEI Review Panel, 2013), clinical (Chalupa et al., 2004) and epidemiological (Kreyling et al., 2006; Wang, M. et al., 2019) studies that suggest that the UF particles can cause adverse health effects. Inhalation of very small insoluble particles can lead to excess health risk relative to the effects of coarse or fine particles with similar chemical compositions (Oberdörster et al., 2005; HEI Review Panel, 2013). This threat is caused by the vast number of the deposited particles in the respiratory system, their relatively large total surface area and their small size (Oberdörster et al., 2005; Braakhuis et al., 2014; Salma et al., 2015; Riediker et al., 2019). The World Health Organization identified the UF particles as a potential risk factor for humans (WHO, 2021).
Particle number size distribution (PNSD) is a basic property of the aerosol system. It can vary considerably over space and time. Formation and atmospheric transformation processes essentially contribute to this variability (Vu et al., 2015). Apart from in the vicinity of intensive sources of UF particles, the PNSD change rates become much slower. Under these more balanced conditions, the PNSDs can be separated into size modes that are associated with source types or aggregate sources (Hopke et al., 2022, and references therein). The PNSDs in the ambient air usually consist of nucleation, Aitken and accumulation modes. The nucleation mode can be associated with regional atmospheric new aerosol particle formation (NPF) and growth events (Kulmala, 2003) and with local or sub-local nucleation connected to combustion sources such as internal-combustion engines (Kittelson et al., 2022, and references therein), residential heating and cooking with natural gas (Li and Hopke, 1993). The Aitken-mode particles are usually emitted into the air and can contain variable portions of semi-volatile components condensed on a solid core (Morawska et al., 2008; Harrison et al., 2019; Rönkkö and Timonen, 2019; Kittelson et al., 2022). The accumulation-mode particles ordinarily result from transformation processes such as condensation growth, physical and chemical ageing, or water activation processes of Aitken-mode or nucleated particles. The naming, associated modal diameters and attribution of the modes to the specific formation processes for some concrete specific sources such as mobile vehicles (which are responsible for the major part of particle numbers in cities) largely vary in the literature (Kittelson et al., 2022).
Primary pollutants (together with the particle number size distributions of primary particles) can be also affected by meteorological processes such as atmospheric mixing and transport due to their dispersion (dilution or enrichment). The dispersion is often governed by solar radiation through planetary boundary mixing layer height (MLH), by wind or by precipitation (Androna, 2004; Kumar et al., 2011). These conditions can substantially affect both larger orographic basins and smaller valleys (Leahey, 1972; Salma et al., 2020). The dispersion of primary particles is essentially related to the available air volume in which they are mixed (Holzworth, 1967; Ashrafi et al., 2009). In cities, this volume is determined by the MLH and by wind speed (WS) in the first approach. It is noted that meteorological variables may affect secondary pollutants and particles in a more complex way with respect to the primary pollutants and particles.
The shape of PNSDs is influenced by the formation and transformation processes of particles and by meteorological conditions (Li et al., 2023). Thus, size distributions can be used to identify and quantify various source types. These sources differ from those dominating the PM mass. The particle number concentrations are nonconservative compared to the PM mass. Quantification of PNSDs and attribution to different source types are desirable and essential since many basic properties and the atmospheric behaviour of particles, as well as health, environmental and climate effects, depend on the number (and not on the mass) concentration (e.g. Ibald-Mulli et al., 2002; Meng et al., 2013; Corsini et al., 2019). Source apportionment can also yield valuable knowledge to create air quality regulatory strategies for particle numbers or their source-specific exposure metrics. Therefore, recently there has been a considerable and increasing scientific interest in source apportionment studies of PNSDs (Harrison et al., 2011; Vu et al., 2015; Beddows and Harrison, 2019; Hopke, 2000; Dai et al., 2021; Hopke et al., 2022; Teinilä et al., 2022; Conte et al., 2023; Crova et al., 2024; Rowell et al., 2024). Studies based on multi-year data are still scarce (de Jesus et al., 2020).
Source apportionments can be achieved by multivariate modelling (Hopke, 1991). Positive matrix factorization (PMF; Paatero and Tapper, 1993, 1994) is one of the most widely used, well established and efficient techniques for this (Hopke, 2016; Hopke et al., 2020). PMF modelling has been successfully applied to mass concentrations of aerosol constituents and gases (e.g. Viana et al., 2008; US EPA, 2014; Belis et al., 2020). The main differences between the PMF deployed on particle number size distribution data and that deployed on mass concentrations include different attitudes toward handling zero data and values below the detection limits and toward estimating the observation uncertainties (Ogulei et al., 2007).
To study the phenomenon of urban atmospheric NPF and growth in Budapest, PNSDs in a diameter range of 6–1000 nm, meteorological properties and air pollutants were measured for 11 full measurement years. This is one of the longest critically evaluated urban datasets of this kind in the world. Utilizing this readily available dataset for source apportionment by the PMF method offers different and comprehensive insights into the sources of particle numbers. Such long-term observations are particularly valuable as they can reveal information statistically that was hidden in the noise on shorter timescales (Kulmala et al., 2023). The main objectives of this study are (1) to present and discuss the results and experience gained from the source apportionment of PNSDs by applying the PMF method for separate seasons in Budapest, (2) to quantify the effect and importance of the atmospheric dispersion correction, (3) to interpret the main sources and their spatial distributions, and (4) to determine the relevance of the sources. The combined application of the size-segregated particle number concentrations, the wide range of size channels, the considerably long dataset, dispersion correction and modelling over separate seasons can lead to novel insights into the aerosol sources, transformation processes and transport processes of particle numbers in cities. Our conclusions can also contribute to developing innovative air quality regulatory policy for the particle numbers.
2.1 Experimental part and data treatment
The measurements were performed at two urban sites in Budapest. Most of them were conducted at the Budapest platform for Aerosol Research and Training (BpART) Laboratory (47°28′29.9′′ N, 19°3′44.6′′ E; 115 m above mean sea level, a.m.s.l.) of Eötvös Loránd University (Salma et al., 2016a). The measurement site is located 85 m from the Danube River, which flows through the city centre. The location represents an urban background site due to its geographical and meteorological conditions. The other measurement site was in a wooded area at the Konkoly Astronomical Observatory (47°3′'00′′ N, 18°57′47′′ E; 478 ) at the northwestern border of the city. Since the prevailing wind direction in the area is northwest, the latter site represents the near-city background. The exact timings of the measurement years are detailed in Table S1 in the Supplement. The experimental data from the two measurement sites were merged into one dataset that was evaluated jointly.
The PNSDs were measured using a flow-switching-type differential mobility particle sizer system, which operates in an electrical mobility diameter range from 6 to 1000 nm in the dry state of particles (relative humidity, RH < 30 %), separating the particles into 27 size channels with a time resolution of τ = 8 min (Salma et al., 2011, 2016b, 2021). The nominal diameters of the 27 channels are 6.0, 7.3, 8.9, 10.8, 13.2, 16.0, 19.5, 23.7, 28.9, 35.2, 42.9, 52.1, 63.4, 77.2, 93.9, 114, 139, 169, 206, 250, 304, 371, 451, 550, 670, 816 and 994 nm. This list facilitates the exact interpretation of the factor profiles and other plots in Figs. 2a–4a, S1a–S4a and S10a–S15a in the Supplement. The concentrations of NO, , CO, O3, SO2 and PM10 mass were acquired from the closest measurement stations of the National Air Quality Network located 4.5 km from the urban background site and 6.9 km from the near-city background site in the prevailing upwind direction (Salma et al., 2020). The time resolution of these measurements was 1 h. Air temperature (T), RH, WS, wind direction (WD) and global radiation (GRad) were measured at the BpART Laboratory and above the rooftop level of the building complex (at a height of 45 m above the nearest street). The wind data above the rooftop level were utilized in the present study and were recorded with standardized sensors (WAA15A and WAV15A; Vaisala, Finland) with τ = 10 min. Mixing layer height data (τ = 1 h) were extracted from the Copernicus Climate Change Service (ERA5 family datasets, ECMWF reanalysis; Hersbach et al., 2023).
The data were expressed in local time (LT; UTC + 1 or daylight saving time, UTC + 2). This was chosen since the activities of the inhabitants greatly influence the atmospheric concentrations and size distributions in cities (Mikkonen et al., 2020). Hourly mean PNSDs were derived from the experimental data to reduce their fluctuations and the amount of missing data. Atmospheric concentrations in each size channel and of the total particle number concentrations (N6–1000) were calculated and further evaluated. The investigated time interval involved 11 full measurement years (Table S1). The data from the two urban sites were joined and evaluated together. The residuals and the goodness of fit in the PMF modelling did not indicate significant differences between the respective factor profiles in the urban background and near-city background. Additionally, this multi-site approach is expected to improve the efficiency of the source apportionment (Pandolfi et al., 2010; Dai et al., 2020; Harni et al., 2023). The median N6–1000 and atmospheric concentrations of pollutants over the measurement years are also summarized in Table S1.
The overall dataset was finally split into separate subsets for meteorological seasons (March, April and May as spring; June, July and August as summer; September, October and November as autumn; and December, January and February as winter) to fulfil one of the basic requirements of the PMF method: consistency of the source profile over the time interval considered (Zhou et al., 2004; Ogulei et al., 2007). The PMF modelling was performed separately on each season joined over all 11 years. The missing concentration values in the input dataset were replaced by the medians with 3 times the measurement uncertainty of the seasonal dataset. The data coverage for the input data was typically > 85 %. The total number of observations for the PNSDs is shown in Fig. S6. The seasonal means and standard deviations (SDs) of the meteorological properties are summarized in Table S2.
2.2 Source apportionment modelling
The source apportionment was performed using the PMF method with the equation solver multilinear engine version 2 (ME-2; Paatero, 1999; Hopke et al., 2023). The method decomposes the input dataset into a factor (source) profile matrix and a factor contribution matrix with a user-specified factor number based on the covariances between the variables. The PMF iteratively optimizes the objective parameter Q, which is calculated as the individual residuals (e) and the uncertainties (s) for the observation i and variable j,
where m and n are the maximum number of observations and variables, respectively. Qtrue was calculated with all data points, whereas Qrobust was determined excluding the poorly fitted data points (i.e. when their uncertainty-scaled residuals were > 4). The uncertainties in the particle number concentrations in a size channel j were estimated as (Ogulei et al., 2007)
where σ is the estimated individual measurement uncertainty for an observation; N represents the observed concentration; is the arithmetic mean of the observed concentrations in the respective variable; α is constant (0.01), the value of which is fine-tuned by A around its nominal value; s is the overall uncertainty matrix; and C3 is a constant (0.1 for size channels, 0.2 for N6–1000 concentrations and 0.15 for air pollutants), which is also tuned. Specifying too low uncertainties relative to the true error level results in overweighting those data points, while larger uncertainties yield downweighting (Hopke, 2000). Assigning moderately lower statistical weights exerts a less sensitive effect on the modelling results than overweighting, and the overdetermined uncertainties can also obscure the concentration data. These selections are widely accepted in the PNSD source apportionment studies (Hopke et al., 2020, and references therein).
The addition of the air pollutants is beneficial for the PMF as the new quantities provide insights into the sources or atmospheric processes that produce the measured size distributions and reduce the rotational ambiguity of the model by complementing the edge points (Paatero, 1999; Hopke, 2016).
Dispersion of the atmospheric concentrations due to the changes in meteorological conditions can result in additional covariance. This effect can be corrected by dispersion normalization of the input dataset with the ventilation coefficient (VC; Ashrafi et al., 2009). In this approach, the available air volume for the atmospheric dispersion is proportional to the product of the MLHi and the vectorial mean of the wind speed (ui) for the observation i:
The hourly mean ui values were obtained from the 10 min WS and WD data using vectorial averaging. The occurrence of the zero hourly mean ui value was very low in the resulting dataset; the share of ui < 0.1 m s−1 was 0.06 %. The concentration data (Ci) were multiplied by the ratio (called the ventilation coefficient ratio, VCratio) of the corresponding VCi and its overall mean value :
The ventilation coefficient represents the maximum volume into which the particles undergo dilution after their release into or formation within the ambient air per unit of time (Dai et al., 2021). The main purpose of this treatment is to correct each concentration data point to have the same ventilation coefficient as the mean VC over the whole 11-year dataset. The mean VC was 1768 m2 s−1 in our case.
After completing the PMF analysis on the corrected dataset, the derived source contributions were divided by the respective VC ratios to obtain the real contributions. The source apportionment modelling was performed independently on both the uncorrected concentrations and the dispersion-corrected concentrations. The results derived from the uncorrected dataset (i.e. Ci concentrations) are referred to as uncorrected PMF data, while those obtained from the corrected dataset (CVi concentrations) are denoted dispersion-corrected PMF (DC-PMF) data.
The PMF solutions were explored in 50 runs with different configurations for each dataset. The factor count was changed between 4 and 12; the uncertainty parameters were modified from 0.01 to 0.05 for α × A and between 0.01 and 0.5 for C3. Increased uncertainty settings were adopted for the smallest (< 10 nm) and the largest (> 800 nm) size channels since their uncertainties were proven to be larger (Wiedensohler et al., 2012) and for the air pollutants since they were set as weak variables. The final solution was reached through a trial-and-error approach. The final parameters of the uncertainty estimations of the input data are summarized in Table S3. Additional uncertainty estimations were run using bootstrap and displacement analyses. Some summary results of this evaluation are shown in Figs. S1–S4 for the factors (identified later as source types) and seasons. These auxiliary calculations and the comparison of their outcomes also mark and confirm that the final selection of the modelling parameters and of the input uncertainty data were reasonable and appropriate.
From an analysis point of view, the best solution (approved later as the final solution) was chosen to meet the following criteria: the convergence is achieved in a robust manner, Qtrue and Qrobust diagnostic values are among the lowest values, the scaled residuals are distributed preferably normally between −3 and +3, and the goodness of fit (expressed as the coefficient of determination, r2) for the strong variables is typically > 0.85. From the interpretation aspect, the main requirements were that the solution is physically interpretable based on the size profiles, shows sensible diel patterns, shows weekly and annual tendencies, and is acceptable as far as directional probability function plots are concerned.
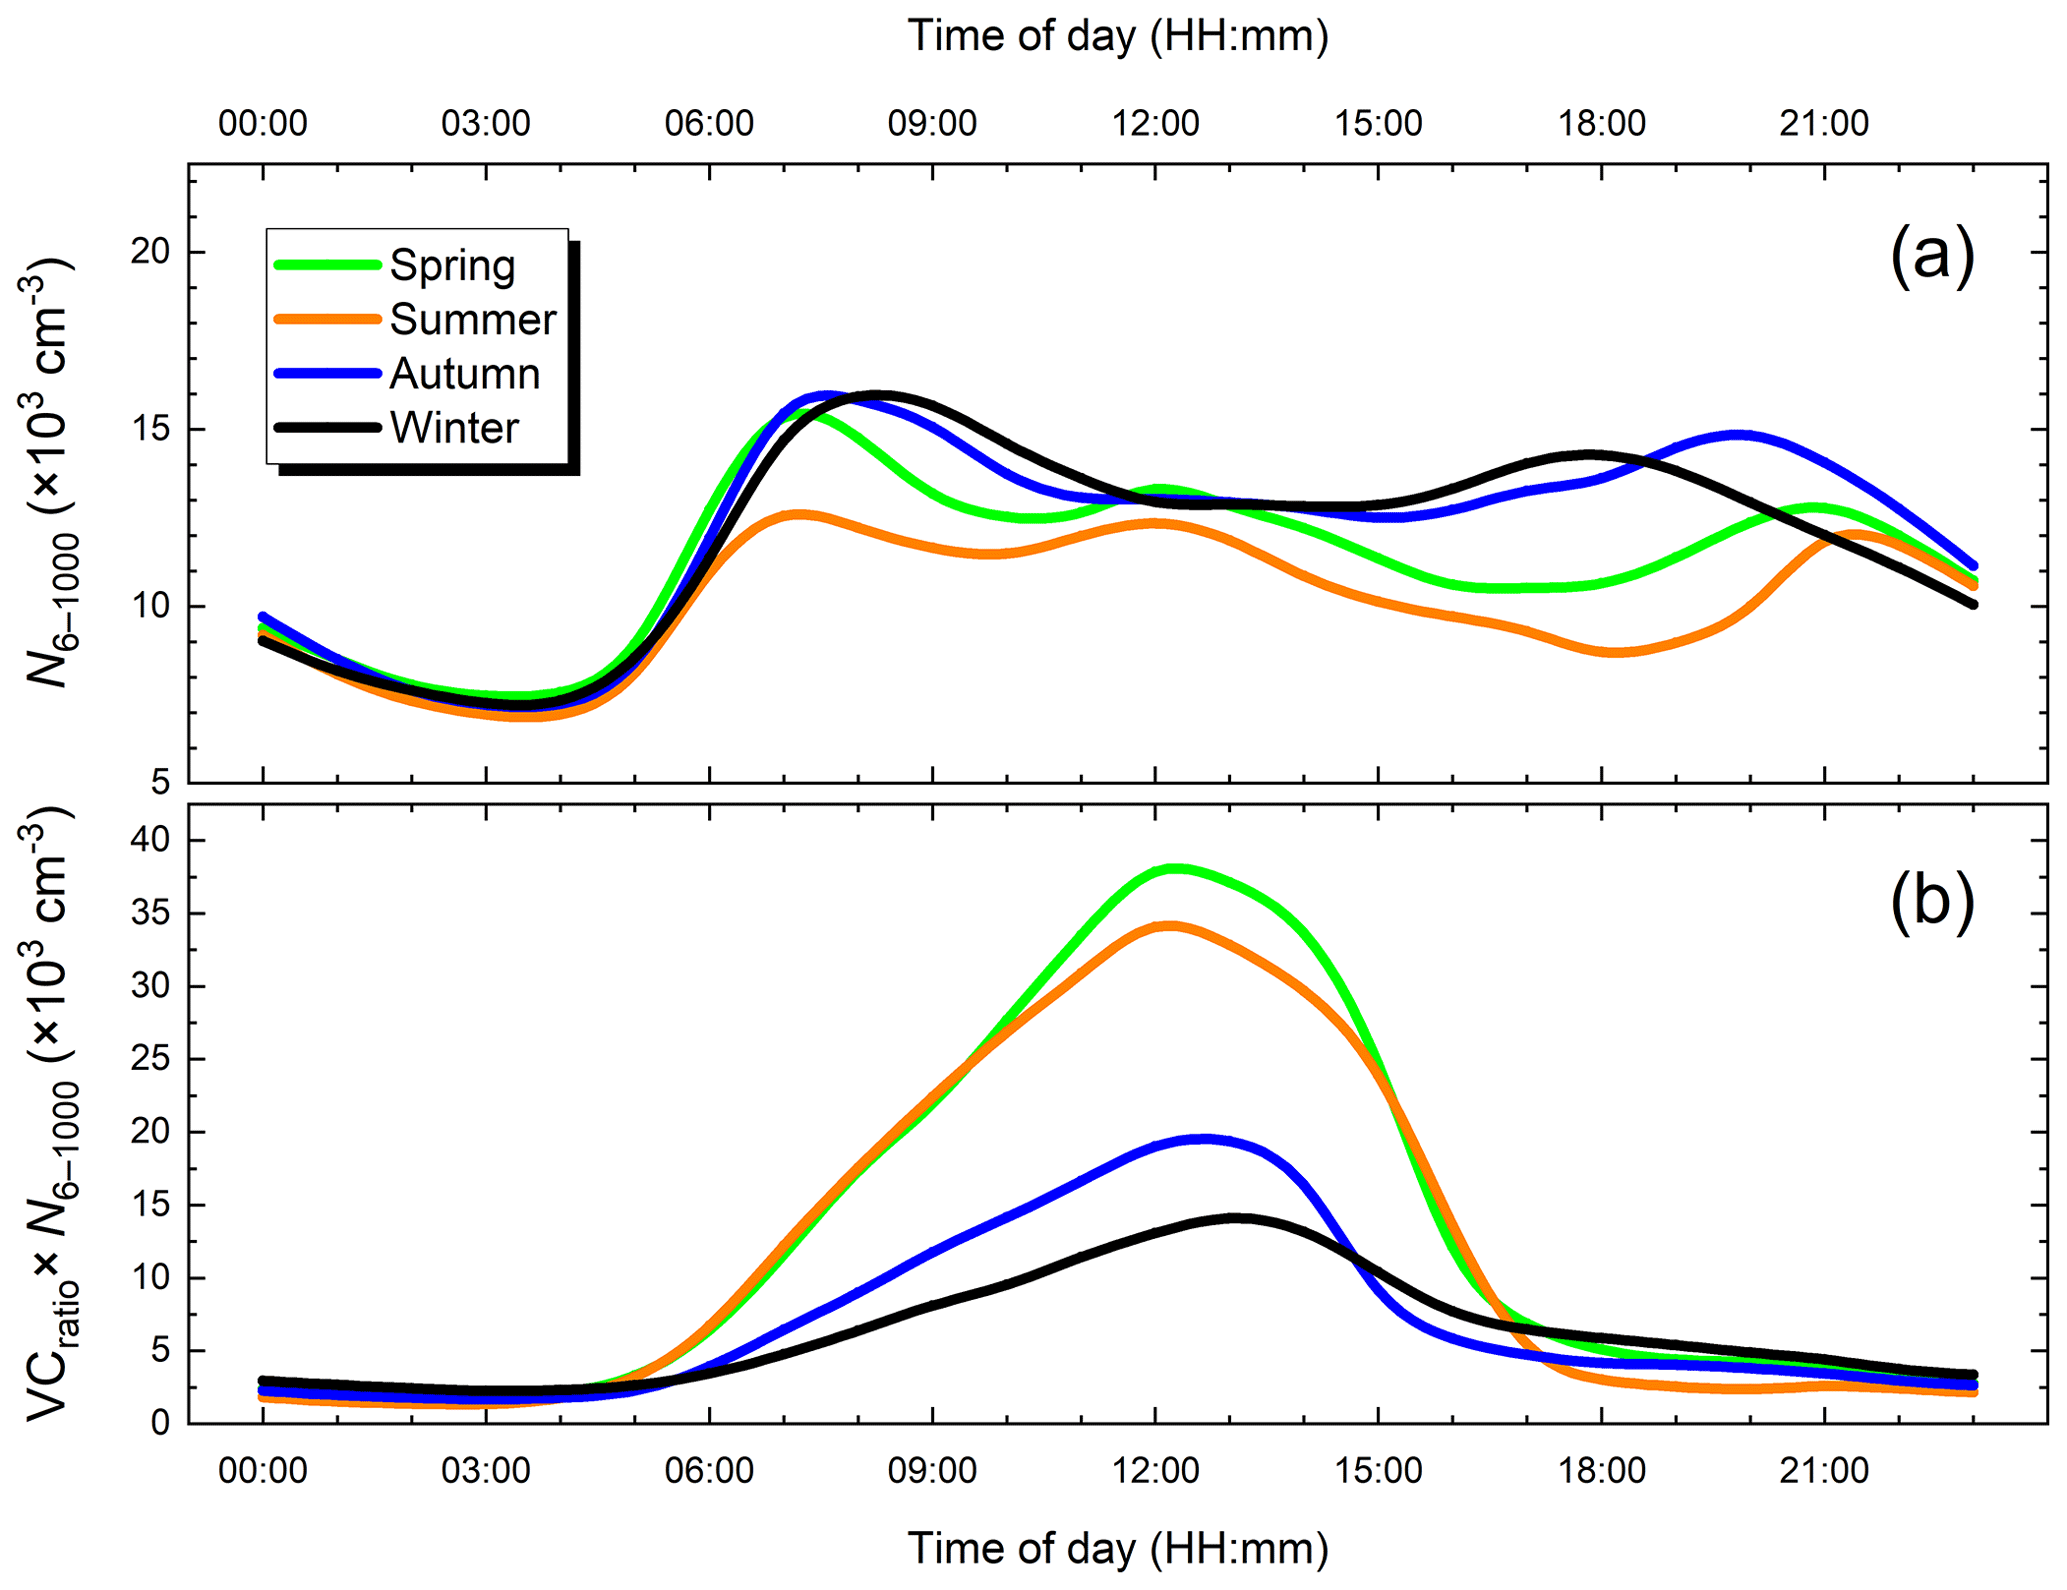
Figure 1(a) Mean diel variations in the uncorrected concentrations (N6–1000) and (b) dispersion-corrected total particle number concentrations (VCratio × N6–1000) for spring, summer, autumn and winter.
Spatial variations in the source intensities and other properties were derived using the conditional bivariate probability function polarPlot() of the “openair” R package (Carslaw and Ropkins, 2012; Uria-Tellaexte and Carslaw, 2014). The method utilizes WS and WD data to create plots of directionality. The plots derived from the uncorrected and corrected PMF modelling were compared using the polarDiff() function of the package. Further statistical evaluations and presentations were accomplished using the laboratory-developed application AeroSoLutions2 in conjunction with the Accord.NET Framework (Souza, 2014).
3.1 Effects of the dispersion correction on the input dataset
The mean diel variations in the ventilation coefficient ratio and of its MLH and WS constituents are shown in Fig. S5 and discussed in the Supplement. The effects of the dispersion correction on the PMF input data are demonstrated by the diel variations in the uncorrected and dispersion-corrected N6–1000 concentrations for separate seasons (Fig. 1). The structure of the uncorrected curves (Fig. 1a) was discussed and explained earlier (Salma et al., 2011, 2020; Thén and Salma, 2022). Conclusively, there are three peaks with variable relative areas in the diel variations, namely an early-morning peak and an evening peak at the rush hours of 06:00–08:00 and 18:00–21:00 LT, respectively, largely generated by road vehicle traffic, and a midday peak predominantly produced by NPF events driven by photochemistry. The curve in summer seems to be below the other lines during the daylight period. The concentrations monotonically decreased from 23:00 to 05:00 LT and were virtually identical to each other.
The extent and shape of the diel curves of the atmospheric concentrations multiplied by the ventilation ratio were vastly different from the uncorrected lines (Fig. 1b). They all consisted of a broad and structured peak. The largest maxima of the peaks were observed in spring and summer, while the peaks in autumn and winter were considerably lower. The shift in the timing of the maxima was influenced by the clock change for the daylight saving periods. The curves exhibited monotonically decreasing tendency in the evening and reached a constant level during the night.
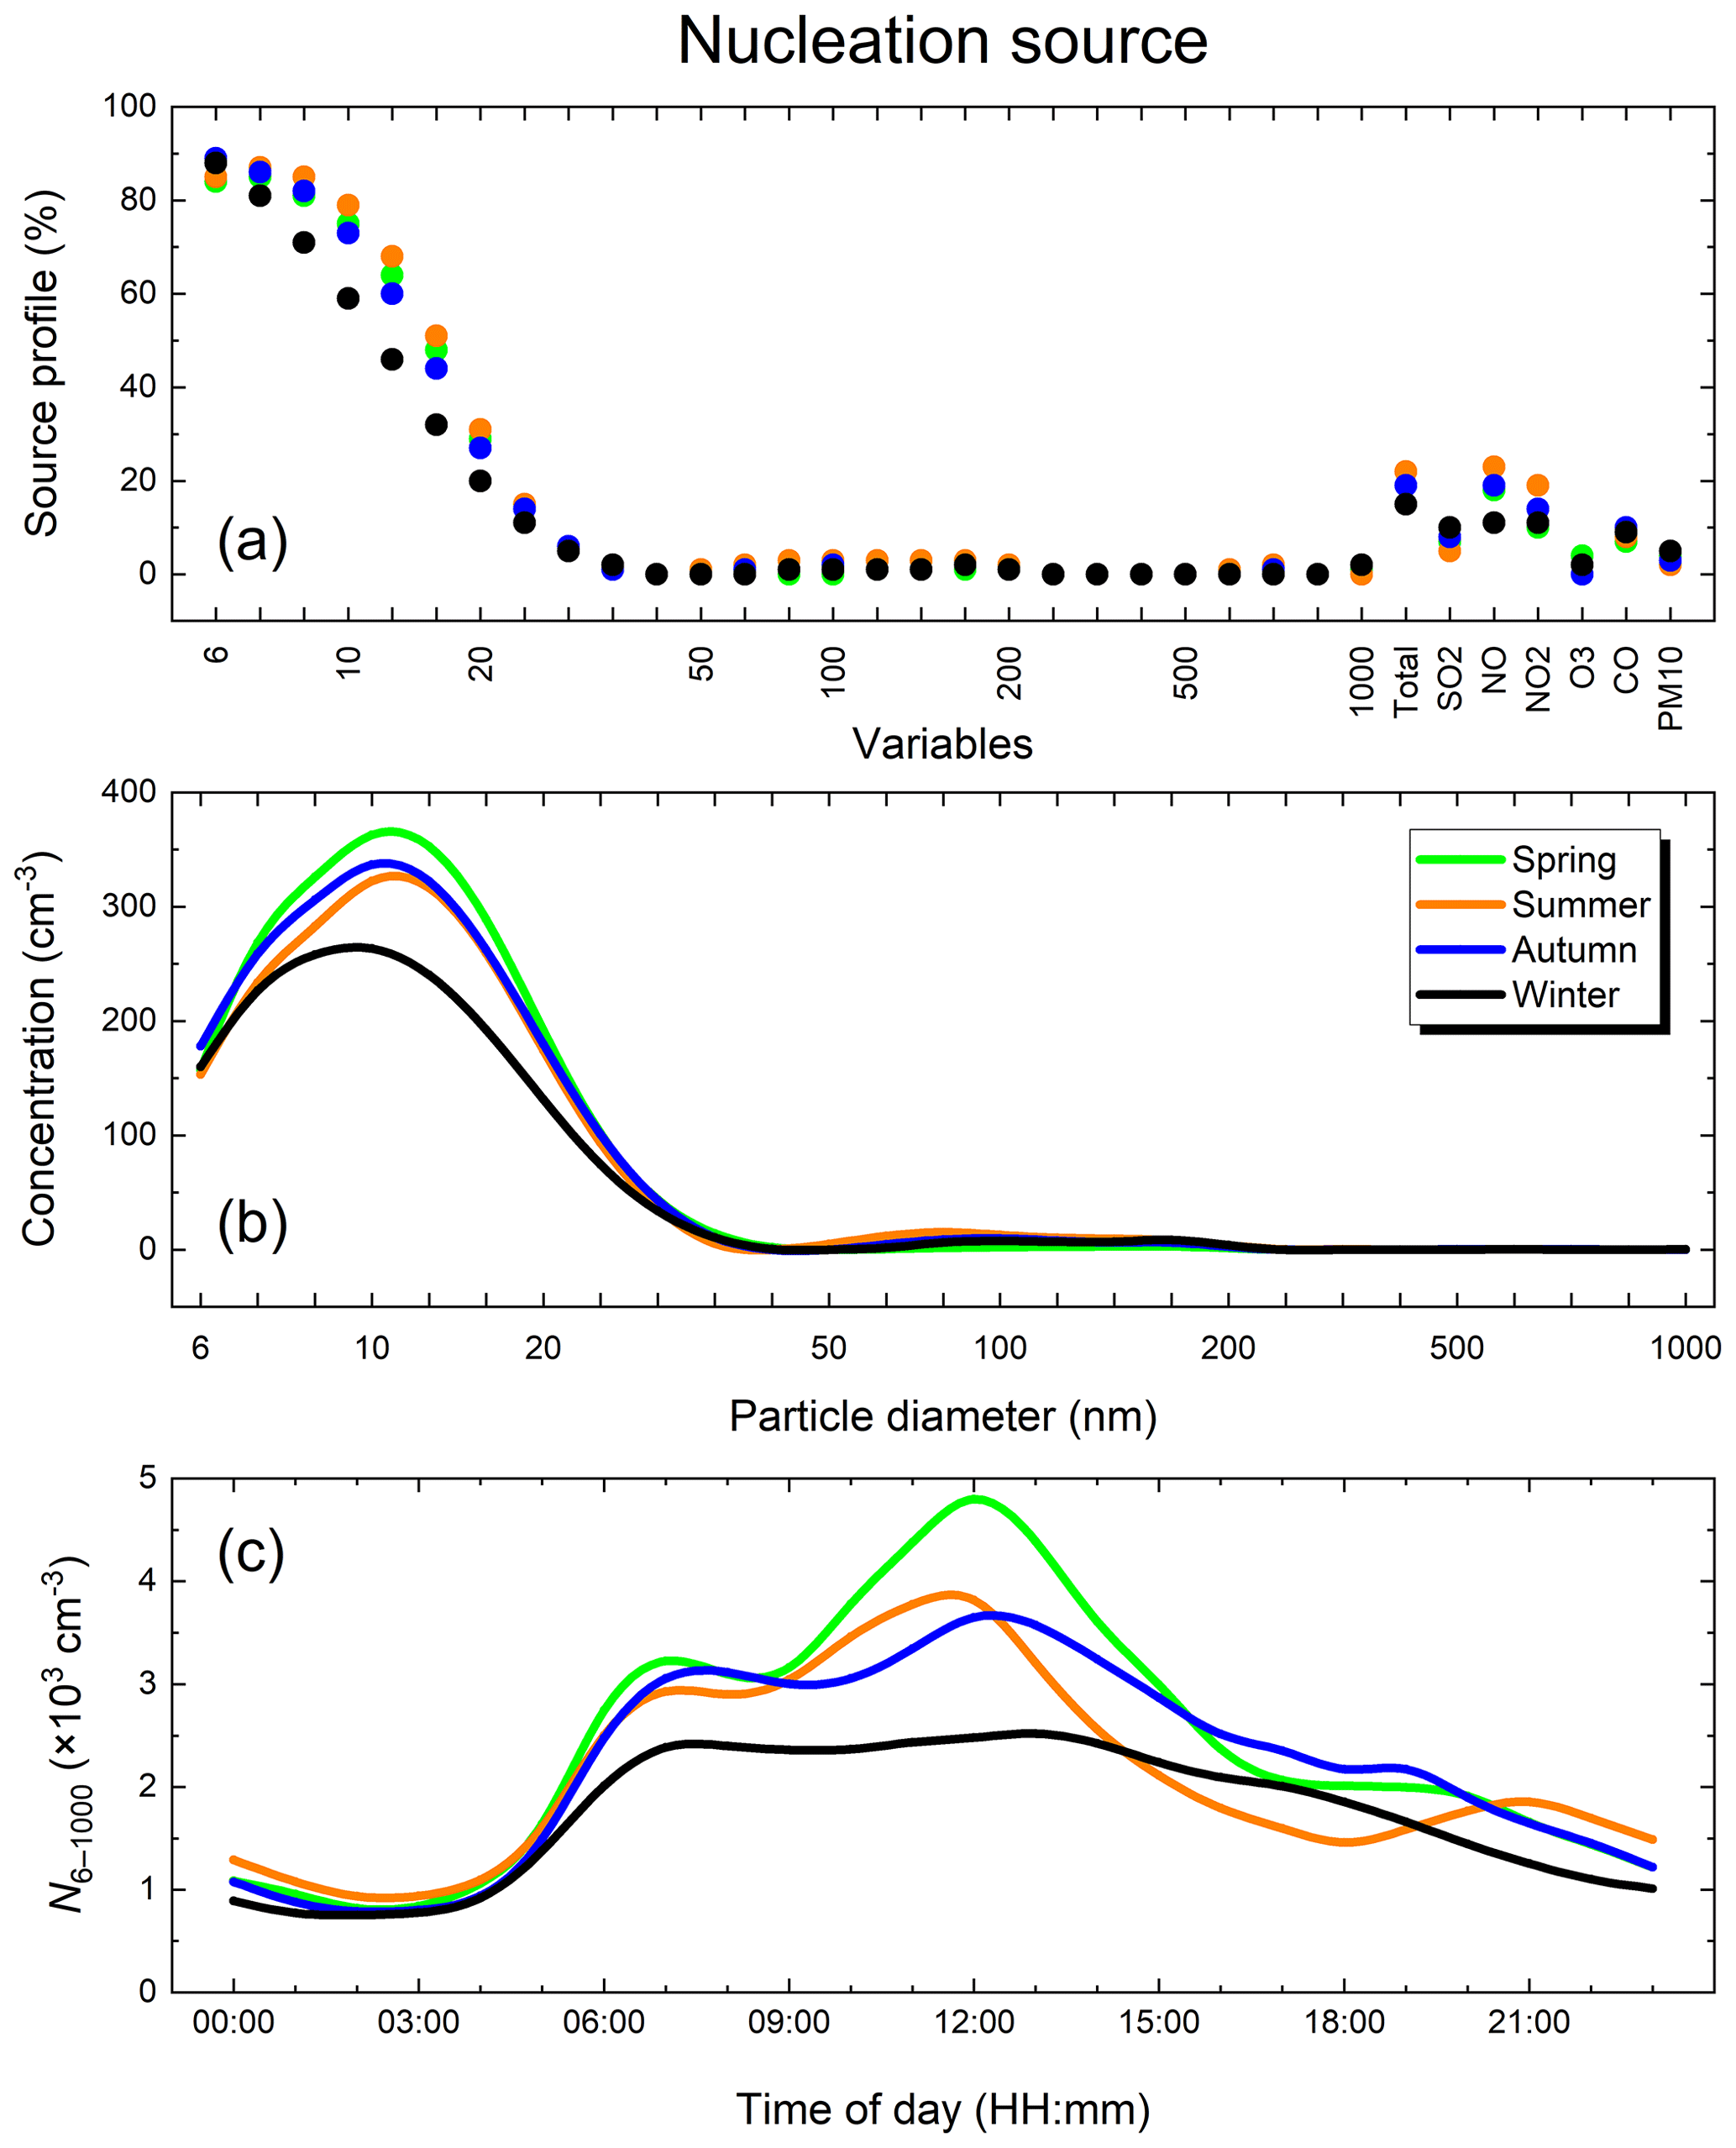
Figure 2(a) Relative factor profiles, (b) factor contributions to the particle number concentrations in the size channels and (c) mean diel variations in the total particle number concentration (N6–1000) assigned to the compound nucleation source in the uncorrected PMF modelling for spring, summer, autumn and winter. The exact diameters of the size channels are listed in Sect. 2.1.
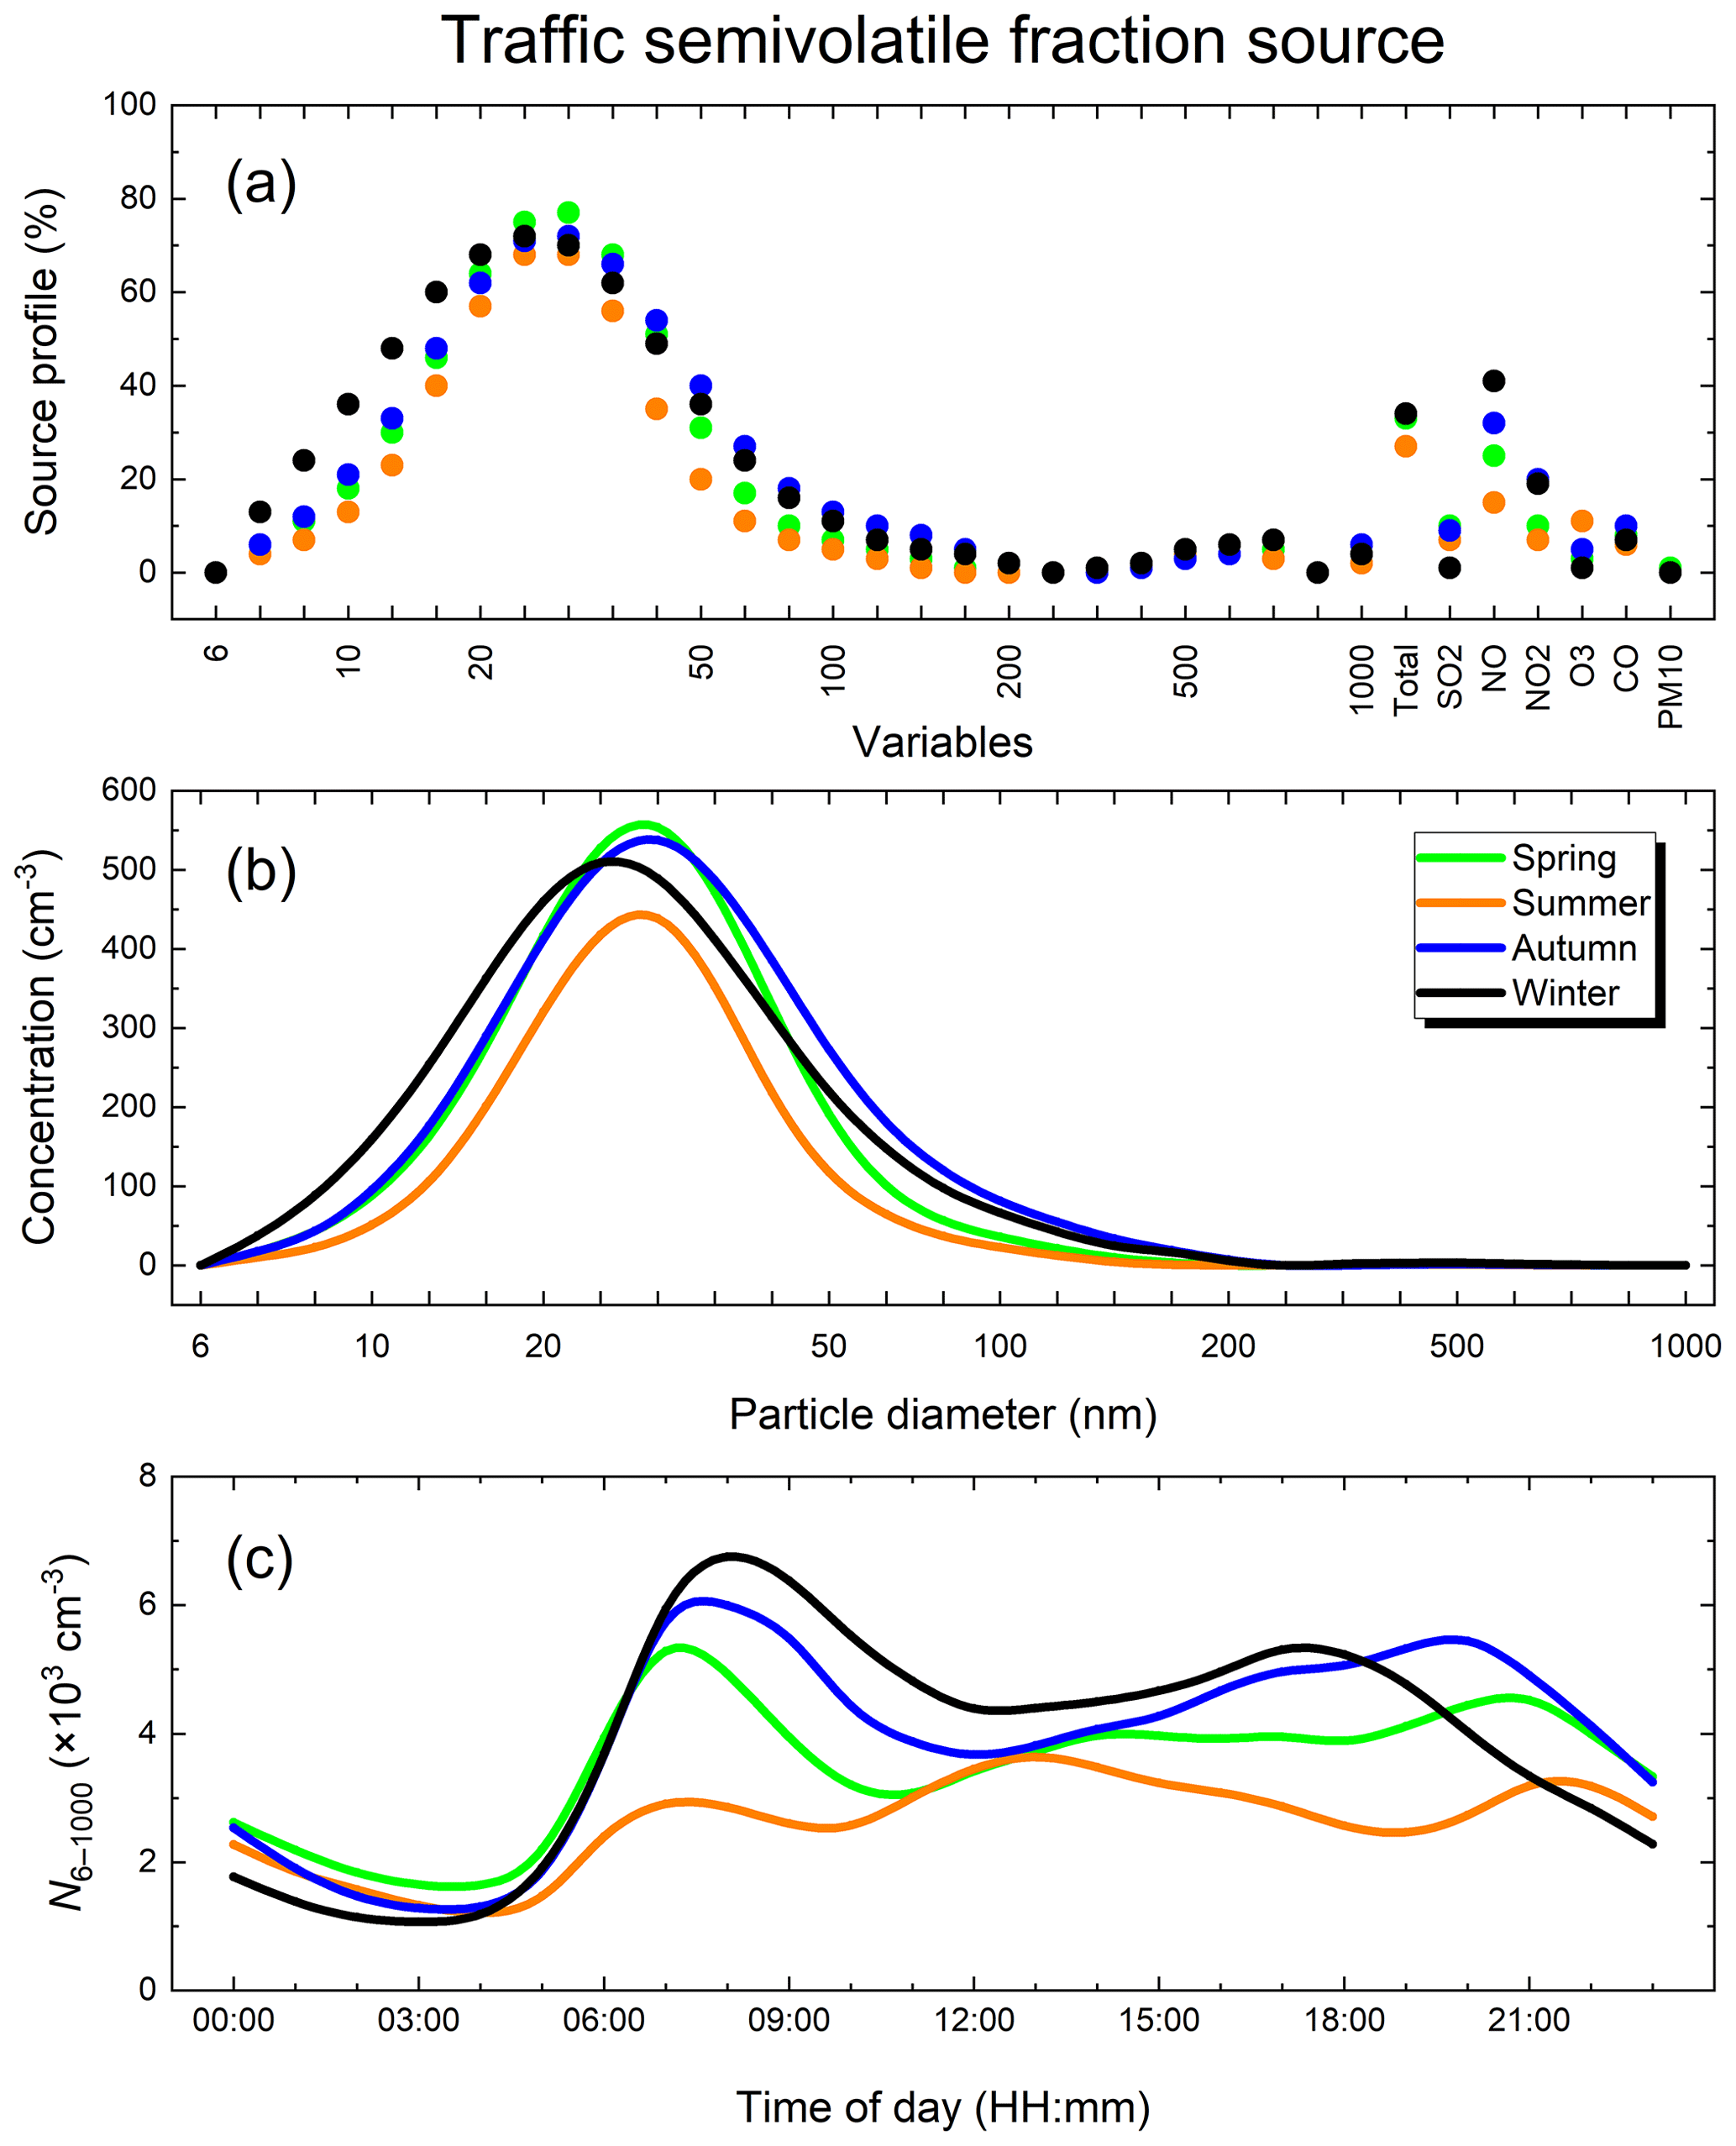
Figure 3(a) Relative factor profiles, (b) factor contributions to the particle number concentrations in the size channels and (c) mean diel variations in the total particle number concentration (N6–1000) assigned to the source of semi-volatile aerosol species emitted by road vehicle traffic (traffic-svf) in the uncorrected PMF modelling for spring, summer, autumn and winter. The exact diameters of the size channels are listed in Sect. 2.1.
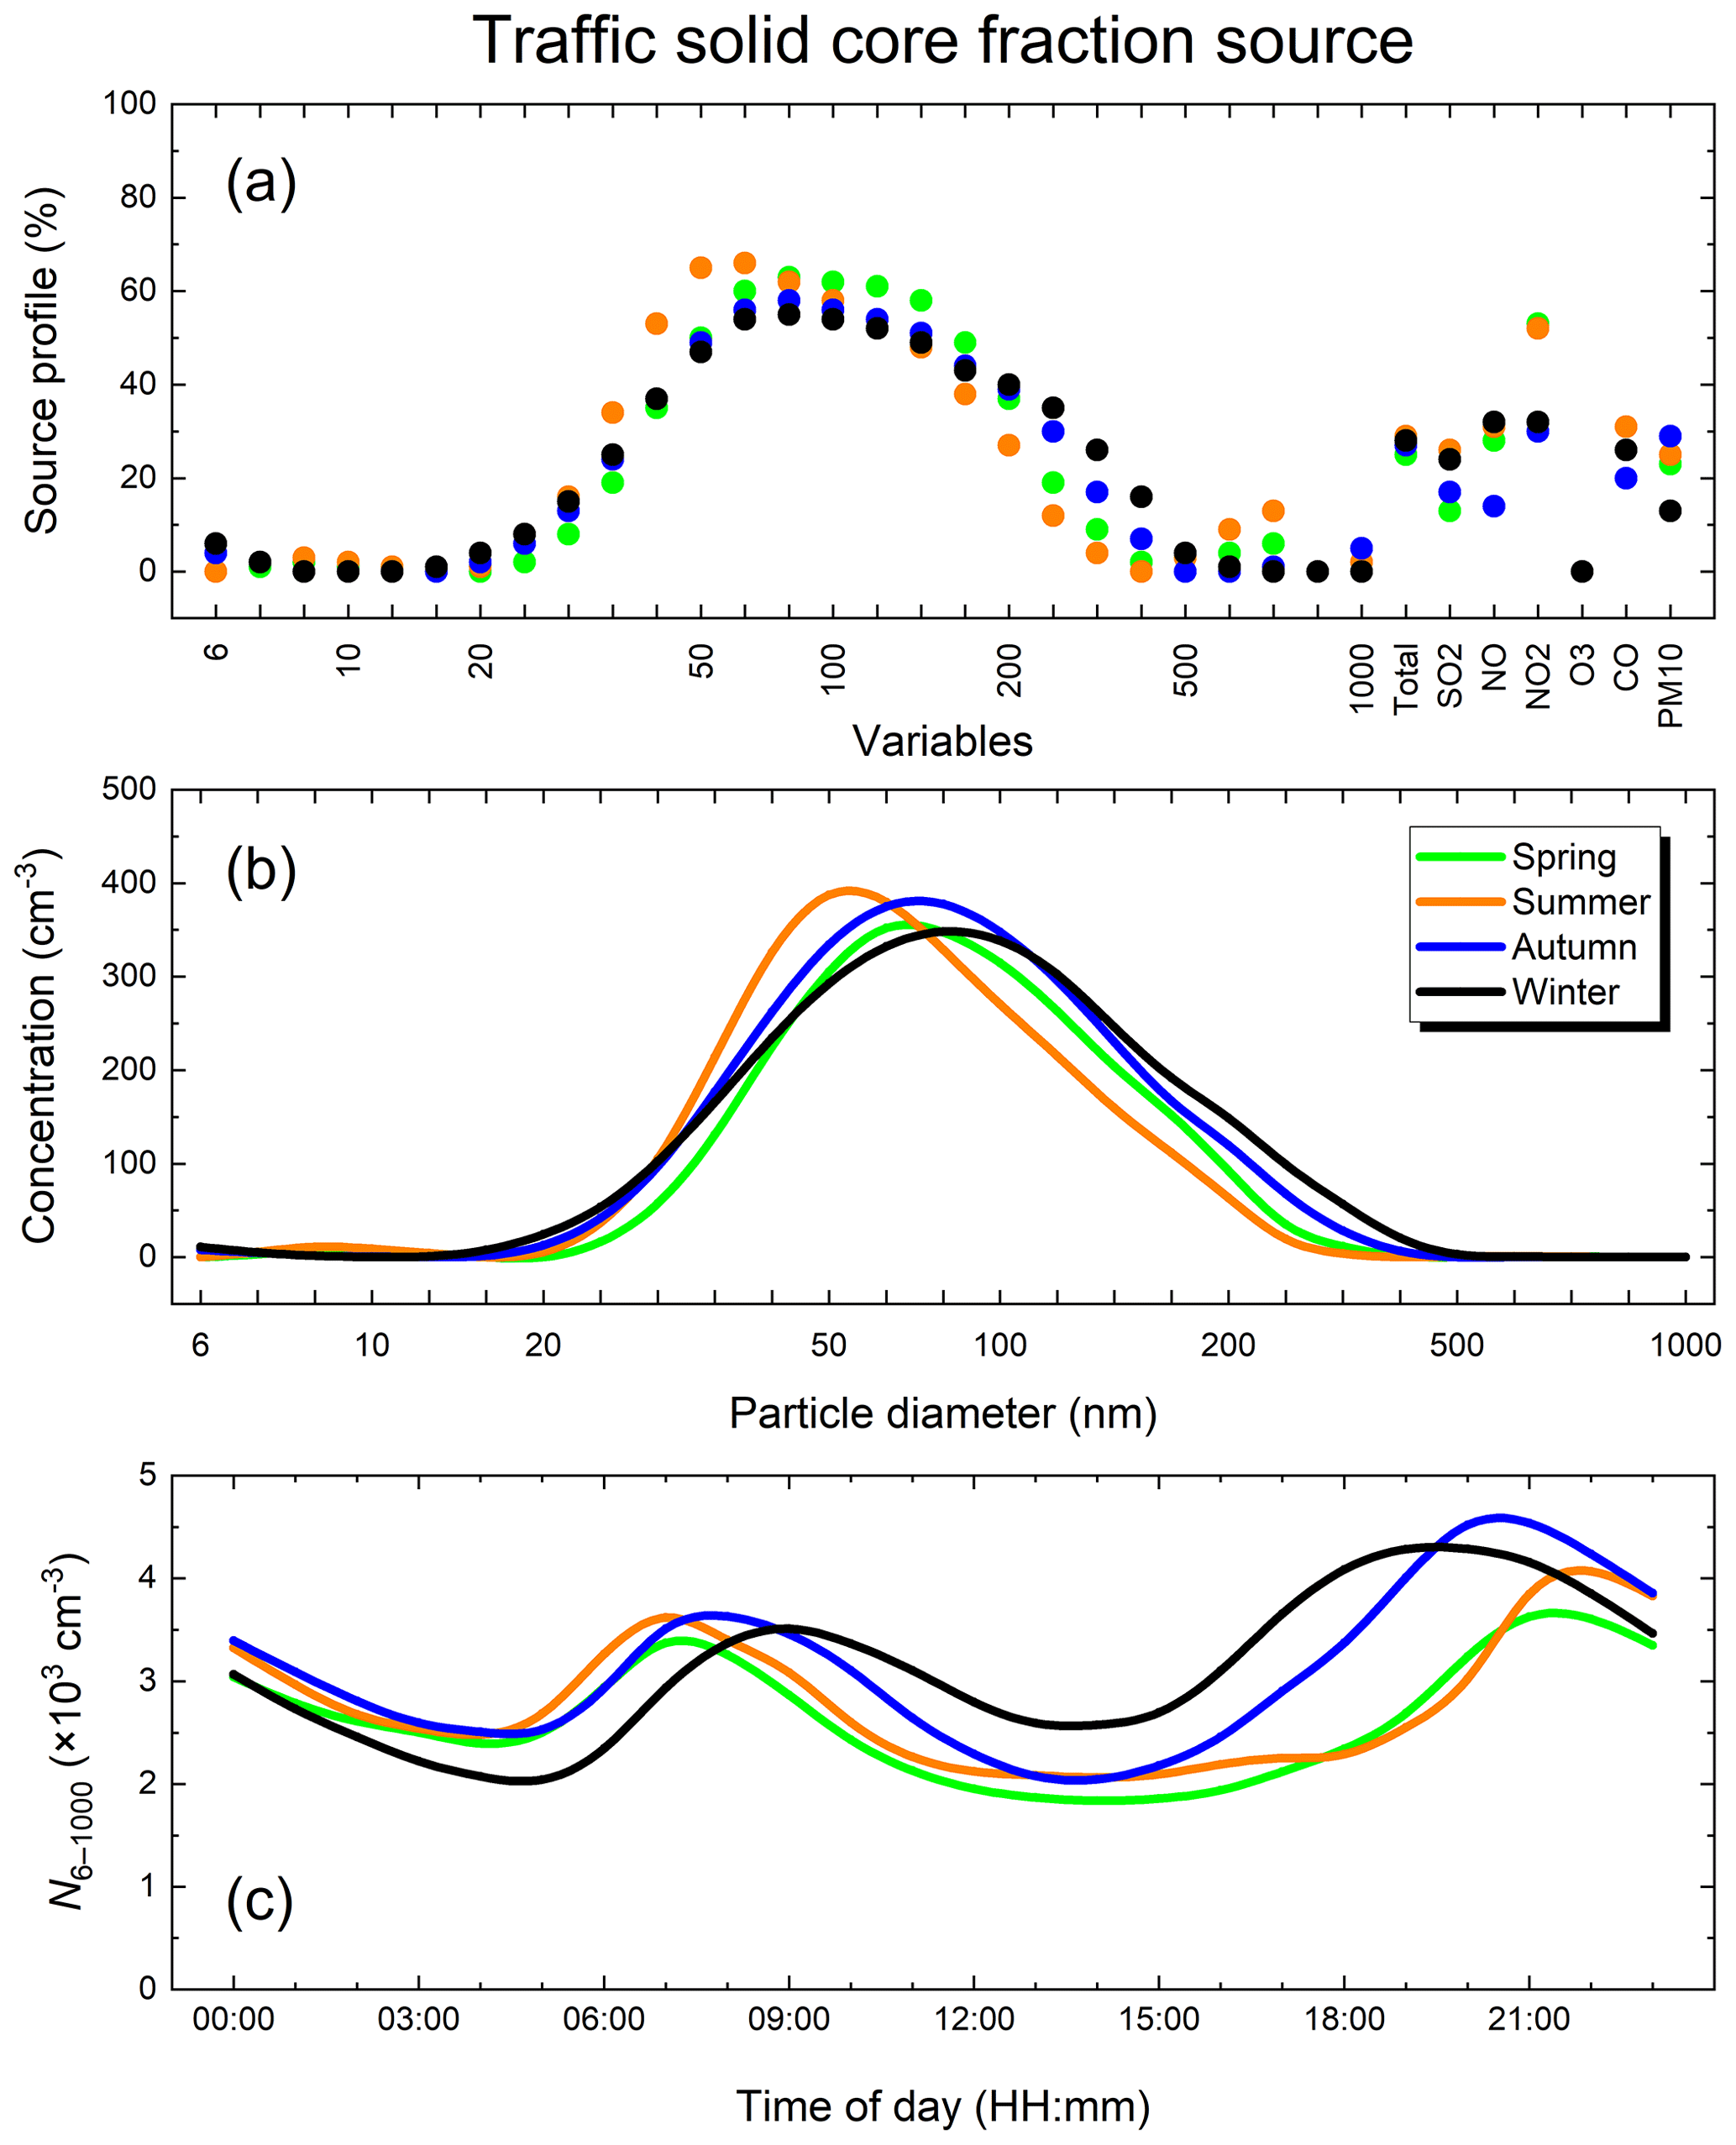
Figure 4(a) Relative factor profiles, (b) factor contributions to the particle number concentrations in the size channels and (c) mean diel variations in the total particle number concentration (N6–1000) assigned to the source of solid aerosol species emitted by road vehicle traffic (traffic-sf) in the uncorrected PMF modelling for spring, summer, autumn and winter. The exact diameters of the size channels are listed in Sect. 2.1.
3.2 Interpretation of the factors
The regression lines of the measured and uncorrected modelled N6–1000 concentrations are shown in Fig. S6. The curves and their statistics indicate that the PMF modelling yielded reasonable agreement with the experimental data. Based on the selection criteria described in Sect. 2.2, final solutions consisting of six factors were accepted for both the uncorrected and dispersion-corrected datasets in each season. More factors resulted in unreasonable splitting of some factors (even in winter), whereas a smaller number of factors yielded questionable merging of the factors. The approved solutions represent a physically sensible approximation for Budapest. The PMF results derived from the uncorrected input data are interpreted in Sect. 3.2.1–3.2.5. The related plots for the three major sources are displayed in the article (Figs. 2–4), whereas those for the remaining three sources are shown in the Supplement (Figs. S10–S12) to communicate our primary messages in a focused manner. The directionality plots of the sources for the uncorrected PMF modelling are presented in Fig. S19.
3.2.1 Nucleation
The factor associated with the smallest particles in our experimental setup was characterized by a single mode in the source profile with a diameter range from 6 to 25 nm (Fig. 2a). This range ordinarily represents the nucleation mode in NPF studies (Kerminen et al., 2018) and corresponds to its typical time-averaged evolution (e.g. Salma and Németh, 2019). The contributions of the factor to the concentrations were the largest in spring and the smallest in winter (Fig. 2b). This property coincides with the relative occurrence frequency of the NPF events in the Budapest area (the Carpathian Basin; Salma et al., 2016b, 2021). The diel variations for the N6–1000 concentration of this factor showed the highest intensity at 12:00 LT in all seasons, with the largest peak in spring and with the smallest peak (if any) in winter (Fig. 2c).
The time series unambiguously indicated additional peaks in the early-morning and evening rush hours in addition to the midday peak (Figs. 2c and S7a and b). This factor also exhibited non-negligible association with NO, NO2 and CO to varying degrees (Fig. 2a). These results suggest that there is connection between this factor and the road vehicle traffic, particularly in non-winter seasons. The compound character of the factor was recognized earlier (Rivas et al., 2020). In our results, the importance of the traffic-related sub-factor was higher on weekdays compared to weekends (particularly in the early-morning rush hours on Sunday) when the traffic intensity is lower (Fig. S7a). The small peak at ca. 110 nm could be generated by heterogeneous nucleation of semi-volatile organic compounds mostly on primary carbonaceous aggregates (soot particles), which is a process likely to occur in rapidly diluting and cooling air due to the turbulence caused by road vehicles. It could equally be a modelling artefact since in this diameter range, enlarged displacement intervals happened.
This factor is interpreted as atmospheric nucleation that is a combination of photochemically induced nucleation with traffic-related nucleation. The former process occurs on regional or urban spatial scales around 12:00 LT. Traffic-related nucleation in cities can happen when the gas-phase vapours and gases in the exhaust of vehicles cool, and the resulting supersaturated vapours likely nucleate near but outside the source (Charron and Harrison, 2003; Kittelson et al., 2022). The process yields particles which may be called primary because they form upon dilution of the exhaust plume but have also been called delayed primary particles (Rönkkö et al., 2017) since they are generated outside the source (the tailpipe). This explains why the traffic circulation patterns showed up in the time series of this factor.
The nucleation source in spring (when its relative occurrence frequency is the largest) was associated with winds from the south and southeast and with high WS (Fig. S19). This conclusion is consistent with our earlier findings (Németh and Salma, 2014). Higher WS values often represent cleaner air in the city centre, and the relationship between the high WS and NPF occurrence is in line with our earlier observations in Budapest (Salma et al., 2021). In winter, the source directionality plot was featureless.
3.2.2 Traffic emissions
There were two factors, both of which showed a unimodal source profile in the Aitken mode, which indicates that these were primary particles (Figs. 3a and 4a). Both factors were strongly associated with NO, NO2 and CO as well. These gases are related to combustion processes. The time series of the concentration contributions of the two factors clearly followed the daily pattern of the vehicle circulation in Budapest and were larger on weekdays than on weekends (Figs. 3c, 4c, S8a and d and S9a and d). They both can be related to direct emissions from road vehicles with internal-combustion engines. There were, however, several differences between the two factors that discriminate them from each other.
One of the road traffic emission factors showed the largest contributions to the particles with a diameter of 25–35 nm (Fig. 3a). Its concentration contributions resulted in a mode that was the smallest in summer (Fig. 3b). The diel variability in the factor also showed different magnitudes over seasons. The seasons were characterized by diverse seasonal mean T values from 3 to 23 °C (Table S2). The contributions to the total particles were the largest in winter, large in autumn and spring, and the smallest in summer (Fig. 3c). This points to the presence of chemical constituents with semi-volatile physicochemical properties. The curves for summer contained a midday peak in addition to the rush-hour peaks, which could be related to the altered traffic pattern (with a peak at 12:00 LT) in Budapest on summer holidays.
Based on these reasons and consistent with earlier conclusions (Robinson et al., 2007; Morawska et al., 2008; Rönkkö et al., 2017; Harrison et al., 2018; Kittelson et al., 2022; Rowell et al., 2024), this factor is interpreted as an emission source of semi-volatile aerosol fraction from road vehicle traffic (traffic-svf). Considering that diesel vehicles are responsible for a large portion of the exhaust particle numbers from road traffic in Europe (Damayanti et al., 2023), the important concrete source is the emissions from diesel engines. The emissions from gasoline combustion in spark ignition engines likely contribute as well, which can be inferred from the differences in the diel patterns of the two traffic-related emission sources over the week (Fig. S8a vs. Fig. S9a). The naming and detailed interpretation of this factor vary in the literature such that it may be called emissions from gasoline vehicles (Liu et al., 2014) or fresh traffic emissions (Rivas et al., 2020) or Traffic 1 (Hopke et al., 2022).
The other road traffic emission factor yielded a source profile in a broader diameter interval than the traffic-svf source (Fig. 4a), with a plateau over 65–140 nm. The factor was also associated with SO2 and PM10 mass. Its contributions to particle size channels exhibited a single mode with a diameter of 90 nm, and these contributions were more stable over the seasons as far as the magnitude and shape are concerned (Fig. 4b). The shares of this factor on the N6–1000 concentration did not seem to be influenced by T in various seasons (Fig. 4c).
Based on these reasons and consistent with earlier studies (Shi and Harrison, 1999; Maricq et al., 2002; Rönkkö et al., 2017; Kittelson et al., 2022; Damayanti et al., 2023; Rowell et al., 2024), this factor is interpreted as the source of solid aerosol species emitted by road vehicle traffic (traffic-sf). These particles likely consist of a carbonaceous aggregate (soot) or of a metal core coated with varying amounts of low-volatility organic and inorganic compounds. Under some conditions, the metal compounds even stick to the soot particles (Kittelson et al., 2022). The most important source contributing to this factor is the emissions from heavy- and light-duty vehicles (Zhang et al., 2020), which typically contain diesel-powered engines in Hungary. Chemically and physically aged traffic particles can be partly involved as well (Robinson et al., 2007). The naming and the detailed interpretation of this factor vary in the literature; e.g. emissions from diesel vehicles (Ogulei et al., 2007) or Traffic 2 (Hopke et al., 2022) have been used.
Both traffic emission sources were related to local spatial scales in all seasons except for summer (Fig. S19). In the latter case, more distant regions and larger WS values prevailed. The source origin was related to smaller WS particularly in winter and was shifted to more regional scales with WS in spring.
3.2.3 Diffuse urban source
Another factor showed a profile with broad peaks at ca. 100 and 500 nm (Fig. S10a). It also contained several air pollutants including PM10 mass (typically 30 % and up to 50 % in winter) and combustion-related pollutants such as CO, SO2, NO and NO2. The profile and contributions also included a small portion of smaller particles (around d = 20 nm). The concentration contributions exhibited multiple structured peaks between 70 and 500 nm, which showed elevated levels in winter and autumn and low values in summer and spring (Fig. S10b). Its diel variations from spring to autumn displayed an early-morning peak and an evening peak (with a higher level in autumn and lower levels in spring and summer). This pattern could be related to secondary particle formation from gas-phase precursors present in vehicle exhaust when it is fully diluted within the ambient air and oxidized by reactive atmospheric species. In such cases, the particles can grow by condensation. In winter, its diel variation was at the highest level and was eventually featureless (Fig. S10c).
Based on these considerations and on earlier studies (Beddows et al., 2015; Beddows and Harrison, 2019; Chandrasekaran et al., 2011; Vratolis et al., 2019; Wang, K. et al., 2019), this factor is interpreted as a source of diffuse (fugitive) urban aerosol. Important concrete sources contributing to it are aged combustion emissions from various boilers and heating equipment used for residential heating or cooking. Burning residual oil and flaming combustion of solid fuels produce distributions with a modal diameter of approximately 100 nm, while efficient combustion of gases and low-viscosity oil in stationary burners generates smaller particles (with a diameter of ca. 20 nm; Hopke et al., 2022, and references therein). In principle, resuspension of road and soil dust particles could also contribute (Conte and Contini, 2019) as a minor factor in Budapest. This factor has been called urban background (Beddows and Harrison, 2019) or heating (Hopke et al., 2022).
This factor was linked to local spatial scales and low WS in all seasons (Fig. S19), which is in accordance with its interpretation.
3.2.4 Secondary inorganic aerosol
One of the further factors exhibited a source profile with a relatively narrow mode at a diameter of 800–1000 nm and a broad mode from 50 to 150 nm (Fig. S11a). The mode with the larger diameter was present in all seasons with similar shapes to each other, but its concentration contributions were negligible (Fig. S11b). The smaller-diameter mode in the source profile was the highest in spring, lower in summer and missing in autumn and winter (Fig. S11a). Its concentration contributions in the size channels were modest. The shares over a broad size range from 30 to 170 nm were larger with a maximum of 120 cm−3 in spring, and 70 cm−3 in summer (Fig. S11b). The corresponding contributions in autumn and winter were negligible.
Based on these reasons and on earlier results (Squizzato et al., 2019; Hopke et al., 2022, and references therein), this factor is ascribed to sources of secondary inorganic aerosol (SIA) containing mostly sulfate and nitrate particles. An important concrete source could be their secondary formation from gaseous precursors in motor vehicle exhaust (Yoshizumi, 1986). The sulfate particles in the air are produced in a size mode around 100 nm in summer and spring, when the photochemical activity is larger (Yoshizumi, 1986). Consequently, their formation in winter is lower. The ammonium nitrate particles behave contrary to this. They are mainly present in a size mode at ca. 250 nm and are present in winter, when the thermal dissociation of ammonium nitrate is low (Kadowaki, 1977; Squizzato et al., 2019). The seasonal tendencies and size modes suggest that sulfate particles prevailed over nitrate particles in Budapest.
The multimodal directionality plots can indicate the presence of particles of both local origin and more distant origin. The latter particles were likely influenced by gas-to-particle conversion or other atmospheric or cloud processing (Ogulei et al., 2007; Squizzato et al., 2019). The SIA was mainly relevant in spring and summer (see Sect. 3.3), with prevailing southeast and possibly northwest wind directions, respectively, and with high WS values (Fig. S19).
3.2.5 Secondary aerosol associated with high-ozone conditions
There was a factor associated with remarkably high O3 (> 80 %) and high SO2 (40 %–60 %) contents. It also showed a main mode in the size channels at ca. 200 nm in summer (Fig. S12a). The corresponding mode in spring was also present, but its contributions in autumn and winter became smaller. This could be caused by the large seasonal variability in O3 in Budapest (Salma et al., 2020). As far as the factor contributions are concerned, they exhibited a mode at ca. 45 nm in winter and autumn and a different mode at 150–200 nm in summer and spring (Fig. S12b). However, the absolute concentration contributions to the size channels remained extremely low (< 85 cm−3). These properties are in accordance with earlier studies, in which a variety of size patterns with multiple modes were obtained (Ogulei et al., 2007; Liu et al., 2014; Squizzato et al., 2019). The diel variation in the factor intensity during the daylight period was similar to the typical daily in situ development of O3 in cities (Fig. S12c), and the contributions were higher on weekdays compared to weekends. The intensity of the O3-associated secondary aerosol source in winter and autumn remained low in the city centre and higher in the outskirts. The directionality plots indicated associations with higher WS (Fig. S19).
This factor cannot be strictly interpreted in a conclusive manner. It is thought to be an appearance of particles of various origins that were produced by condensation of vapours generated by photochemical oxidation driven by O3 (Juozaitis et al., 1996; Hopke et al., 2022). This source may contain a substantial fraction of organic compounds. Additional input data on chemical composition would be advantageous to clarify this factor. It has been called O3-rich secondary aerosol in earlier studies (Ogulei et al., 2007; Liu et al., 2014; Squizzato et al., 2019).
3.3 Relevance of the dispersion correction
The seasonal median uncorrected modelled total particle number concentrations were 7.1, 6.8, 8.2 and 7.8 × 103 cm−3 from spring to winter. The corresponding corrected values were 9.2, 8.6, 10.3 and 9.9 × 103 cm−3. The correction did not change the source profiles considerably as far as both structure and modal properties are concerned. The associations of air pollutants to the sources were altered somewhat more in a few isolated cases, but they are weak auxiliary variables. This is demonstrated for the three major sources (cf. Figs. 2a–4a with Figs. S13a–S15a). The shapes of the source contributions also remained virtually unchanged, but the magnitudes were modified, and the curves for summer and spring were separated from the lines for autumn and winter (cf. Figs. 2b–4b with Figs. S13b–S15b). These changes are to be interpreted together with the alterations in the seasonal total particle number concentrations also caused by the dispersion correction. Their combined effect is captured by the mean relative concentration contributions of the sources, which is an expressive quantity.
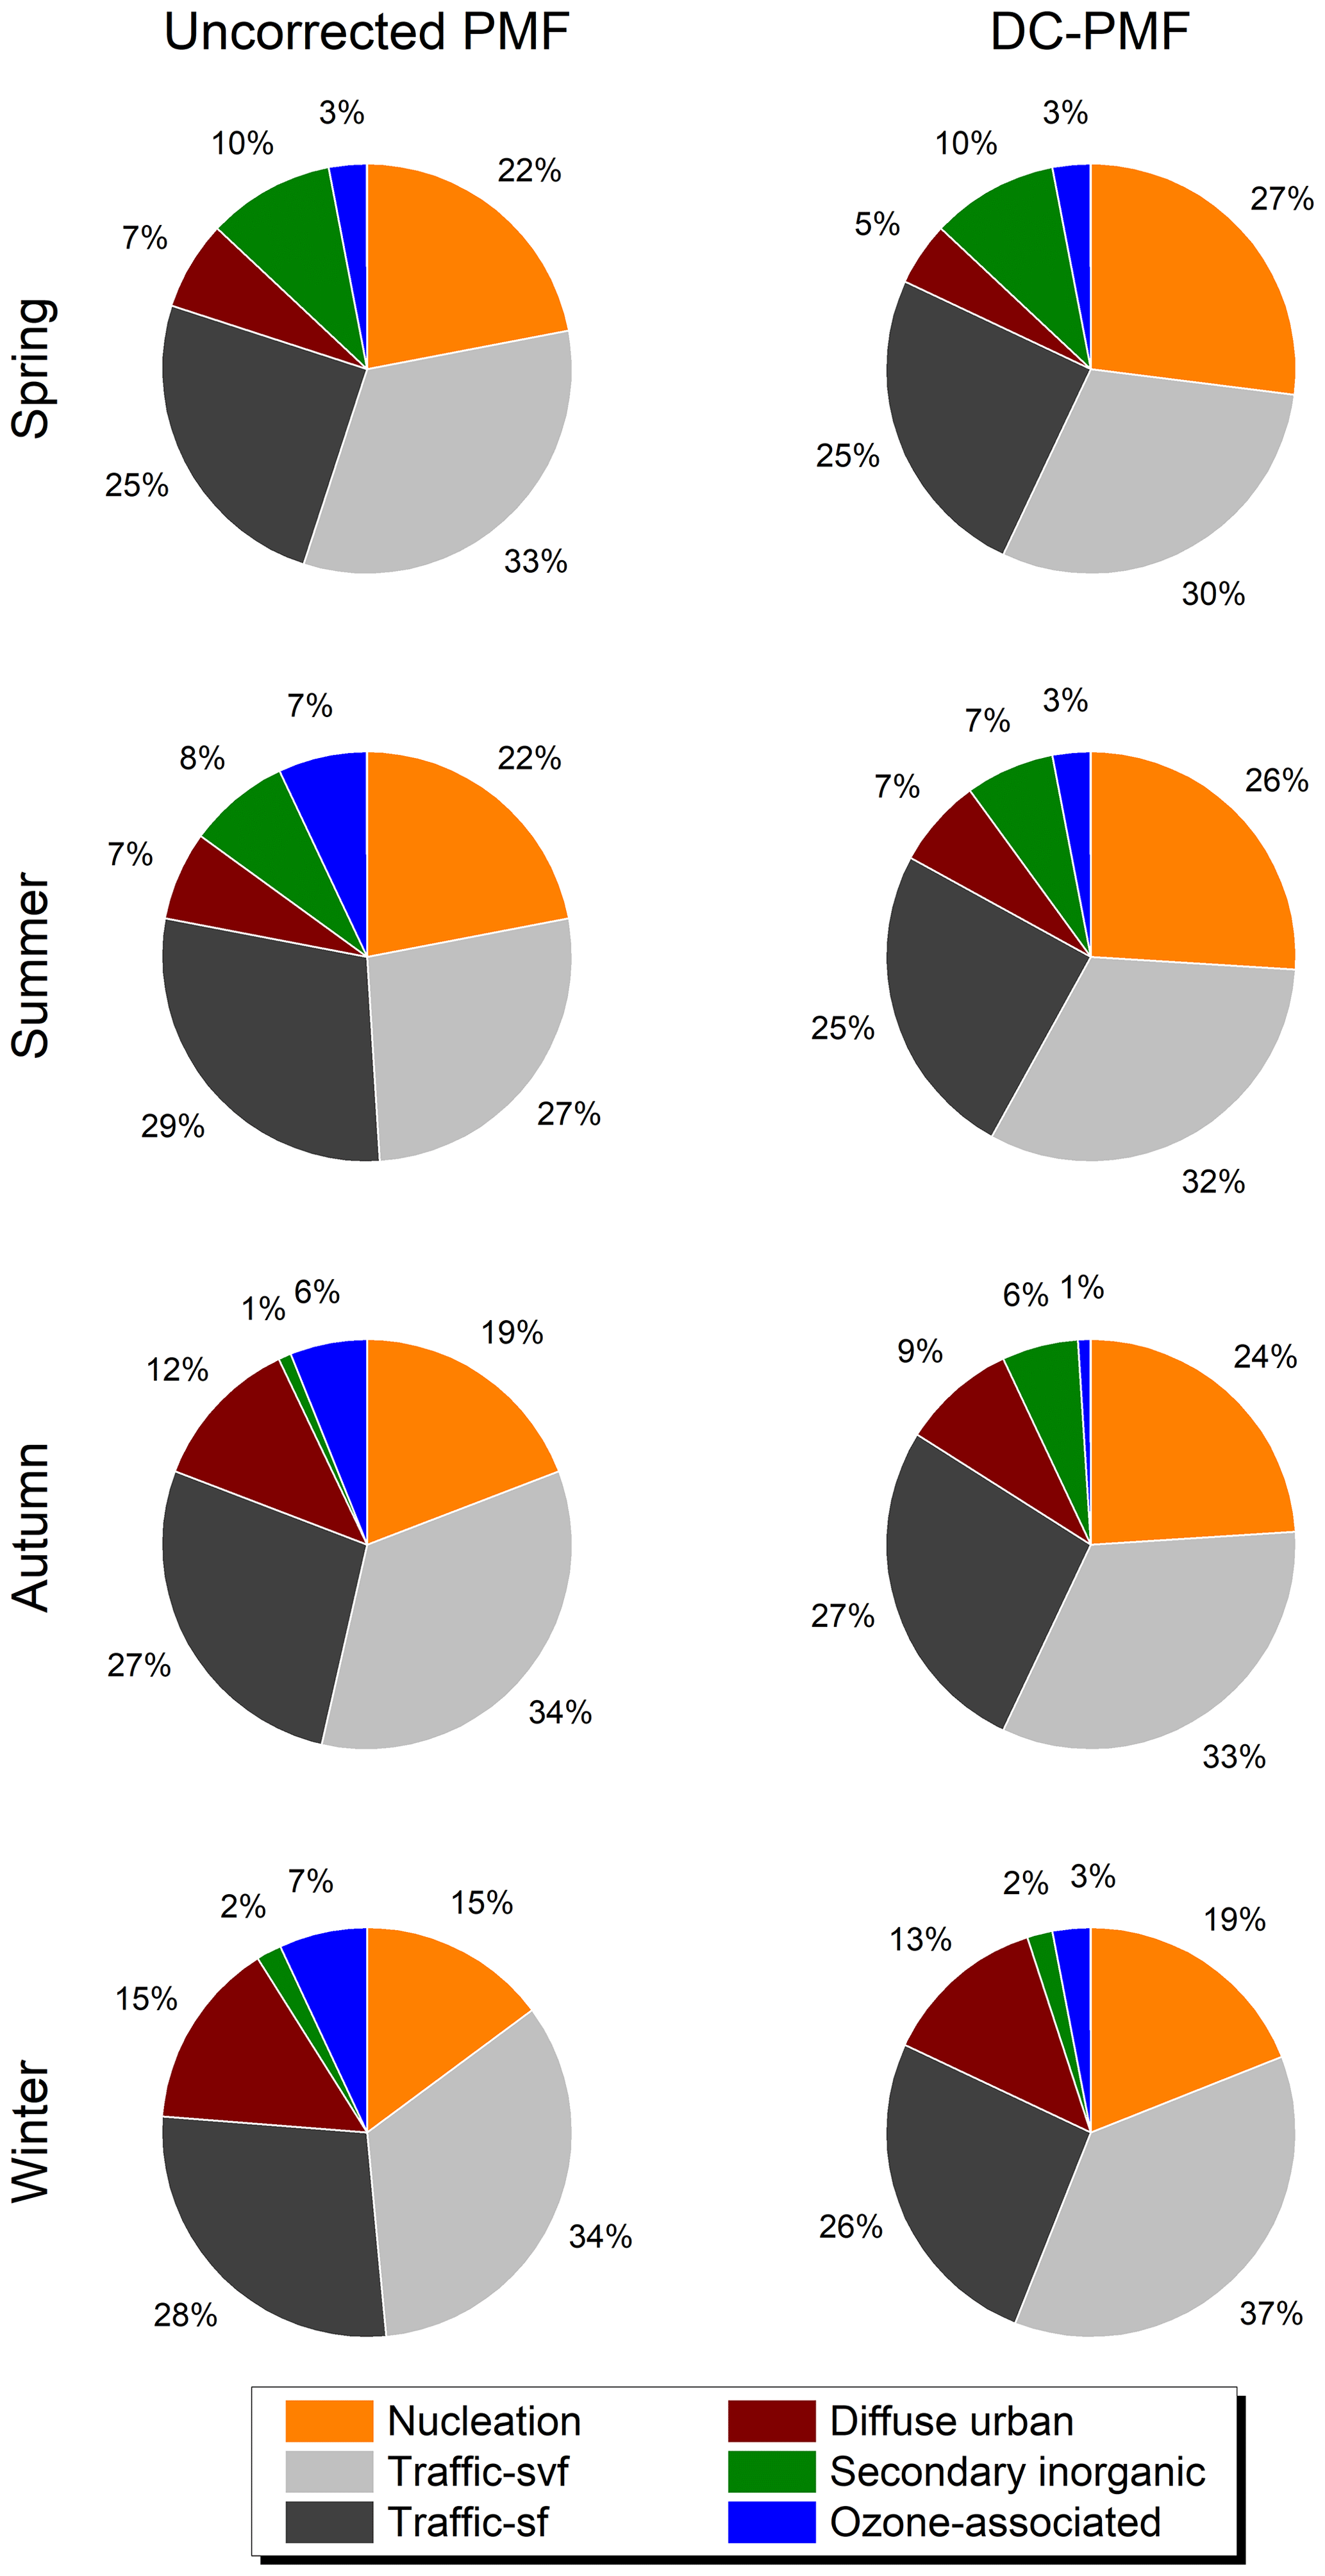
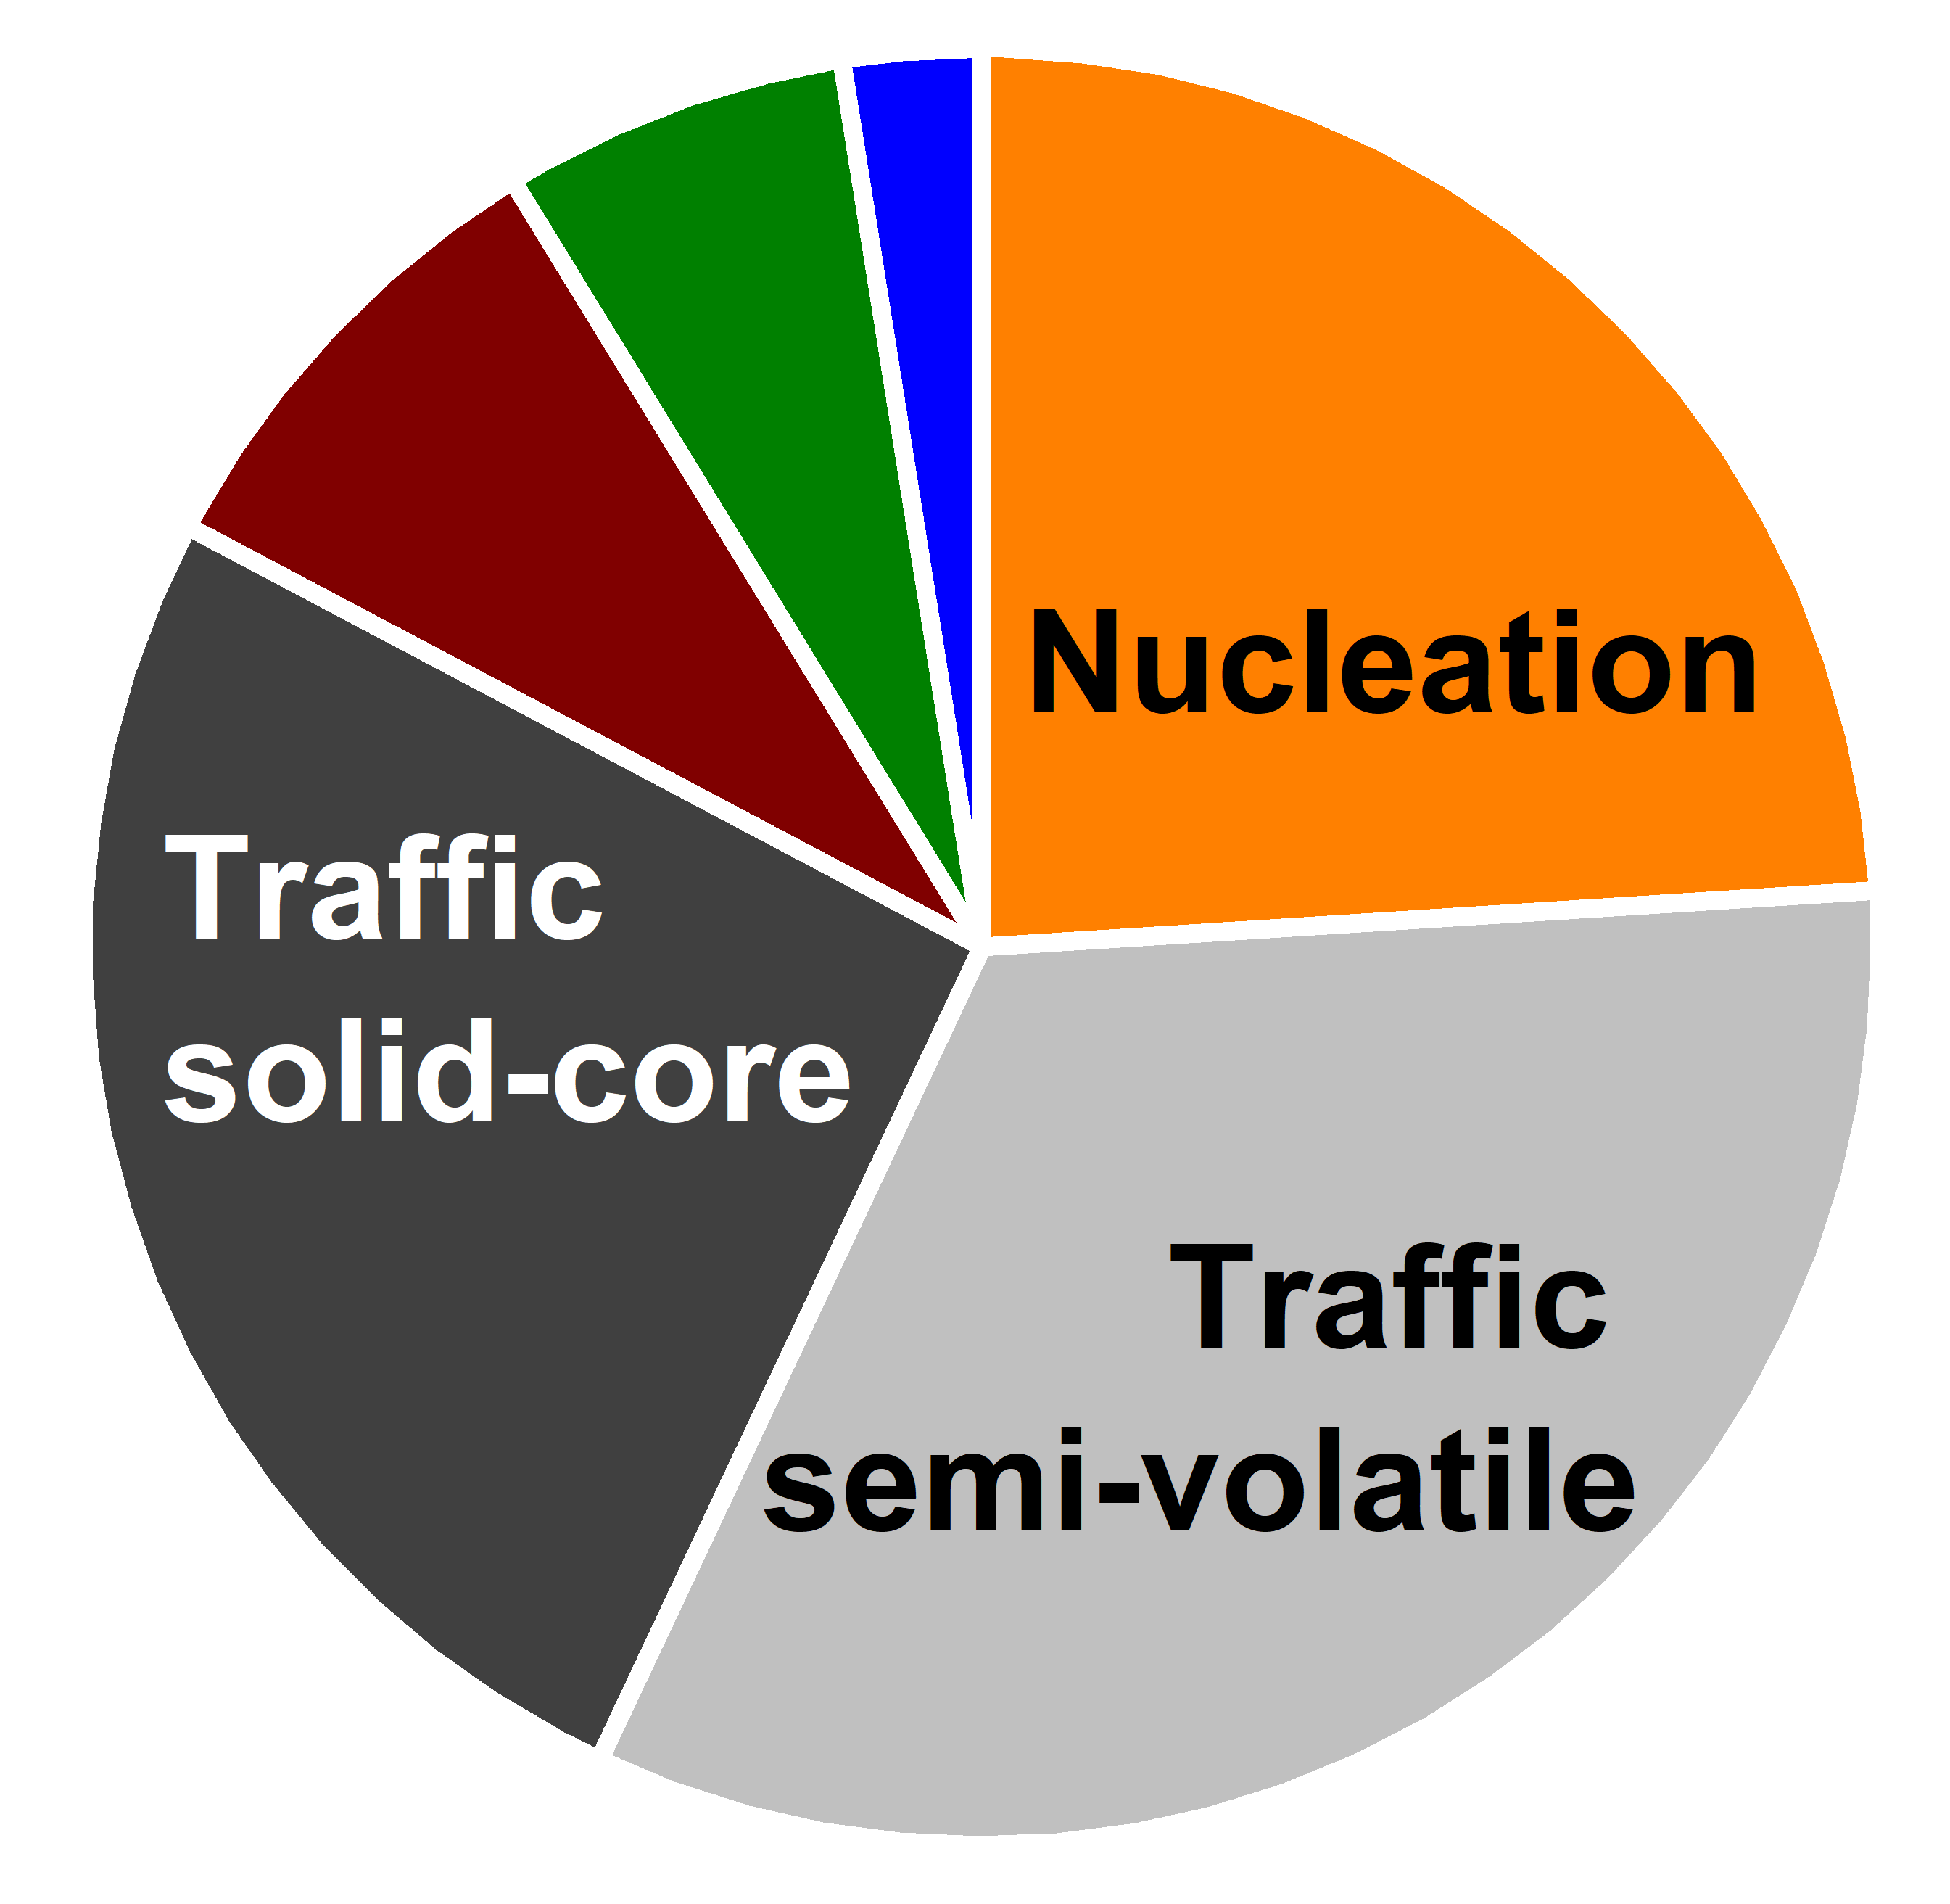
Figure 5Mean relative contributions of the nucleation source, the road vehicle traffic semi-volatile fraction source (traffic-svf), the road vehicle traffic solid-core fraction source (traffic-sf), the diffuse urban source, the secondary inorganic aerosol source and the ozone-associated secondary aerosol source to the modelled total particle number concentrations obtained using the uncorrected PMF modelling (left column) and the dispersion-corrected PMF (DC-PMF) modelling (right column) in spring, summer, autumn and winter.
The effect of the dispersion correction on the seasonal mean relative source contributions is shown in Fig. 5. The correction increased the contribution of the nucleation from 20 % to 24 %, thus by a relative ratio of 23 % on an annual basis. The ratio was the largest (27 %) in winter and the smallest (18 %) in summer. The dispersion correction was relevant for the nucleation source, the photochemically driven component of which usually takes place during the midday period. At the same time, the correction did not alter the contributions of the traffic sources. Larger differences were observed for the low (⪅ 10 %) contributions, but these results raise the question of interpreting ratios obtained from small absolute values.
The mean diel variations in the source types for uncorrected PMF and DC-PMF modelling are summarized in Figs. S16–S18 for separate seasons. For all sources, the corresponding curves essentially exhibited the same time patterns, while they were vertically shifted to higher or lower levels from each other. There were no obvious tendencies in the extent and directions of the shifts except for nucleation, for which all corrected curves were above the uncorrected lines.
It was demonstrated earlier (e.g. for Budapest most recently in Salma et al., 2020) that the local meteorological properties can influence the ambient atmospheric concentrations and size distributions in cities to a comparable extent to the changes in the source intensities (Li et al., 2023). The dispersion correction was introduced to remove a large part of the extra covariance between the variables, which is frequently or enduringly caused by the common effect of meteorology on all concentrations. This basic motivation already implies that the corrected concentrations and concentration contributions are expected to be closer to reality and of higher reliability than their uncorrected counterparts. At the same time, the correction did not considerably alter the source profiles and temporal behaviours or patterns. Furthermore, some previous papers have also demonstrated the value of the dispersion correction in estimating the source contributions (e.g. Dai et al., 2020, 2021; Hopke et al., 2024).
The conditional bivariate probability plots obtained from both the uncorrected PMF model and the DC-PMF models indicated qualitatively comparable properties and behaviours. The differences in the directionality plots were obtained by subtracting the uncorrected PMF results from the DC-PMF results (Fig. S19). The corrected PMF could change the source origins in many cases. In this respect, the DC-PMF can also provide important added value to the spatial distributions. More interpretations will be available after gaining further experience and expertise in future studies.
3.4 Importance of the sources
The mean relative contributions of the sources to the total modelled concentrations derived by both the uncorrected PMF approach and the DC-PMF approach are displayed in Fig. 5 for separate seasons. The relative contributions of unaccounted-for sources with respect to the measured N6–1000 concentrations were estimated to be ⪅ 2 %. It is the DC-PMF results that are interpreted here because they are expected to be more reliable than the uncorrected results, as shown in Sect. 3.3.
The overall mean relative contribution of the road vehicle traffic emissions was 59 %; 33 % for traffic-svf and 26 % for traffic-sf. The latter source did not show a tendency in the seasonal variability, while the former source was somewhat enhanced in winter possibly due to lower ambient T in this season (Table S2). The values seem to be in line with those in other large cities (Beddows et al., 2015; Brines et al., 2015; Liu et al., 2014; Squizzato et al., 2019; Rivas et al., 2020; Hopke et al., 2022, and references therein). The similarity was obtained despite the fact that the emissions from vehicles depend on multiple conditions, for instance on the car fleet, general technical conditions of vehicles, properties of fuels and lubricants used, driving conditions, ambient T, RH and even the distance to the nearest road (Rönkkö et al., 2017; Kittelson et al., 2022).
The nucleation source was responsible for 24 % of the particle numbers annually. It was the largest (27 %) in spring and the smallest (19 %) in winter. This seasonal tendency is partially linked to the monthly distribution of the NPF event occurrence frequency (which has a maximum in spring and a minimum in winter in the Budapest area; Salma et al., 2021). The overall share of the nucleation was comparable to our earlier conclusion of 12 %–27 % (UF particles) as a lower assessment derived using the nucleation strength factor and other implicit indications (Salma et al., 2017; Thén and Salma, 2022). The present contribution can be, however, considered again as a lower estimate since an extensive portion produced by some other source types can be also related to nucleation. This is the case particularly for the SIA in summer and spring and possibly also for the urban diffuse source in winter and autumn. The former source could partly contribute to nucleation through the vapours generated from gaseous precursors (such as SO2 and volatile organics) and H2SO4 in the exhaust of road vehicles, ships or aeroplanes and in the fumes of coal-fired power plants. The urban diffuse source could be linked to nucleated particles via particle growth followed by physical and chemical ageing processes and possibly by coagulation. In addition, an unusual type of NPF event characterized by atypical time evolution and induced by some urban, industrial or leisure activities on sub-local or local spatial scales with extremely high formation rates is frequently observed in Budapest (Salma and Németh, 2019). These possibly unaccounted-for NPF events can also contribute to the particle number concentrations from the nucleation source.
The contributions from the urban diffuse and SIA source types were the largest in autumn and winter and in spring and summer, respectively (both with seasonal maxima of ca. 10 %). The O3-associated secondary aerosol made up the smallest (⪅ 3 %) mean share on an annual timescale. These tendencies are in line with our general understanding of the behaviour of the related source processes and particles.
Six main source types of particle numbers were identified in Budapest. Road vehicle emissions are the leading contributor; they were responsible for approximately 60 % of particles. This source was resolved into a semi-volatile fraction and a solid-core fraction. It seems likely that these two types do not express the emissions from gasoline- and diesel-powered motor vehicles, respectively, but that they represent two distinct groups of chemical mixtures from both types of internal-combustion engines. Nevertheless, both traffic emission sources, particularly the source which contains the solid-core fraction, are dominated by diesel motor vehicles. More importantly, the latter source is characterized by a relatively large modal diameter of 90 nm and is expected to contain high portions of insoluble particles. These two properties can yield considerably larger lung-deposited surface areas than for the traffic-svf or the other sources (except for the urban diffuse source), which results in an extraordinary particle burden for the human lung caused by this single source. Furthermore, the surface-active properties of the soot core likely represent additional risk for health outcomes.
The nucleation source was responsible for ca. 24 % of particles as a lower estimate. It displayed a compound character consisting of photochemically induced nucleation and traffic-related nucleation. There is a method available for splitting it into the two specific sub-factors using NOx as a proxy marker for road vehicle traffic (Rivas et al., 2020). However, in our datasets the coefficients of correlation between the concentration contribution of the nucleation source and NOx concentration were typically < 0.2, and adopting this method yielded unusually small photochemically induced nucleation contributions. These findings are in contrast with our earlier results, with other indirect estimations and with other suggestions as well. Furthermore, the shares of the two sub-factors are also expected to depend on several other traffic and environmental conditions such as the characteristics of the vehicle fleet, ambient T, RH, GRad or background particle concentration. Therefore, we avoided adopting this estimation for the time being and emphasize here the need to develop generally valid splitting methods and to test them on a variety of datasets.
The relatively large modal diameter of the abundant traffic solid-core fraction source also raises the question of whether the upper diameter limit of the UF particles is set to the correct value. Some important health-related metrics such as the surface area of particles or the lung-deposited surface area size distributions can largely extend above the traditional 100 nm threshold. The outlying upper part of these exposure indicators can confuse or obscure the studies of particle exposure on human health. The particle number size distributions attributed to separate sources, together with their conjugate size distributions over the whole particle diameter range, are to be further utilized in an advanced lung deposition model for characterizing and quantifying source-specific depositions in the human respiratory system.
The observational data are available from the corresponding author, Imre Salma.
The supplement related to this article is available online at: https://doi.org/10.5194/acp-24-5695-2024-supplement.
MV performed the data treatment and modelling, prepared the figures, and participated in the data interpretation and the writing of the manuscript. PKH participated in the conceptualization, the interpretation of the results and the editing. IS provided the dataset, conducted the conceptualization and participated in the interpretation of the data and the writing of the manuscript. All co-authors contributed to the discussion of the results and provided comments on the final paper.
At least one of the (co-)authors is a member of the editorial board of Atmospheric Chemistry and Physics. The peer-review process was guided by an independent editor, and the authors also have no other competing interests to declare.
Publisher's note: Copernicus Publications remains neutral with regard to jurisdictional claims made in the text, published maps, institutional affiliations, or any other geographical representation in this paper. While Copernicus Publications makes every effort to include appropriate place names, the final responsibility lies with the authors.
The authors are grateful to the present and former members of the BpART Lab for their valuable contributions over the years of operation.
This research has been supported by the Hungarian Research, Development and Innovation Office (grant no. K132254) and the New National Excellence Program of the Ministry for Culture and Innovation from the National Research, Development and Innovation Fund (grant no. ÚNKP-22-3).
This paper was edited by Veli-Matti Kerminen and reviewed by two anonymous referees.
Androna, C.: Precipitation removal of ultrafine aerosol particles from the atmospheric boundary layer, J. Geophys. Res., 109, D16S07, https://doi.org/10.1029/2003jd004050, 2004.
Ashrafi, Kh., Shafie-Pour, M., and Kamalan, H.: Estimating temporal and seasonal variation of ventilation coefficients, Int. J. Environ. Res., 3, 637–644, 2009.
Beddows, D. C. S. and Harrison, R. M.: Receptor modelling of both particle composition and size distribution from a background site in London, UK – a two-step approach, Atmos. Chem. Phys., 19, 4863–4876, https://doi.org/10.5194/acp-19-4863-2019, 2019.
Beddows, D. C. S., Harrison, R. M., Green, D. C., and Fuller, G. W.: Receptor modelling of both particle composition and size distribution from a background site in London, UK, Atmos. Chem. Phys., 15, 10107–10125, https://doi.org/10.5194/acp-15-10107-2015, 2015.
Belis, C. A., Pernigotti, D., Pirovano, G., Favez, O., Jaffrezo, J. L., Kuenen, J., Denier van Der Gon, H., Reizer, M., Riffault, V., Alleman, L. Y., Almeida, M., Amato, F., Angyal, A., Argyropoulos, G., Bande, S., Beslic, I., Besombes, J.-L., Bove, M. C., Brotto, P., Calori, G., Cesari, D., Colombi, C., Contini, D., De Gennaro, G., Di Gilio, A., Diapouli, E., El Haddad, I., Elbern, H., Eleftheriadis, K., Ferreira, J., Vivanco, M. G., Gilardoni, S., Golly, B., Hellebust, S., Hopke, P. K., Izadmanesh, Y., Jorquera, H., Krajsek, K., Kranenburg, R., Lazzeri, P., Lenartz, F., Lucarelli, F., Maciejewska, K., Manders, A., Manousakas, M., Masiol, M., Mircea, M., Mooibroek, D., Nava, S., Oliveira, D., Paglione, M., Pandolfi, M., Perrone, M., Petralia, E., Pietrodangelo, A., Pillon, S., Pokorna, P., Prati, P., Salameh, D., Samara, C., Samek, L., Saraga, D., Sauvage, S., Schaap, M., Scotto, F., Sega, K., Siour, G., Tauler, R., Valli, G., Vecchi, R., Venturini, E., Vestenius, M., Waked, A., and Yubero, E.: Evaluation of receptor and chemical transport models for PM10 source apportionment, Atmos. Environ. X, 5, 100053, https://doi.org/10.1016/j.aeaoa.2019.100053, 2020.
Braakhuis, H. M., Park, M. V., Gosens, I., De Jong, W. H., and Cassee, F. R.: Physicochemical characteristics of nanomaterials that affect pulmonary inflammation, Part. Fibre Toxicol., 11, 18, https://doi.org/10.1186/1743-8977-11-18, 2014.
Brines, M., Dall'Osto, M., Beddows, D. C. S., Harrison, R. M., Gómez-Moreno, F., Núñez, L., Artíñano, B., Costabile, F., Gobbi, G. P., Salimi, F., Morawska, L., Sioutas, C., and Querol, X.: Traffic and nucleation events as main sources of ultrafine particles in high-insolation developed world cities, Atmos. Chem. Phys., 15, 5929–5945, https://doi.org/10.5194/acp-15-5929-2015, 2015.
Carslaw, D. C. and Ropkins, K.: openair – An R package for air quality data analysis, Environ. Modell. Softw., 27–28, 52–61, https://doi.org/10.1016/j.envsoft.2011.09.008, 2012.
Chalupa, D. C., Morrow, P. E., Oberdörster, G., Utell, M. J., and Frampton, M. W.: Ultrafine particle deposition in subjects with asthma, Environ. Health Perspect., 112, 879–882, https://doi.org/10.1289/ehp.6851 879--882, 2004.
Chandrasekaran, S. R., Laing, J. R., Holsen, T. M., Raja, S., and Hopke, P. K.: Emission characterization and efficiency measurements of high-efficiency wood boilers, Energy Fuels, 25, 5015–5021, https://doi.org/10.1021/ef2012563, 2011.
Charron, A. and Harrison, R. M.: Primary particle formation from vehicle emissions during exhaust dilution in the roadside atmosphere, Atmos. Environ., 37, 4109–4119, https://doi.org/10.1016/S1352-2310(03)00510-7, 2003.
Conte, M. and Contini, D.: Size-resolved particle emission factors of vehicular traffic derived from urban eddy covariance measurements, Environ. Pollut., 251, 830–838, https://doi.org/10.1016/j.envpol.2019.05.029, 2019.
Conte, M., Dinoi, A., Grasso, F. M., Merico, E., Guascito, M. R., and Contini, D.: Concentration and size distribution of atmospheric particles in southern Italy during COVID-19 lockdown period, Atmos. Environ., 295, 119559, https://doi.org/10.1016/j.atmosenv.2022.119559, 2023.
Corsini, E., Marinovich, M., and Vecchi, R.: Ultrafine particles from residential biomass combustion: A review on experimental data and toxicological response, Int. J. Mol. Sci., 20, 4992, https://doi.org/10.3390/ijms20204992, 2019.
Crova, F., Forello, A. C., Bernardoni, V., Calzolai, G., Canepari, S., Argentini, S., Costabile, F., Frezzini, M. A., Giardi, F., Lucarelli, F., Massabò, D., Massimi, L., Nava, S., Paglione, M., Pazzi, G., Prati, P., Rinaldi, M., Russo, M., Valentini, S., Valli, G., Vernocchi, V., and Vecchi, R.: Assessing the role of atmospheric dispersion vs. emission strength in the southern Po Valley (Italy) using dispersion-normalised multi-time receptor modelling, Atmos. Environ., 316, 120168, https://doi.org/10.1016/j.atmosenv.2023.120168, 2024.
Dai, Q., Hopke, P. K., Bi, X., and Feng, Y.: Improving apportionment of PM2.5 using multisite PMF by constraining G-values with apriori information, Sci. Total Environ., 736, 139657, https://doi.org/10.1016/j.scitotenv.2020.139657, 2020.
Dai, Q., Ding, J., Song, C., Liu, B., Bi, X., Wu, J., Zhang, Y., Feng, Y., and Hopke, P. K.: Changes in source contributions to particle number concentrations after the COVID-19 outbreak: Insights from a dispersion normalized PMF, Sci. Total Environ., 759, 143548, https://doi.org/10.1016/j.scitotenv.2020.143548, 2021.
Damayanti, S., Harrison, R. M., Pope, F., and Beddows, D. C. S.: Limited impact of diesel particle filters on road traffic emissions of ultrafine particles, Environ. Int., 174, 107888, https://doi.org/10.1016/j.envint.2023.107888, 2023.
de Jesus, A. L., Thompson, H., Knibbs, L. D., Kowalski, M., Cyrys, J., Niemi, J. V., Kousa, A., Timonen, H., Luoma, K., Petäjä, T., Beddows, D., Harrison, R. M., Hopke, P., and Morawska, L.: Long-term trends in PM2.5 mass and particle number concentrations in urban air: the impacts of mitigation measures and extreme events due to changing climates, Environ. Pollut., 263, 114500, https://doi.org/10.1016/j.envpol.2020.114500, 2020.
EU EEA: Air pollution, European Environment Agency of the European Union, https://www.eea.europa.eu/en/topics/in-depth/air-pollution (last access: 20 December 2023), 2023.
Harni, S. D., Aurtela, M., Saarikoski, S., Niemi, J., Portin, H., Manninen, H., Leinonen, V., Aalto, P., Hopke, P., Petäjä, T., Rönkkö, T., and Timonen, H.: Source apportionment of particle number size distribution at the street canyon and urban background sites, EGUsphere [preprint], https://doi.org/10.5194/egusphere-2023-2428, 2023.
Harrison, R. M., Beddows, D. C. S., and Dall'Osto, M.: PMF analysis of wide-range particle size spectra collected on a major highway, Environ. Sci. Technol., 45, 5522–5528, https://doi.org/10.1021/es2006622, 2011.
Harrison, R. M., MacKenzie, R. A., Xu, H., Alam, M. S., Nikolova, I., Zhong, J., Singh, A., Zeraati-Rezaei, S., Stark, C., Beddows, D. C. S., Liang, Z., Xu, R., and Cai, X.: Diesel exhaust nanoparticles and their behaviour in the atmosphere, P. R. Soc. A, 474, 20180492, https://doi.org/10.1098/rspa.2018.0492, 2018.
Harrison, R. M., Beddows, D. C. S., Alam, M. S., Singh, A., Brean, J., Xu, R., Kotthaus, S., and Grimmond, S.: Interpretation of particle number size distributions measured across an urban area during the FASTER campaign, Atmos. Chem. Phys., 19, 39–55, https://doi.org/10.5194/acp-19-39-2019, 2019.
HEI Review Panel on Ultrafine Particles: Understanding the health effects of ambient ultrafine particles, HEI Perspectives 3, Health Effects Institute, Boston, 2013.
Hersbach, H., Bell, B., Berrisford, P., Biavati, G., Horányi, A., Muñoz Sabater, J., Nicolas, J., Peubey, C., Radu, R., Rozum, I., Schepers, D., Simmons, A., Soci, C., Dee, D., and Thépaut, J-N.: ERA5 hourly data on single levels from 1940 to present, Copernicus Climate Change Service (C3S) Climate Data Store (CDS), https://doi.org/10.24381/cds.adbb2d47 (last access: 10 September 2023), 2023.
Holzworth, G. C.: Mixing depths, wind speeds and air pollution potential for selected locations in the United States, J. Appl. Meteorol., 6, 1039–1044, https://doi.org/10.1175/1520-0450(1967)006<1039:mdwsaa>2.0.co;2, 1967.
Hopke, P. K.: An introduction to receptor modeling, Chemometr. Intell. Lab., 10, 21–43, https://doi.org/10.1016/0169-7439(91)80032-l, 1991.
Hopke, P. K.: A guide to positive matrix factorization, Center for Air Resources Engineering and Science, Clarkson University, Potsdam, NY, https://people.clarkson.edu/~phopke/PMF-Guidance.htm (last access: 10 September 2023), 2000.
Hopke, P. K.: Review of receptor modeling methods for source apportionment, J. Air Waste Manage., 66, 237–259, https://doi.org/10.1080/10962247.2016.1140693, 2016.
Hopke, P. K., Dai, Q., Li, L., and Feng, Y.: Global review of recent source apportionments for airborne particulate matter, Sci. Total Environ., 740, 140091, https://doi.org/10.1016/j.scitotenv.2020.140091, 2020.
Hopke, P. K., Feng, Y., and Dai, Q.: Source apportionment of particle number concentrations: A global review, Sci. Total Environ., 819, 153104, https://doi.org/10.1016/j.scitotenv.2022.153104, 2022.
Hopke, P. K., Chen, Y., Rich, D. Q., Mooibroek, D., and Sofowote, U. M.: The application of positive matrix factorization with diagnostics to BIG DATA, Chemometr. Intell. Lab., 240, 104885, https://doi.org/10.1016/j.chemolab.2023.104885, 2023.
Hopke, P. K., Chen, Y., Chalupa, D. C., and Rich, D. Q.: Long term trends in source apportioned particle number concentrations in Rochester NY, Environ. Pollut., 347, 123708, https://doi.org/10.1016/j.envpol.2024.123708, 2024.
Ibald-Mulli, A., Wichmann, H.-E., Kreyling, W., and Peters, A.: Epidemiological evidence on health effects of ultrafine particles, J. Aerosol Med., 15, 189–201, https://doi.org/10.1089/089426802320282310, 2002.
Juozaitis, A., Trakumas, S., Girgždien, R., Girgždys, A., Šopauskien, D., and Ulevičius, V.: Investigations of gas-to-particle conversion in the atmosphere, Atmos. Res., 41, 183–201, https://doi.org/10.1016/0169-8095(96)00008-7, 1996.
Kadowaki, S.: Size distribution and chemical composition of atmospheric particulate nitrate in the Nagoya area, Atmos. Environ., 11, 671–675, https://doi.org/10.1016/0004-6981(77)90174-3, 1977.
Kittelson, D., Khalek, I., McDonald, J., Stevens, J., and Giannelli, R.: Particle emissions from mobile sources: Discussion of ultrafine particle emissions and definition, J. Aerosol Sci., 159, 105881, https://doi.org/10.1016/j.jaerosci.2021.105881, 2022.
Kerminen, V. M., Chen, X., Vakkari, V., Petäjä, T., Kulmala, M., and Bianchi, F.: Atmospheric new particle formation and growth: Review of field observations, Environ. Res. Lett., 13, 103003, https://doi.org/10.1088/1748-9326/aadf3c, 2018.
Kreyling, W. G., Semmler-Behnke, M., and Möller, W.: Ultrafine particle-lung interactions: does size matter?, J. Aerosol Med., 19, 74–83, https://doi.org/10.1089/jam.2006.19.74., 2006.
Kumar, P., Ketzel, M., Vardoulakis, S., Pirjola, L., and Britter, R.: Dynamics and dispersion modelling of nanoparticles from road traffic in the urban atmospheric environment – A review, J. Aerosol Sci., 42, 580–603, https://doi.org/10.1016/j.jaerosci.2011.06.001, 2011.
Kulmala, M.: How particles nucleate and grow, Science, 302, 1000, https://doi.org/10.1126/science.1090848, 2003.
Kulmala, M., Lintunen, A., Lappalainen, H., Virtanen, A., Yan, C., Ezhova, E., Nieminen, T., Riipinen, I., Makkonen, R., Tamminen, J., Sundström, A.-M., Arola, A., Hansel, A., Lehtinen, K., Vesala, T., Petäjä, T., Bäck, J., Kokkonen, T., and Kerminen, V.-M.: Opinion: The strength of long-term comprehensive observations to meet multiple grand challenges in different environments and in the atmosphere, Atmos. Chem. Phys., 23, 14949–14971, https://doi.org/10.5194/acp-23-14949-2023, 2023.
Leahey, D. M.: An advective model for predicting air pollution within an urban heat island with applications to New York City, J. Air Waste Manage., 22, 548–550, https://doi.org/10.1080/00022470.1972.10469678, 1972.
Li, Q.-Q., Guo, Y.-T., Yang, J.-Y., and Liang, C.-S.: Review on main sources and impacts of urban ultrafine particles: Traffic emissions, nucleation, and climate modulation, Atmos. Environ. X, 19, 100221, https://doi.org/10.1016/j.aeaoa.2023.100221, 2023.
Li, W. and Hopke, P. K.: Initial size distributions and hygroscopicity of indoor combustion aerosol particles, Aerosol Sci. Technol., 19, 305–316, https://doi.org/10.1080/02786829308959638, 1993.
Liu, Z. R., Hu, B., Liu, Q., Sun, Y., and Wang, Y. S.: Source apportionment of urban fine particle number concentration during summertime in Beijing, Atmos. Environ., 96, 359–369, https://doi.org/10.1016/j.atmosenv.2014.06.055, 2014.
Maricq, M. M., Chase, R. E., Xu, N., and Laing, P. M.: The effects of the catalytic converter and fuel sulfur level on motor vehicle particulate matter emissions: Light duty diesel vehicles, Environ. Sci. Technol., 36, 283–289, https://doi.org/10.1021/es010962l, 2002.
Meng, X., Ma, Y., Chen, R., Zhou, Z., Chen, B., and Kan, H.: Size-fractionated particle number concentrations and daily mortality in a Chinese city, Environ. Health Perspect., 121, 1174–1178, https://doi.org/10.1289/ehp.1206398, 2013.
Mikkonen, S., Németh, Z., Varga, V., Weidinger, T., Leinonen, V., Yli-Juuti, T., and Salma, I.: Decennial time trends and diurnal patterns of particle number concentrations in a central European city between 2008 and 2018, Atmos. Chem. Phys., 20, 12247–12263, https://doi.org/10.5194/acp-20-12247-2020, 2020.
Morawska, L., Ristovski, Z., Jayaratne, E. R., Keogh, D. U., and Ling, X.: Ambient nano and ultrafine particles from motor vehicle emissions: Characteristics, ambient processing and implications on human exposure, Atmos. Environ., 42, 8113–8138, https://doi.org/10.1016/j.atmosenv.2008.07.050, 2008.
Németh, Z. and Salma, I.: Spatial extension of nucleating air masses in the Carpathian Basin, Atmos. Chem. Phys., 14, 8841–8848, https://doi.org/10.5194/acp-14-8841-2014, 2014.
Oberdörster, G., Oberdörster, E., and Oberdörster, J.: Nanotoxicology: An emerging discipline evolving from studies of ultrafine particles, Environ. Health Perspect., 113, 823–839, https://doi.org/10.1289/ehp.7339, 2005.
Ogulei, D., Hopke, P. K., Chalupa, D., and Utell, M.: Modeling source contributions to submicron particle number concentrations measured in Rochester, NY, Aerosol Sci. Technol., 41, 179–201, https://doi.org/10.1080/02786820601116012, 2007.
Paatero, P.: The Multilinear Engine: A table-driven, least squares program for solving multilinear problems, including the n-way parallel factor analysis model, J. Comput. Graph. Stat., 8, 854, https://doi.org/10.2307/1390831, 1999.
Paatero, P. and Tapper, U.: Analysis of different modes of factor analysis as least squares fit problems, Chemometr. Intell. Lab., 18, 183–194, https://doi.org/10.1016/0169-7439(93)80055-m, 1993.
Paatero, P. and Tapper, U.: Positive matrix factorization: A non-negative factor model with optimal utilization of error estimates of data values, Environmetrics, 5, 111–126, https://doi.org/10.1002/env.3170050203, 1994.
Pandolfi, M., Gonzalez-Castanedo, Y., Alastuey, A., de la Rosa, J. D., Mantilla, E., de la Campa, A. S., Querol, X., Pey, J., Amato, F., and Moreno, T.: Source apportionment of PM10 and PM2.5 at multiple sites in the strait of Gibraltar by PMF: impact of shipping emissions, Environ. Sci. Pollut. Res., 18, 260–269, https://doi.org/10.1007/s11356-010-0373-4, 2010.
Riediker, M., Zink, D., Kreyling, W., Oberdörster, G., Elder, A., Graham, U., Lynch, I., Duschl, A., Ichihara, G., Ichihara, S., Kobayashi, T., Hisanaga, N., Umezawa, M., Cheng, T.-J., Handy, R., Gulumian, M., Tinkle, S., and Cassee, F.: Particle toxicology and health – where are we?, Part. Fibre Toxicol., 16, https://doi.org/10.1186/s12989-019-0302-8, 2019.
Rivas, I., Beddows, D. C. S., Amato, F., Green, D. C., Järvi, L., Hueglin, C., Reche, C., Timonen, H., Fuller, G. W., Niemi, J. V., Pérez, N., Aurela, M., Hopke, P. K., Alastuey, A., Kulmala, M., Harrison, R. M., Querol, X., and Kelly, F. J.: Source apportionment of particle number size distribution in urban background and traffic stations in four European cities, Environ. Int., 135, 105345, https://doi.org/10.1016/j.envint.2019.105345, 2020.
Robinson, A. L., Donahue, N. M., Shrivastava, M. K., Weitkamp, E. A, Sage, A. M., Grieshop, A. P., Lane, T. E., Pierce, J. R., and Pandis, S. N.: Rethinking organic aerosols: semivolatile emissions and photochemical aging, Science, 80, 315, 1259–1262, https://doi.org/10.1126/science.1133061, 2007.
Rönkkö, T. and Timonen, H.: Overview of sources and characteristics of nanoparticles in urban traffic-influenced areas, J. Alzheimers Dis., 72, 15–28, https://doi.org/10.3233/jad-190170, 2019.
Rönkkö, T., Kuuluvainen, H., Karjalainen, P., Keskinen, J., Hillamo, R., Niemi, J. V., Pirjola, L., Timonen, H. J., Saarikoski, S., Saukko, E., Järvinen, A., Silvennoinen, H., Rostedt, A., Olin, M., Yli-Ojanperä, J., Nousiainen, P., Kousa, A., Dal Maso, M.: Traffic is a major source of atmospheric nanocluster aerosol, P. Natl. Acad. Sci. USA, 114, 7549–7554. https://doi.org/10.1073/pnas.1700830114, 2017.
Rowell, A., Brean, J., Beddows, D. C. S., Shi, Z., Petäjä, T., Vörösmarty, M., Salma, I., Niemi, J. V., Manninen, H. E., van Pinxteren, D., Harrison, R. M., Tuch, T., and Weinhold, K.: Insights into the sources of ultrafine particle numbers at six European urban sites obtained by investigating COVID–19 lockdowns, EGUsphere [preprint], https://doi.org/10.5194/egusphere-2023-3053, 2024.
Salma, I. and Németh, Z.: Dynamic and timing properties of new aerosol particle formation and consecutive growth events, Atmos. Chem. Phys., 19, 5835–5852, https://doi.org/10.5194/acp-19-5835-2019, 2019.
Salma, I., Maenhaut, W., and Záray, Gy.: Comparative study of elemental mass size distributions in urban atmospheric aerosol, J. Aerosol Sci., 33, 339–356, https://doi.org/10.1016/S0021-8502(01)00176-8, 2002.
Salma, I., Borsós, T., Weidinger, T., Aalto, P., Hussein, T., Dal Maso, M., and Kulmala, M.: Production, growth and properties of ultrafine atmospheric aerosol particles in an urban environment, Atmos. Chem. Phys., 11, 1339–1353, https://doi.org/10.5194/acp-11-1339-2011, 2011.
Salma, I., Füri, P., Németh, Z., Farkas, Á., Balásházy, I., Hofmann, W., and Farkas, Á.: Lung burden and deposition distribution of inhaled atmospheric urban ultrafine particles as the first step in their health risk assessment, Atmos. Environ., 104, 39–49, https://doi.org/10.1016/j.atmosenv.2014.12.060, 2015.
Salma, I., Németh, Z., Weidinger, T., Kovács, B., and Kristóf, G.: Measurement, growth types and shrinkage of newly formed aerosol particles at an urban research platform, Atmos. Chem. Phys., 16, 7837–7851, https://doi.org/10.5194/acp-16-7837-2016, 2016a.
Salma, I., Németh, Z., Kerminen, V.-M., Aalto, P., Nieminen, T., Weidinger, T., Molnár, Á., Imre, K., and Kulmala, M.: Regional effect on urban atmospheric nucleation, Atmos. Chem. Phys., 16, 8715–8728, https://doi.org/10.5194/acp-16-8715-2016, 2016b.
Salma, I., Varga, V., and Németh, Z.: Quantification of an atmospheric nucleation and growth process as a single source of aerosol particles in a city, Atmos. Chem. Phys., 17, 15007–15017, https://doi.org/10.5194/acp-17-15007-2017, 2017.
Salma, I., Vörösmarty, M., Gyöngyösi, A. Z., Thén, W., and Weidinger, T.: What can we learn about urban air quality with regard to the first outbreak of the COVID-19 pandemic? A case study from central Europe, Atmos. Chem. Phys., 20, 15725–15742, https://doi.org/10.5194/acp-20-15725-2020, 2020.
Salma, I., Thén, W., Aalto, P., Kerminen, V.-M., Kern, A., Barcza, Z., Petäjä, T., and Kulmala, M.: Influence of vegetation on occurrence and time distributions of regional new aerosol particle formation and growth, Atmos. Chem. Phys., 21, 2861–2880, https://doi.org/10.5194/acp-21-2861-2021, 2021.
Shi, J. P. and Harrison, R. M.: Investigation of ultrafine particle formation during diesel exhaust dilution, Environ. Sci. Technol., 33, 3730–3736. https://doi.org/10.1021/es981187l, 1999.
Squizzato, S., Masiol, M., Emami, F., Chalupa, D., Utell, M., Rich, D., and Hopke, P.: Long-term changes of source apportioned particle number concentrations in a metropolitan area of the northeastern United States, Atmosphere, 10, 27, https://doi.org/10.3390/atmos10010027, 2019.
Souza, C. R.: The Accord.NET Framework, Department of Computing, Federal University of Sao Carlos, Brazil, http://accord-framework.net (last access: 10 September 2023), 2014.
Teinilä, K., Timonen, H., Aurela, M., Kuula, J., Rönkkö, T., Hellèn, H., Loukkola, K., Kousa, A., Niemi, J. V., and Saarikoski, S.: Characterization of particle sources and comparison of different particle metrics in an urban detached housing area, Finland, Atmos. Environ., 272, 118939, https://doi.org/10.1016/j.atmosenv.2022.118939, 2022.
Thén, W. and Salma, I.: Particle number concentration: a case study for air quality monitoring, Atmosphere, 13, 570, https://doi.org/10.3390/atmos13040570, 2022.
Trechera, P., Garcia-Marlès, M., Liu, X., Reche, C., Pérez, N., Savadkoohi, M., Beddows, D., Salma, I., Vörösmarty, M., Casans, A., Casquero-Vera, J. A., Hueglin, C., Marchand, N., Chazeau, B., Gille, G., Kalkavouras, P., Mihalopoulos, N., Ondráček, J., Zíkova, N., Niemi, J. V., Manninen, H. E., Green, D. C., Tremper, A. H., Norman, M., Vratolis, S., Eleftheriadis, K., Gómez-Moreno, F. J., Alonso-Blanco, E., Gerwig, H., Wiedensohler, A., Weinhold, K., Merkel, M., Bastian, S., Petit, J.-E., Favez, O., Crumeyrolle, S., Ferlay, N., Martins Dos Santos, S., Putaud, J.-P., Timonen, H., Lampilahti, J., Asbach, C., Wolf, C., Kaminski, H., Altug, H., Hoffmann, B., Rich, D. Q., Pandolfi, M., Harrison, R. M., Hopke, P. K., Petäjä, T., Alastuey, A., and Querol, X.: Phenomenology of ultrafine particle concentrations and size distribution across urban Europe, Environ. Int., 172, 107744, https://doi.org/10.1016/j.envint.2023.107744, 2023.
Uria-Tellaetxe, I. and Carslaw, D. C.: Conditional bivariate probability function for source identification, Environ. Modell. Softw., 59, 1–9, https://doi.org/10.1016/j.envsoft.2014.05.002, 2014.
US EPA: Positive matrix factorization model for environmental data analyses, U.S. Environmental Protection Agency, https://www.epa.gov/air-research/positive-matrix-factorization-model-environmental-data-analyses (last access: 10 September 2023), 2014.
US EPA: Criteria air pollutants, U.S. Environmental Protection Agency, https://www.epa.gov/criteria-air-pollutants (last access: 20 December 2023), 2023.
Viana, M., Kuhlbusch, T. A. J., Querol, X., Alastuey, A., Harrison, R. M., Hopke, P. K., Winiwarter, W., Vallius, M., Szidat, S., Prévôt, A. S. H., Hueglin, C., Bloemen, H., Wåhlin, P., Vecchi, R., Miranda, A. I., Kasper-Giebl, A., Maenhaut, W., and Hitzenberger, R.: Source apportionment of particulate matter in Europe: A review of methods and results, J. Aerosol Sci., 39, 827–849, https://doi.org/10.1016/j.jaerosci.2008.05.007, 2008.
Vratolis, S., Gini, M. I., Bezantakos, S., Stavroulas, I., Kalivitis, N., Kostenidou, E., Louvaris, E., Siakavaras, D., Biskos, G., Mihalopoulos, N., Pandis, S. N., Pilinis, C., Papayannis, A., and Eleftheriadis, K.: Particle number size distribution statistics at city-centre urban background, urban background, and remote stations in Greece during summer, Atmos. Environ., 213, 711–726, https://doi.org/10.1016/j.atmosenv.2019.05.064, 2019.
Vu, T. V., Delgado-Saborit, J. M., and Harrison, R. M.: Review: Particle number size distributions from seven major sources and implications for source apportionment studies, Atmos. Environ., 122, 114–132, https://doi.org/10.1016/j.atmosenv.2015.09.027, 2015.
Wang, K., Nakao, S., Thimmaiah, D., and Hopke, P. K.: Emissions from in-use residential wood pellet boilers and potential emissions savings using thermal storage, Sci. Total Environ., 676, 564–576, https://doi.org/10.1016/j.scitotenv.2019.04.325, 2019.
Wang, M., Hopke, P. K., Masiol, M., Thurston, S. W., Cameron, S., Ling, F., van Wijngaarden, E., Croft, D., Squizzato, S., Thevenet-Morrison, K., Chalupa, D., and Rich, D. Q.: Changes in triggering of ST-elevation myocardial infarction by particulate air pollution in Monroe County, New York over time: a case-crossover study, Environ. Health., 18, 82, https://doi.org/10.1186/s12940-019-0521-3, 2019.
WHO: Global Air Quality Guidelines: Particulate matter (PM2.5 and PM10), ozone, nitrogen dioxide, sulfur dioxide and carbon monoxide, World Health Organization, https://www.ncbi.nlm.nih.gov/books/NBK574594/ (last access: 10 September 2023), 2021.
Wiedensohler, A., Birmili, W., Nowak, A., Sonntag, A., Weinhold, K., Merkel, M., Wehner, B., Tuch, T., Pfeifer, S., Fiebig, M., Fjäraa, A. M., Asmi, E., Sellegri, K., Depuy, R., Venzac, H., Villani, P., Laj, P., Aalto, P., Ogren, J. A., Swietlicki, E., Williams, P., Roldin, P., Quincey, P., Hüglin, C., Fierz-Schmidhauser, R., Gysel, M., Weingartner, E., Riccobono, F., Santos, S., Grüning, C., Faloon, K., Beddows, D., Harrison, R., Monahan, C., Jennings, S. G., O'Dowd, C. D., Marinoni, A., Horn, H.-G., Keck, L., Jiang, J., Scheckman, J., McMurry, P. H., Deng, Z., Zhao, C. S., Moerman, M., Henzing, B., de Leeuw, G., Löschau, G., and Bastian, S.: Mobility particle size spectrometers: harmonization of technical standards and data structure to facilitate high quality long-term observations of atmospheric particle number size distributions, Atmos. Meas. Tech., 5, 657–685, https://doi.org/10.5194/amt-5-657-2012, 2012.
Yoshizumi, K.: Regional size distributions of sulfate and nitrate in the Tokyo metropolitan area in summer, Atmos. Environ., 20, 763–766, https://doi.org/10.1016/0004-6981(86)90191-5, 1986.
Zhang, Y., Zhang, Q., Yao, Z., and Li, H.: Particle size and mixing state of freshly emitted black carbon from different combustion sources in China, Environ. Sci. Technol., 54, 7766–7774, https://doi.org/10.1021/acs.est.9b07373, 2020.
Zhou, L., Kim, E., Hopke, P. K., Stanier, C., and Pandis, S. N.: Advanced factor analysis on Pittsburgh particle size-distribution data, Aerosol Sci. Technol., 38, 118–132, https://doi.org/10.1080/02786820390229589, 2004.