the Creative Commons Attribution 4.0 License.
the Creative Commons Attribution 4.0 License.
 | 16 May 2024
Aerosols in the central Arctic cryosphere: satellite and model integrated insights during Arctic spring and summer
Basudev Swain
Marco Vountas
Aishwarya Singh
Nidhi L. Anchan
Adrien Deroubaix
Luca Lelli
Yanick Ziegler
Sachin S. Gunthe
Hartmut Bösch
John P. Burrows
The central Arctic cryosphere is influenced by the Arctic amplification (AA) and is warming faster than the lower latitudes. AA affects the formation, loss, and transport of aerosols. Efforts to assess the underlying processes determining aerosol variability are currently limited due to the lack of ground-based and space-borne aerosol observations with high spatial coverage in this region. This study addresses the observational gap by making use of total aerosol optical depth (AOD) datasets retrieved by the AEROSNOW algorithm over the vast cryospheric region of the central Arctic during Arctic spring and summer. GEOS-Chem (GC) simulations combined with AEROSNOW-retrieved data are used to investigate the processes controlling aerosol loading and distribution at different temporal and spatial scales. For the first time, an integrated study of AOD over the Arctic cryosphere during sunlight conditions was possible with the AEROSNOW retrieval and GC simulations. The results show that the spatial patterns observed by AEROSNOW differ from those simulated by GC. During spring, which is characterized by long-range transport of anthropogenic aerosols in the Arctic, GC underestimates the AOD in the vicinity of Alaska in comparison with AEROSNOW retrieval. At the same time, it overestimates the AOD along the Bering Strait, northern Europe, and the Siberian central Arctic sea-ice regions, with differences of −12.3 % and 21.7 %, respectively. By contrast, GC consistently underestimates AOD compared with AEROSNOW in summer, when transport from lower latitudes is insignificant and local natural processes are the dominant source of aerosol, especially north of 70° N. This underestimation is particularly pronounced over the central Arctic sea-ice region, where it is −10.6 %. Conversely, GC tends to overestimate AOD along the Siberian and Greenland marginal sea-ice zones by 19.5 % but underestimates AOD along the Canadian Archipelago by −9.3 %. The differences in summer AOD between AEROSNOW data products and GC-simulated AOD highlight the need to integrate improved knowledge of the summer aerosol process into existing models in order to constrain its effects on cloud condensation nuclei, on ice nucleating particles, and on the radiation budget over the central Arctic sea ice during the developing AA period.
- Article
(8272 KB) - Full-text XML
- BibTeX
- EndNote


Over the past three decades, Arctic surface air temperatures have exhibited a warming rate 2–4 times higher than the global average, leading to the phenomenon known as “Arctic amplification” (AA) (Rantanen et al., 2022). This accelerated warming has contributed to the retreat of central Arctic glaciers, sea ice, and snow-covered areas (Shukla et al., 2019; Dai et al., 2019). Although the man-made release of greenhouse gas concentrations remains the primary driver of global warming, uncertainties persist regarding the factors influencing AA. These uncertainties encompass both local (within the Arctic) natural processes and long-range transport of anthropogenic aerosols, along with their associated forcing mechanisms (Willis et al., 2018). While aerosols play a crucial role in the atmosphere and impact climate dynamics, their specific effects on AA remain inadequately quantified (Schmale et al., 2021; Xian et al., 2022).
The anthropogenic aerosol burden in the Arctic has decreased due to air quality measures in Western Europe and North America and the changes in industrial activity from the fall of the Soviet Union (Breider et al., 2017). Concurrently, changes in natural processes influencing Arctic aerosols, modified by Arctic warming, need to be accounted for in models projecting the behavior in the Arctic (Schmale et al., 2021). Particularly during Arctic summer, understanding natural aerosol emissions, their evolution, and the processes involved in their transport poses challenges in capturing the range and relative importance of various aerosol-related AA drivers. This challenge is true in the central Arctic region, especially concerning central Arctic aerosols and their impact on cloud formation, which is inadequately represented in current models, as highlighted by various studies (Boucher et al., 2013; Sand et al., 2017; Palazzi et al., 2019; Schmale et al., 2021). The knowledge gap is pronounced in the central Arctic cryospheric region due to the absence of comprehensive spatiotemporal observational data on aerosols, both from ground-based and space-borne measurements (Schmale et al., 2021).
To fill the observational data gap in the central Arctic region, several relevant research campaigns and expeditions have addressed aerosol formation and loss in the Arctic, such as the MOSAiC expedition (Shupe et al., 2022), ACLOUD/PASCAL (Wendisch et al., 2019), and PAMARCMIP (Hoffmann et al., 2012; Ohata et al., 2021). Additionally, long-term ground-based aerosol observations over specific sites (Herber et al., 2002; Tomasi et al., 2007; Moschos et al., 2022; Schmale et al., 2022) are valuable but sparse; thus, these studies do not necessarily represent the vast central Arctic cryospheric region spatiotemporally (Schmale et al., 2021; Xian et al., 2022).
The use of passive and active satellite measurements is crucial for enhancing aerosol observation data with broad spatial coverage. However, passive satellites, including the Moderate Resolution Imaging Spectroradiometer (MODIS), Multi-angle Imaging SpectroRadiometer (MISR), and Ozone Monitoring Instrument (OMI), face challenges in aerosol optical depth (AOD) retrieval, particularly in the central Arctic cryospheric region (Sand et al., 2017; Xian et al., 2022). Thus, the datasets from these passive satellites are not yet available over the central Arctic cryospheric region. These challenges arise from issues related to cold and highly reflective surfaces and cloud interference. Unfortunately, the active sensor CALIOP/CALIPSO faces limitations in reporting measurements above 72° N (Pitts et al., 2013; Manney et al., 2015; Sand et al., 2017; Toth et al., 2018; Xian et al., 2022).
In consideration of the lack of aerosol observations with high spatiotemporal coverage in the central Arctic cryosphere, various efforts have been made to bridge this data gap by utilizing AOD retrieved from top-of-atmosphere reflectance (TOA) measurements from passive satellite remote-sensing instruments (Istomina et al., 2011; Mei et al., 2013, 2020b, a). However, these studies have primarily focused on retrieving AOD above the island of Spitsbergen in the Svalbard Archipelago, leaving the central Arctic cryosphere data gap unaddressed.
Given the absence of ground-based and space-borne observations across the central Arctic cryosphere, pioneering research has turned to modeling approaches (von Hardenberg et al., 2012; Sand et al., 2013, 2017; Breider et al., 2017; Ren et al., 2020; Sand et al., 2021; Schmale et al., 2021; Zhao et al., 2022) and reanalysis datasets (Xian et al., 2022). Notably, these investigations focused on land and open ocean areas but not above the sea- ice areas in the central Arctic. These studies have acknowledged that the aerosols within the central Arctic cryosphere are not investigated.
We note the recent review by Schmale et al. (2021), which stresses rapid changes in the Arctic natural aerosol baseline with diverse regional characteristics. The authors emphasized the need for a detailed understanding of the mechanisms governing summertime Arctic aerosol emissions, their evolution, and their transport, highlighting the necessity of integrating these mechanisms into models, especially in the sensitive region of the high Arctic.
Despite various research efforts, no systematic development of advanced aerosol retrieval algorithms across the entire central Arctic cryosphere has taken place. In summary, due to the lack of measurements, studies that integrate space-based observations and model simulations within the central Arctic cryospheric region have not been conducted, leaving both the contribution of aerosols to AA and the effects of AA on aerosol load and its components poorly quantified.
To address the recent research questions raised by Schmale et al. (2021), particularly with respect to the sparsely monitored central Arctic, that the summertime central Arctic total aerosol baseline may be changing, we use a recently retrieved aerosol satellite record entitled “AEROSNOW” (Swain et al., 2024) and compare it with GEOS-Chem (GC) simulations.
This product, for the first time, provides a comprehensive aerosol distribution spatially across the vast central Arctic cryosphere, spanning nearly a decade (2003–2011). Our first objective is to use the total AOD data from AEROSNOW to assess factors influencing model-simulated total AOD. For this purpose, we employ the GEOS-Chem 3-D chemical transport model coupled with MERRA-2 meteorological data, which is considered well suited for Arctic conditions (see Breider et al., 2017). In this context, we focus on quantifying the changing Arctic aerosol baseline as highlighted by Schmale et al. (2021) during spring and summer, and we compare the results of a state-of-the-art model with novel satellite retrievals.
Additionally, we aim to elucidate processes governing diverse AOD components, including transport mechanisms, meteorological conditions, and sources of natural and anthropogenic aerosols contributing to AOD in the central Arctic cryospheric regions observed by AEROSNOW during both spring and summer.
Moreover, recent findings suggest an increase in biomass burning in the low Arctic (Sherstyukov and Sherstyukov, 2014; Hugelius et al., 2020; McCarty et al., 2021). Given these developments, understanding total AOD and its associated aerosol components, especially in the fragile central Arctic region, becomes crucial. The investigation of the aerosol composition over the central Arctic cryosphere is the second objective of this paper. Here, we aim to explore aerosols from both anthropogenic and natural sources. This exploration considers smoke intrusion events and seasonal variations in precipitation over the central Arctic cryosphere.
Given the aforementioned objectives and constraints, we refrain from using the Coupled Model Intercomparison Project (CMIP) model-generated aerosol datasets (Eyring et al., 2016) due to their lack of optimization for the Arctic conditions in terms of up-to-date emission inventories; inadequate representation of Arctic-specific processes, such as long-range transport and deposition processes; and a lack of vertical distribution information on aerosol transport (Zhao et al., 2022). Further, reanalysis datasets such as CAMS (Inness et al., 2019) and MERRA-2 (Gelaro et al., 2017) incorporate satellite retrievals of AOD from MODIS and MISR, but these satellite products lack measurements over the central Arctic snow and sea ice. Thus, such reanalysis datasets must be used with care over the central Arctic. To achieve the two aforementioned objectives of our study, we employ the GEOS-Chem 3-D chemical transport model coupled with MERRA-2 meteorological data, which is considered well suited for Arctic conditions (see Breider et al., 2017).
Our study uses the AEROSNOW-retrieved AOD dataset from 2003 to 2011 (Swain et al., 2024), derived from Advanced Along-Track Scanning Radiometer (AATSR) space-borne instrument measurements over the Arctic. To assess the AEROSNOW and GEOS-Chem datasets, we first compared AEROSNOW and GEOS-Chem AOD with ground-based Aerosol Robotic Network (AERONET) AOD observations, details of which are given in Sect. 3.1. Further, AERONET, AEROSNOW, and GEOS-Chem AOD data are also compared at high-latitude AERONET sites and over snow- and ice-covered surfaces at high latitudes (see Sect. 3.1). Section 3.2 presents AOD values from AATSR measurements and those simulated by the GEOS-Chem model, including the AOD component. Our conclusions are presented in Sect. 4.
As described above, this study aims to explore the spatiotemporal distribution, seasonal variability, and origins of aerosols over the Arctic snow and ice. To accomplish this, we utilized passive remote sensing during spring (March–April–May, MAM) and summer (June–July–August, JJA). The comparison of AOD between these two seasons allows us to investigate the influence of long-range aerosol transport and local aerosol sources, as outlined in Willis et al. (2018).
The AEROSNOW algorithm is employed to retrieve AOD, using the dual-view level 1B reflectance data acquired at the top of the atmosphere by the Advanced Along-Track Scanning Radiometer (AATSR). For a more comprehensive explanation of the methods used, please refer to Swain et al. (2024). AEROSNOW-retrieved AOD alongside the AOD simulated by the GEOS-Chem model, together with ground-based sun-photometer measurements obtained from AERONET (Holben et al., 1998), are used. GEOS-Chem simulations are also utilized to estimate aerosol properties, components, sources, and processes driving the total AOD retrieved by AEROSNOW.
2.1 AERONET level 2 aerosol product
In addition to the AEROSNOW measurements and GEOS-Chem simulations of AOD, we include the relevant AERONET measurements of AOD. The AERONET network comprises ground-based observations of AOD by using sun photometers that accurately measure solar irradiance across a range of wavelengths, starting from the band of near ultraviolet (UV) to near infrared (IR) (Holben et al., 1998).
Typically, AERONET sun photometers measure AOD values at 15 min intervals in seven spectral channels, such as 340, 380, 440, 500, 670, 870, and 1020 nm (Holben et al., 2001). For this study, we used the quality-assured AERONET version 3, level 2 data, accessible at https://aeronet.gsfc.nasa.gov/ (last access: 25 January 2023).
The selected high Arctic AERONET station locations include OPAL (79.990° N, 85.939° W), Hornsund (77.001° N, 15.540° E), and Thule (76.516° N, 68.769° W), as shown in Fig. 1. Two of these sites are situated in the Canadian Archipelago (CA). This CA region primarily experiences aerosols of natural origin (Breider et al., 2017), while Hornsund station located at Spitsbergen is primarily dominated by the air masses which transport pollution from lower latitudes (Willis et al., 2018).
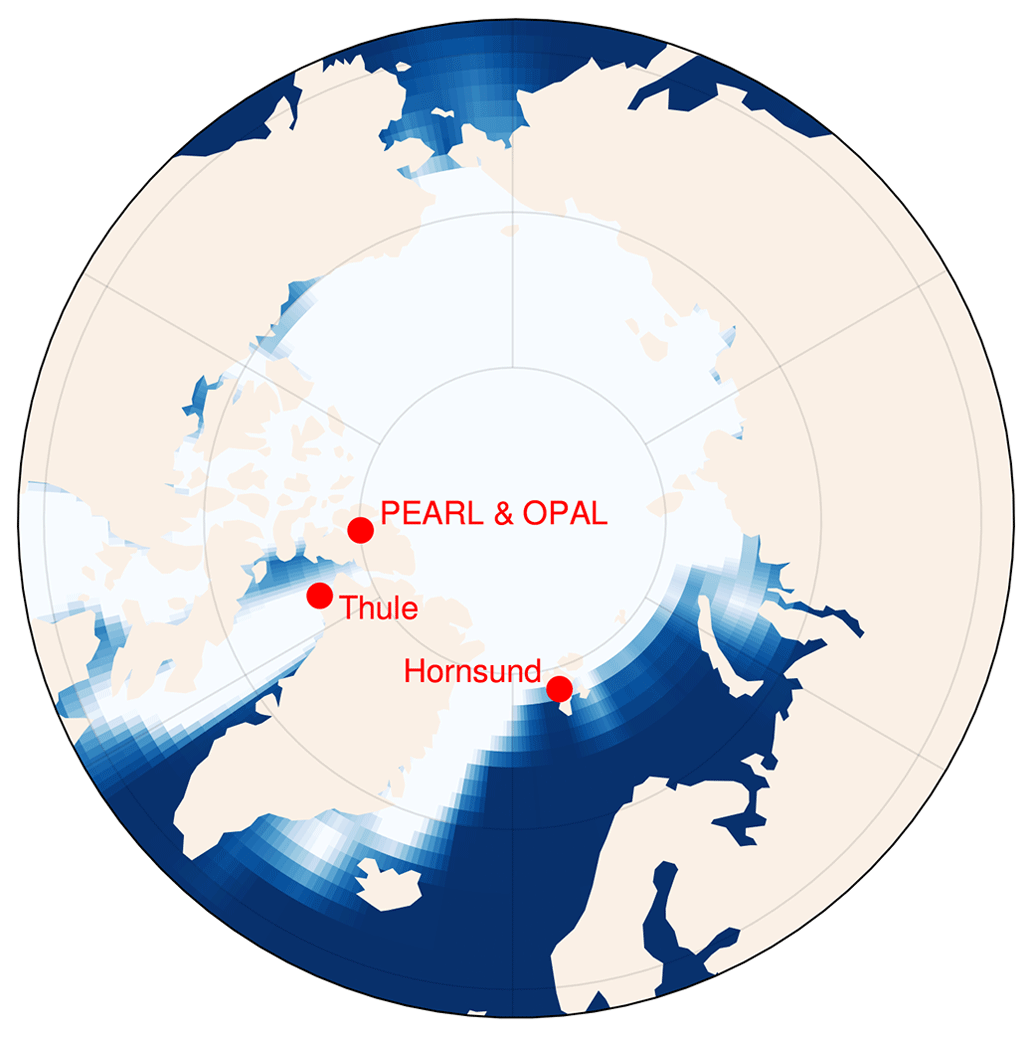
Figure 1High Arctic AERONET measurement sites considered in this study: PEARL (80.054° N, 86.417° W), OPAL (79.990° N, 85.939° W), Hornsund (77.001° N, 15.540° E), and Thule (76.516° N, 68.769° W). The blue, tan, and white regions represent the Arctic open ocean region, the land areas, and the central Arctic sea-ice region, respectively.
In the integrated analysis of AEROSNOW and GEOS-Chem AOD, we also used the datasets from the spectral deconvolution method for the fine-mode (FM) and coarse-mode (CM) AODs at 500 nm from AERONET (O'Neill et al., 2003; Saha et al., 2010). To facilitate a comparison of the FM and CM results measured by AERONET at 500 nm with those from AEROSNOW (measured at 550 nm), wavelength conversion was necessary. The CM AOD at 500 nm was assumed to be equivalent to the 550 nm value (Xian et al., 2022), while the FM spectral derivative at 500 nm was utilized to extrapolate the FM AOD at 550 nm.
Similarly, to compare the AOD of AERONET measured at 500 nm with the GEOS-Chem AOD (modeled at 550 nm), wavelength conversion was also required. we employed the Angstrom exponent from the AOD at 500 and 870 nm to determine the AERONET at AOD at 550 nm for comparisons with GEOS-Chem. The ground-based AERONET measurements were subsequently averaged on a monthly basis and compared with values measured within a 25 km radius of the AERONET station locations for the GEOS-Chem AOD. Monthly averages were determined using the matched GEOS-Chem and AERONET AOD datasets.
2.2 GEOS-Chem model description
We employed version 12.2.1 of the GEOS-Chem global 3-D model, accessible at https://geoschem.github.io/ (last access: 25 January 2023) (Bey et al., 2001). The model uses 6-hourly assimilated meteorological fields provided by the National Aeronautics and Space Administration's (NASA) Goddard Modeling and Assimilation Office's (GMAO) Modern Era Retrospective Reanalysis2 (MERRA2). The fully coupled model simulations encompass O3-NOx hydrocarbon chemistry, aerosols, and gas–aerosol phase partitioning, as detailed in Alexander et al. (2005), Hu et al. (2007), Fountoukis and Nenes (2007), and Knippertz et al. (2015).
As described by Breider et al. (2017), the aerosol simulations in GEOS-Chem account for multiple aerosol components, including black carbon (BC), organic carbon (OC), sulfate–nitrate–ammonium, dust, and sea salt. Carbonaceous aerosols like BC and primary OC (POC) are simulated using standard GEOS-Chem methodologies (Park et al., 2003). The model assumes that 80 % of BC and 50 % of POC emissions are hydrophobic, with the remainder being hydrophilic. After an e-folding aging time of 1.15 d, the hydrophobic BC and POC components transition to hydrophilic states, a process described by Park et al. (2005), allowing them to be removed by wet deposition.
The GEOS-Chem model employs various processing schemes, including an aerosol wet deposition scheme (Liu et al., 2001), a dry deposition scheme (Fisher et al., 2011), a dust mobilization scheme for wind speed subgrid variability (Ridley et al., 2013), sea salt aerosol simulation (Jaeglé et al., 2011), and optical aerosol properties (Koepke et al., 1997; Drury et al., 2010). Additionally, the model features a linearized climatological ozone parameterization for stratospheric ozone (McLinden et al., 2000).
In our simulation, a time step of 10 min is utilized for transport, with a 20 min time step for chemistry and emissions. The model operates at a horizontal resolution of 2° × 2.5° (approximately 220 km × 50 km at the high Arctic latitudes of OPAL) and incorporates 72 vertical levels extending up to 0.01 hPa (Bey et al., 2001; Lu et al., 2020). The initial boundary conditions generated by the first global simulations (4° × 5°) were used for the horizontal resolution of 2° × 2.5° simulations. The simulation covers a period of 13 years (from 1999 to 2011), with the initial years from 1999 to 2002 serving as a model spin-up period.
To analyze the different AOD components provided by GEOS-Chem, the simulated AOD is categorized into fine- and coarse-mode components, denoted as τf,GEOS-Chem and τc,GEOS-Chem, respectively. These components encompass fine-mode organic carbon (OC), sulfate (SO4), and BC, along with fine- and coarse-mode sea salt (SALA) and mineral dust (Hesaraki et al., 2017). The coarse- and fine-mode AOD are calculated as follows:
with l being the 72 vertical levels.
To determine the total AOD at 550 nm, the GEOS-Chem model employed optical properties derived from the global aerosol dataset (GADS), originally introduced by Koepke et al. (1997) and subsequently updated with more recent observations (Drury et al., 2010). GADS offers detailed information on wavelength-specific complex refractive indices and assesses aerosol size distributions, which include geometric mean and standard deviation, across various relative humidity levels (0 %, 50 %, 70 %, 80 %, 90 %, 95 %, and 99 %). (Martin et al., 2003).
This dataset serves as input to the Mie code (Mishchenko et al., 1999), which, in turn, generates the aerosol optical properties by assuming a lognormal size distribution. This process yields the extinction efficiency (Qext) and effective radius (reff), which are essential for the AOD calculations, as outlined in Martin et al. (2003).
The AOD is then determined using the following equation:
where Qext represents the extinction efficiency, which is determined based on data from GADS. The variables M and ρ stand for columnar mass loading and mass density of the particle, respectively (Tegen and Lacis, 1996). Further details regarding the emission inventories utilized in this study are provided in Appendix B.
In this section, we describe and discuss the results obtained from our analyses of the space-borne AEROSNOW-retrieved, ground-based AERONET-measured, and GC model-simulated AODs. Specifically, we explore (i) the proximity of AODs to AERONET stations located in high Arctic snow- and ice-covered regions, and (ii) AODs across the vast central Arctic sea-ice region in spring and summer.
3.1 Assessing annual and seasonal AODs at high Arctic AERONET stations
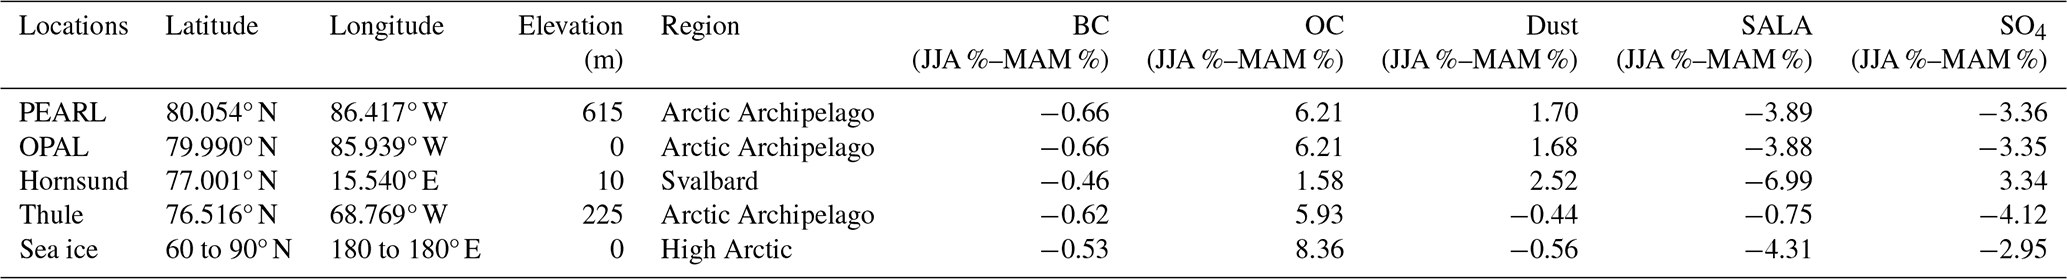
Here, we investigated the AOD close to AERONET stations in the central Arctic cryosphere in the period 2003–2011. The time-series data for the retrieved AOD from AEROSNOW alongside the GEOS-Chem modeling outcomes and AERONET dataset are presented in Fig. 2. The GEOS-Chem model results are depicted in a stacked format, with each component of the aerosols contributing to the uppermost segment, which is the overall AOD as modeled by GEOS-Chem. To facilitate a meaningful evaluation with the ground-based data, we employ monthly averages, a practice that substantially reduces model-induced noise (Li et al., 2013; Breider et al., 2017; Xian et al., 2022).
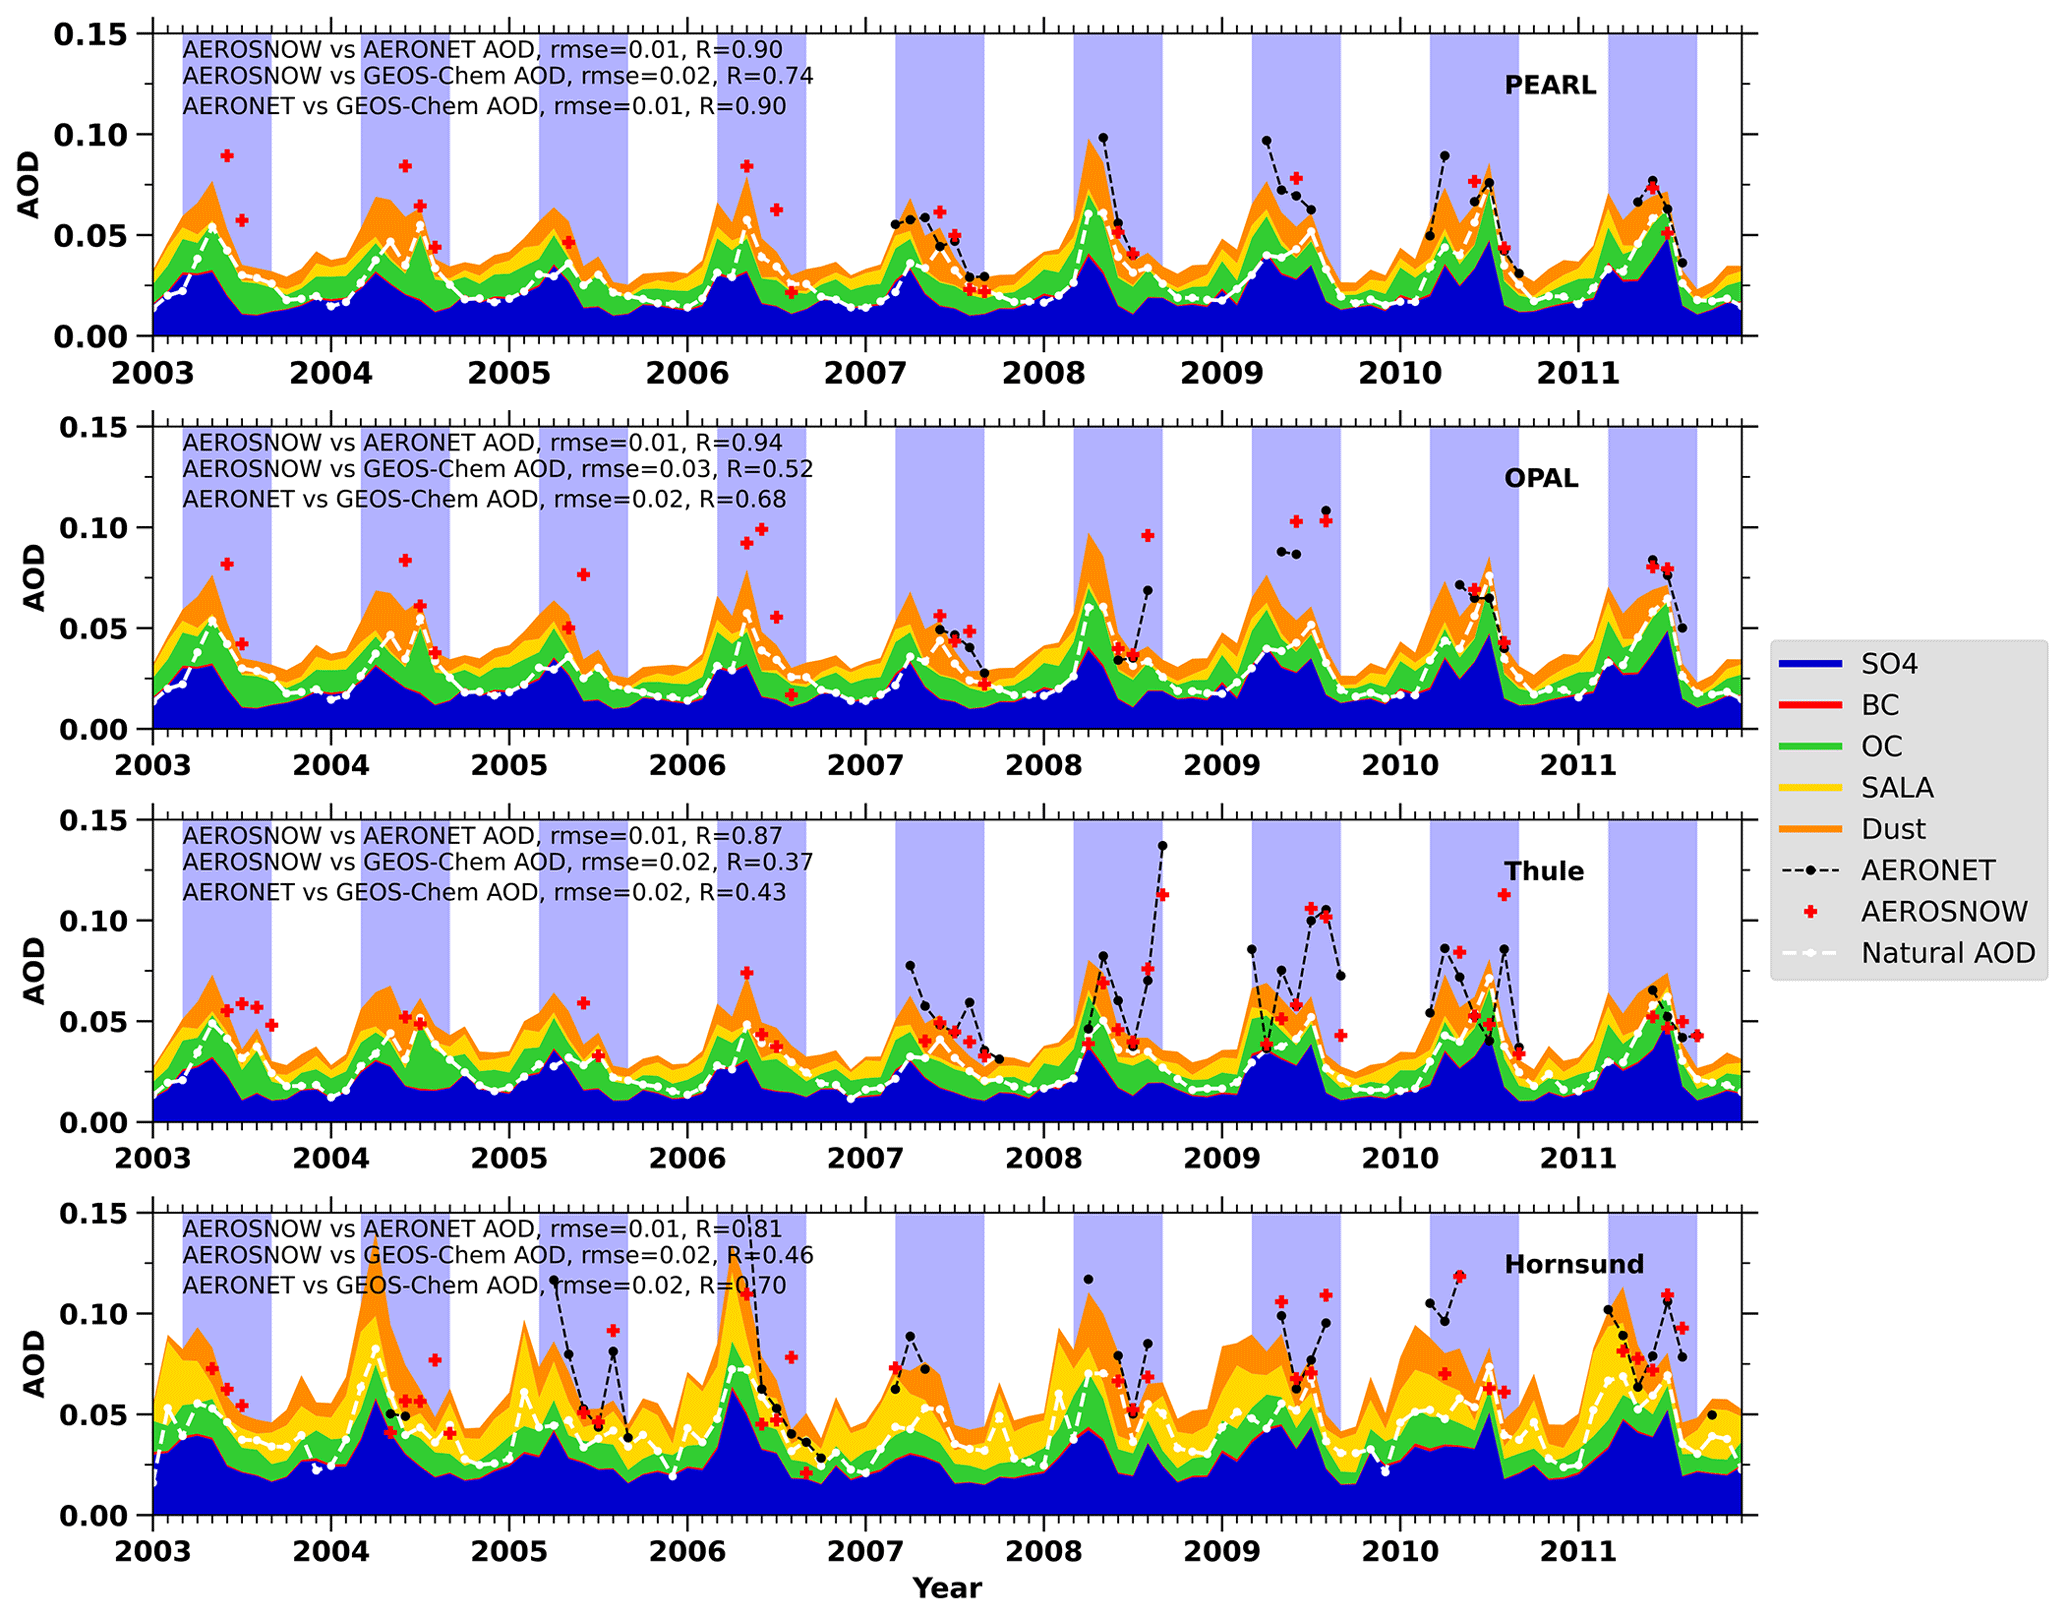
Figure 2The monthly average time series of GEOS-Chem AOD, speciated and natural, and the AERONET-observed and AEROSNOW-retrieved AOD dataset by Swain et al. (2024) at the AERONET stations: PEARL, OPAL, Hornsund, and Thule. The vertical blue shades show MAM and JJA periods. Annotations for each time series show root mean square error (RMSE) and the Pearson correlation coefficient (R) between AEROSNOW and AERONET AODs.
The AEROSNOW and the GEOS-Chem model AODs are in good agreement with the temporal variations of AOD observed in the AERONET AOD, and particularly the good agreement observed at the PEARL AERONET station, where AEROSNOW and the GEOS-Chem model closely match the AERONET measurements. This is evidenced by values of the Pearson correlation coefficient (R) of 0.90 for both, along with confidence intervals (CIs) ranging from 0.57 to 0.98 and 0.42 to 0.84, respectively. The associated p value serves as a statistical tool for assessing the significance of the correlation within a 95 % CI. Additionally, the associated p values for this comparison are 1.5 × 10⁻⁴ and 5.9 × 10⁻⁶, respectively. Essentially, the p value provides an estimate of the likelihood that an uncorrelated system would produce datasets with a Pearson correlation coefficient at least as extreme as the one computed from these datasets.
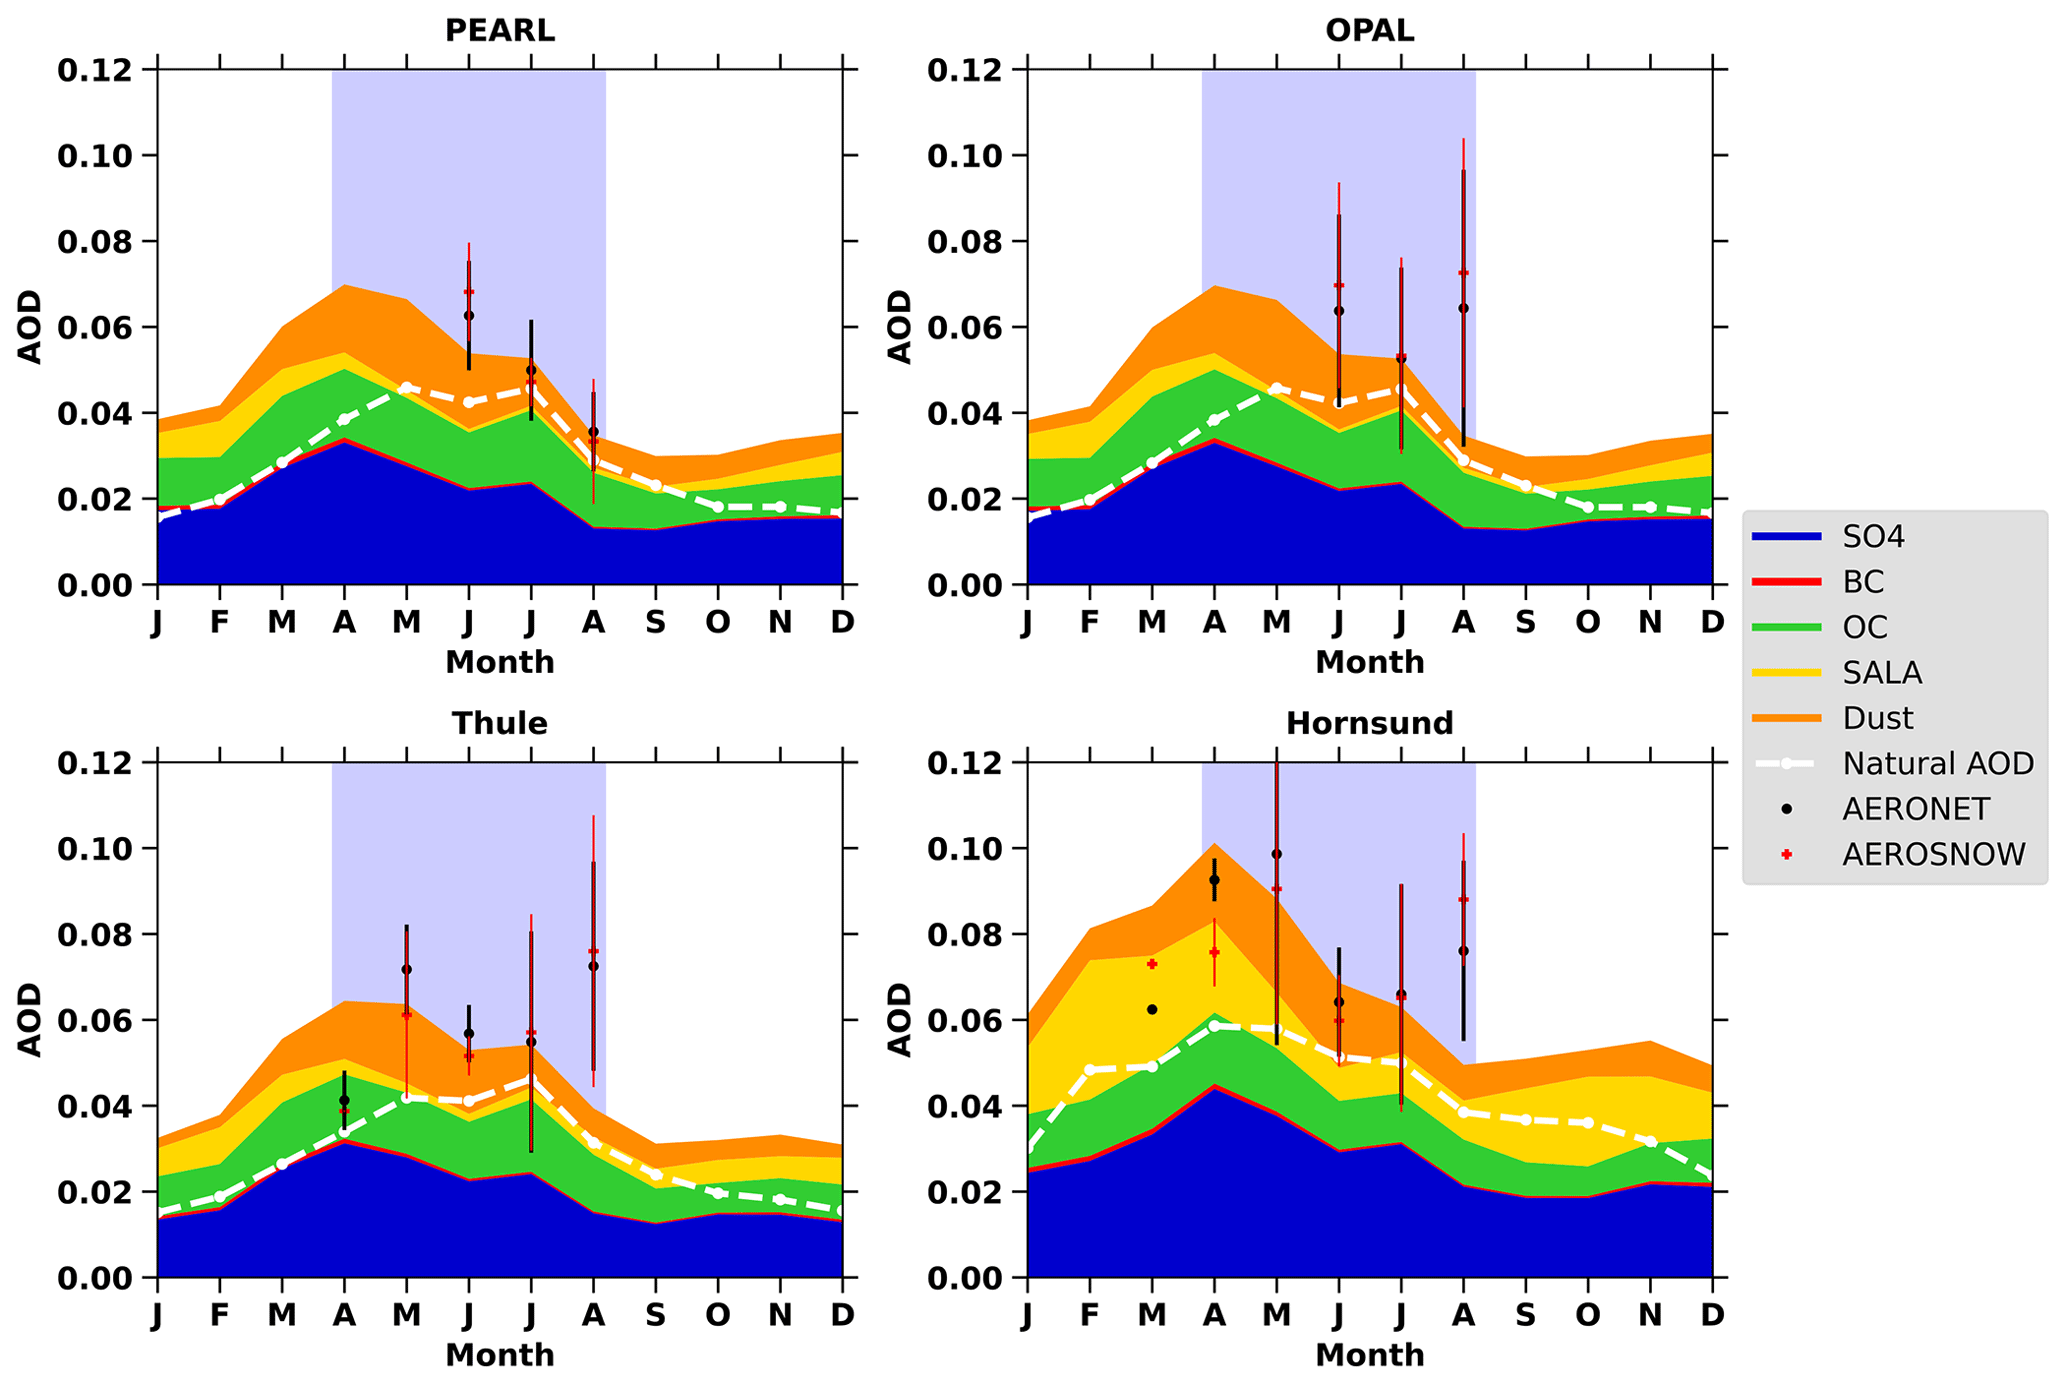
Figure 3GEOS-Chem simulated seasonal depiction of AOD components over ground-based AERONET sites such as PEARL, OPAL, Hornsund, and Thule with respect to AERONET-observed and AEROSNOW-retrieved AOD by Swain et al. (2024) for the period 2003–2011. Red and black circles denote observed monthly mean AODs, and vertical error bars show 1 standard deviation of the mean for AEROSNOW and AERONET, respectively. Stacked contours show the speciated AOD contribution from GEOS-Chem simulations. AOD from natural sources is shown as a dashed white line.
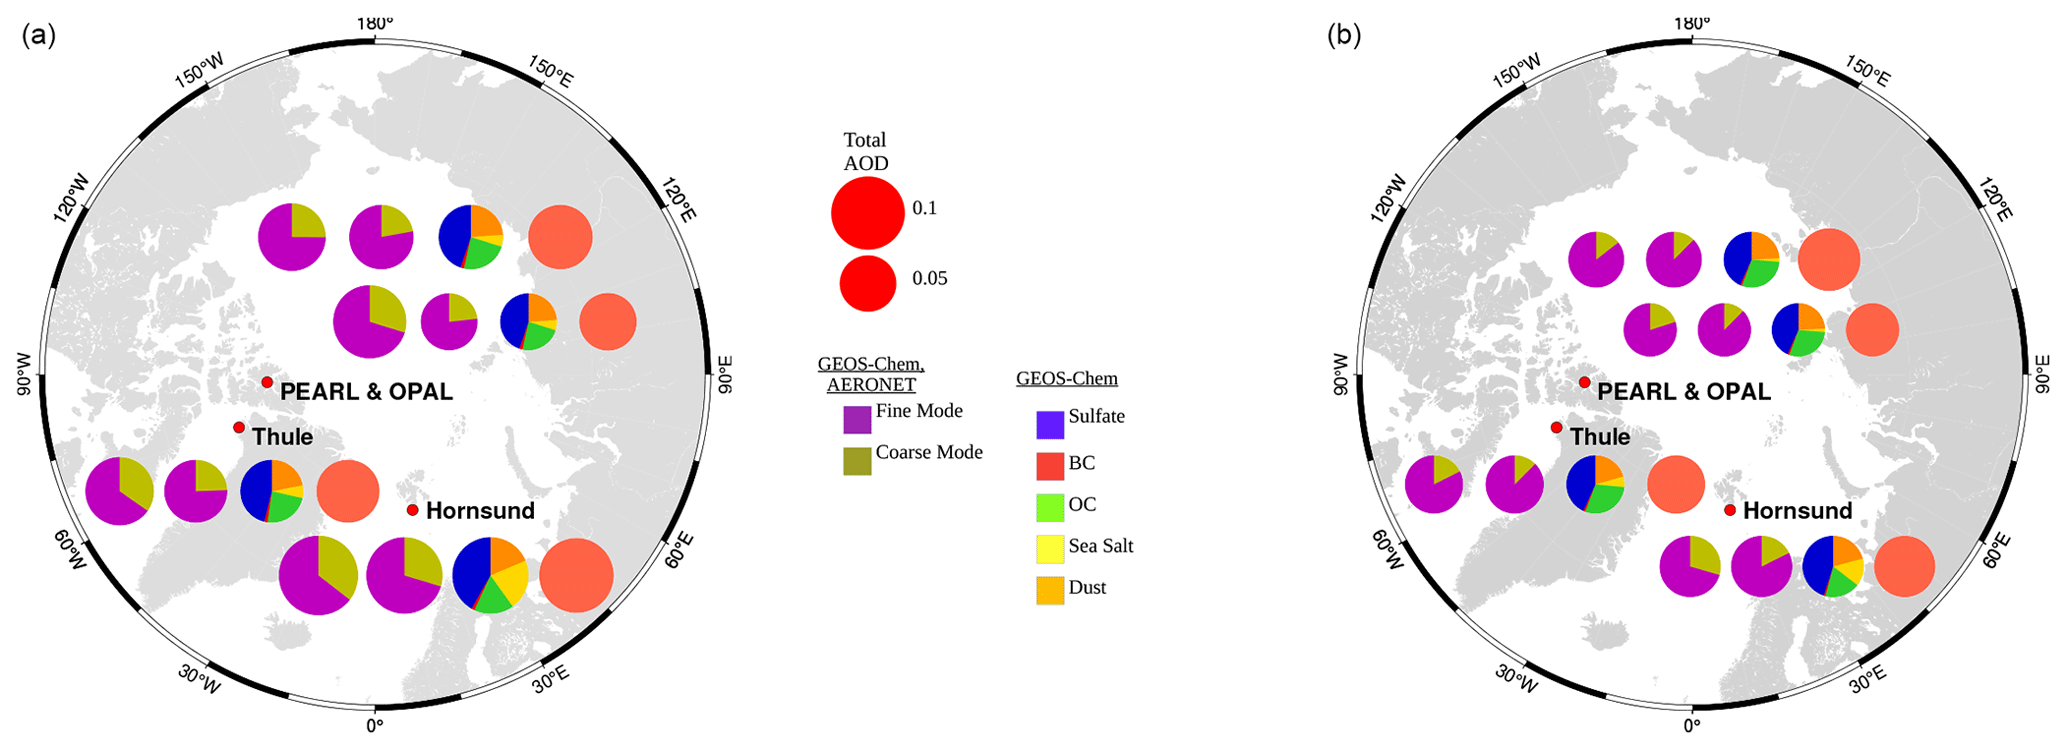
Figure 4Arctic polar map with red dots depicting the locations of the AERONET stations: (a) MAM (b) JJA. The circles from left to right of each panel show fine-mode (FM) and coarse-mode (CM) AODs from AERONET, FM and CM AODs from GEOS-Chem, the speciated pie charts of AODs from GEOS-Chem, and AEROSNOW-retrieved AODs for each station in orange. Purple represents fine mode and dark yellow represents coarse mode.
The AOD observed at PEARL, OPAL, and Thule (hereafter referred to as the “Canadian Archipelago” (CA) stations) exhibit similar temporal patterns (Fig. 2). Furthermore, the partitioning of AOD into its constituent GEOS-Chem model components appears comparable across these CA stations. Apart from a substantial sulfate contribution, the GEOS-Chem components at Hornsund indicate higher contributions of SALA and dust. The CA stations consistently display relatively low average AOD values across all three datasets, which can be attributed to their Arctic unpolluted conditions. A difference is observed in summer, as the CA stations, on average, exhibit even higher levels of organic carbon (OC) AOD compared with Hornsund (Figs. 3, 4). This difference is further evident in the seasonal average plots encompassing all four stations (Fig. 3). Additionally, on average, all three datasets (e.g., AERONET, AEROSNOW, GC) show periods of haze during the spring season over the four AERONET measurement sites.
From our analysis of Fig. 2, it becomes evident that the overall monthly mean AOD derived from GEOS-Chem simulations for the period from 2003 to 2011, across the four AERONET stations, often exhibits comparable values to the ground-based observations. These differences can largely be attributed to the fact that GEOS-Chem simulates AOD regardless of Arctic climatic conditions, including cloud cover, limited sunlight, and the spatial and temporal constraints imposed by bright underlying surfaces. By contrast, ground-based AERONET instruments and space-borne satellite observations are affected by these Arctic climatic conditions.
The R value between GEOS-Chem and AERONET AOD is larger than that between GEOS-Chem and AEROSNOW due to variations in the spatiotemporal availability of datasets (illustrated in Figs. A1, A2, and A3 in the Appendix). These differences can be attributed to the continuous availability of GEOS-Chem AOD, whereas AEROSNOW depends on the presence of cloud-free scenes. Furthermore, during the spring season, the AOD stemming from long-range transport of anthropogenic aerosols exhibits substantial levels, whereas naturally occurring AOD predominates in the Arctic during the summer months. This observation aligns with findings from a prior study conducted by Breider et al. (2017).
The GEOS-Chem model effectively simulates AOD values that exhibit good agreement with those observed by AERONET and AEROSNOW across all four AERONET stations during spring. Further, during summer, the discrepancies in GEOS-Chem AOD can be attributed to various factors, including limitations related to new particle formation and the inherent effects of a relatively coarse horizontal model resolution (2° × 2.5°). It is worth noting that refining the spatial resolution by utilizing finer nested grid simulations (0.5° × 0.666°) has the potential to enhance the R values, making them more indicative of the high values associated with short-lived aerosol loads (Yu et al., 2012; Croft et al., 2016). A qualitative assessment can be conducted by categorizing the individual components into those primarily contributing to FM or those with a greater impact on the CM fraction. We then compare the FM and CM fractions of the GEOS-Chem model with those obtained from AERONET.
In Fig. 4, we present the seasonal AOD for spring and summer, averaged over the entire study period. For each station, four circles are displayed, illustrating (i) the FM (in purple) and CM (in dark yellow) proportions according to AERONET, (ii) the corresponding proportions according to GEOS-Chem, (iii) the AOD component speciation as per the GEOS-Chem model, and (iv) the AEROSNOW total AOD retrieval results. The size of the circles is chosen to be proportional to the corresponding total AOD.
We observe a difference in coarse-mode content between AERONET sites situated in the CA region and the Hornsund AERONET site in Spitsbergen of 11 % and 7 % during spring and summer, respectively. According to the GEOS-Chem speciation pie chart, the discrepancy in CM AOD between these locations can be attributed to the prevalence of sea salt (approximately 9 %) during the summer season (JJA). During spring, GEOS-Chem tends to overestimate AOD but has comparable results to AERONET FM AOD during the summer. The difference in FM and CM AOD between AERONET and GEOS-Chem may be linked to an overestimation of haze events by GEOS-Chem during the spring.
From the atmospheric profiles and zonally averaged contour plots of dust aerosol, we demonstrate that elevated dust layers are present over all AERONET sites during the spring season. We interpret this to indicate long-range transport. In summer, by comparison, there is much less dust because of the lack of long-range transport from lower latitudes. This observation agrees with the findings of previous studies such as Breider et al. (2017) and Stone et al. (2014).
During both seasons, as indicated by the GEOS-Chem simulations, sulfate aerosols emerge as the primary contributor to fine-mode (FM) AOD. Compared with spring, there is a decrease in sulfate aerosol levels by 3.3 % at CA sites and 4.1 % at Spitsbergen during the summer (see Table 1). In general, the summer season is characterized by a dominance of FM AOD, a trend consistent with observations from both AERONET and GEOS-Chem simulations, which agrees with the findings of Willis et al. (2018).
We observed a 6 % increase in OC and a 1.5 % increase in FM AOD over all sites during the summer compared with the spring (see Table 1). This growth in OC and the increased presence of FM AOD at PEARL, OPAL, and Thule shows the influence of boreal forest fires. This finding is in line with the insights derived from Sand et al. (2017) and Xian et al. (2022). The impact of boreal forest fires on carbonaceous aerosol load is also evident in the contour maps provided in the Appendix (Fig. A5).
The validation and evaluation statistics such as the root mean square error (RMSE) and Pearson correlation coefficient (R) are illustrated in Fig. 2, indicating a reasonable level of agreement among all three datasets. The seasonal climatology presented in Fig. 3 demonstrates a peak in AOD during the spring, consistent with the increased transport of aerosols to the high Arctic. GEOS-Chem predicts that sulfate, mineral dust, and carbonaceous aerosols are the most important contributors to AOD during both spring and summer.
3.2 Vast central Arctic sea-ice region: spring and summer aerosol processes and climatology
In this section, we investigate the AOD determined by AEROSNOW and simulated by GEOS-CHEM in the central Arctic cryosphere. We generated and examined seasonal climatologies of AOD during the Arctic spring and summer over sea ice. These climatologies are derived from both space-borne AEROSNOW retrievals and GEOS-Chem simulations. It is worth noting that the 1990s witnessed a pronounced decline in AOD, as documented by Schmale et al. (2022). This decline is attributed to two key factors: (i) reductions and changes in industrial activity following the fall of the Soviet Union; and (ii) the effectiveness of air quality legislation in Europe and North America, which contributed to a decrease in pollutant transport to the Arctic. Both led to a significant decrease in the long-range transport of aerosols and their precursors.
However, the period from 2003 to 2011 may mark a potential turning point. AOD may increase from the loss of sea-ice extent and from sub-Arctic forest fires. As a result, we calculate the percentage contributions of component AOD to identify potential changes and establish connections with Arctic boreal forest fires (Table 1).
Previous relevant research on Arctic aerosol model studies such as von Hardenberg et al. (2012), Sand et al. (2013), Ren et al. (2020), Sand et al. (2017), Breider et al. (2017), Sand et al. (2021), Schmale et al. (2021), and Zhao et al. (2022), as well as reanalysis datasets such as Xian et al. (2022), have primarily focused on regions characterized by the dark ocean and open land surfaces. Consequently, our current study marks the first instance in which a view of aerosols over the highly reflective central Arctic sea-ice region is presented, by integrating both satellite- and model-based perspectives.
In a manner analogous to the analysis presented in Fig. 2 where we explored the temporal evolution of total AOD and component AOD using AEROSNOW and GEOS-Chem at AERONET stations, we now investigate the AOD load evolution over time across the vast central Arctic sea-ice region during the period 2003–2011.
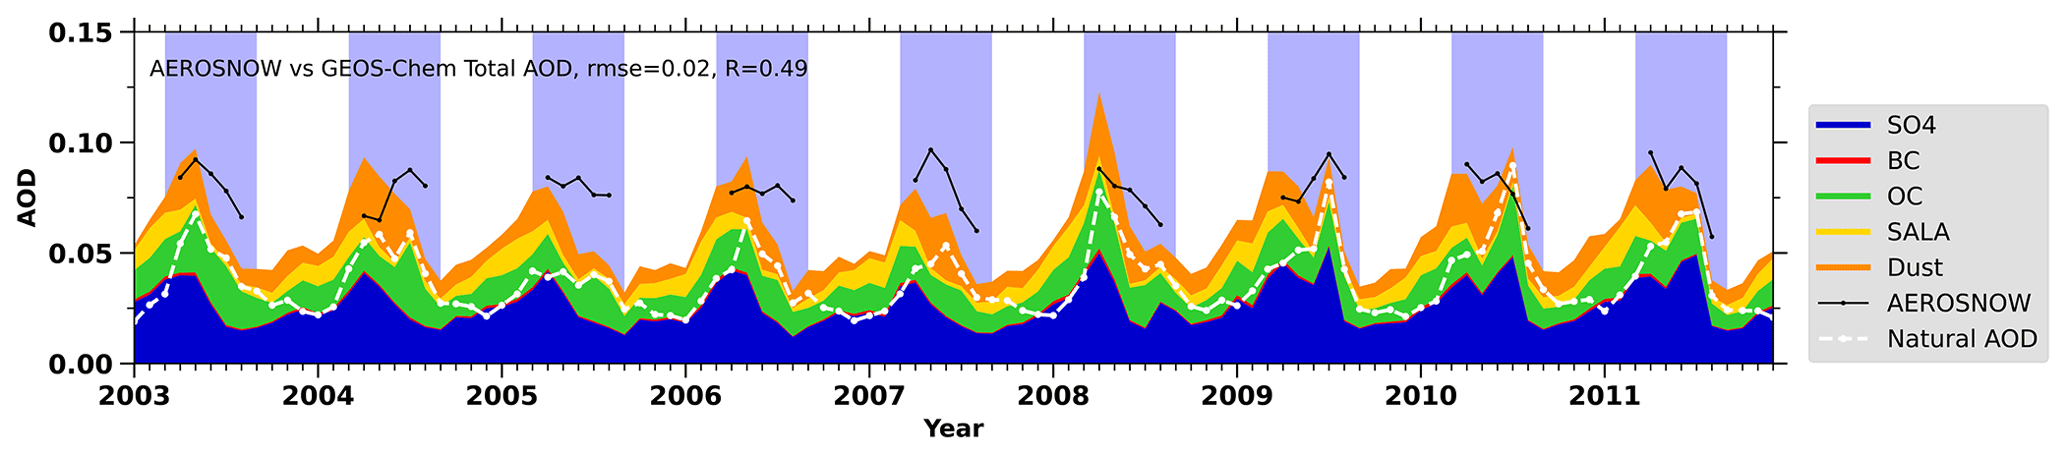
Figure 5Monthly mean time series of GEOS-Chem speciated local natural AOD and AEROSNOW-retrieved AOD by Swain et al. (2024) over Arctic sea ice. The blue shades show the MAM and JJA periods. Annotations for each time series show RMSE and R between different AODs.
As illustrated in Fig. 5, we observed GEOS-Chem and AEROSNOW AOD values of R = 0.49 and RMSE = 0.02 (Fig. A4). GEOS-Chem simulations showed higher and lower AOD during spring of the years 2009 and 2007, respectively. When analyzing the seasonal climatology from 2003 to 2011, GEOS-Chem and AEROSNOW results demonstrate reasonable agreement during spring (see Fig. 6) but differences in summer. During summer local sources of aerosol in unpolluted air (see the dashed white line in Fig. 6) are the most important sources of central Arctic aerosol.
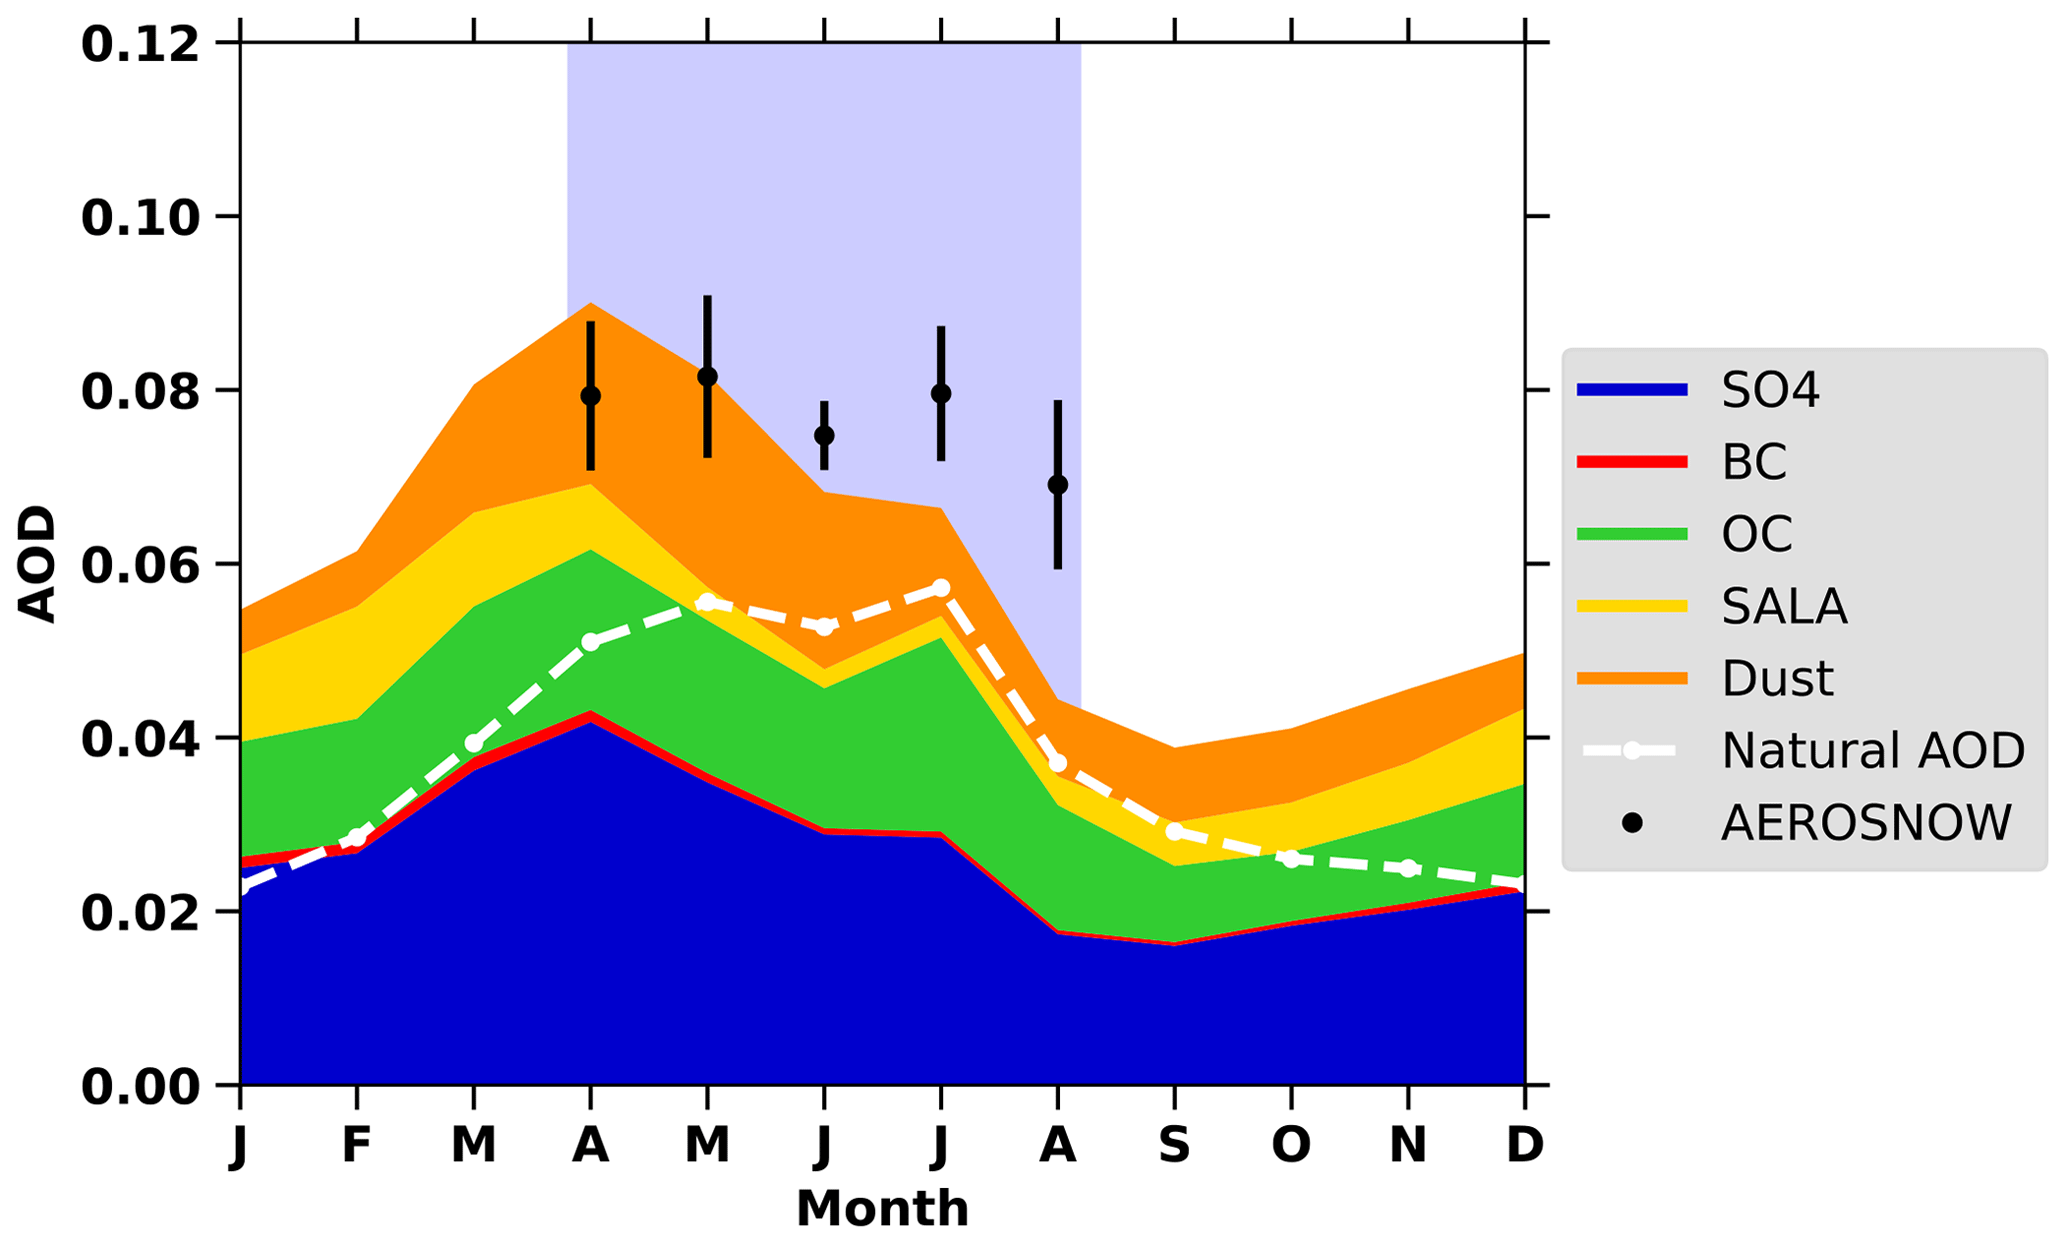
Figure 6The seasonally depicted AOD over the central Arctic cryosphere with AEROSNOW-retrieved AOD by Swain et al. (2024) is averaged over the period 2003–2011. The average AODs are shown as black circles, and vertical bars show 1 standard deviation of the mean for AEROSNOW. Stacked contours show the speciated AOD contribution from GEOS-Chem simulations. AOD from natural sources is shown as a dashed white line.
In spatial comparisons, GC simulations tended to underestimate AOD along the periphery of Alaska by −12.3 %, whereas they overestimated AOD along the Bering Strait, northern European, and Siberian Arctic sea-ice regions during spring by 21.7 % with respect to AEROSNOW (Fig. 8).
From a comparative analysis of the seasonal climatology spanning 2003 to 2011, it becomes evident that the AOD derived from GEOS-Chem is lower than that obtained from AEROSNOW (see Fig. 6). We propose that these differences observed in spring (high AOD) and summer (low AOD) may be attributed to the combined impact of (i) the increase in long-range transport during spring, giving rise to Arctic haze events; and (ii) the decrease in long-range transport and increase in precipitation during summer, compared with spring, resulting in elevated wet scavenging effects. The zonal averages of precipitation for the Arctic region are also depicted in Fig. A7.
We note that the model underestimates AOD levels north of 70° N spatially across the extensive central Arctic cryosphere during the summer, with a difference of −10.6 %, as illustrated in Fig. 8. By contrast, the GC overestimates AOD along the marginal sea-ice zones adjacent to Siberia and Greenland by 19.5 % but underestimates AOD along the Canadian Archipelago region by 9.3 %.
It is conceivable that the model has not adequately accounted for the natural secondary aerosol formation driven by an increase in open ocean emissions due to sea-ice loss, as suggested by Breider et al. (2017), Schmale et al. (2021), and Gong et al. (2023). There is also a possibility that frequent new particle formation over the high Arctic pack ice, influenced by enhanced iodine emissions, could play a role, as discussed in Baccarini et al. (2020). Furthermore, it confirms the recent noteworthy perspective emphasized by Schmale et al. (2021), urging further integration of mechanisms governing summertime natural Arctic aerosol emissions, their evolution, and their transport into the models in order to constrain their effects on the dynamically evolving baseline of the warmer Arctic. This perspective underscores the significance of Arctic natural aerosols in the context of contemporary Arctic climate change, emphasizing that the dynamic evolution of the Arctic natural aerosol baseline and its varied regional characteristics is true. The impact of cloud contamination on AEROSNOW retrievals has been minimized by using the strict cloud masking algorithm (Jafariserajehlou et al., 2019). However, for the AOD retrieval, even though we implemented rigid cloud masking, it is not possible to completely rule out the potential influence of remaining cloud impacts (Jafariserajehlou et al., 2019).
Figure 7Mean climatological MAM (top panels) and JJA (lower panels) GEOS-Chem-simulated total and speciated AOD over central Arctic sea ice averaged for 9 years from 2003 to 2011.
On the whole, the GEOS-Chem model's annual and seasonal total AOD demonstrates reasonable agreement with AEROSNOW AOD over the central Arctic sea ice during spring, implying that the component AOD within this GEOS-Chem model is realistically portrayed. However, during summer, a spatial difference becomes evident over the central Arctic sea-ice region. The spatial distribution of monthly mean total AOD and component AOD over Arctic sea ice, averaged from 2003 to 2011, is presented in Fig. 7, with the first row displaying springtime and the second row showing summer patterns.
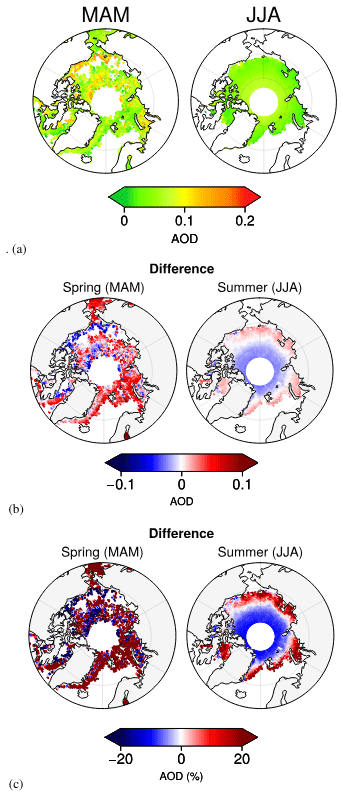
Figure 8Mean total AOD for MAM and JJA for (a) AEROSNOW-retrieved total AOD (a) (Swain et al., 2024) and (b, c) the difference and relative percentage difference between the GEOS-Chem model simulation (see Fig. 7) and AEROSNOW-retrieved total AOD averaged from the year 2003 to 2011.
During spring, we observe higher AOD values ranging from 0.1 to 0.12 in proximity to the continents of Europe and Asia, while smaller values in the range of 0.07–0.08 are evident towards the Canadian Archipelago (CA) and Greenland. These spring AOD values are primarily influenced by the long-range transport of aerosols originating from human activities in Europe, America, and Asia at lower latitudes. This explanation is corroborated by the zonally averaged contour plots in Fig. A5 and is consistent with the findings of Stone et al. (2014). Figure A6 shows the transport features through vertical AOD accumulation between 600 and 300 hPa. In Fig. 5, the spring maxima observed in 2003, 2006, and 2008 are the result of the transport of aerosols from widespread agricultural burning at high latitudes, as suggested by (Saha et al., 2010) and (Stohl et al., 2006).
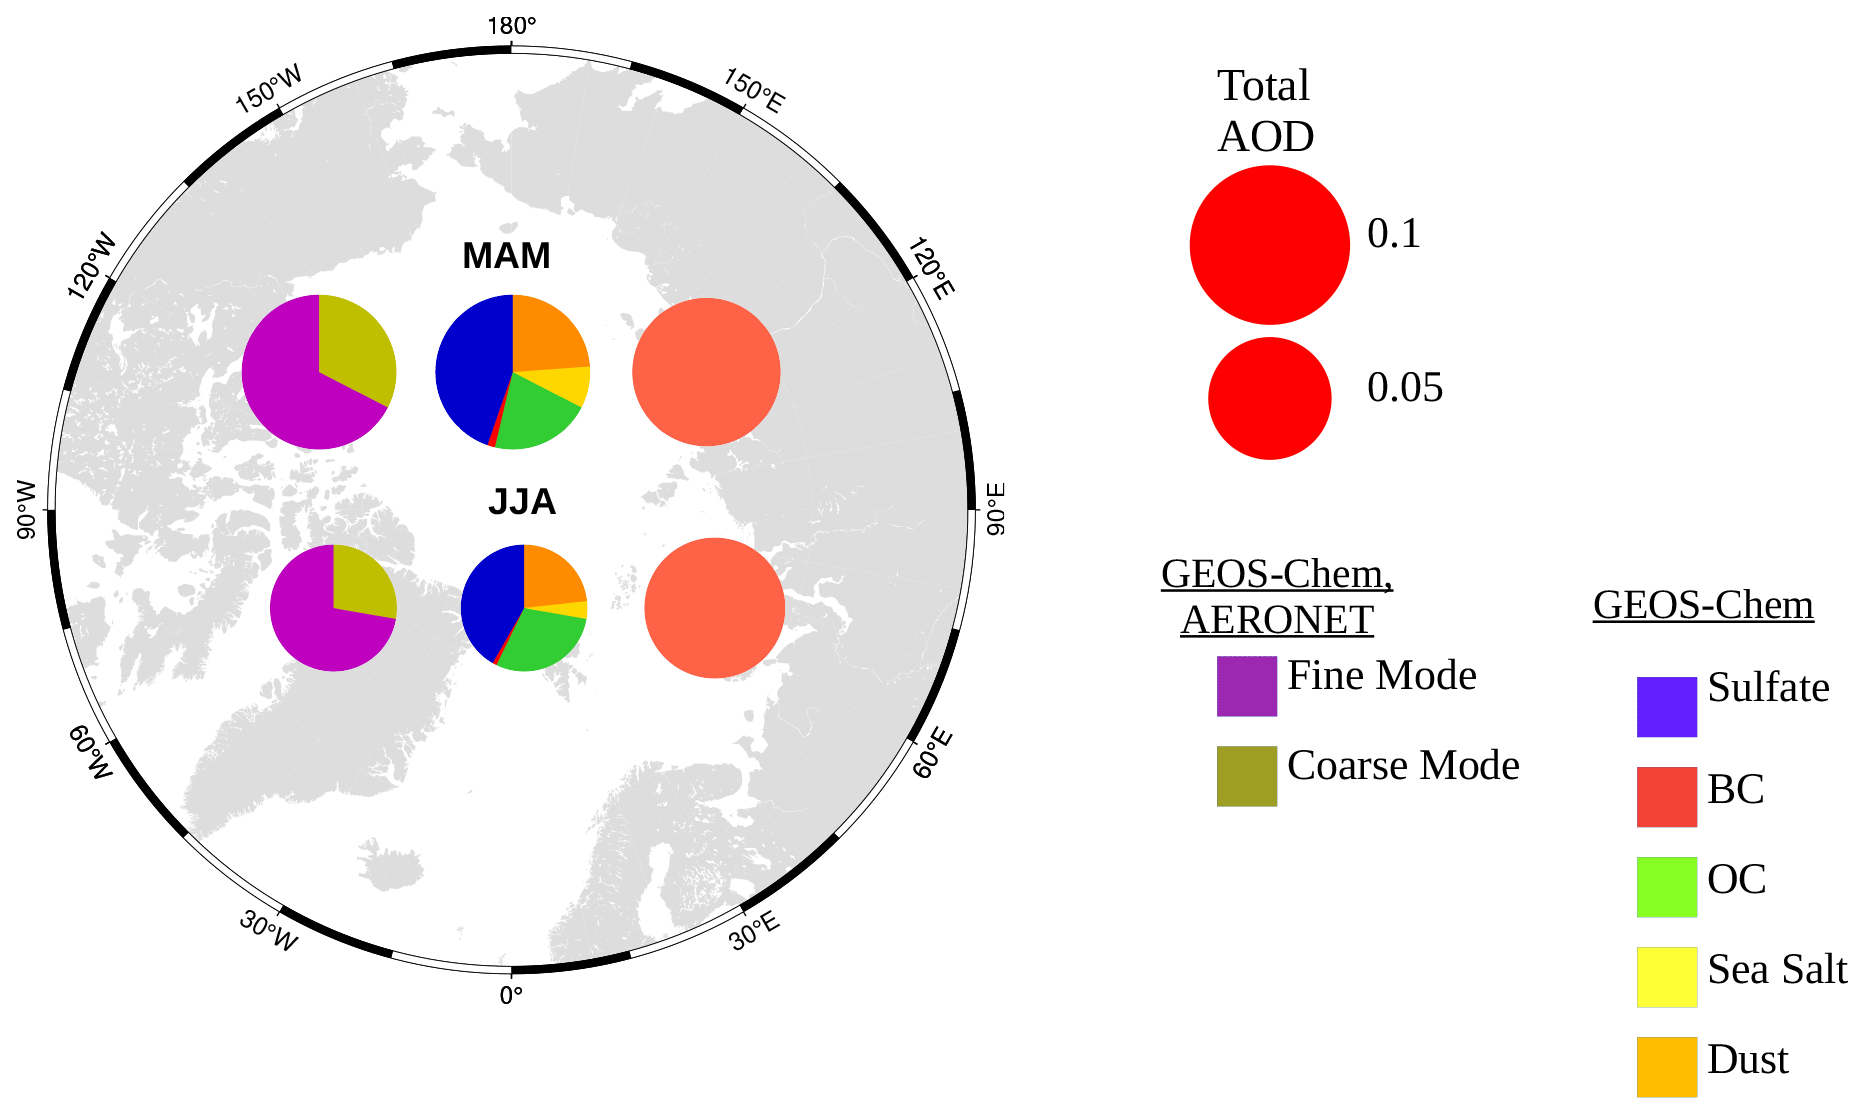
Figure 9Arctic polar map showing pie charts from left to right: FM (purple) and CM (dark yellow) AOD (left), speciated AODs from the GEOS-Chem model (middle), and AEROSNOW-retrieved AOD (right) over Arctic sea ice for JJA and MAM, respectively.
The component AODs exhibit more pronounced variability during spring compared with summer, reflecting the diverse sources of aerosols in these respective seasons, as previously described. Fine-mode (FM) AOD remains dominant in both spring (comprising 72 %) and summer (comprising 67 %), but it holds a relatively higher proportion during spring, as illustrated in Fig. 9.
Further, comparatively to spring, during summer the contribution of sulfate to the total AOD over Arctic sea ice decreases by 3.0 %, while carbonaceous aerosols exhibit an 8.4 % increase when averaged over the study period (as depicted in Fig. 9 and Table 1). This surge in black carbon and organic carbon (BC+OC) during summer, when long-range transport from mid-latitudes is less important, underscores the significance and penetration of Arctic boreal forest fires into the high Arctic sea-ice-covered regions (as highlighted in Fig. 11). The black box in Fig. A5 delineates the latitudinal range from which forest fires originate.
As depicted in Fig. 7, the GEOS-Chem model indicates that sea salt, originating from sea spray, is prominent over regions including the Greenland Sea, Norwegian Sea, North Atlantic, and the Bering Strait (North Pacific). We attribute this to the elevated wind speeds, particularly during the spring season. The maximum AOD values (ranging from 0.09 to 0.08) over the sea ice are typically observed during April and May, while the minimum values are recorded in July, August, and September. The latter observation can be largely attributed to increased levels of precipitation and subsequent wet scavenging, as illustrated in Fig. A7.
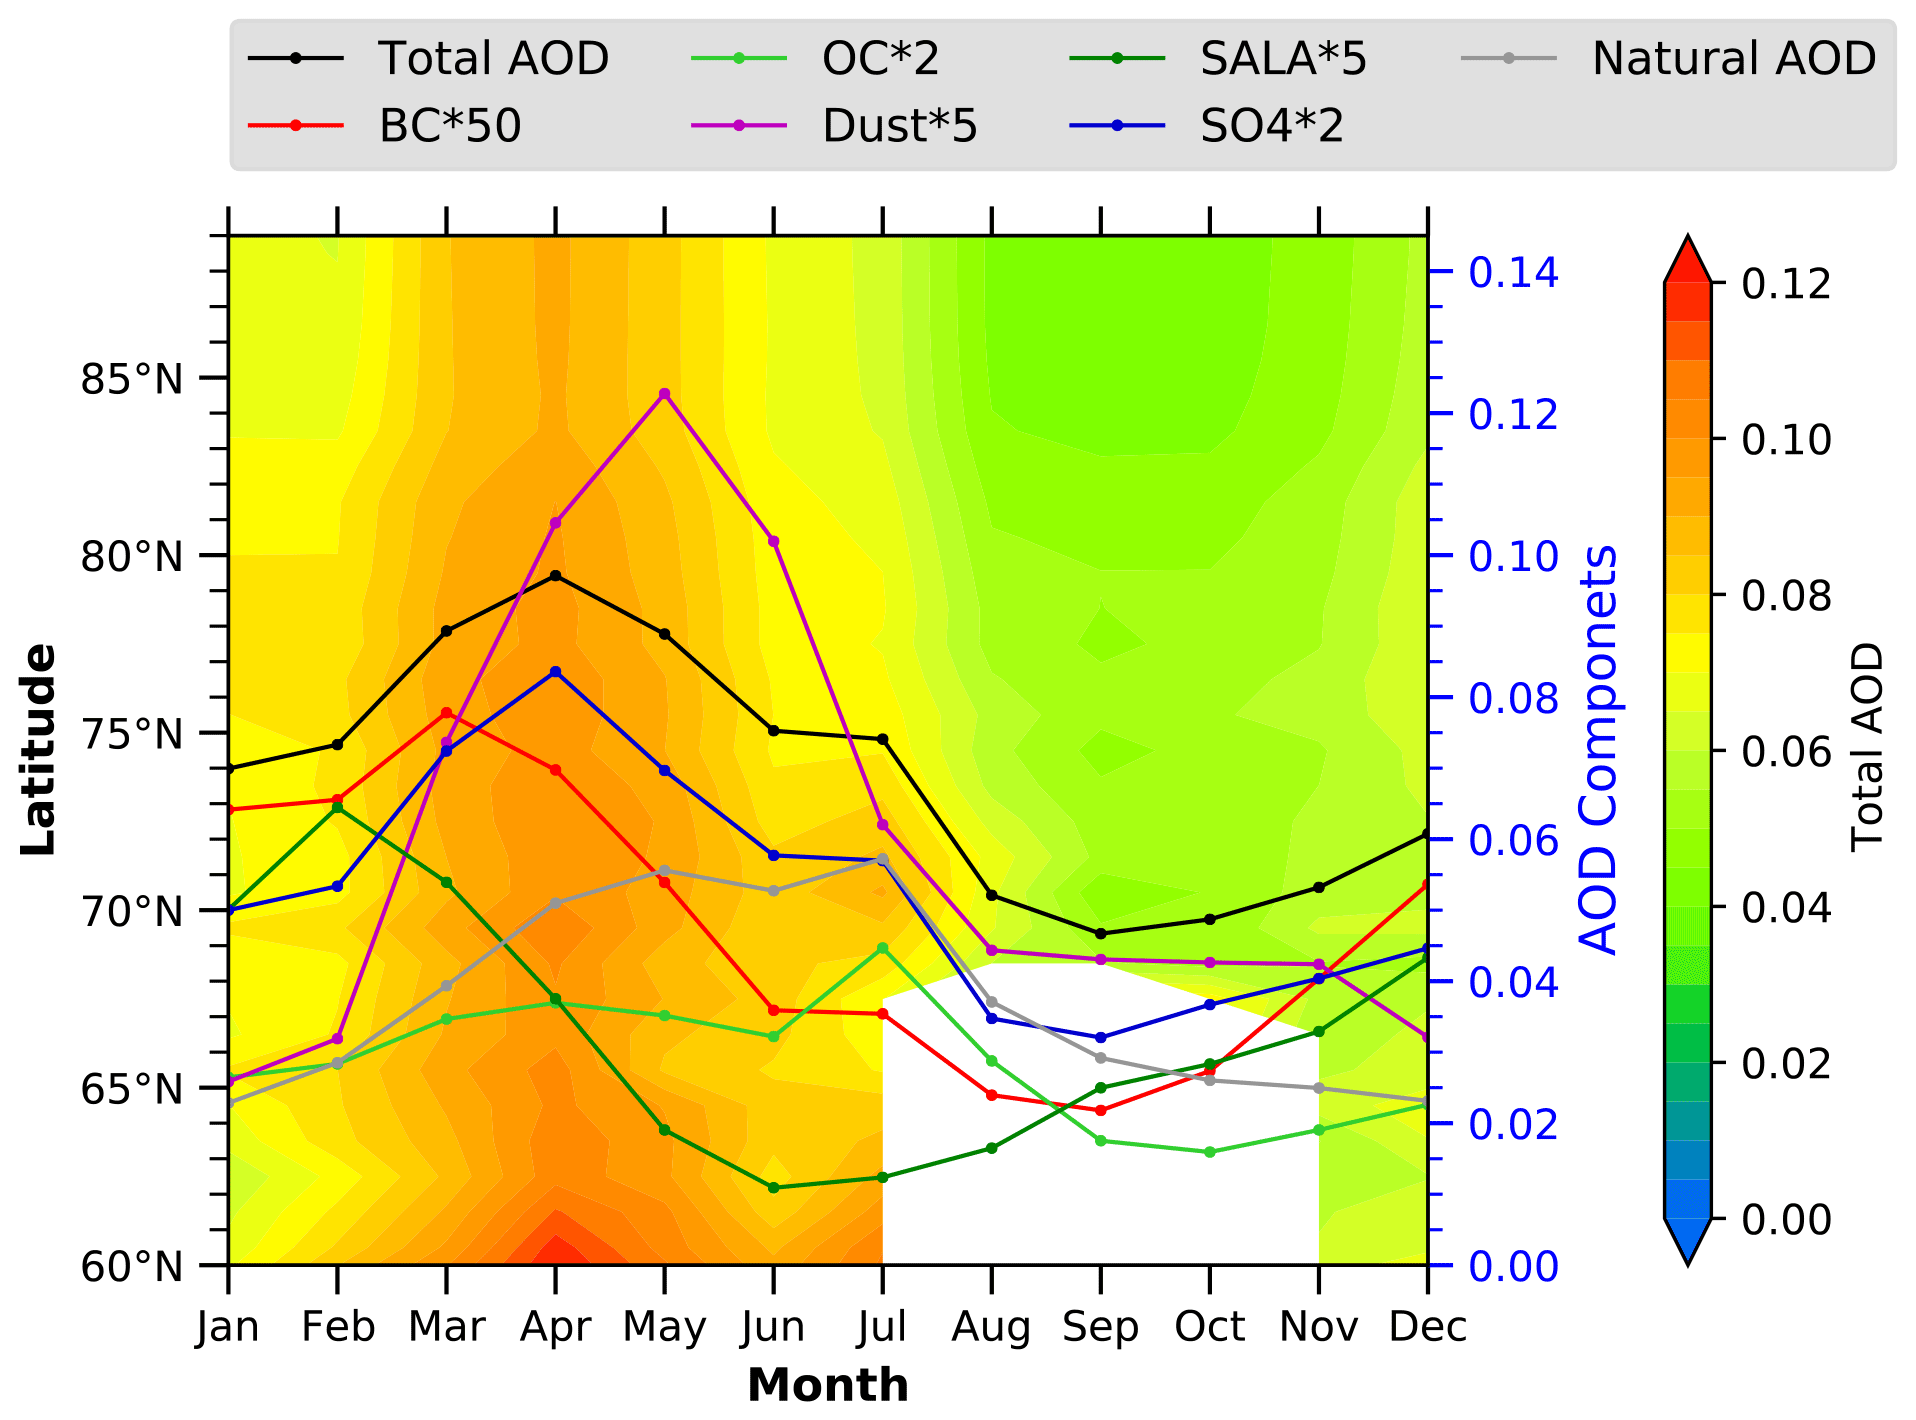
Figure 10Zonal averages of total AOD over Arctic sea ice as a function of month and latitude for the GEOS-Chem model, superimposed with the climatological (2003–2011) seasonal cycle of total and speciated AOD over Arctic sea ice. The total AOD is monthly averaged in the period 2003–2011. The white space shows the receding of sea ice from 60 to 70° N over the Arctic in summer.
Figure 10 shows the zonal monthly average variation in AOD components simulated by GC over the period 2003–2011. The reduced AOD levels observed during summer above the Arctic sea ice can be attributed to increased aerosol removal rates. When examining the zonal average AOD from 60 to 90° N over sea ice, we observe that AOD values are highest at 60° N and gradually decrease with increasing latitude (see Fig. 10). Notably, the OC+BC AOD exhibits a peak during the summer, while all other aerosol components decrease. This is likely a result of wet scavenging, given that in GEOS-Chem, 50 % of OC emitted from various primary sources is hydrophobic, as documented in previous studies (Cooke et al., 1999; Chin et al., 2002). The combined factors of hydrophobicity and increased boreal forest fires make carbonaceous aerosols (BC and OC) a potentially significant contributor to the total AOD over Arctic sea ice during the summer season.
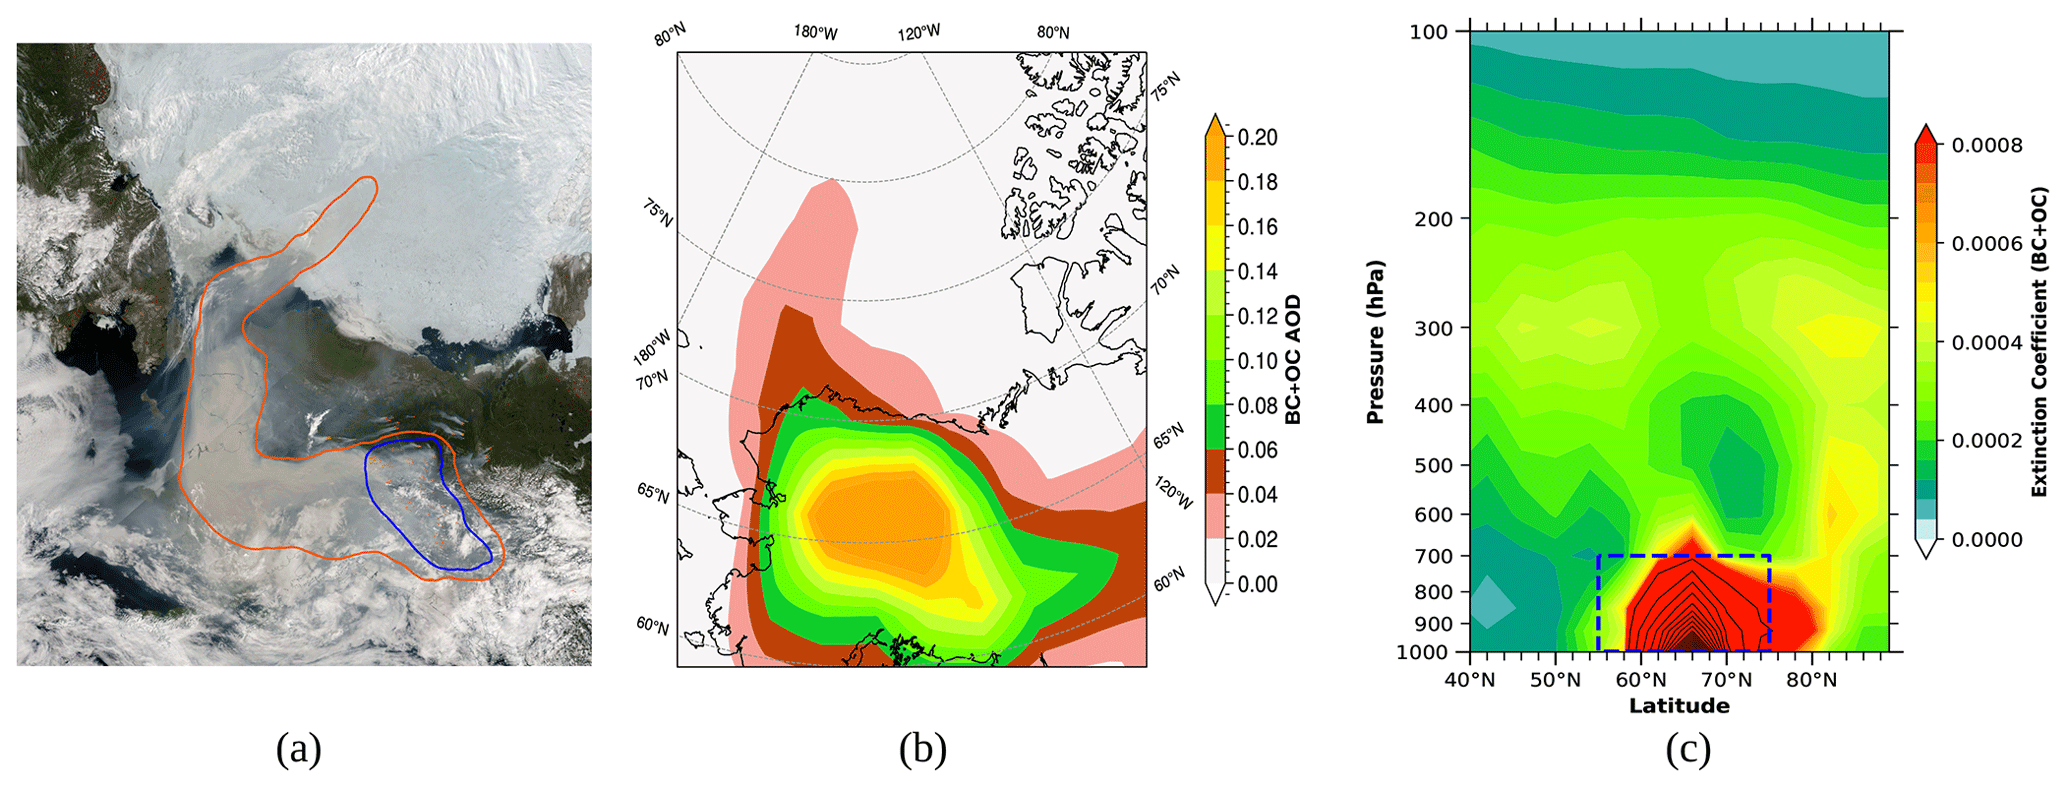
Figure 11An example of boreal forest fire smoke intrusion into the high Arctic from fires originating in Alaska. (a) True-color Terra satellite imagery taken on 1 July 2004. Red dots within the blue contour show satellite-detected fire hotspots. (b) GEOS-Chem BC+OC AOD simulated for 1 July 2004. (c) GEOS-Chem vertical extinction coefficient of carbonaceous aerosols per layer around the source area.
This work introduces an integrated study of aerosols over the central Arctic cryospheric region by using a new Arctic aerosol dataset, AEROSNOW (Swain et al., 2024), together with GEOS-Chem model simulations and AERONET AOD observations during the period from 2003 to 2011.
- i.
Filling the observational data gap – spatiotemporal AOD observation in the central Arctic sea-ice region:
Ground-based measurements of AOD are available at the selected four AERONET stations, which are close to the sea ice in the central Arctic in the period from 2003 to 2011. Reliable AOD measurements above the sea ice in the Arctic cryosphere have not yet been retrieved from satellite-borne instruments such as MODIS, MISR, OMI, CALIOP, and others for a variety of reasons. In the absence of observations of AOD from space across the central Arctic cryosphere, research on AOD has focused on model studies, at best constrained to AOD measurements from and around AERONET stations and those above the ocean in the Arctic. These studies have emphasized that the lack of aerosol observations within the central Arctic cryosphere is a major obstacle to improving our understanding of aerosol sources and sinks in this region (Sand et al., 2017; Schmale et al., 2022; Xian et al., 2022). In this study, the AEROSNOW AOD together with the FM and CM AOD from the AERONET station in the high Arctic has been used (a) to assess the quality of the AOD simulations in a chemical transport model, GEOS-Chem; and (b) to assess changes in the AOD in the sea-ice regions of the central Arctic in the period from 2003 to 2011 during Arctic amplification.
- ii.
Aerosol processes in the central Arctic sea-ice region:
Across the Arctic cryosphere, particularly over sea ice, comparisons of AEROSNOW AOD and GEOS-Chem model AOD simulations show disparities in spatial and temporal patterns. Fine-mode aerosols predominate in both spring and summer, with a higher presence in the latter season. Anthropogenic aerosols play a significant role in spring, while naturally occurring aerosols become more prominent in summer. The fraction of carbonaceous aerosols (BC and OC) to total AOD is higher in summer than in spring at all AERONET sites and over sea ice. Sulfate and dust fractions are slightly greater in spring. Further, during spring, zonally the AOD extends from 60 to 90° N across the sea-ice region, whereas during summer the extension is reduced due to elevated precipitation and subsequent wet deposition over the Arctic (see Fig. 10), corroborating previous findings (Garrett et al., 2011).
Despite high levels of precipitation and wet deposition, primary carbonaceous aerosols, particularly organic carbon (OC), peak in summer due to their hydrophobic nature. The combined factors of hydrophobicity and the rising incidence of boreal forest fires in the Arctic make carbonaceous aerosols (BC and OC) increasingly significant contributors to total AOD over Arctic sea ice in summer, which is in line with Willis et al. (2018) and Xian et al. (2022). BC AOD levels are prominent in both seasons, driven by long-range transport of anthropogenic pollution in spring but not in summer.
According to the GC simulations, the fraction of sulfate to AOD decreases over Arctic sea ice, whereas carbonaceous aerosols exhibit a more substantial increase in summer than in spring. This finding is derived from AOD averaged from 2003 to 2011.
- iii.
Changing aerosol sources from anthropogenic to natural over the central Arctic sea-ice region:
The anthropogenic aerosol load in the Arctic has experienced a decline in recent decades, simultaneously with changes in natural processes influencing aerosols in the Arctic. These modifications are anticipated to persist and intensify, primarily attributed to the ongoing phenomenon of Arctic warming. Within the central Arctic sea-ice region, particularly during the spring season characterized by the prevalence of long-range transport of anthropogenic aerosols, there was reasonable agreement in seasonal climatology between GEOS-Chem and AEROSNOW over the period from 2003 to 2011. However, spatially, the model tends to underestimate AOD in the vicinity of Alaska by −12.3 %, while overestimating it along the Bering Strait, northern European, and Siberian Arctic sea-ice regions by 21.7 % in spring compared with AEROSNOW (see Fig. 8). By contrast, during the summer season when the Arctic mostly experiences natural aerosol loading, the analysis of seasonal climatology indicates that GEOS-Chem AOD is lower than AEROSNOW AOD (see Figs. 6 and 8).
It is important to highlight that in summer, when local aerosols prevail in the Arctic atmosphere, the GEOS-Chem model consistently underestimates AOD spatially when compared with AEROSNOW, especially north of 70° N. This underestimation is particularly pronounced over the central Arctic sea-ice region, with a difference of −10.6 %. Conversely, the GEOS-Chem model overestimates AOD along the marginal sea-ice zones adjacent to Siberia and Greenland by 19.5 % and underestimates AOD along the Canadian Archipelago region by −9.3 %. This difference may arise from the model inadequately addressing natural aerosol formation due to increased open ocean emissions from sea-ice loss, as suggested in prior studies (Breider et al., 2017; Schmale et al., 2021; Gong et al., 2023). It is also possible that new particle formation over the high Arctic ice pack occurs. This requires cold brine and yields iodine emissions (Baccarini et al., 2021).
These AEROSNOW observational and GEOS-Chem model-simulated AOD discrepancies confirm the recent perspective emphasized by Schmale et al. (2021) – indicating a rapid change in the local sources and sinks of aerosol having different regional fingerprints. Additionally, Schmale et al. (2021) underscores the need for detailed knowledge of mechanisms governing local Arctic aerosol emissions, their evolution, and their transport, urging further integration of these mechanisms into models to constrain their effects on the dynamically evolving baseline of the warmer Arctic.
It is worth noting that our integrated analysis of AEROSNOW and GC AODs in the central Arctic cryosphere confirms the perspective highlighted by Schmale et al. (2021) that the state-of-the-art models underestimate AOD and that additional, or at least changes in, local sources and sinks of aerosol are required in the models, such as GC.
The use of the advanced aerosol-retrieval algorithm, AEROSNOW, for AOD estimation over Arctic snow and ice has the potential to contribute a novel dataset for the central Arctic region. Improvements in input meteorology and consideration of natural oceanic emissions resulting from diminishing sea ice, particularly in the central Arctic region during spring and summer, hold the potential to enhance the accuracy of AOD simulations by GEOS-Chem and other state-of-the-art models.
AOD retrieved using AEROSNOW applied to AATSR observations of the reflectance in the atmosphere provides a valuable high-latitude dataset in the central Arctic during spring and summer throughout the 2003–2011 period, a time when Arctic amplification became evident and for which ground-based measurements and space-borne observations are nonexistent or sparse. We recommend employing AEROSNOW datasets to evaluate chemical transport models and to refine climate models that simulate the direct and indirect impacts of aerosols on Arctic amplification. Its use and further development and application to the growing fleet of satellites will provide a valuable set of data to constrain atmospheric models and thereby test our understanding of the sources and sinks of AOD at high latitudes.
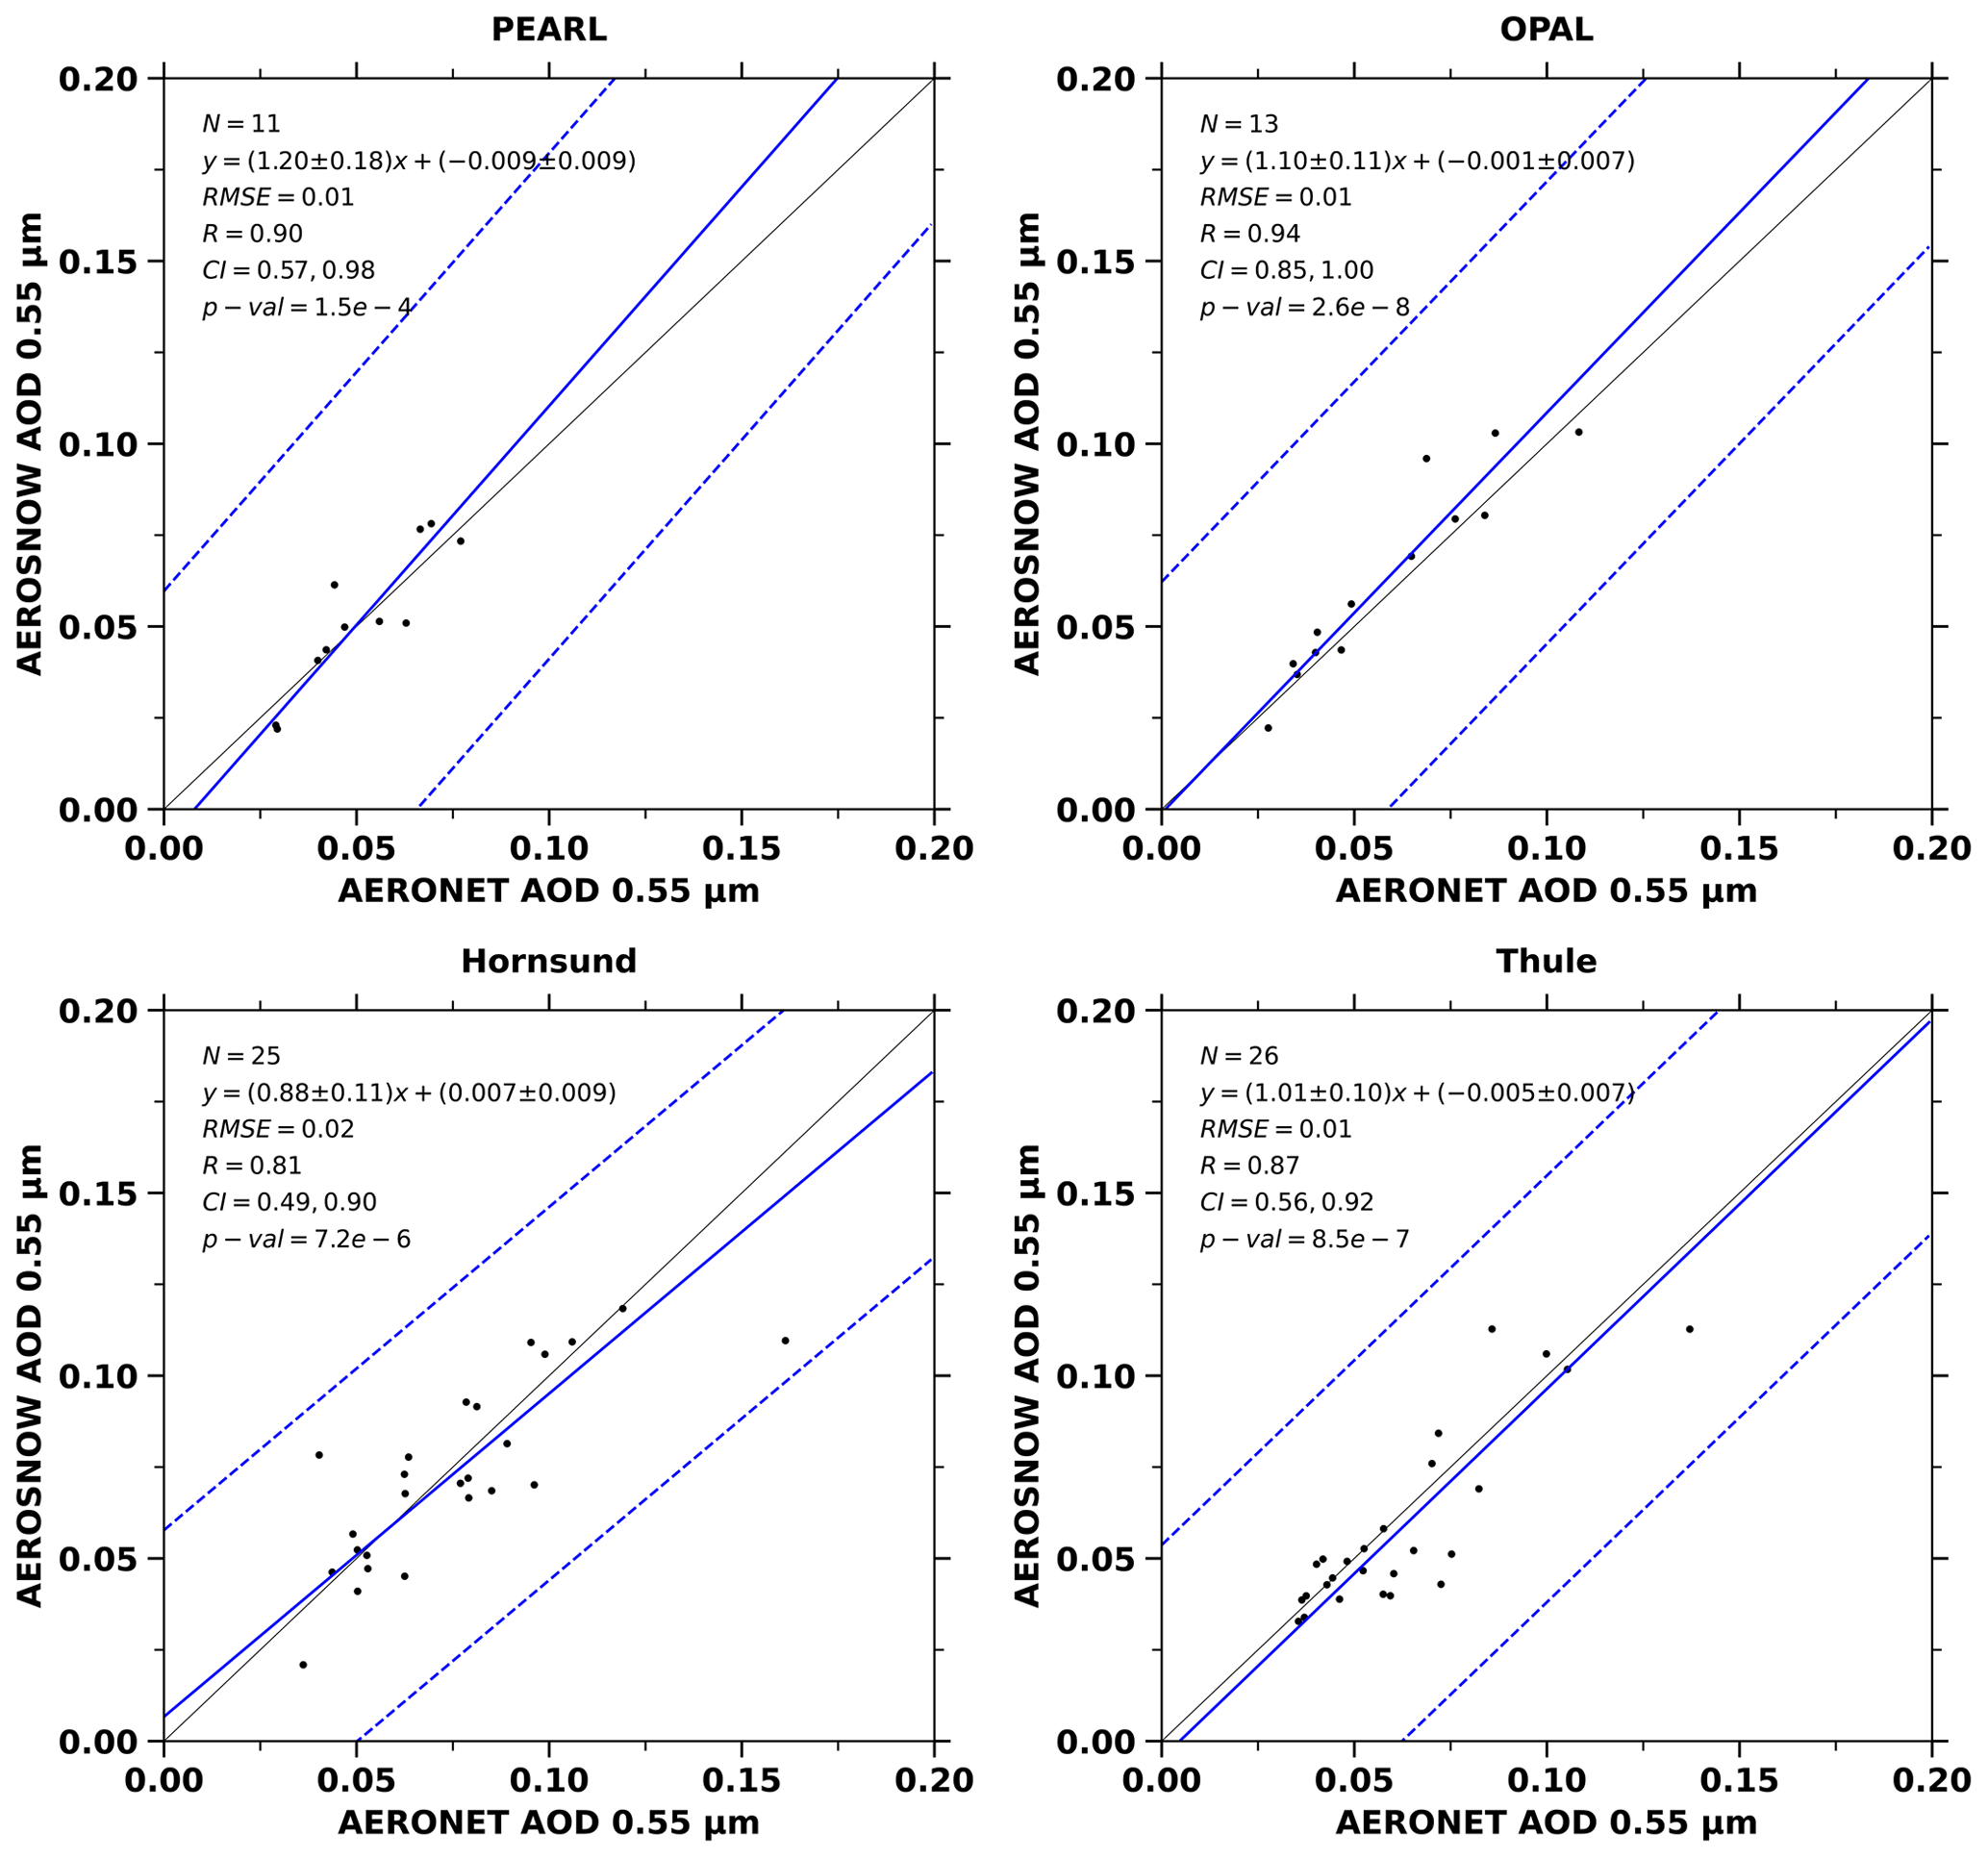
Figure A1Evaluation of the monthly average AEROSNOW and AERONET AOD collected from PEARL, OPAL, Hornsund, and Thule stations. The dashed blue lines represent the linear regression lines. This modified figure is from Swain et al. (2024).
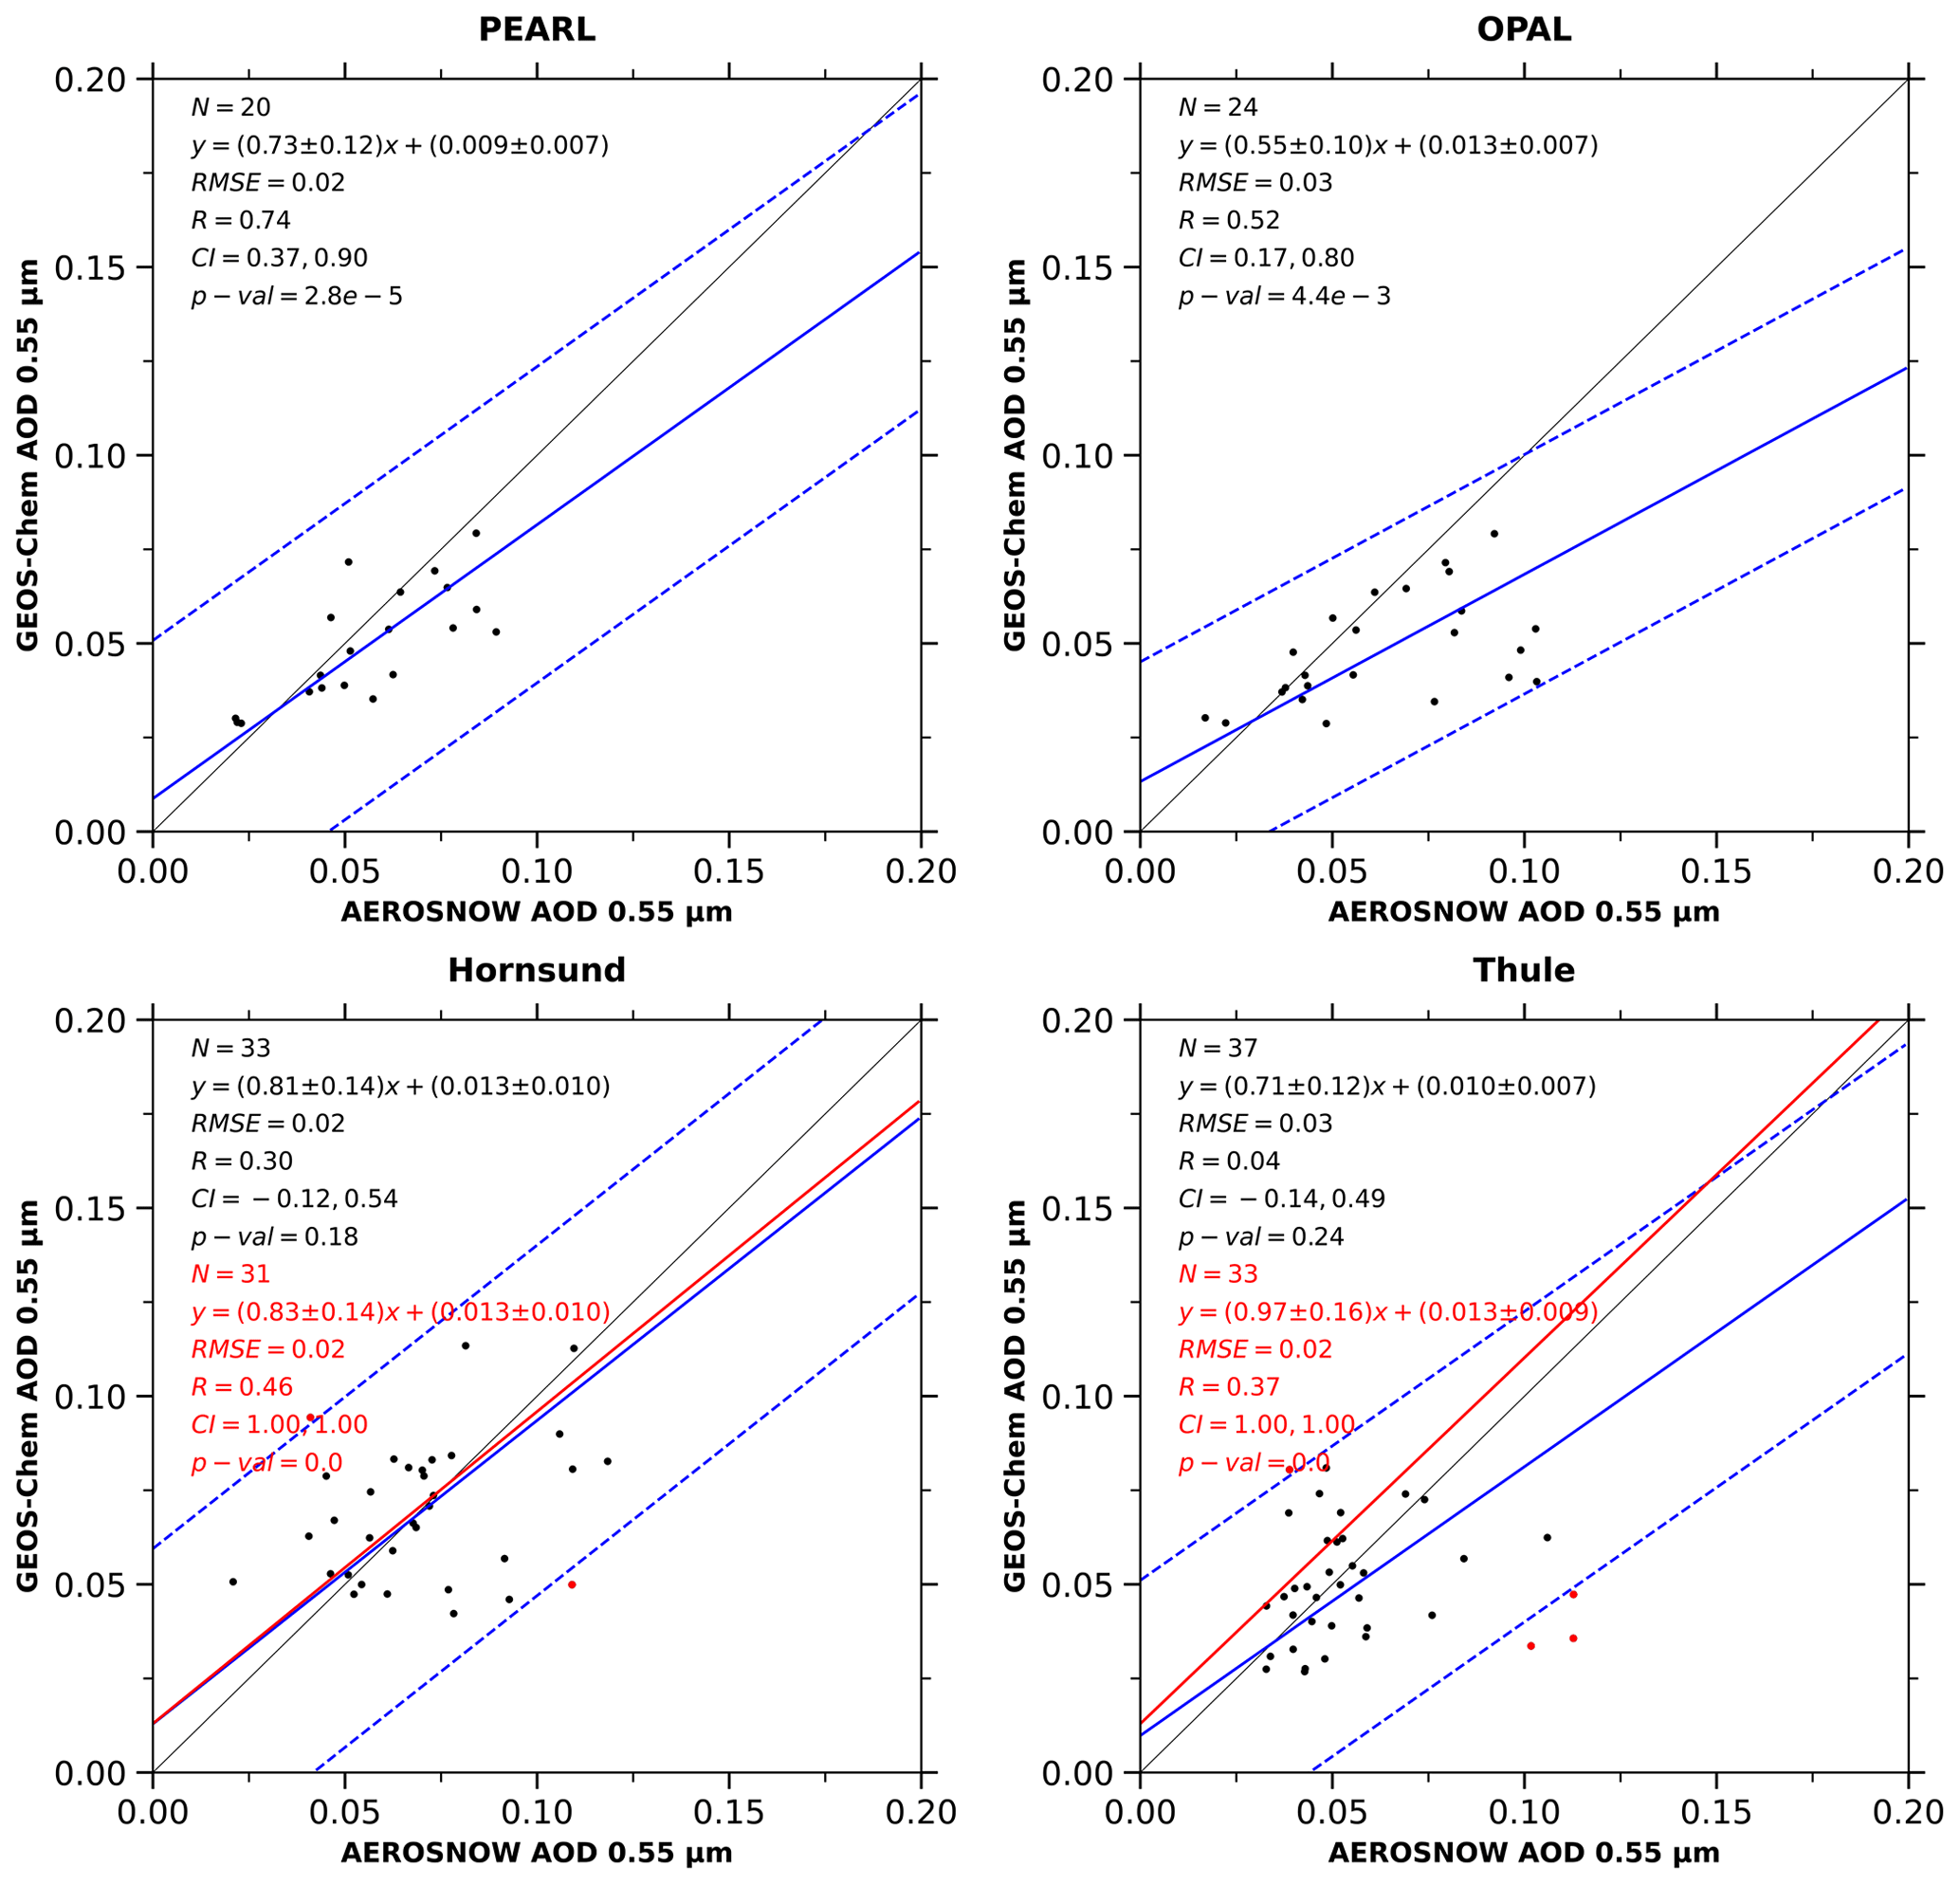
Figure A2Evaluation of monthly average GEOS-Chem AOD and monthly average AEROSNOW AOD over PEARL, OPAL, Hornsund, and Thule stations. The linear regression and 1 standard deviation lines are shown as a solid blue line and dashed blue lines, respectively. The red regression line is shown without the outliers marked as red.
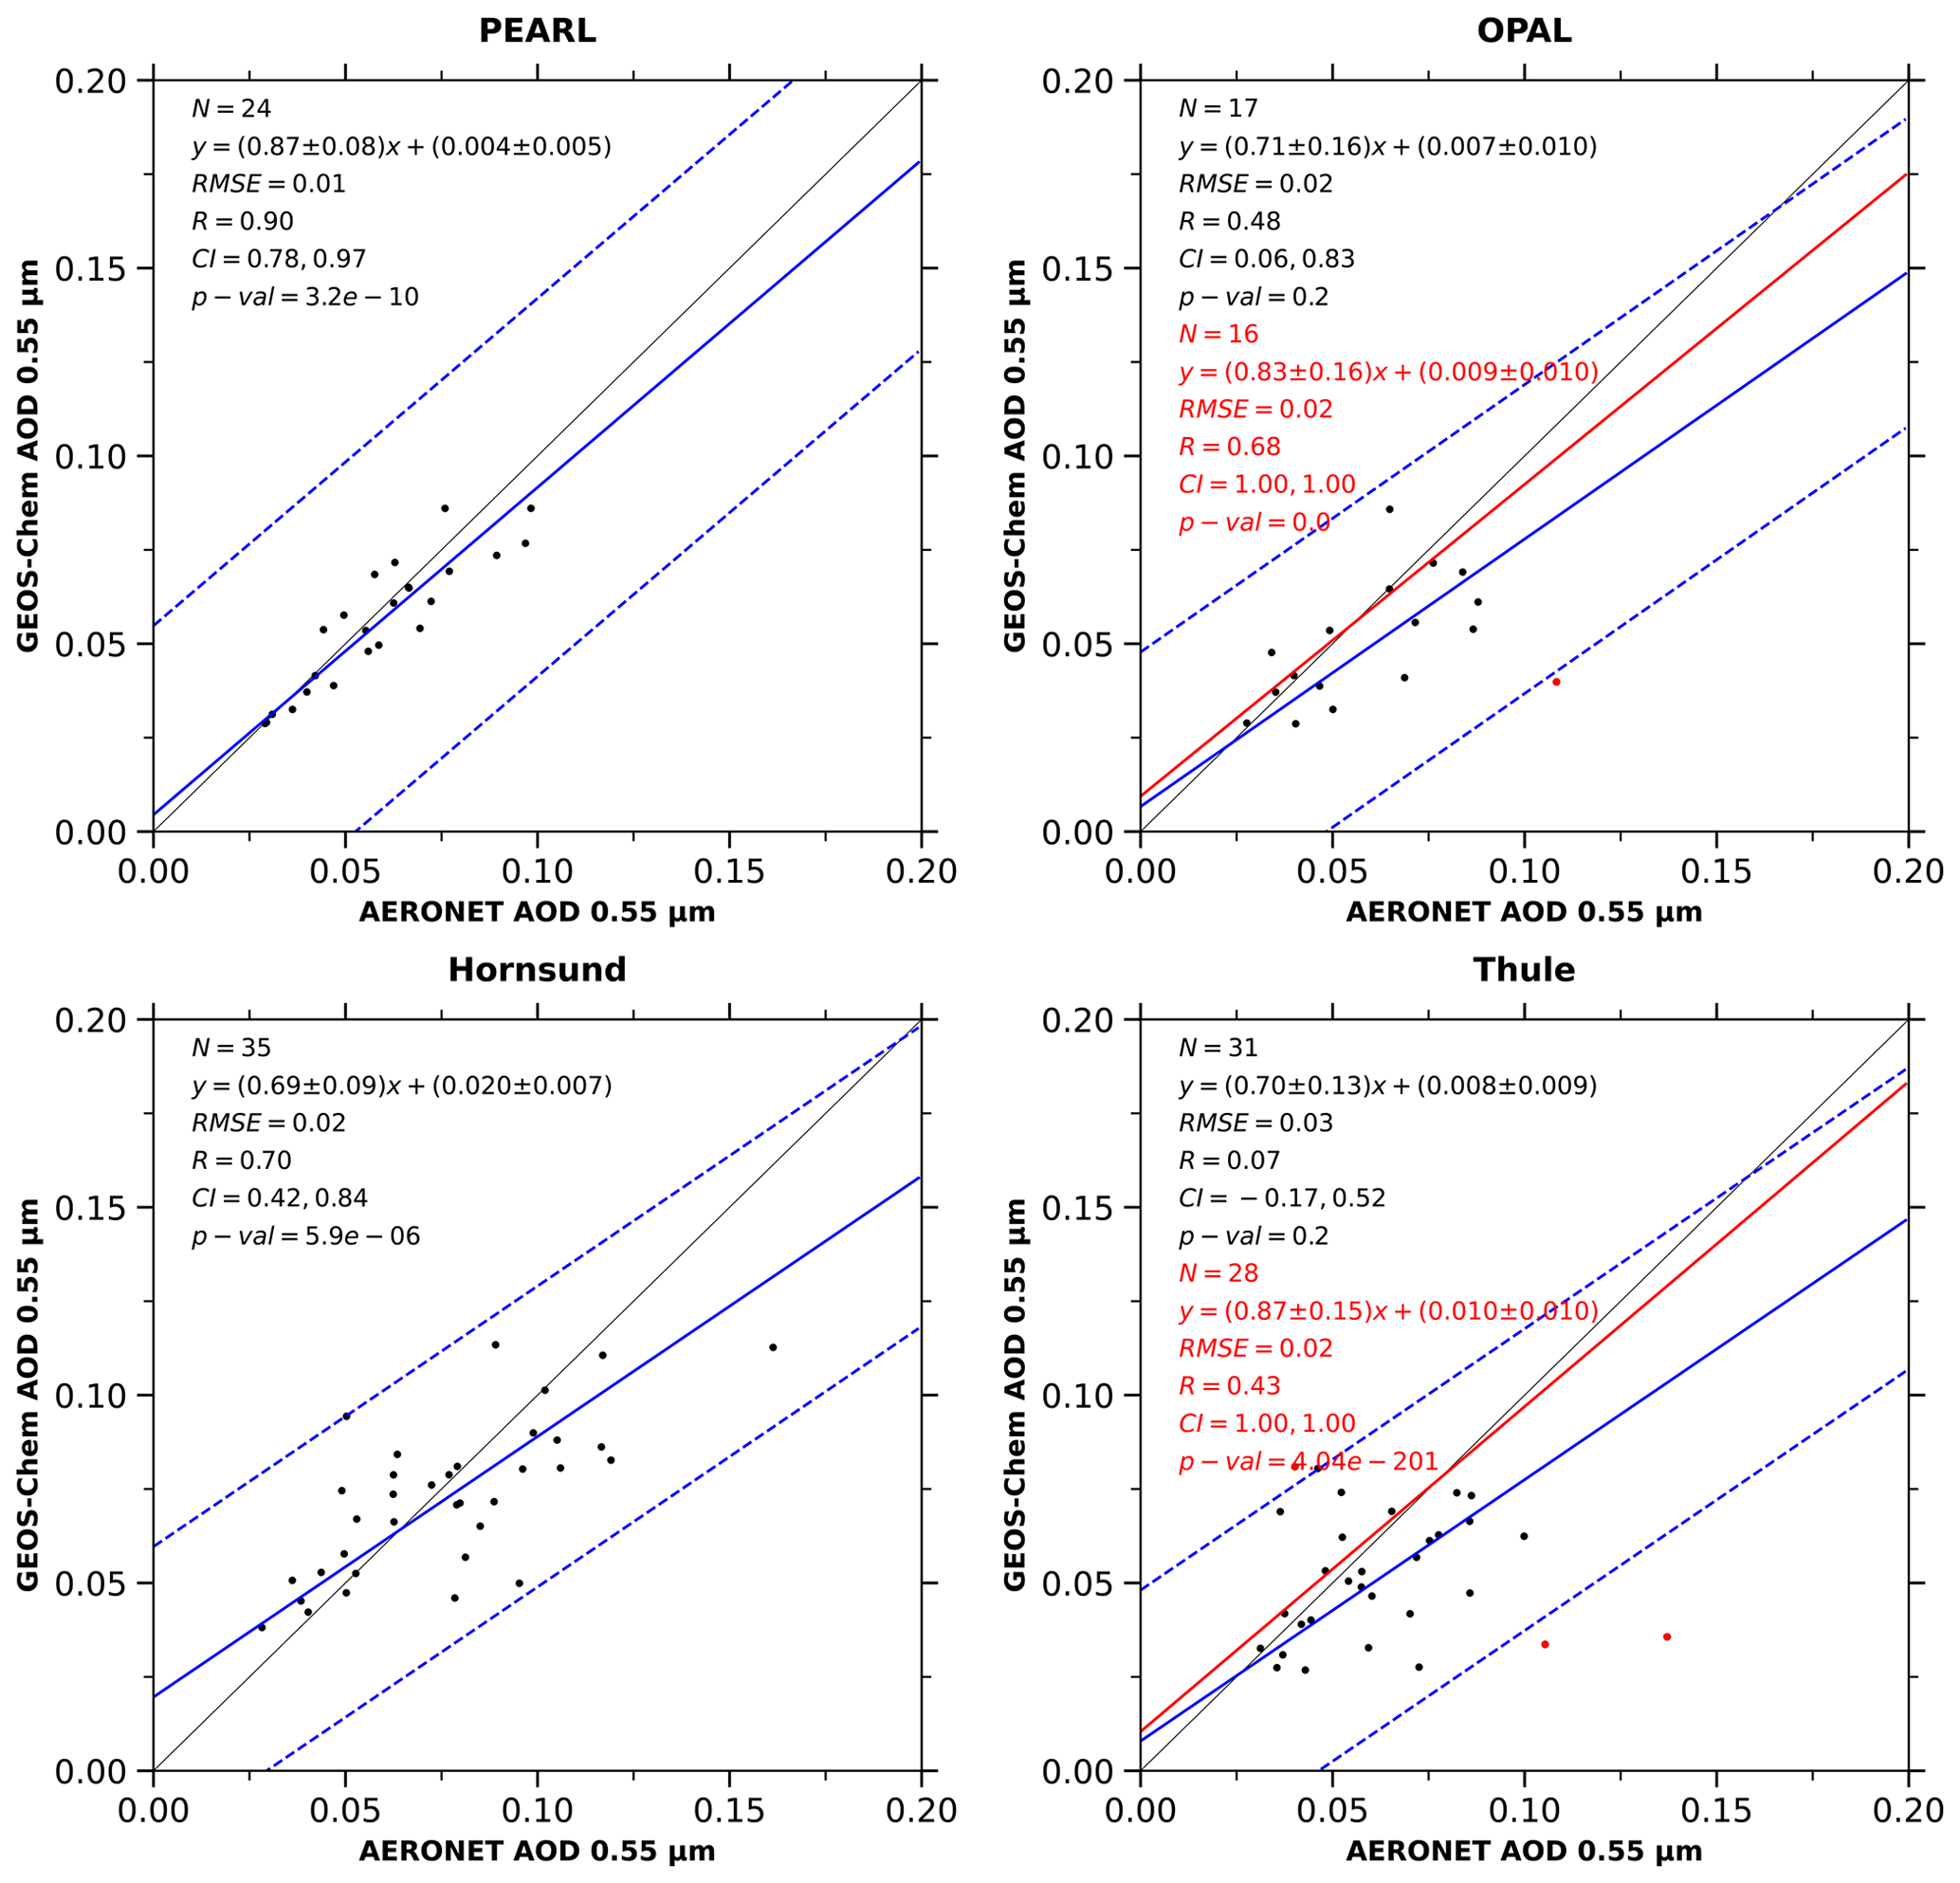
Figure A3Validation of monthly mean GEOS-Chem AOD with monthly mean AERONET observation AOD over PEARL, OPAL, Hornsund, and Thule sites. The linear regression and 1 standard deviation lines are shown as a solid blue line and dashed blue lines, respectively. The red regression line is shown without the outliers marked as red.
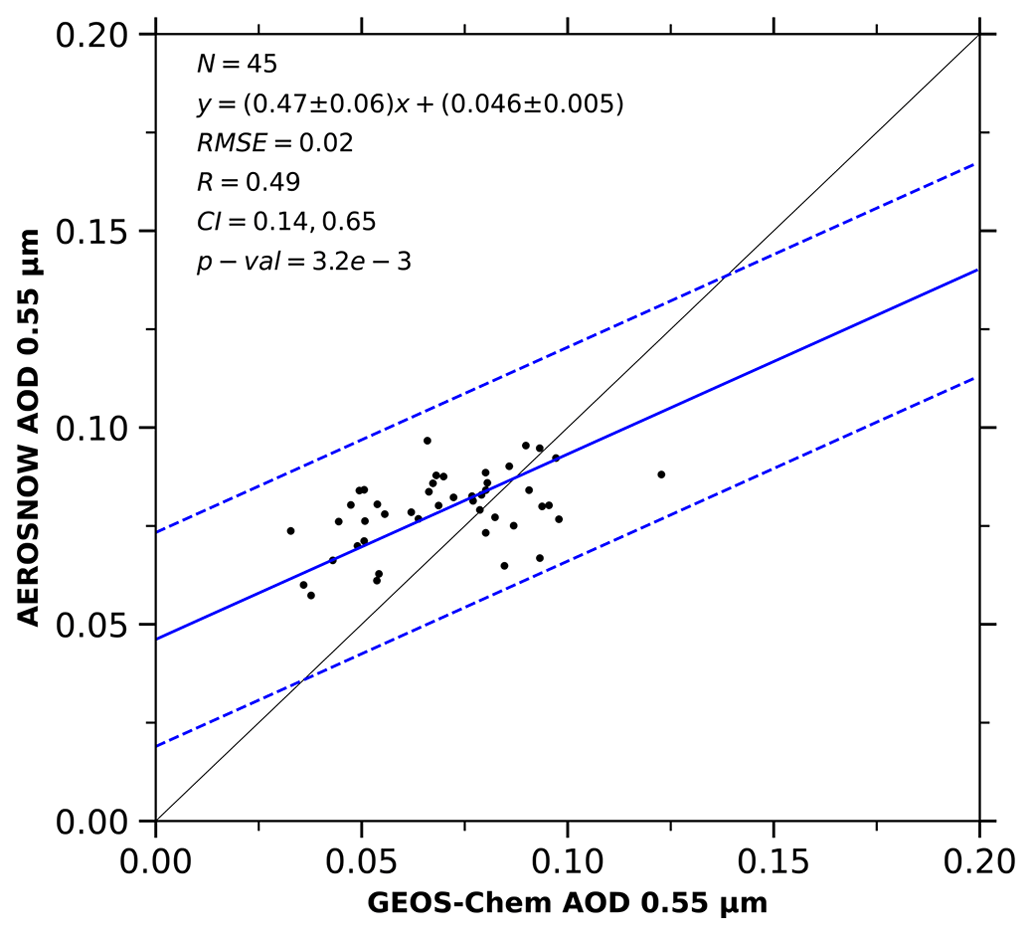
Figure A4Evaluation of monthly average GEOS-Chem and AEROSNOW AOD over vast Arctic sea ice. The linear regression and 1 standard deviation lines are shown as a solid blue line and dashed blue lines, respectively.
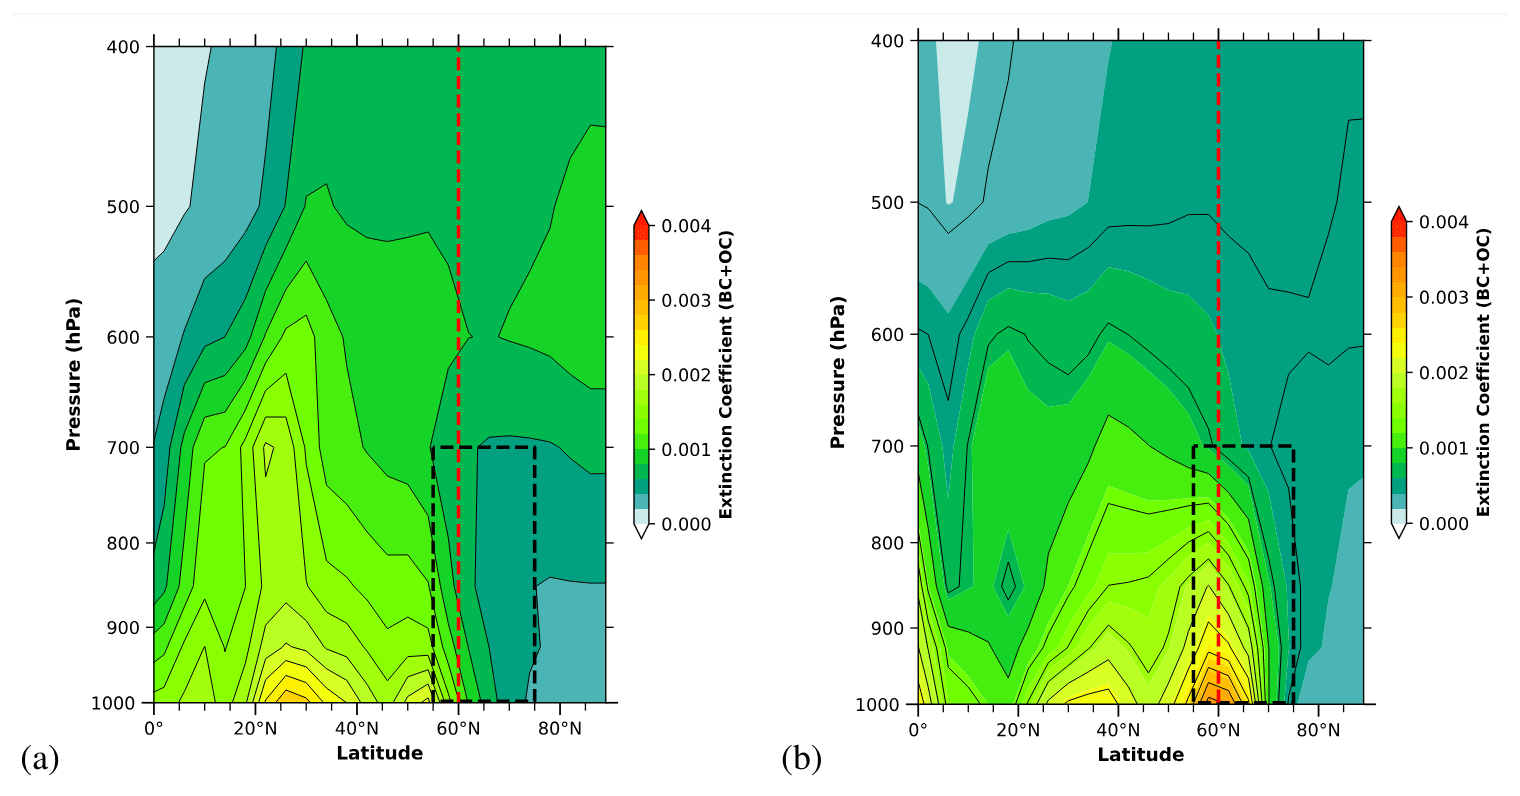
Figure A5Vertical zonal mean of extinction coefficient of carbonaceous aerosols (BC + OC) per layer for (a) MAM and (b) JJA, respectively, averaged in the period 2003–2011. The black box shows the biomass burning in the Arctic.
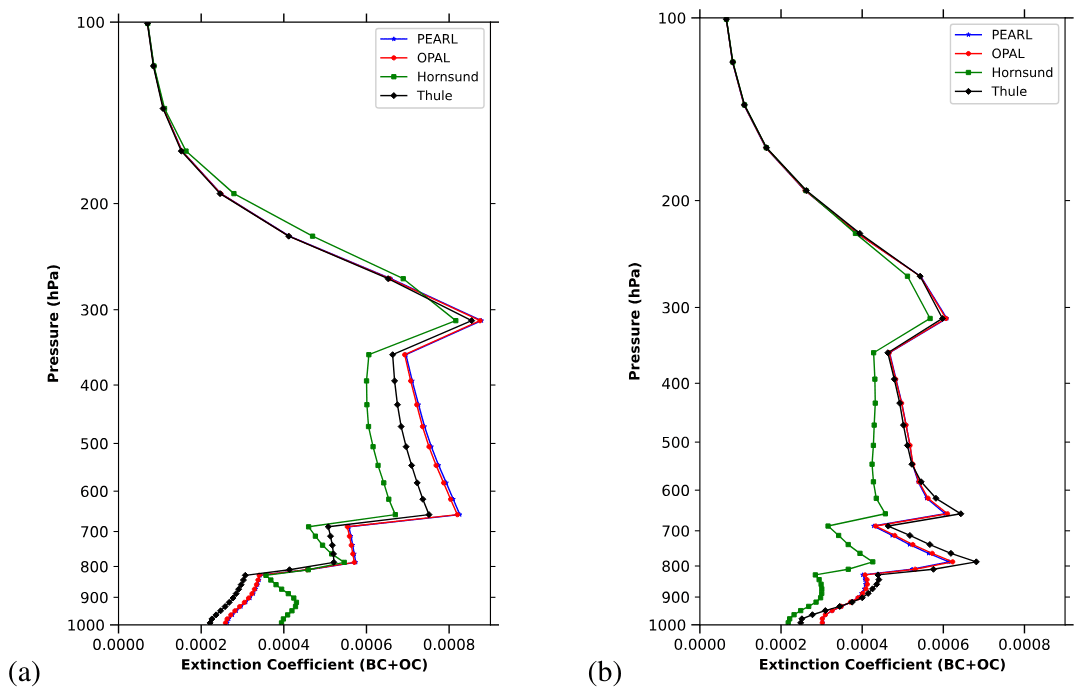
Figure A6Vertical extinction coefficient of carbonaceous aerosols per layer over PEARL, OPAL, Hornsund, and Thule for (a) MAM and (b) JJA, respectively, averaged in the period 2003–2011.
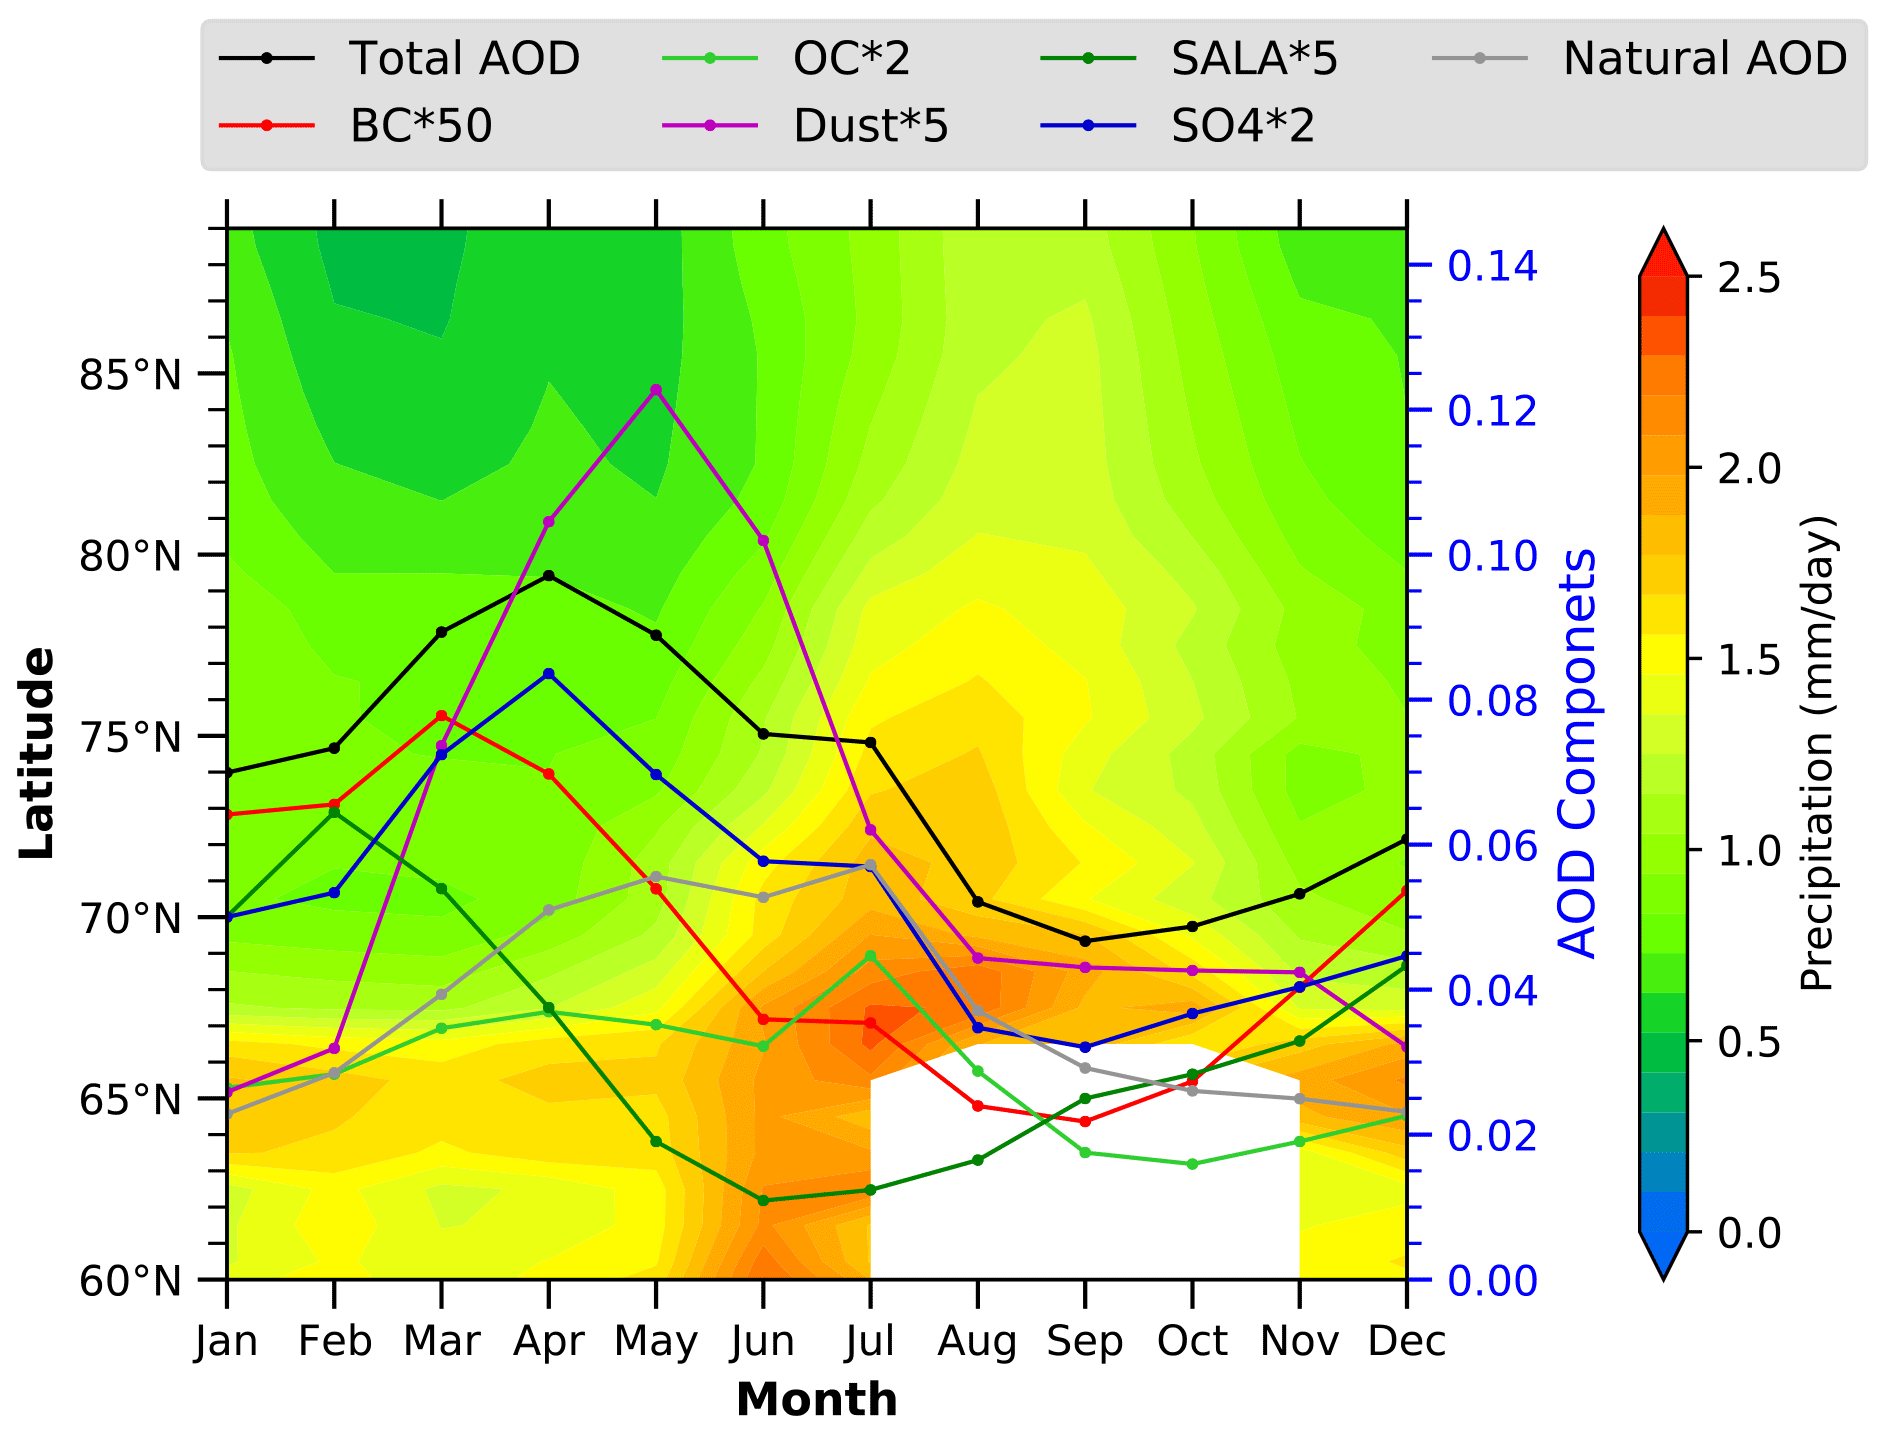
Figure A7Zonal averages of total precipitation over Arctic sea ice as a function of month and latitude for the GEOS-Chem model, superimposed with the climatological (2003–2011) seasonal cycle of total and component AOD over Arctic sea ice. The total precipitation is monthly averaged in the period 2003–2011. The white space shows the receding of sea ice from 60 to 70° N over the Arctic in summer.
The configuration of GEOS-Chem emissions was accomplished through the utilization of the Harvard–NASA Emissions Component module (Keller et al., 2014). The global anthropogenic emissions encompassed a variety of species, including aerosol components (BC, OC), aerosol precursor and reactive compounds (SO2, NOx, NH3, CH4, CO, NMVOC), and CO2, which were sourced from the Community Emissions Data System (CEDS) inventory (Hoesly et al., 2018). Monthly mean aircraft emissions were extracted from the Aviation Emissions Inventory v2.0 (AEIC) (Simone et al., 2013), while the inventory for biofuel and agricultural field burning in the developing world was derived from (Yevich and Logan, 2003). The US American and Mexican inventory (BRAVO, Mexico Bend Regional Aerosol and Visibility Observational study) was also incorporated (Kuhns et al., 2005).
Specifically for anthropogenic ammonia (NH3) emissions in Canada, detailed monthly emission data for four agricultural categories (beef, dairy, fertilizer, poultry) were provided by Agriculture Canada from the APEI inventory (Sheppard et al., 2010). The Co-operative Programme for Monitoring and Evaluation of the Long-range Transmission of Air Pollutants in Europe (EMEP) anthropogenic emissions inventory was employed for Europe (Auvray et al., 2007). Natural, biofuel, bird colony, and oceanic NH3 emissions were obtained from the Global Emission Initiative (GEIA) inventory (Bouwman et al., 1997; Croft et al., 2016). Additionally, the National Emissions Inventory produced by the US EPA (EPA/NEI2011) (Simon et al., 2010), anthropogenic VOC emissions from RETRO (van het Bolshcer et al., 2007), MIX Asian emission inventory for emissions over South Asia (Li et al., 2017), and DICE-Africa anthropogenic emissions inventory (Marais and Wiedinmyer, 2016) were all integrated into the model. Non-anthropogenic emissions encompassed biomass burning emissions from the Global Fire Emissions Database version 4 (Giglio et al., 2013), volcanic sulfur dioxide (SO2) emissions (Fisher et al., 2011), sea salt (SS) aerosol (Jaeglé et al., 2011), and mineral dust (Zender et al., 2003; Fairlie et al., 2007). The model's dust and sea salt fluxes operated independently of the emission inventories applied to other species. Additionally, emissions from various natural sources (such as lightning sea flux and soil NOx) were integrated into the model (Fisher et al., 2011).
During the study period from 2003 to 2011, it is significant that the total AOD over the Arctic region may have been influenced by stratospheric volcanic contributions arising from the Kasatochi and Sarychev eruptions in August 2008 and July 2009, respectively. Smaller eruptions into the troposphere could also have contributed to the overall AOD. However, the tropospheric ash and sulfate aerosols resulting from volcanic eruptions tend to be significantly shorter lived compared with stratospheric aerosols. GEOS-Chem accounted for these eruptions using the inventory from Fisher et al. (2011) and Carn et al. (2015).
According to Sawamura et al. (2012), the stratospheric AOD contribution is estimated to be approximately 0.01, which is roughly 25 % of the background AOD but still smaller than the AOD originating from anthropogenic sources, particularly in the Arctic.
An emerging local contributor to the total AOD column is the increasing shipping traffic, particularly within the Arctic region, as shipping routes have expanded in response to Arctic amplification (Mudryk et al., 2021). These shipping emissions also act as a potential source of carbonaceous aerosols in the Arctic (Browse et al., 2013). To account for this, ship emission data were drawn from the CEDS (Hoesly et al., 2018) and EMEP (Hoesly et al., 2018) ship data.
The primary outcome of GEOS-Chem simulations in this study is the AOD values associated with various aerosol components, including sulfate (SO4), black carbon (BC), organic carbon (OC), sea salt in the accumulation mode (SALA), sea salt in the coarse mode (SALC), and dust. Additionally, natural AOD simulations were conducted independently, without the inclusion of anthropogenic emission inventories.
The code and data supporting the conclusions of this paper are available upon request.
The overarching goals of the research undertaken in this study at IUP-UB were defined by MV and JPB. BS designed the research undertaken in this study, with support from MV and JPB. BS also ran the AEROSNOW algorithm on AATSR observations and set up the GEOS-Chem model and simulations. He also led the analysis of results and the writing of the manuscript with contributions from MV, AS, NLA, AD, LL, YZ, SSG, HB, and JPB. All authors contributed to the interpretation of the results and the preparation of the final manuscript.
The contact author has declared that none of the authors has any competing interests.
Publisher’s note: Copernicus Publications remains neutral with regard to jurisdictional claims made in the text, published maps, institutional affiliations, or any other geographical representation in this paper. While Copernicus Publications makes every effort to include appropriate place names, the final responsibility lies with the authors.
We express gratitude to the GEOS-Chem model community for sharing their data and to ESA for providing the AATSR dataset. This research received funding from the University of Bremen and the State of Bremen as well as from the Deutsche Forschungsgemeinschaft (DFG, German Research Foundation) under the project “ArctiC Amplification: Climate Relevant Atmospheric and SurfaCe Processes, and Feedback Mechanisms (AC)3” as part of the Transregional Collaborative Research Center (TRR) 172, Project-ID 268020496.
This research was supported by the University of Bremen, the State of Bremen, and the Deutsche Forschungsgemeinschaft (Transregional Collaborative Research Center (TRR) 172, Project-ID 268020496).
The article processing charges for this open-access publication were covered by the University of Bremen.
This paper was edited by Lynn M. Russell and reviewed by two anonymous referees.
Alexander, B., Park, R. J., Jacob, D. J., Li, Q. B., Yantosca, R. M., Savarino, J., Lee, C. C. W., and Thiemens, M. H.: Sulfate formation in sea-salt aerosols: Constraints from oxygen isotopes, J. Geophys. Res.-Atmos., 110, D10307, https://doi.org/10.1029/2004JD005659, 2005. a
Auvray, M., Bey, I., Llull, E., Schultz, M. G., and Rast, S.: A model investigation of tropospheric ozone chemical tendencies in long-range transported pollution plumes, J. Geophys. Res.-Atmos., 112, D05304, https://doi.org/10.1029/2006JD007137, 2007. a
Baccarini, A., Karlsson, L., Dommen, J., Duplessis, P., Vüllers, J., Brooks, I. M., Saiz-Lopez, A., Salter, M., Tjernström, M., Baltensperger, U., Zieger, P., and Schmale, J.: Frequent new particle formation over the high Arctic pack ice by enhanced iodine emissions, Nat. Commun., 11, 1–11, https://doi.org/10.1038/s41467-020-18551-0, 2020. a
Baccarini, A., Dommen, J., Lehtipalo, K., Henning, S., Modini, R. L., Gysel-Beer, M., Baltensperger, U., and Schmale, J.: Low-Volatility Vapors and New Particle Formation Over the Southern Ocean During the Antarctic Circumnavigation Expedition, J. Geophys. Res.-Atmos., 126, e2021JD035126, https://doi.org/10.1029/2021JD035126, 2021. a
Bey, I., Jacob, D. J., Yantosca, R. M., Logan, J. A., Field, B. D., Fiore, A. M., Li, Q., Liu, H. Y., Mickley, L. J., and Schultz, M. G.: Global modeling of tropospheric chemistry with assimilated meteorology: Model description and evaluation, J. Geophys. Res.-Atmos., 106, 23073–23095, https://doi.org/10.1029/2001JD000807, 2001. a, b
Boucher, O., Randall, D., Artaxo, P., Bretherton, C., Feingold, G., Forster, P., Kerminen, V.-M., Kondo, Y., Liao, H., Lohmann, U., Rasch, P., Satheesh, S. K., Sherwood, S., Stevens, B., and Zhang, X. Y.: Clouds and aerosols, in: Climate change 2013: The Physical Science Basis. Contribution of Working Group I to the Fifth Assessment Report of the Intergovernmental Panel on Climate Change, edited by: Stocker, T. F., Qin, D., Plattner, G.-K., Tignor, M., Allen, S. K., Boschung, J., Nauels, A., Xia, Y., Bex, V., and Midgley, P. M., Cambridge University Press, 571–657, https://doi.org/10.1017/CBO9781107415324.016, 2013. a
Bouwman, A. F., Lee, D. S., Asman, W. A. H., Dentener, F. J., Van Der Hoek, K. W., and Olivier, J. G. J.: A global high-resolution emission inventory for ammonia, Global Biogeochem. Cy., 11, 561–587, https://doi.org/10.1029/97GB02266, 1997. a
Breider, T. J., Mickley, L. J., Jacob, D. J., Ge, C., Wang, J., Payer Sulprizio, M., Croft, B., Ridley, D. A., McConnell, J. R., Sharma, S., Husain, L., Dutkiewicz, V. A., Eleftheriadis, K., Skov, H., and Hopke, P. K.: Multidecadal trends in aerosol radiative forcing over the Arctic: Contribution of changes in anthropogenic aerosol to Arctic warming since 1980, J. Geophys. Res.-Atmos., 122, 3573–3594, https://doi.org/10.1002/2016JD025321, 2017. a, b, c, d, e, f, g, h, i, j, k, l
Browse, J., Carslaw, K. S., Schmidt, A., and Corbett, J. J.: Impact of future Arctic shipping on high-latitude black carbon deposition, Geophys. Res. Lett., 40, 4459–4463, https://doi.org/10.1002/grl.50876, 2013. a
Carn, S. A., Yang, K., Prata, A. J., and Krotkov, N. A.: Extending the long-term record of volcanic SO2 emissions with the Ozone Mapping and Profiler Suite nadir mapper, Geophys. Res. Lett., 42, 925–932, https://doi.org/10.1002/2014GL062437, 2015. a
Chin, M., Ginoux, P., Kinne, S., Torres, O., Holben, B. N., Duncan, B. N., Martin, R. V., Logan, J. A., Higurashi, A., and Nakajima, T.: Tropospheric aerosol optical thickness from the GOCART model and comparisons with satellite and Sun photometer measurements, J. Atmos. Sci., 59, 461–483, https://doi.org/10.1175/1520-0469(2002)059<0461:TAOTFT>2.0.CO;2, 2002. a
Cooke, W., Liousse, C., Cachier, H., and Feichter, J.: Construction of a 1° × 1° fossil fuel emission data set for carbonaceous aerosol and implementation and radiative impact in the ECHAM4 model, J. Geophys. Res.-Atmos., 104, 22137–22162, https://doi.org/10.1029/1999JD900187, 1999. a
Croft, B., Martin, R. V., Leaitch, W. R., Tunved, P., Breider, T. J., D'Andrea, S. D., and Pierce, J. R.: Processes controlling the annual cycle of Arctic aerosol number and size distributions, Atmos. Chem. Phys., 16, 3665–3682, https://doi.org/10.5194/acp-16-3665-2016, 2016. a, b
Dai, A., Luo, D., Song, M., and Liu, J.: Arctic amplification is caused by sea-ice loss under increasing CO2, Nat. Commun., 10, 1–13, https://doi.org/10.1038/s41467-018-07954-9, 2019. a
Drury, E., Jacob, D. J., Spurr, R. J. D., Wang, J., Shinozuka, Y., Anderson, B. E., Clarke, A. D., Dibb, J., McNaughton, C., and Weber, R.: Synthesis of satellite (MODIS), aircraft (ICARTT), and surface (IMPROVE, EPA-AQS, AERONET) aerosol observations over eastern North America to improve MODIS aerosol retrievals and constrain surface aerosol concentrations and sources, J. Geophys. Res.-Atmos., 115, D14204, https://doi.org/10.1029/2009JD012629, 2010. a, b
Eyring, V., Bony, S., Meehl, G. A., Senior, C. A., Stevens, B., Stouffer, R. J., and Taylor, K. E.: Overview of the Coupled Model Intercomparison Project Phase 6 (CMIP6) experimental design and organization, Geosci. Model Dev., 9, 1937–1958, https://doi.org/10.5194/gmd-9-1937-2016, 2016. a
Fairlie, T. D., Jacob, D. J., and Park, R. J.: The impact of transpacific transport of mineral dust in the United States, Atmos. Environ., 41, 1251–1266, https://doi.org/10.1016/j.atmosenv.2006.09.048, 2007. a
Fisher, A. J., Jacob, J. D., Wang Q., Bahreini, R., Carouge, C. C., Cubison, J. M., Dibb, E. J., Diehl, T., Jimenez, L. J., Leibensperger, M. E., Lu, Z., Meinders, B. J. M., Pye, O. T. H., Quinn, K. P., Sharma, S., Streets, G. D., van Donkelaar A., and Yantosca, M. R.: Sources, distribution, and acidity of sulfate–ammonium aerosol in the Arctic in winter–spring, Atmos. Environ., 45, 7301–7318, https://doi.org/10.1016/j.atmosenv.2011.08.030, 2011. a, b, c, d
Fountoukis, C. and Nenes, A.: ISORROPIA II: a computationally efficient thermodynamic equilibrium model for K+–Ca2+–Mg2+––Na+–––Cl−–H2O aerosols, Atmos. Chem. Phys., 7, 4639–4659, https://doi.org/10.5194/acp-7-4639-2007, 2007. a
Garrett, T. J., Brattström, S., Sharma, S., Worthy, D. E. J., and Novelli, P.: The role of scavenging in the seasonal transport of black carbon and sulfate to the Arctic, Geophys. Res. Lett., 38, L16805, https://doi.org/10.1029/2011GL048221, 2011. a
Gelaro, R., McCarty, W., Suárez, M. J., Todling, R., Molod, A., Takacs, L., Randles, C. A., Darmenov, A., Bosilovich, M. G., Reichle, R., Wargan, K., Coy, L., Cullather, R., Draper, C., Akella, S., Buchard, V., Conaty, A., da Silva, A. M., Gu, W., Kim, G.-K., Koster, R., Lucchesi, R., Merkova, D., Nielsen, J. E., Partyka, G., Pawson, S., Putman, W., Rienecker, M., Schubert, S. D., Sienkiewicz, M., and Zhao, B.: The modern-era retrospective analysis for research and applications, version 2 (MERRA-2), J. Climate, 30, 5419–5454, https://doi.org/10.1175/JCLI-D-16-0758.1, 2017. a
Giglio, L., Randerson, J. T., and van der Werf, G. R.: Analysis of daily, monthly, and annual burned area using the fourth-generation global fire emissions database (GFED4), J. Geophys. Res.-Biogeo., 118, 317–328, https://doi.org/10.1002/jgrg.20042, 2013. a
Gong, X., Zhang, J., Croft, B., Yang, X., Frey, M. M., Bergner, N., Chang, R. Y.-W., Creamean, J. M., Kuang, C., Martin, R. V., Ranjithkumar, A., Sedlacek, A. J., Uin, J., Willmes, S., Zawadowicz, M. A., Pierce, J. R., Shupe, M. D., Schmale, J., and Wang, J: Arctic warming by abundant fine sea salt aerosols from blowing snow, Nat. Geosci., 16, 1–7, https://doi.org/10.1038/s41561-023-01254-8, 2023. a, b
Herber, A., Thomason, L. W., Gernandt, H., Leiterer, U., Nagel, D., Schulz, K.-H., Kaptur, J., Albrecht, T., and Notholt, J.: Continuous day and night aerosol optical depth observations in the Arctic between 1991 and 1999, J. Geophys. Res.-Atmos., 107, AAC 6-1–AAC 6-13, https://doi.org/10.1029/2001JD000536, 2002. a
Hoesly, R. M., Smith, S. J., Feng, L., Klimont, Z., Janssens-Maenhout, G., Pitkanen, T., Seibert, J. J., Vu, L., Andres, R. J., Bolt, R. M., Bond, T. C., Dawidowski, L., Kholod, N., Kurokawa, J.-I., Li, M., Liu, L., Lu, Z., Moura, M. C. P., O'Rourke, P. R., and Zhang, Q.: Historical (1750–2014) anthropogenic emissions of reactive gases and aerosols from the Community Emissions Data System (CEDS), Geosci. Model Dev., 11, 369–408, https://doi.org/10.5194/gmd-11-369-2018, 2018. a, b, c
Hoffmann, A., Osterloh, L., Stone, R., Lampert, A., Ritter, C., Stock, M., Tunved, P., Hennig, T., Böckmann, C., Li, S.-M., Eleftheriadis, K., Maturilli, M., Orgis, T., Herber, A., Neuber, R., and Dethloff, K.: Remote sensing and in-situ measurements of tropospheric aerosol, a PAMARCMiP case study, Atmos. Environ., 52, 56–66, https://doi.org/10.1016/j.atmosenv.2011.11.027, 2012. a
Holben, B. N., Eck, T. F., Slutsker, I., Tanré, D., Buis, J. P., Setzer, A., Vermote, E., Reagan, J. A., Kaufman, Y. J., Nakajima, T., Lavenu, F., Jankowiak, I., and Smirnov, A.: AERONET – A federated instrument network and data archive for aerosol characterization, Remote Sens. Environ., 66, 1–16, https://doi.org/10.1016/S0034-4257(98)00031-5, 1998. a, b
Holben, B. N., Tanré, D., Smirnov, A., Eck, T. F., Slutsker, I., Abuhassan, N., Newcomb, W. W., Schafer, J. S., Chatenet, B., Lavenu, F., Kaufman, Y. J., Castle, J. V., Setzer, A., Markham, B., Clark, D., Frouin, R., Halthore, R., Karneli, A., O'Neill, N. T., Pietras, C., Pinker, R. T., Voss, K., and Zibordi, G.: An emerging ground-based aerosol climatology: Aerosol optical depth from AERONET, J. Geophys. Res.-Atmos., 106, 12067–12097, https://doi.org/10.1029/2001JD900014, 2001. a
Hu, R.-M., Martin, R. V., and Fairlie, T. D.: Global retrieval of columnar aerosol single scattering albedo from space-based observations, J. Geophys. Res.-Atmos., 112, D02204, https://doi.org/10.1029/2005JD006832, 2007. a
Hugelius, G., Loisel, J., Chadburn, S., Jackson, R. B., Jones, M., MacDonald, G., Marushchak, M., Olefeldt, D., Packalen, M., Siewert, M. B., Treat, C., Turetsky, M., Voigt, C., and Yu, Z.: Large stocks of peatland carbon and nitrogen are vulnerable to permafrost thaw, P. Natl. Acad. Sci. USA, 117, 20438–20446, https://doi.org/10.1073/pnas.1916387117, 2020. a
Inness, A., Ades, M., Agustí-Panareda, A., Barré, J., Benedictow, A., Blechschmidt, A.-M., Dominguez, J. J., Engelen, R., Eskes, H., Flemming, J., Huijnen, V., Jones, L., Kipling, Z., Massart, S., Parrington, M., Peuch, V.-H., Razinger, M., Remy, S., Schulz, M., and Suttie, M.: The CAMS reanalysis of atmospheric composition, Atmos. Chem. Phys., 19, 3515–3556, https://doi.org/10.5194/acp-19-3515-2019, 2019. a
Istomina, L. G., von Hoyningen-Huene, W., Kokhanovsky, A. A., Schultz, E., and Burrows, J. P.: Remote sensing of aerosols over snow using infrared AATSR observations, Atmos. Meas. Tech., 4, 1133–1145, https://doi.org/10.5194/amt-4-1133-2011, 2011. a
Jaeglé, L., Quinn, P. K., Bates, T. S., Alexander, B., and Lin, J.-T.: Global distribution of sea salt aerosols: new constraints from in situ and remote sensing observations, Atmos. Chem. Phys., 11, 3137–3157, https://doi.org/10.5194/acp-11-3137-2011, 2011. a, b
Jafariserajehlou, S., Mei, L., Vountas, M., Rozanov, V., Burrows, J. P., and Hollmann, R.: A cloud identification algorithm over the Arctic for use with AATSR–SLSTR measurements, Atmos. Meas. Tech., 12, 1059–1076, https://doi.org/10.5194/amt-12-1059-2019, 2019. a, b
Keller, C. A., Long, M. S., Yantosca, R. M., Da Silva, A. M., Pawson, S., and Jacob, D. J.: HEMCO v1.0: a versatile, ESMF-compliant component for calculating emissions in atmospheric models, Geosci. Model Dev., 7, 1409–1417, https://doi.org/10.5194/gmd-7-1409-2014, 2014. a
Knippertz, P., Coe, H., Chiu, J. C., Evans, M. J., Fink, A. H., Kalthoff, N., Liousse, C., Mari, C., Allan, R. P., Brooks, B., Danour, S., Flamant, C., Jegede, O. O., Lohou, F., and Marsham, J. H.: The DACCIWA Project: Dynamics–Aerosol–Chemistry–Cloud Interactions in West Africa, B. Am. Meteorol. Soc., 96, 1451–1460, https://doi.org/10.1175/BAMS-D-14-00108.1, 2015. a
Koepke, P., Hess, M., Schult, I., and Shettle, E. P.: Global Aerosol Data Set, Tech. Rep. 243, Max-Planck-Institut für Meteorologie, ISSN 0937-1060, 1997. a, b
Kuhns, H., Knipping, E. M., and Vukovich, J. M.: Development of a United States–Mexico emissions inventory for the big bend regional aerosol and visibility observational (BRAVO) study, J. Air Waste Manage. Assoc., 55, 677–692, https://doi.org/10.1080/10473289.2005.10464648, 2005. a
Li, M., Zhang, Q., Kurokawa, J.-I., Woo, J.-H., He, K., Lu, Z., Ohara, T., Song, Y., Streets, D. G., Carmichael, G. R., Cheng, Y., Hong, C., Huo, H., Jiang, X., Kang, S., Liu, F., Su, H., and Zheng, B.: MIX: a mosaic Asian anthropogenic emission inventory under the international collaboration framework of the MICS-Asia and HTAP, Atmos. Chem. Phys., 17, 935–963, https://doi.org/10.5194/acp-17-935-2017, 2017. a
Li, S., Garay, M. J., Chen, L., Rees, E., and Liu, Y.: Comparison of GEOS-Chem aerosol optical depth with AERONET and MISR data over the contiguous United States, J. Geophys. Res.-Atmos., 118, 11228–11241, https://doi.org/10.1002/jgrd.50867, 2013. a
Liu, H., Jacob, D. J., Bey, I., and Yantosca, R. M.: Constraints from 210Pb and 7Be on wet deposition and transport in a global three-dimensional chemical tracer model driven by assimilated meteorological fields, J. Geophys. Res.-Atmos., 106, 12109–12128, https://doi.org/10.1029/2000JD900839, 2001. a
Lu, X., Zhang, L., Wu, T., Long, M. S., Wang, J., Jacob, D. J., Zhang, F., Zhang, J., Eastham, S. D., Hu, L., Zhu, L., Liu, X., and Wei, M.: Development of the global atmospheric chemistry general circulation model BCC-GEOS-Chem v1.0: model description and evaluation, Geosci. Model Dev., 13, 3817–3838, https://doi.org/10.5194/gmd-13-3817-2020, 2020. a
Manney, G. L., Lawrence, Z. D., Santee, M. L., Livesey, N. J., Lambert, A., and Pitts, M. C.: Polar processing in a split vortex: Arctic ozone loss in early winter 2012/2013, Atmos. Chem. Phys., 15, 5381–5403, https://doi.org/10.5194/acp-15-5381-2015, 2015. a
Marais, E. A. and Wiedinmyer, C.: Air quality impact of diffuse and inefficient combustion emissions in Africa (DICE-Africa), Environ. Sci. Technol., 50, 10739–10745, https://doi.org/10.1021/acs.est.6b02602, 2016. a
Martin, R. V., Jacob, D. J., Yantosca, R. M., Chin, M., and Ginoux, P.: Global and regional decreases in tropospheric oxidants from photochemical effects of aerosols, J. Geophys. Res.-Atmos., 108, D4097, https://doi.org/10.1029/2002JD002622, 2003. a, b
McCarty, J. L., Aalto, J., Paunu, V.-V., Arnold, S. R., Eckhardt, S., Klimont, Z., Fain, J. J., Evangeliou, N., Venäläinen, A., Tchebakova, N. M., Parfenova, E. I., Kupiainen, K., Soja, A. J., Huang, L., and Wilson, S.: Reviews and syntheses: Arctic fire regimes and emissions in the 21st century, Biogeosciences, 18, 5053–5083, https://doi.org/10.5194/bg-18-5053-2021, 2021. a
McLinden, C. A., Olsen, S. C., Hannegan, B., Wild, O., Prather, M. J., and Sundet, J.: Stratospheric ozone in 3-D models: A simple chemistry and the cross-tropopause flux, J. Geophys. Res.-Atmos., 105, 14653–14665, https://doi.org/10.1029/2000JD900124, 2000. a
Mei, L., Xue, Y., de Leeuw, G., von Hoyningen-Huene, W., Kokhanovsky, A. A., Istomina, L., Guang, J., and Burrows, J. P.: Aerosol optical depth retrieval in the Arctic region using MODIS data over snow, Remote Sens. Environ., 128, 234–245, https://doi.org/10.1016/j.rse.2012.10.009, 2013. a
Mei, L., Rozanov, V., Ritter, C., Heinold, B., Jiao, Z., Vountas, M., and Burrows, J. P.: Retrieval of Aerosol Optical Thickness in the Arctic Snow-Covered Regions Using Passive Remote Sensing: Impact of Aerosol Typing and Surface Reflection Model, IEEE T. Geosci. Remote, 58, 5117–5131, https://doi.org/10.1109/TGRS.2020.2972339, 2020a. a
Mei, L., Vandenbussche, S., Rozanov, V., Proestakis, E., Amiridis, V., Callewaert, S., Vountas, M., and Burrows, J. P.: On the retrieval of aerosol optical depth over cryosphere using passive remote sensing, Remote Sens. Environ., 241, 111731, https://doi.org/10.1016/j.rse.2020.111731, 2020b. a
Mishchenko, M. I., Geogdzhayev, I. V., Cairns, B., Rossow, W. B., and Lacis, A. A.: Aerosol retrievals over the ocean by use of channels 1 and 2 AVHRR data: sensitivity analysis and preliminary results, Appl. Optics, 38, 7325–7341, https://doi.org/10.1364/ao.38.007325, 1999. a
Moschos, V., Schmale, J., Aas, W., Becagli, S., Calzolai, G., Eleftheriadis, K., Moffett, C. E., Schnelle-Kreis, J., Severi, M., Sharma, S., Skov, H., Vestenius, M., Zhang, W., Hakola, H., Hellén, H., Huang, L., Jaffrezo, J.-L., Massling, A., Nøjgaard, J. K., Petäjä, T., Popovicheva, O., Sheesley, R. J., Traversi, R., Yttri, K. E., Prévôt, A. S. H., Baltensperger, U., and El Haddad, I.: Elucidating the present-day chemical composition, seasonality and source regions of climate-relevant aerosols across the Arctic land surface, Environ. Res. Lett., 17, 034032, https://doi.org/10.1088/1748-9326/ac444b, 2022. a
Mudryk, L. R., Dawson, J., Howell, S. E., Derksen, C., Zagon, T. A., and Brady, M.: Impact of 1, 2 and 4 C of global warming on ship navigation in the Canadian Arctic, Nat. Clim. Change, 11, 673–679, https://doi.org/10.1038/s41558-021-01087-6, 2021. a
Ohata, S., Koike, M., Yoshida, A., Moteki, N., Adachi, K., Oshima, N., Matsui, H., Eppers, O., Bozem, H., Zanatta, M., and Herber, A. B.: Arctic black carbon during PAMARCMiP 2018 and previous aircraft experiments in spring, Atmos. Chem. Phys., 21, 15861–15881, https://doi.org/10.5194/acp-21-15861-2021, 2021. a
O'Neill, N. T., Eck, T. F., Smirnov, A., Holben, B. N., and Thulasiraman, S.: Spectral discrimination of coarse and fine mode optical depth, J. Geophys. Res.-Atmos., 108, 4559, https://doi.org/10.1029/2002JD002975, 2003. a
Palazzi, E., Mortarini, L., Terzago, S., and Von Hardenberg, J.: Elevation-dependent warming in global climate model simulations at high spatial resolution, Clim. Dynam., 52, 2685–2702, https://doi.org/10.1007/s00382-018-4287-z, 2019. a
Park, R. J., Jacob, D. J., Chin, M., and Martin, R. V.: Sources of carbonaceous aerosols over the United States and implications for natural visibility, J. Geophys. Res.-Atmos., 108, 4355, https://doi.org/10.1029/2002JD003190, 2003. a
Park, R. J., Jacob, D. J., Palmer, P. I., Clarke, A. D., Weber, R. J., Zondlo, M. A., Eisele, F. L., Bandy, A. R., Thornton, D. C., Sachse, G. W., and Bond, T. C.: Export efficiency of black carbon aerosol in continental outflow: Global implications, J. Geophys. Res.-Atmos., 110, D11205, https://doi.org/10.1029/2004JD005432, 2005. a
Pitts, M. C., Poole, L. R., Lambert, A., and Thomason, L. W.: An assessment of CALIOP polar stratospheric cloud composition classification, Atmos. Chem. Phys., 13, 2975–2988, https://doi.org/10.5194/acp-13-2975-2013, 2013. a
Rantanen, M., Karpechko, A. Y., Lipponen, A., Nordling, K., Hyvärinen, O., Ruosteenoja, K., Vihma, T., and Laaksonen, A.: The Arctic has warmed nearly four times faster than the globe since 1979, Commun. Earth Environ., 3, 168, https://doi.org/10.1038/s43247-022-00498-3, 2022. a
Ren, L., Yang, Y., Wang, H., Zhang, R., Wang, P., and Liao, H.: Source attribution of Arctic black carbon and sulfate aerosols and associated Arctic surface warming during 1980–2018, Atmos. Chem. Phys., 20, 9067–9085, https://doi.org/10.5194/acp-20-9067-2020, 2020. a, b
Ridley, D. A., Heald, C. L., Pierce, J. R., and Evans, M. J.: Toward resolution-independent dust emissions in global models: Impacts on the seasonal and spatial distribution of dust, Geophys. Res. Lett., 40, 2873–2877, https://doi.org/10.1002/grl.50409, 2013. a
Saha, A., O'Neill, N. T., Eloranta, E., Stone, R. S., Eck, T. F., Zidane, S., Daou, D., Lupu, A., Lesins, G., Shiobara, M., and McArthur, L. J. B.: Pan-Arctic sunphotometry during the ARCTAS-A campaign of April 2008, Geophys. Res. Lett., 37, L05803, https://doi.org/10.1029/2009GL041375, 2010. a, b
Sand, M., Berntsen, T. K., Seland, Ø., and Kristjánsson, J. E.: Arctic surface temperature change to emissions of black carbon within Arctic or midlatitudes, J. Geophys. Res.-Atmos., 118, 7788–7798, https://doi.org/10.1002/jgrd.50613, 2013. a, b
Sand, M., Samset, B. H., Balkanski, Y., Bauer, S., Bellouin, N., Berntsen, T. K., Bian, H., Chin, M., Diehl, T., Easter, R., Ghan, S. J., Iversen, T., Kirkevåg, A., Lamarque, J.-F., Lin, G., Liu, X., Luo, G., Myhre, G., Noije, T. V., Penner, J. E., Schulz, M., Seland, Ø., Skeie, R. B., Stier, P., Takemura, T., Tsigaridis, K., Yu, F., Zhang, K., and Zhang, H.: Aerosols at the poles: an AeroCom Phase II multi-model evaluation, Atmos. Chem. Phys., 17, 12197–12218, https://doi.org/10.5194/acp-17-12197-2017, 2017. a, b, c, d, e, f, g
Sand, M., Samset, B. H., Myhre, G., Gliß, J., Bauer, S. E., Bian, H., Chin, M., Checa-Garcia, R., Ginoux, P., Kipling, Z., Kirkevåg, A., Kokkola, H., Le Sager, P., Lund, M. T., Matsui, H., van Noije, T., Olivié, D. J. L., Remy, S., Schulz, M., Stier, P., Stjern, C. W., Takemura, T., Tsigaridis, K., Tsyro, S. G., and Watson-Parris, D.: Aerosol absorption in global models from AeroCom phase III, Atmos. Chem. Phys., 21, 15929–15947, https://doi.org/10.5194/acp-21-15929-2021, 2021. a, b
Sawamura, P., Vernier, J. P., Barnes, J. E., Berkoff, T. A., Welton, E. J., Alados-Arboledas, L., Navas-Guzmán, F., Pappalardo, G., Mona, L., Madonna, F., Lange, D., Sicard, M., Godin-Beekmann, S., Payen, G., Wang, Z., Hu, S., Tripathi, S. N., Cordoba-Jabonero, C., and Hoff, R. M.: Stratospheric AOD after the 2011 eruption of Nabro volcano measured by lidars over the Northern Hemisphere, Environ. Res. Lett., 7, 034013, https://doi.org/10.1088/1748-9326/7/3/034013, 2012. a
Schmale, J., Zieger, P., and Ekman, A. M.: Aerosols in current and future Arctic climate, Nat. Clim. Change, 11, 95–105, https://doi.org/10.1038/s41558-020-00969-5, 2021. a, b, c, d, e, f, g, h, i, j, k, l, m, n, o, p
Schmale, J., Sharma, S., Decesari, S., Pernov, J., Massling, A., Hansson, H.-C., von Salzen, K., Skov, H., Andrews, E., Quinn, P. K., Upchurch, L. M., Eleftheriadis, K., Traversi, R., Gilardoni, S., Mazzola, M., Laing, J., and Hopke, P.: Pan-Arctic seasonal cycles and long-term trends of aerosol properties from 10 observatories, Atmos. Chem. Phys., 22, 3067–3096, https://doi.org/10.5194/acp-22-3067-2022, 2022. a, b, c
Sheppard, S., Bittman, S., and Bruulsema, T.: Monthly ammonia emissions from fertilizers in 12 Canadian Ecoregions, Can. J. Soil Sci., 90, 113–127, https://doi.org/10.4141/CJSS09006, 2010. a
Sherstyukov, B. and Sherstyukov, A.: Assessment of increase in forest fire risk in Russia till the late 21st century based on scenario experiments with fifth-generation climate models, Russ. Meteorol. Hydrol., 39, 292–301, https://doi.org/10.3103/S1068373914050021, 2014. a
Shukla, P., Skea, J., Calvo, B. E., Masson-Delmotte, V., Pörtner, H.-O., Roberts, D., Zhai, P., Slade, R., Connors, S., van, D. R., Ferrat, M., Haughey, E., Luz, S., Neogi, S., Pathak, M., Petzold, J., Portugal, P. J., Vyas, P., Huntley, E., Kissick, K., Belkacemi, M., and Malley, J.: IPCC, 2019: Climate Change and Land: an IPCC special report on climate change, desertification, land degradation, sustainable landmanagement, food security, and greenhouse gas fluxes in terrestrial ecosystems, edited by: Masson-Delmotte, V., Pörtner, H.-O., Skea, J., Calvo Buendía, E., Zhai, P., Roberts, D., Shukla, P. R., Slade, R., Connors, S., van Diemen, R., Ferrat, M., Haughey, E., Luz, S., Neogi, S., Pathak, M., Petzold, J., Neogi, S., Pathak, M., Petzold, J., Kissick, K., Belkacemi, M., and Malley, J., IPCC, Tech. rep., https://www.ipcc.ch/site/assets/uploads/2019/11/SRCCL-Full-Report-Compiled-191128.pdf (last access: 25 January 2023), 2019. a
Shupe, M. D., Rex, M., Blomquist, B., Persson, P. O. G., Schmale, J., Uttal, T., Althausen, D., Angot, H., Archer, S., Bariteau, L., Beck, I., Bilberry, J., Bucci, S., Buck, C., Boyer, M., Brasseur, Z., Brooks, I. M., Calmer, R., Cassano, J., Castro, V., Chu, D., Costa, D., Cox, C. J., Creamean, J., Crewell, S., Dahlke, S., Damm, E., de Boer, G., Deckelmann, H., Dethloff, K., Dütsch, M., Ebell, K., Ehrlich, A., Ellis, J., Engelmann, R., Fong, A. A., Frey, M. M., Gallagher, M. R., Ganzeveld, L., Gradinger, R., Graeser, J., Greenamyer, V., Griesche, H., Griffiths, S., Hamilton, J., Heinemann, G., Helmig, D., Herber, A., Heuzé, C., Hofer, J., Houchens, T., Howard, D., Inoue, J., Jacobi, H.-W., Jaiser, R., Jokinen, T., Jourdan, O., Jozef, G., King, W., Kirchgaessner, A., Klingebiel, M., Krassovski, M., Krumpen, T., Lampert, A., Landing, W., Laurila, T., Lawrence, D., Lonardi, M., Loose, B., Lüpkes, C., Maahn, M., Macke, A., Maslowski, W., Marsay, C., Maturilli, M., Mech, M., Morris, S., Moser, M., Nicolaus, M., Ortega, P., Osborn, J., Pätzold, F., Perovich, D. K., Petäjä, T., Pilz, C., Pirazzini, R., Posman, K., Powers, H., Pratt, K. A., Preußer, A., Quéléver, L., Radenz, M., Rabe, B., Rinke, A., Sachs, T., Schulz, A., Siebert, H., Silva, T., Solomon, A., Sommerfeld, A., Spreen, G., Stephens, M., Stohl, A., Svensson, G., Uin, J., Viegas, J., Voigt, C., von der Gathen, P., Wehner, B., Welker, J. M., Wendisch, M., Werner, M., Xie, Z., and Yue, F.: Overview of the MOSAiC expedition: Atmosphere, Elem. Sci. Anth., 10, 00060, https://doi.org/10.1525/elementa.2021.00060, 2022. a
Simon, H., Beck, L., Bhave, P. V., Divita, F., Hsu, Y., Luecken, D., Mobley, J. D., Pouliot, G. A., Reff, A., Sarwar, G., and Strum, M.: The development and uses of EPA’s SPECIATE database, Atmos. Pollut. Res., 1, 196–206, https://doi.org/10.5094/APR.2010.026, 2010. a
Simone, N., Stettler, M., Eastham, S., and Barrett, S.: An open global civil aviation emissions dataset for 2005 (R1), Tech. rep., MIT Laboratory for Aviation and the Environment, https://citeseerx.ist.psu.edu/document?repid=rep1&type=pdf&doi=46d901d50796e928d4216a11ee8d9ef83d7a3e77 (last access: 22 January 2023), 2013. a
Stohl, A., Andrews, E., Burkhart, J. F., Forster, C., Herber, A., Hoch, S. W., Kowal, D., Lunder, C., Mefford, T., Ogren, J. A., Sharma, S., Spichtinger, N., Stebel, K., Stone, R., Ström, J., Tørseth, K., Wehrli, C., and Yttri, K. E.: Pan-Arctic enhancements of light absorbing aerosol concentrations due to North American boreal forest fires during summer 2004, J. Geophys. Res.-Atmos., 111, D22214, https://doi.org/10.1029/2006JD007216, 2006. a
Stone, R. S., Sharma, S., Herber, A., Eleftheriadis, K., and Nelson, D. W.: A characterization of Arctic aerosols on the basis of aerosol optical depth and black carbon measurements, Elem. Sci. Anth., 2, 000027, https://doi.org/10.12952/journal.elementa.000027, 2014. a, b
Swain, B., Vountas, M., Deroubaix, A., Lelli, L., Ziegler, Y., Jafariserajehlou, S., Gunthe, S. S., Herber, A., Ritter, C., Bösch, H., and Burrows, J. P.: Retrieval of aerosol optical depth over the Arctic cryosphere during spring and summer using satellite observations, Atmos. Meas. Tech., 17, 359–375, https://doi.org/10.5194/amt-17-359-2024, 2024. a, b, c, d, e, f, g, h, i, j
Tegen, I. and Lacis, A. A.: Modeling of particle size distribution and its influence on the radiative properties of mineral dust aerosol, J. Geophys. Res.-Atmos., 101, 19237–19244, https://doi.org/10.1029/95JD03610, 1996. a
Tomasi, C., Vitale, V., Lupi, A., Di Carmine, C., Campanelli, M., Herber, A., Treffeisen, R., Stone, R. S., Andrews, E., Sharma, S., Radionov, V., von Hoyningen-Huene, W., Stebel, K., Hansen, G. H., Myhre, C. L., Wehrli, C., Aaltonen, V., Lihavainen, H., Virkkula, A., Hillamo, R., Ström, J., Toledano, C., Cachorro, V. E., Ortiz, P., de Frutos, A. M., Blindheim, S., Frioud, M., Gausa, M., Zielinski, T., Petelski, T., and Yamanouchi, T.: Aerosols in polar regions: A historical overview based on optical depth and in situ observations, J. Geophys. Res.-Atmos., 112, D16205, https://doi.org/10.1029/2007JD008432, 2007. a
Toth, T. D., Campbell, J. R., Reid, J. S., Tackett, J. L., Vaughan, M. A., Zhang, J., and Marquis, J. W.: Minimum aerosol layer detection sensitivities and their subsequent impacts on aerosol optical thickness retrievals in CALIPSO level 2 data products, Atmos. Meas. Tech., 11, 499–514, https://doi.org/10.5194/amt-11-499-2018, 2018. a
van het Bolscher, M., Pulles, T., Brand, R., Pereira, J., Mota, B., Spessa, A., Dalsøren, S., van Nojie, T., and Szopa, S.: RETRO deliverable D1-6, RETRO documentation, 2007. a
von Hardenberg, J., Vozella, L., Tomasi, C., Vitale, V., Lupi, A., Mazzola, M., van Noije, T. P. C., Strunk, A., and Provenzale, A.: Aerosol optical depth over the Arctic: a comparison of ECHAM-HAM and TM5 with ground-based, satellite and reanalysis data, Atmos. Chem. Phys., 12, 6953–6967, https://doi.org/10.5194/acp-12-6953-2012, 2012. a, b
Wendisch, M., Macke, A., Ehrlich, A., Lüpkes, C., Mech, M., Chechin, D., Dethloff, K., Velasco, C. B., Bozem, H., Brückner, M., Clemen, H.-C., Crewell, S., Donth, T., Dupuy, R., Ebell, K., Egerer, U., Engelmann, R., Engler, C., Eppers, O., Gehrmann, M., Gong, X., Gottschalk, M., Gourbeyre, C., Griesche, H., Hartmann, J., Hartmann, M., Heinold, B., Herber, A., Herrmann, H., Heygster, G., Hoor, P., Jafariserajehlou, S., Jäkel, E., Järvinen, E., Jourdan, O., Kästner, U., Kecorius, S., Knudsen, E. M., Köllner, F., Kretzschmar, J., Lelli, L., Leroy, D., Maturilli, M., Mei, L., Mertes, S., Mioche, G., Neuber, R., Nicolaus, M., Nomokonova, T., Notholt, J., Palm, M., van Pinxteren, M., Quaas, J., Richter, P., Ruiz-Donoso, E., Schäfer, M., Schmieder, K., Schnaiter, M., Schneider, J., Schwarzenböck, A., Seifert, P., Shupe, M. D., Siebert, H., Spreen, G., Stapf, J., Stratmann, F., Vogl, T., Welti, A., Wex, H., Wiedensohler, A., Zanatta, M., and Zeppenfeld, S.: The Arctic Cloud Puzzle: Using ACLOUD/PASCAL Multiplatform Observations to Unravel the Role of Clouds and Aerosol Particles in Arctic Amplification, B. Am. Meteorol. Soc., 100, 841–871, https://doi.org/10.1175/BAMS-D-18-0072.1, 2019. a
Willis, M. D., Leaitch, W. R., and Abbatt, J. P.: Processes Controlling the Composition and Abundance of Arctic Aerosol, Rev. Geophys., 56, 621–671, https://doi.org/10.1029/2018RG000602, 2018. a, b, c, d, e
Xian, P., Zhang, J., O'Neill, N. T., Reid, J. S., Toth, T. D., Sorenson, B., Hyer, E. J., Campbell, J. R., and Ranjbar, K.: Arctic spring and summertime aerosol optical depth baseline from long-term observations and model reanalyses – Part 2: Statistics of extreme AOD events, and implications for the impact of regional biomass burning processes, Atmos. Chem. Phys., 22, 9949–9967, https://doi.org/10.5194/acp-22-9949-2022, 2022. a, b, c, d, e, f, g, h, i, j, k
Yevich, R. and Logan, J. A.: An assessment of biofuel use and burning of agricultural waste in the developing world, Global Biogeochem. Cy., 17, 1095, https://doi.org/10.1029/2002GB001952, 2003. a
Yu, F., Luo, G., Liu, X., Easter, R. C., Ma, X., and Ghan, S. J.: Indirect radiative forcing by ion-mediated nucleation of aerosol, Atmos. Chem. Phys., 12, 11451–11463, https://doi.org/10.5194/acp-12-11451-2012, 2012. a
Zender, C. S., Bian, H., and Newman, D.: Mineral Dust Entrainment and Deposition (DEAD) model: Description and 1990s dust climatology, J. Geophys. Res.-Atmos., 108, 4416, https://doi.org/10.1029/2002JD002775, 2003. a
Zhao, A., Ryder, C. L., and Wilcox, L. J.: How well do the CMIP6 models simulate dust aerosols?, Atmos. Chem. Phys., 22, 2095–2119, https://doi.org/10.5194/acp-22-2095-2022, 2022. a, b, c