the Creative Commons Attribution 4.0 License.
the Creative Commons Attribution 4.0 License.
 | 08 May 2024
Measurement report: A comparison of ground-level ice-nucleating-particle abundance and aerosol properties during autumn at contrasting marine and terrestrial locations
Elise K. Wilbourn
Larissa Lacher
Carlos Guerrero
Hemanth S. K. Vepuri
Kristina Höhler
Jens Nadolny
Aidan D. Pantoya
Ottmar Möhler
Ice-nucleating particles (INPs) are an essential class of aerosols found worldwide that have far-reaching but poorly quantified climate feedback mechanisms through interaction with clouds and impacts on precipitation. These particles can have highly variable physicochemical properties in the atmosphere, and it is crucial to continuously monitor their long-term concentration relative to total ambient aerosol populations at a wide variety of sites to comprehensively understand aerosol–cloud interactions in the atmosphere. Hence, our study applied an in situ forced expansion cooling device to measure ambient INP concentrations and test its automated continuous measurements at atmospheric observatories, where complementary aerosol instruments are heavily equipped. Using collocated aerosol size, number, and composition measurements from these sites, we analyzed the correlation between sources and abundance of INPs in different environments. Toward this aim, we have measured ground-level INP concentrations at two contrasting sites, one in the Southern Great Plains (SGP) region of the United States with a substantial terrestrially influenced aerosol population and one in the Eastern North Atlantic Ocean (ENA) region with a primarily marine-influenced aerosol population. These measurements examined INPs mainly formed through immersion freezing and were performed at a ≤ 12 min resolution and with a wide range of heterogeneous freezing temperatures (Ts above −31 °C) for at least 45 d at each site. The associated INP data analysis was conducted in a consistent manner. We also explored the additional offline characterization of ambient aerosol particle samples from both locations in comparison to in situ data. From our ENA data, on average, INP abundance ranges from ≈ 1 to ≈ 20 L−1 (−30 °C ≤ T ≤ −20 °C) during October–November 2020. Backward air mass trajectories reveal a strong marine influence at ENA with 75.7 % of air masses originating over the Atlantic Ocean and 96.6 % of air masses traveling over open water, but analysis of particle chemistry suggests an additional INP source besides maritime aerosols (e.g., sea spray aerosols) at ENA. In contrast, 90.8 % of air masses at the SGP location originated from the North American continent, and 96.1 % of the time, these air masses traveled over land. As a result, organic-rich SGP aerosols from terrestrial sources exhibited notably high INP abundance from ≈ 1 to ≈ 100 L−1 (−30 °C ≤ T ≤ −15 °C) during October–November 2019. The probability density function of aerosol surface area-scaled immersion freezing efficiency (ice nucleation active surface site density; ns) was assessed for selected freezing temperatures. While the INP concentrations measured at SGP are higher than those of ENA, the ns(T) values of SGP (≈ 105 to ≈ 107 m−2 for −30 °C ≤ T ≤ −15 °C) are reciprocally lower than ENA for approximately 2 orders of magnitude (≈ 107 to ≈ 109 m−2 for −30 °C ≤ T ≤ −15 °C). The observed difference in ns(T) mainly stems from varied available aerosol surface areas, Saer, from two sites (Saer,SGP > Saer,ENA). INP parameterizations were developed as a function of examined freezing temperatures from SGP and ENA for our study periods.
- Article
(3813 KB) - Full-text XML
-
Supplement
(1651 KB) - BibTeX
- EndNote


Ice-nucleating particles (INPs) are a proportionally rare population of atmospheric aerosols that assist in the formation of atmospheric ice crystals under ice supersaturation conditions. INPs are present in the Earth's atmosphere in varying concentrations, ranging from 10−6 to 103 L−1 over wide freezing temperatures, and they come from both anthropogenic (e.g., manufacturing, transportation, soot, biomass burning, and agriculture) and natural (e.g., maritime, terrestrial bacteria, volcanic sulfate, biomass burning, K-feldspar/mineral, and soil dust) sources (Kanji et al., 2017). INPs supply surfaces for the deposition and freezing of water vapor and/or cloud droplets, lowering the critical activation energy for ice germ formation on the surface and leading to a type of ice formation known as heterogeneous freezing (Hoose and Möhler, 2012). In contrast, homogeneous freezing, which requires cloud droplets to be cooled to a temperature of approximately −35 °C (238 K) or below, occurs in the absence of INPs (Koop and Murray, 2016; Koop et al., 2000).
Ice formation in climate models is currently a source of uncertainty in current models, warranting further study of ice nucleation processes and INPs (Knopf and Alpert, 2023; Burrows et al., 2022; Forster et al., 2021; Murray et al., 2021). While the understanding of INPs remains limited, recent advancements have shed light on the various modes of heterogeneous ice-nucleation in the atmosphere. INPs can alter the altitude of ice cloud formation and influence nucleation and freezing pathways (Hoose and Möhler, 2012). For instance, water droplets containing these aerosol particles freeze at temperatures higher than would be possible with pure water alone. In particular, immersion freezing processes including a minor contribution of condensation freezing predominate over 85 % of atmospheric heterogeneous freezing (Hande and Hoose, 2017; Westbrook and Illingworth, 2011). Other nucleation pathways include deposition nucleation (and/or pore condensation freezing) (David et al., 2019; Marcolli, 2014) and contact nucleation (Ladino Moreno et al., 2013; Fornea et al., 2009; Durant and Shaw, 2005). Secondary ice formation processes may also lead to an increase in atmospheric ice crystals (e.g., Korolev and Leisner, 2020; Sullivan et al., 2018; Field et al., 2017) but will not be addressed in this report.
This study reports the automated continuous measurements of ambient INP concentrations in comparison to offline INP abundance measurements in a wide range of heterogeneous freezing temperatures from two field campaigns, including Examining the Ice-Nucleating Particles from Southern Great Plains (ExINP-SGP; https://www.arm.gov/research/campaigns/sgp2019exinpsgp, last access: 11 March 2024) and Examining the Ice-Nucleating Particles from Eastern North Atlantic (ExINP-ENA; https://www.arm.gov/research/campaigns/ena2020exinpena, last access: 11 March 2024). The goals of this study are to quantify INPs continuously measured for > 45 d at the two ground observatories located in unique ambient conditions (i.e., predominantly terrestrial and marine-influenced sites) and to understand the properties of immersion-mode INPs with respect to the origin of air mass and ambient aerosol properties (i.e., number and surface area concentrations, as well as chemical composition). These two sites are operated by a United States Department of Energy (DOE) Atmospheric Radiation Measurement (ARM) program.
The Southern Great Plains (SGP) site in the central United States is influenced by terrestrial and local anthropogenic sources (Liu et al., 2021; Fast et al., 2019; Logan et al., 2018; Sisterson et al., 2016; Parworth et al., 2015; Wang et al., 2006). A recent study showed that airborne aerosols at the SGP site consist of complex mixing states, with findings indicating that up to 23 % of the aerosol mass is composed of an insoluble fraction (Kulkarni et al., 2023). The past two ground-based campaigns that investigated INP concentrations (nINP) at this site are reported in DeMott et al. (2015) and Knopf et al. (2021). DeMott et al. (2015) measured nINP with a continuous flow diffusion chamber in May and June 2014 and found nINP of ≈ 0.1 to 164.3 L−1 in the freezing temperature range of −14.9 to −32.4 °C. The authors postulated contributions of regional agricultural soil and long-range biomass burning material in aerosols to the INP budget. Knopf et al. (2021) measured nINP using a continuous flow diffusion chamber (CFDC; DeMott et al., 2010) and a Portable Ice Nucleation Experiment chamber (PINE; Möhler et al., 2021). In part, the authors confirmed the detection of about 1 to 100 standard INPs per liter for freezing temperatures between −20 to −30 °C and extended the INP analysis over a single day in October 2019 to better incorporate nINP into climate models via the closure study. Knopf et al. (2021) also found organic carbon in all particles examined as part of the study. Additional offline INP characterizations are underway to specify the source of organic compounds (soil-derived, biogenic, or secondary).
To contrast with the primarily terrestrial nature of the SGP site, here we also report results from another DOE-ARM site in the Azores on Graciosa Island, referred to throughout as the Eastern North Atlantic (ENA) site. There are few INP measurements from the temperate oligotrophic Atlantic Ocean and only one at the ENA site, leaving a potential knowledge gap and increasing model uncertainty in the region. The unique prior offline INP measurements were taken on a single-particle basis for the samples collected during short intensive operating periods (i.e., two days and two nights) in the Azores as part of the Aerosol and Cloud Experiments in the Eastern North Atlantic (ACE-ENA) study in 2017 and 2018 (Knopf et al., 2022). This study demonstrated that fresh sea salt and organics, as well as a comprehensive mixture of aged sea salt combined with other components like dust, sulfur, and organics, serve as sources for deposition-mode active INPs within a temperature range of −42 to −63 °C. This result indicates that there is a partial maritime origin for INPs active in deposition-mode ice nucleation. There are several studies on aerosol physicochemical properties (Zheng et al., 2022; Y. Wang et al., 2021; Zawadowicz et al., 2021; Gallo et al., 2020; Zheng et al., 2018), air mass origins (Wang et al., 2020; Véron and Church, 1997), and cloud condensation nuclei (Wood et al., 2017) at ENA. These studies indicate a site with strong marine influence with the majority of aerosols classified as boundary layer sea spray aerosols (SSAs) (J. Wang et al., 2021), with some also including continental dust and/or anthropogenic aerosols (Véron and Church, 1997).
Marine SSAs, produced during jet spray and wave breaking (Wang et al., 2017), contain INPs (Brooks and Thornton, 2018; Wilson et al., 2015; Andreae and Rosenfeld, 2008). The bubble-bursting process aerosolizes the organic material found in the underlying seawater and particularly the material found in the sea surface microlayer, forming organic- and salt-rich SSA. SSAs containing marine organic material are well-known and globally assumed to be a potential source of INPs (Vergara-Temprado et al., 2017; Burrows et al., 2013). SSAs may dominate the aerosol populations at sites with strong marine influences and possible anthropogenic inputs, as well as the local land contribution. Complementary INP measurements at ENA are desired to extend the characterization of INPs to cover the mixed-phase cloud regime (i.e., ≈ −5 to −30 °C) for a prolonged period and INP parameterization, which motivated our ≥ 45 d INP measurements.
Due to the distinctiveness of the ENA measurement site and the lack of comparable studies, the INP characterization methods verified at SGP were consistently employed at ENA for a longer period (≈ 6 months) than at SGP. The resulting INP data from both sites were processed and analyzed in a consistent manner to elucidate INP sources and abundance in different environments and set a basis for long-term INP data processing and analysis at more remote locations in the future. The high-time resolution data, time-averaged data, and temperature-binned data products here provide first-of-its-kind information about INPs that could be useful for global climate models to reduce the uncertainties associated with current aerosol measurements (Murray et al., 2021).
2.1 Study sites and measurement periods
The locations of the two sampling sites, as well as the ground-level wind properties at each location, are shown in Fig. 1. The study locations are chosen for their unique and distinct conditions suitable to operate our in situ device and to test the autonomous monitoring of ambient INP concentrations through the network at stationary observatories, where stable power and network supplies, as well as additional aerosol physicochemical baseline data, are available. More than a dozen instruments are present at both sites and collect continuous data of aerosol and cloud properties. Many of the same instrument models are used at observatories in both sites. A list of instrumentation and models used for this paper can be found in Table S1 in the Supplement, Sect. S1.
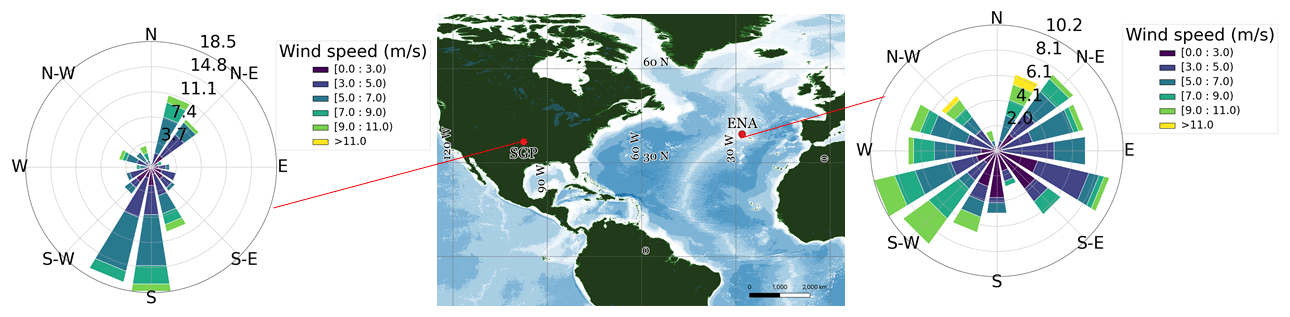
Figure 1The two DOE ARM site locations: the SGP site is located in Oklahoma in the United States, and the ENA site is located on Graciosa Island in Azores. The wind speed and direction distributions during the ExINP-SGP and ExINP-ENA campaigns are shown by the wind roses. The color scale of wind roses represents the wind speed observed at ground level.
The SGP site is located in Oklahoma at 36°36′26.36′′ N, 97°29′15.51′′ W. This site is surrounded by farmland, with the nearest major city, Tulsa, being 187 km away (Sisterson et al., 2016). Sampling activities at the SGP site took place from 1 October to 15 November 2019 (UTC). The SGP site is the oldest DOE ARM site, established in 1992 as the first Clouds and Radiation Testbed (CART; Stokes and Schwartz, 1994). The nearest large water body is the Gulf of Mexico, and any marine aerosols would be transported and mixed with continental aerosols. The site has distinct seasons and variable wind sources (Sisterson et al., 2016; Stokes and Schwartz, 1994).
The ENA site is located in the Azores at 39°5′29.76′′ N, 28°1′32.52′′ W (Wood et al., 2015). While measurements were made at ENA from 1 October 2020 to 28 March 2021 (UTC), the analysis here will focus on sampling from the autumn period from 1 October to 30 November 2020, UTC). Although ENA is 1500 km from the nearest continental land mass, Saharan dust has been observed at the site (Logan et al., 2014). Entrainment and transport of large quantities of Saharan dust by the Azores High is the primary method of transportation of dust across the North Atlantic Ocean (Doherty et al., 2008). It should be noted that the center of the Azores High is not necessarily centered over the Azores themselves but is known to vary (Mächel et al., 1998). However, the ENA site does show a strong influence from the Azores High (Rémillard and Tselioudis, 2015), which can entrain Saharan dust and bring this material to ENA.
Although there are small towns on islands in the Azores, most of the influence at the ENA site is marine (Wood et al., 2015). Possible anthropogenic influence comes primarily from transportation, as the sampling site is near the island's airport to the north, and the road to the south has large fire trucks traveling across it multiple times daily on the way to the airport. There are generally two to three flights arriving and departing to and from Graciosa each day, but the schedule was not consistent across the sampling period, so anthropogenic influences, which typically introduced aerosol spikes, were determined from black carbon levels using methods described in Sect. 2.5.2.
Aerosol particles for online and offline INP measurements were collected through similar quasi-laminar flow, 5.5 m height inlets constructed with aluminum pipes at the sampling sites (6 and 4 in. diameter pipes at SGP and ENA, respectively). At the SGP site, the stack inlet was also topped with a total suspended particle (TSP) inlet, and the INP measurement and sampling activities were performed in the guest instrument facility (GIF). Similarly, aerosol inlets were capped with a TSP inlet, and samples were drawn through the inlet into a dedicated air-conditioned sampling trailer at ENA. More information on the inlets used at the two sites and their inlet particle loss data can be found in Sect. S2.
2.2 Ice-nucleating-particle-concentration measurements
At both the SGP and ENA sites, the similar measurement setup described in Sect. 2.2 was used for online measurements of nINP as a function of temperature (nINP(T), per liter of air) and aerosol particle sampling activities. Online INP measurements and aerosol particle sampling activities for offline INP measurements were made concurrently, although the time resolution, as well as the examined freezing temperature range, was different.
2.2.1 Portable ice nucleation experiment chamber
The nINP values were measured at both sites with PINE version 03 (Bilfinger Noell GmbH, PINE-03 hereafter) (Möhler et al., 2021). PINE-03 is capable of measuring but not distinguishing between both immersion-mode and deposition-mode freezing events. At ENA, the stack inlet was connected to PINE-03 via a in. internal diameter copper pickup tube. Sampling to PINE-03 at SGP was conducted through a similar stack inlet connected to a in. internal diameter copper pickup tube. At SGP, these activities were carried out at the ARM guest instrument facility.
PINE-03 operates by cycles of flushing ambient dried air through a cooled chamber and subsequently forced air volume expansions of the sampled air within the chamber. During the expansions, the sample gas temperature and pressure are continuously reduced to create supersaturated conditions with respect to ice and liquid water. This virtual expansion triggers ice nucleation in the presence of INPs. Particles exiting the chamber pass through an optical particle counter (OPC; fidas-pine; Palas GmbH), and ice crystals are differentiated from smaller aerosol particles and/or water droplets on the basis of their optical size. In our typical measurement operation, the air gas set-point temperature to examine heterogeneous freezing in the chamber was changed between −10 and −31 °C at SGP and between −14 and −31 °C at ENA. The time resolution of such a temperature cycle was approximately 2 h, and thereby the 6 h time-averaged PINE-03 data represent nINP(T) from three temperature cycles.
At SGP, the chamber was flushed with ambient air through the stack inlet for 300 s at a volumetric air flow rate of 2 L min−1, followed by an expansion with 3 L min−1 of pump flow to a 750 mbar internal pressure and a refill with ambient air at 2 L min−1 back to ambient pressure. At ENA, the chamber was flushed at 2 L min−1 for 600 s, followed by expansion with 3 L min−1 of pump flow to an 800 mbar internal pressure, and then refilled at 2 L min−1 to ambient pressure. With the flushing conditions at both ENA and SGP, we ensured that the replaced population of aerosol particles in the vessel was measured in each run. PINE-03 was also cleaned with a daily cleaning cycle where filtered ambient dry air was flushed through the chamber until no particles were detected anymore with the OPC during the expansion mode.
The calibration of PINE-03 is described in Sect. S3. Moreover, the instrument was defrosted every 3 months using methods described in Sects. S4 and S5. A leak test (as described in Sect. S6) was performed several times during the sampling period, and a vibration test (Sect. S7) was performed at ENA. These procedures and tests ensure that no internal ice crystals formed and could have led to a high-bias in nINP.
The nINP values normalized to a unit volume of sampled air were calculated from PINE-03 data following the method described in Möhler et al. (2021). The concentration of INPs measured with PINE-03 (nINP, standard per liter of air) is calculated using the following equation:
where ΔNice is the count of ice crystals measured with the OPC, Fem is the volume of expansion (Vem) divided by the duration of the expansion, and Δtem is the duration of the expansion. More detail on PINE-03 data analysis can be found in Sects. S8 and S9, and information on the systematic and statistical error inherent in PINE-03 measurements can be found in Sect. S10. We note that the time resolution of one expansion at SGP is approximately 8 min and at ENA approximately 12 min due to the longer flush time. The prolonged flushing helps PINE-03 to exchange the air mass in the vessel and avail unexamined air for the consecutive expansion. Please see Möhler et al. (2021) for more information about PINE-03. It is also noteworthy that the minimum temperature measured during the expansion represents the temperature for nINP for each run in this study.
2.2.2 Collection of aerosol particles on filters for offline INP analysis
Aerosol particle samples were collected at both ENA and SGP using a single-stage filter impactor on cleaned 47 mm polycarbonate filters (Whatman Nuclepore, 0.2 µm pore size). For cleaning, filters were soaked in 0.05 vol % hydrogen peroxide and dried at room temperature prior to sample collection to remove any preexisting organic contaminants, and blank filters were also periodically collected at each sampling site. Filters were collected for approximately 4 d at around 7–10 L min−1 (see Sect. S11 for exact filter sampling periods and airflow information). Filters were stored in sealed, sterile petri dishes at −20 °C prior to analysis (other than during sampling and transportation, which took up to 14 d in total), which occurred no more than 12 months after collection.
Filters from ENA were analyzed using the West Texas Cryogenic Refrigerator Applied to Freezing Test (WT-CRAFT) instrument (Vepuri et al., 2021). Taking into account the expected particle concentration, filters were placed in a calculated volume of HPLC-grade water (Sigma Aldrich) in sterile tubes (15 mL, VWR International LLC), shaken for 5 min to liberate particles, and allowed to stand for 1 min. Samples were placed onto an aluminum plate coated with clear petroleum jelly (70 droplets, 3 µL volume each) and placed into the cryocooler. A video was recorded as the samples were cooled at a rate of 1 °C min−1 and analyzed in 0.5 °C increments to determine the fraction of droplets frozen. A complete dataset includes data from 0 to −25 °C. Although the cryocooler is capable of reaching temperatures below −25 °C, using data from this range ensures that we only include data that can be attributed to immersion-mode freezing events without artifacts (see Sect. S11). The lowest calculated nINP was reported at each 0.5 °C increment to prevent overestimation of nINP (Vepuri et al., 2021). Our HPLC-grade water is virtually INP-free at −25 °C (Wilbourn et al., 2023a). Data from WT-CRAFT have a minimum INP detection limit of 0.001 L−1. The temperature uncertainty for WT-CRAFT is ±0.5 °C with a 23.5 % uncertainty in nINP (Vepuri et al., 2021). A 95 % confidence interval was calculated for each 0.5 °C data point as described in Schiebel (2017), and the analysis of blank filters is discussed in Sect. S11.
Filters from SGP were analyzed with the Ice Nucleation Spectrometer of the Karlsruhe Institute of Technology (INSEKT) system (Schneider et al., 2021; Schiebel, 2017). Samples on filters are resuspended in 8 mL of filtered nano-pure water and mixed. This volume of water was based on the volume of air filtered through each filter and ensured that the minimum detection limit was 0.015 INPs per liter of air. Samples are then aliquoted into wells in a polystyrene polymerase chain reaction (PCR) plate (50 µL per well) that is cooled at 0.33 °C min−1. Sample freezing is observed through a camera based on light transmission intensity. The temperature uncertainty associated with INSEKT is ±0.5 °C. Both offline instruments are employed to detect freezing events at temperatures warmer than PINE-03. WT-CRAFT and INSEKT provide equivalent data and have been compared previously (Hiranuma et al., 2021).
Samples collected on filters were also treated with 100 °C heat to remove heat-sensitive material, including but not limited to proteins, which denature at temperatures above approximately 60 °C (Hogg, 2013). A 1 mL portion of the suspension containing the sample was placed into a sterile 15 mL polycarbonate tube (VWR), which was then capped and placed into a beaker of boiling water for 20 min. The sample was allowed to cool, and then nINP was measured with either WT-CRAFT or INSEKT. The heat-treated sample was also diluted as needed to collect data between the warmest freezing point and −25 °C.
The number of INPs (nINP(T), per liter of air) collected on a filter sample can be calculated as
where funfrozen is the fraction of droplets unfrozen at a given temperature, Vdrop is the individual droplet volume (3 µL for WT-CRAFT, 50 µL for INSEKT), Vair is the volume of air sampled (L), and Vwater is the volume of HPLC-grade nano-pure water used to resuspend the sample (mL; see Tables S5 and S6 from Sect. S11 for amounts used for each filter). The number of aliquots made for each method was chosen to increase statistical validity.
For samples analyzed with WT-CRAFT, if sample data at full strength did not reach the minimum temperature (−25 °C) the sample was diluted 10 times or 100 times with HPLC-grade water and the diluted sample nINP was measured using the same method. Samples analyzed with INSEKT were diluted 15 and 225 times. To prevent over-estimation of nINP, if there was an overlap between the diluted and full-strength measurements (for data from both WT-CRAFT and INSEKT), the lower of the two calculated nINP at each 0.5 °C was chosen as it typically has lower uncertainties. If the diluted profile did not match the full-strength INP profile within the 95th percentile range, then the diluted sample was re-run.
2.3 Aerosol concentrations and ambient conditions
Aerosol concentrations (naer) were measured at both sites with condensation particle counters (CPCs; TSI, Inc. model 3772). Ambient meteorological conditions, including wind speed, wind vector direction, temperature, pressure, relative humidity, and precipitation properties, were measured at both sites with Vaisala weather transmitters (model WXT520). All instruments were associated with the ARM Aerosol Observing System (other than INP measurement instruments including a filter-based aerosol particle sampling system for offline INP analysis). To compare with data collected at longer and consistent timescales, all online datasets discussed in this report were averaged over 6 h time periods.
2.4 Aerosol surface area estimation
Aerosol size distributions of particles in the ≈ 0.01–20 µm diameter range were measured by a combination of a scanning mobility particle sizer (SMPS; TSI, Inc. model 3936) and an aerodynamic particle sizer (APS; TSI, Inc. model 3321) in the aerosol observing system (AOS) facility at SGP. In this study, we used the ARM's value-added product (VAP) that merges size distribution data from both instruments and integrates surface area concentrations across re-binned mobility diameter sizes for representing the total aerosol surface area concentration scaled to a unit air volume (Saer in m2 L−1) at SGP (Beddows et al., 2010).
At ENA, the aerosol size distribution measuring instruments, such as SMPS-APS or an optical particle counter, were not operational during our study period. Therefore, we estimated the aerosol surface area concentration using the aerosol scattering coefficients measured by the integrating nephelometer (TSI, Inc. model 3563). This ARM baseline nephelometer measures the aerosol particle optical coefficients with three different wavelengths, including 450, 550, and 700 nm, at RH below 40 %. In this study, following Moore et al. (2022), the supermicron (< 10 µm in aerodynamic diameter) aerosol surface area concentration (Saer) was estimated by multiplying the aerosol scattering coefficient measured at the wavelength of 450 nm (bsp in m−1) by 4 and dividing the product by the total aerosol scattering efficiency (Q) (i.e., ). Due to the marine-predominant environment at the ENA site, we approximated Q = 3 as demonstrated in previous studies of marine aerosols (DeMott et al., 2016).
2.5 Aerosol chemistry measurements
2.5.1 Aerosol chemical speciation monitor
Bulk aerosol particle chemistry at SGP and ENA was studied using an aerosol chemical speciation monitor (ACSM; Aerodyne Inc.). The ACSM gives information on non-refractory aerosol particles and was used to determine the mass concentrations of aerosol particles in the following categories: sulfates, nitrates, ammonium, total organics, and chloride (Watson, 2017).
Bulk chemical composition data were available for the entire sampling period at SGP and from 14 to 30 November 2020 at ENA. The native time resolution of ACSM data is 30 min. For ENA, we excluded ammonium as the ARM quality control flagged the ACSM ammonium data for our study period.
2.5.2 Black carbon mass concentration (mBC)
Although mBC was not measured directly, it can be calculated based on light transmission measured by a particle soot absorption photometer (PSAP; Radiance Research) (Springston, 2018). PSAP data were corrected according to Bond et al. (1999) and Ogren (2010) to account for filter loading over time. PSAP instruments operate on the principle that aerosol absorbance is dependent on particle composition.
Measured mass absorption cross-section values for freshly generated black carbon fall within a relatively narrow range of 7.5 ± 1.2 m2 g−1 at 550 nm (Bond et al., 2013). This assumption of uniform aerosol composition may introduce uncertainties in information derived from PSAP data, which represents one of the limitations of this study, as few natural aerosol populations have uniform composition. In this study, the mass of black carbon present in aerosols (mBC, ng m−3) was estimated by dividing the absorption at 529 nm by the estimated mass absorbing cross-section of 7.5 m2 g−1 (Zheng et al., 2018; Bond et al., 2013).
Black carbon can be indicative of anthropogenic influence. For instance, at ENA, due to airport operations, a minute average naer can instantaneously exceed 8000 cm−3 (Gallo et al., 2020). Therefore, the periods corresponding to spikes in black carbon above 50 ng m−3 were removed from the overall dataset to remove local anthropogenic influence (Sanchez et al., 2021).
2.6 Back trajectory analysis and geographic classification of air mass origins
Backward air mass trajectories were calculated using the Hybrid Single-Particle Lagrangian Integrated Trajectory (HYSPLIT) model (Rolph et al., 2017; Stein et al., 2015) (available at https://www.ready.noaa.gov/HYSPLIT.php, last access: 11 March 2024) to compute archive trajectories every 6 h during the sampling period. Each 96 h backward trajectory was calculated at the sampling inlet height (5 m a.g.l.). The origin of the back trajectory was classified into broad regional categories, including the major oceans and continents. More information on the air mass origin classifications for SGP and ENA can be found in Sect. S12.
While the impact of cloud scavenging on aerosol particles, as well as dry and wet deposition, is not considered in this study, as precipitation removes aerosols via wet scavenging, the amount of precipitation was examined along each back trajectory. Starting at the inlets of SGP and ENA and tracing backwards along the trajectory, the trajectory was truncated at the point 1 h before the sum of all rainfall exceeded 7 mm. The back trajectory origin was reclassified as necessary if the newly identified origin occurred less than 96 h prior (Gong et al., 2020a).
Each back trajectory's travel time over land versus over open water versus over ice percentage was calculated with a time resolution of 1 h. Using the geoJSON file, which provides highly accurate 23 MB coordinates and multi-polygon representation of the countries and the sea-ice extent on Earth (Natural Earth, 2024), hourly computed spatial coordinates were first checked if they fall within a country and then if they fall over land. Otherwise, the coordinate was subsequently checked against the coordinate boundary of the sea-ice extent based on the geoJSON file analysis for the corresponding time. If the coordinate point is within the coordinate boundary of the sea-ice extent, then it is over ice. If the back trajectory's coordinate location is not within a country's coordinate boundary or the sea-ice extent boundary, then it is over open water. Each percentage is tracked, and a total percentage is given for all trajectories.
3.1 Ambient atmospheric conditions and aerosol abundance
The ambient measurements taken at the two sites show contrasting conditions. The temperature at SGP was lower, with an average temperature of 10.2 °C compared to 18.3 °C at ENA, even though the ENA study period continued further into the autumn season. The mean relative humidity at ENA was higher, at 76.4 % compared with 65.5 % at SGP. Although the Great Plains are known to have strong winds, the average wind speed at the two sites was comparable, with an average wind speed of 5.3 m s−1 at ENA and 5.1 m s−1 at SGP. In fact, the maximum wind speed at ENA of 11.4 m s−1 was slightly higher than the maximum wind speed of 10.4 m s−1 at SGP (Fig. 1). The wind at both sites predominantly came from the south, although both sites had variability in wind direction and air mass origin that will be addressed in Sect. 3.6.
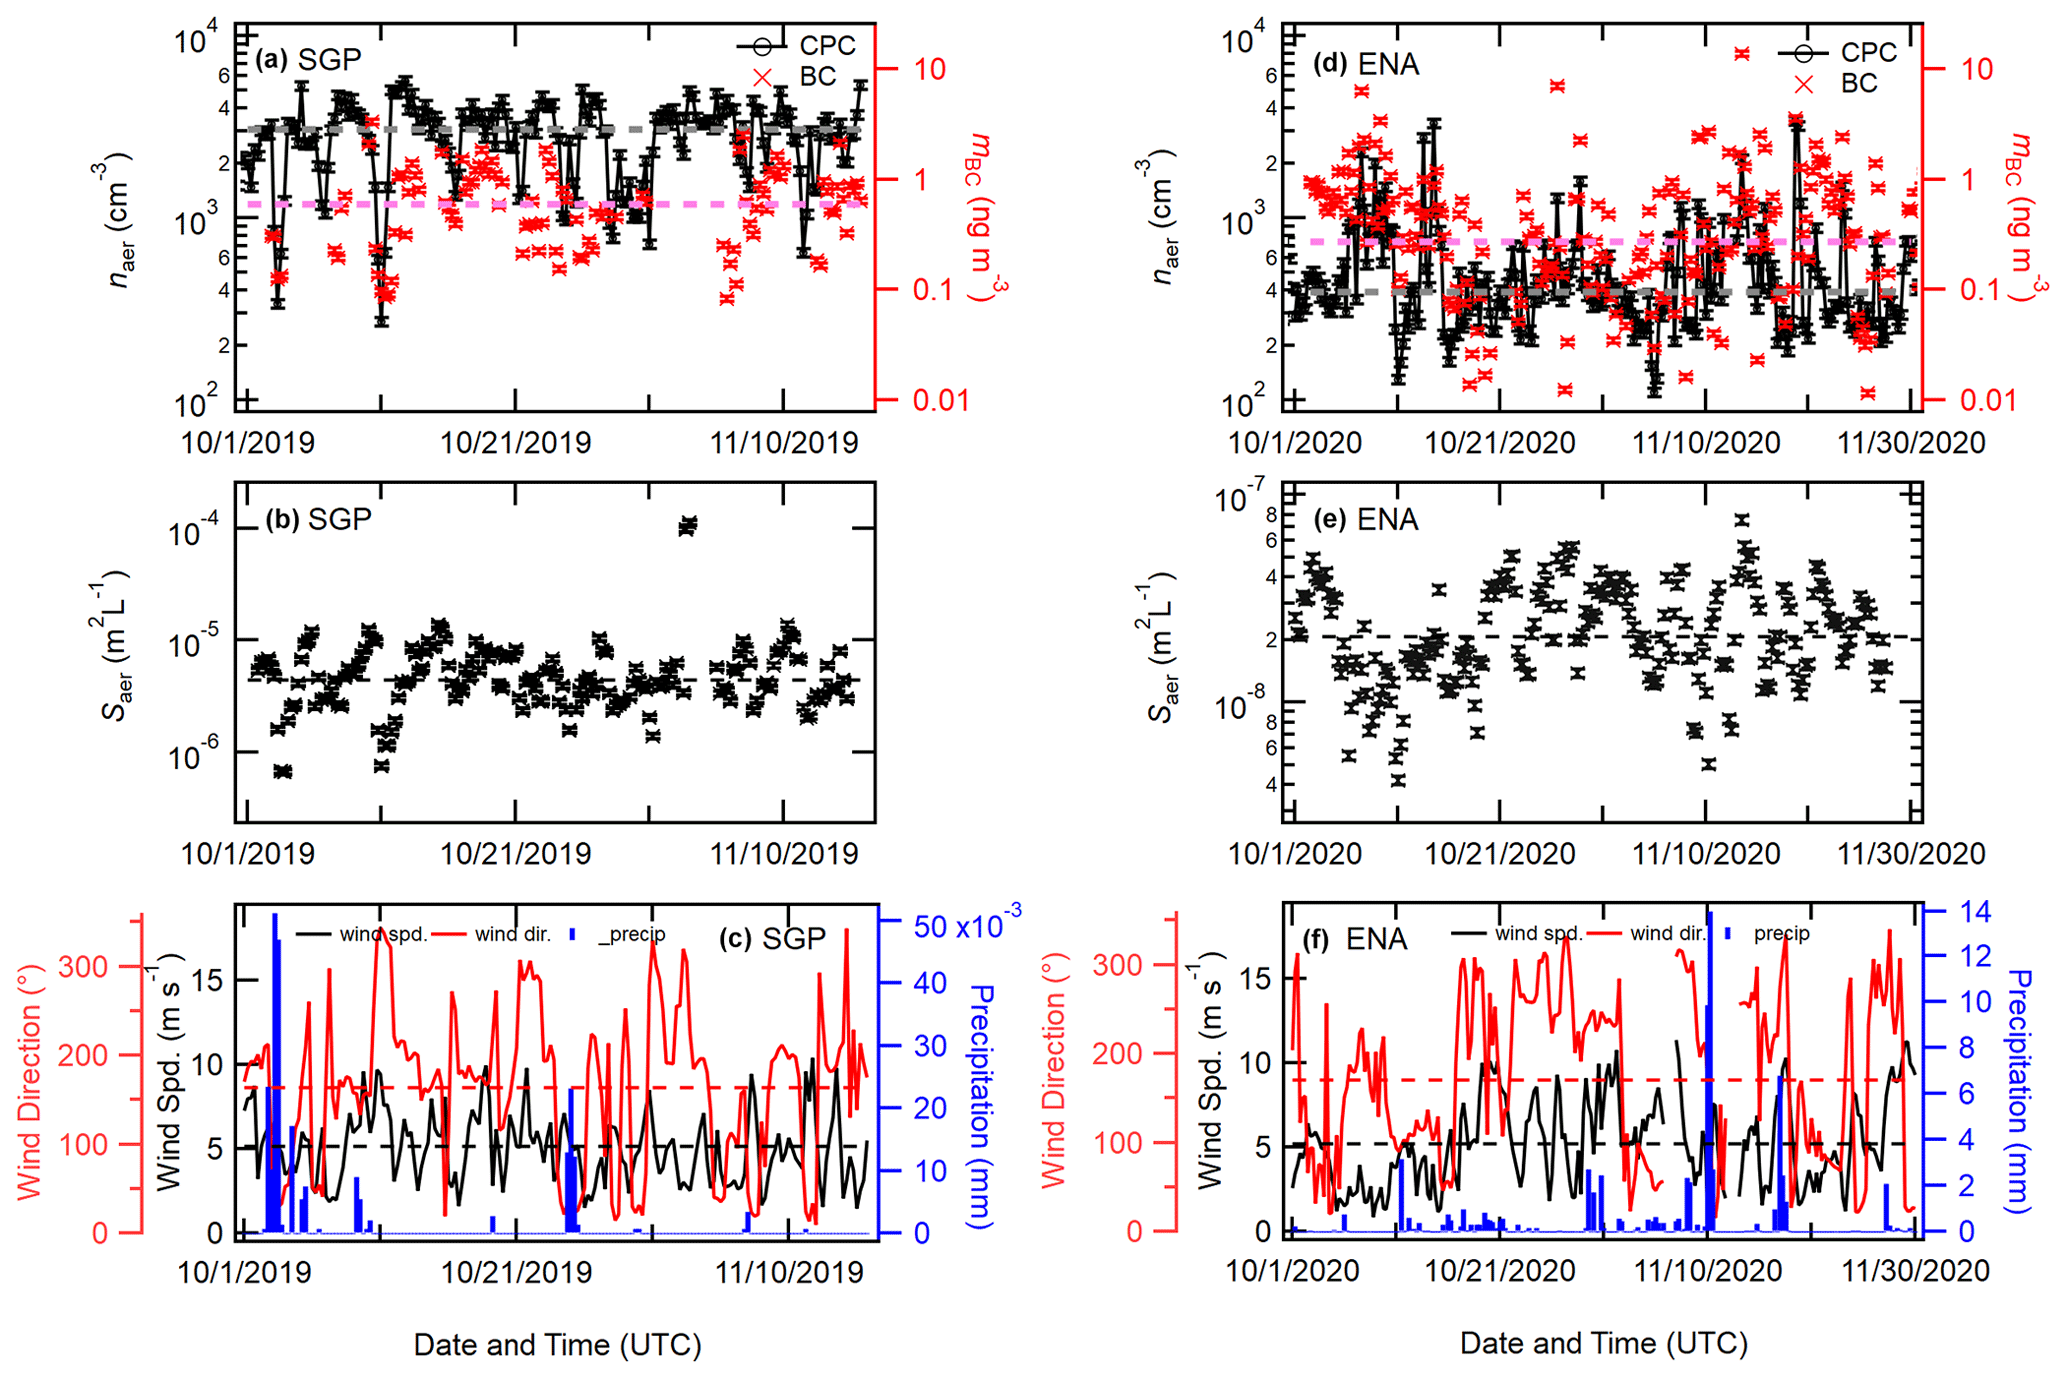
Figure 2The 6 h average total particle concentration (naer; cm−3, shown with black dots), mass of black carbon (mBC; ng m−3, red crosses), total surface area concentration (Saer; m2 L−1, shown with black crosses), and meteorological (wind properties and precipitation measurements) at SGP and ENA. Data for the SGP study period (2019) are plotted in panels (a)–(c), and data for the ENA study period (2020) are plotted in panels (d)–(f). The measurement accuracy of aerosol and BC concentrations is expressed by inlet flow variability of 5 % (Kuang, 2016). Dashed lines in each panel represent median values of individual measurements for our study periods.
Figure 2 shows the time series plots of aerosol number and surface area concentrations, black carbon mass, and wind and precipitation properties at both locations. The total particle concentration (naer, cm−3, shown with black dots) was measured with the same model of CPC at both sites and plotted at 6 h averaged intervals. The median naer (± standard error) at ENA (393.25 ± 30.85 cm−3) was almost an order of magnitude lower than SGP at 3055.00 ± 87.83 cm−3. This number at ENA is within the seasonal baseline naer values of 346 cm−3 (winter) to 428 cm−3 (summer) from the ACE-ENA campaign in 2017 (Gallo et al., 2020). Even long-term ENA-CPC data from 2015 to 2021 support the seasonal variation between ≈ 300 cm−3 (winter) and ≈ 600 cm−3 (summer) at ENA (Ghate et al., 2023). At SGP, our median naer of 3055 cm−3 is similar to the previous total aerosol abundance measured at SGP for air mass flow from the US Midwest (2304 cm−3) and Northwest (3369 cm−3) regions in May 2003 reported in Wang et al. (2006). There were times when naer at SGP was well below 500 cm−3, and the concentration of particles was much more variable and on average higher at SGP than ENA. The maximum naer of 5677.39 cm−3 at SGP was also higher than 3427.59 cm−3 at ENA.
Although the average naer differed by an order of magnitude between the two sites, estimated mBC values (plotted with red crosses in Fig. 2) are much closer, with an average mBC of 0.59 ± 0.08 ng m−3 at ENA and 0.74 ± 0.06 ng m−3 at SGP (average ± standard error). The maximum mBC was also nearly 4 times higher at ENA when compared with the maximum mBC at SGP (13.67 and 3.35 ng m−3, respectively), and the spread of mBC values is slightly greater at ENA than at SGP. It is known that there is local anthropogenic influence at the ENA site due to its location within half a kilometer of the local airport as well as a road passing next to the site. However, there were no periods longer than 3 h with such high concentrations of black carbon at ENA, indicating a predominance of clean conditions with little to no direct anthropogenic influence. At SGP, less mBC is due to local anthropogenic production; instead, it is dominated by transported black carbon particles from biomass burning and wildfires (Logan et al., 2018).
The median Saer (± standard error) at SGP was 4.4 × 10⁻⁶ ± 2.4 × 10⁻⁷ m−2 L−1, which is 2 orders of magnitude higher than ENA at 2.1 × 10⁻⁸ ± 7.9 × 10⁻¹⁰ m−2 L−1. The min–max ranges of Saer at two sites are 6.7 × 10⁻⁷–1.1 × 10⁻⁴ and 4.2 × 10⁻⁹–7.5 × 10⁻⁸ m−2 L−1 at SGP and ENA, respectively. Knopf et al. (2021) conducted the single-particle microspectroscopy and cluster analysis for particle composition type classification with particle samples collected on 15 October 2019 during the Aerosol–Ice Formation Closure Pilot Study campaign, which took place in parallel to ExINP-SGP. The authors reported a substantial fraction of dust particles in a supermicron population (≈ 36 % out of 629 particles) as compared to submicron particles (≈ 4 % of 8521 particles). While there are no long-term measurements of dust during ExINP-SGP, the observed high abundance of dust-dominant supermicron particles at SGP may have led to this observed high Saer in SGP.
The observed difference in concentration can primarily be attributed to the difference between continental and marine sampling sites. Due to their closer proximity to aerosol sources, continental sites generally have higher total aerosol mass and number concentrations than marine sites. The dominant aerosol sources at marine sites are generally limited to transported material and new particle formation through marine boundary layer interaction with the free troposphere (Clarke et al., 2013; Katoshevski et al., 1999; Russell et al., 1994) and the generation of sea spray aerosols through wave breaking and bubble bursting (Fuentes et al., 2010; Christiansen et al., 2019; Cochran et al., 2017). Transported aerosols at ENA have been observed from sources as distant as North America (Zheng et al., 2020; O'Dowd and Smith, 1993) based on air mass backward trajectories and will be further addressed in Sect. 3.6. Knopf et al. (2022) performed offline single-particle chemical composition analysis with particle samples collected during the ACE-ENA campaign in June and July 2017 and classified particle type into (a) processed sea salt with mineral dust, sulfur, and organic matter; (b) sea salt particles; (c) processed sea salt with mineral dust; and (d) organic matter- and chlorine-containing particles. The authors found a predominance of highly oxygenated sea-salt- and dust-containing particles. The inclusion of sea-salt- and dust-indicative elements (i.e., Na, Mg, Cl, Al, and Ca) are commonly found in the ACE-ENA samples, implying the presence of mixed sea spray aerosols and continental aerosols in ENA.
At SGP, we observed a shift in the wind direction and prevailing northerly wind often coincided with a passing front and a small amount of precipitation (Figs. 1 and 2c). We also observed that the near values decreased followed by precipitation events at SGP (e.g., 2–5, 9–10, and 24–25 October 2019). Nevertheless, for our study period and 6 h time-averaged measurements, there was a statistically insignificant correlation between precipitation amount and near (Spearman's rank-order correlations, ρ, of −0.22 at p < 0.05). Likewise, our ENA data also indicated a statistically insignificant correlation between precipitation amount and near (ρ = −0.3 at p < 0.05).
3.2 Online ice-nucleating-particle concentrations
Shown in Fig. 3 is the comparison of online nINP(T) from two sites for similar freezing temperatures and measurement time ranges. The time series of 6 h averaged nINP(T) from SGP with a temperature resolution of 1 °C is shown in Fig. 3a, with the color of each point corresponding to the freezing temperature. Figure 3b displays the time series of 6 h averaged nINP(T) from ENA with a temperature resolution of 1 °C. For both sites, the nINP(T) data are displayed for freezing temperatures above −31 °C, where we warrant more than 77 data points of 6 h averaged nINP(T) during our study periods. It should be noted that the apparent lack of low-temperature INPs at SGP in the middle of the sampling period is due to the intended measurements at above −20 °C. Due to the precipitation observed during 24–25 October (Fig. 2c), there was a measured decrease in INPs active at temperatures below −25 °C just prior, from 25–27 October 2019.
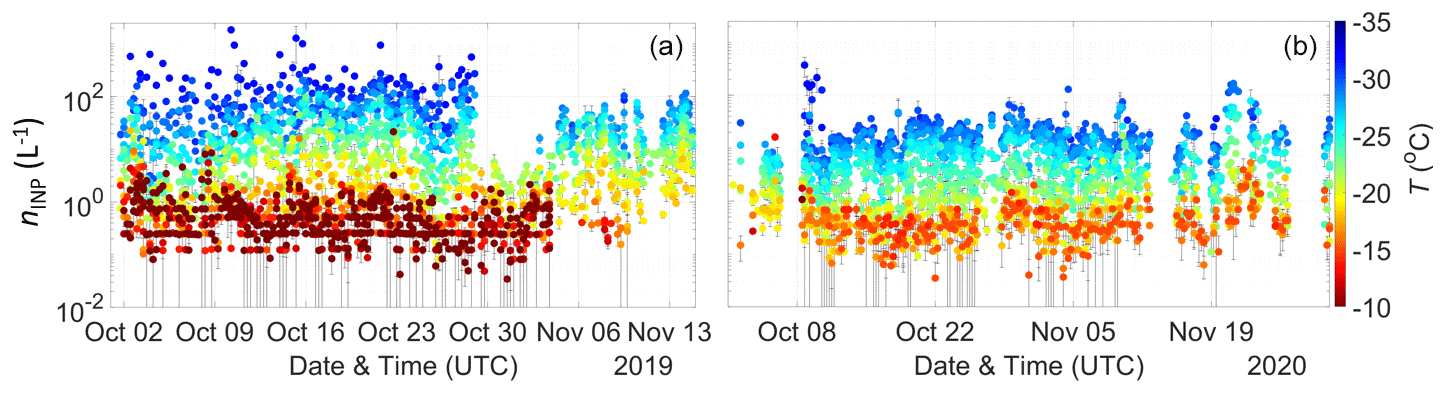
Figure 3INP concentrations (nINP(T)) measured at SGP (a) and ENA (b) with the PINE-03 system. Each point represents a 6 h time-averaged concentration. The color scale indicates the measured freezing temperature. Individual data points are temperature binned for 1 °C and rounded to the closest integer. The vertical error bars represent the standard error of time-averaged data.
The low-temperature INPs measured at ENA during the same time of year show less variability, with a maximum 6 h average (± standard deviation) at −30 °C of 161.0 ± 25.3 L−1. For SGP, a maximum 6 h averaged nINP (−30 °C) was 210.0 ± 44.2 L−1. The highest observed freezing temperature for detecting INPs at SGP and ENA was −5 and −10 °C at SGP and ENA, respectively. The statistical limitation and validity of the nINP measurement at high-temperatures by PINE-03 are discussed in Sect. S10. While the usage of nINP data above our limits is possible, it deserves more discussion and analysis, and we only report the INP data validated by our tests in this paper. Nevertheless, we note that the 6 h time averaging of nINP data helps to lessen the detection limit for approximately an order of magnitude (≈ 0.03 L−1) at both ENA and SGP, while the lowest nINP detection limit for individual expansion is operationally limited to (0.21 and 0.22 L−1 for SGP and ENA, respectively – see Eq. 1).
The measurements at SGP and ENA were made in different years. Regardless, the patterns in nINP(T) can still be compared as representative of the entire autumn season. When comparing the median nINP(T) from October–November for both locations (also refer to Table S7), it is apparent that nINP(T) at SGP is consistently higher than nINP(T) at ENA at all measured temperatures. The observed difference in nINP(T) can be in part attributed to the difference in median naer.
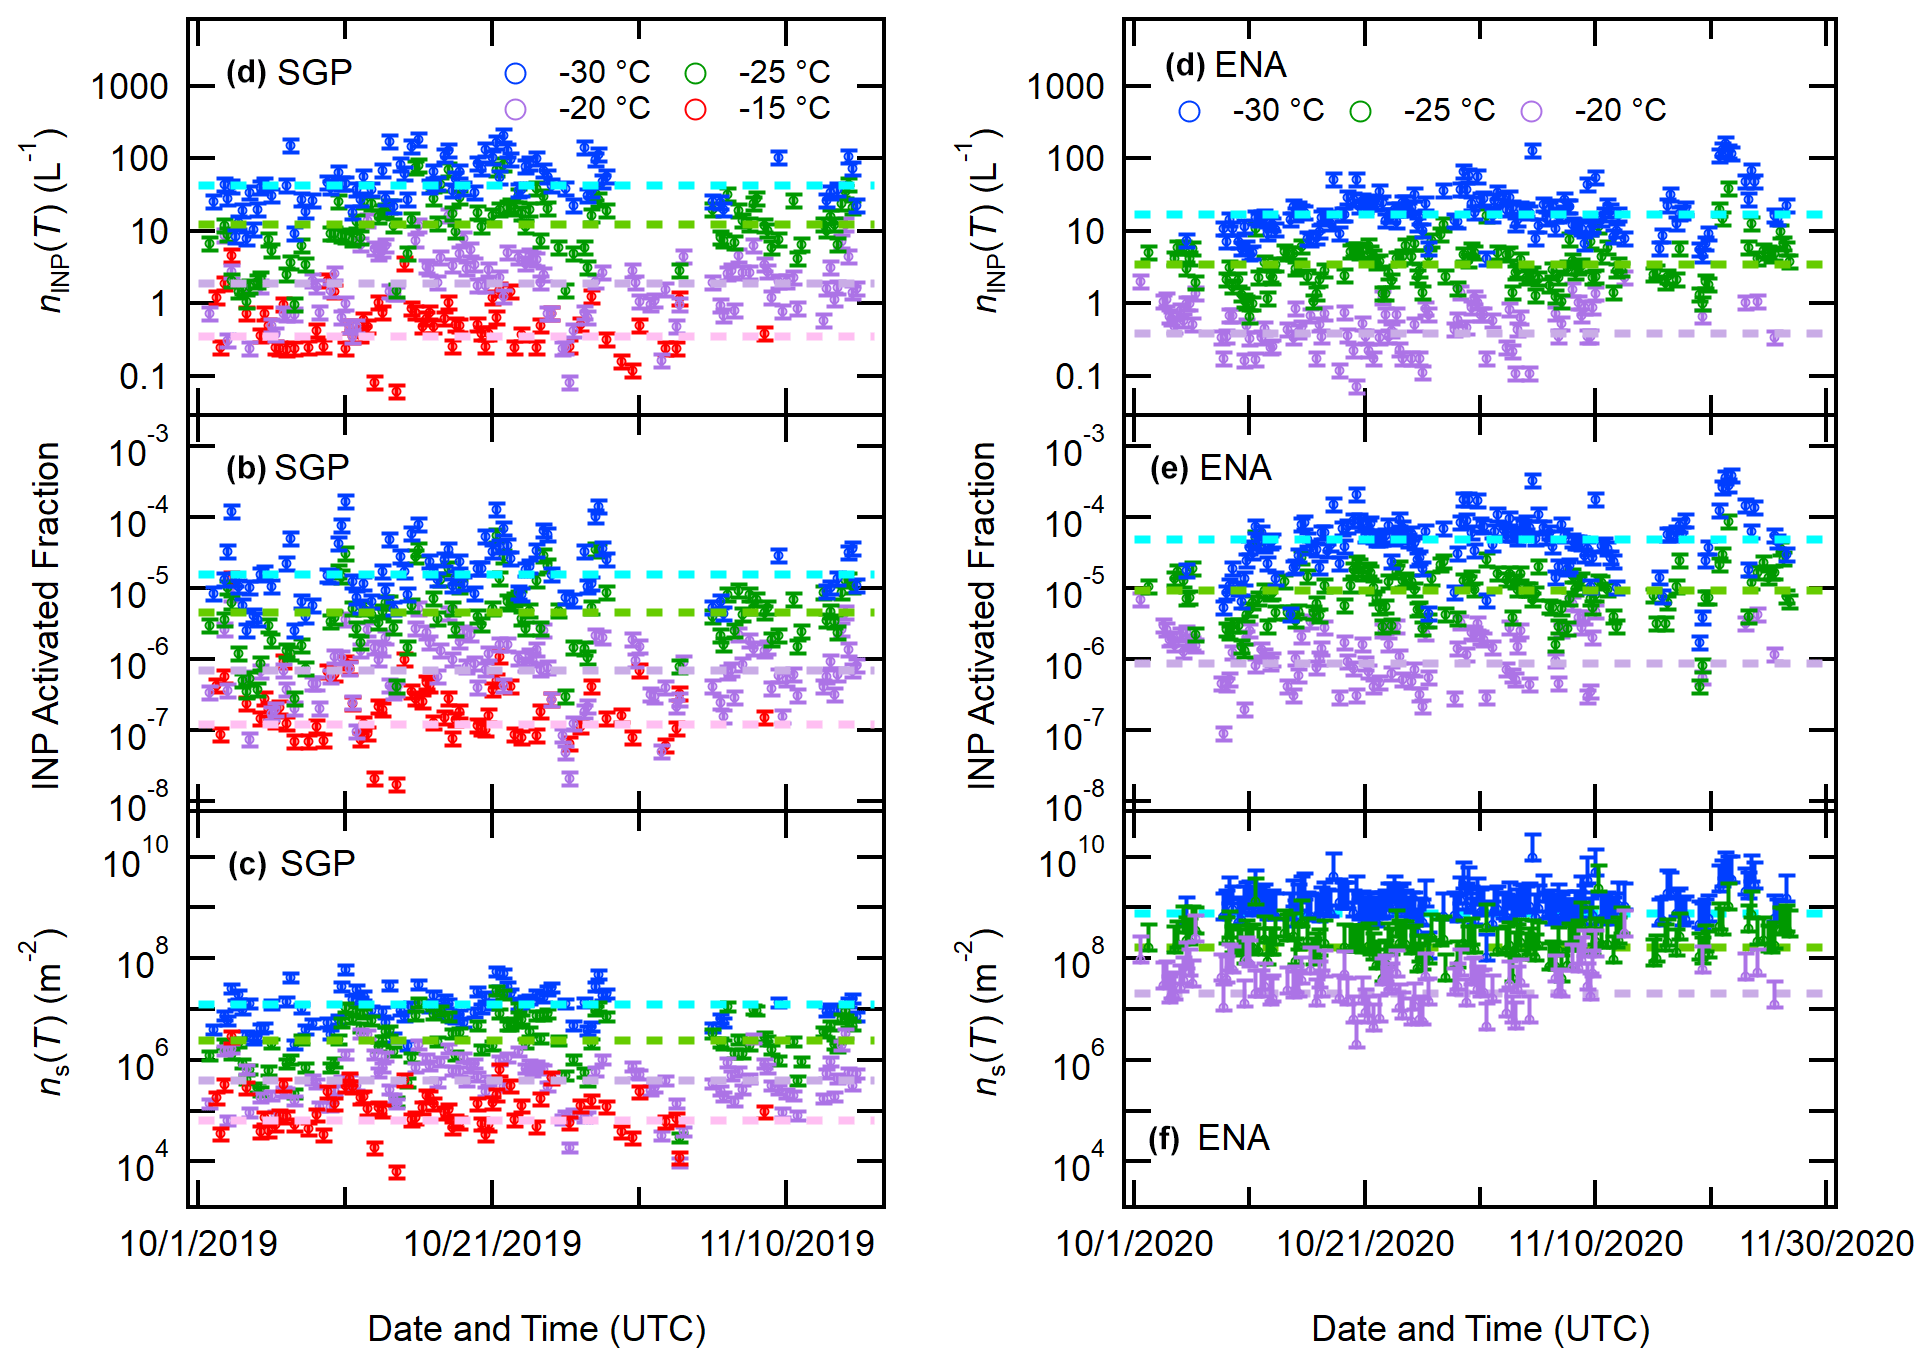
Figure 4The 6 h time-averaged nINP(T), IAF, and ns(T) at selected temperatures at SGP (a–c) and ENA (d–f). Dashed lines represent median values for the measured periods. Error bars in nINP are represented by the systematic error (±20 %). Errors in IAF are estimated to be ±21 % (). Note that the 5 % error is reported in Kuang (2016). Errors in ns(T) at SGP are estimated to be ±27 % (i.e., ). Note that the 15 % and 10 % errors stem from the manufacturer's report for SMPS and APS. Errors in ns(T) at ENA are estimated to be Q ± [3–0.42].
Figure 4 shows the 6 h average nINP(T), INP-activated fraction (IAF = ), and ns(T) (i.e., ) at selected temperatures (−15, −20, −25, and −30 °C). Despite the substantial difference in nINP (nINP,SGP ≫ nINP,ENA seen in Fig. 4a and d), it appears that IAFs at −20 and −25 °C are very similar for ENA and SGP (≈ on the order of 10−5 to 10−6; see Fig. 4b and e). Moreover, IAF interestingly tends to be higher at −30 °C at ENA with a median IAF (−30 °C) of approximately 4.6 × 10⁻⁵ than SGP (≈ 1.7 × 10⁻⁵), while we cautiously note that high variability in nINP (−30 °C) and the aforementioned, intended high-temperature measurements at SGP may play a role in this trend. Likewise, our ns(T) results also exhibit unique trends. The ns (−30 °C) median of ≈ 7.7 × 10⁸ m−2 is substantially higher at ENA than SGP (≈ 1.2 × 10⁷), although we note that different surface estimation methods were used at two sites (Sect. 2.4). At the freezing temperature of −20 °C, the relative significance of ns at ENA (median ≈ 2.1 × 10⁷ m−2) is even more obvious as compared to the ns (−20 °C) median at SGP (≈ 4.1 × 10⁵). The observed IAF and ns trend suggests that (1) nINP(T) does not necessarily scale to naer and Saer (and vice versa), and (2) aerosol population in ENA was found to generate more INPs active at low temperatures, which represents a unique finding of this study.
At SGP, we observed the nINP values decreased followed by precipitation events while IAF and ns remained consistent around the median values, implying that the overall immersion freezing efficiencies of aerosols at SGP remained the same in our study period. Furthermore, for our study period and 6 h time-averaged measurements, there was a statistically insignificant correlation between precipitation amount and nINP ( ≤ 0.12). Similarly, our ENA data also indicated a statistically insignificant correlation between precipitation amount and nINP ( ≤ 0.08).
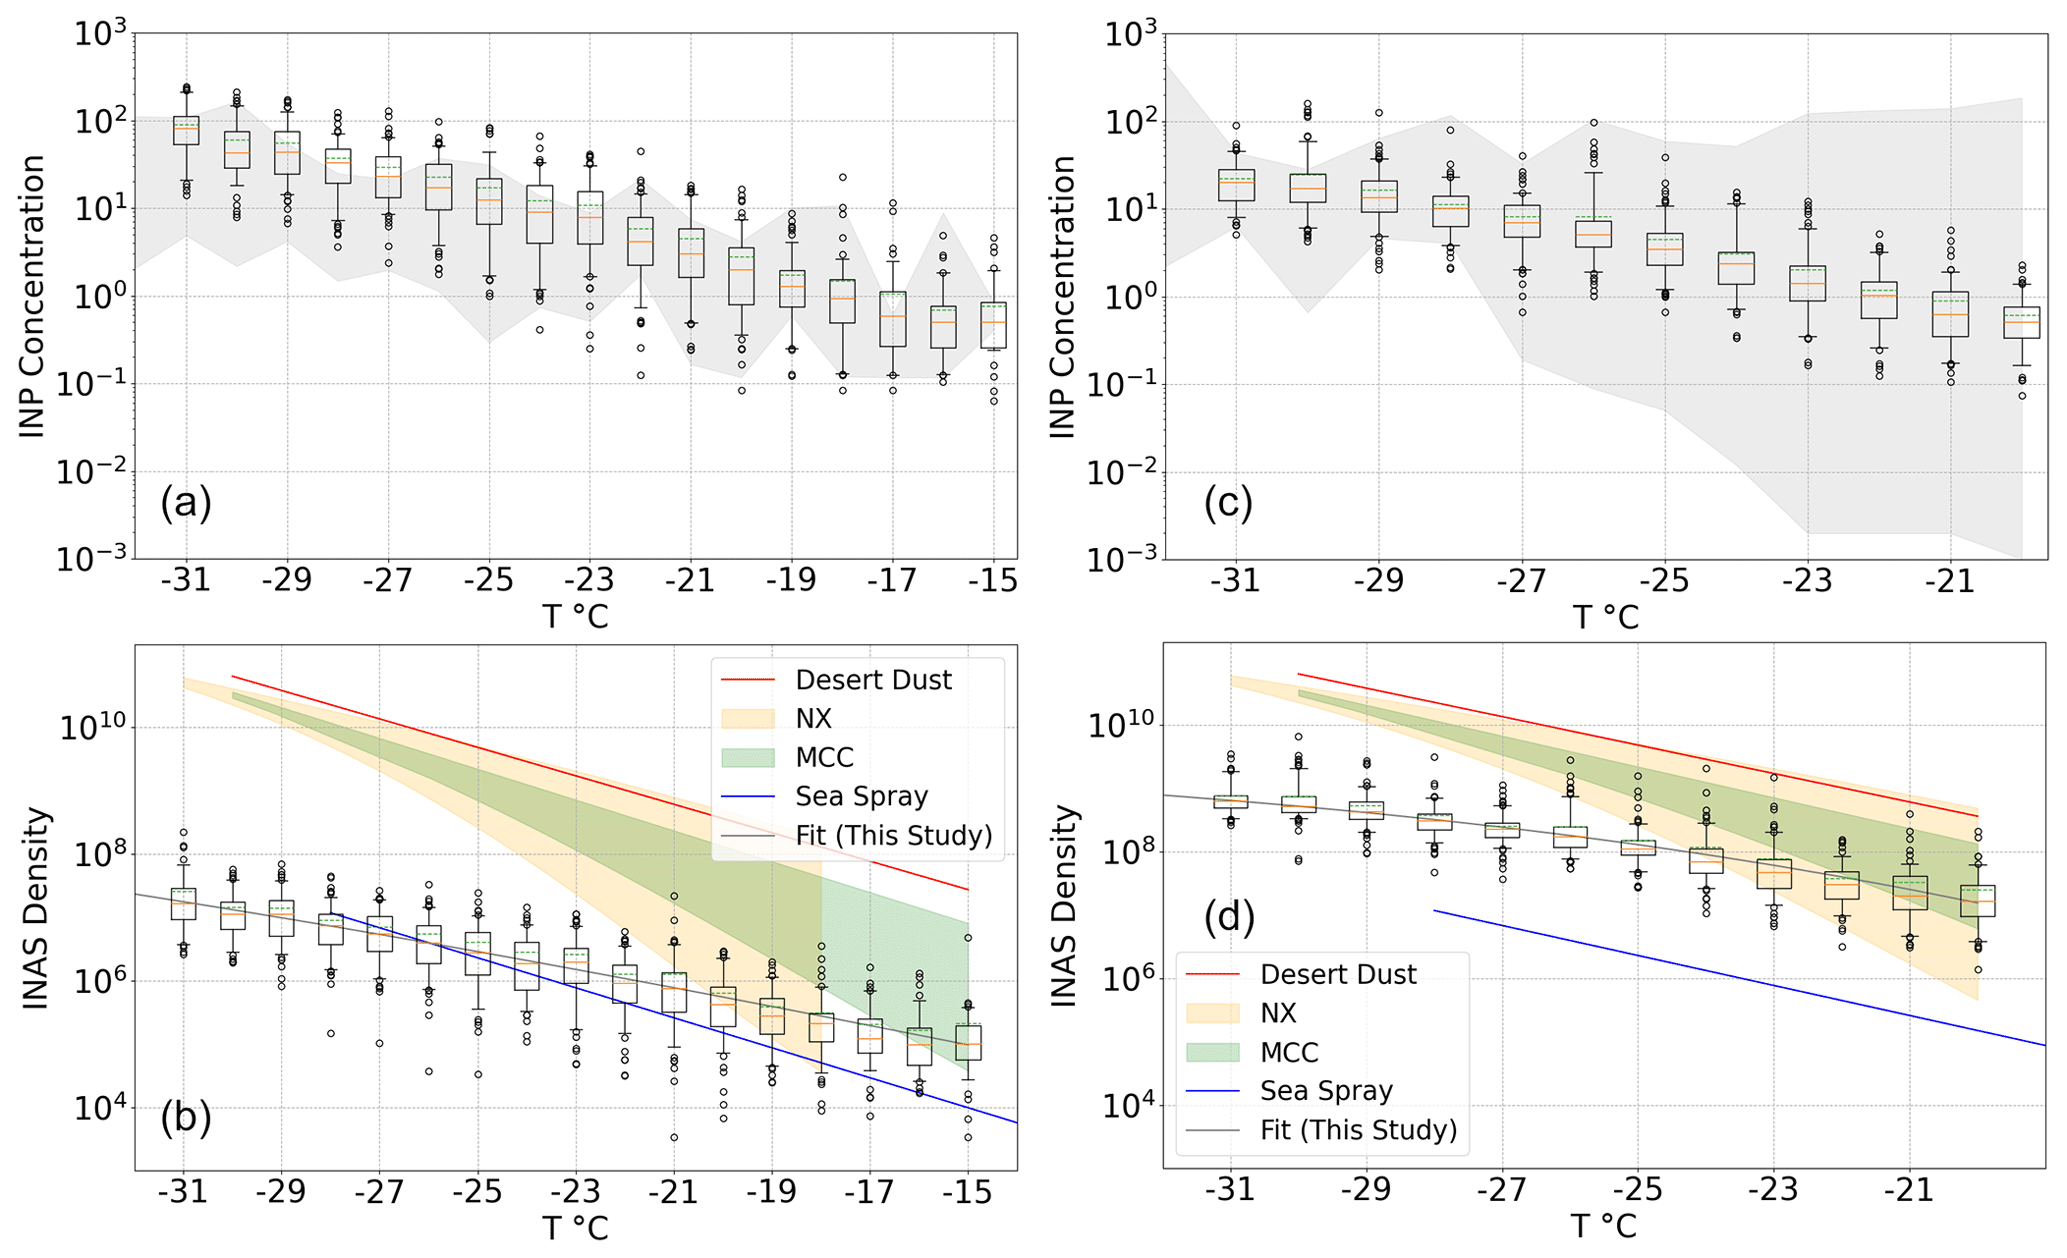
Figure 5Box plot of the PINE-03 based nINP(T) and ns(T) spectra with a degree temperature bin for a statistically validated freezing temperature range at SGP (a–b; −15 to −31 °C) and ENA (c–d; −20 to −31 °C). Individual boxes display median (orange line), average (green line), 25 % and 75 % percentile (whiskers), and outliers beyond 5 % and 95 % percentile values. The grey-shaded area in panels (a) and (c) shows the maximum and minimum nINP(T) measured by DeMott et al. (2015) for SGP and previous INP studies from marine dominant sites located in the Atlantic Ocean for ENA (see Wilbourn et al., 2023a, for more information). The reference ns(T) spectra in panels (b) and (d) are adopted from U17 (desert dust; −14 to −30 °C; Ullrich et al., 2017), M18 (sea spray aerosol; −20 to −28 °C; McCluskey et al., 2018), H15a (illite NX; < −18 °C; Hiranuma et al., 2015a), and H15b as well as H19 (MCC; < −15 °C; Hiranuma et al., 2015b, 2019).
Figure 5 shows the 6 h averaged PINE-03-measured nINP(T) and ns(T) spectra as a function of freezing temperatures (1 °C resolution) as box plots from SGP and ENA. As seen in Fig. 5a, the data from SGP can be compared with previously collected nINP(T) data as reported by DeMott et al. (2015) for April–June 2014. It becomes apparent that the data collected in this study are comparable to data collected in the spring to early summer season 2014.
Although there are no previous studies reporting long-term nINP(T) at ENA, in Fig. 5c, we have compared the data to all other studies reporting nINP(T) in locations with strong Atlantic Ocean influence (Wilbourn et al., 2023a, figure in SI_Sect_S1_Module_2, and references therein). The nINP(T) range for these studies from the Atlantic Ocean is much larger than the range reported at SGP, potentially due to either differences in sample techniques or differences in nINP(T) between the seven locations. By comparing previous studies to our current ENA data, we can conclude that our data fall within the range of nINP(T) reported by them.
Figure 5b and d show the ns(T) spectra, as well as the exponential fits. Following Li et al. (2022), we computed ns(T) parameterizations that fit the median values of the log-normal ns(T) distribution as a function of freezing temperatures as follows:
The comparison between the ns(T) spectra from this study and reference spectra shown in Fig. 5 suggests that the immersion freezing efficiencies of aerosols collected at the ground-level in SGP and ENA are primarily lower than desert dust studied in Ullrich et al. (2017). This outcome was expected as the aerosol population at both sites was presumably not purely composed of desert dust. While a partial overlap of our ns(T) with illite NX (mineral dust proxy) and microcrystalline cellulose (MCC; non-proteinaceous organic surrogate) spectra is seen for both SGP and ENA data in a few temperature bins towards the upper end, the reference spectra of these compositions cannot solely explain the ns(T) trends from SGP and ENA at freezing temperatures approximately below −22 and −25 °C, respectively. The SSA ns(T) parameterization spectrum from McCluskey et al. (2018) shows a less active trend at least in part as compared to the SGP and ENA spectra, implying the aerosols collected at both sites are composed of a mixture of heterogeneous compositions that have a variety of freezing efficiencies. Without size-dependent composition, this cannot be assessed in this study.
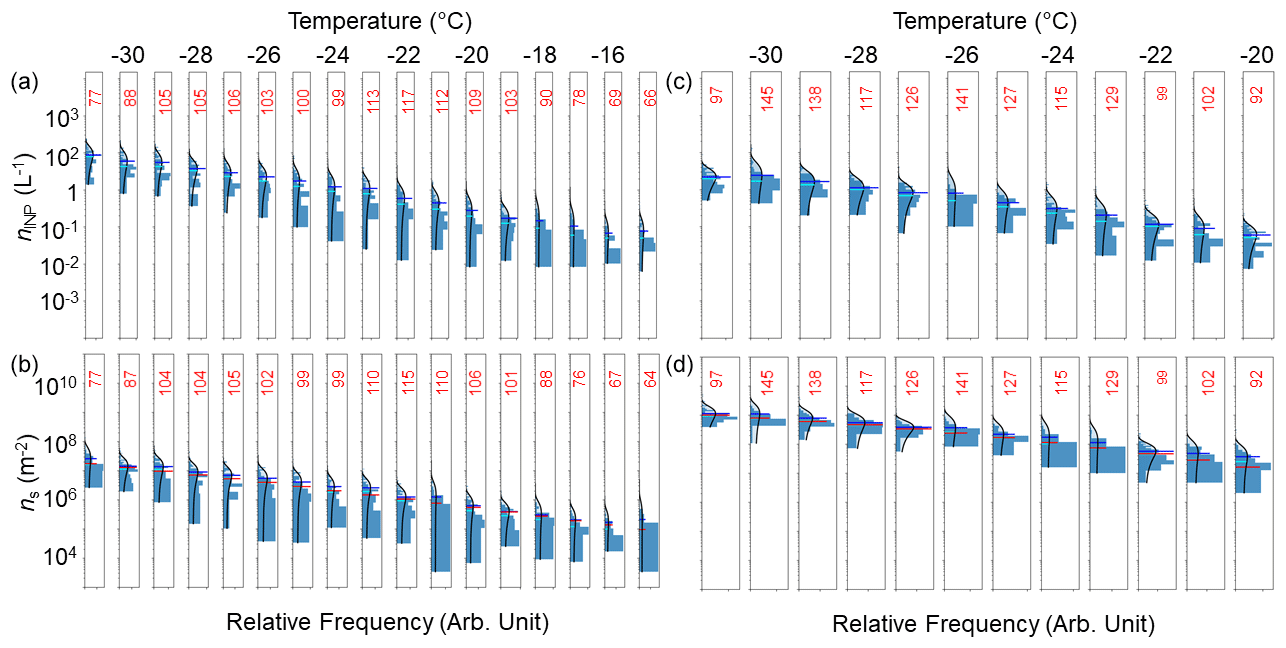
Figure 6Histogram of the PINE-03-based nINP(T) and ns(T) Gaussian distribution with a degree temperature bin for a statistically validated freezing temperature range at SGP (a–b; −15 to −31 °C) and ENA (c–d; −20 to −31 °C). Individual data densities (no. in red) and relative frequencies (arbitrary units) for each degree are shown in each panel. Blue, cyan, and red horizontal lines in each relative frequency distribution sub-panel represent the average, median, and fit ns(T), respectively.
Figure 6 shows a series of histograms displaying probability densities and relative frequency of 6 h averaged nINP(T) and ns(T) data from PINE-03 with a temperature resolution of 1 °C for both sites. The Gaussian log-normal fit is shown for each degree of binned data. As seen, the mode nINP(T) and ns(T) are reasonably comparable to our median ns(T) for our data with the given data density (n > 77) despite some inclusion of outliers at low nINP(T) and ns(T). For the ns(T) distributions, the fitted ns(T) values from this study are also superposed on each histogram to show reasonable agreement with the median values of the log-normal ns(T) distribution.
3.3 Offline ice-nucleating-particle measurements and INP heat sensitivity
The nINP(T) measured from filters gives values at temperatures higher than the operating temperature of PINE-03 due to the larger air sample volume (listed in Tables S5 and S6). At the same time, the temperature range also overlaps with the range above −25 °C measured with PINE-03, allowing for comparison of the two techniques.
Figure 7 summarizes the results of offline INP measurements, represented by nINP(T) box plot and freezing spectra, as well as associated heat-treated INP experiments, from the two sites. The ns(T) spectra are not shown for the offline results here since the time-averaged ns(T) over our prolonged aerosol sampling intervals for offline INP analysis (several days) could be misleading in discussing the atmospheric implications. As shown in Fig. 7, the aerosol particle samples collected at ENA (n = 18) showed a lower nINP(T) at all temperatures when compared with SGP (n = 21), confirming the pattern seen with PINE-03 measurements. As inferred from the box plots and associated freezing spectra as a function of temperature, the average initial freezing temperature (± standard deviation) of samples collected at ENA (−12.4 ± 3.4 °C) was also lower than that of samples collected at SGP (−6.4 ± 0.7 °C), suggesting the terrestrial INPs active at high-temperatures at SGP were not present at ENA.
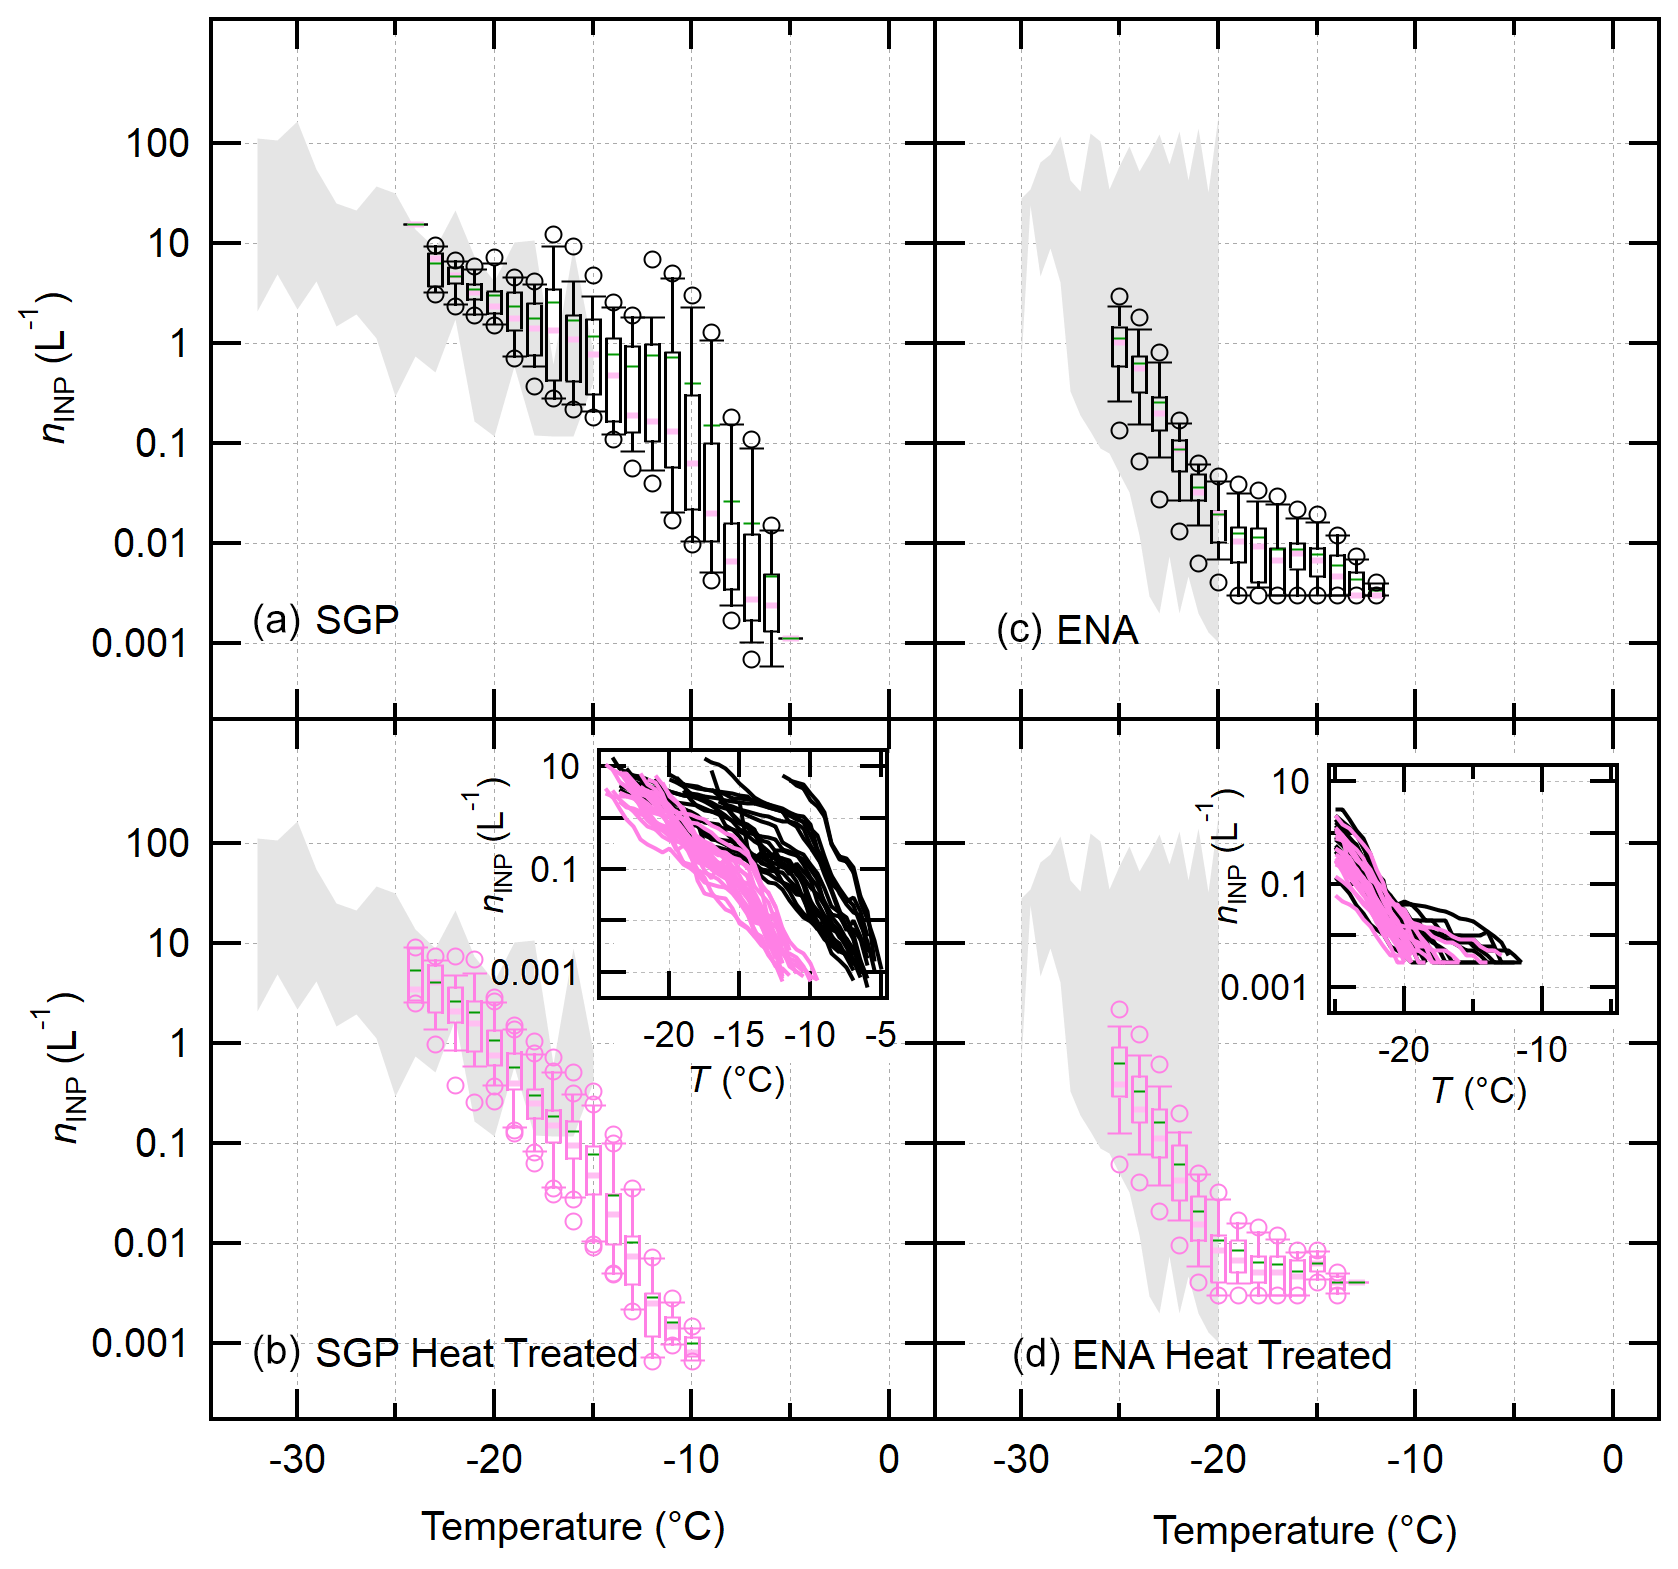
Figure 7A summary of freezing spectra of both non-treated and heated samples from SGP (a–b) and ENA (c–d) is shown. The heat-treated nINP spectra are shown for the SGP and ENA samples (b and d, respectively). The shaded areas represent the previous nINP max–min range adopted from Fig. 5. The inset in panels (b) and (d) shows individual spectra of non-treated and heated samples from each site.
At SGP, the average nINP (−10 °C) was approximately 10−1 INPs per liter, while at ENA, nINP of 10−1 INPs per liter was generally observed at the freezing temperatures of below −20 °C, and only three samples showed freezing activity even at −12 °C. This difference indicates the presence of a greater quantity of high-temperature freezing INPs at SGP, especially INPs active at above −10 °C, which may infer biogenic contributions as discussed below. It is also possible that due to the rarity of high-temperature INPs and the lower aerosol load at ENA, these INPs were present at levels below the detection limit of PINE-03 or a WT-CRAFT system.
The median heat sensitivity of ice-active aerosol particles is also shown in the box plots and associated individual freezing spectra for heat-treated samples (Fig. 7b and d). Both ENA and SGP had measurable ice nucleation activity above −15 °C in unheated samples, with all SGP samples having an initial freezing point above −8 °C. However, once the samples were heated, only three samples at SGP and no samples from ENA showed ice nucleation activity at −10 °C. This decrease in nINP(T) can be attributed to the degradation of heat-sensitive INPs in both samples, which are often referred to being of biogenic origin due to the heat sensitivity of known ice nucleation active proteins through taxonomic characterization (Hill et al., 2016; Daily et al., 2022). Only 3 of the 18 total filter samples from ENA showed any activation above −12 °C in the unheated samples, and none of the samples showed any activity above −12 °C once heated. Thus, the ENA samples exhibited a strong decrease in nINP above −12 °C once heated.
As seen in Fig. 7b, the samples from SGP showed a much greater decrease in total nINP than ENA at all temperatures above −15 °C, again indicating a high biogenic aerosol particle concentration in the INPs from SGP. It should be noted that samples from SGP generally had about an order of magnitude higher total nINP than those measured at ENA, so some of the difference between the two measurements in Fig. 7 is due to this inherent difference. However, even with SGP having a higher overall concentration, the decrease in absolute nINP after heating the SGP samples is still larger than the change seen in samples from ENA (Fig. 7d).
The heat-sensitive INPs may have come from nearby SGP as the sampling site was surrounded by agricultural land and thus fertile soil dust or may have been transported from further away. It is calculated that the majority of INPs at SGP were terrestrial in origin based on the back trajectory analysis (see Sect. 3.6). Further, chemical analysis of both the bulk aerosol particle population and individual particles is discussed in Sect. 3.5 to confirm the nature of the INPs at the two stations.
3.4 Comparing online and offline INP measurements
Figure 8 shows the comparison of online and (non-treated) offline median nINP(T) spectra. The online spectra from SGP (−31 °C ≤ T ≤ −15 °C) and ENA (−31 °C ≤ T ≤ −20 °C) are time-averaged for 48 and 72 h, respectively, to roughly match with the aerosol sampling time intervals for the offline INP analysis. The offline spectra from SGP (−24 °C ≤ T ≤ −5 °C) and ENA (−25 °C ≤ T ≤ −12 °C) are superposed in Fig. 8 for the comparison.

Figure 8Blue and red box plots for the comparison of online vs. offline nINP(T) spectra from SGP (a) and ENA (b). The online PINE-03 spectra from SGP and ENA are time-averaged for 48 and 72 h, respectively, to match with the aerosol sampling time intervals for the offline INP analysis. The offline spectra are all non-heated data. The structural description of individual boxes and grey-shaded areas is given in the caption of Fig. 5.
A good agreement between online and offline nINP measurements is observed at SGP. Table S7 also provides the median number concentration measured with each technique. For example, the SGP filters sampled 2.33 ± 0.50 INPs per liter active at −20 °C (measured with INSEKT), and PINE-03 measured a median nINP of 1.90 ± 0.21 INPs per liter at the same temperature. In contrast, for the ExINP-ENA campaign, when the concentration of INPs measured with PINE-03 is compared with the concentration of INPs measured with offline techniques at the same temperature range, it becomes apparent that there are discrepancies of 1–2 orders of magnitude between the two datasets. The observed difference is far outside of the range of estimated uncertainties. As shown in Table S7, WT-CRAFT measured the median nINP of 0.02 INPs per liter at ENA for a temperature of −20 °C, while PINE-03 measured 0.40 ± 0.03 L−1. This observed discrepancy between PINE-03 and WT-CRAFT data is likely due to the aerosol sampling efficiency on filters or a property inherent to the aerosol particle population at ENA, although elucidation of this property is difficult with current data.
It is noteworthy that the sampling flow generally decreased over time, and the relative sampling flow deviation measured at the beginning and end of each sampling was on average (± standard error) larger at ENA (27.9 ± 3.0 %) than that at SGP (5.1 ± 2.3 %), which might hint to a decreased sampling efficiency at ENA towards the end of the sampling period. The larger deviation observed at ENA than at SGP is also presumably due to longer sampling intervals (typically ≈ 3 d; see Table S5) as compared to SGP (≈ 2 d; see Table S6), but the overall impact on nINP(T) deviation is not yet known.
Rinaldi et al. (2021) and DeMott et al. (2018) saw discrepancies between online and offline measurements and gave several reasons for this. Given that our samples were collected through similar inlets and onto the same filter sampling substrate, and yet samples from SGP generally did not show a mismatch between PINE-03 and filter-based samples, the reason for the discrepancy is likely to be an inherent aerosol property or the environmental conditions rather than the measurement method. The filter samples were collected concurrently with the PINE-03 measurements, but the online PINE-03 measurements do not involve storing the sample for any length of time as the WT-CRAFT and INSEKT measurements do. However, there is no correlation between the length of storage time of samples and nINP measured in the samples (Vepuri et al., 2021). There was a generally higher concentration of INPs measured with INSEKT than with WT-CRAFT, but a previous study compared WT-CRAFT and INSEKT and concluded that their results are comparable when the same sample is examined with each method (Hiranuma et al., 2021).
The same PINE-03 instrument was used for measurements at ENA and SGP. This suggests that there is a difference in the ability of WT-CRAFT and PINE-03 when detecting the ice nucleation ability of aerosol particles with different sizes and certain chemical compositions. The sampling efficiencies for different ranges of particle sizes and the impact of particle size on offline ice nucleation analyses are discussed in Li et al. (2023). One possibility regarding chemical compositions is that, although storage time in a −20 °C freezer might not have impacted nINP measured from filters substantially (Beall et al., 2020), any degradation of ice-active material occurred uniformly across the filter samples before the filters reached the storage site several thousand kilometers from the sampling site at ENA. Another possibility is that PINE-03 is capable of detecting freezing modes other than immersion freezing, while the WT-CRAFT method is only sensitive to INPs active during immersion-mode freezing processes. Möhler et al. (2021) reported that PINE-03 is capable of detecting pore condensation freezing and deposition freezing processes. These freezing modes may be seen when the chamber is supersaturated with respect to ice yet under a water-subsaturated condition. Thus, it is possible that the much larger discrepancy between online and offline measurements at ENA, when compared to the negligible discrepancy at SGP, is due to PINE-03 detecting additional freezing modes that are more prominent at ENA than SGP. For instance, the deposition mode was missing in offline analyses. However, as all previous work at both sites has focused on immersion-mode freezing processes, this remains an area of uncertainty that could be examined by future researchers.
A difference in overall aerosol composition could also explain the apparent mismatch between the two sites. The samples from ENA contain much larger amounts of chloride (see Sect. 3.5) and, due to the dominance of marine material, could contain more salts overall. While these salt-containing particles could act as INPs if they also contained ice-active material (as salt alone is a poor immersion-mode INP), both of the offline methods employed in this study involve suspending aerosol particles in clean water. This suspension process is not present in PINE-03 but would necessarily dissolve any soluble material that could potentially contain ice-active sites on the surface of the particles. Removal of ice-active sites following dissolution could explain the lower nINP(T) seen in filter samples from ENA but not SGP, which has a lower contribution from marine sources.
3.5 Aerosol composition
Figure 9 summarizes the ACSM composition fractions from ExINP-SGP and ExINP-ENA campaigns. Chemical composition data are available for the last 15 d of the autumn period at ENA and the entire sampling period at SGP. The ACSM data have been classified into four categories that include sulfate, chloride, nitrate, and organics. As seen in the figure, the average relative abundance of chloride and sulfate (± standard error) is substantially higher at the marine influence predominant ENA site (0.11 ± 0.01 and 0.41 ± 0.01, respectively) than terrestrial SGP (0.01 ± 0.001 and 0.12 ± 0.005, respectively). In contrast, at the SGP site, a notably high total organic fraction of 0.65 ± 0.01, as well as a high nitrate fraction (0.13 ± 0.01), was observed as compared to the ENA site (0.45 ± 0.01 and 0.03 ± 0.001, respectively).
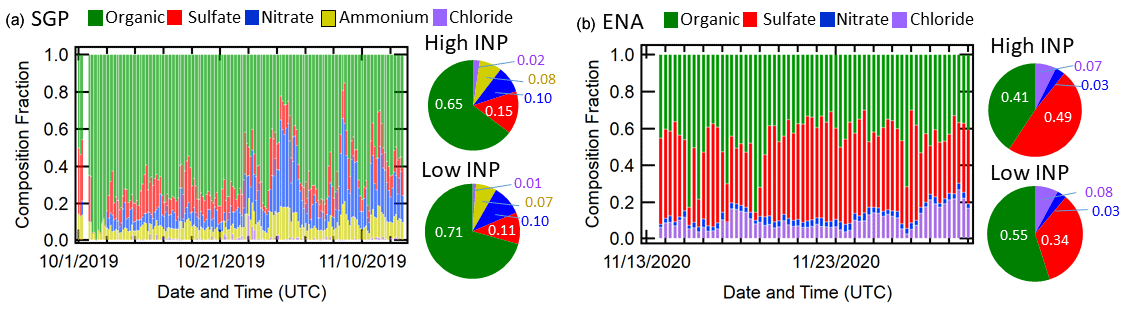
Figure 9Summary time series of ACSM composition fraction at SGP (a) and ENA (b). The pie charts represent the relative composition of examined compounds during high-INP and low-INP periods.
The average chloride concentration at ENA was much higher than the concentration at SGP (0.14 ± 0.01 and 0.03 ± 0.002 µg m−3, respectively). Although chloride may come from anthropogenic sources including HCl and other reactive species, in a site located far from major anthropogenic chloride sources and directly next to the ocean, it would be expected that the chloride source is predominantly marine (Ovadnevaite et al., 2012). In contrast, most of the chloride at SGP could be expected to come from transported anthropogenic material, and the lack of marine-sourced salts provides an explanation for the much lower overall chloride concentration (Jimenez et al., 2009).
The average total organic concentration at SGP was 1.16 ± 0.06 µg m−3, while it was 0.75 ± 0.14 µg m−3 at ENA. This higher organic concentration could in part explain the overall higher naer at SGP than ENA (Fig. 2), although the source of organic aerosols, as well as primary vs. secondary speciation, is unknown at this stage.
Table 1List of high-INP and low-INP periods from SGP and ENA (ND: no data or not detected).

∗ Refer to Sect. 3.5 for the selection criteria.
The pie charts in Fig. 9 display the composition data for selected high-IAF periods at each site. We used both IAF(T) and ns(T) as ice nucleation efficiency indexes to select high- or low-INP periods in this study. For the given INP dataset from SGP, the high-INP episodes were identified by extracting periods when the 6 h time-averaged IAF and ns values all exceed their medians at −20, −25, and −30 °C at each study site (Fig. 4). In contrast, the low-INP episodes are represented by the time when all the IAF and ns at the three temperature values fall less than their medians at SGP. We found 10 periods to be high-INP episodes and 11 to be low-INP episodes. A list of the identified high- and low-INP periods is summarized in Table 1 along with composition fractions and ice nucleation efficiency parameters.
For ENA, because the ACSM data were available only from 13 November 2020, the high-INP episodes were identified by extracting periods when the available 6 h time-averaged IAF and ns values exceed their medians at −20, −25, and −30 °C from 13–30 November 2020. Likewise, if no available IAF and ns values exceed the medians for the same time interval, the data at the given time are considered to constitute a low-INP period. For ENA, we identified 14 data points each as being in a high-INP period and 9 as being in a low-INP period (see the ACSM rows in Table 1).
Interestingly, the increase in an average (± standard error) organic fraction in ACSM data coincided with low-INP cases (i.e., the suppression in freezing efficiency) at both ENA (0.55 ± 0.02) and SGP (0.71 ± 0.04), whereas high-INP periods exhibited a lower organic fraction to the campaign average at ENA (0.41 ± 0.06) and SGP (0.65 ± 0.03). However, this observation does not rule out the role of organics in atmospheric ice nucleation, and the detailed characterization of aerosol composition that triggers freezing is necessary for example by assessing INP residuals (Knopf et al., 2018).
As can be seen in Fig. 9, the relative increase in sulfate fraction (average ± standard error for SGP from 0.11 ± 0.01 to 0.15 ± 0.02; for ENA from 0.34 ± 0.05 to 0.49 ± 0.02) counterbalances and virtually offsets the decrease in total organics at both sites for our study periods. The exact source of sulfate is unknown, and the aerosol source identification is beyond the scope of this measurement report, yet the air mass back trajectory during the high- and low-INP periods is discussed in Sect. 3.6. There may have been minor contributions of marine aerosols at SGP (as indicated by low but non-zero chloride concentrations measured with the ACSM), but the non-refractory organics present at SGP are more likely to be continental than marine, due to the long distance traveled by any marine aerosols that reach the site and the potential for mixing with transported continental organics during this transportation process. The chloride concentration at ENA was more than an order of magnitude higher, indicating a much stronger marine signal, while the organic concentration was only slightly lower. To reach the sampling site, air masses must spend several days or longer over continental regions, including passing over the Great Plains region, a known dust source. For this reason, dust and local soil dust are considered the major aerosol types reaching SGP based on both our back trajectories and previous studies (Knopf et al., 2021; DeMott et al., 2015).
3.6 Air mass trajectories, aerosol sources, and INP abundance
HYSPLIT back trajectory origins and air mass fractions over open water, land, and ice surfaces are shown in Table 2. Overall, both SGP and ENA showed > 93 % of trajectories originating from non-Arctic locations south of 66° N. The time fraction of air mass over land, especially North America, accounted for > 96 % in SGP. Contrarily, ENA showed > 96 % open water influence in air mass trajectories and notably more maritime air mass origin, especially the Atlantic Ocean.
Table 2Percentage of air masses originating from each location, as well as air mass time fractions over open water, land, or ice, determined from 96 h HYSPLIT back trajectories (back trajectories may be younger than 96 h if rainfall exceeded 7 mm). At each site, each column represents air mass properties for all trajectories, high-INP periods, and low-INP periods. Back trajectories were calculated at an inlet height for each 6 h sample period.
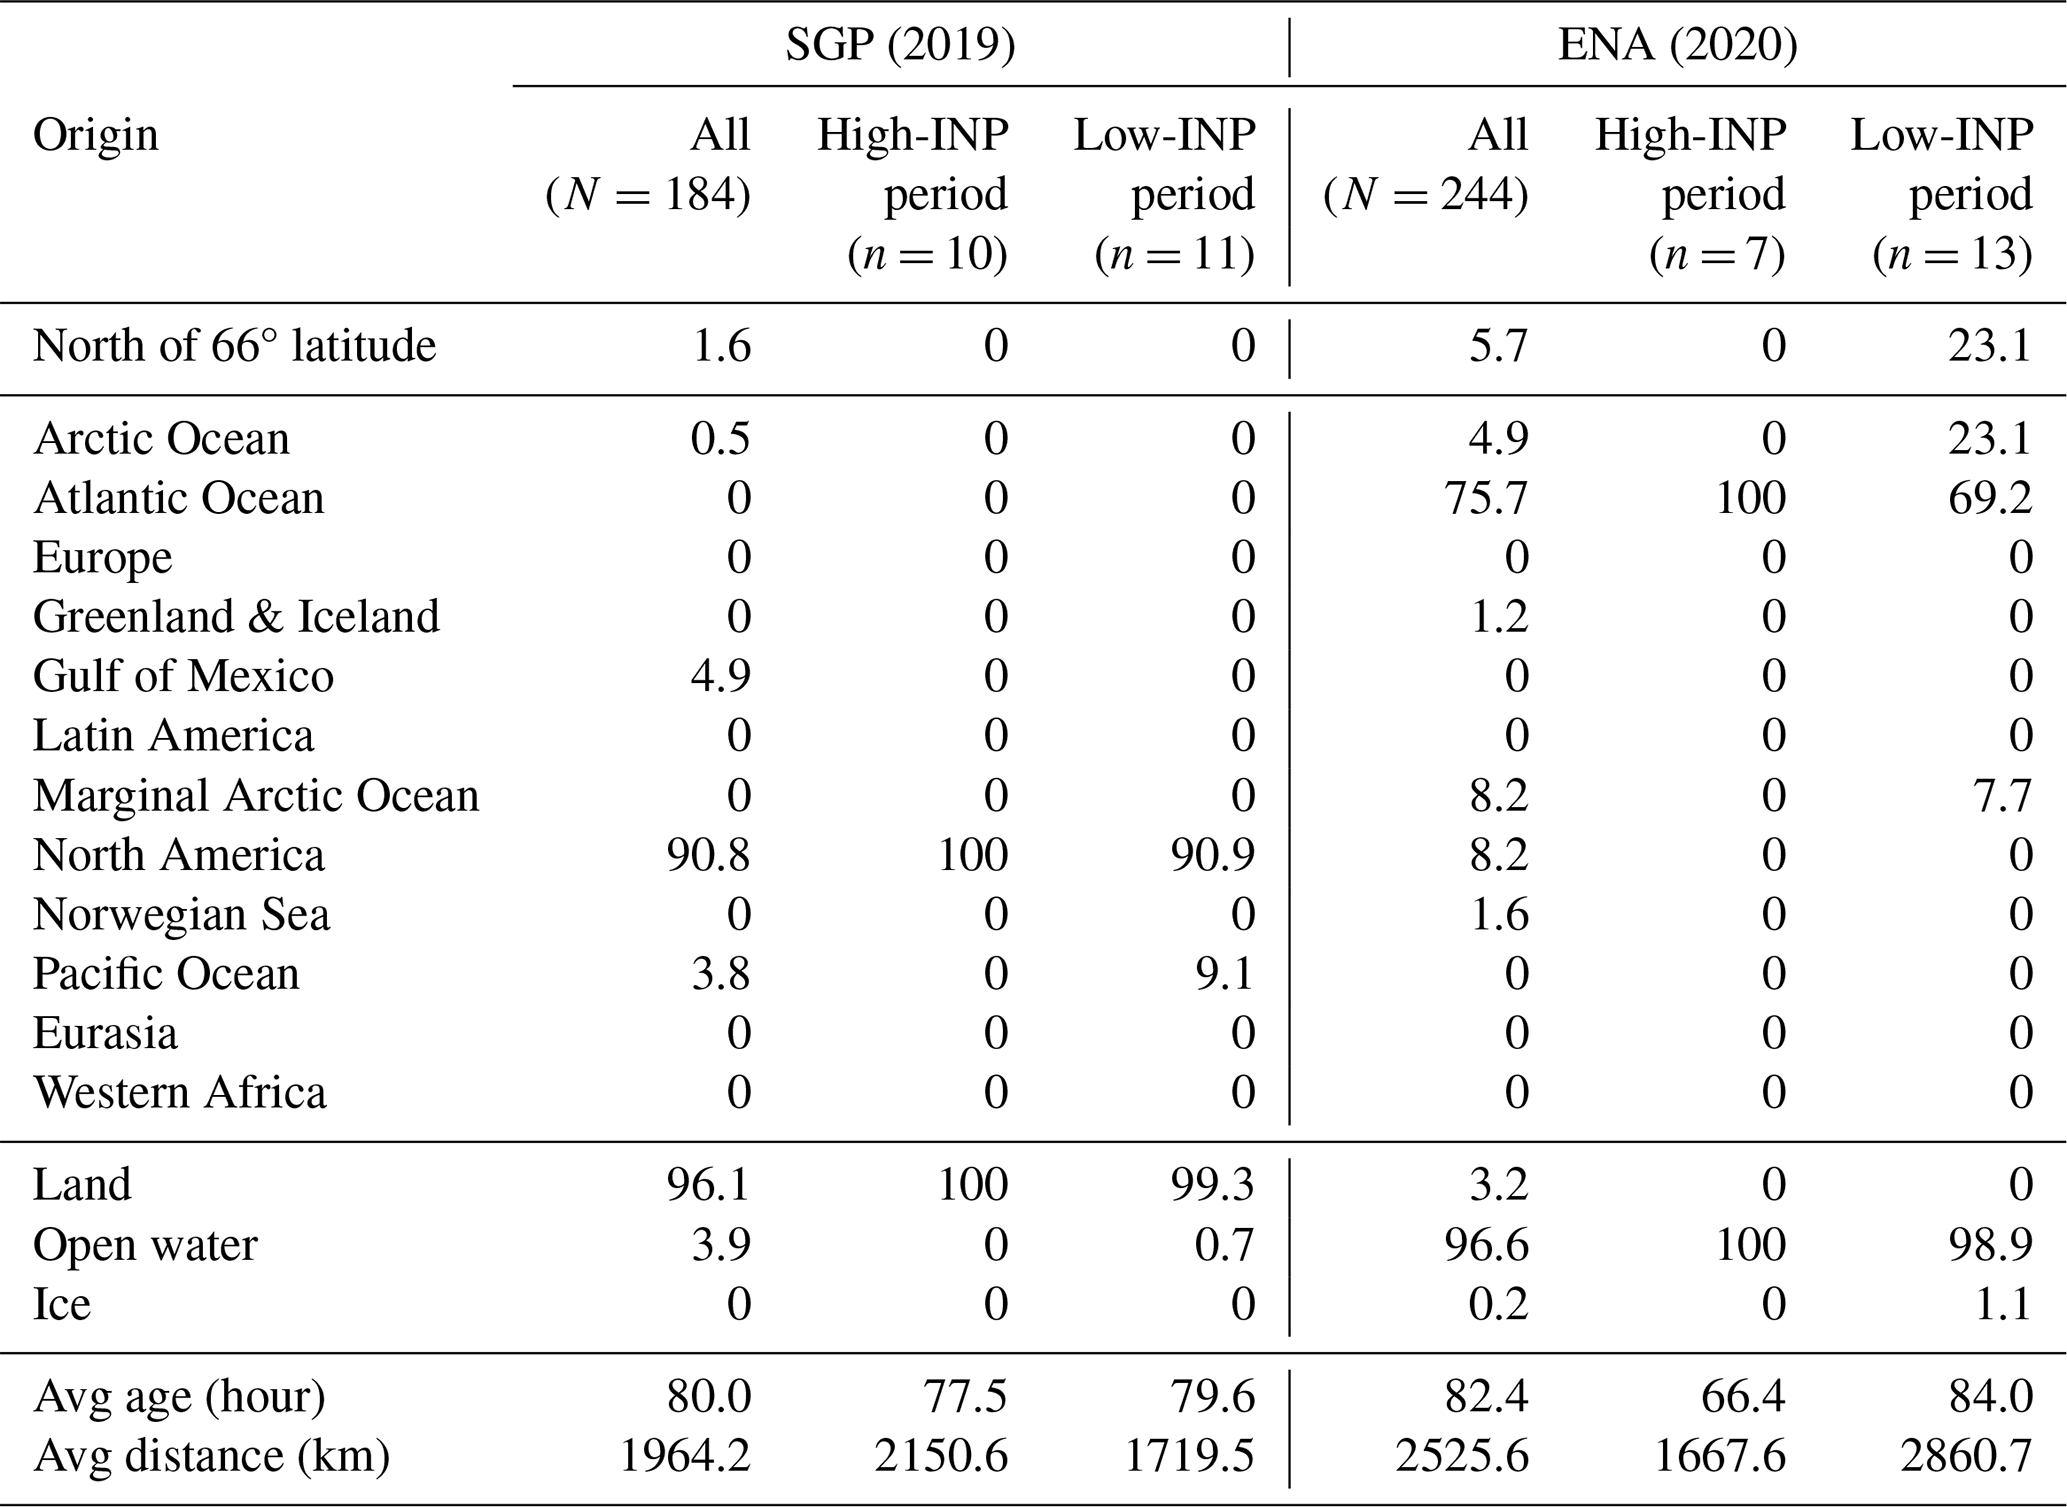
The approximate maximum age of the air mass can be determined from the rainfall amount along the backward trajectory (Gong et al., 2020b). For this study, the air mass age was calculated as assumed to be either 96 h prior to the trajectory starting time or 1 h prior to the sum of rainfall exceeding 7 mm. Using this method, the average air mass age (± standard error) at SGP at inlet height was 80.0 ± 1.9 h, while the average air mass age at ENA (also at inlet height) was slightly longer (82.4 ± 1.7 h). There is not a large difference between the air mass ages at the two sites, but an appreciable amount of rainfall along the air mass backward trajectories is found at both sites, implying the importance of considering wet deposition when determining air mass origins, as both sites would have measurably different and longer air mass trajectories if wet deposition were not considered.
At ENA, back trajectories at inlet height show and confirm the clear marine influence indicated by the high levels of chloride, with at least 75 % of trajectories originating from the Atlantic Ocean. The next most common source was North America (> 8 %). In contrast, no air masses from SGP originated in the Atlantic. A small contribution of maritime origin from the Pacific Ocean (3.8 %) and the Gulf of Mexico (4.9 %) was observed at SGP. However, it can be observed that air masses originating in the Pacific Ocean spent time over North America to reach SGP, so they cannot be considered solely marine, unlike air masses from the Atlantic Ocean at ENA, which spent their entire lifetime over marine conditions.

Figure 10Air mass origins and back trajectories at the inlet height from SGP (a–c) and ENA (d–f). The air mass trajectories during high- and low-INP episodes are shown in blue and pink colors.
Tables 1 and 2 also show the comparison between all back trajectories and the air mass trajectories during high- or low-INP episodes. As demonstrated in Sect. 3.5, the high-INP episodes were identified by extracting periods when the 6 h time-averaged IAF and ns values all exceed their medians at −20, −25, and −30 °C at each study site for our study periods (n = 10 for SGP and n = 7 for ENA). In contrast, the low-INP episodes are represented by the time when all the IAF and ns at the three temperature values fall less than their medians at SGP (n = 11) and ENA (n = 13). Back trajectories of air masses corresponding to these high- and low-INP times are displayed in Fig. 10. For ENA, similar trajectory figures, as well as tabular results, from high- and low-INP times specifically used for the ACSM analysis (Sect. 3.5) are reported in Sect. S14.
A summary of back trajectory analyses and plots is given in Fig. 10. For SGP, a total of 10 out of 184 trajectories are considered high-INP trajectories and displayed in Fig. 10b along with their dates and times in the legend. The terrestrial contribution originating from the central area of the North American continent is a notable source of high-INP trajectories at SGP. Figure 10c shows back trajectories of air mass approaching SGP during low-INP episodes. With the exception of one air mass originating in the Pacific Ocean, SGP does not exhibit any unique back trajectory patterns, yet the short air mass travel distance of 1719.5 ± 264.3 km during the low-INP episodes on average (± standard error) as compared to the high-INP episodes (2150.6 ± 207.6 km) can be explained by precipitation and associated wet scavenging.
At ENA, 13 air mass trajectories out of 244 trajectories are considered low-INP episodes (Table 1). As seen in Fig. 10f, at the ENA site, low-INP episodes coincide with air mass originating from the coastal region of the North American Atlantic and contribution of the north of 66° latitude region from the Arctic Ocean accounting for 23.1 % as compared to other trajectories. While the exact source of INPs from high latitudes is uncertain, previous studies suggest that open water and pack ice can be the source of aerosol particles in the Arctic (Beck et al., 2020; Baccarini et al., 2020; Park et al., 2020). Several previous studies also postulated the influence of transported biomass burning material from North America at the ENA site (Y. Wang et al., 2021; Zheng et al., 2020).
On the other hand, high-INP episodes at ENA (n = 7) show 100 % contributions of air masses from the Atlantic Ocean with a shorter average (± standard error) travel distance of 1667.6 ± 262.1 km as compared to the other case (2860.7 ± 293.1 km, Fig. 10f). As discussed in Sect. 3.2, maritime SSAs are less active as INPs as compared to terrestrial dust particles. Since our back trajectory pathways show the land contribution only before approaching the ENA site, a portion of the ENA aerosols and INPs may be from material transported from local terrestrial sources near ENA for local air masses, as indicated by back trajectories for our study period in 2020. While there are no direct long-term measurements of dust during ExINP-ENA, a high abundance of dust-containing particles at ENA has been reported in the previous study at ENA (Knopf et al., 2022).
We did not observe any unique wind properties (i.e., direction and wind speed) measured at each observatory corresponding to high- or low-INP episodes for our study period at both sites (Fig. 2c and f). The correlation between wind direction and nINP is low at SGP (ρ < 0.11 at p < 0.05) and ENA (ρ < 0.14 at p < 0.05). The observed wind speed also exhibits relatively low correlation to nINP at SGP (ρ < 0.33 at p < 0.05) and ENA (ρ < 0.15 at p < 0.05).
This study compares aerosol particles and INP measurements from two contrasting sites, SGP and ENA, which represent terrestrial and marine environments, respectively. While further investigation of physicochemical properties of INPs is necessary, our measurement observations suggest that both terrestrial and marine influences affect the abundance of INPs in air masses reaching SGP and ENA. The overall online nINP(T) at SGP was approximately 3 times higher than at ENA. Although naer and Saer at SGP were also larger than naer and Saer at ENA, the increased aerosol concentrations at SGP alone did not explain the higher nINP(T) at SGP as we found no reasonable correlation between near and nINP(T) ( < 0.23 at p < 0.05). On the other hand, the ice nucleation efficiencies (i.e., IAF and ns) estimated for the SGP case are substantially lower than those for the ENA case.
We observed that INP concentrations from ENA are not sensitive to the heat treatment, but the heat sensitivity is noticeable at high-temperature conditions for INP concentrations measured for the samples from SGP. No INPs were found at temperatures above −10 °C after the heat treatment whereas the immersion freezing was detected at −5 °C for one non-heated sample from SGP. Heat sensitivity is often attributed to organic and/or biogenic material, which can be from soil dust at SGP. In contrast, samples from ENA may contain a higher proportion (but not a higher number concentration) of non-heat labile particle type than samples from SGP, while they may still contain organic materials. In the future, the hydrogen peroxide treatment for aerosol particle samples for offline INP measurement, as well as the assessment of refractory organics, may be useful to understand the abundance of organic INPs (Perkins et al., 2020; Kulkarni et al., 2023).
Further, future studies could focus on assessing the long-term SGP–ENA measurement data and parameterizations offered in this report to guide immersion freezing schemes in models and examine an agreement (or disagreement) between measured and predicted INP abundance and properties within reasonable uncertainties (i.e., closure study, Knopf et al., 2021). Kulkarni et al. (2023) demonstrated the closure analysis of cloud condensation nuclei abundance and activation efficiency in relation to aerosol size distribution and chemical composition from SGP.
Exploring both the hygroscopicity from various ambient supersaturation conditions and INPs at various temperatures could reveal the nature of aerosol sampled at SGP and ENA sites. Such understanding could help to better constrain the aerosol properties within the atmospheric models. It is apparent that organic material (as seen in samples from SGP) is capable of acting as INPs, but the type of INPs at ENA must be better understood by increasing both spatiotemporal sampling resolution and physicochemical sampling of individual INPs. These broad goals open up the possibility for, and demonstrate the need for, partnership and collaboration between different research groups to understand this complex problem.
Original data created for the study are available in the Supplement and at https://doi.org/10.1594/PANGAEA.964038 (Wilbourn and Hiranuma, 2023). The revised dataset is available at https://doi.org/10.6084/m9.figshare.24199176 (Wilbourn et al., 2023b).
The supplement related to this article is available online at: https://doi.org/10.5194/acp-24-5433-2024-supplement.
NH designed the concept of this collaborative research. EKW led the writing of the manuscript with the support of all authors. The methodology was developed by OM, LL, KH, JN, and NH. The on-site and remote measurements at SGP were conducted by HSKV and NH. The ENA experiment was remotely conducted by EKW and NH, followed by the initial on-site setup led by LL. Offline INP measurements were supervised by KH and NH and contributed by CG, HSKV, and EKW. Initial formal data analyses were led by EKW, and the data analysis during the revision was led by AP.
The contact author has declared that none of the authors has any competing interests.
Publisher’s note: Copernicus Publications remains neutral with regard to jurisdictional claims made in the text, published maps, institutional affiliations, or any other geographical representation in this paper. While Copernicus Publications makes every effort to include appropriate place names, the final responsibility lies with the authors.
The authors gratefully acknowledge the NOAA Air Resources Laboratory (ARL) for the provision of the HYSPLIT transport and dispersion model and/or READY website (https://www.ready.noaa.gov, last access: 11 March 2024) used in this publication. The authors acknowledge Tercio Silva, Bruno Cunha, Carlos Sousa, Pawel Lech, Hannah Frances Ransom, John Archuleta, Heath Powers, and Karen Caporaletti for their on-site and administrative contributions to the ExINP-ENA campaign. Our half-a-year campaign at the ENA site could not have been completed without their support. The authors also acknowledge the contributions of the SGP on-site technical team (Chris Martin, Mark Smith, and Ken Teske) and administrative team (John Schatz, James Martin, George Sawyer, David Swank, Tim Grove, Rod Soper, Judy Brooke, and Michael T. Ritsche). Naruki Hiranuma and Elise K. Wilbourn thank Kimberly Sauceda for her contribution to the inlet loss measurement. The authors appreciate Gourihar Kulkarni, Romy Fösig, and Nicole Büttner for the useful discussion regarding the PINE-03 data processing.
This research has been supported by the US Department of Energy, Office of Science, Office of Biological and Environmental Research (grant no. DE-SC-0018979).
This paper was edited by Hinrich Grothe and reviewed by two anonymous referees.
Andreae, M. O. and Rosenfeld, D.: Aerosol-cloud-precipitation interactions. Part 1. The nature and sources of cloud-active aerosols, Earth-Sci. Rev,, 89, 13–41, https://doi.org/10.1016/j.earscirev.2008.03.001, 2008.
Baccarini, A., Karlsson, L., Dommen, Duplessis, P., Vüllers, J., Brooks, I. M., Saiz-Lopez, A., Salter, M., Tjernström, M., Baltensperger, U., Zieger, P., and Schmale, J.: Frequent new particle formation over the high Arctic pack ice by enhanced iodine emissions, Nat. Commun., 11, 4924, https://doi.org/10.1038/s41467-020-18551-0, 2020.
Beall, C. M., Lucero, D., Hill, T. C., DeMott, P. J., Stokes, M. D., and Prather, K. A.: Best practices for precipitation sample storage for offline studies of ice nucleation in marine and coastal environments, Atmos. Meas. Tech., 13, 6473–6486, https://doi.org/10.5194/amt-13-6473-2020, 2020.
Beck, L. J., Sarnela, N., Junninen, H., Hoppe, C. J. M., Garmash, O., Bianchi, F., Riva, M., Rose, C., Peräkylä, O., Wimmer, D., Kausiala, O., Jokinen, T., Ahonen, L., Mikkilä, J., Hakala, J., He, X.-C., Kontkanen, J., Wolf, K. K. E., Cappelletti, D., Mazzola, M., Traversi, R., Petroselli, C., Viola, A. P., Vitale, V., Lange, R., Massling, A., Nøjgaard, J. K., Krejci, R., Karlsson, L., Zieger, P., Jang, S., Lee, K., Vakkari, V., Lampilahti, J., Thakur, R. C., Leino, K., Kangasluoma, J., Duplissy, E.-M., Siivola, E., Marbouti, M., Tham, Y. J., Saiz-Lopez, A., Petäjä, T., Ehn, M., Worsnop, D. R., Skov, H., Kulmala, M., Kerminen, V.-M., and Sipilä, M.: Differing mechanisms of new particle formation at two Arctic sites, Geophys. Res. Lett., 48, e2020GL091334, https://doi.org/10.1029/2020GL091334, 2020.
Beddows, D. C. S., Dall'osto, M., and Harrison, R. M.: An enhanced procedure for the merging of atmospheric particle size distribution data measured using electrical mobility and time-of-flight analysers, Aerosol Sci. Tech., 44, 930–938, https://doi.org/10.1080/02786826.2010.502159, 2010.
Bond, T. C., Anderson, T. L., and Campbell, D.: Calibration and intercomparison of filter-based measurements of visible light absorption by aerosols, Aerosol Sci. Tech., 30, 582–600, https://doi.org/10.1080/027868299304435, 1999.
Bond, T. C., Doherty, S. J., Fahey, D. W., Forster, P. M., Berntsen, T., DeAngelo, B. J., Flanner, M. G., Ghan, S., Kärcher, B., Koch, D., Kinne, S., Kondo, Y., Quinn, P. K., Sarofim, M. C., Schultz, M. G., Schulz, M., Venkataraman, C., Zhang, H., Zhang, S., Bellouin, N., Guttikunda, S. K., Hopke, P. K., Jacobson, M. Z., Kaiser, J. W., Klimont, Z., Lohmann, U., Schwarz, J. P., Shindell, D., Storelvmo, T., Warren, S. G., and Zender, C. S.: Bounding the role of black carbon in the climate system: A scientific assessment, J. Geophys. Res.-Atmos., 118, 5380–5552, https://doi.org/10.1002/jgrd.50171, 2013.
Brooks, S. D. and Thornton, D. C. O.: Marine Aerosols and Clouds, Ann. Rev. Mar. Sci., 10, 289–313, https://doi.org/10.1146/annurev-marine-121916-063148, 2018.
Burrows, S. M., Hoose, C., Pöschl, U., and Lawrence, M. G.: Ice nuclei in marine air: biogenic particles or dust?, Atmos. Chem. Phys., 13, 245–267, https://doi.org/10.5194/acp-13-245-2013, 2013.
Burrows, S. M., McCluskey, C. S., Cornwell, G., Steinke, I., Zhang, K., Zhao, B., Zawadowicz, M., Raman, A., Kulkarni, G., and China, S.: Ice-nucleating particles that impact clouds and climate: observational and modeling research needs, Rev. Geophys., 60, e2021RG000745, https://doi.org/10.1029/2021RG000745, 2022.
Christiansen, S., Salter, M. E., Gorokhova, E., Nguyen, Q. T., and Bilde, M.: Sea spray aerosol formation: Laboratory results on the role of air entrainment, water temperature, and phytoplankton biomass, Environ. Sci. Technol., 53, 13107–13116, https://doi.org/10.1021/acs.est.9b04078, 2019.
Clarke, A. D., Freitag, S., Simpson, R. M. C., Hudson, J. G., Howell, S. G., Brekhovskikh, V. L., Campos, T., Kapustin, V. N., and Zhou, J.: Free troposphere as a major source of CCN for the equatorial pacific boundary layer: long-range transport and teleconnections, Atmos. Chem. Phys., 13, 7511–7529, https://doi.org/10.5194/acp-13-7511-2013, 2013.
Cochran, R. E., Ryder, O. S., Grassian, V. H., and Prather, K. A.: Sea spray aerosol: The chemical link between the oceans, atmosphere, and climate, Accounts Chem. Res., 50, 599–604, https://doi.org/10.1021/acs.accounts.6b00603, 2017.
Daily, M. I., Tarn, M. D., Whale, T. F., and Murray, B. J.: An evaluation of the heat test for the ice-nucleating ability of minerals and biological material, Atmos. Meas. Tech., 15, 2635–2665, https://doi.org/10.5194/amt-15-2635-2022, 2022.
David, R. O., Marcolli, C., Fahrni, J., Qiu, Y., Sirkin, Y. A. P., Molinero, V., Mahrt, F., Brühwiler, D., Lohmann, U., and Kanji, Z. A.: Pore condensation and freezing is responsible for ice formation below water saturation for porous particles, P. Natl. Acad. Sci. USA, 116, 8184–8189, https://doi.org/10.1073/pnas.1813647116, 2019.
DeMott, P. J., Prenni, A. J., Liu, X., Kreidenweis, S. M., Petters, M. D., Twohy, C. H., Richardson, M. S., Eidhammer, T., and Rogers, D. C.: Predicting global atmospheric ice nuclei distributions and their impacts on climate, P. Natl. Acad. Sci. USA, 107, 11217–11222, https://doi.org/10.1073/pnas.0910818107, 2010.
DeMott, P. J., Suski, K. J., Hill, T. C. J., and Levin, E. J. T.: Southern Great Plains Ice Nuclei Characterization Experiment Final Campaign Summary, DOE Office of Science Atmospheric Radiation Measurement (ARM) Program, Washington DC, USA, DOE/SC-ARM-15-012, https://www.arm.gov/publications/programdocs/doe-sc-arm-15-012.pdf (last access: 7 June 2023), 2015.
DeMott, P. J., Hill, T. C. J., McCluskey, C. S., Prather, K. A., Collins, D. B., Sullivan, R. C., Ruppel, M. J., Mason, R. H., Irish, V. E., Lee, T., Hwang, C. Y., Rhee, T. S., Snider, J. R., McMeeking, G. R., Dhaniyala, S., Lewis, E. R., Wentzell, J. J. B., Abbatt, J., Lee, C., Sultana, C. M., Ault, A. P., Axson, J. L., Diaz Martinez, M., Venero, I., Santos-Figueroa, G., Stokes, M. D., Deane, G. B., Mayol-Bracero, O. L., Grassian, V. H., Bertram, T. H., Bertram, A. K., Moffett, B. F., and Franc, G. D.: Sea spray aerosol as a unique source of ice nucleating particles, P. Natl. Acad. Sci. USA, 113, 5797–5803, https://doi.org/10.1073/pnas.1514034112, 2016.
DeMott, P. J., Mason, R. H., McCluskey, C. S., Hill, T. C. J., Perkins, R. J., Desyaterik, Y., Bertram, A. K., Trueblood, Jonathan V., Grassian, V. H., Qiu, Y., Molinero, V., Tobo, Y., Sultana, C. M., Lee, C., and Prather, K. A.: Ice nucleation by particles containing long-chain fatty acids of relevance to freezing by sea spray aerosols, Environ. Sci.-Proc. Imp., 20, 1559–1569, https://doi.org/10.1039/C8EM00386F, 2018.
Doherty, O., Riemer, N., and Hameed, S.: Saharan mineral dust transport into the Caribbean: Observed atmospheric controls and trends, J. Geophys. Res.-Atmos., 113, D07211, https://doi.org/10.1029/2007JD009171, 2008.
Durant, A. J. and Shaw, R. A.: Evaporation freezing by contact nucleation inside-out, Geophys. Res. Lett., 32, L20814, https://doi.org/10.1029/2005gl024175, 2005.
Fast, J. D., Berg, L. K., Alexander, L., Bell, D., D'Ambro, E., Hubbe, J., Kuang, C. A., Liu, J. M., Long, C., Matthews, A., Mei, F., Newsom, R., Pekour, M., Pinterich, T., Schmid, B., Schobesberger, S., Shilling, J., Smith, J. N., Springston, S., Suski, K., Thornton, J. A., Tomlinson, J., Wang, J., Xiao, H., and Zelenyuk, A.: Overview of the HI-SCALE field campaign: A new perspective on shallow convective clouds, B. Am. Meteorol. Soc., 100, 821–840, https://doi.org/10.1175/Bams-D-18-0030.1, 2019.
Field, P. R., Lawson, R. P., Brown, P. R., Lloyd, G., Westbrook, C., Moisseev, D., Miltenberger, A., Nenes, A., Blyth, A., and Choularton, T.: Secondary ice production: Current state of the science and recommendations for the future, Meteor. Mon., 58, 7.1–7.20, https://doi.org/10.1175/AMSMONOGRAPHS-D-16-0014.1, 2017.
Fornea, A. P., Brooks, S. D., Dooley, J. B., and Saha, A.: Heterogeneous freezing of ice on atmospheric aerosols containing ash, soot, and soil, J. Geophys. Res.-Atmos., 114, D13201, https://doi.org/10.1029/2009jd011958, 2009.
Forster, P., Storelvmo, T., Armour, K., Collins, W., Dufresne, J.-L., Frame, D., Lunt, D. J., Mauritsen, T., Palmer, M. D., Watanabe, M., Wild, M., and Zhang, H.: The Earth's Energy Budget, Climate Feedbacks, and Climate Sensitivity, in: Climate Change 2021: The Physical Science Basis. Contribution of Working Group I to the Sixth Assessment Report of the Intergovernmental Panel on Climate Change, edited by: Masson-Delmotte, V., Zhai, P., Pirani, A., Connors, S. L., Péan, C., Berger, S., Caud, N., Chen, Y., Goldfarb, L., Gomis, M. I., Huang, M., Leitzell, K., Lonnoy, E., Matthews, J. B. R., Maycock, T. K., Waterfield, T., Yelekçi, O., Yu, R., and Zhou, B., Cambridge University Press, Cambridge, United Kingdom and New York, NY, USA, 923–1054, https://doi.org/10.1017/9781009157896.009, 2021.
Fuentes, E., Coe, H., Green, D., de Leeuw, G., and McFiggans, G.: Laboratory-generated primary marine aerosol via bubble-bursting and atomization, Atmos. Meas. Tech., 3, 141–162, https://doi.org/10.5194/amt-3-141-2010, 2010.
Gallo, F., Uin, J., Springston, S., Wang, J., Zheng, G., Kuang, C., Wood, R., Azevedo, E. B., McComiskey, A., Mei, F., Theisen, A., Kyrouac, J., and Aiken, A. C.: Identifying a regional aerosol baseline in the eastern North Atlantic using collocated measurements and a mathematical algorithm to mask high-submicron-number-concentration aerosol events, Atmos. Chem. Phys., 20, 7553–7573, https://doi.org/10.5194/acp-20-7553-2020, 2020.
Ghate, V. P., Surleta, T., Magaritz-Ronen, L., Raveh-Rubin, S., Gallo, F., Carlton, A. G., and Azevedo, E. B.: Drivers of cloud condensation nuclei in the Eastern North Atlantic as observed at the ARM site, J. Geophys. Res.-Atmos., 128, e2023JD038636, https://doi.org/10.1029/2023JD038636, 2023.
Gong, X., Wex, H., Voigtländer, J., Fomba, K. W., Weinhold, K., van Pinxteren, M., Henning, S., Müller, T., Herrmann, H., and Stratmann, F.: Characterization of aerosol particles at Cabo Verde close to sea level and at the cloud level – Part 1: Particle number size distribution, cloud condensation nuclei and their origins, Atmos. Chem. Phys., 20, 1431–1449, https://doi.org/10.5194/acp-20-1431-2020, 2020a.
Gong, X., Wex, H., van Pinxteren, M., Triesch, N., Fomba, K. W., Lubitz, J., Stolle, C., Robinson, T.-B., Müller, T., Herrmann, H., and Stratmann, F.: Characterization of aerosol particles at Cabo Verde close to sea level and at the cloud level – Part 2: Ice-nucleating particles in air, cloud and seawater, Atmos. Chem. Phys., 20, 1451–1468, https://doi.org/10.5194/acp-20-1451-2020, 2020b.
Hande, L. B. and Hoose, C.: Partitioning the primary ice formation modes in large eddy simulations of mixed-phase clouds, Atmos. Chem. Phys., 17, 14105–14118, https://doi.org/10.5194/acp-17-14105-2017, 2017.
Hill, T. C. J., DeMott, P. J., Tobo, Y., Fröhlich-Nowoisky, J., Moffett, B. F., Franc, G. D., and Kreidenweis, S. M.: Sources of organic ice nucleating particles in soils, Atmos. Chem. Phys., 16, 7195–7211, https://doi.org/10.5194/acp-16-7195-2016, 2016.
Hiranuma, N., Augustin-Bauditz, S., Bingemer, H., Budke, C., Curtius, J., Danielczok, A., Diehl, K., Dreischmeier, K., Ebert, M., Frank, F., Hoffmann, N., Kandler, K., Kiselev, A., Koop, T., Leisner, T., Möhler, O., Nillius, B., Peckhaus, A., Rose, D., Weinbruch, S., Wex, H., Boose, Y., DeMott, P. J., Hader, J. D., Hill, T. C. J., Kanji, Z. A., Kulkarni, G., Levin, E. J. T., McCluskey, C. S., Murakami, M., Murray, B. J., Niedermeier, D., Petters, M. D., O'Sullivan, D., Saito, A., Schill, G. P., Tajiri, T., Tolbert, M. A., Welti, A., Whale, T. F., Wright, T. P., and Yamashita, K.: A comprehensive laboratory study on the immersion freezing behavior of illite NX particles: a comparison of 17 ice nucleation measurement techniques, Atmos. Chem. Phys., 15, 2489–2518, https://doi.org/10.5194/acp-15-2489-2015, 2015a.
Hiranuma, N., Möhler, O., Yamashita, K., Tajiri, T., Saito, A., Kiselev, A., Hoffmann, N., Hoose, C., Jantsch, E., Koop, T., and Murakami, M.: Ice nucleation by cellulose and its potential contribution to ice formation in clouds, Nat. Geosci., 8, 273–277, https://doi.org/10.1038/ngeo2374, 2015b.
Hiranuma, N., Adachi, K., Bell, D. M., Belosi, F., Beydoun, H., Bhaduri, B., Bingemer, H., Budke, C., Clemen, H.-C., Conen, F., Cory, K. M., Curtius, J., DeMott, P. J., Eppers, O., Grawe, S., Hartmann, S., Hoffmann, N., Höhler, K., Jantsch, E., Kiselev, A., Koop, T., Kulkarni, G., Mayer, A., Murakami, M., Murray, B. J., Nicosia, A., Petters, M. D., Piazza, M., Polen, M., Reicher, N., Rudich, Y., Saito, A., Santachiara, G., Schiebel, T., Schill, G. P., Schneider, J., Segev, L., Stopelli, E., Sullivan, R. C., Suski, K., Szakáll, M., Tajiri, T., Taylor, H., Tobo, Y., Ullrich, R., Weber, D., Wex, H., Whale, T. F., Whiteside, C. L., Yamashita, K., Zelenyuk, A., and Möhler, O.: A comprehensive characterization of ice nucleation by three different types of cellulose particles immersed in water, Atmos. Chem. Phys., 19, 4823–4849, https://doi.org/10.5194/acp-19-4823-2019, 2019.
Hiranuma, N., Auvermann, B. W., Belosi, F., Bush, J., Cory, K. M., Georgakopoulos, D. G., Höhler, K., Hou, Y., Lacher, L., Saathoff, H., Santachiara, G., Shen, X., Steinke, I., Ullrich, R., Umo, N. S., Vepuri, H. S. K., Vogel, F., and Möhler, O.: Laboratory and field studies of ice-nucleating particles from open-lot livestock facilities in Texas, Atmos. Chem. Phys., 21, 14215–14234, https://doi.org/10.5194/acp-21-14215-2021, 2021.
Hogg, S.: Essential microbiology, John Wiley & Sons, New York, NY, USA, 528 pp., ISBN 978-1-119-97890-9, 2013.
Hoose, C. and Möhler, O.: Heterogeneous ice nucleation on atmospheric aerosols: a review of results from laboratory experiments, Atmos. Chem. Phys., 12, 9817–9854, https://doi.org/10.5194/acp-12-9817-2012, 2012.
Jimenez, J. L., Canagaratna, M. R., Donahue, N. M., Prevot, A. S. H., Zhang, Q., Kroll, J. H., DeCarlo, P. F., Allan, J. D., Coe, H., Ng, N. L., Aiken, A. C., Docherty, K. S., Ulbrich, I. M., Grieshop, A. P., Robinson, A. L., Duplissy, J., Smith, J. D., Wilson, K. R., Lanz, V. A., Hueglin, C., Sun, Y. L., Tian, J., Laaksonen, A., Raatikainen, T., Rautiainen, J., Vaattovaara, P., Ehn, M., Kulmala, M., Tomlinson, J. M., Collins, D. R., Cubison, M. J., null, n., Dunlea, J., Huffman, J. A., Onasch, T. B., Alfarra, M. R., Williams, P. I., Bower, K., Kondo, Y., Schneider, J., Drewnick, F., Borrmann, S., Weimer, S., Demerjian, K., Salcedo, D., Cottrell, L., Griffin, R., Takami, A., Miyoshi, T., Hatakeyama, S., Shimono, A., Sun, J. Y., Zhang, Y. M., Dzepina, K., Kimmel, J. R., Sueper, D., Jayne, J. T., Herndon, S. C., Trimborn, A. M., Williams, L. R., Wood, E. C., Middlebrook, A. M., Kolb, C. E., Baltensperger, U., and Worsnop, D. R.: Evolution of organic aerosols in the atmosphere, Science, 326, 1525–1529, https://doi.org/10.1126/science.1180353, 2009.
Kanji, Z. A., Ladino, L. A., Wex, H., Boose, Y., Burkert-Kohn, M., Cziczo, D. J., and Krämer, M.: Overview of ice nucleating particles, Meteor. Mon., 58, 1.1–1.33, https://doi.org/10.1175/AMSMONOGRAPHS-D-16-0006.1, 2017.
Katoshevski, D., Nenes, A., and Seinfeld, J. H.: A study of processes that govern the maintenance of aerosols in the marine boundary layer, J. Aerosol Sci., 30, 503–532, https://doi.org/10.1016/S0021-8502(98)00740-X, 1999.
Knopf, D. A. and Alpert, P. A.: Atmospheric ice nucleation, Nat. Rev. Phys., 5, 203–217, https://doi.org/10.1038/s42254-023-00570-7, 2023.
Knopf, D. A., Alpert, P. A., and Wang, B.: The role of organic aerosol in atmospheric ice nucleation: A review, ACS Earth Space Chem., 2, 168–202, https://doi.org/10.1021/acsearthspacechem.7b00120, 2018.
Knopf, D. A., Barry, K. R., Brubaker, T. A., Jahl, L. G., Jankowski, K. A., Li, J., Lu, Y., Monroe, L. W., Moore, K. A., Rivera-Adorno, F. A., Sauceda, K. A., Shi, Y., Tomlin, J. M., Vepuri, H. S. K., Wang, P., Lata, N. N., Levin, E. J. T., Creamean, J. M., Hill, T. C. J., China, S., Alpert, P. A., Moffet, R. C., Hiranuma, N., Sullivan, R. C., Fridlind, A. M., West, M., Riemer, N., Laskin, A., DeMott, P. J., and Liu, X.: Aerosol-ice formation closure: A Southern Great Plains field campaign, B. Am. Meteorol. Soc., 102, E1952–E1971, https://doi.org/10.1175/Bams-D-20-0151.1, 2021.
Knopf, D. A., Charnawskas, J. C., Wang, P., Wong, B., Tomlin, J. M., Jankowski, K. A., Fraund, M., Veghte, D. P., China, S., Laskin, A., Moffet, R. C., Gilles, M. K., Aller, J. Y., Marcus, M. A., Raveh-Rubin, S., and Wang, J.: Micro-spectroscopic and freezing characterization of ice-nucleating particles collected in the marine boundary layer in the eastern North Atlantic, Atmos. Chem. Phys., 22, 5377–5398, https://doi.org/10.5194/acp-22-5377-2022, 2022.
Koop, T. and Murray, B. J.: A physically constrained classical description of the homogeneous nucleation of ice in water, J. Chem. Phys., 145, 211915, https://doi.org/10.1063/1.4962355, 2016.
Koop, T., Luo, B., Tsias, A., and Peter, T.: Water activity as the determinant for homogeneous ice nucleation in aqueous solutions, Nature, 406, 611–614, https://doi.org/10.1038/35020537, 2000.
Korolev, A. and Leisner, T.: Review of experimental studies of secondary ice production, Atmos. Chem. Phys., 20, 11767–11797, https://doi.org/10.5194/acp-20-11767-2020, 2020.
Kuang, C.: Condensation particle counter (CPC) instrument handbook, DOE Office of Science Atmospheric Radiation Measurement (ARM) Program, https://doi.org/10.2172/1245983, https://www.arm.gov/publications/tech_reports/handbooks/cpc_handbook.pdf, (last access: 7 June 2023), 2016.
Kulkarni, G., Mei, F., Shilling, J. E., Wang, J., Reveggino, R. P., Flynn, C., Zelenyuk, A., and Fast, J.: Cloud condensation nuclei closure study using airborne measurements over the Southern Great Plains, J. Geophys. Res.-Atmos., 128, e2022JD037964, https://doi.org/10.1029/2022JD037964, 2023.
Ladino Moreno, L. A., Stetzer, O., and Lohmann, U.: Contact freezing: a review of experimental studies, Atmos. Chem. Phys., 13, 9745–9769, https://doi.org/10.5194/acp-13-9745-2013, 2013.
Li, G., Wieder, J., Pasquier, J. T., Henneberger, J., and Kanji, Z. A.: Predicting atmospheric background number concentration of ice-nucleating particles in the Arctic, Atmos. Chem. Phys., 22, 14441–14454, https://doi.org/10.5194/acp-22-14441-2022, 2022.
Li, G., Wilbourn, E. K., Cheng, Z., Wieder, J., Fagerson, A., Henneberger, J., Motos, G., Traversi, R., Brooks, S. D., Mazzola, M., China, S., Nenes, A., Lohmann, U., Hiranuma, N., and Kanji, Z. A.: Physicochemical characterization and source apportionment of Arctic ice-nucleating particles observed in Ny-Ålesund in autumn 2019, Atmos. Chem. Phys., 23, 10489–10516, https://doi.org/10.5194/acp-23-10489-2023, 2023.
Liu, J., Alexander, L., Fast, J. D., Lindenmaier, R., and Shilling, J. E.: Aerosol characteristics at the Southern Great Plains site during the HI-SCALE campaign, Atmos. Chem. Phys., 21, 5101–5116, https://doi.org/10.5194/acp-21-5101-2021, 2021.
Logan, T., Xi, B., and Dong, X.: Aerosol properties and their influences on marine boundary layer cloud condensation nuclei at the ARM mobile facility over the Azores, J. Geophys. Res.-Atmos., 119, 4859–4872, https://doi.org/10.1002/2013JD021288, 2014.
Logan, T., Dong, X. Q., and Xi, B. K.: Aerosol properties and their impacts on surface CCN at the ARM Southern Great Plains site during the 2011 Midlatitude Continental Convective Clouds Experiment, Adv. Atmos. Sci., 35, 224–233, https://doi.org/10.1007/s00376-017-7033-2, 2018.
Mächel, H., Kapala, A., and Flohn, H.: Behaviour of the centres of action above the Atlantic since 1881. Part I: Characteristics of seasonal and interannual variability, Int. J. Climatol., 18, 1–22, https://doi.org/10.1002/(SICI)1097-0088(199801)18:1<1::AID-JOC225>3.0.CO;2-A, 1998.
Marcolli, C.: Deposition nucleation viewed as homogeneous or immersion freezing in pores and cavities, Atmos. Chem. Phys., 14, 2071–2104, https://doi.org/10.5194/acp-14-2071-2014, 2014.
McCluskey, C. S., Ovadnevaite, J., Rinaldi, M., Atkinson, J., Belosi, F., Ceburnis, D., Marullo, S., Hill, T. C. J., Lohmann, U., Kanji, Z. A., O'Dowd, C., Kreidenweis, S. M., and DeMott, P. J.: Marine and Terrestrial Organic Ice-Nucleating Particles in Pristine Marine to Continentally Influenced Northeast Atlantic Air Masses, J. Geophys. Res., 123, 6196–6212, https://doi.org/10.1029/2017JD028033, 2018.
Möhler, O., Adams, M., Lacher, L., Vogel, F., Nadolny, J., Ullrich, R., Boffo, C., Pfeuffer, T., Hobl, A., Weiß, M., Vepuri, H. S. K., Hiranuma, N., and Murray, B. J.: The Portable Ice Nucleation Experiment (PINE): a new online instrument for laboratory studies and automated long-term field observations of ice-nucleating particles, Atmos. Meas. Tech., 14, 1143–1166, https://doi.org/10.5194/amt-14-1143-2021, 2021.
Moore, K. A., Alexander, S. P., Humphries, R. S., Jensen, J., Protat, A., Reeves, J. M., Sanchez, K. J., Kreidenweis, S. M., and DeMott, P. J.: Estimation of sea spray aerosol surface area over the Southern Ocean using scattering measurements, J. Geophys. Res.-Atmos., 127, e2022JD037009, https://doi.org/10.1029/2022JD037009, 2022.
Murray, B. J., Carslaw, K. S., and Field, P. R.: Opinion: Cloud-phase climate feedback and the importance of ice-nucleating particles, Atmos. Chem. Phys., 21, 665–679, https://doi.org/10.5194/acp-21-665-2021, 2021.
Natural Earth: Natural Earth data in GeoJSON, GitHub [code], https://github.com/martynafford/natural-earth-geojson (last access: 11 March 2024), 2024.
O'Dowd, C. D. and Smith, M. H.: Physicochemical properties of aerosols over the northeast Atlantic: Evidence for wind-speed-related submicron sea-salt aerosol production, J. Geophys. Res.-Atmos., 98, 1137–1149, https://doi.org/10.1029/92JD02302, 1993.
Ogren, J. A.: Comment on “Calibration and intercomparison of filter-based measurements of visible light absorption by aerosols”, Aerosol Sci. Tech., 44, 589–591, https://doi.org/10.1080/02786826.2010.482111, 2010.
Ovadnevaite, J., Ceburnis, D., Canagaratna, M., Berresheim, H., Bialek, J., Martucci, G., Worsnop, D. R., and O'Dowd, C.: On the effect of wind speed on submicron sea salt mass concentrations and source fluxes, J. Geophys. Res.-Atmos., 117, D16201, https://doi.org/10.1029/2011JD017379, 2012.
Park, J., Dall'Osto, M., Park, K., Gim, Y., Kang, H. J., Jang, E., Park, K.-T., Park, M., Yum, S. S., Jung, J., Lee, B. Y., and Yoon, Y. J.: Shipborne observations reveal contrasting Arctic marine, Arctic terrestrial and Pacific marine aerosol properties, Atmos. Chem. Phys., 20, 5573–5590, https://doi.org/10.5194/acp-20-5573-2020, 2020.
Parworth, C., Fast, J., Mei, F., Shippert, T., Sivaraman, C., Tilp, A., Watson, T., and Zhang, Q.: Long-term measurements of submicrometer aerosol chemistry at the Southern Great Plains (SGP) using an Aerosol Chemical Speciation Monitor (ACSM), Atmos. Environ., 106, 43–55, https://doi.org/10.1016/j.atmosenv.2015.01.060, 2015.
Perkins, R. J., Gillette, S. M., Hill, T. C. J., and DeMott, P. J.: The labile nature of ice nucleation by Arizona Test Dust, ACS Earth. Space. Chem., 4, 133–141, https://doi.org/10.1021/acsearthspacechem.9b00304, 2020.
Rémillard, J. and Tselioudis, G.: Cloud regime variability over the Azores and its application to climate model evaluation, J. Climate, 28, 9707–9720, https://doi.org/10.1175/JCLI-D-15-0066.1, 2015.
Rinaldi, M., Hiranuma, N., Santachiara, G., Mazzola, M., Mansour, K., Paglione, M., Rodriguez, C. A., Traversi, R., Becagli, S., Cappelletti, D., and Belosi, F.: Ice-nucleating particle concentration measurements from Ny-Ålesund during the Arctic spring–summer in 2018, Atmos. Chem. Phys., 21, 14725–14748, https://doi.org/10.5194/acp-21-14725-2021, 2021.
Rolph, G., Stein, A., and Stunder, B.: Real-time Environmental Applications and Display sYstem: READY, Environ. Model. Softw., 95, 210–228, https://doi.org/10.1016/j.envsoft.2017.06.025, 2017.
Russell, L. M., Pandis, S. N., and Seinfeld, J. H.: Aerosol production and growth in the marine boundary layer, J. Geophys. Res.-Atmos., 99, 20989–21003, https://doi.org/10.1029/94JD01932, 1994.
Sanchez, K. J., Zhang, B., Liu, H., Saliba, G., Chen, C.-L., Lewis, S. L., Russell, L. M., Shook, M. A., Crosbie, E. C., Ziemba, L. D., Brown, M. D., Shingler, T. J., Robinson, C. E., Wiggins, E. B., Thornhill, K. L., Winstead, E. L., Jordan, C., Quinn, P. K., Bates, T. S., Porter, J., Bell, T. G., Saltzman, E. S., Behrenfeld, M. J., and Moore, R. H.: Linking marine phytoplankton emissions, meteorological processes, and downwind particle properties with FLEXPART, Atmos. Chem. Phys., 21, 831–851, https://doi.org/10.5194/acp-21-831-2021, 2021.
Schiebel, T.: Ice nucleation activity of soil dust aerosols, PhD Dissertation, KIT-Bibliothek, Karlsruhe, Germany, 131 pp., https://doi.org/10.5445/IR/1000076327, 2017.
Schneider, J., Höhler, K., Heikkilä, P., Keskinen, J., Bertozzi, B., Bogert, P., Schorr, T., Umo, N. S., Vogel, F., Brasseur, Z., Wu, Y., Hakala, S., Duplissy, J., Moisseev, D., Kulmala, M., Adams, M. P., Murray, B. J., Korhonen, K., Hao, L., Thomson, E. S., Castarède, D., Leisner, T., Petäjä, T., and Möhler, O.: The seasonal cycle of ice-nucleating particles linked to the abundance of biogenic aerosol in boreal forests, Atmos. Chem. Phys., 21, 3899–3918, https://doi.org/10.5194/acp-21-3899-2021, 2021.
Sisterson, D., Peppler, R., Cress, T., Lamb, P., and Turner, D.: The ARM southern great plains (SGP) site, Meteor. Mon., 57, 6.1–6.14, https://doi.org/10.1175/AMSMONOGRAPHS-D-16-0004.1, 2016.
Springston, S.: Particle soot absorption photometer (PSAP) instrument handbook, DOE Office of Science Atmospheric Radiation Measurement (ARM) Program, Washington DC, USA, DOE/SC-ARM-TR-176, https://www.arm.gov/publications/tech_reports/handbooks/psap_handbook.pdf (last access: 7 June 2023), 2018.
Stein, A. F., Draxler, R. R., Rolph, G. D., Stunder, B. J. B., Cohen, M. D., and Ngan, F.: Noaa's Hysplit atmospheric transport and dispersion modeling system, B. Am. Meteorol. Soc., 96, 2059–2077, https://doi.org/10.1175/Bams-D-14-00110.1, 2015.
Stokes, G. M. and Schwartz, S. E.: The Atmospheric Radiation Measurement (ARM) Program: Programmatic Background and Design of the Cloud and Radiation Test Bed, B. Am. Meteorol. Soc., 75, 1201–1222, https://doi.org/10.1175/1520-0477(1994)075<1201:Tarmpp>2.0.Co;2, 1994.
Sullivan, S. C., Hoose, C., Kiselev, A., Leisner, T., and Nenes, A.: Initiation of secondary ice production in clouds, Atmos. Chem. Phys., 18, 1593–1610, https://doi.org/10.5194/acp-18-1593-2018, 2018.
Ullrich, R., Hoose, C., Möhler, O., Niemand, M., Wagner, R., Höhler, K., Hiranuma, N., Saathoff, H., and Leisner, T.: A New Ice Nucleation Active Site Parameterization for Desert Dust and Soot, J. Atmos. Sci., 74, 699–717, https://doi.org/10.1175/JAS-D-16-0074.1, 2017.
Vepuri, H. S. K., Rodriguez, C. A., Georgakopoulos, D. G., Hume, D., Webb, J., Mayer, G. D., and Hiranuma, N.: Ice-nucleating particles in precipitation samples from the Texas Panhandle, Atmos. Chem. Phys., 21, 4503–4520, https://doi.org/10.5194/acp-21-4503-2021, 2021.
Vergara-Temprado, J., Murray, B. J., Wilson, T. W., O'Sullivan, D., Browse, J., Pringle, K. J., Ardon-Dryer, K., Bertram, A. K., Burrows, S. M., Ceburnis, D., DeMott, P. J., Mason, R. H., O'Dowd, C. D., Rinaldi, M., and Carslaw, K. S.: Contribution of feldspar and marine organic aerosols to global ice nucleating particle concentrations, Atmos. Chem. Phys., 17, 3637–3658, https://doi.org/10.5194/acp-17-3637-2017, 2017.
Véron, A. J. and Church, T. M.: Use of stable lead isotopes and trace metals to characterize air mass sources into the eastern North Atlantic, J. Geophys. Res.-Atmos., 102, 28049–28058, https://doi.org/10.1029/97JD01527, 1997.
Wang, J., Collins, D., Covert, D., Elleman, R., Ferrare, R. A., Gasparini, R., Jonsson, H., Ogren, J., Sheridan, P., and Tsay, S. C.: Temporal variation of aerosol properties at a rural continental site and study of aerosol evolution through growth law analysis, J. Geophys. Res.-Atmos., 111, D18203, https://doi.org/10.1029/2005jd006704, 2006.
Wang, J., Wood, R., Jensen, M. P., Chiu, J. C., Liu, Y., Lamer, K., Desai, N., Giangrande, S. E., Knopf, D. A., Kollias, P., Laskin, A., Liu, X., Lu, C., Mechem, D., Mei, F., Starzec, M., Tomlinson, J., Wang, Y., Yum, S. S., Zheng, G., Aiken, A. C., Azevedo, E. B., Blanchard, Y., China, S., Dong, X., Gallo, F., Gao, S., Ghate, V. P., Glienke, S., Goldberger, L., Hardin, J. C., Kuang, C., Luke, E. P., Matthews, A. A., Miller, M. A., Moffet, R., Pekour, M., Schmid, B., Sedlacek, A. J., Shaw, R. A., Shilling, J. E., Sullivan, A., Suski, K., Veghte, D. P., Weber, R., Wyant, M., Yeom, J., Zawadowicz, M., and Zhang, Z.: Aerosol and Cloud Experiments in the Eastern North Atlantic (ACE-ENA), B. Am. Meteorol. Soc., 21, 1–51, https://doi.org/10.1175/bams-d-19-0220.1, 2021.
Wang, X., Deane, G. B., Moore, K. A., Ryder, O. S., Stokes, M. D., Beall, C. M., Collins, D. B., Santander, M. V., Burrows, S. M., Sultana, C. M., and Prather, K. A.: The role of jet and film drops in controlling the mixing state of submicron sea spray aerosol particles, P. Natl. Acad. Sci. USA, 114, 6978–6983, https://doi.org/10.1073/pnas.1702420114, 2017.
Wang, Y., Zheng, X., Dong, X., Xi, B., Wu, P., Logan, T., and Yung, Y. L.: Impacts of long-range transport of aerosols on marine-boundary-layer clouds in the eastern North Atlantic, Atmos. Chem. Phys., 20, 14741–14755, https://doi.org/10.5194/acp-20-14741-2020, 2020.
Wang, Y., Zheng, G., Jensen, M. P., Knopf, D. A., Laskin, A., Matthews, A. A., Mechem, D., Mei, F., Moffet, R., Sedlacek, A. J., Shilling, J. E., Springston, S., Sullivan, A., Tomlinson, J., Veghte, D., Weber, R., Wood, R., Zawadowicz, M. A., and Wang, J.: Vertical profiles of trace gas and aerosol properties over the eastern North Atlantic: variations with season and synoptic condition, Atmos. Chem. Phys., 21, 11079–11098, https://doi.org/10.5194/acp-21-11079-2021, 2021.
Watson, T. B.: Aerosol chemical speciation monitor (ACSM) instrument handbook, DOE Office of Science Atmospheric Radiation Measurement (ARM) Program, Washington DC, USA, DOE/SC-ARM-TR-196, https://www.arm.gov/publications/tech_reports/handbooks/acsm_handbook.pdf (last access: 7 June 2023), 2017.
Westbrook, C. D. and Illingworth, A. J.: Evidence that ice forms primarily in supercooled liquid clouds at temperatures > −27 °C, Geophys. Res. Lett., 38, L14808, https://doi.org/10.1029/2011gl048021, 2011.
Wilbourn, E. and Hiranuma, N.: Abundance of ice-nucleating particles and cloud condensation nuclei measured at the Sothern Great Plains and Eastern North Atlantic observatories in autumn 2019 and 2020, PANGAEA [data set], https://doi.org/10.1594/PANGAEA.964038, 2023.
Wilbourn, E. K., Alrimaly, S., Williams, H., Hurst, J., McGovern, G. P., Anderson, T. A., and Hiranuma, N.: Integrated science teaching in atmospheric ice nucleation research: Immersion freezing experiments, J. Chem. Educ., 100, 1511–1522, https://doi.org/10.1021/acs.jchemed.2c01060, 2023a.
Wilbourn, E. K., Pantoya, A., and Hiranuma, N.: Abundance of ground-level ice-nucleating particle abundance and aerosol properties during autumn at contrasting marine and terrestrial locations, figshare [data set], https://doi.org/10.6084/m9.figshare.24199176, 2023b.
Wilson, T. W., Ladino, L. A., Alpert, P. A., Breckels, M. N., Brooks, I. M., Browse, J., Burrows, S. M., Carslaw, K. S., Huffman, J. A., Judd, C., Kilthau, W. P., Mason, R. H., McFiggans, G., Miller, L. A., Najera, J. J., Polishchuk, E., Rae, S., Schiller, C. L., Si, M., Temprado, J. V., Whale, T. F., Wong, J. P., Wurl, O., Yakobi-Hancock, J. D., Abbatt, J. P., Aller, J. Y., Bertram, A. K., Knopf, D. A., and Murray, B. J.: A marine biogenic source of atmospheric ice-nucleating particles, Nature, 525, 234–238, https://doi.org/10.1038/nature14986, 2015.
Wood, R., Wyant, M., Bretherton, C. S., Remillard, J., Kollias, P., Fletcher, J., Stemmler, J., de Szoeke, S., Yuter, S., Miller, M., Mechem, D., Tselioudis, G., Chiu, J. C., Mann, J. A. L., O'Connor, E. J., Hogan, R. J., Dong, X. Q., Miller, M., Ghate, V., Jefferson, A., Min, Q. L., Minnis, P., Palikonda, R., Albrecht, B., Luke, E., Hannay, C., and Lin, Y. L.: Clouds, aerosols, and precipitation in the marine boundary layer: An ARM mobile facility deployment, B. Am. Meteorol. Soc., 96, 419–439, https://doi.org/10.1175/Bams-D-13-00180.1, 2015.
Wood, R., Stemmler, J. D., Remillard, J., and Jefferson, A.: Low-CCN concentration air masses over the eastern North Atlantic: Seasonality, meteorology, and drivers, J. Geophys. Res.-Atmos., 122, 1203–1223, https://doi.org/10.1002/2016jd025557, 2017.
Zawadowicz, M. A., Suski, K., Liu, J., Pekour, M., Fast, J., Mei, F., Sedlacek, A. J., Springston, S., Wang, Y., Zaveri, R. A., Wood, R., Wang, J., and Shilling, J. E.: Aircraft measurements of aerosol and trace gas chemistry in the eastern North Atlantic, Atmos. Chem. Phys., 21, 7983–8002, https://doi.org/10.5194/acp-21-7983-2021, 2021.
Zheng, G., Wang, Y., Aiken, A. C., Gallo, F., Jensen, M. P., Kollias, P., Kuang, C., Luke, E., Springston, S., Uin, J., Wood, R., and Wang, J.: Marine boundary layer aerosol in the eastern North Atlantic: seasonal variations and key controlling processes, Atmos. Chem. Phys., 18, 17615–17635, https://doi.org/10.5194/acp-18-17615-2018, 2018.
Zheng, G., Sedlacek, A. J., Aiken, A. C., Feng, Y., Watson, T. B., Raveh-Rubin, S., Uin, J., Lewis, E. R., and Wang, J.: Long-range transported North American wildfire aerosols observed in marine boundary layer of eastern North Atlantic, Environ. Int., 139, 105680, https://doi.org/10.1016/j.envint.2020.105680, 2020.
Zheng, X., Xi, B., Dong, X., Wu, P., Logan, T., and Wang, Y.: Environmental effects on aerosol–cloud interaction in non-precipitating marine boundary layer (MBL) clouds over the eastern North Atlantic, Atmos. Chem. Phys., 22, 335–354, https://doi.org/10.5194/acp-22-335-2022, 2022.