the Creative Commons Attribution 4.0 License.
the Creative Commons Attribution 4.0 License.
 | 07 May 2024
Response patterns of moss to atmospheric nitrogen deposition and nitrogen saturation in an urban–agro–forest transition
Ouping Deng
Yuanyuan Chen
Jingze Zhao
Xi Li
Wei Zhou
Ting Lan
Dinghua Ou
Yanyan Zhang
Jiang Liu
Yueqiang He
Hanqing Yang
Rong Huang
Increasing trends of atmospheric nitrogen (N) deposition resulting from a large number of anthropogenic emissions of reactive N are dramatically altering the global biogeochemical cycle of N. Nitrogen uptake by mosses occurs mainly from the atmosphere, making it a competent bio-indicator of N deposition. However, high uncertainties exist when using mosses to indicate N deposition, especially in choosing sampling periods and sampling frequencies. In this study, atmospheric N deposition and moss N content in the urban–agro–forest transition, a region with a high N deposition level of 27.46–43.70 kg N hm−2 yr−1, were monitored, and the method for monitoring atmospheric N deposition by mosses was optimized. We found that the optimal sampling frequency is within 6 months per time, and the optimal sampling times are winter (January and February), autumn (October and November), and summer (July and August), which provides us with a more accurate estimation of atmospheric N deposition than other scenarios. In addition, the moss N content serves as a more reliable N species. This study eventually allowed mosses to be used more effectively and sensibly as an indicator of atmospheric N deposition and helped to improve the accuracy of the model for quantifying N deposition.
- Article
(3084 KB) - Full-text XML
-
Supplement
(476 KB) - BibTeX
- EndNote


Anthropogenic perturbations have dramatically influenced the nitrogen (N) cycle on the earth's surface (Vitousek et al., 1997; Galloway et al., 2008). Several pathways of anthropogenic N input into the earth's surface, including deposition, manure, fertilizer, and so on (Gu et al., 2015). Atmospheric transport, deposition, and circulation facilitate the conveyance of excess N to nearby or distant terrestrial and aquatic habitats (Erisman et al., 2007; Schlesinger, 2009). Atmospheric N deposition is an important component of the human-accelerated global N cycle and a serious form of atmospheric pollution (Xu et al., 2019), resulting in adverse ecological effects, such as water eutrophication, soil acidification, and biodiversity loss, which have been reported due to excess N deposition in some areas (Clark and Tilman, 2008; Elser et al., 2009; Storkey et al., 2015; Duan et al., 2016). Atmospheric N deposition has increased by 3- to 5-fold over the 20th century (IPCC, 2013). Global N deposition was estimated at 119 Tg N in 2010 (land, 60 %; seas, 40 %) (Liu et al., 2022). Therefore, it is vital to quantify atmospheric N deposition effectively to provide valuable strategies for N emission mitigation.
Unlike vascular plants, mosses are known to lack a well-developed root system, vascular system, and protective cuticle, allowing them to take up water and nutrients primarily from the atmosphere through their surfaces (Glime, 2007; Keyte et al., 2009; Salemaa et al., 2020). Hence, mosses have been shown to be suitable indicators of atmospheric deposition, for example, nitrogen (Pitcairn et al., 2006; Zechmeister et al., 2008; Harmens et al., 2014; Meyer et al., 2015) and heavy metals (Schröder and Pesch, 2010; Harmens et al., 2011). However, several uncertainties remain regarding the use of mosses as a bio-indicator to predict N deposition. First, the sampling frequency (i.e. weeks to years) varied widely among different studies, which largely increased the uncertainty of mosses in predicting N deposition. The sampling frequency option will be based on the duration of the N deposition that accumulated in the mosses. It is generally accepted that mosses can preserve the N deposited from the atmosphere for more than 1 year, while some studies have also shown that the preservation period of N by mosses is limited by land use types and moss species, making it possible to maintain N for only a few weeks or months (Schröder et al., 2011; Pavlíková et al., 2016). Second, the relationship between moss N content and N deposition usually varies under different study area conditions. This means that the existing models for N deposition prediction, if used in this study area, may lead to significant uncertainties (Dong et al., 2017; Wilson et al., 2009). Third, various forms of N from deposition cause distinct responses in mosses. In some N fertilization experiments, mosses were found to prefer ammonium (NH–N) and dissolved organic N (DON) over nitrate (NO–N) as N sources (Forsum et al., 2006); meanwhile, the natural abundance of N isotopes was used to determine that moss NO–N assimilation was substantially inhibited by the high supply of NH–N and DON (Liu et al., 2013b), underscoring the dominance of and preference for atmospheric NH–N in moss N utilization. Finally, according to current knowledge, N saturation is defined as the level of pollution below which there are no significant harmful environmental effects (UBA, 2005). N saturation is widely used to evaluate the impacts of N deposition on ecosystems regarding excess nutrient N availability, also known as eutrophication (Burpee and Saros, 2020; Gao et al., 2014). The absorption of N deposition by mosses is limited because N deposition modulates mosses to take up N by altering their physiological indicators (Liu et al., 2017; Shi et al., 2017). Nitrate reductase is an essential physiological indicator of the N assimilation process of mosses, and it has been reported that an increase in N deposition leads to a decrease in nitrate reductase, inhibiting the N uptake and utilization efficiency of mosses (Arróniz-Crespo et al., 2008; Pearce et al., 2003). Therefore, N saturation plays a significant role in limiting the response of mosses to N deposition. Above all, it is desirable to improve the moss method for monitoring atmospheric N deposition from multiple perspectives, especially by improving sampling parameters. In summary, two questions require resolution to enhance the utilization of mosses as bio-indicators for predicting N deposition: (i) determining the optimal sampling period (i.e. sampling frequency and sampling duration) for moss sampling and (ii) characterizing moss responses and mechanisms to various N deposition forms.
Previous studies have mainly focused on ecosystems with low N deposition, such as forests and grasslands. The urban–agro–forest transition regions include agricultural, urban, rural, and forest areas, which are commonly formed in the process of urbanization and are deeply influenced by human beings. The patterns and sources of N deposition are more complex here than in natural ecosystems. However, the methods for monitoring moss N deposition are limited here, and sufficient knowledge is still needed under such high N deposition conditions. Considering the aforementioned limitations, this study conducted a year-long field experiment to monitor atmospheric N deposition in an urban–agro–forest transition in southwest China. The primary objective of this study was to establish a protocol by using mosses as a bio-indicator for the prediction of N deposition. Three aspects were included: (i) assessing moss responses to atmospheric N deposition, considering variations in sampling frequency and season; (ii) evaluating the N saturation state of mosses in regions with high N deposition; and (iii) analysing moss responses and mechanisms to different N species.
2.1 Study sites
The field experiment was performed from April 2018 to September 2019 in an urban–agro–forest transition zone situated in the southwestern Chengdu Plain (Fig. 1). Moss collection started in October 2018. The climate is subtropical monsoon humid, with a mean annual temperature, relative humidity, and precipitation of 15.7 °C, 85 %, and 1103 mm, respectively. The study encompassed five distinct sites strategically chosen within the urban–agro–forest transition. These sites represented the four primary land-use types, namely, agricultural area (Qiquan, QQ), urban area (Chongyang, CY), rural areas (Yuantong, YT, and Huaiyuan, HY), and forest area (Jiguan Mountain, JGM) (Fig. 1). More details about the study sites are shown in Table S1 in the Supplement.
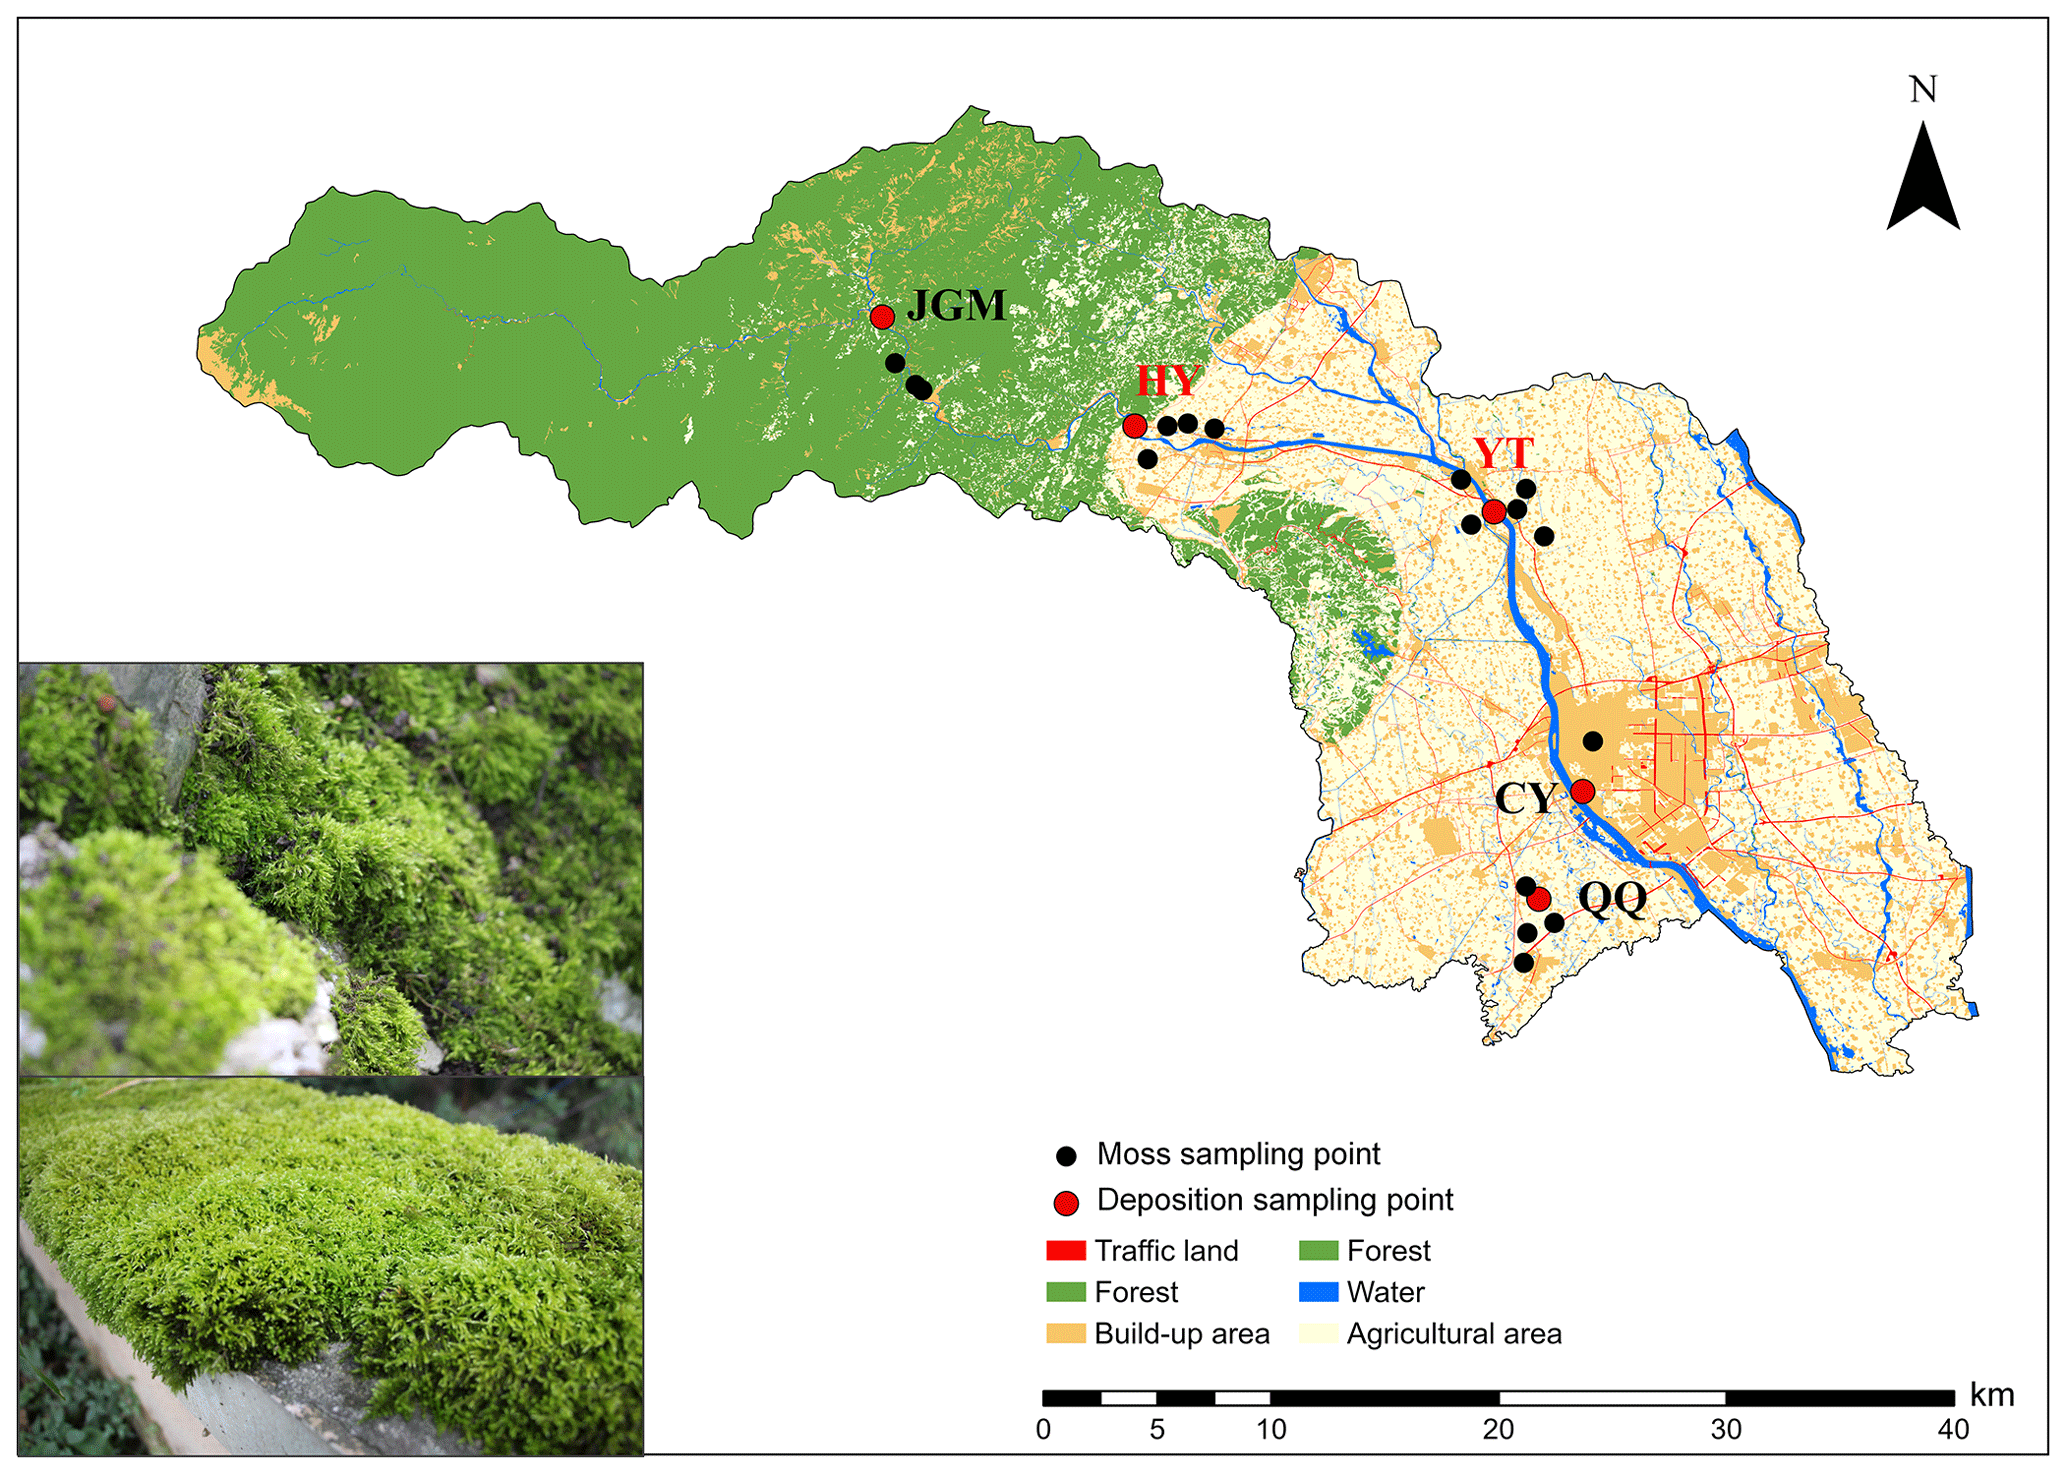
Figure 1Locations of the sampling sites. QQ, Qiquan, agricultural area; CY, Chongyang, urban area; YT, Yuantong, rural area; HY, Huaiyuan, rural area; JGM, Jiguan Mountain, forest area. The sites in red represent N emission hotspots. A field photo of the moss collection is shown in the lower-left corner, illustrating the moss species and sampling substrate. The land-use data (2016) used here were provided by the Center of Land Acquisition and Consolidation in Sichuan Province.
2.2 Deposition sampling, analysis, and calculation
Atmospheric bulk deposition samplers were used to collect N bulk deposition at five sites, with three parallel samplers at each location to ensure three replicate data. Deposition samplers were precleaned glass cylinders (inner diameter times height of 10.5 cm × 14.5 cm) and were installed at a height of 1.2 m above the ground with no obstacles or tall buildings around each site to prevent contamination from surface soil and plants. A stainless-steel net (pore size 0.02×0.02 m2) was used to avoid disturbance of birds and crop stubble contamination. Ultrapure water was added to each collector, and the depth was maintained at approximately 10 cm (Wang et al., 2013). During the summer, 1 mL of 2 mol L−1 copper sulfate solution was added to the collectors to prevent the growth of bacteria and algae. Deposition sampling was conducted at 1-month intervals. The samples were transferred to preclean glass bottles and transported to the laboratory to determine the concentrations of different forms of N deposition, including dissolved organic nitrogen (DON) and inorganic N (NH–N and NO–N) concentrations, within the same day. NH–N and NO–N were measured in the filtered samples (using 0.45 µm filter membranes) using an ultraviolet spectrophotometer (UV-1100, Meipuda, China). Unfiltered samples were collected for total N (TN) measurement through the alkaline potassium peroxydisulfate oxidation method (APOM). Dissolved organic N (DON) was then calculated using TN subtracted from the sum of inorganic N (i.e. NH–N and NO–N). It should be noted that some insoluble N compounds may overestimate the DON content in this study.
An estimate of bulk deposition in the sampling fluid could be obtained by multiplying the concentrations by the precipitation amounts as follows:
where Fw is the flux of N types in monthly deposition, kg N hm−2 per month; Ci is the concentration of N types in monthly collected samples, mg N L−1; Pi is the monthly precipitation amount, mm; and i represents each month. The precipitation data used in this study are from the Chongzhou Meteorological Bureau, Sichuan Province, China.
2.3 Moss sampling and analysis
The moss materials (Haplocladium microphyllum (Hedw.) Broth. subsp. capillatum (Mitt.) Reim.) at all study sites were sampled. This species was chosen based on its greater presence under different growing conditions in this study area, which made the study possible. Moss sampling and preparation were conducted according to guidelines in the ICP vegetation guidelines (ICP Vegetation, 2010), and temporal and spatial synchronization was maintained with deposition sampling. Moss samples were collected every month, which was consistent with collecting N deposition. In this study, two to five subsample sites were selected for moss collection within 1 km of the N deposition sampling site (Fig. 1). Within a 50 m range (a square of 50×50 m), 5 to 10 samples were collected to combine into a representative one for each subsample site. Each subsample was of similar weight and distributed homogenously and as separated as possible within the area, avoiding the collection of concentrated mops within the areas.
All mosses were collected from natural rocks without canopies or overhanging vegetation to avoid the effect of throughfall N compounds. The sampling sites are more than 300 m away from the main roads and at least 100 m away from other roads or houses, free of the direct impact of stagnant water and surface water splashes, traffic, and other artificial pollution sources (human and animal excrement, fertilization, and stamping). The moss samples, which were stored in polythene zip-lock bags, had dead branches, leaves, and debris removed in the laboratory before separating green and brownish parts for analysis, with only the green part undergoing analysis and the brownish part being discarded (Harmens et al., 2014). After the mosses were dried to constant weight in a forced-air oven (at 40 °C for 48 h), they were ground to a powder for the moss N content, which was measured by the “Kjeldahl” method after H2SO4–H2O2 digestion.
2.4 Correlation between moss N content and atmospheric N deposition
The correlation between the moss total N content and various forms of atmospheric N deposition under different accumulation timescales (1, 3, 6, 9, and 12 months) was analysed. This approach enabled the study to discern the appropriate sampling frequency for continuous monitoring of N deposition, revealing that the moss N content in a given month was sensitive to the cumulative N deposition in the preceding months. For example, to analyse the correlation between the moss N content in October 2018 and N deposition under the sampling frequency of 3 months, the value of moss N content should be given as a value in October 2018, while the N deposition should be the sum of August, September, and October 2018.
Furthermore, correlations between the moss N content and various species of N deposition were analysed in each sampling month, which could obtain the optimal sampling time for moss response to atmospheric N deposition. Note that the timescale of the moss N content was from October 2018 to September 2019, while the N deposition collection period was more than 1 year, from April 2018 to September 2019, which could enhance the optimality of the sampling frequency for this study.
2.5 Response model of moss N content to deposition of different N species
Linear and logarithmic regression analyses of the moss N content were fitted to various forms of atmospheric N deposition in SPSS® (version 25.0). Notably, the analysis was carried out at a sampling frequency of 1 month. The moss N content was the dependent variable, and the monthly atmospheric N deposition was the independent variable. The R2 values derived from the observations were instrumental in evaluating the model's optimal fit to the data, thereby aiding in the selection of the most suitable regression approach.
2.6 Statistical analyses and quality assurance and control (QA/QC)
Pearson correlation analysis with a two-tailed significance test was used to examine the relationship between moss N content and bulk N deposition, including different sampling times and frequencies. All studies were conducted using SPSS® 25.0 (SPSS Inc., Chicago, USA).
Utmost care was taken to avoid any contamination during the sampling and analytical programme. For the quality assurance (QA) of the moss N content measurements, three replicates of each sample were analysed to provide a stable determination process. Additionally, quality control (QC) was ensured by using certified reference material and laboratory standards for N determination. Additionally, for the determination of the elemental concentrations in the reference material, laboratories followed the same analytical procedure as that used for the collected samples. The certified reference materials used in the experiment all conformed to national standards. The standard solutions of NH–N, NO–N, and TN complied with GSB 04-2832-2011, GSB 04-1772-2004, and GSB 04-2837-2011 (b). These certified reference materials were stored and utilized correctly.
3.1 Monthly variation in N deposition and moss N content
The range of total N (TN) deposition fluxes in this study was 1.00–6.44 kg N hm−2 per month during the monitoring period from October 2018 to September 2019, which was significantly higher in summer than in other seasons (Fig. S1a in the Supplement; P<0.05). NH–N was the predominant form of N deposition, ranging from 0.20–3.89 kg N hm−2 per month, followed by NO–N (0.13–2.33 kg N hm−2 per month) and DON (0.00–1.46 kg N hm−2 per month). In addition, the different N forms displayed distinct patterns of seasonal variation (Fig. S1). Notably, NH–N, NO–N, and DON attained their peak values during the summer and spring seasons.
Mosses in the study area had N contents of 1.51 %–2.96 %. Notably, the monthly fluctuations in moss samples from the five designated moss sampling sites were notably similar. The curve depicting the monthly average variation in moss N contents showed characteristics characterized by a single valley value along with several peaks (Fig. 2a–e). The lowest values were commonly observed in the range of January to March. The lowest value was in February (JGM, 1.51 %), while the highest was in August (YT, 2.96 %). Additionally, the averages of atmospheric N deposition and moss N content across the five sites are shown in Fig. 2f, providing an overview of the temporal variations in the study area. It was found that the variation in the N content in moss highly matched the monthly fluctuation patterns of N deposition (all N species) in the study area.
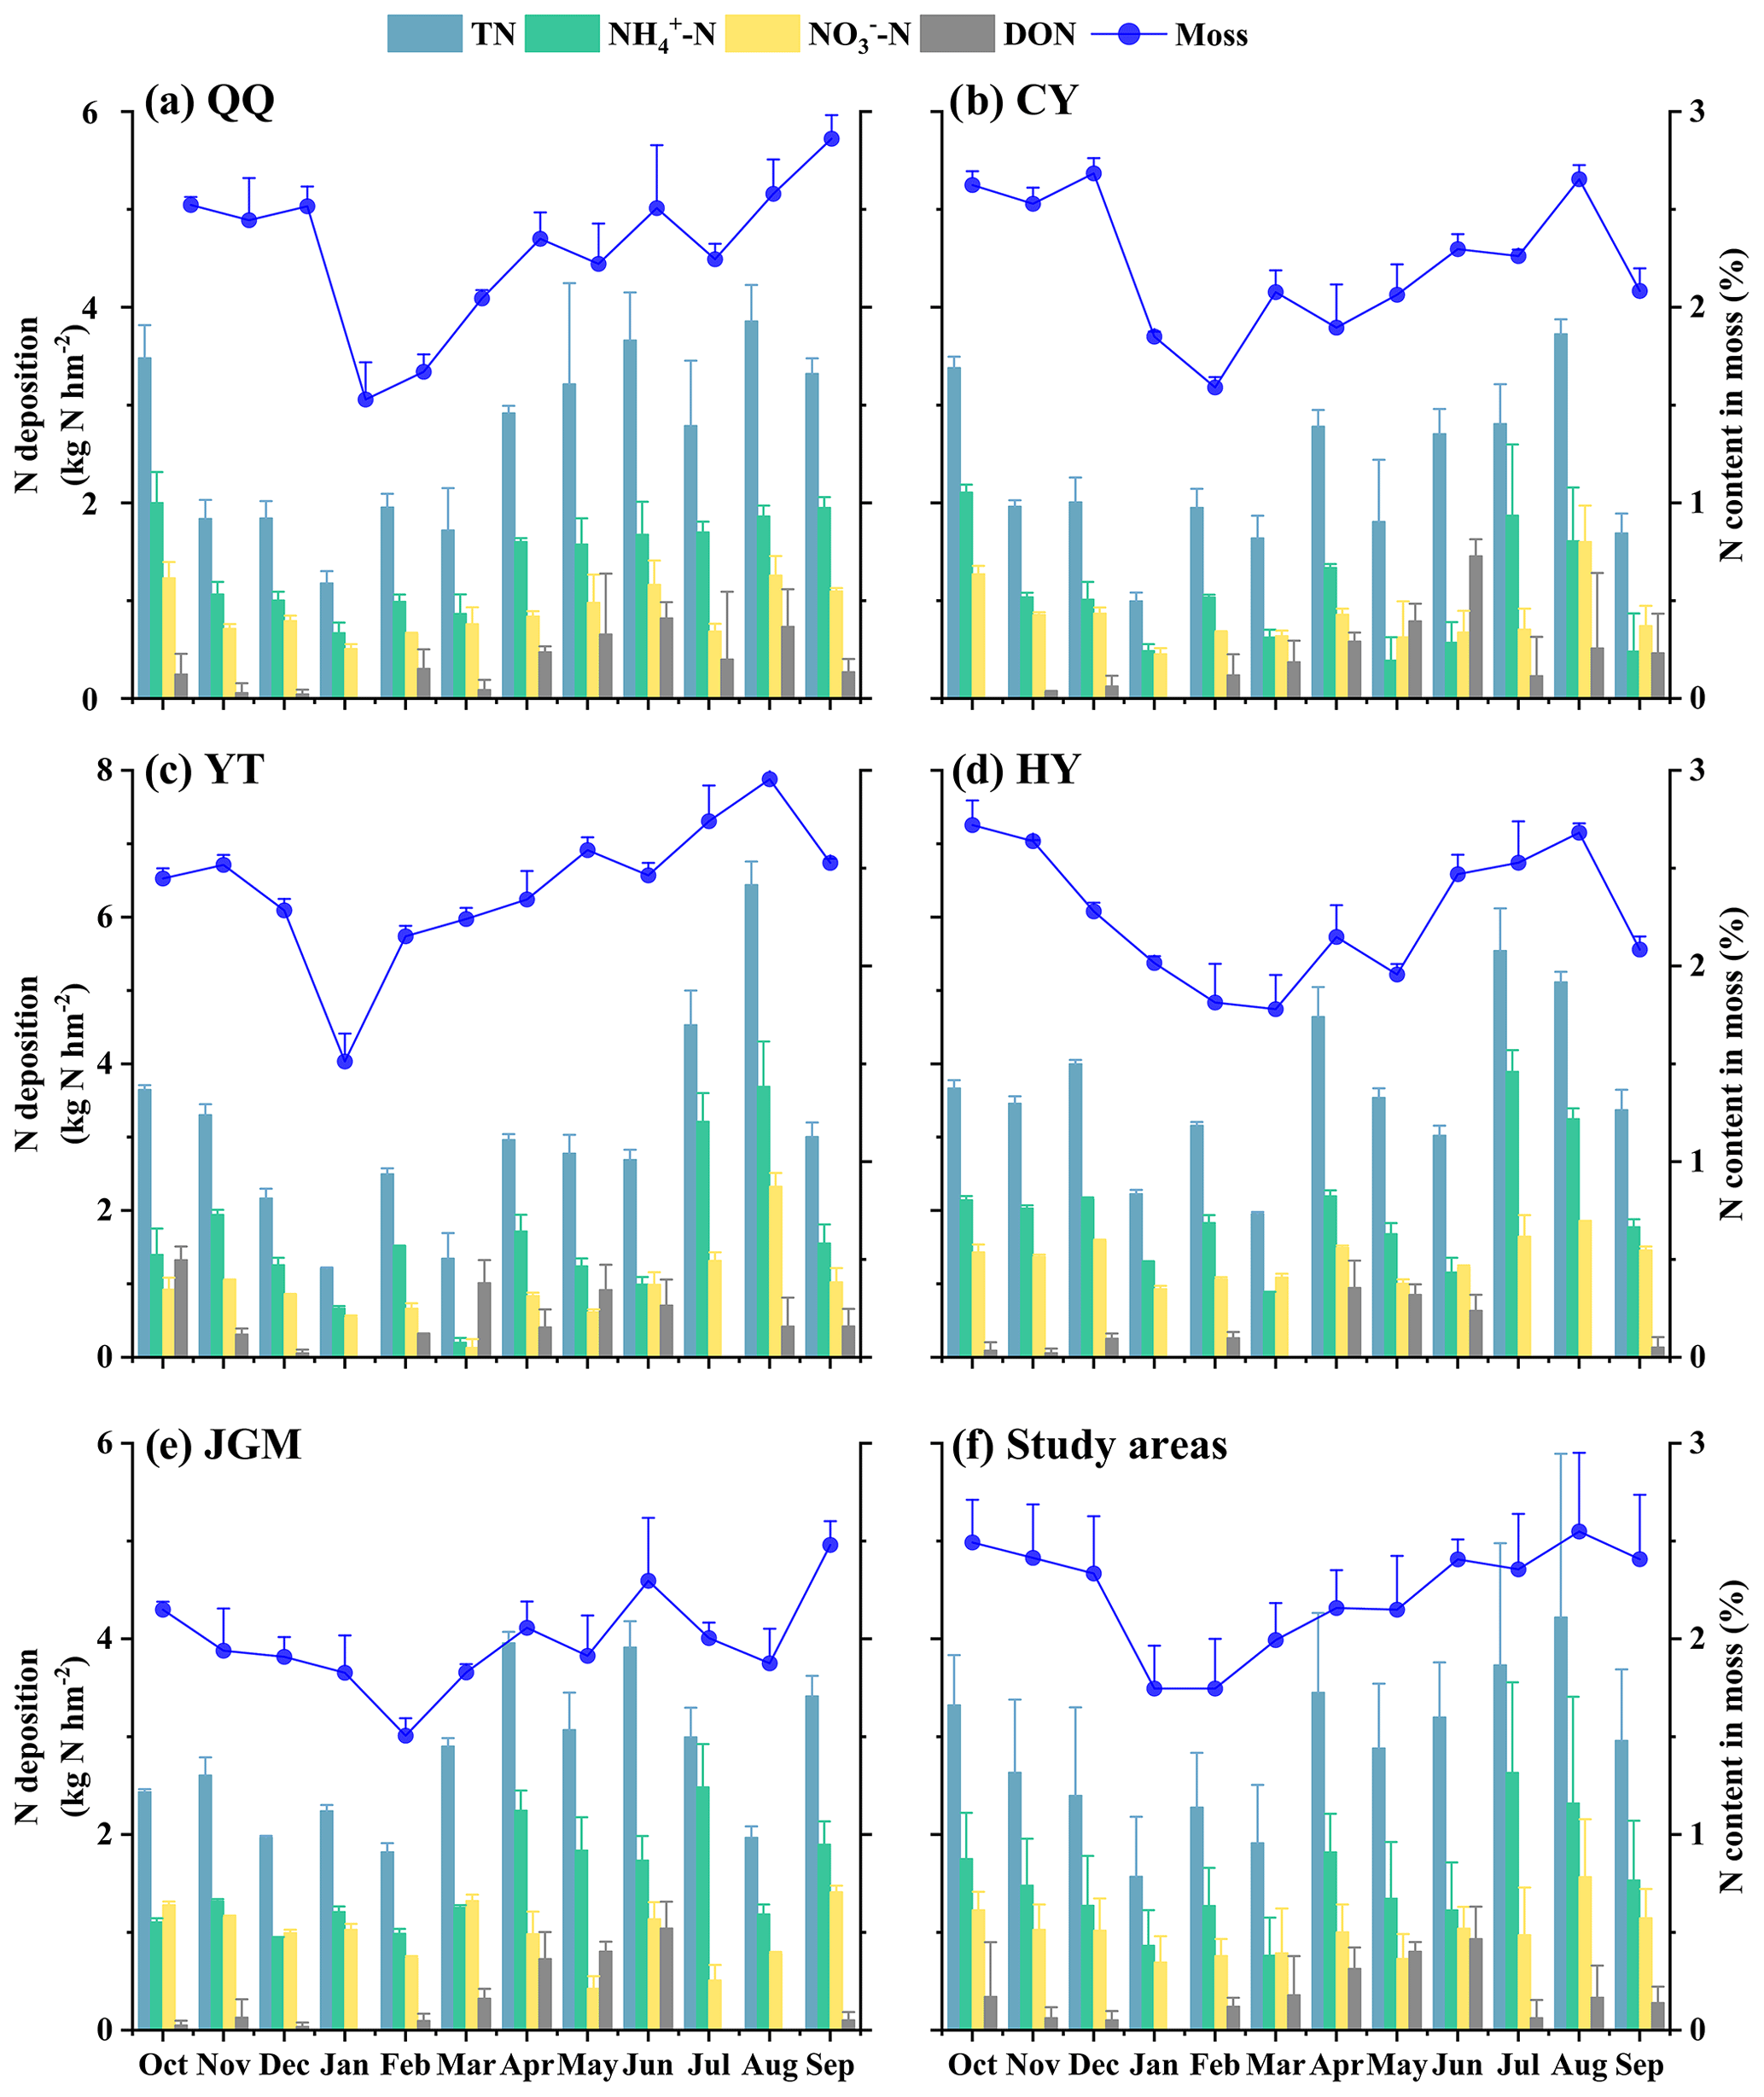
Figure 2Temporal variations in atmospheric N deposition and moss N content at different sites. This figure depicts a year-long (October 2018–September 2019) overview of N deposition dynamics and moss responses at QQ (a), CY (b), YT (c), HY (d), JGM (e), and study areas (f), with columns showing deposition data on the left axis and moss N content variations shown as a line on the right axis. Error bars represent the standard deviations of three replicates.
3.2 Correlations between moss N content and N deposition
Different N species (TN, NH–N, NO–N, and DON) were used to analyse the correlation between N deposition and moss N content (Table 1). The results showed that when the sampling frequency of mosses was within 6 months (i.e. every 1, 3, and 6 months), significantly positive correlations (P<0.05) between N species in deposition and the N content of moss were observed. However, at a sampling frequency of 1 year (i.e. 12 months), the moss N content and NO–N deposition were found to be negatively correlated (, P<0.05).
Table 1Correlation coefficients between the moss N content in the current month and N deposition accumulation in the study area under different sampling frequencies (from 1 month per time to 1 year per time).
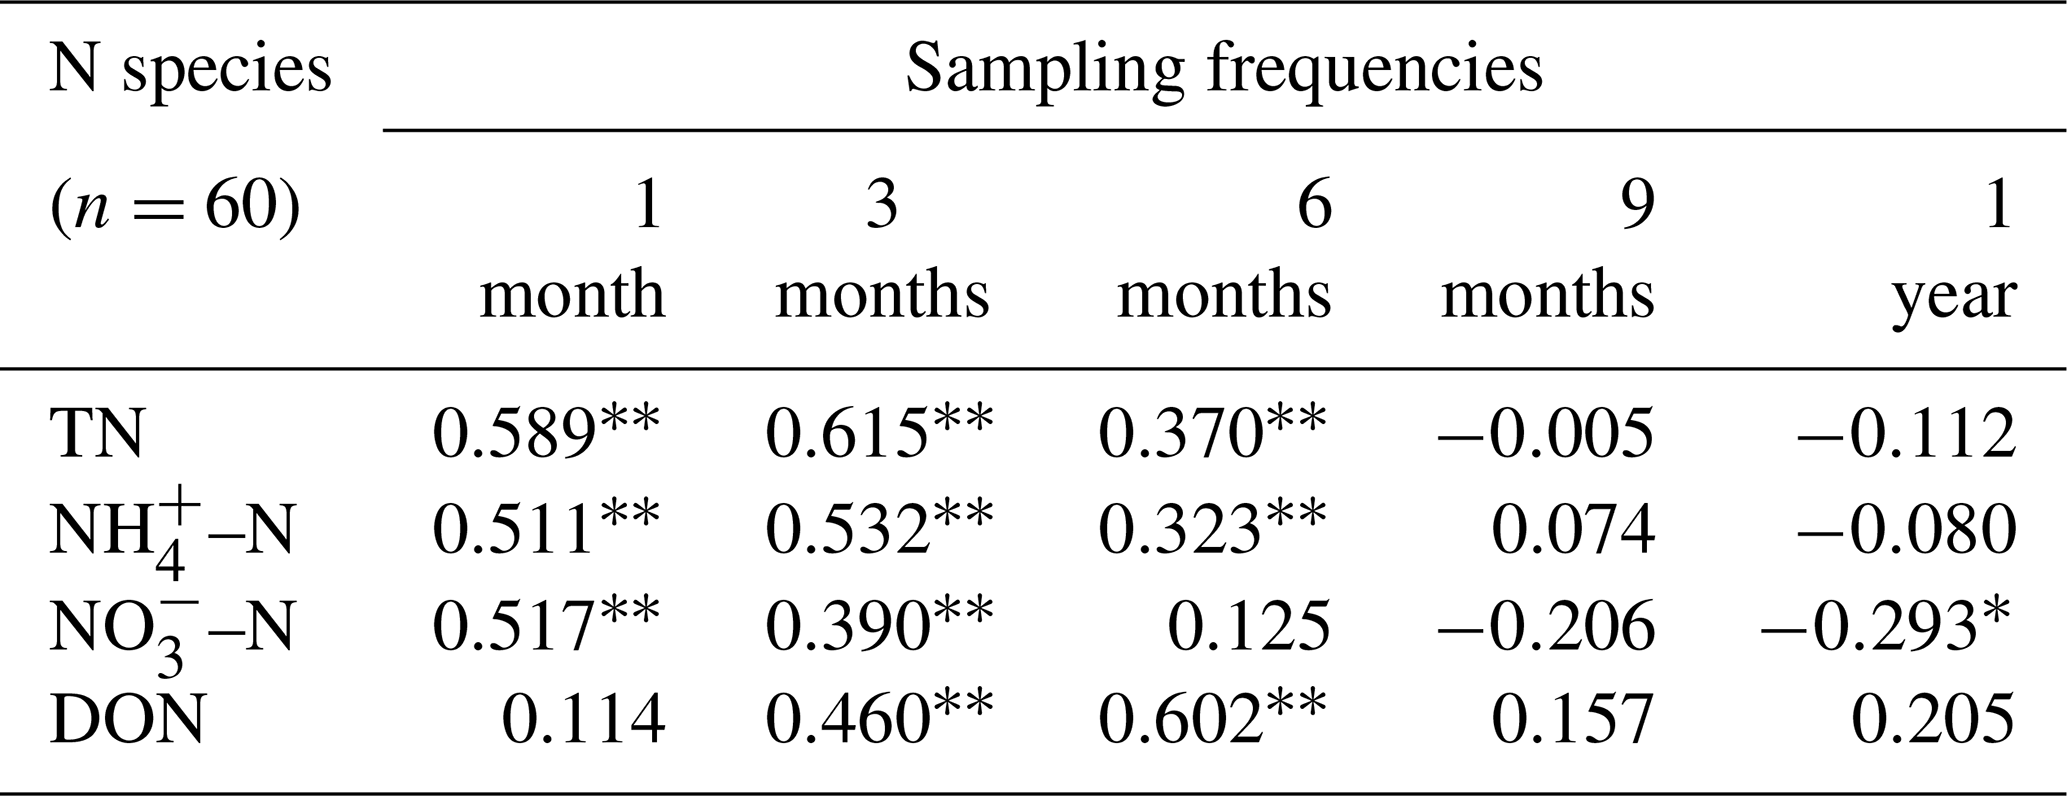
Note that “” and “*” indicate P<0.01 and P<0.05, respectively. N deposition samples (n=60) and moss samples (n=60) for each correlation.
Based on the sampling frequency (less than 6 months per time) that showed a significant positive correlation, the preferred sampling season was further studied using correlation analysis (Fig. 3).
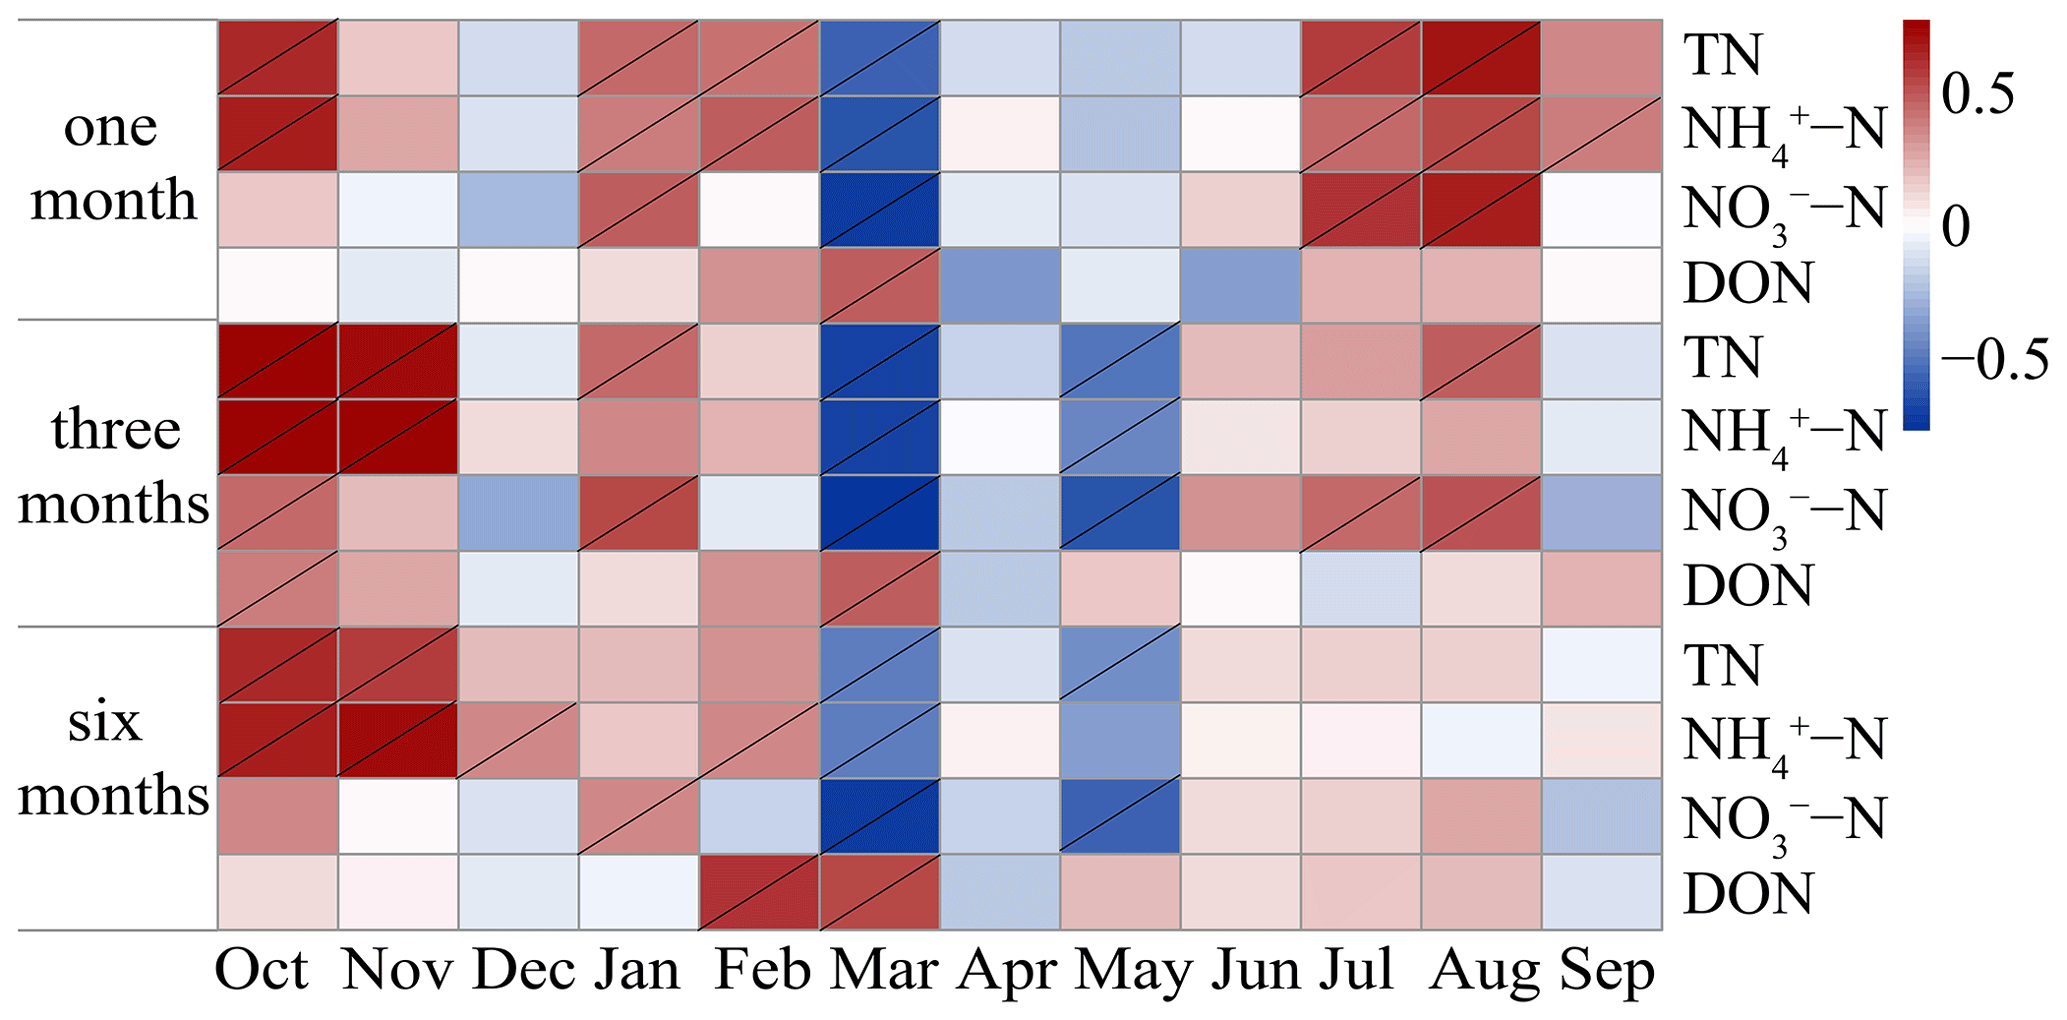
Figure 3Pearson correlation between the moss N content in the current month (from left to right) and cumulative N deposition values at different accumulation times at all sites. The grey slash indicates significance at P<0.05.
Under the sampling frequency of 1 month, the moss N content showed a significant positive correlation with TN, NH–N, and NO–N deposition in winter (January and February), summer (July and August), and autumn (October and November) (P<0.05). Moreover, DON deposition in spring (March) also showed an exact correlation with the moss N content. Under the sampling frequency of 3 months per sampling event, the correlations between moss N content and N deposition were similar to those under the sampling frequency of 1 month per sampling event. Under the sampling frequency of 6 months per sampling event, significant positive correlations were observed only in late autumn and winter, particularly for NH–N.
3.3 Response model and N saturation state
Both linear and logarithmic models were used to evaluate the response of the moss N content to the different forms of N deposition (Fig. 4). There were linear and logistic regression relationships between TN, NH–N, and NO–N and moss N content. At the same time, there was no relationship between DON and moss N content. The logarithmic models had a high R2 (P<0.05) for TN. However, for NH–N and NO–N, the linear models had high R2 values (P<0.05). Here, the increase in moss N content along the atmospheric N deposition gradient was much faster at low levels than at high levels of atmospheric N input.
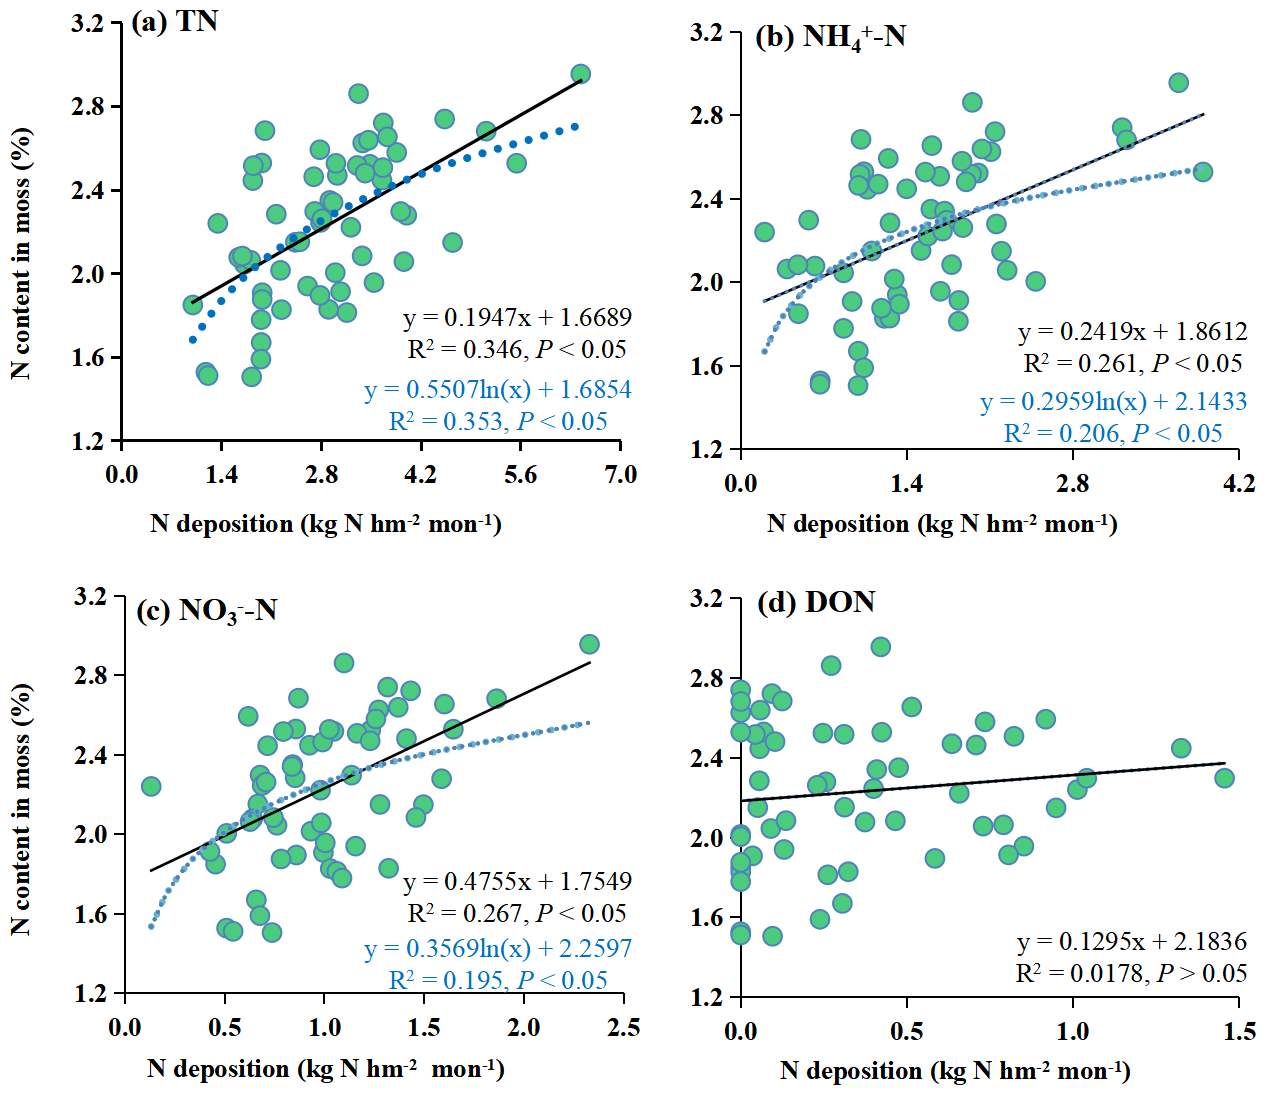
Figure 4Regression relationship between moss N content and bulk N deposition. The nitrogen species considered are TN (a), NH–N (b), NO–N (c), and DON (d), depicted by solid and dashed lines for linear and logarithmic regressions, respectively.
4.1 Response pattern to various sampling strategies
The moss N content is a promising indicator for estimating N deposition in the urban–agro–forest transition of this study, owing to the substantial covariation that has been observed (Fig. 2). The ability of mosses to monitor atmospheric N deposition has been validated through chamber experiments (Salemaa et al., 2008). Field sampling in seven European countries revealed that moss N content is correlated with various forms of N deposition (Harmens et al., 2014). Due to the physiological characteristics of mosses, especially epilithic mosses, the atmosphere provides a major source of nutrients, not the soil. Therefore, mosses are susceptible to changes in atmospheric N deposition and can also be used to monitor N deposition. Additionally, mosses can monitor not only atmospheric N deposition but also atmospheric pollutants, such as heavy metals (Fernández et al., 2015).
However, a suitable sampling frequency for mosses remains to be determined. Theoretically, the higher the sampling frequency is, the more accurate the monitoring of N deposition is. Nevertheless, synergistic monitoring frequencies need to be found due to financial and other difficulties. In previous studies, mosses were generally believed to retain N deposition for an extended period (i.e. more than a year), and the relationships between moss N content and atmospheric N deposition within 1-year periods were rarely considered in these works (Harmens et al., 2014; Kosonen et al., 2018; Liu et al., 2013b). In this study, significant covariations between moss N content and N deposition for more than 6 months were absent. However, when the sampling frequency of mosses was in the range within 6 months (i.e. 1, 3, and 6 months), significantly positive correlations (P<0.05) between N species in deposition and the N content of moss were observed. This relation means at least every 6 months for continuous monitoring of N deposition. The optimal sampling frequency for mosses was explained as the sampling frequency that showed a significant positive correlation with atmospheric N deposition in this study. This indicates that moss N can only reflect N deposition in a short period (i.e. less than 6 months). High atmospheric N deposition levels in the study region (27.46–43.70 kg N hm−2 yr−1) can explain this phenomenon. It has been reported that the atmospheric N deposition in southwest China is approximately 12.05 kg N hm−2 yr−1, which is significantly lower than that in this study (Zhu et al., 2016). As a result, when the accumulated N deposition exceeds the moss N sequestration capacity, the responses of mosses to atmospheric N deposition may become less sensitive. Therefore, given the high levels of N deposition observed in this study area, it is advisable to increase the frequency of moss sampling beyond the current 6-month interval for effective N deposition monitoring. This principle of high-frequency monitoring should also be extended to regions characterized by substantial N deposition.
The covariation between the moss N content and atmospheric N deposition depends on the season. For example, significant positive correlations were found between the moss N content and TN, NH–N, and NO–N deposition in winter (January and February), summer (July and August), and autumn (October and November) (Fig. 3; P<0.05), but these correlations were absent during spring. This phenomenon is relevant to the growing season of mosses. As mentioned in several studies, the growth of mosses generally occurs from March to May and from October to December (Thöni et al., 2011; Yurukova et al., 2009). Since mosses undergo a period of nutrient accumulation during growth (Faus-Kessler et al., 2001), they can better monitor atmospheric N deposition after growth (Boquete et al., 2011; Thöni et al., 2011). Thus, the optimal sampling seasons are winter (January and February), summer (July and August), and autumn (October and November) within this area. Moss growth status and regional N deposition level influence the moss response patterns, subsequently influencing the design of effective sampling strategies.
4.2 Response patterns of mosses to various N species
Significant positive correlations (P<0.05) between various N species in deposition and the N content of moss were observed when adopting the optimal frequency, i.e. every 1, 3, and 6 months. The relationships between moss N content and deposition of different N forms were diverse in this study. Specifically, moss N content was more strongly correlated with TN deposition than with other N species. This is consistent with results from several European countries (Harmens et al., 2011).
A comparison among different N species (NH–N, DON, and NO–N) revealed a stronger correlation between moss N content and NH–N and DON than between moss N content and NO–N. Notably, at the moss sampling frequency of 6 months, the correlation coefficient between DON and moss N content had the highest r value (r=0.602, P<0.01). This outcome might be attributed to the adaptability of mosses to their N assimilation processes in response to anthropogenic N deposition (Wiedermann et al., 2009). Research employing 15N labelling techniques revealed that mosses exhibit inducible assimilation of NO–N when NO–N constitutes the sole source of N, but such assimilation of NO–N becomes negligible in natural environments where the supply rate of reduced dissolved N (NH–N plus DON) surpasses that of NO–N. The limited assimilation of NO–N in mosses across different habitats results from the inhibition of nitrate reductase activity, which results from the high supply rate of NH–N plus DON (Liu et al., 2012). In this study, the annual rate of NH–N plus DON (24.21 kg N hm−2 yr−1) was 2.03 times greater than that of NO–N (11.91 kg N hm−2 yr−1). This habitat situation drives the preference for various N forms for moss uptake. Through 15N labelling of NO–N, NH–N, alanine, and glutamic acid, a previous study revealed that mosses preferred NH–N and DON, with deficient uptake of NO–N under different levels of N deposition (Wiedermann et al., 2009). The relatively greater uptake of NH–N than of NO–N in mosses is probably due to the high cation-exchange capacity typical of mosses (Glime, 2007).
Notably, during autumn (October and November) and spring (March), there was a noteworthy and statistically significant positive correlation between the deposition fluxes of NH–N and DON and the moss N content (Fig. 3; P<0.05). This observed correlation can be attributed to a main factor. The elevated ambient concentrations of N compounds render mosses more responsive to atmospheric N deposition. The flux of NH–N deposition was greater in autumn than in the other seasons (Fig. S1b). This heightened flux in autumn can be attributed to the peak agricultural activity, including N fertilizer application. It is worth mentioning that such fertilizer practices lead to ammonia emissions (Cui et al., 2014). Furthermore, the high level of dissolved N nutrients in the topsoil of agricultural land also facilitates the absorption of N by mosses (Glime, 2007). For the same reason, the moss N content responded better to DON in spring (March). The fluxes of DON were significantly greater in spring than in autumn and winter in this study (Fig. S1d). It is composed of various organic compounds, primarily from fossil fuel combustion and fireworks (Deng et al., 2018).
Finally, this study underscores the preference for atmospheric NH–N and DON in moss N utilization, highlighting the importance of considering the effect of the ambient concentration effect on the response.
4.3 Relationships between various N forms and the N saturation state
Logarithmic models demonstrated a superior fit for the relationship between moss N content and atmospheric TN deposition (with higher R2, P<0.05) compared to linear models with the combined dataset encompassing the whole study area (Fig. 4a). This suggests that the increase in moss N content with increasing atmospheric N deposition is much faster at low levels than at high levels of N deposition.
The utilization of logarithmic models to describe the moss response to N deposition is grounded in the concepts of the “minimum nutrient rate” and the “N saturation effect”. The minimum nutrient rate suggests that the growth of crops is influenced by the least-available relative concentration of nutrients within the environment. At low N deposition levels, the limitation tends to be N, whereas at high N deposition levels, it may be limited by other nutrients, such as phosphorus. As a result, the rate at which mosses absorb N is influenced by the presence of different limiting nutrients at different N deposition levels, leading to a non-linear relationship with N (Vitousek et al., 2010). Additionally, a distinct N saturation effect has been observed in the relationship between moss N content and N deposition. This phenomenon signifies that there is a point at which the response of mosses to N deposition becomes saturated. When the total N (TN) deposition reaches a state of N saturation, the capacity of mosses to absorb N becomes constrained (Harmens et al., 2014; Liu et al., 2013a, b; Salemaa et al., 2020). For instance, when the N deposition level falls below the state of N saturation, mosses display heightened sensitivity to N deposition, leading to significant increases in moss N content. In contrast, when N deposition surpasses the N saturation state, mosses become less responsive to further N deposition, and the expected increases in moss N content may not materialize. In fact, in such scenarios, the moss N content might even decrease due to growth limitations and physiological disruptions (Shi et al., 2017). In summary, the presence of the minimum nutrient rate and the N saturation effect during deposition influences and restricts the response patterns of mosses.
Notably, the response models constructed using the data from this study indicated that the moss N content exhibited a relatively subdued reaction to TN deposition increases exceeding approximately 4.0 kg N hm−2 per month (Fig. 4a). This observation suggested that the mosses were approaching the N saturation state. This phenomenon of N saturation is usually accompanied by a significant decrease in moss abundance and growth, along with the inhibition of photosynthesis and subsequent degradation of chlorophyll (Britton and Fisher, 2010; Ochoa-Hueso et al., 2013). These findings could indicate that the threshold of adverse impacts of N on the moss sampled becomes apparent when TN deposition reaches 4.0 kg N hm−2 per month. The N saturation state in this study was greater than that in other field studies conducted in European countries (1.2 and 1.7 kg hm−2 per month; Harmens et al., 2011, 2014). This value was also greater than the large number of fluxes on a global scale, such as in the Atlantic oak woods (0.9–1.5 kg hm−2 per month; Mitchell et al., 2005) and the Yunnan montane forest (1.5 kg hm−2 per month; Shi et al., 2017). These results could be attributed to the study area being located in a traditionally high N deposition region in China (Deng et al., 2018) because it includes agricultural, urban, rural, and forest areas, which are commonly formed in the process of urbanization and are deeply influenced by human activities. Therefore, the composition of the moss species was adapted to the elevated N deposition levels in this region. In locations marked by elevated N pollution, more tolerant species tend to thrive more than sensitive ones (Munzi et al., 2019).
In conclusion, the N saturation rate exhibited by mosses is significantly influenced by the background atmospheric N deposition, and this phenomenon displays substantial spatial variation. Notably, this rate was determined to be 4.0 kg N hm−2 per month in the specific study area under consideration.
Additionally, Fig. 4 shows the relationships between the moss N content and the various forms of bulk N deposition (NH–N and NO–N). The results showed that the linear models could better fit the moss N content and atmospheric NH–N and NO–N deposition than the logarithmic models (with higher R2, P<0.05) (Fig. 4b and c). This suggests that the increase in moss N content with increasing atmospheric N deposition is the same at low levels as at high levels of N deposition. Therefore, the moss N content responds differently to various forms of N deposition. This provides a new perspective for monitoring N deposition by mosses, which allows NH–N and NO–N deposition to be observed separately.
4.4 An optimal guide for using mosses to predict atmospheric N deposition
The following parameters should be noted to improve this technique's accuracy in using mosses to indicate atmospheric nitrogen deposition. First, the optimal sampling frequency and sampling time are determined. Mosses should be sampled more frequently than every 6 months and during winter (January and February), autumn (October and November), and summer (July and August) as a method of monitoring N deposition. Second, the moss N content correlated best with TN deposition, followed by NH–N, DON, and NO–N. Additionally, the application of this method requires certain preconditions. Understanding the background deposition is needed to determine a more appropriate relationship model and quantify N deposition.
In summary, improving the accuracy of using moss as an indicator of atmospheric nitrogen deposition involves optimizing the sampling frequency and timing, determining the correlation hierarchy among different nitrogen species, and ensuring that certain preconditions are met for accurate results. Nonetheless, it is important to acknowledge the limitations of this method. First, the method is contingent upon the specific environment where mosses thrive; for instance, it necessitates the collection of epilithic mosses and demands that they be situated in an unshaded area. Second, spatial limitations exist when applying quantitative relationships.
The moss technique remains a valuable tool for cost-effectively identifying areas at risk of high N deposition, with this study optimizing its parameters. First, the optimal sampling frequency is within 6 months per time. Second, the optimal sampling periods were winter, summer, and autumn, allowing for a more accurate estimation of atmospheric N deposition. Third, the moss N content exhibited the strongest correlation with TN deposition, indicating its heightened sensitivity to TN deposition. In addition, a new perspective on monitoring N deposition by mosses allows NH–N and NO–N deposition to be observed separately. Enhancing the model's accuracy in quantifying N deposition includes grasping background N deposition values. Considering that some limitations exist, further research is needed on moss response patterns to atmospheric N deposition in various ecosystems across China, particularly those with high N exposure levels.
The data will be made available on request.
The supplement related to this article is available online at: https://doi.org/10.5194/acp-24-5303-2024-supplement.
OD and YC designed the research and collected data. JZ, YC, and XL wrote the original draft. OD, RH, and JL contributed to the review and editing. LL, WZ, and TL contributed to visualization and validation. DHO, YZ, YH, and HY curated the data. All co-authors were actively involved in extended discussions and the elaboration of the final design of the manuscript.
The contact author has declared that none of the authors has any competing interests.
We thank the researchers for field sampling. We appreciate the meteorological data from the Chongzhou Meteorological Bureau, Sichuan Province, China.
Publisher's note: Copernicus Publications remains neutral with regard to jurisdictional claims made in the text, published maps, institutional affiliations, or any other geographical representation in this paper. While Copernicus Publications makes every effort to include appropriate place names, the final responsibility lies with the authors.
This research was supported by the National Natural Science Foundation of China (grant nos. 42361144855, 42007212, and 42107247); the Sichuan Province Science and Technology Support Program, China (grant nos. 2022NSFSCO100 and 24NSFSC5096); the Natural Science Foundation of Guizhou Province (Qian-Ke-He-Ji-Chu ZK (2023) Yi ban 474); and the Postdoctoral Fellowship Program of CPSF (GZC20231861).
This paper was edited by Theodora Nah and reviewed by two anonymous referees.
Arróniz-Crespo, M., Leake, J. R., Horton, P., and Phoenix, G. K.: Bryophyte physiological responses to, and recovery from, long-term N deposition and phosphorus fertilisation in acidic grassland, New Phytol., 180, 864–874, https://doi.org/10.1111/j.1469-8137.2008.02617.x, 2008.
Boquete, M. T., Fernández, J. A., Aboal, J. R., and Carballeira, A.: Analysis of temporal variability in the concentrations of some elements in the terrestrial moss Pseudoscleropodium purum, Environ. Exp. Bot., 72, 210–216, https://doi.org/10.1016/j.envexpbot.2011.03.002, 2011.
Britton, A. J. and Fisher, J. M.: Terricolous alpine lichens are sensitive to both load and concentration of applied nitrogen and have the potential as bioindicators of nitrogen deposition, Environ. Pollut., 158, 1296–1302, https://doi.org/10.1016/j.envpol.2010.01.015, 2010.
Burpee, B. T. and Saros, J. E.: Cross-ecosystem nutrient subsidies in Arctic and alpine lakes: implications of global change for remote lakes. Environ. Sci. Proc. Imp., 22, 1166–1189, https://doi.org/10.1039/C9EM00528E, 2020.
Clark, C. M. and Tilman, D.: Loss of plant species after chronic low-level nitrogen deposition to prairie grasslands, Nature, 451, 712–715, https://doi.org/10.1038/nature06503, 2008.
Cui, J., Zhou, J., Peng, Y., He, Y., Yang, H., and Mao, J.: Atmospheric wet deposition of nitrogen and sulfur to a typical red soil agroecosystem in Southeast China during the ten-year monsoon seasons (2003–2012), Atmos. Environ., 82, 121–129, https://doi.org/10.1016/j.atmosenv.2013.10.023, 2014.
Deng, O., Zhang, S., Deng, L., Zhang, C., and Fei, J.: Wet nitrogen deposition across the urban-intensive agricultural-rural transect of a small urban area in southwest China, Environ. Sci. Pollut. Res., 25, 7866–7874, https://doi.org/10.1007/s11356-017-1082-z, 2018.
Dong, Y., Liu, X., Sun, X., Song, W., Zheng, X., Li, R., and Liu, C.: Inter-species and intra-annual variations of moss nitrogen utilization: Implications for nitrogen deposition assessment, Environ. Pollut., 230, 506–515, https://doi.org/10.1016/j.envpol.2017.06.058, 2017.
Duan, L., Yu, Q., Zhang, Q., Wang, Z., Pan, Y., Larssen, T., Tang, J., and Mulder, J.: Acid deposition in Asia: Emissions, deposition, and ecosystem effects, Atmos. Environ., 146, 55–69, https://doi.org/10.1016/j.atmosenv.2016.07.018, 2016.
Elser, J. J., Andersen, T., Baron, J. S., Bergström, A. K., Jansson, M., Kyle, M., Nydick, K. R., Steger, L., and Hessen, D. O.: Shifts in lake N:P stoichiometry and nutrient limitation driven by atmospheric nitrogen deposition, Science, 326, 835–837, https://doi.org/10.1126/science.1176199, 2009.
Erisman, J. W., Bleeker, A., Galloway, J., and Sutton, M. S.: Reduced nitrogen in ecology and the environment, Environ. Pollut., 150, 140–149, https://doi.org/10.1016/j.envpol.2007.06.033, 2007.
Faus-Kessler, T., Dietl, C., Tritschler, J., and Peichl, L.: Correlation patterns of metals in the epiphytic moss Hypnum cupressiforme in Bavaria, Atmos. Environ., 35, 427–439, https://doi.org/10.1016/S1352-2310(00)00119-9, 2001.
Fernández, J. A., Boquete, M. T., Carballeira, A., and Aboal, J. R.: A critical review of protocols for moss biomonitoring of atmospheric deposition: Sampling and sample preparation, Sci. Total Environ., 517, 132–150, https://doi.org/10.1016/j.scitotenv.2015.02.050, 2015.
Forsum, Å., Dahlman, L., Näsholm, T., and Nordin, A.: Nitrogen utilization by Hylocomium splendens in a boreal forest fertilization experiment, Funct. Ecol., 20, 421–426, https://doi.org/10.1111/j.1365-2435.2006.01127.x, 2006.
Galloway, J. N., Townsend, A. R., Erisman, J. W., Bekunda, M., Cai, Z., Freney, J. R., Martinelli, L. A., Seitzinger, S. P., and Sutton, M. A.: Transformation of the nitrogen cycle: Recent trends, questions, and potential solutions, Science, 320, 889–892, https://doi.org/10.1126/science.1136674, 2008.
Gao, Y., He, N., and Zhang, X.: Effects of reactive nitrogen deposition on terrestrial and aquatic ecosystems, Ecol Eng., 70, 312–318, https://doi.org/10.1016/j.ecoleng.2014.06.027, 2014.
Glime, J. M.: Bryophyte Ecology, in: Vol. 1. Physiological ecology, Michigan Technological University and the International Association of Bryologists, http://www.bryoecol.mtu.edu (last access: 4 May 2024), 2007.
Gu, B., Ju, X., Chang, J., Ge, Y., and Vitousek, P. M.: Integrated reactive nitrogen budgets and future trends in China, P. Natl. Acad. Sci. USA, 112, 8792–8797, https://doi.org/10.1073/pnas.1510211112, 2015.
Harmens, H., Norris, D. A., Cooper, D. M., Mills, G., Steinnes, E., Kubin, E., Thöni, L., Aboal, J. R., Alber, R., Carballeira, A., Cokun, M., De Temmerman, L., Frolova, M., González-Miqueo, L., Jeran, Z., Leblond, S., Liiv, S., Maňkovská, B., Pesch, R., Poikolainen, J., Rühling, A., Santamaria, J. M., Simoni, P., Schröder, W., Suchara, I., Yurukova, L., and Zechmeister, H. G.: Nitrogen concentrations in mosses indicate the spatial distribution of atmospheric nitrogen deposition in Europe, Environ. Pollut., 159, 2852–2860, https://doi.org/10.1016/j.envpol.2011.04.041, 2011.
Harmens, H., Schnyder, E., Thöni, L., Cooper, D. M., Mills, G., Leblond, S., Mohr, K., Poikolainen, J., Santamaria, J., Skudnik, M., Zechmeister, H. G., Lindroos, A. J., and Hanus-Illnar, A.: Relationship between site-specific nitrogen concentrations in mosses and measured wet bulk atmospheric nitrogen deposition across Europe, Environ. Pollut., 194, 50–59, https://doi.org/10.1016/j.envpol.2014.07.016, 2014.
ICP Vegetation: Heavy Metals in European Mosses: 2010 Survey, Monitoring Manual, UNECE ICP, Vegetation Coordination Centre, CEH Bangor, UK, http://icpvegetation.ceh.ac.uk (last access: 1 September 2018), 2010.
IPCC: Climate Change 2013: The Physical Science Basis, Cambridge University Press, Cambridge, UK and New York, p. 1535, https://doi.org/10.1017/CBO9781107415324, 2013.
Keyte, I., Wild, E., Dent, J., and Jones, K. C.: Investigating the foliar uptake and within-leaf migration of phenanthrene by moss (Hypnum cupressiforme) using two-photon excitation microscopy with autofluorescence, Environ. Sci. Technol., 43, 5755–5761, https://doi.org/10.1021/es900305c, 2009.
Kosonen, Z., Thimonier, A., Schnyder, E., and Thöni, L.: Nitrogen concentration in moss compared with N load in precipitation and with total N deposition in Switzerland, Environ. Pollut., 239, 169–178, https://doi.org/10.1016/j.envpol.2018.03.063, 2018.
Liu, L., Xu, W., Lu, X., Zhong, B., Guo, Y., Lu, X., Zhao, Y., He, W., Wang, S., Zhang, X., Liu, X., and Vitousek, P.: Exploring global changes in agricultural ammonia emissions and their contribution to nitrogen deposition since 1980, P. Natl. Acad. Sci. USA, 119, e2121998119 https://doi.org/10.1073/pnas.2121998119, 2022.
Liu, X., Koba, K., Liu, C., Li, X., and Yoh, M.: Pitfalls and new mechanisms in moss isotopic bio-monitoring of atmospheric nitrogen deposition, Environ. Sci. Technol., 46, 12557–12566, https://doi.org/10.1021/es300779h 2012.
Liu, X., Zhang, Y., Han, W., Tang, A., Shen, J., Cui, Z., Vitousek, P., Erisman, J. W., Goulding, K., Christie, P., Fangmeier, A., and Zhang, F.: Enhanced nitrogen deposition over China, Nature, 494, 459–462, https://doi.org/10.1038/nature11917, 2013a.
Liu, X., Koba, K., Makabe, A., Li, X., Yoh, M., and Liu, C.: Ammonium first: natural mosses prefer atmospheric ammonium but vary utilization of dissolved organic nitrogen depending on habitat and nitrogen deposition, New Phytol., 199, 407–419, https://doi.org/10.1111/nph.12284, 2013b.
Liu, X., Xiao, H., Xiao, H., Song, W., Sun, W., Sun, X., Zheng, X., Liu, C., and Koba, K.: Stable isotope analyses of precipitation N sources in Guiyang, southwestern China, Environ. Pollut., 230, 486–494, https://doi.org/10.1016/j.envpol.2017.06.010, 2017.
Meyer, M., Schröder, W., Nickel, S., Leblond, S., Lindroos, A. J., Mohr, K., Poikolainen, J., Santamaria, J. M., Skudnik, M., Thöni, L., Beudert, B., Dieffenbach-Fries, H., Schulte-Bisping, H., and Zechmeister, H. G.: Relevance of canopy drip for the accumulation of nitrogen in moss used as biomonitors for atmospheric nitrogen deposition in Europe, Sci. Total Environ., 538, 600–610, https://doi.org/10.1016/j.scitotenv.2015.07.069, 2015.
Mitchell, R. J., Truscot, A. M., Leith, I. D., Cape, J. N., Van Dijk, N., Tang, Y., Fowler, D., and Sutton, M. A.: A study of the epiphytic communities of Atlantic oak woods along an atmospheric nitrogen deposition gradient, J. Ecol., 93, 482–492, https://doi.org/10.1111/j.1365-2745.2005.00967.x, 2005.
Munzi, S., Branquinho, C., Cruz, C., Máguas, C., Leith, I. D., Sheppard, L. J., and Sutton, M. A.: δ15N of lichens reflects the isotopic signature of ammonia source, Sci. Total Environ., 653, 698–704, https://doi.org/10.1016/j.scitotenv.2018.11.010, 2019.
Ochoa-Hueso, R., Mejías-Sanz, V., Pérez-Corona, M. E., and Manrique, E.: Nitrogen deposition effects on tissue chemistry and phosphatase activity in Cladonia foliacea (Huds.) Willd., a common terricolous lichen of semi-arid Mediterranean shrublands, J. Arid Environ., 88, 78–81, https://doi.org/10.1016/j.jaridenv.2012.07.007, 2013.
Pavlíková, I., Plášek, V., Hladký, D., Tomšejová, K., and Jančík, P.: Identification of environmental factors explaining the total nitrogen concentration in mosses collected in the Moravian Silesian borderlands, Acta Musei Silesiae, Sci. Nat., 65, 235–242, https://doi.org/10.1515/cszma-2016-0030, 2016.
Pearce, I. S. K, Woodin, S. J., and Van Der Wal, R.: Physiological and growth responses of the montane bryophyte Racomitrium lanuginosum to atmospheric N deposition, New Phytol., 160, 145–155, https://doi.org/10.1046/j.1469-8137.2003.00875.x, 2003.
Pitcairn, C., Fowler, D., Leith, I., Sheppard, L., Tang, S., Sutton, M., and Famulari, D.: Diagnostic indicators of elevated nitrogen deposition, Environ. Pollut., 144, 941–950, https://doi.org/10.1016/j.envpol.2006.01.049, 2006.
Salemaa, M., Mäkipää, R., and Oksanen, J.: Differences in the growth response of three bryophyte species to nitrogen, Environ. Pollut., 152, 82–91, https://doi.org/10.1016/j.envpol.2007.05.019, 2008.
Salemaa, M., Kieloaho, A. J., Lindroos, A. J., Merilä, P., Poikolainen, J., and Manninen, S.: Forest mosses sensitively indicate nitrogen deposition in boreal background areas, Environ. Pollut., 114054, https://doi.org/10.1016/j.envpol.2020.114054, 2020.
Schlesinger, W. H.: On the fate of anthropogenic nitrogen, P. Natl. Acad. Sci. USA, 106, 203–208, https://doi.org/10.1073/pnas.0810193105, 2009.
Schröder, W. and Pesch, R.: Long-term monitoring of the metal accumulation in forests measured by use of the moss technique, Eur. J. Forest Res., 129, 475–488, https://doi.org/10.1007/s10342-009-0298-y, 2010.
Schröder, W., Holy, M., Pesch, R., Zechmeister, H., Harmens, H., and Ilyin, I.: Mapping background values of atmospheric nitrogen total depositions in Germany based on EMEP deposition modelling and the European Moss Survey 2005, Environ. Sci. Europe, 23, 1–9, https://doi.org/10.1186/2190-4715-23-18, 2011.
Shi, X., Song, L., Liu, W., Lu, H., Qi, J., Li, S., Chen, X., Wu, J., Liu, S., and Wu, C.: Epiphytic bryophytes as bio-indicators of atmospheric nitrogen deposition in a subtropical montane cloud forest: Response patterns, mechanism, and critical load, Environ. Pollut., 229, 932–941, https://doi.org/10.1016/j.envpol.2017.07.077, 2017.
Storkey, J., Macdonald, A. J., Poulton, P. R., Scott, T., Köhler, I. H., Schnyder, H., Goulding, K. W. T., and Crawley, M. J.: Grassland biodiversity bounces back from long-term nitrogen addition, Nature, 528, 401–404, https://doi.org/10.1038/nature16444, 2015.
Thöni, L., Yurukova, L., Bergamini, A., Ilyin, I., and Matthaei, D.: Temporal trends and spatial patterns of heavy metal concentrations in mosses in Bulgaria and Switzerland: 1990–2005, Atmos. Environ., 45, 1899–1912, https://doi.org/10.1016/j.atmosenv.2011.01.039, 2011.
UBA – UmweltBundesAmt: Manual on methodologies and criteria for mapping critical levels/loads and geographical areas where they are exceeded, Federal Environmental Agency (UmweltBundesAmt), Berlin, http://www.icpmapping.org (last access: 4 May 2024), 2005.
Vitousek, P. M., Aber, J. D., Howarth, R. W., Likens, G. E., Matson, P. A., Schindler, D. W., Schelsinger, W. H., and Tilman, D. G.: Human alteration of the global nitrogen cycle: sources and consequences, Ecol Appl., 7, 737–750, https://doi.org/10.2307/2269431, 1997.
Vitousek, P. M., Porder, S., Houlton, B. Z., Chadwick, O. A., and Houlton, Z.: Ecological Society of America Terrestrial phosphorus limitation: mechanisms, implications, and nitrogen–phosphorus interactions, Ecol. Appl., 20, 5–15, https://doi.org/10.1890/08-0127.1, 2010.
Wang, X., Wu, Z., Shao, M., Fang, Y., Zhang, L., Chen, F., Chan, P. W., Fan, Q., Wang, Q., Zhu, S., and Bao, R.: Atmospheric nitrogen deposition to forest and estuary environments in the Pearl River Delta region, southern China, Tellus B, 65, 1–13, https://doi.org/10.3402/tellusb.v65i0.20480, 2013.
Wiedermann, M. M., Gunnarsson, U., Ericson, L., and Nordin, A.: Ecophysiological adjustment of two Sphagnum species in response to anthropogenic nitrogen deposition, New. Phytol., 181, 208–217, https://doi.org/10.1111/j.1469-8137.2008.02628.x, 2009.
Wilson, D., Stock, W. D., and Hedderson, T.: Historical nitrogen content of bryophyte tissue as an indicator of increased nitrogen deposition in the Cape Metropolitan Area, South Africa, Environ. Pollut., 157, 938–945, https://doi.org/10.1016/j.envpol.2008.10.021, 2009.
Xu, W., Zhang, L., and Liu, X.: A database of atmospheric nitrogen concentration and deposition from the nationwide monitoring network in China, Sci. Data, 6, 51, https://doi.org/10.1038/s41597-019-0061-2, 2019.
Yurukova, L., Tsakiri, E., and Çayir, A.: Cross-border response of moss, hypnum cupressiforme hedw., to atmospheric deposition in Southern Bulgaria and Northeastern Greece, Bull. Environ. Contam. Toxicol., 83, 174–179, https://doi.org/10.1007/s00128-008-9601-8, 2009.
Zechmeister, H. G., Richter, A., Smidt, S., Hohenwallner, D., Roder, I., Maringer, S., and Wanek, W.: Total nitrogen content and δ15N signatures in moss tissue: Indicative value for nitrogen deposition patterns and source allocation on a nationwide scale, Environ. Sci. Technol., 42, 8661–8667, https://doi.org/10.1021/es801865d, 2008.
Zhu, J., Wang, Q., He, N., Smith, M. D., Elser, J. J., Du, J., Yuan, G., Yu, G., and Yu, Q.: Imbalanced atmospheric nitrogen and phosphorus depositions in China: Implications for nutrient limitation, J. Geophys. Res.-Biogeo., 121, 1605–1616, https://doi.org/10.1002/2016JG003393, 2016.