the Creative Commons Attribution 4.0 License.
the Creative Commons Attribution 4.0 License.
 | 06 May 2024
Technical note: Characterization of a single-beam gradient force aerosol optical tweezer for droplet trapping, phase transition monitoring, and morphology studies
Xiangyu Pei
Yikan Meng
Yueling Chen
Huichao Liu
Yao Song
Zhengning Xu
Fei Zhang
Thomas C. Preston
Zhibin Wang
Single particle analysis is essential for a better understanding of the particle transformation process and to predict its environmental impact. In this study, we developed an aerosol optical tweezer (AOT) Raman spectroscopy system to investigate the phase state and morphology of suspended aerosol droplets in real time. The system comprises four modules: optical trapping, reaction, illumination and imaging, and detection. The optical trapping module utilizes a 532 nm laser and a 100 × oil immersion objective to stably trap aerosol droplets within 30 s. The reaction module allows us to adjust relative humidity (RH) and introduce reaction gases into the droplet levitation chamber, facilitating experiments to study liquid–liquid phase transitions. The illumination and imaging module employs a high-speed camera to monitor the trapped droplets, while the detector module records Raman scattering light. We trapped sodium chloride (NaCl) and 3-methyl glutaric acid (3-MGA) mixed droplets to examine RH-dependent morphology changes. Liquid–liquid phase separation (LLPS) occurred when RH was decreased. Additionally, we introduced ozone and limonene/pinene to generate secondary organic aerosol (SOA) particles in situ, which collided with the trapped droplet and dissolved in it. To determine the trapped droplet's characteristics, we utilized an open-source program based on Mie theory to retrieve diameter and refractive index from the observed whispering gallery modes (WGMs) in Raman spectra. It is found that mixed droplets formed core–shell morphology when RH was decreased, and the RH dependence of the droplets' phase transitions generated by different SOA precursors varied. Our AOT system serves as an essential experimental platform for in situ assessment of morphology and phase state during dynamic atmospheric processes.
- Article
(3124 KB) - Full-text XML
-
Supplement
(397 KB) - BibTeX
- EndNote


Atmospheric aerosol particles can absorb and reflect solar radiation, be activated into cloud droplets, participate in ice nucleation processes, and provide interfaces for chemical reactions (Mülmenstädt et al., 2015; Shrivastava et al., 2017). As a result, aerosols play important roles in air pollution, atmospheric chemistry and climate change (Pöschl, 2005). Aerosol particles can have complex compositions including inorganic, metallic, and mineral components, elemental and organic carbon, and an amount of water (Kolb and Worsnop, 2012). Aerosol particles can also have different morphologies. For example, aerosol particles composed of inorganic salts and organic components can have solid, partially engulfed or core–shell, and homogeneous morphologies through phase transitions (Freedman, 2020). Changes in aerosol composition and water content lead to the evolution of particle morphology and phase state while altering other physiochemical properties such as pH (Freedman et al., 2019), polarity (Zuend and Seinfeld, 2012), interfacial tensions (Sullivan et al., 2018), and photochemistry (Cremer et al., 2016).
To study the physiochemical properties of atmospheric aerosol particles, various measurement methods and techniques are applied. However, traditional measurement methods mainly represent the average properties of the aerosol population, lacking detailed information about individual particles, such as morphology, phase state, and composition. In comparison to methods measuring properties of particle populations, single particle levitation techniques have been developed and applied as effective tools for measuring the physical and optical properties of micron-sized particles (Krieger et al., 2012). Several single particle levitation techniques, such as electrodynamic balance (EDB), acoustic trap (AT), and optical tweezers (OT), have been widely used to control and conduct direct real-time in situ measurements of single particles (Davies, 2019; Combe and Donaldson, 2017; Z. Gong et al., 2018). Using these techniques, various atmospheric aerosol properties during dynamic processes, such as hygroscopicity, volatility, optical properties, viscosity, surface tension, and diffusion characteristics, have been extensively studied (Chan et al., 2005; Davies et al., 2013; Cai et al., 2015). However, the fundamental principles of these techniques determine their applicability for trapping particles of different sizes. For instance, EDB and AT can trap particles with diameter ranges of 5–50 and 20–100 µm, respectively, while OT can trap smaller particles with size ranges in the microns and tens of microns in diameter (Krieger et al., 2012).
When transparent or weakly absorptive spherical particles, such as droplets, are trapped by OT and measured with Raman spectroscopy (RS), these spherical droplets can function as high-finesse optical cavities. This results in a significant enhancement of stimulated Raman scattering signals at specific wavelengths, which are referred to as whispering gallery modes (WGMs) (Ashkin and Dziedzic, 1981). The diameter and refractive index of the trapped droplet can be determined from the WGM signals (Reid et al., 2007). Additionally, different droplet morphologies can exert a considerable influence on WGM behavior. For instance, if the droplet exhibits a homogeneous or concentric core–shell morphology, WGM signals are generated. However, when liquid–liquid phase separation (LLPS) occurs, and the droplet assumes a partially engulfed morphology, WGM signals will vanish. By combining OT with RS, precise information about droplet size, refractive index, and morphology can be obtained. For example, Rickards et al. (2013) employed OT-RS to investigate the evolution of size and refractive index under varying relative humidity (RH) conditions, exploring the impact of the O C ratio on aerosol hygroscopicity. Gorkowski et al. (2020) utilized OT-RS to predict phase separation and changes in particle morphology. They studied the mixing behavior of α-pinene secondary organic aerosol (SOA) with different organic phases, including squalene and glycerol, at various relative humidity levels. Boyer et al. (2020) applied OT-RS to achieve highly accurate in situ pH measurements of NaHSO4 microdroplets.
In this study, we present our custom-made aerosol optical tweezer (AOT) system. We describe the system and the design of the droplet particle levitation chamber. We have innovated the chamber design by adopting a smaller chamber to reduce droplet capture time. Additionally, we have introduced a double-floor chamber room and a replaceable intermediate plate, which facilitates control of the flow exchange rate for different experiments. We have also established methods for Raman spectrum analysis and droplet morphometry determination and have systematically characterized this system, presenting the results. The application of this system includes studying the morphology of aqueous droplet–hydrocarbon experiments and in situ generation and addition of SOA as the second phase. Furthermore, our chamber design provides for the possibility of conducting more gas–liquid phase reaction experiments in the future. This indicates that the AOT system is a powerful tool that can be used to uncover the mechanisms of changes in physical and chemical properties of droplets during their evolution under different conditions.
2.1 System description
A schematic illustration of the aerosol optical tweezer system is presented in Fig. 1, which includes the optical trapping module, illumination and imaging module, detector module, and reaction module. The optical trapping module utilizes a 532 nm laser (Opus 532-2W). Depending on the desired particle size and flow turbulence, the laser power is adjusted between 30 and 200 mW to maintain steady trapping. Subsequently, the laser passes through expansion lenses to overfill the back aperture of the microscope objective. A 100 × oil immersion objective (Olympus, UPLFLN100XO, NA 1.30) is brought into contact with a glass coverslip (Nest, thickness 160–190 µm) installed at the bottom of the aerosol particle levitation chamber. This convergence of the laser beam above the glass coverslip forms an optical trap.

Figure 1(a) Schematic of the aerosol optical tweezer setup used in this study. (b) Design of the droplet particle levitation chamber. (c) Photo of the main components of the system, including the chamber, water bubbler, laser, camera, and spectrometer.
The illumination and imaging module consists of a 450 nm LED (Daheng Optics, GCI060404) and a camera (Thorlabs, CS165CU/M) used for illuminating and imaging the particles. Both the camera and spectrograph capture the LED scattered light and the Raman scattered light from the particle, respectively, using the same microscope objective. To obtain a clear image of the particle, a low-pass filter (Andover, 500FL07-25) is positioned in front of the camera lens to eliminate the influence of backscattered light from the 532 nm laser.
The Raman scattering signals are collected through a detector module, with the primary component being a spectrometer. The Raman scattered light passes through two 50 : 50 beam splitters (CVI Laser Optics, BTF-VIS-50-2501M-C) and a notch filter (Edmund, 86125) before being focused into the Raman spectrograph. A spectrometer (ZOLIX, Omni-λ5004i) is employed to measure the Stokes-shifted Raman spectra, utilizing a 20 µm entrance slit width and a 1200 groove mm−1 diffraction grating with a blaze wavelength of 500 nm to achieve a spectral resolution of 0.021 nm. The wavelength position of the spectrograph is calibrated using a Hg-light source. For liquid–liquid phase separation experiments, the center wavelengths of 645 nm for the diffraction grating are configured, and the Raman scattered light is recorded every 4 s within a wavelength range of 624.24–665.40 nm.
The reaction module serves as the area where RH airflow and reactive gases are introduced, and where chemical reactions occur. Its central component is a custom-made aerosol particle levitation chamber (Fig. 1b), which integrates the inverted oil immersion objective from the optical trapping module and the downward brightfield illumination source from the illumination and imaging module. Further details on the chamber's design will be provided in the following section. For controlling RH airflow, two air streams are combined: one with a relative humidity of 100 % and the other air-dried using a silica drier. This mixture results in conditioned air with a specific RH, allowing precise control over humidity within the chamber. The humidification of the airflow is achieved through a water bubbler, and both the humidified and dry airflows are regulated by two mass flow controllers (MFCs) with a total flow rate of 0.3 L min−1. Temperature and humidity sensors (Sensirion, SHT85) are employed to measure the temperature and humidity of the airflow at both the inlet and outlet of the chamber, following the design used by Gorkowski et al. (2016). Temperature and humidity are not directly measured inside the chamber with a probe because particle deposition on the probe can affect measurement accuracy. Additionally, placing the probe near the droplet could interfere with droplet capture, making it challenging to maintain stable trapping of the droplet. Other reactive gases can be introduced into the chamber through dedicated ports located on the chamber wall for chemical reactions, and these gases exit through an exhaust port.
2.2 Chamber design
The chamber is designed to provide a sealed environment and to regulate the ambient humidity for the optically trapped droplet, similar to the chamber design by Gómez Castaño et al. (2019). Our chamber is relatively compact, with a volume of 36 mL, in contrast to the design by Gorkowski et al. (2016). This smaller size offers several advantages, including improved capture efficiency. Moreover, we have introduced an innovative double-floor chamber structure. The chamber consists of three main components: the upper section for introducing RH conditioned airflow and organic aerosol/gas flow, an intermediate plate that connects the upper and lower compartments for airflow passage, and the lower part for injecting atomized droplets. The RH measured by the sensor at the outlet of the lower part is used as the actual chamber RH, since this sensor is closed to the droplet trapping position and measures the RH in the lower part. Both the upper and lower sections feature three ports for tubing connections. The replaceable intermediate part plays a pivotal role in enhancing the chamber's versatility. Depending on the specific experimental objectives, the shape, size, and distribution of ventilation holes on the intermediate part can be customized to control the flow exchange rate. For instance, in experiments involving liquid–liquid phase separation, a flat plate with unobstructed circular holes in the middle is employed to minimize the airflow's impact on liquid droplets. In contrast, during reactivity experiments, the central circular hole is altered from a flat type to a circular barrier type, facilitating better contact between the reactants and the droplet's surface.
To facilitate the passage of light while preventing the flow of gas, a transparent glass slide is positioned on top of the intermediate section to cover the central holes. This innovative approach allows the illumination LED's light to pass through the window, reaching the trapped particle, while enabling the gas flow to penetrate the intermediate plate through the holes. This design effectively reduces the likelihood of disturbing the stability of particle trapping. In the lower section, the vertical distance between the droplet inlet and the coverslip is set at 6.5 mm. This configuration ensures that atomized droplets can reach the optical trap position in abundance, thereby increasing the probability of successful trapping. Inside the lower part, a glass coverslip is placed and soaked in a surfactant solution (a 50 : 50 water-to-Decon 90 solution). The surfactant solution is used to help the deposited droplets to spread on the surface of the coverslip. The openings of the chamber are sealed with O rings and screws to ensure airtightness. This sealing is applied between the upper, intermediate, and lower sections and between the window cover, coverslip, and the bottom of the lower part. This design allows for easy disassembly and cleaning of the entire chamber. Under conditions devoid of external disturbances, we are able to stably capture droplets within the chamber for periods exceeding 24 h.
2.3 Aerosol generation
Aqueous aerosol droplets are created using a medical nebulizer (LANDWIND, PN 100) and can be effectively trapped within 30 s after introducing the aerosol plume into the chamber. In this study, aqueous NaCl droplets were generated to investigate their response to changes in RH and to assess the accuracy of particle size measurements during the droplet equilibrium experiments. Additionally, mixed droplets containing both NaCl and 3-methyl glutaric acid (3-MGA) were generated to demonstrate the research approach for studying liquid–liquid phase separation (LLPS). Detailed information on each of these experiments is provided below.
Following the successful trapping of droplets in the lower layer of the AOT, reaction gases such as ozone and volatile organic compounds (VOCs) can be introduced into the chamber. Subsequently, SOA is formed and added to the surface of the droplets through designated ports within the chamber. In this study, both limonene and α-pinene were used as separate SOA precursors. The concentration of limonene within the AOT was controlled by passing dry nitrogen flow over limonene contained in a diffusion vial submerged in a temperature-regulated bath system (Pei et al., 2018). Ozone was generated by passing zero air through a UV lamp unit (SOG-2, UVP). The VOCs and ozone reacted in the upper part of the chamber, resulting in the production of SOA particles. These particles settled and subsequently collided with the trapped droplets in the lower section of the chamber.
2.4 Detection of the morphology of mixed droplets
Droplets exhibit various morphologies in the atmosphere, including homogeneous, partially engulfed, and core–shell morphologies (Song et al., 2013; Veghte et al., 2013). Whispering gallery modes (WGMs), which significantly enhance Raman signals (Ashkin and Dziedzic, 1981), serve as crucial indicators for identifying droplet morphology (Gorkowski et al., 2016; Stewart et al., 2015). These WGMs are observed as distinct peaks superimposed on the broader vibrational modes in the droplet's Raman spectrum. Analyzing the Raman spectrum involves pinpointing the wavelength positions of WGM peaks in the spectrum and fitting these positions to a Mie scattering model. This fitting process allows for the retrieval of the droplet's diameter, denoted as Dp, and its refractive index, represented as n (Preston and Reid, 2013, 2015).
Our method for retrieving the values of Dp, and n from the WGMs comprises two essential components: an automatic peak finding algorithm and a Mie scattering fitting program. The peak finding method relies on the iPeak code, which was developed by O'Haver (2022). This approach accurately identifies the desired peaks by smoothing the first derivative of the signal and identifying downward-going zero-crossings that meet specific predefined criteria, such as minimum slope and amplitude thresholds. Once the positions of the WGMs are determined using the peak finding method, we employ the Mie scattering fitting program known as Mie Resonance Fitting (MRFIT), developed by Preston and Reid (2015). MRFIT is utilized to calculate both the diameter and refractive index of a homogeneous droplet. It provides mode assignment information, including the mode number, mode order, and polarization, which is essential for a comprehensive analysis.
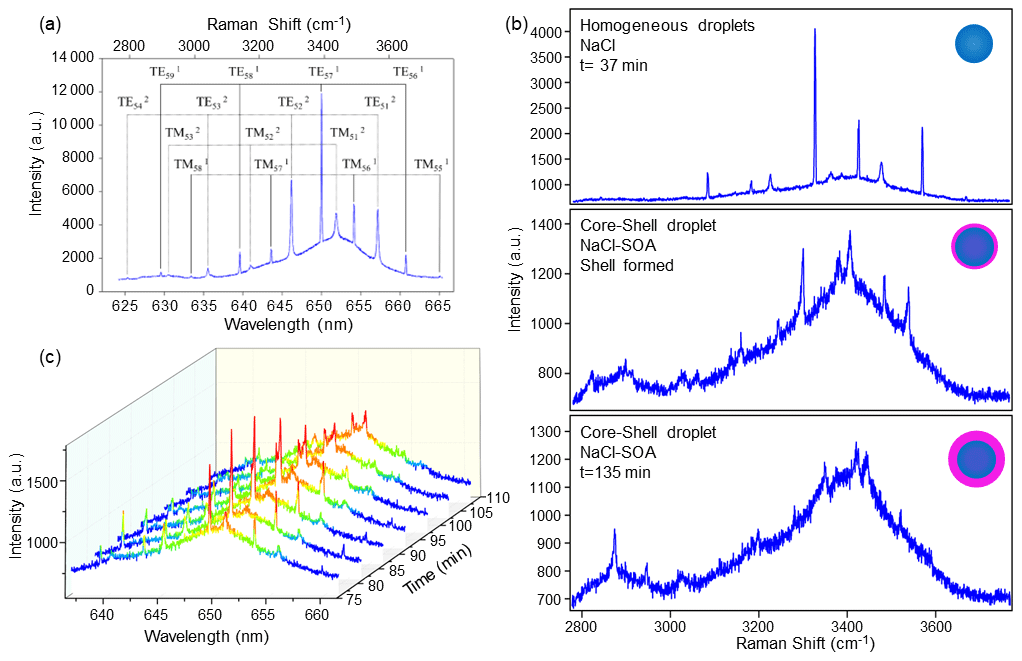
Figure 2Example of identifying droplet morphology based on spectral features. (a) Example of a Raman scattering signature from a trapped aqueous NaCl droplet. (b) Spectra of different droplet morphologies: upper subpanel shows the typical spectrum of homogeneous aqueous saturated NaCl droplets. Middle subpanel shows the spectrum when SOA forms a thin shell on the surface of the saturated NaCl droplets. Bottom subpanel shows the spectrum with weakened WGMs peaks when SOA continues to coagulate onto the surface of the saturated NaCl droplets. (c) Example of WGM splitting time series: red peaks gradually split from one into two, and intensity becomes weaker when SOA is added to the droplet, indicating the formation of a core–shell morphology.
During the experiment, typically, a homogeneous droplet is initially trapped. Subsequently, as the RH is decreased, the droplet may undergo phase separation and transform into partially engulfed or core–shell morphologies. These transformations have distinct effects on the WGMs. When a droplet transitions into a partially engulfed state, its symmetric structure is disrupted, leading to quenching of the WGMs. In contrast, when the droplet assumes a core–shell structure, the WGMs weaken because the radial uniformity of the droplet is perturbed (Buajarern et al., 2007; Mitchem et al., 2006). Consequently, applying MRFIT to a partially engulfed or core–shell droplet can render the retrieval of diameter and refractive index implausible, resulting in abnormally high fit errors. To address this issue and retrieve the diameters and refractive indices for core–shell droplets, we employ another program called Mie Resonance Shell Fitting (MRSFIT), developed by Vennes and Preston (2019). MRSFIT is specifically designed to fit observed Mie resonances to the resonances predicted using Mie theory for core–shell particles. The mode assignments provided by MRFIT guide the selection of appropriate parameters for core–shell droplets. After capturing a droplet, its morphology can be identified from the spectra, with examples illustrated in Fig. 2.
3.1 Performance of trapping chamber
In the initial stages of chamber optimization, a 3D printing technique was employed to create the chamber prototype. However, for the final chamber design, aluminum was chosen as the construction material instead of 3D printing material. While 3D printing offers rapid prototyping capabilities, the polymer structure of 3D printing materials can absorb moisture, making it impractical to maintain a stable RH level within the chamber (Gorkowski et al., 2016). Initially, a single-floor chamber design was used to achieve successful particle trapping. However, it was challenging to introduce controlled RH flow into the chamber while maintaining stable droplet trapping. This difficulty arose because the ports on the chamber were located on the sides, and the flows were delivered directly to the trapping position, thereby disrupting the stability of trapping. Consequently, a double-floor chamber design was adopted. In this configuration, RH flow is introduced into the upper part of the chamber and then directed through holes in the intermediate part to reach the lower section. All the experimental data presented in this study were obtained using the double-floor chamber design, which offered improved control over RH conditions and allowed for stable droplet trapping.
A saturated aqueous NaCl droplet was trapped to investigate its response to changes in RH. These droplets equilibrate rapidly with variations in the RH of the surrounding air (Gorkowski et al., 2016). When the droplet was successfully trapped, the RH was systematically ramped up and down in approximately 4 % steps. This RH cycling ranged from 74 % to 98 %, and the settings for RH, including the flows of both humid air and dry air, were held constant for 20 min at each step. This process of ramping RH up and down was repeated seven times, totaling 31 h of experimentation. Measurements of RH both before and after the chamber were taken. Simultaneously, Raman scattered light was recorded at intervals of 4 s, enabling the calculation of Dp and n through the use of the WGM fitting program known as MRFIT. In Fig. 3, the retrieved values for Dp and n, as well as the measured RH before and after the chamber, are displayed. Additionally, the figure provides a time series of Raman spectra for a trapped aqueous NaCl droplet during the first RH cycling experiment. These data offer insights into how the droplet responds to RH variations.
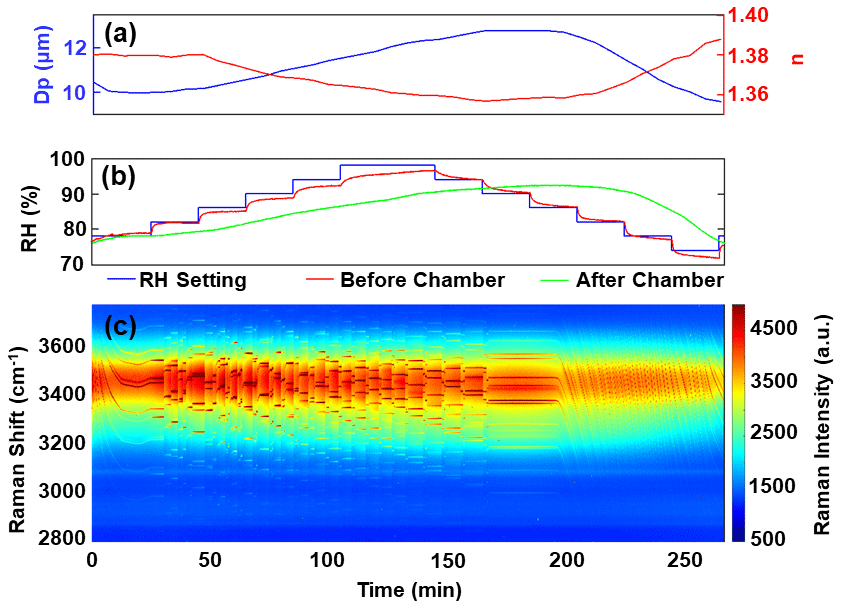
Figure 3(a) Retrieved diameter (Dp) and refractive index (n). (b) RH measured before and after the chamber. (c) Time series of Raman spectra for a trapped aqueous NaCl droplet.
Figure 3b clearly illustrates a significant difference between the RH measurements before and after the chamber. Specifically, the RH measured before entering the chamber closely followed the stepwise setting values, while the RH measured after exiting the chamber exhibited a continuous change with a noticeable lag compared to the RH before entering. When the RH was incrementally increased, the lag between the RH before entering the chamber and the RH after exiting the chamber was 20 min for an RH of 78 % and extended to 80 min for an RH of 92 %. Conversely, when the RH was decreased, the lag between the RH before entering the chamber and the RH after exiting the chamber was 42 min for an RH of 90 % and reduced to 20 min for an RH of 77 %. This observed lag can be attributed to the fact that water vapor can only traverse the holes in the intermediate part from the upper section to the lower section, leading to RH in the lower part requiring time to reach the same value as in the upper part. The lag in RH reflects the time required for the chamber's internal conditions to equilibrate with the externally controlled RH levels.
Figure 3c displays the Raman spectra time series for the trapped aqueous NaCl droplet. This spectrum exhibits the broad O-H vibration mode from water, spanning the range of 3200–3600 cm−1, with sharp WGMs superimposed on top, highlighted in dark red. In Fig. 3a, we observe the retrieved values for Dp and n of the trapped droplet. During the initial 10 min of the experiment, the WGM positions blue-shifted to shorter wavelengths (as shown in Fig. 3c) and the droplet's diameter decreased from 10.47 to 9.98 µm. This indicates that the newly nebulized and trapped droplet did not immediately equilibrate with the surrounding air and that water was evaporating from the droplet. Starting from 25 min into the experiment, as RH was increased, there was a rapid shift in WGM positions to longer wavelengths within 1 min. After this initial shift, the positions remained relatively stable, but the intensities of the WGMs increased significantly over the rest of the time. Additionally, there were instances where the WGM positions shifted again abruptly, but the red shift phenomenon was not always observed. Nevertheless, an increase in WGM intensities did occur. This process continued until the RH after exiting the chamber reached its maximum value of approximately 92 % and remained stable from 160 to 195 min. Subsequently, during the period from 195 to 267 min, as RH was decreased, the RH after exiting the chamber gradually declined from 92 % to 76 %. Interestingly, unlike during the RH increase, there were no abrupt changes in WGMs. Instead, the WGMs consistently shifted to shorter wavelengths, indicating continuous water vapor evaporation from the droplet. This resulted in a decrease in droplet diameter. In general, the trend of Dp correlated well with the RH after exiting the chamber, increasing from 10.0 to 12.8 µm as RH increased from 78 % to 92 % and decreasing from 12.8 to 9.6 µm as RH decreased from 92 % to 76 %. This suggests that the droplet responded quickly to changes in its surrounding RH. Regarding n, it exhibited a reverse trend compared to Dp. It decreased from 1.379 to 1.357 as RH increased from 78 % to 92 %, and increased from 1.357 to 1.388 as RH decreased from 92 % to 76 %. This indicates that as RH increased, more water molecules were added to the droplet, diluting the NaCl solution and causing the refractive index to approach that of pure water (∼ 1.33). This trend aligns with previous studies (Boyer et al., 2020) and demonstrates the effectiveness of the Mie scattering fitting program, MRFIT, developed by Preston and Reid (2015), in providing reasonable and consistent results.
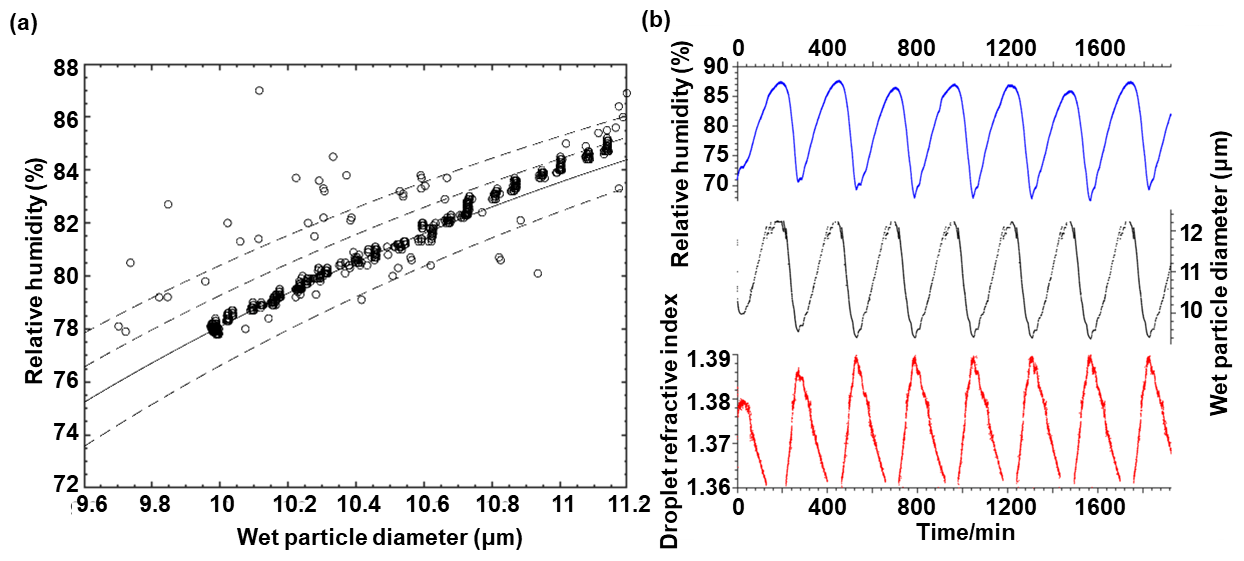
Figure 4Chamber humidity performance. (a) Comparison between experimental measurements and theoretical calculations of the relationship between wet particle diameter and relative humidity. The lines represent Köhler curves calculated for particles with different diameters: 5.28, 5.38, 5.48, and 5.60 µm from left to right, respectively. The points represent the results obtained using our AOT to observe particles with a 5.48 µm diameter, which is consistent with the predicted result (solid black line). (b) Time series of RH, droplet diameter, and refractive index variation in the chamber.
To assess the accuracy of particle size measurements using the RH balance, the method proposed by Mitchem et al. (2006) was employed. This method estimates the particle size of a single droplet by comparing the actual size of the droplet during equilibrium with the theoretical value calculated using Köhler theory. In this specific experiment, droplets were generated using a 0.4 g mL−1 NaCl aqueous solution; the results are presented in Fig. 4a and the results of another droplet at higher RH are given in the Supplement, Fig. S1. Upon reaching initial equilibrium within the chamber, the size of the droplet, which initially had a diameter of 9.6 µm, exhibited excellent consistency with the predicted results based on Köhler theory for a dry particle with a diameter of 5.48 µm. Figure 4b illustrates the variations in droplet diameter and refractive index within the RH range of 68 % to 88 % over a span of 32 h during the droplet equilibrium experiment. Throughout the process of increasing and decreasing RH, the droplet diameter exhibited a direct proportionality to RH, while the refractive index displayed an inverse proportionality to RH. These trends highlight how changes in RH influence the droplet's size and optical properties.
3.2 Phase separation of inorganic/SOA proxy mixed aqueous droplets
Droplets were generated using a medical nebulizer (LANDWIND, PN 100) and composed of a mixed saturated solution of NaCl and trimethyl glutaric acid (3-MGA). The solution had a mass concentration of 100 g L−1, and the organic-to-inorganic mass ratio was maintained at 1 : 1. These droplets, with diameters ranging from 8 to 12 µm, were subsequently captured using the aerosol optical tweezers. Inside the chamber, the RH was adjusted while Raman spectra were recorded. This allowed for the monitoring of changes in the droplet's morphology, following the method described in Sect. 2.4. The recorded Raman spectra provided insights into how alterations in RH affected the morphological characteristics of the droplets.
Figure 5 illustrates an experimental example involving the liquid–liquid phase separation and mixing of a NaCl/3-MGA mixed solution droplet. The experiment began with the chamber's RH being stabilized at 95 % for a duration of 20 min. During this phase, the initial droplet diameter was determined to be 11.38 µm, and its refractive index was measured at 1.360. Subsequently, an RH cycling process was initiated, involving a gradual decrease and then increase in the RH inside the chamber. During the RH decrease phase, the WGMs shifted towards shorter wavelengths, and the WGM locations exhibited a negative slope. These observations indicated that the droplet's diameter decreased due to the evaporation of water from within the droplet. This decrease in diameter resulted in an increase in the solute concentration within the droplet, causing the refractive index of the droplet to rise. At the 155 min mark, the WGMs in the Raman spectrum weakened but did not disappear entirely. Meanwhile, the fitting errors associated with the determination of droplet diameter and refractive index significantly increased. These findings suggested that LLPS had occurred, and a core–shell morphology was formed within the droplet. The separation RH (SRH) for the NaCl/3-MGA mixture was determined to be 61.5 %. As the RH was increased during the subsequent phase, the WGMs shifted towards longer wavelengths. When the RH reached 65.5 %, the errors associated with the WGMs fitting algorithm returned to the state observed before phase separation, indicating the restoration of a homogeneous state within the droplet. Therefore, the RH level of 65.5 % was considered to be the mixed RH (MRH), corresponding to the conditions of the droplet during this experiment.

Figure 5Liquid–liquid phase separation and mixing of a NaCl/3-MGA solution. (a) The droplet diameter and refractive index obtained from WGM fitting, with blue dots representing the droplet diameter and red dots representing the refractive index. (b) The change in RH of the chamber, with red lines representing RH before entering the chamber and green lines representing RH exiting the chamber. (c) Time-resolved Raman spectra, with WGMs marked in dark red. The dashed green line and dashed purple line represent the occurrence of liquid–liquid phase separation and liquid–liquid phase mixing, respectively.
3.3 Morphology of NaCl droplet coated with SOA
To investigate the morphology of inorganic droplets coated with SOA, SOA precursors such as limonene and α-pinene were oxidized with ozone inside the chamber, generating SOA in situ. Raman-enhanced spectroscopy was used to determine the droplet morphology, revealing that SOA formed a second phase and exhibited a tendency to create a shell on the surface of aqueous droplets. Figure 6 presents an experiment involving droplets coated with limonene SOA. At the start of the experiment, a saturated NaCl droplet was trapped at 0 min. The pink stripe in the figure represents the introduction of ozone and limonene into the chamber to generate SOA, with an RH of approximately 73.10 ± 0.18 %. The median particle size of the generated SOA particles was measured as 25.67 nm using a scanning mobility particle size (SMPS) instrument. As SOA was introduced into the chamber, the WGMs became weakened but did not completely disappear. Over time, with the continuous introduction of SOA, the SOA shell gradually formed and thickened, disrupting the radial homogeneity of the droplets and leading to the appearance of two phases within the droplet. Consequently, one WGM peak began to split into two peaks (as observed in Figs. 2c and 6b), and the fitting error of the homogeneous Mie algorithm increased (as shown in Fig. 6a). These changes indicated the formation of a core–shell morphology within the droplet. As the organic component content increased due to the presence of SOA, the spontaneous organic peaks in the spectra (in the 2800–2900 cm−1 region) were enhanced. WGMs also emerged in the C-H hydrocarbon region, although they weakened in the OH region. Over time, the intensity of the WGMs peak in the C-H region continued to increase when SOA was continually added, as depicted in Fig. 6c. These observations provide insights into the evolving morphology and composition of the droplets as SOA is introduced.
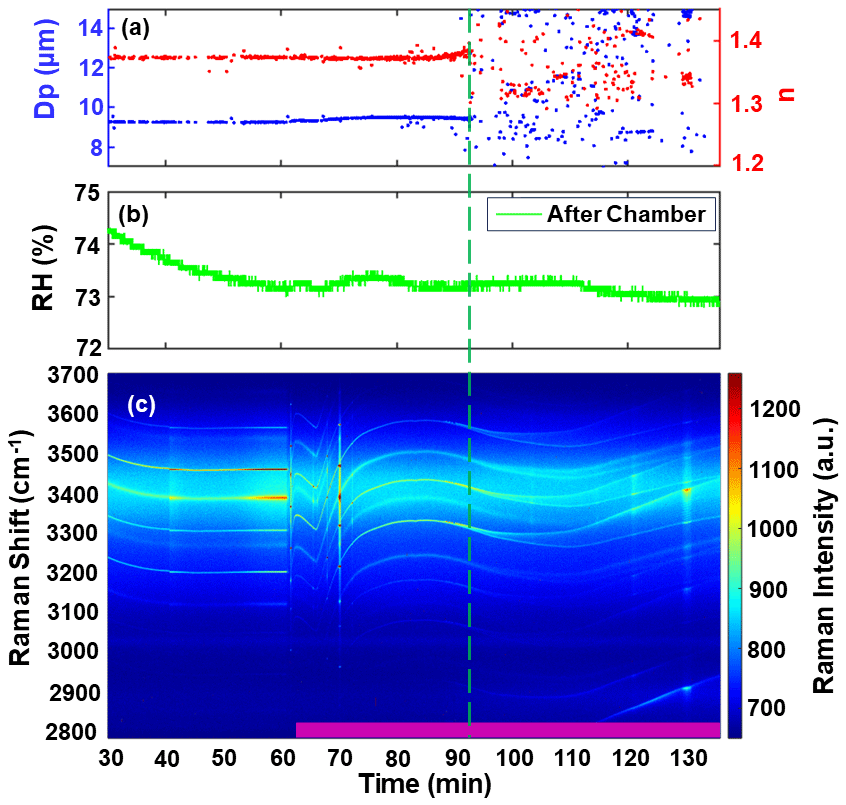
Figure 6The experiment of limonene SOA coated on a saturated NaCl droplet. (a) Retrieved diameter (blue dots) and refractive index (red dots) of the droplet. (b) Relative humidity (RH) of the flow after exiting the chamber. (c) Limonene SOA (purple bar at the bottom) was added to the droplet, resulting in the formation of a core–shell morphology. The dashed green line indicates the occurrence of WGM splitting and the formation of a second phase.
Figure 7 presents another experiment involving a droplet coated with α-pinene SOA at an RH of approximately 75.47 ± 0.29 %. Using the same SOA generation conditions, the median diameter of the α-pinene SOA particles was measured at 25.67 nm. After approximately 40 min of introducing SOA into the chamber, significant changes occurred in the WGMs, including splitting, and the fitting error of the homogeneous Mie algorithm increased significantly. As SOA was generated, ultra-micron SOA particles formed within the NaCl droplet. This phenomenon can be attributed to the higher polarity of certain compounds in SOA, which are water-soluble and can dissolve into the aqueous phase (Y. Gong et al., 2018; Takeuchi et al., 2022; Mutzel et al., 2021). This behavior has been observed in previous studies using electron microscopy, where the formation of outer shell emulsion droplets in organic/inorganic mixed droplets was observed (Song et al., 2012). Similar phenomena have also been observed in experiments involving AOT (Gorkowski et al., 2017). With continued introduction of SOA, a shell gradually formed on the surface of the aqueous phase of the droplet. To illustrate the development of this shell, a core–shell model developed by Vennes and Preston (2019) was used to calculate the inner core and outer shell diameters of the droplet during the phase addition stage. Eventually, a shell with a thickness of approximately 100 nm was formed (as shown in Fig. 7b). Some gaps in the data are due to the WGMs' insufficient quality during this stage, which affected the fitting of the core–shell model. The automated peak finding program used may not have recognized WGMs with slightly weaker intensity. Figure 7b reveals that before 88 min, the core–shell model provided identical values for the fitted core and shell diameters, indicating a homogeneous droplet with no shell. However, after 88 min, the difference between the core and shell diameters increased, signifying the development of a core–shell structure within the droplet.
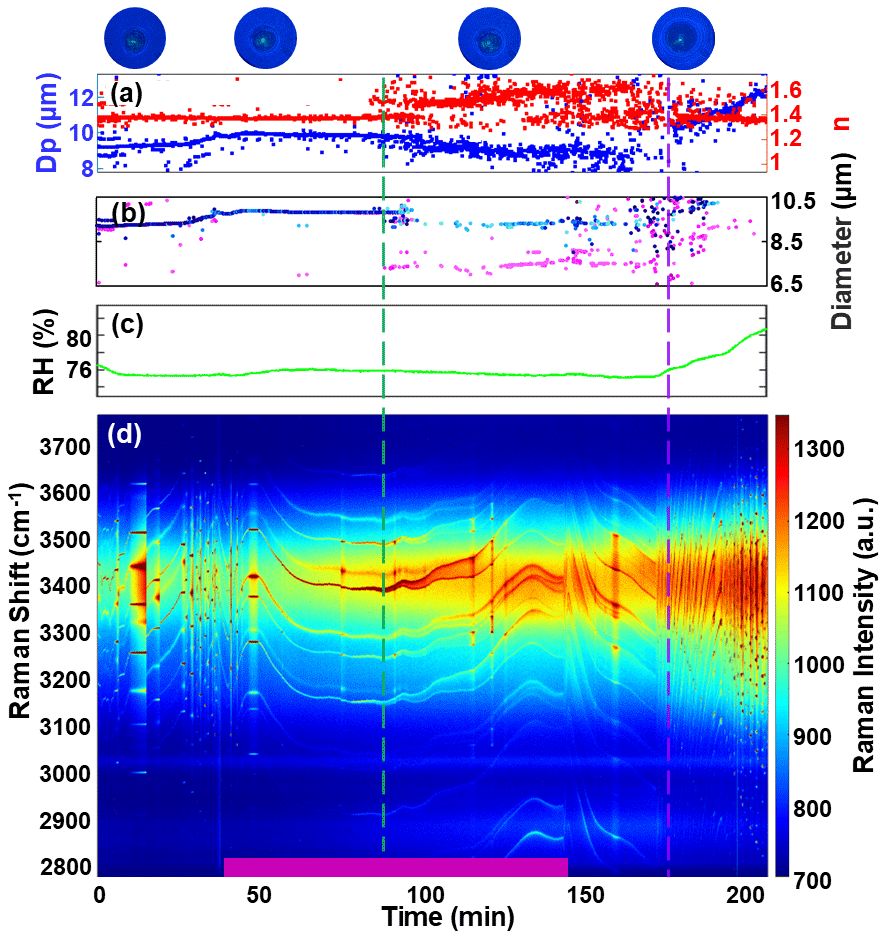
Figure 7The experiment of α-pinene SOA coated on a saturated NaCl droplet. (a) Retrieved diameter (blue dots) and refractive index (red dots) of the droplets using the homogeneous droplet model, with real-time images of the droplet at different times. (b) Retrieved shell diameter (blue dots) and core diameter (red dots) of droplets using the core–shell droplet model. The darker the color, the smaller the fitting error. Between the dotted green line and dotted purple line, blue dots represent shell diameter while pink dots represent core diameter. (c) RH of the flow after exiting the chamber. (d) Limonene SOA (purple bar at the bottom) was added to the droplet, resulting in the formation of a core–shell morphology. The dashed green line and dashed purple line represent the occurrence of liquid–liquid phase separation and liquid–liquid phase mixing, respectively.
Interestingly, the formation of a shell was observed at an RH of 75.47 % when α-pinene was used to generate SOA. However, under the same conditions, no shell formation was observed when limonene was used to generate SOA. However, when the RH was reduced to 73.10 %, shell formation was observed with limonene SOA. This difference in behavior can be attributed to the chemical properties of the SOA precursors. Limonene contains two double bonds, making it more reactive to ozone and resulting in a higher yield of SOA compared to α-pinene (Chen and Hopke, 2010; Saathoff et al., 2009). Consequently, SOA generated from α-pinene has lower water solubility in saturated NaCl aqueous solution, which explains the different phase states observed in NaCl droplets mixed with α-pinene SOA versus limonene SOA. After introducing α-pinene SOA for 100 min and stabilizing the droplet for 30 min, the RH was increased. When the RH reached 76.20 %, the fitting error of the homogeneous Mie algorithm significantly decreased (as shown in Fig. 7a), indicating a transition from core–shell morphology to a homogeneous morphology. This demonstrates the capability of our AOT to study the water solubility, hygroscopicity, and other properties of SOA. Furthermore, these experimental results align with previous studies (Sullivan et al., 2020), indicating that SOA generated from terpenes tends to form core–shell morphologies during phase separation.
In this study, we developed and characterized a new single-beam gradient force aerosol AOT system. A customized droplet particle levitation chamber with a double-floor design was constructed, offering versatility for modifications and enabling rapid droplet trapping. We conducted a comprehensive characterization and performance assessment of this AOT system. Our AOT system demonstrated the ability to efficiently capture micron-sized droplets within 30 s, significantly improving capture efficiency. Additionally, the flexibility of the chamber design allowed for adjustments in airflow exchange rate and direction by altering the shape and size of the air holes in the intermediate part, tailored to specific experimental requirements. To evaluate the chamber's performance, we trapped NaCl droplets and used the MRFIT algorithm to retrieve their diameter and refractive index. The experimentally obtained droplet sizes closely matched theoretical values, affirming the chamber's performance. We also investigated the RH-dependent morphology of droplets, using NaCl droplets mixed with 3-MGA to measure SRH and phase MRH. Additionally, we generated and added α-pinene and limonene SOA to inorganic droplets in situ. We found that the formation of a second phase of the droplet occurred, allowing us to study its miscibility and humidity-dependent morphology. Our findings suggest that the AOT system can be effectively used to study the physical and chemical properties of typical atmospheric SOA. Our future research using the new AOT system will explore the interaction between secondary organic matter and various types of trapped droplets, including inorganic salt and organic aerosol droplets.
The data used in this paper can be obtained from the corresponding author upon request.
The supplement related to this article is available online at: https://doi.org/10.5194/acp-24-5235-2024-supplement.
ZW determined the main goal of this study. XP and YC designed the methods. YC and YM performed the experiments. XP and YM prepared the paper with contributions from all co-authors. ZX, HL, and YS participated in the building of the AOT system. TCP provided the codes for WGM analysis and provided comments. ZX and FZ provided comments.
At least one of the (co-)authors is a member of the editorial board of Atmospheric Chemistry and Physics. The peer-review process was guided by an independent editor, and the authors also have no other competing interests to declare.
Publisher’s note: Copernicus Publications remains neutral with regard to jurisdictional claims made in the text, published maps, institutional affiliations, or any other geographical representation in this paper. While Copernicus Publications makes every effort to include appropriate place names, the final responsibility lies with the authors.
This research has been supported by the National Natural Science Foundation of China (grant nos. 91844301 and 42005086), the Key Research and Development Program of Zhejiang Province (grant nos. 2021C03165 and 2022C03084), and the Fundamental Research Funds for the Central Universities (grant no. 2018QNA6008).
This paper was edited by Guangjie Zheng and reviewed by two anonymous referees.
Ashkin, A. and Dziedzic, J. M.: Observation of optical resonances of dielectric spheres by light scattering, Appl. Optics, 20, 1803–1814, https://doi.org/10.1364/AO.20.001803, 1981.
Boyer, H. C., Gorkowski, K., and Sullivan, R. C.: In situ pH measurements of individual levitated microdroplets using aerosol optical tweezers, Anal. Chem., 92, 1089–1096, https://doi.org/10.1021/acs.analchem.9b04152, 2020.
Buajarern, J., Mitchem, L., and Reid, J. P.: Characterizing multiphase organic/inorganic/aqueous aerosol droplets, J. Phys. Chem. A, 111, 9054–9061, https://doi.org/10.1021/jp074366a, 2007.
Cai, C., Stewart, D. J., Reid, J. P., Zhang, Y.-H., Ohm, P., Dutcher, C. S., and Clegg, S. L.: Organic component vapor pressures and hygroscopicities of aqueous aerosol measured by optical tweezers, J. Phys. Chem. A., 119, 704–718, https://doi.org/10.1021/jp510525r, 2015.
Chan, M. N., Choi, M. Y., Ng, N. L., and Chan, C. K.: Hygroscopicity of water-soluble organic compounds in atmospheric aerosols: amino acids and biomass burning derived organic species, Environ. Sci. Technol., 39, 1555–1562, https://doi.org/10.1021/es049584l, 2005.
Chen, X. and Hopke, P. K.: A chamber study of secondary organic aerosol formation by limonene ozonolysis, Indoor Air, 20, 320–328, https://doi.org/10.1111/j.1600-0668.2010.00656.x, 2010.
Combe, N. A. and Donaldson, D. J.: Water evaporation from acoustically levitated aqueous solution droplets, J. Phys. Chem. A, 121, 7197–7204, https://doi.org/10.1021/acs.jpca.7b08050, 2017.
Cremer, J. W., Thaler, K. M., Haisch, C., and Signorell, R.: Photoacoustics of single laser-trapped nanodroplets for the direct observation of nanofocusing in aerosol photokinetics, Nat. Commun., 7, 10941, https://doi.org/10.1038/ncomms10941, 2016.
Davies, J. F.: Mass, charge, and radius of droplets in a linear quadrupole electrodynamic balance, Aerosol Sci. Tech., 53, 309–320, https://doi.org/10.1080/02786826.2018.1559921, 2019.
Davies, J. F., Haddrell, A. E., Rickards, A. M. J., and Reid, J. P.: Simultaneous analysis of the equilibrium hygroscopicity and water transport kinetics of liquid aerosol, Anal. Chem., 85, 5819–5826, https://doi.org/10.1021/ac4005502, 2013.
Freedman, M. A.: Liquid–liquid phase separation in supermicrometer and submicrometer aerosol particles, Acc. Chem. Res., 53, 1102–1110, https://doi.org/10.1021/acs.accounts.0c00093, 2020.
Freedman, M. A., Ott, E.-J. E., and Marak, K. E.: Role of pH in aerosol processes and measurement challenges, J. Phys. Chem. A, 123, 1275–1284, https://doi.org/10.1021/acs.jpca.8b10676, 2019.
Gómez Castaño, J. A., Boussekey, L., Verwaerde, J. P., Moreau, M., and Tobón, Y. A.: Enhancing double-beam laser tweezers Raman spectroscopy (LTRS) for the photochemical study of individual airborne microdroplets, Molecules, 24, 3325, https://doi.org/10.3390/molecules24183325, 2019.
Gong, Y., Chen, Z., and Li, H.: The oxidation regime and SOA composition in limonene ozonolysis: roles of different double bonds, radicals, and water, Atmos. Chem. Phys., 18, 15105–15123, https://doi.org/10.5194/acp-18-15105-2018, 2018.
Gong, Z., Pan, Y.-L., Videen, G., and Wang, C.: Optical trapping and manipulation of single particles in air: Principles, technical details, and applications, J. Quant. Spectrosc. Ra., 214, 94–119, https://doi.org/10.1016/j.jqsrt.2018.04.027, 2018.
Gorkowski, K., Beydoun, H., Aboff, M., Walker, J. S., Reid, J. P., and Sullivan, R. C.: Advanced aerosol optical tweezers chamber design to facilitate phase-separation and equilibration timescale experiments on complex droplets, Aerosol Sci. Tech., 50, 1327–1341, https://doi.org/10.1080/02786826.2016.1224317, 2016.
Gorkowski K., Donahue N. M., and Sullivan R. C.: Emulsified and liquid-liquid phase-separated states of α-pinene secondary organic aerosol determined using aerosol optical tweezers, Environ. Sci. Technol., 51, 12154–12163, https://doi.org/10.1021/acs.est.7b03250, 2017.
Gorkowski, K., Donahue, N. M., and Sullivan, R. C.: Aerosol optical tweezers constrain the morphology evolution of liquid-liquid phase-separated atmospheric particles, Chem., 6, 204–220, https://doi.org/10.1016/j.chempr.2019.10.018, 2020.
Kolb, C. E. and Worsnop, D. R.: Chemistry and composition of atmospheric aerosol particles, Annu. Rev. Phys. Chem., 63, 471–491, https://doi.org/10.1146/annurev-physchem-032511-143706, 2012.
Krieger, U. K., Marcolli, C., and Reid, J. P.: Exploring the complexity of aerosol particle properties and processes using single particle techniques, Chem. Soc. Rev., 41, 6631–6662, https://doi.org/10.1039/C2CS35082C, 2012.
Mitchem, L., Buajarern, J., Ward, A. D., and Reid, J. P.: A strategy for characterizing the mixing state of immiscible aerosol components and the formation of multiphase aerosol particles through coagulation, J. Phys. Chem., 110, 13700–13703, https://doi.org/10.1021/jp062874z, 2006.
Mülmenstädt, J., Sourdeval, O., Delanoë, J., and Quaas, J.: Frequency of occurrence of rain from liquid-, mixed-, and ice-phase clouds derived from A-Train satellite retrievals, Geophys. Res. Lett., 42, 6502–6509, https://doi.org/10.1002/2015GL064604, 2015.
Mutzel, A., Zhang, Y., Böge, O., Rodigast, M., Kolodziejczyk, A., Wang, X., and Herrmann, H.: Importance of secondary organic aerosol formation of α-pinene, limonene, and m-cresol comparing day- and nighttime radical chemistry, Atmos. Chem. Phys., 21, 8479–8498, https://doi.org/10.5194/acp-21-8479-2021, 2021.
O'Haver, T. C.: A pragmatic introduction to signal processing with applications in scientific measurement, Kindle Direct 402 Publishing, ISBN 9798611266687, 2022.
Pei, X., Hallquist, M., Eriksson, A. C., Pagels, J., Donahue, N. M., Mentel, T., Svenningsson, B., Brune, W., and Pathak, R. K.: Morphological transformation of soot: investigation of microphysical processes during the condensation of sulfuric acid and limonene ozonolysis product vapors, Atmos. Chem. Phys., 18, 9845–9860, https://doi.org/10.5194/acp-18-9845-2018, 2018.
Pöschl, U.: Atmospheric Aerosols: Composition, Transformation, Climate and health effects, Angew. Chem. Int. Ed., 44, 7520–7540, https://doi.org/10.1002/anie.200501122, 2005.
Preston, T. C. and Reid, J. P.: Accurate and efficient determination of the radius, refractive index, and dispersion of weakly absorbing spherical particle using whispering gallery modes, J. Opt. Soc. Am. B, 30, 2113–2122, https://doi.org/10.1364/JOSAB.30.002113, 2013.
Preston, T. C. and Reid, J. P.: Determining the size and refractive index of microspheres using the mode assignments from Mie resonances, J. Opt. Soc. Am. A, 32, 2210–2217, https://doi.org/10.1364/JOSAA.32.002210, 2015.
Reid, J. P., Meresman, H., Mitchem, L., and Symes, R.: Spectroscopic studies of the size and composition of single aerosol droplets, Int. Rev. Phys. Chem., 26, 139–192, https://doi.org/10.1080/01442350601081899, 2007.
Rickards, A. M. J., Miles, R. E. H., Davies, J. F., Marshall, F. H., and Reid, J. P.: Measurements of the sensitivity of aerosol hygroscopicity and the κ parameter to the O C ratio, J. Phys. Chem. A., 117, 14120–14131, https://doi.org/10.1021/jp407991n, 2013.
Saathoff, H., Naumann, K.-H., Möhler, O., Jonsson, Å. M., Hallquist, M., Kiendler-Scharr, A., Mentel, Th. F., Tillmann, R., and Schurath, U.: Temperature dependence of yields of secondary organic aerosols from the ozonolysis of α-pinene and limonene, Atmos. Chem. Phys., 9, 1551–1577, https://doi.org/10.5194/acp-9-1551-2009, 2009.
Shrivastava, M., Cappa, C. D., Fan, J., Goldstein, A. H., Guenther, A. B., Jimenez, J. L., Kuang, C., Laskin, A., Martin, S. T., Ng, N. L., Petaja, T., Pierce, J. R., Rasch, P. J., Roldin, P., Seinfeld, J. H., Shilling, J., Smith, J. N., Thornton, J. A., Volkamer, R., Wang, J., Worsnop, D. R., Zaveri, R. A., Zelenyuk, A., and Zhang, Q.: Recent advances in understanding secondary organic aerosol: implications for global climate forcing, Rev. Geophys., 55, 509–559, https://doi.org/10.1002/2016RG000540, 2017.
Song, M., Marcolli, C., Krieger, U. K., Zuend, A., and Peter, T.: Liquid-liquid phase separation and morphology of internally mixed dicarboxylic acids/ammonium sulfate/water particles, Atmos. Chem. Phys., 12, 2691–2712, https://doi.org/10.5194/acp-12-2691-2012, 2012.
Song, M., Marcolli, C., Krieger, U. K., Lienhard, D. M., and Peter, T.: Morphologies of mixed organic/inorganic/aqueous aerosol droplets, Faraday Discuss., 165, 289–316, https://doi.org/10.1039/c3fd00049d, 2013.
Stewart, D. J., Cai, C., Nayler, J., Preston, T. C., Reid, J. P., Krieger, U. K., Marcolli, C., and Zhang, Y. H.: Liquid-liquid phase separation in mixed organic/inorganic single aqueous aerosol droplets, J. Phys. Chem. A, 119, 4177–4190, https://doi.org/10.1021/acs.jpca.5b01658, 2015.
Sullivan, R. C., Gorkowski, K., and Jahn, L.: Chapter 12 – Characterization of individual aerosol particles, in: Physical chemistry of gas-liquid interfaces, edited by: Faust, J. A. and House, J. E., Elsevier, 353–402, https://doi.org/10.1016/B978-0-12-813641-6.00012-1, 2018.
Sullivan, R. C., Boyer-Chelmo, H., Gorkowski, K., and Beydoun, H.: Aerosol optical tweezers elucidate the chemistry, acidity, phase separations, and morphology of atmospheric microdroplets, Acc. Chem. Res., 53, 2498–2509, https://doi.org/10.1021/acs.accounts.0c00407, 2020.
Takeuchi, M., Berkemeier, T., Eris, G., and Ng, N. L.: Non-linear effects of secondary organic aerosol formation and properties in multi-precursor systems, Nat. Commun., 13, 7883, https://doi.org/10.1038/s41467-022-35546-1, 2022.
Veghte, D. P., Altaf, M. B., and Freedman, M. A.: Size dependence of the structure of organic aerosol, J. Am. Chem. Soc., 135, 16046–16049, https://doi.org/10.1021/ja408903g, 2013.
Vennes, B. and Preston, T. C.: Calculating and fitting morphology-dependent resonances of a spherical particle with a concentric spherical shell, J. Opt. Soc. Am. A. Opt. Image. Sci. Vis., 36, 2089–2103, https://doi.org/10.1364/JOSAA.36.002089, 2019.
Zuend, A. and Seinfeld, J. H.: Modeling the gas-particle partitioning of secondary organic aerosol: the importance of liquid-liquid phase separation, Atmos. Chem. Phys., 12, 3857–3882, https://doi.org/10.5194/acp-12-3857-2012, 2012.