the Creative Commons Attribution 4.0 License.
the Creative Commons Attribution 4.0 License.
 | 03 May 2024
Bacteria in clouds biodegrade atmospheric formic and acetic acids
Leslie Nuñez López
Pierre Amato
Formic and acetic acids are major organic species in cloud water and affect precipitation acidity. In atmospheric models, their losses are limited to chemical oxidation in the gas and aqueous phases and deposition processes. Previous lab studies suggest that these acids can be efficiently biodegraded in water by atmospherically relevant bacteria. However, the importance of biodegradation as a loss process in the atmospheric multiphase system has not been fully assessed. We implemented biodegradation as a sink of formic and acetic acids in a detailed atmospheric multiphase chemistry model. In our model, biodegradation is considered in 0.1 % of cloud droplets according to atmospheric bacteria concentrations of 0.1 cm−3. We predict that up to 20 ppt h−1 formic acid and 5 ppt h−1 acetic acid are biodegraded. This translates into a concentration change of 20 % and 3 % in addition to that caused by chemical losses. Our sensitivity studies suggest that acetic acid is most efficiently biodegraded at pH > 5, whereas biodegradation is least efficient for formic acid under such conditions. This trend can be explained by the fact that formic acid partitions more efficiently into the aqueous phase due to its higher Henry's law constant ( M atm−1 vs. M atm−1 at pH = 5). Therefore, under such conditions, formic acid evaporates less efficiently from bacteria-free droplets, resulting in less formic acid in the gas phase for dissolution bacteria-containing droplets to replenish biodegraded acid. Our analysis demonstrates that previous estimates of the importance of atmospheric biodegradation were often biased high as they did not correctly account for such uptake limitation in bacteria-containing droplets. The results suggest that, under specific conditions, biological processes can significantly affect atmospheric composition and concentrations in particular volatile, moderately soluble organics.
- Article
(2687 KB) - Full-text XML
-
Supplement
(16294 KB) - BibTeX
- EndNote


Small monocarboxylic acids have been of particular interest for several decades as they control, to a large extent, the acidity of cloud water, fog, dew and rainwater in regions that are not heavily anthropogenically impacted (Pye et al., 2020). They contribute up to 60 % to the free acidity in remote areas and up to ∼ 30 % in polluted regions (Millet et al., 2015). Recently, it was proposed that the increase in organic particulate matter in continental areas leads to a new chemical regime, in which acid deposition is largely controlled by organic acids, as opposed to the previous dominance by secondary inorganic pollutants (sulfate, nitrate) (Lawrence et al., 2023). Formic and acetic acids, which are the smallest organic acids, are commonly found to be major contributors to the global organic acid budget (Khare et al., 1999; Paulot et al., 2011). Typical mixing ratios range from 0.015 to 40 ppb for formic acid and 0.05 to 16 ppb for acetic acid (Chebbi and Carlier, 1996; Millet et al., 2015). Their direct emission sources include biomass burning, fossil fuel combustion, biogenic sources and land use activities (Khare et al., 1999; Paulot et al., 2011; Gong et al., 2020). Their abundance in regions far from direct emission sources, e.g., in the Arctic, implies their formation in the atmosphere (Mungall et al., 2018). Their chemical sources include the oxidation of isoprene-derived products by ozone or OH in the gas phase (Paulot et al., 2011) and the oxidation of formaldehyde and acetaldehyde by the OH radical in the aqueous phase (Jacob, 1986; Chebbi and Carlier, 1996). Significant fractions (∼ 20 %–90 %) of formic and acetic acids are dissolved in the aqueous phase of clouds, comprising a major fraction of the total dissolved organic carbon (Herckes et al., 2013). Therefore, major losses of atmospheric formic and acetic acids include wet deposition and aqueous phase oxidation. Such source and sink processes are included in atmospheric models of various scales (Paulot et al., 2011). The comparisons of chemical models to observations show generally good agreement on a global scale; however, they often reveal discrepancies on regional scales, possibly pointing to inaccurate emission inventories and/or incomplete chemical mechanisms (Franco et al., 2020).
Recent lab studies suggest that formic and acetic acids are biodegraded by bacteria under atmospherically relevant conditions (Herlihy et al., 1987; Vaïtilingom et al., 2011; Liu et al., 2023). Bacteria comprise a small number fraction of total atmospheric aerosol particles (≪ 1 %), with concentrations on the order of ∼ 103 to 105 cells m; this corresponds to 103 to 105 cells mL at typical cloud liquid water contents (∼ 0.1–1 g m) (Amato et al., 2007). However, to date, biological processes and functions, such as biodegradation, are not included in atmospheric models to describe their potential effects on atmospheric composition or, in turn, the influence of the atmosphere on the aeromicrobiome (Amato et al., 2023). The consideration of bacteria in models is usually limited to their role as ice nuclei (Fröhlich-Nowoisky et al., 2016, and references therein). However, ice nucleation does not necessarily require living, biologically active cells. The atmosphere is considered to be a harsh environment for microorganisms due to extreme and rapidly changing conditions in terms of temperature, pH, water and nutrient availability (Amato et al., 2007). Yet, living bacteria cells are commonly found far from emission sources and have been isolated from cloud and fog water, which suggests that clouds may be “atmospheric oases” for bacteria (Fuzzi et al., 1997; Sattler et al., 2001; Amato et al., 2017; Šantl-Temkiv et al., 2022). Biodegradation is a well-known efficient aerobic loss process for organics in soil where bacteria cell concentrations are on the order of 109 cell cm−3 (Adeleke et al., 2017). Cell concentrations in the atmosphere are much lower (∼ 0.01 cm−3) than in the denser soil that typically has an aerobic layer of ∼ 10 cm. Therefore the atmospheric volume is much larger as compared to the biotic terrestrial and aquatic environments which may result in comparable rates (cell concentration × volume) if one compares losses in different environments (atmosphere vs. soil vs. surface waters).
A first comparison of biodegradation rates to those of chemical processes in clouds was performed based on atmospherically relevant cell concentrations and lab-derived biodegradation rates of organic acids. This comparison suggests that biodegradation might be similarly efficient as OH or NO3 reactions in cloud water (Vaïtilingom et al., 2013; Jaber et al., 2021). However, such processes are not widely included in atmospheric models, mainly due to the lack of comprehensive data sets and appropriate model approaches. Comparing typical number concentrations of cloud droplets (∼ 50–500 cm−3) to those of bacteria cells, it is evident that only a small subset of cloud droplets (∼ 0.01 %–0.1 %) contain a bacteria cell (or possibly a few cells). In the current study, we use a multiphase chemistry model complemented by biodegradation processes to systematically explore the conditions under which biodegradation of formic and acetic acids by bacteria may be a significant sink in addition to chemical losses in the gas and aqueous phases. We investigate the sensitivities to wide ranges of cloud droplet diameters and pH values.
2.1 Model equations
We use a multiphase chemistry box model with detailed gas- and aqueous-phase chemistry, including 58 reactions in the gas phase and 34 in the aqueous phase (Ervens et al., 2014; Khaled et al., 2021). In total, 15 of the 31 chemical species are transferred between the gas and aqueous phases. All parameters for the aqueous-phase reactions and phase transfer processes are listed in Tables S1–S4 in the Supplement. We use the standard equations to describe the multiphase chemistry system:
where LWC is the liquid water content (vol vol−1), KH(eff) is the (effective) Henry's law constant (M atm−1), and R is the constant for ideal gases (0.082 L atm (mol K)−1). All concentrations are expressed in units related to the gas-phase volume (mol g). The terms Saq, Laq, Sg and Lg denote the chemical sources and losses in the aqueous (aq) and gas (g) phases. Lbact refers to the loss rates of formic and acetic acids by the biodegradation that occurs in a subset of droplets. We derived rate constants for biodegradation by converting lab-derived biodegradation rates (mol cell−1 s−1) into kbact (L cell−1 s−1) (Reactions R33 and R34 in Table S1) (Khaled et al., 2021). We use data measured at a temperature of 17 °C for Pseudomonas sp., being a representative genus for commonly abundant atmospheric bacteria (Vaïtilingom et al., 2011). Unlike for chemical reactions, we did not account for temperature-dependent biodegradation rates. The reasoning for this assumption is explored in Sect. 4.2. kbact is multiplied with the (constant) cell concentration of 2 × 10⁸ cells g and the modeled organic acid concentrations to obtain Lbact (mol L−1 s−1). The phase transfer of soluble gases is described by means of the kinetic mass transfer coefficient kmt (Schwartz, 1986; Nathanson et al., 1996):
where rd is the drop radius (cm), Dg is the gas-phase diffusion coefficient (cm2 s−1), α is the dimensionless mass accommodation coefficient, and Mg is the molecular weight (g mol−1).
2.2 Model initialization and simulations
The box model includes a monodisperse drop population with a constant liquid water content of 0.42 g m−3. Simulations are performed at constant temperature (286 K) and air density (1.032 × 10⁻³ g cm−3). Drop diameter Dd, number concentration Nd and pH value are kept constant throughout each simulation. The model is initialized with the mixing ratios summarized in Table S5. All simulations are performed for 1 h. This period reflects multiple cloud cycles for a single particle (e.g., bacteria cell) given the lifetime of droplets on the order of ∼ 10–30 min (Ervens et al., 2008). Simulations are performed for 30 pH values (3 ≤ pH ≤ 6) and 30 drop diameters (1 µm ≤ Dd ≤ 30 µm). Given the constant LWC, the total drop number concentration Nd increases with decreasing Dd:
In the reference set of 900 simulations, no bacteria are considered (Lbact = 0); i.e., all droplets have the same composition. The results are compared to a second set of simulations, in which it is assumed that a small number fraction of the droplets contains bacteria cells (Nd2 = Ncell = 0.1 cm). This concentration is at the upper end of atmospheric bacteria cell concentrations. To quantify the importance of biodegradation for each Dd–pH combination, we define the differences between the total acid concentrations (gas + aqueous) predicted in the two simulation sets as follows:
ΔC represents the absolute difference in predicted total acid concentration (expressed as mixing ratios [ppt]) at the end of the simulation (Fig. 1). Thus, it quantifies the extent to which the total acid concentration is overestimated if biodegradation is not included. Accordingly, the relative difference is
Depending on model conditions (Dd, pH), the two acids show either a net increase or a loss, as schematically shown in Fig. 1. All model parameters are defined in Table A1. Therefore, ΔCrel expresses either the relative extent to which the net increase is reduced or the relative extent to which the net loss is enhanced due to biodegradation under the model conditions.
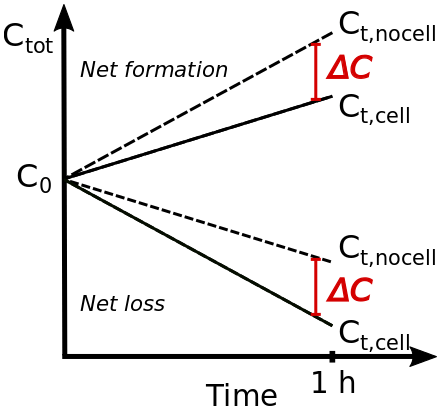
Figure 1Schematic to illustrate the predicted absolute (ΔC) and relative (ΔCrel) differences in predicted total (gas + aqueous) acid concentrations in the absence (Ct,nocell) and presence (Ct,cell) of bacteria cells after 1 h simulation time.
3.1 Absolute and relative differences in predicted acid concentrations – ΔC and ΔCrel
Figure 2 shows the predicted absolute concentration difference ΔC from 900 1 h model simulations as a function of pH value and Dd for formic and acetic acids. The maximum values are ΔCmax ∼ 20 ppt for formic acid (pH = 4.7, Dd = 30 µm) and ΔCmax ∼ 8.5 ppt for acetic acid (pH = 6, Dd = 27 µm). These values correspond to ∼ 4 % of the initial acid mixing ratios of 500 and 200 ppt (Table S5). Both maxima appear at high Dd values but at different pH.
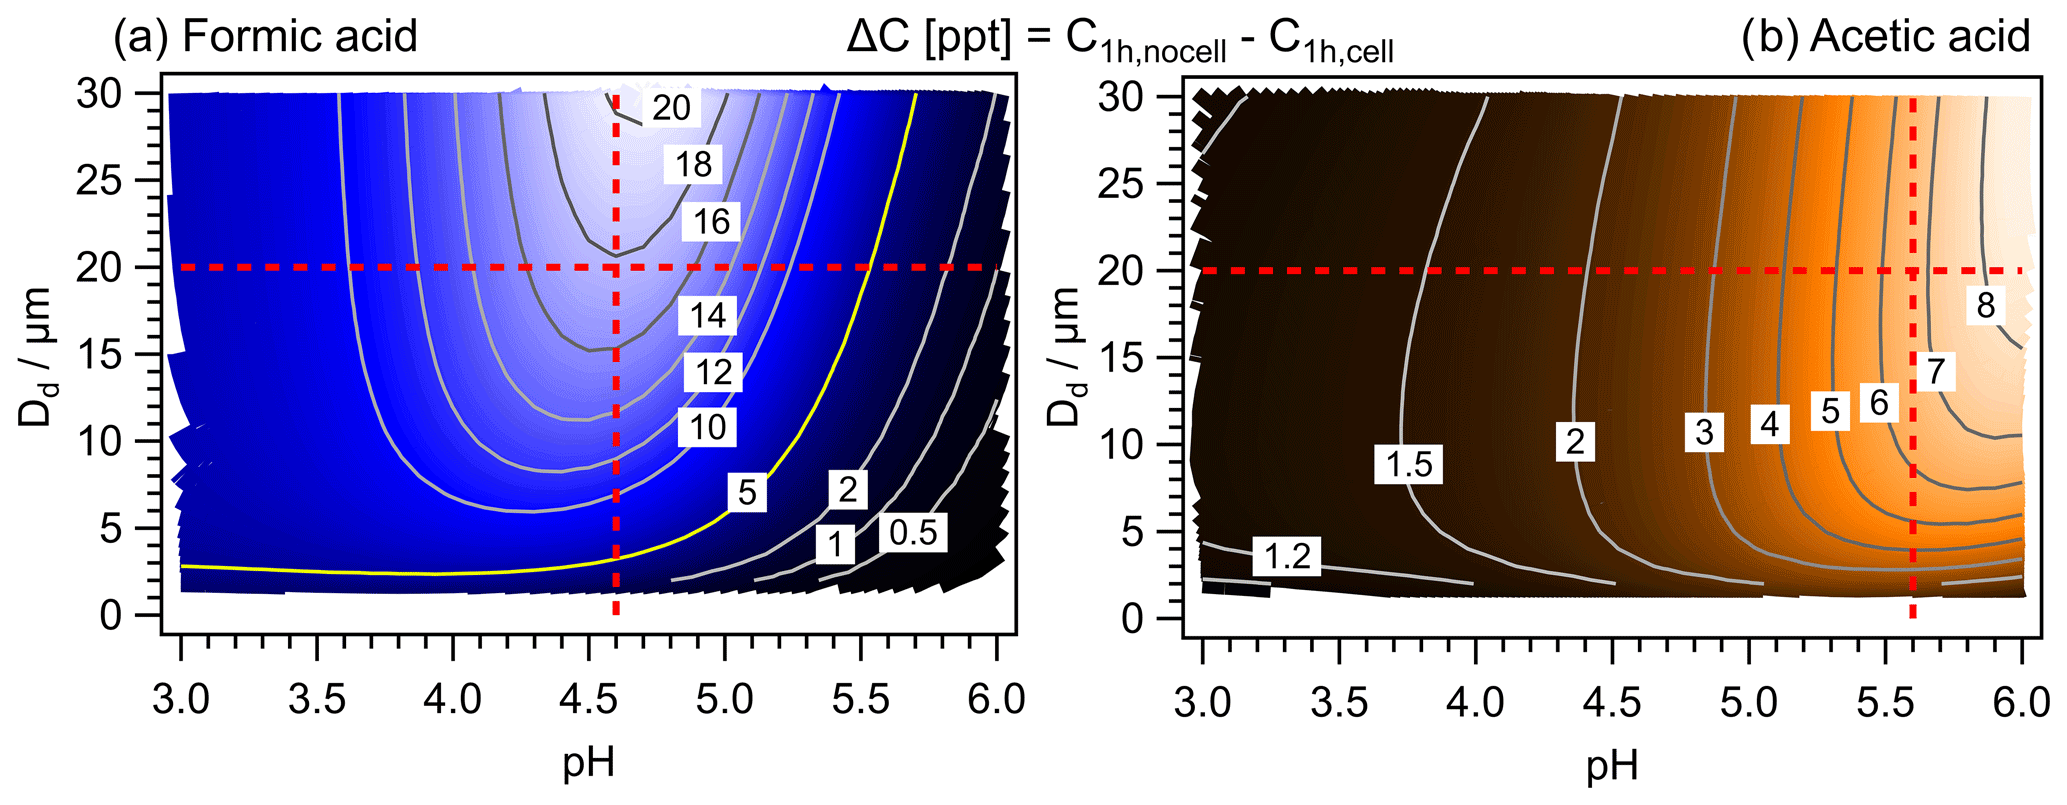
Figure 2Predicted concentration differences (ΔC; Eq. 5) of 900 model simulations for all combinations of 30 pH and 30 Dd values. (a) Formic acid. (b) Acetic acid. The red lines denote conditions that are discussed in detail in Sect. 3.2 and 3.3. The numbers on the contour lines indicate ΔC (in ppt h−1).
The comparison of the mixing ratios (ppt) of the two acids reveals that they show different trends as a function of pH: whereas formic acid is predicted to be highest at the highest pH value (Fig. S1a, b), the opposite trend is seen for acetic acid (Fig. S2a, b). There is a net loss in formic acid at pH ≳ 3.5 (Fig. S1c, d) and a net formation of acetic acid at pH = 6 (Fig. S2c, d), nearly doubling its initial mixing ratio. The resulting relative differences ΔCrel (Eq. 6) are shown in Figs. S1e and S2e. For formic acid, ΔCrel exceeds 100 % at pH ∼ 3.5; however, these values do not seem to be meaningful since the absolute change in acid concentration is very small (< 1 ppt). In less acidic droplets, ΔCrel for formic acid decreases from ∼ 50 % (pH ∼ 4) to < 1 % at pH > 5.5. The corresponding values for acetic acid show a continuous increase with increasing pH, resulting in = 2.8 % at pH ∼ 6 (Fig. S2e).
For both acids, biodegradation might lead to decreases in total concentrations on the order of ∼ 4 % h−1. This corresponds to an enhancement of the formic acid loss rate by up to 20 % as compared to chemical losses alone. The net formation rate of acetic acid is reduced by up to 8 % under the model conditions. In other words, the formic acid loss by chemical processes of ∼ 300 ppt (pH = 5.5) is enhanced to 360 ppt due to biodegradation. Acetic acid is predicted to increase by ∼ 80 ppt h−1 due to chemical processes (at pH = 5.5); this net increase is reduced to 66 ppt h−1 in the presence of bacteria cells. These numbers or trends may increase or decrease in different chemical regimes or may possibly depend on the details of the chemical mechanism; however, the dependence on Dd and pH is likely to be robust. In the following, it will be explored why the two acids show differences in the dependency of their biodegradation efficiency on pH and Dd.
3.2 Dependence of ΔC on Dd
Both ΔC and ΔCrel show the highest values at the largest Dd. To more clearly illustrate this trend, Fig. 3a repeats ΔC as a function of Dd, as seen along the vertical red lines in Fig. 2, at a single pH (pH = 4.6 for formic acid, pH = 5.6 for acetic acid). The drop size dependence of chemical reactions with organics in the atmospheric multiphase system has been discussed previously. It was demonstrated that organic oxidation tends to be more efficient in small droplets due to higher OH uptake rates (kmt ∝ ) and resulting enhanced OH(aq) concentrations (Ervens et al., 2014; Chakraborty et al., 2016). Biodegradation apparently shows the opposite trend, i.e., higher efficiency in large droplets (Fig. 3a). If OH(aq) were significantly smaller in large droplets, less acid may be oxidized there, leaving higher acid concentrations for biodegradation. However, neither the acid concentration nor the OH(aq) concentration shows any clear trend with drop size (Fig. 3b). Therefore, we conclude that uptake limitation of the reactants into the droplets and competition effects between chemical and biodegradation processes cannot be the main reason for the ΔC dependence on Dd.

Figure 3Dependence of (a) ΔC of formic acid (pH = 4.6) and acetic acid (pH = 5.6) on the droplet diameter Dd; (b) aqueous-phase concentrations of formic acid (pH = 4.6) and acetic acid (pH = 5.6) (left scale) and the OH radical (right scale) as a function of Dd; and (c) the percentage of bacteria-containing droplets FNCell for LWC = 0.42 g m−3, with NCell = 0.1 cm−3 as a function of Dd. All values were derived from simulations after 1 h simulation time.
A change in Dd leads to a change in the total droplet number concentration Nd since we assume a constant LWC. The number concentration of bacteria cells (Ncell = 0.1 cm−3) does not change in our simulations. This implies that the fraction of bacteria-containing droplets (FNCell) to the total drop number concentration Nd changes with Dd according to
FNCell can vary largely depending on conditions and on the aerosol size range that is considered. It may be as high as several percent if Ntot is assumed to constitute only super-micron particles in dust storms (Hu et al., 2020) or in the upper troposphere (DeLeon-Rodriguez et al., 2013). If the total particle size range is taken into account (D > 10 nm), the fraction can be calculated as being < 0.001 %, e.g., for conditions that are typical at the Puy de Dôme station (Ntot,average ∼ 2000 cm−3 for Dparticle > 10 nm and 104 ≤ Ncell ≤ 105; Baray et al., 2020). In a coniferous forest, the fraction of bioaerosol particles (including bacteria but also other microbes) to total particles in ambient aerosol populations has been found to be in the range of 0.1 %–0.5 % for super-micron particles (Petersson Sjögren et al., 2023).
Accordingly, Fig. 3c shows that FNCell spans several orders of magnitude from ∼ 10−4 % to ∼ 0.3 %. Thus, when droplets are large, biodegradation occurs in a relatively larger fraction of the aqueous phase, with more acid being directly accessible for the bacteria. This relationship can explain the trend of an increase in ΔC by a factor of ∼ 7 (3 ppt ≤ ΔC ≤ 20 ppt) for formic acid and by a factor of ∼ 3 (2 ppt ≤ ΔC ≤ 6 ppt) for acetic acid (Fig. 3a). It is not expected that the increase in ΔC is as strong as that for FNCell since the complex interactions of chemical and phase transfer processes within the multiphase system do not necessarily translate into linear relationships between loss rates and reaction volume (Sect. 3.5). A similar increase with Dd as for ΔC is also seen for ΔCrel (Figs. S1e and S2e), in particular for relatively small Dd (≲ 10 µm). Based on the ΔCrel values, it may be concluded that a fraction of ∼ 0.01 % bacteria-containing cloud droplets may be sufficient to impact the total acid concentrations by several percentage points. The assumptions of a constant bacteria concentration and varying drop number concentration may represent very specific conditions. Often, the drop number concentration is a function of the total particle concentration. Under highly polluted conditions, the bacteria concentration scales with the particle number concentration of PM2.5 or PM10 (Gao et al., 2016; Zhai et al., 2018), which may ultimately lead to similar FNCell, but the specific trend will depend on the air mass composition. An increase in Ncell may lead to a nearly linear increase in biodegraded mass (Khaled et al., 2021).
3.3 Dependence of ΔC on pH value
Similarly to the analysis in the previous section, Fig. 4a shows the ΔC values, as seen along the red horizontal lines in Fig. 2, i.e., the pH dependence at Dd = 20 µm. Most strikingly, the ΔC trends with pH for the two acids are different, with a maximum at pH ∼ 4.6 for formic acid and a continuous increase over the full pH range for acetic acid. ΔC of formic acid spans a range of ∼ 1 to ∼ 17 ppt, while this is smaller for acetic acid with 1 ppt < ΔC < 7 ppt. The biodegradation rates themselves are assumed to be pH-independent due to intracellular buffering, in agreement with lab studies that showed only small variations in biodegradation rates for cloud-relevant pH ranges (Liu et al., 2023; Vaïtilingom et al., 2011). The biodegradation rate constants of the two acids differ by less than a factor of 2 (Table S1); therefore, it seems unlikely that they cause a significant difference in the general trends of ΔCrel with any parameter. Thus, differences in the (physico)chemical properties of the carboxylic acids may be rather responsible for the trends. Rate constants of OH reactions with undissociated acids kRCOOH are usually smaller than those of the corresponding carboxylates kRCOO due to a shift in the mechanism from H abstraction to electron transfer (Herrmann, 2003). The overall rate constant is a combination of the two rate constants and the proportions of the undissociated acid χRCOOH and the carboxylate (1−χRCOOH) as a function of pH:
where kROO refers to the rate constants of Reactions (R21) and (R30), kROOH refers to those of Reactions (R22) and (R29) (Table S1), and χRCOOH is dependent on the acid dissociation constant Ka.
As seen in the above, kOH,tot is shown for both acids as a function of pH in Fig. 4b. The dotted lines in the figure (right axis) illustrate the relative increase normalized to the smallest kOH,tot at pH = 3. This comparison demonstrates that both rate constants increase by a factor of ∼ 5.5 over the pH range between 3 and 6. A high kOH,tot at high pH implies that more acid is chemically degraded, reducing the acid concentration available for biodegradation. This would be opposite to the predicted ΔC trend with pH for acetic acid and could only explain ΔC values above pH ∼ 4.6 for formic acid. Thus, the competition between the pH-dependent chemical rate and the biodegradation cannot be the main reason for the apparent pH dependence of ΔC.

Figure 4The pH dependencies of (a) the predicted concentration difference in the absence and presence of bacteria cells (ΔC). (b) The total rate constant for the oxidation of formic and acetic acids according to Eq. (8). (c) Effective Henry's law constant.
The second pH-dependent parameter that may affect conversion rates in the aqueous phase is the effective Henry's law constant KH,eff, the ratio between the total aqueous-phase concentration (undissociated acid and carboxylate) and its gas-phase partial pressure at thermodynamic equilibrium:
KH is the physical Henry's law constant (M atm−1). The increase in KH,eff with pH is approximately 1 order of magnitude higher for formic acid than for acetic acid (Fig. 4c). Therefore, it can be expected that, under equilibrium conditions, more formic acid is available for biodegradation, leading to a higher ΔC with increasing pH. The fact that either pH-dependent parameter kOH,tot or KH,eff can explain some range of the Δ values in Sect. 3.3 suggests that a combination of the aqueous-phase partitioning and reactivity leads to the differences in the trends shown in Fig. 2.
3.4 Dependence of ΔC on the gas–aqueous-phase partitioning
The fraction of a compound in the aqueous phase can be defined as
when aqueous- and gas-phase concentrations (Caq,g and Cg) are given in identical units (e.g., mol g). Aqueous-phase concentrations of Caq (typically given in units of mol L) can be converted by
At equilibrium conditions (eq), the aqueous-phase concentration is
The values for ϵaq at thermodynamic equilibrium () are shown in Fig. 5a, overlaid with the ΔC values from Fig. 4a (dotted lines). It is evident that the decrease in ΔC for formic acid occurs when more than 50 % of formic acid is predicted to be in the aqueous phase under equilibrium conditions. The threshold of = 0.5 is not reached for acetic acid due to its significantly smaller effective Henry's law constant (smaller Ka, Table S2), and ΔC continues to increase with pH.
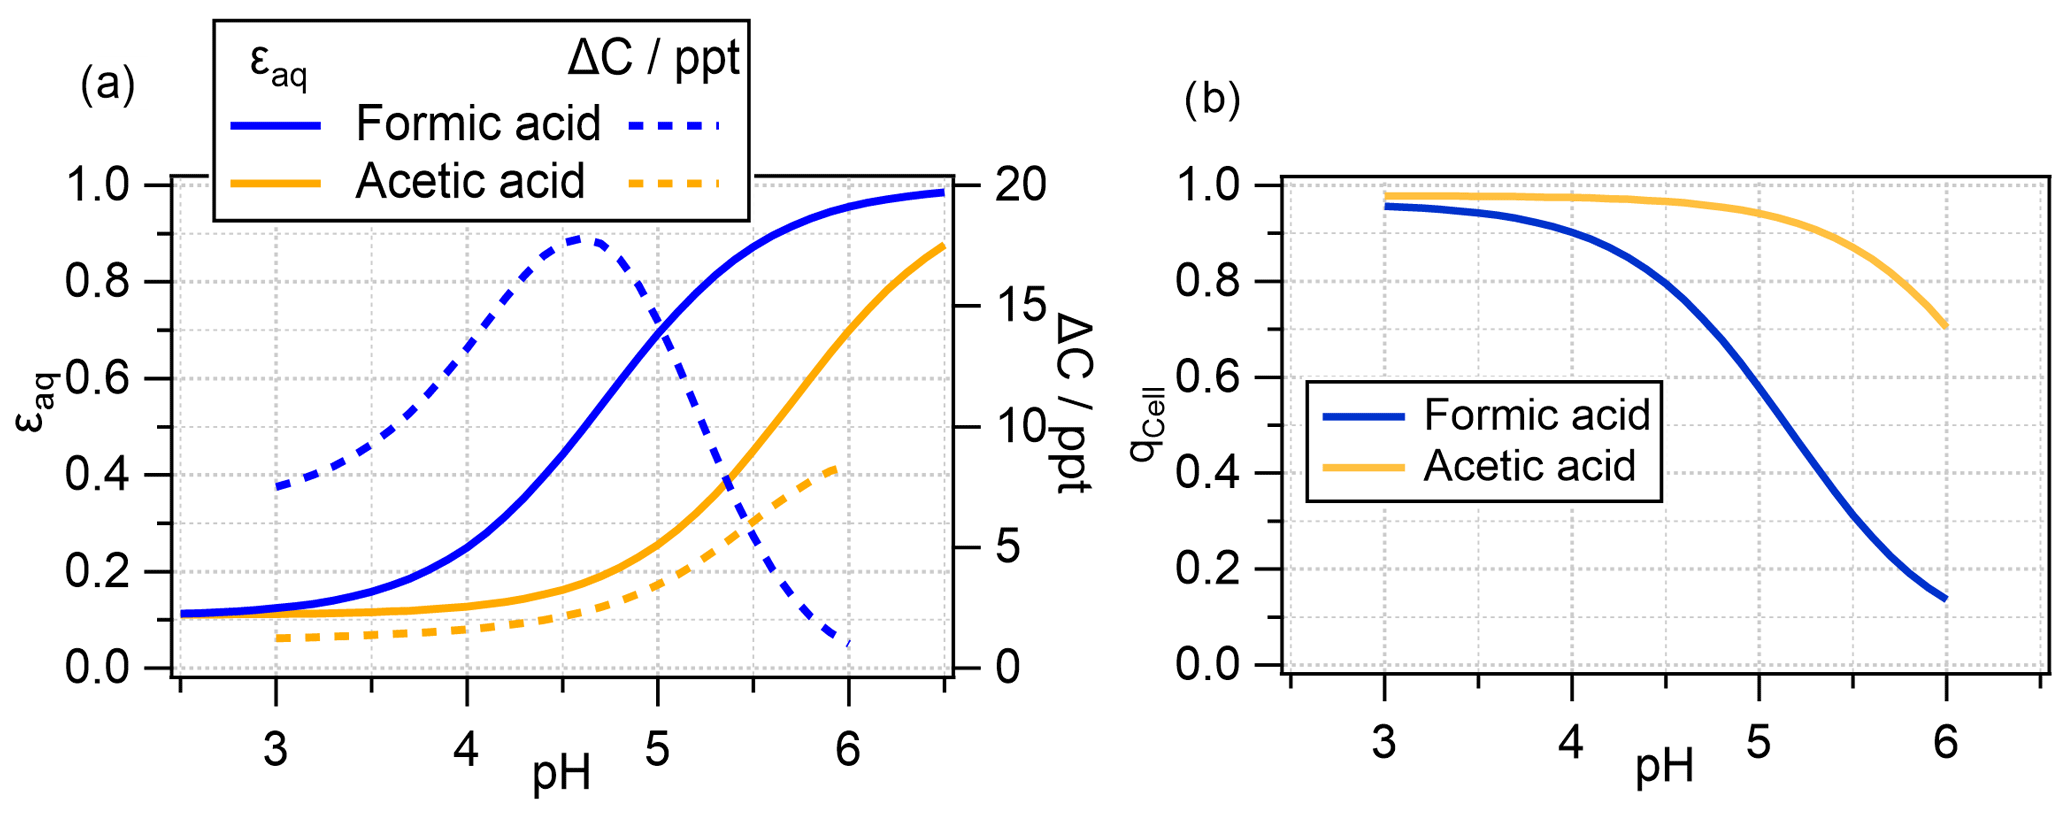
Figure 5(a) Aqueous-phase fraction of total formic and acetic acids (undissociated and dissociated) at thermodynamic equilibrium; (b) deviation from thermodynamic equilibrium in the bacteria-containing droplets (Dd = 20 µm; 1 h simulation) (Eq. 14); the corresponding q values for bacteria-free droplets are not shown as they are at unity, i.e., indicating thermodynamic equilibrium.
The assumption of equilibrium conditions may not be always valid. Species that are very reactive in the aqueous phase are more efficiently consumed than they may be replenished by uptake. To quantify deviations from thermodynamic equilibrium, a parameter q can be used to represent the ratio of the equilibrium concentration to measured or modeled aqueous-phase concentrations (Ervens, 2015; Barth et al., 2021):
where pg corresponds to the gas-phase partial pressure (atm). The resulting values for the bacteria-containing drop class qCell are shown in Fig. 5b. It is evident that the acids in the bacteria-containing droplets are in equilibrium at pH = 3 but are increasingly subsaturated at higher pH. At pH = 5.6, the formic acid concentration is only about 30 % of the equilibrium concentration (qCell = 0.3), whereas it is nearly 90 % for acetic acid. This suggests that, at high pH, relatively little formic acid is available for biodegradation, resulting in low ΔC values. The higher qCell value for acetic acid implies that it is closer to equilibrium; therefore, ΔC values correlate approximately with KH,eff.
These qCell trends apparently contradict findings from previous measurements or model studies that have often shown that not only formic and acetic acids are in thermodynamic equilibrium in clouds or fog – this is also the case for other small organics (Winiwarter et al., 1994; Voisin et al., 2000; Facchini et al., 1992; Ervens, 2015). However, it should be kept in mind that the bacteria-containing droplets only comprise 0.1 % of all droplets (if Dd = 20 µm, Fig. 3c). Such a small deviation would not be detected in measurements of bulk cloud water or in models that treat the aqueous volume as a homogeneously composed aqueous phase. In fact, the corresponding predicted q values for the bacteria-free droplets are all at unity over the full pH range (not shown).
3.5 Redistribution of acids between the gas phase and droplets
The previous sections point to the competition of the biodegradation with chemical loss processes but also with the phase transfer to replenish biodegraded acids. To quantify these effects, we compare in the following the individual process rates for the two acids at different pH values. Figure 6a shows a schematic of all processes considered in the model (Eqs. 1 and 2). In Fig. 6b–d, the relative rates for all processes are shown (at pH values of 3, 4.6 and 5.6), normalized to the biodegradation rate Lbact (in units of mol g s−1). Accordingly, the biodegradation rate is indicated as being at unity. The units are used as they reflect the differences of the liquid water contents of the two drop classes (999 : 1). The absolute values for Lbact are shown in the last column at the bottom of each panel, together with the aqueous-phase concentrations (in mol L) of the acids and the OH radical. The rates for all processes are summarized in Table S6 (in units of mol g s−1 and mol L s−1).
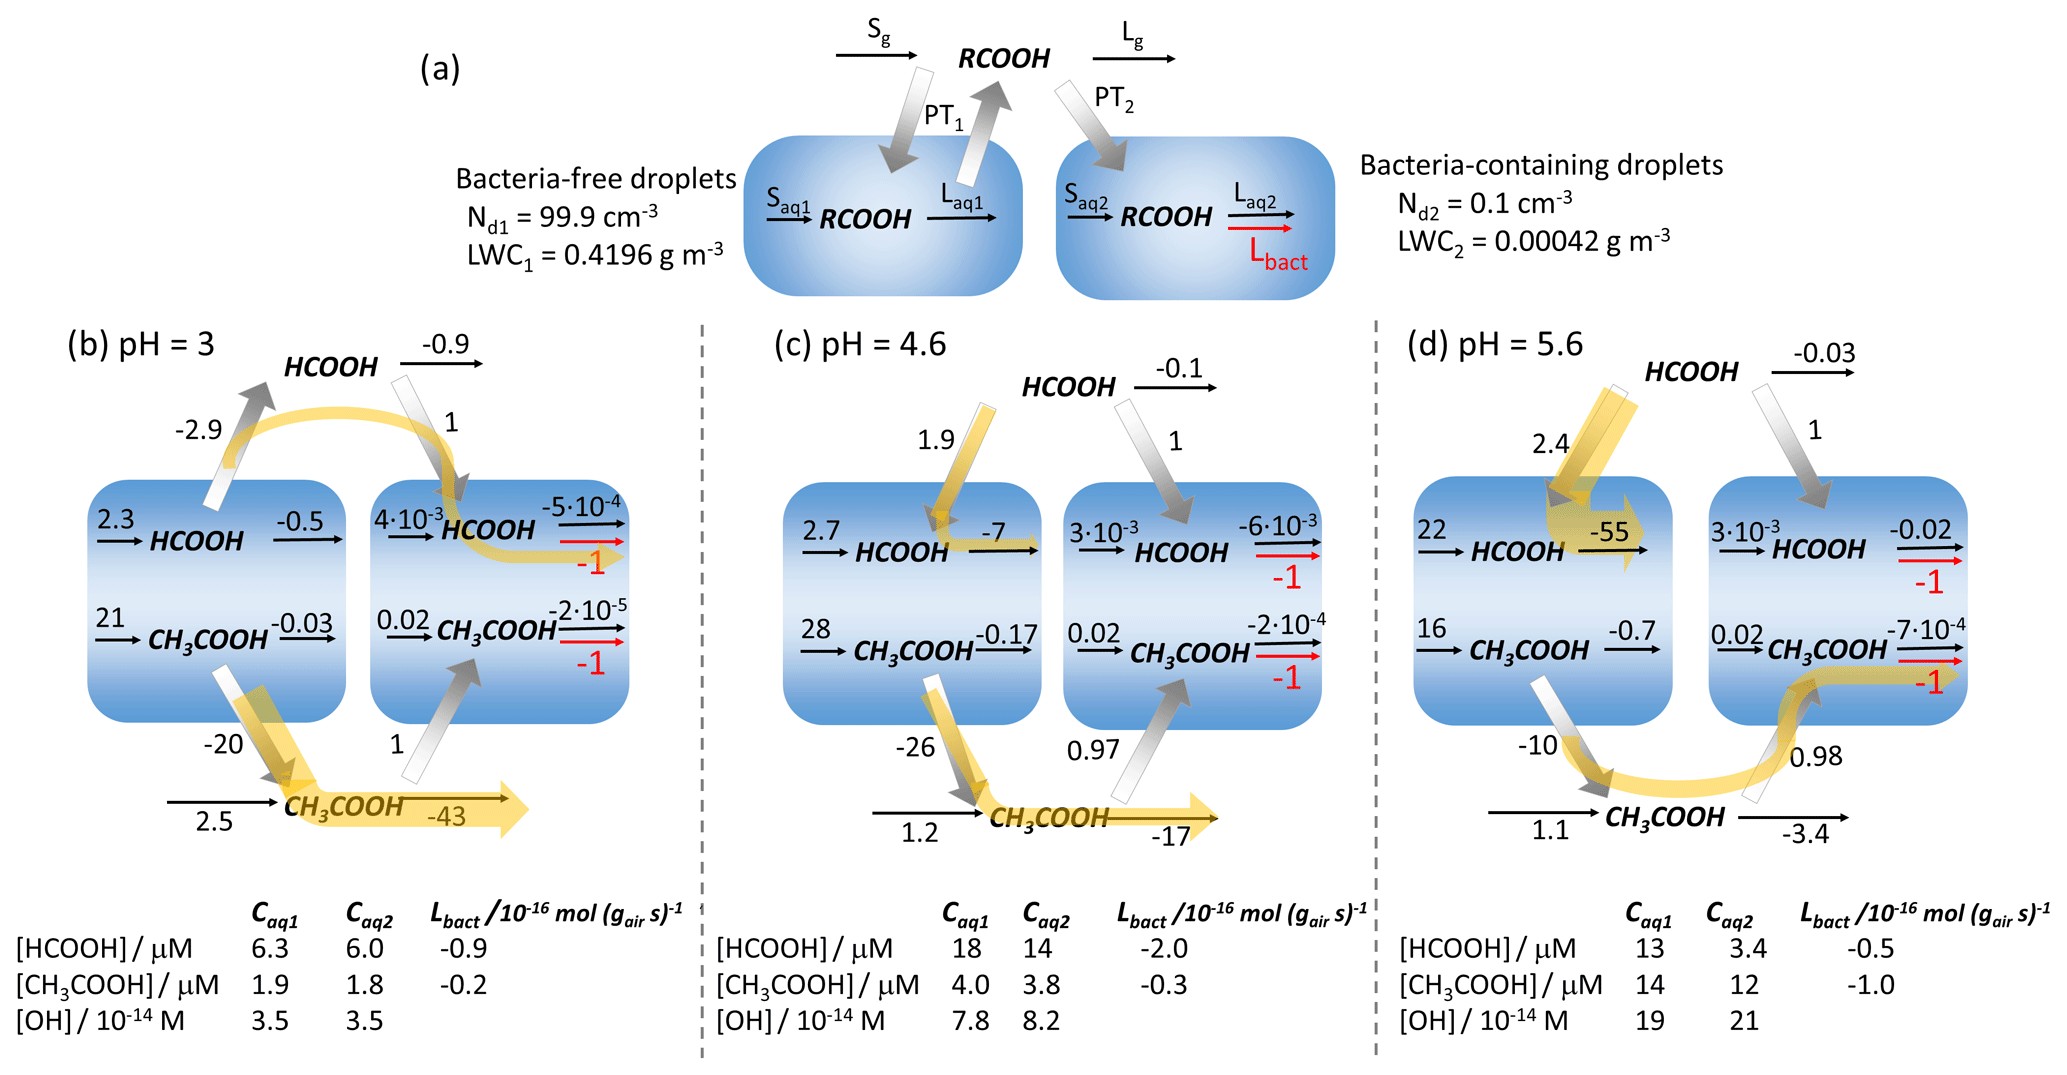
Figure 6(a) Schematic of the chemical sources (S) and losses (L), biodegradation (Lbact), and phase transfers (PT) of acids in the gas (g) and aqueous (aq) phases. (b–d) Numbers next to the arrows denote the relative rates, normalized to the biodegradation rate Lbact (mol g s−1); (b) pH = 3; (c) pH = 4.6; (d) pH = 5.6. Yellow arrows indicate the series of processes that explain the pH dependencies of ΔC and ΔCrel for formic and acetic acids. The tables at the bottom show the aqueous-phase concentrations of the acids and the OH radical, together with the absolute value of Lbact (10−16 mol g s−1). All results are for 1 h model simulations – Dd = 20 µm.
At pH = 3, both acids evaporate from the bacteria-free droplets and are taken up by the bacteria-containing droplets. All chemical loss rates for formic acid are less than unity; i.e., the biodegradation represents the strongest sink in the full multiphase system even though it only occurs in 0.1 % of the aqueous-phase volume. The lack of efficient chemical sinks for formic explains the high ΔCrel at low pH (Fig. S1e). However, at this pH, the chemical loss of formic acid is negligible since the oxidation in the gas phase (Rg3, Table S4) is relatively slow; in addition, the oxidation in the aqueous phase is not efficient due to low KH,eff and kOH,tot. The aqueous-phase concentrations in the two drop classes do not differ, which suggests that the biodegradation – though relatively efficient – does not significantly affect the absolute concentration. This explains the small ΔC values at low pH (Fig. 2a). This is also reflected in the identical rates within the aqueous phase if expressed in units of mol L s−1 (bottom part of Table S6), which would be expected in a system where all droplets are considered to be identical.
The rate constant of the gas-phase loss of acetic acid is 1 order of magnitude higher than that of formic acid (Rg4, Table S4). This leads to efficient acetic acid loss in the gas phase, exceeding by far (factor 43) the rates of the uptake into the bacteria-containing droplets and the subsequent biodegradation. This results in low values of ΔCrel (Fig. S2e). Similarly to formic acid, the chemical rates in the bacteria-containing droplets are not affected by biodegradation; i.e., the total amount of biodegraded acetic acid is very small (low ΔC). The yellow arrows in Fig. 6b illustrate the major pathways of the two acids that explain the similarities in ΔC due to the sequence of evaporation, uptake and biodegradation and the differences in terms of loss processes resulting in differences in ΔCrel.
At pH = 4.6, the effective Henry's law constants for formic and acetic acid are higher by factors of ∼ 10 and ∼ 2 as compared to pH = 3 (Fig. 4c). The increased aqueous-phase partitioning leads to higher phase transfer rates into the droplets. Also, the rate constants for the aqueous-phase loss kOH,tot are higher by factors of 5 and 3 for formic and acetic acids, respectively (Fig. 4b). This increased aqueous-phase loss leads to a fast consumption and phase transfer of formic acid in all droplets. Most formic acid is taken up by the bacteria-free droplets and consumed there (yellow arrow). However, only about two-thirds of formic acid (PT1 PT2 = 1.9 1) is taken up into bacteria-free droplets, whereas one-third is transferred into the bacteria-containing droplets even though they only comprise 0.1 % of the total aqueous phase. The chemical loss rate of formic acid is only 7 times higher than the loss by biodegradation ( = 7) despite the much smaller drop volume. The higher partitioning allows more formic acid to be biodegraded (high ΔC), but its contribution relative to the chemical losses is smaller than at low pH (low ΔCrel). For acetic acid, the increases in kOH,tot and KH,eff are not sufficient to compete with its strong gas-phase sink and to shift the direction of the major pathways towards predominating uptake into bacteria-free droplets. Thus, the rate pattern does not change significantly as compared to the lower pH and only results in small increases in both ΔC and ΔCrel.
At pH = 5.6, ∼ 90 % of formic acid is expected to partition to the aqueous phase under equilibrium conditions (Fig. 5a). However, the concentration in bacteria-containing droplets is only ∼ 30 % of this value (Fig. 5b). The efficient uptake into the bacteria-free droplets and the consumption there dominate the sinks ( = 55). This leads to even less efficient replenishment of biodegraded acid in the bacteria-containing droplets so that the formic acid concentrations between the droplet classes differ by a factor of ∼ 4 (Caq1 = 13 µM, Caq2 = 3.4 µM). In a previous model study, even higher concentration differences in bacteria-free and bacteria-containing droplets were predicted (Khaled et al., 2021). This led to the conclusion that biodegradation for highly soluble compounds may be inefficient. However, this latter study did not include aqueous-phase formation processes (Saq) to provide a continuous acid source (e.g., for formic acid: Reactions R7 and R9 in Table S1). For acetic acid, gas-phase loss becomes relatively less important with increasing KH,eff and kOH,tot. Instead, the fraction of acetic acid being taken up into the bacteria-containing droplets increases, increasing both ΔC and ΔCrel. Unlike formic acid that is only formed in the aqueous phase, formation of acetic acid also takes place in the gas phase (Rg1, Rg2, Table S4) in addition to its aqueous-phase sources (Reactions R17–R19, Table S1). The efficient net production of acetic acid leads to significantly higher total acetic acid concentrations as compared to those for formic acid, resulting in more acetic acid being degraded at high pH (higher ΔC, Fig. 2).
4.1 Comparison to previous estimates of the importance of biodegradation in the atmosphere: Fbact,aq and Fbact
4.1.1 Estimates based on the comparison of measured chemical and biodegradation rates
The importance of biodegradation has been compared to chemical loss processes in the atmospheric multiphase system in several previous studies. Most of these comparisons limited the comparison to losses in the aqueous phase:
Only a few studies extended the comparison to gas-phase losses to consider the full atmospheric multiphase system:
Table 1 summarizes Fbact,aq and Fbact values based on literature data for formic and acetic acids and other organics, together with the assumptions made in these comparisons. Most values are based on comparisons of lab-derived biodegradation rates Lbact and chemical rates with the OH radical in aqueous solution (“bulk Laq,tot”) (Vaïtilingom et al., 2010, 2011, 2013; Ariya et al., 2002; Liu et al., 2023). Herlihy et al. (1987) reported biodegradation rates of formic and acetic acid observed in incubated rainwater. To derive Fbact,aq, we calculated Laq assuming [OH(aq)] = 10−13 M and kOH at pH = 4.6. Similarly, Ariya et al. (2002) compared Laq to biodegradation rates that were estimated after exposing solutions of carboxylic acids to atmospheric fungi in ambient air. Predicted values of Fbact,aq for formic acid differ between < 0.004 % and 66 %. According to our discussion in Sect. 3.5, the lowest value (≤ 2 %) is expected at pH < 5.6. Only the study by Pailler et al. (2023) was performed at such high pH and resulted in a much higher value (Fbact,aq ∼ 28 %). Their bulk model (where biodegradation occurs in all cloud droplets) cannot represent the redistribution of acids that leads to a reduced Lbact at high Laq and KH,eff (Fig. 6d and Sect. 4.1.2). Therefore, their model overestimates losses by biodegradation for highly soluble species (e.g., formic acid at high pH), as also discussed previously by Khaled et al. (2021). Instead of drop classes with significant differences in acid concentration due to biodegradation, as shown in Fig. 6d, such a bulk model predicts relatively high acid concentrations in all droplets (similarly to those as predicted for bacteria-free droplets in the current simulations). In such a bulk approach, substrate-limited conditions may not even be reached where biodegradation efficiency becomes negligible below some threshold of substrate (acid) concentration.
Table 1Literature data on the relative importance of biodegradation as compared to chemical processes of organic compounds in the atmospheric aqueous-phase Fbact,aq (Eq. 15) and Fbact (Eq. 16).
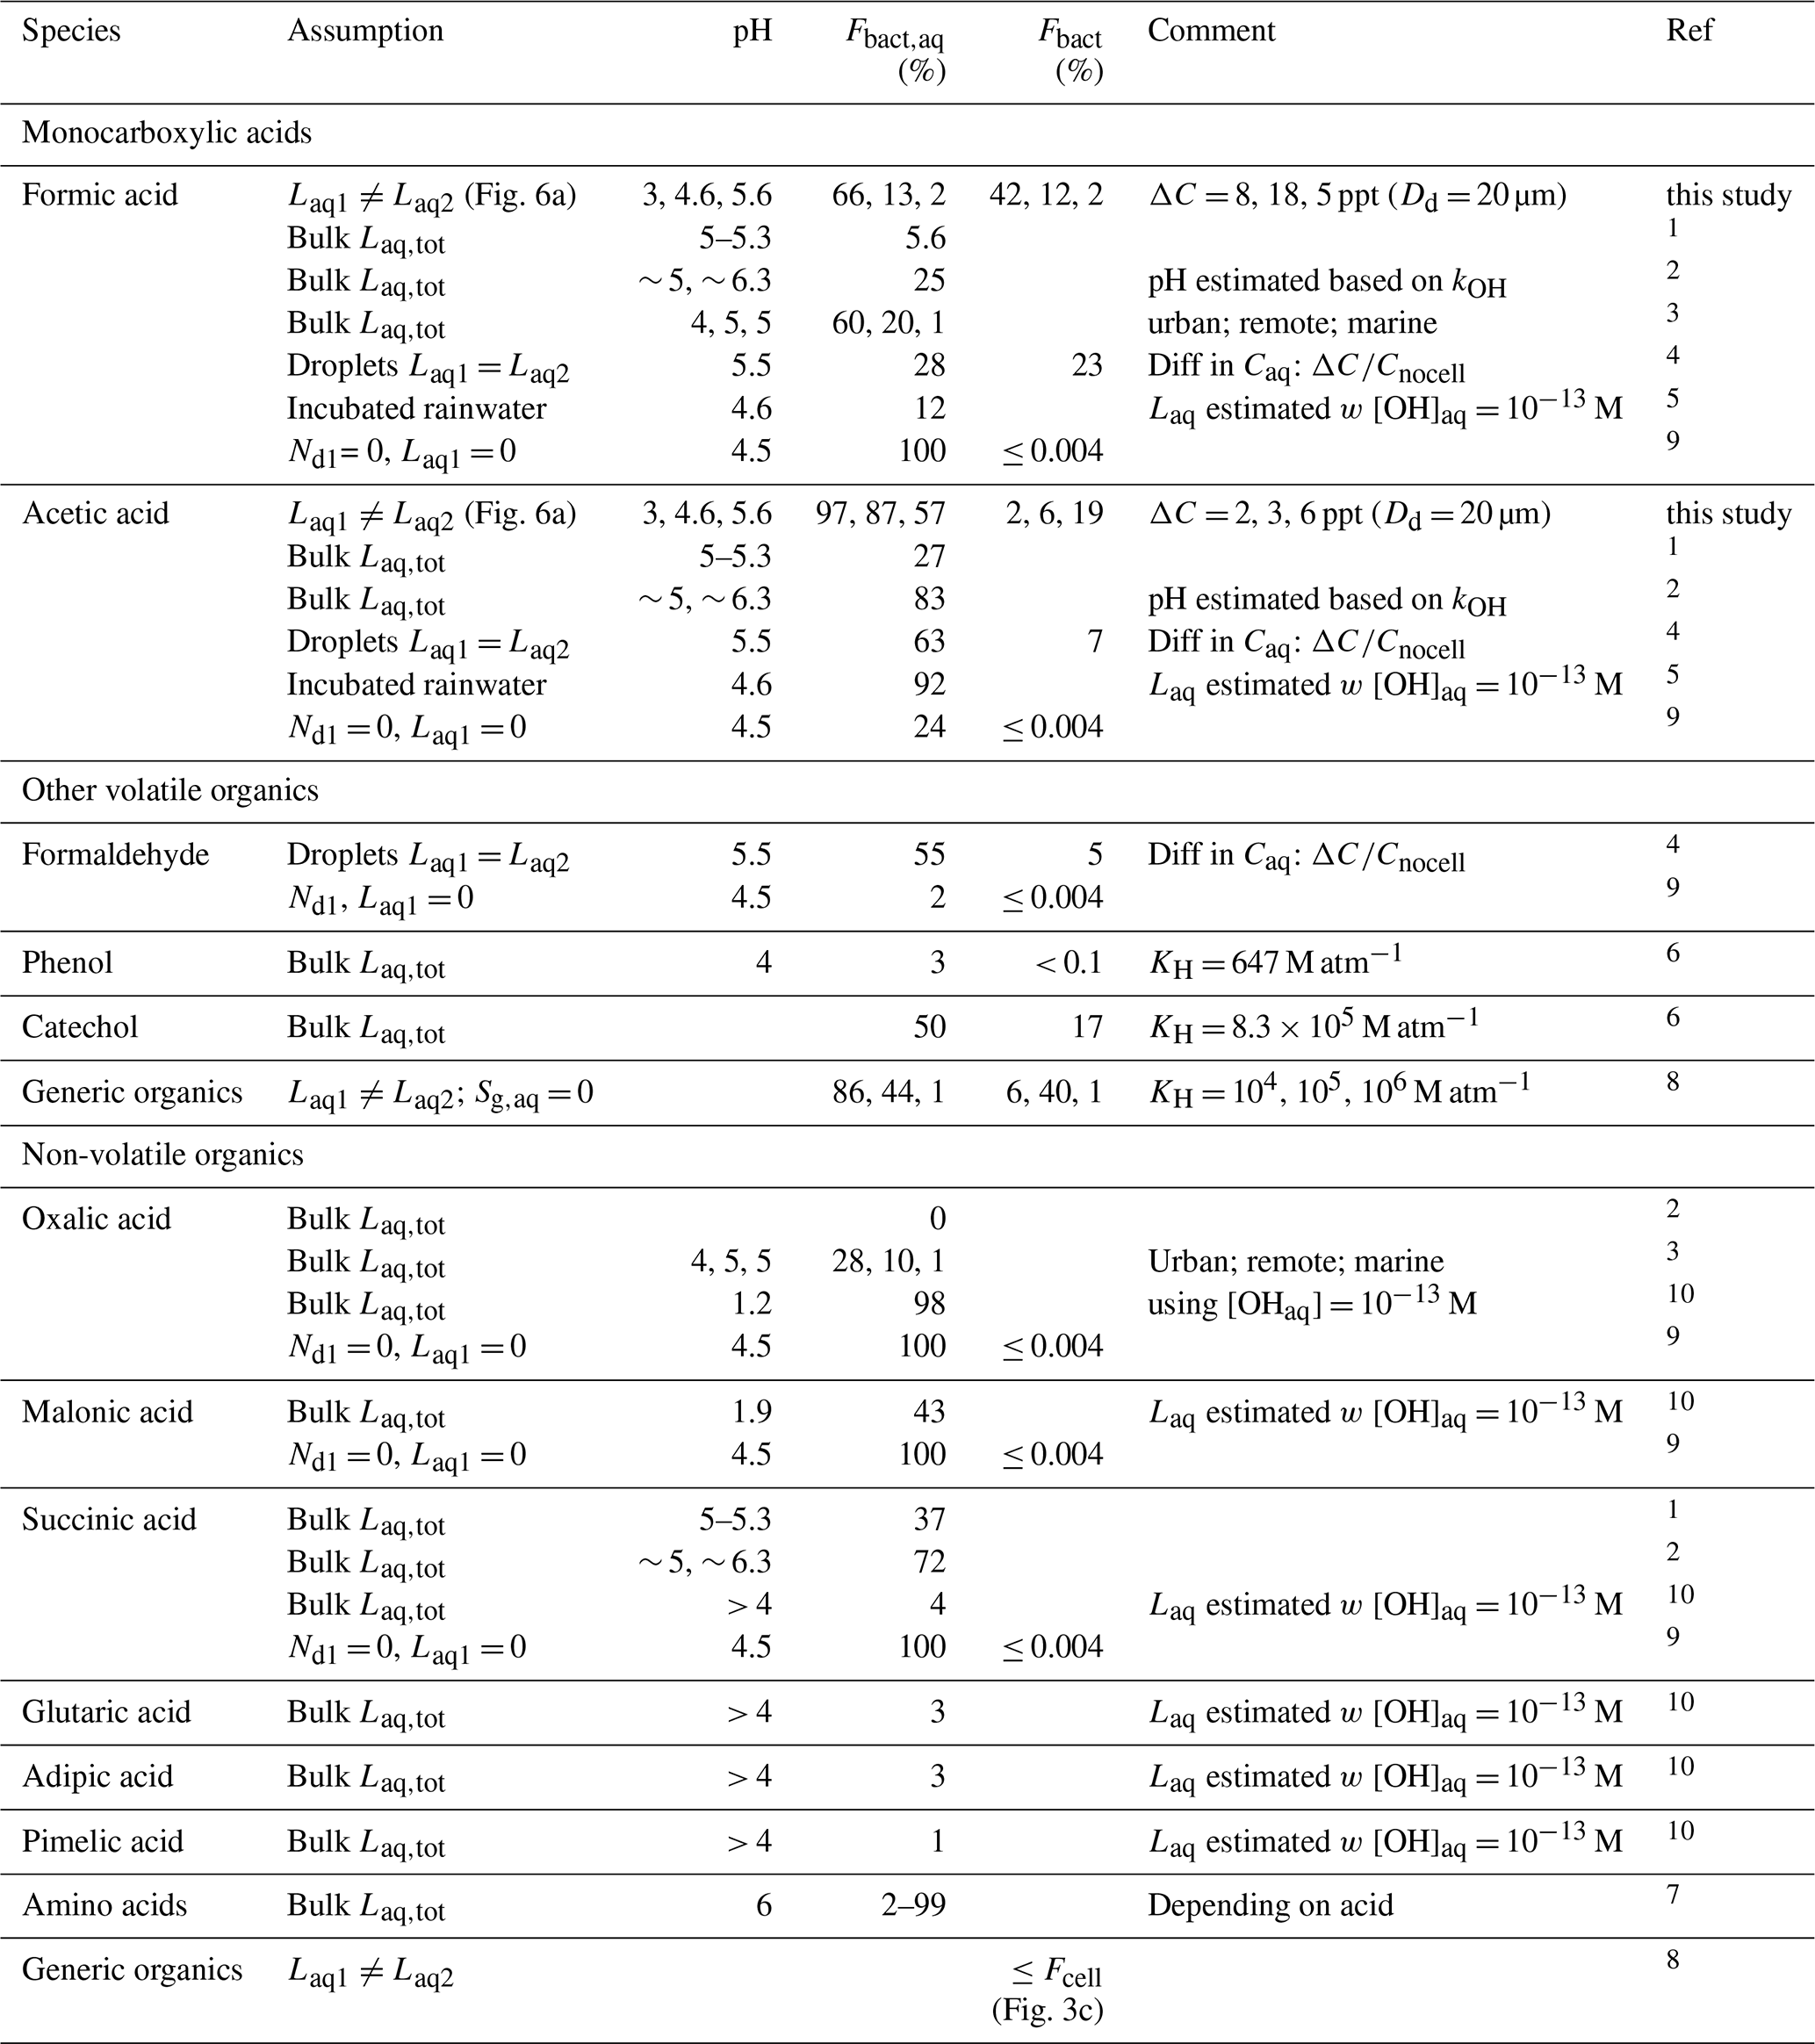
1 Vaïtilingom et al. (2010) – P. graminis; 2 Vaïtilingom et al. (2011); 3 Liu et al. (2023); 4 we compare to the conditions as defined by “summer” in Pailler et al. (2023) since our [OH]aq in Fig. 6d is most similar to these conditions; 5 Herlihy et al. (1987); 6 Jaber et al. (2020); 7 Jaber et al. (2021); 8 Khaled et al. (2021) – s−1, Rbact = 10−3 s−1, Raq= 10−3 s−1; 9 Fankhauser et al. (2019); 10 Ariya et al. (2002).
Liu et al. (2023) predict decreasing Fbact,aq with pH for formic acid. However, the agreement of this trend with our results in Fig. 6 seems fortuitous. In their study, the pH value is considered to be a proxy for pollution level (urban, remote, marine); thus, not only the pH value changed between scenarios – this is also the case for oxidant levels and bacteria concentrations. All other values for Fbact,aq in Table 1 that were determined for pH ≤ 5 agree approximately with those found in the current study. As discussed in Sect. 3.5, under such conditions, the composition of the aqueous phase is not largely affected by biodegradation; therefore, the assumption of a bulk aqueous phase is applicable for species with chemical reactivity comparable to that of formic acid. Similarly, literature values of Fbact,aq for acetic acid are in agreement with those found in the current study. Small differences between the values are expected since different bacteria species and strains were used in the various experiments. The KH of phenol is even smaller than that of formic acid and acetic acid at pH = 3. Therefore, its Fbact,aq estimated by Jaber et al. (2020) is likely a good approximation. However, given the much higher KH of catechol (comparable to KH,eff of formic acid at pH = 5.6), we conclude that their estimate of Fbact(aq) may be too high. Only a few studies provided values of Fbact. The Fbact values predicted by Fankhauser et al. (2019) (≤ 0.004 %) are orders of magnitude lower than our results (2 %–42 % for formic acid, 2 %–19 % for acetic acid). Their value is based on the assumption that only organics present in bacteria-containing droplets are biodegraded, and they estimate that 0.004 % of the atmospheric aqueous volume contains bacteria (Dd = 10 µm). However, these considerations neglect the sequence of processes as discussed in Sect. 3.5.
4.1.2 Implementation of organic acid biodegradation into multiphase chemistry models
The few studies that implemented biodegradation of organic acids into multiphase chemistry models applied different assumptions:
-
The model approach by Khaled et al. (2021) is similar to the current model. The only difference is that they focused on the comparison of loss processes of generic organics over wide ranges of chemical and biodegradation rates and solubility but without any chemical sources.
-
Fankhauser et al. (2019) considered only bacteria-containing droplets, i.e., a total LWC that is several orders of magnitude smaller than in real clouds (Nd1 = 0). Thus, the reactor volume for aqueous-phase chemical reactions is small.
-
Pailler et al. (2023) used a multiphase box model with similar LWC and drop sizes as in the current model. They assumed that biodegradation occurs in all droplets in an analogy to chemical reactions. They used the same lab data for biodegradation rates by Vaïtilingom et al. (2010) as we do in the current study. However, their model approach implied that the biodegradation rate in each droplet is smaller by a factor as compared to our approach, where no biodegradation occurs in > 99 % of the droplets.
The commonalities and differences between these approaches are summarized in Table 2.
Table 2Comparison of model features between our model study1 and the ones by Fankhauser et al. (2019)2 and Pailler et al. (2023)3.
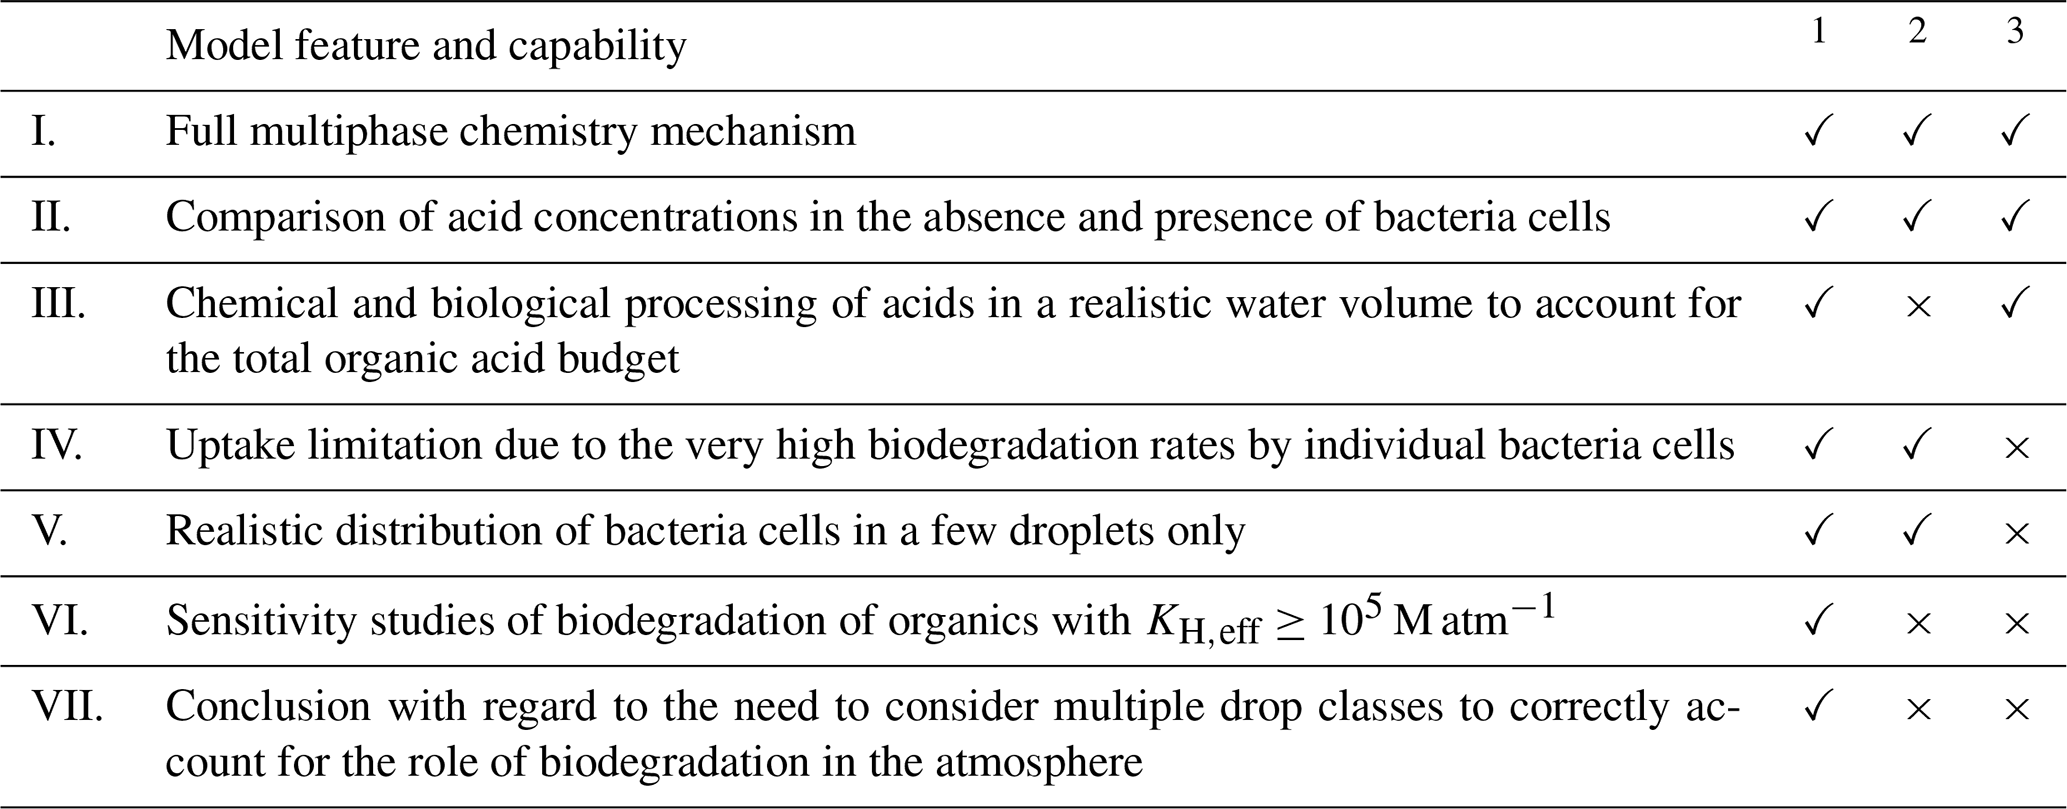
All three models included a (I) multiphase chemistry mechanism and explored the potential importance of biodegradation in the atmosphere by means of (II) sensitivity studies in the absence and presence of bacteria cells, respectively. However, there are distinct differences between the three model approaches that allow us to address the different aspects of the importance of biodegradation. They are briefly discussed in the following.
Realistic cloud liquid water content (III). We show in Fig. 6 that, at pH = 3, the bacteria-free droplets act as efficient reactors of formic acid and acetic acid production. In the absence of bacteria, all droplets would produce these acids at pH = 3 and, thus, increase the total acid concentration in the atmosphere. This acid production is not fully represented in the model by Fankhauser et al. (2019) because of the limited “reactor size”, comprised of the very small aqueous-phase volume. Thus, in their study, the importance of biodegradation may have been generally underestimated because of an incomplete multiphase system that did not comprehensively represent the full organic acid budget.
When acids are chemically formed in bacteria-free droplets, evaporate and then are taken up into bacteria-containing droplets (Fig. 6), contributions by biodegradation can exceed, by far, the fraction of the aqueous volume where biodegradation occurs. This may ultimately result in biodegradation rates being comparable to chemical loss rates in the total aqueous phase (Table S6). Considering bacteria-containing droplets to be isolated systems is only appropriate for non-volatile organics, including (di)carboxylic and amino acids, that are not replenished by phase transfer into bacteria-containing droplets. For such compounds, the upper limit of Fbact is indeed constrained by the aqueous-phase volume that contains bacteria. This limit may be as high as 0.3 %, depending on LWC, Nd and Dd (Fig. 3c).
Uptake limitation (IV). As discussed in Sect. 3.4 and shown in Fig. 6, the loss by biodegradation in the bacteria-containing droplets is very efficient; neither chemical reactions in the aqueous phase nor the uptake from the gas phase are sufficient to compensate for this rapid acid consumption, resulting in q ≤ 1 (Fig. 5c). Even though Fankhauser et al. (2019) did not explicitly discuss it in their study, similar trends can be deduced from their results since the formic acid concentration in the aqueous phase is basically zero in the presence of bacteria cells, whereas, in the absence of cells, the aqueous-phase concentration corresponds to its equilibrium value (Sect. S1). Pailler et al. (2023) did not observe that uptake limitation affected the formic acid aqueous-phase concentration. In their model, biodegradation occurred in all droplets but at moderate rates which could be always compensated for by acid sources (either uptake or chemical production in the aqueous phase). Even in the presence of bacteria cells, formic acid was apparently (approximately) in thermodynamic equilibrium, which may explain their findings that the net phase transfer was negligible. Thus, their predictions of biodegraded formic acid might represent overestimates since the acid concentration available for biodegradation may have been to high. Although they implemented an expression to account for a non-linear decrease of biodegradation at low substrate (acid) concentrations, such conditions may not have even been reached. In our model study, the biodegradation rate depends linearly on the substrate concentration (kbact × [Acid]aq) and was, thus, significantly suppressed under uptake-limited conditions.
Biodegradation of species with KH(eff) ≥ ∼ 105 M atm−1 (VI). Uptake limitations are most prominent for species that are predicted to partition to a significant fraction in the aqueous phase, such as formic acid at pH ≥ 5 (KH,eff ≥ 105 M atm−1). Our model study is the first one to systematically explore the sensitivity of biodegradation (as quantified by ΔC and ΔCrel) to the solubility (KH(eff) of specific substrates. The finding that biodegradation of species with KH(eff) ≥ 105 is likely unimportant in the atmosphere gives important guidance for future research, e.g., for lab experiments dedicated to the investigation of biodegradation rates of additional compounds.
Consideration of multiple drop classes with and without bacteria (V and VII). We conclude that it is essential in models to distinguish the small number concentration of bacteria-containing droplets from those without cells to properly account for uptake limitations. The implementation of biodegradation in models of larger (regional, global) scales may, thus, not be straightforward since such models usually do not distinguish drop classes but rather assume homogeneous monodisperse drop populations.
4.2 Potential effects of additional microphysical chemical and biological parameters on ΔC, ΔCrel and Fbact
The results discussed in the previous section cover a limited set of cloud (micro)physical, chemical and biological parameters. However, based on our sensitivity studies, we can predict trends of the absolute (ΔC) and relative (ΔCrel, Fbact) importance of biodegradation as a function of various parameters, as schematically shown in Fig. 7.

Figure 7Predicted change of absolute (ΔC) or relative (ΔCrel, Fbact) importance of biodegradation as a function of cloud microphysical, chemical and biological parameters. Red (blue) arrows indicate increased (decreased) importance with an increase in model parameter n; color intensity scales with the expected strength of the effect. Gray arrows denote either an insignificant change or an unpredictable sign of the change depending on n. These estimates are based on the assumption that one parameter at a time is varied.
One simplified assumption regarding the biodegradation rates is the use of values derived in lab studies at 17 °C. Similarly to chemical rates, biodegradation rates also show a temperature dependence. Based on the measurements by Vaïtilingom et al. (2010) at 5 and 17 °C, we estimated activation energies Ea of 90 and 27 kJ mol−1 for the biodegradation of formic and acetic acid, respectively (Sect. S2). To describe the temperature dependence of biological processes, often the Q10 factor is used to quantify the change in a rate within a temperature interval of 10 K. The resulting Q10 factors are 3.9 and 1.5 for biodegradation of formic and acetic acids by Pseudomonas sp.; these are in general agreement for other biological processes that often show values between 2 and 3. The overview of Ea and Q10 values in Tables S7 and S8 suggests that differences between bacteria species may be larger than those due to temperature variation for a single species. However, these trends should cautiously interpreted due to the very limited data base they were derived on. It should be also noted that the rates of biological processes often follow Arrhenius' law over limited temperature intervals only as they decrease beyond an optimum temperature (Schipper et al., 2014). Based on the current very limited data set, it may be concluded that, overall, the temperature dependence of biodegradation rates may not have a large impact on ΔC. Given that the trend with temperature is similar for chemical reactions and biodegradation (both follow the Arrhenius law), ΔCrel may be even less affected.
A monodisperse droplet population is a simplified representation of realistic cloud microphysical properties. The assumption of a polydisperse population with the same LWC and cell concentration distributed randomly across the population will not change FNCell; therefore, ΔC is not expected to change. Rates of OH(aq) reactions haven been shown to be enhanced in small droplets and correspondingly decreased in large droplets (Ervens et al., 2014; Chakraborty et al., 2016). These effects might (partially) cancel each other, resulting in a similar total Laq, which implies that neither ΔCrel nor Fbact will change. An increase in LWC (typically in the range of 0.1–1 g m−3 for warm clouds) might be caused by a higher droplet number concentration (Nd) or larger droplets (Dd) (or a combination of both; Eq. 4). An increase in Dd results in an increase in the fraction of bacteria-containing droplets FNCell (Fig. 3c), leading to somewhat higher ΔC and ΔCrel. Accordingly, an increase in Nd leads to a decrease in FNCell and to lower ΔC and ΔCrel since the reaction volume for chemical aqueous-phase reactions and therefore Laq increase. The absolute amount of acid that is biodegraded ΔC is a function of the number of available cells; thus, it is not expected to significantly change as a function of available liquid water. So far, the microphysical parameters LWC, Nd and Dd referred to properties of clouds. Given that aerosol particles outside clouds also contain liquid water, similar considerations may apply to such scenarios. Studies of gas–particle partitioning of acids have shown that significant acid fractions are partitioned into particles despite very low LWC (∼ 10 s µg m−3) (Yuan et al., 2015; Nah et al., 2018). If metabolic activity under such water-limited conditions were comparable to that in clouds, ΔC may be comparable if it scales by cell concentration only. There are indications that bacteria are metabolically active outside clouds (Krumins et al., 2014; Péguilhan et al., 2023). The relative importance of biodegradation (ΔCrel, Fbact(aq)) might be even higher than under cloud conditions due to the smaller role of aqueous-phase chemical reactions. However, due to the lack of systematic data for biodegradation under such conditions, to date, such comparisons cannot be reliably performed.
Chemical models often underpredict observed formic acid and acetic acid concentrations (Millet et al., 2015). In addition to missing emission sources, recent studies suggested that chemical mechanisms are not complete in terms of gas-phase sources (Paulot et al., 2011; Yuan et al., 2015; Chen et al., 2021; Gao et al., 2022; Luo et al., 2023). The addition of such formation processes would enhance Sg, leading to higher atmospheric acid concentrations and higher ΔC. However, the higher concentrations would enhance loss rates in both phases so that, overall, ΔCrel might remain constant. In the aqueous phase, the direct oxidation processes of aldehydes (Reactions R7 and R19, Table S1) are likely to be the main sources of formic and acetic acids. However, additional multiphase pathways, as suggested by Franco et al. (2021), may occur. Such sources increase Saq in all cloud droplets. Given that most additional acid would be produced in or on bacteria-free droplets, the additional acid directly accessible to the bacteria may be very small, leading to a small increase in ΔC. Consequently, ΔCrel may decrease since the increased acid concentration will enhance Laq in the total aqueous volume. Additional acid loss processes of acids in either phase (Lg, Laq) lead to a decreased role of biodegradation, both in absolute and relative numbers. Such losses may include not only chemical reactions but also acid removal by deposition, which is considered to be a major loss for small acids (Chebbi and Carlier, 1996).
In addition to gaps in chemical mechanisms, current models are even more incomplete with regards to biological processes. Formic and acetic acids may not only be biodegraded but also formed by metabolic processes (Vyas and Gulati, 2009). Such a process could be added as Sbact in Fig. 6a. Formaldehyde is a likely substrate that may be metabolized and converted into formic acid, in parallel to the chemical pathway (Reaction R7, Table S1). The biodegradation rate of formaldehyde is comparable to that of the aqueous-phase oxidation (Pailler et al., 2023); as a consequence, Sbact could be comparable to Lbact. An additional formic acid source in bacteria-containing droplets would enhance ΔC, ΔCrel and Fbact. Depending on the biotransformation efficiency, this process may affect the formaldehyde concentration not only in the bacteria-containing droplets but possibly even in the full multiphase system. However, due to the lack of data describing such bioformation processes (rates, yields) under atmospherically relevant conditions, they are neglected in our model.
The cell concentration assumed in the current study (0.1 cm−3) is at the upper end of the range of in-cloud observations. Such high concentrations may be particularly relevant in fog close to the ground and/or near strong emission sources of bacteria. All three parameters – ΔC, ΔCrel and Fbact – are expected to linearly scale with the concentration of (living, metabolically active) cells (Khaled et al., 2021). For simplicity, we assumed that the total bacteria population is composed of metabolically active Pseudomonas sp. since they usually represent a major fraction of atmospheric bacteria. However, this assumption underestimates the bacteria diversity in the atmosphere since, usually, a mixture of different bacteria types and strains are present (Gandolfi et al., 2013). The biodegradation rates of formic and acetic acids span a range of more than 1 order of magnitude (Vaïtilingom et al., 2010, 2011). Thus, both the proportions of individual bacteria strains and their different metabolic activities vary depending on the location. It may be speculated that, on average, the consideration of a greater bacteria diversity may not change our results and conclusions for formic and acetic acids significantly. However, more detailed studies are warranted to confirm the validity of this assumption for different locations and atmospheric conditions.
Bacteria comprise a ubiquitous, small number fraction of atmospheric aerosol particles. The potential of their metabolic process to affect atmospheric composition has not been widely explored yet. We extended a multiphase box model including detailed gas- and aqueous-phase chemistry by implementing biodegradation of formic and acetic acids in cloud droplets. Biodegradation is considered in a small subset of the droplets reflecting a typical atmospheric bacteria concentration of 0.1 cm. Model studies were performed for a cloud liquid water content (LWC) of 0.42 g m−3 with a monodisperse droplet population. To identify scenarios where biodegradation significantly affects formic acid and acetic acid concentrations, wide ranges of cloud droplet diameters (1 µm ≤ Dd ≤ 30 µm) and cloud water acidity (3 ≤ pH ≤ 6) were explored.
We predict losses of ΔC ≤ 20 and ≤ 5 ppt h−1 for formic and acetic acids, respectively, corresponding to loss rates of 4 % h−1 for both acids. This enhances the chemical net loss of formic acid by ΔCrel ≤ 20 % and reduces the net formation of acetic acid by ΔCrel ≤ 3 %. ΔC and ΔCrel are highest in the presence of large droplets, i.e., when the total droplet number concentration is small and, consequently, the fraction of bacteria-containing droplets is largest. The loss by biodegradation increases with pH for acetic acid; however, it reaches its maximum at pH ∼ 4.6 for formic acid and decreases at higher pH. The inefficient biodegradation of formic acid at high pH is explained by its strong aqueous-phase partitioning (KH,eff = 8 × 10⁵ M atm−1) and high aqueous-phase reactivity (kOH = 3 × 10⁹ M−1 s−1) at pH = 5.6. These factors lead to the predominant consumption of formic acid in the bacteria-free droplets that comprise > 99 % of all cloud droplets. As both the solubility and reactivity of acetic acid are lower at the same pH (KH,eff = 8 × 10⁴ M atm−1, kOH = 7 × 10⁷ M−1 s−1), sufficient gas-phase acetic acid is available to replenish biodegraded acetic acid in the bacteria-containing droplets.
We compared our results to previous estimates of the importance of biodegradation as a loss process in the atmospheric aqueous phase (Fbact,aq) and in the complete atmospheric multiphase system (Fbact) based on the simplistic comparison of chemical vs. biodegradation rates. The analysis of our model results revealed that the assumption of an averaged biodegradation rate in the full aqueous volume is only appropriate for volatile compounds with low or moderate solubility and aqueous-phase reactivity. A detailed comparison of our model results to those of the previous model studies by Pailler et al. (2023) and Fankhauser et al. (2019) highlighted important differences between the three model approaches. Based on this, we conclude that the role of biodegradation of compounds with KH(eff) ≥ ∼ 105 M atm−1 will be overestimated by a bulk approach, in which biodegradation is assumed to occur in the full aqueous volume, since uptake-limited phase transfer processes between bacteria-containing and bacteria-free droplets cannot be properly described. For the same reasons, bulk models overestimate the biodegradation of non-volatile species that, in the real atmosphere, only takes in the small subset of bacteria-containing droplets. For such species, the upper limit of the biodegradable mass of non-volatile species (e.g., dicarboxylic acids) is constrained by the number fraction of bacteria-containing droplets. Our conclusions based on the comparison of the three model approaches show the need for the developments of parameterizations to describe biodegradation in larger-scale models since such models usually do not distinguish individual drop classes with different chemical compositions (e.g., with and without bacteria cells).
We also highlight the need for more refined data on the abundance and diversity of (living) bacteria in the atmosphere. Additional biological processes may lead not only to the consumption but also to the formation of organic compounds in clouds and possibly also aqueous aerosol particles outside clouds. We conclude that, despite a very small number concentration in the atmosphere (≤ 0.1 % of all aerosol particles and cloud droplets), metabolically active microorganisms (bacteria, fungi, yeast) may be efficient drivers to significantly affect atmospheric concentrations of organic compounds. Our model can be considered a starting point for future studies to further constrain the role of biological processes in the atmosphere to affect biogeochemical cycles in the Earth system.

The data set related to this work can be accessed via https://doi.org/10.5281/zenodo.8406017 (Nuñez Lopez, 2023).
The supplement related to this article is available online at: https://doi.org/10.5194/acp-24-5181-2024-supplement.
LNL performed the model studies and analyzed the results. BE developed the research idea and goals. All the authors wrote the paper.
At least one of the (co-)authors is a member of the editorial board of Atmospheric Chemistry and Physics. The peer-review process was guided by an independent editor, and the authors also have no other competing interests to declare.
Publisher’s note: Copernicus Publications remains neutral with regard to jurisdictional claims made in the text, published maps, institutional affiliations, or any other geographical representation in this paper. While Copernicus Publications makes every effort to include appropriate place names, the final responsibility lies with the authors.
This research has been supported by the Agence Nationale de la Recherche (grant no. ANR-17-MPGA-0013).
This paper was edited by Alex Huffman and reviewed by two anonymous referees.
Adeleke, R., Nwangburuka, C., and Oboirien, B.: Origins, roles and fate of organic acids in soils: A review, S. Afr. J. Bot., 108, 393–406, https://doi.org/10.1016/j.sajb.2016.09.002, 2017. a
Amato, P., Parazols, M., Sancelme, M., Laj, P., Mailhot, G., and Delort, A. M.: Microorganisms isolated from the water phase of tropospheric clouds at the Puy de Dôme: Major groups and growth abilities at low temperatures, FEMS Microbiol. Ecol., 59, 242–254, https://doi.org/10.1111/j.1574-6941.2006.00199.x, 2007. a, b
Amato, P., Joly, M., Besaury, L., Oudart, A., Taib, N., Moné, A. I., Deguillaume, L., Delort, A. M., and Debroas, D.: Active microorganisms thrive among extremely diverse communities in cloud water, PLoS ONE, 12, 1–22, https://doi.org/10.1371/journal.pone.0182869, 2017. a
Amato, P., Mathonat, F., Nuñez Lopez, L., Péguilhan, R., Bourhane, Z., Rossi, F., Vyskocil, J., Joly, M., and Ervens, B.: The aeromicrobiome: the selective and dynamic outer-layer of the Earth's microbiome, Front. Microbiol., 14, 1186847, https://doi.org/10.3389/fmicb.2023.1186847, 2023. a
Ariya, P. A., Nepotchatykh, O., Ignatova, O., and Amyot, M.: Microbiological degradation of atmospheric organic compounds, Geophys. Res. Lett., 29, 2077, https://doi.org/10.1029/2002GL015637, 2002. a, b, c
Baray, J.-L., Deguillaume, L., Colomb, A., Sellegri, K., Freney, E., Rose, C., Van Baelen, J., Pichon, J.-M., Picard, D., Fréville, P., Bouvier, L., Ribeiro, M., Amato, P., Banson, S., Bianco, A., Borbon, A., Bourcier, L., Bras, Y., Brigante, M., Cacault, P., Chauvigné, A., Charbouillot, T., Chaumerliac, N., Delort, A.-M., Delmotte, M., Dupuy, R., Farah, A., Febvre, G., Flossmann, A., Gourbeyre, C., Hervier, C., Hervo, M., Huret, N., Joly, M., Kazan, V., Lopez, M., Mailhot, G., Marinoni, A., Masson, O., Montoux, N., Parazols, M., Peyrin, F., Pointin, Y., Ramonet, M., Rocco, M., Sancelme, M., Sauvage, S., Schmidt, M., Tison, E., Vaïtilingom, M., Villani, P., Wang, M., Yver-Kwok, C., and Laj, P.: Cézeaux-Aulnat-Opme-Puy De Dôme: a multi-site for the long-term survey of the tropospheric composition and climate change, Atmos. Meas. Tech., 13, 3413–3445, https://doi.org/10.5194/amt-13-3413-2020, 2020. a
Barth, M. C., Ervens, B., Herrmann, H., Tilgner, A., McNeill, V. F., Tsui, W. G., Deguillaume, L., Chaumerliac, N., Carlton, A. G., and Lance, S.: Box Model Intercomparison of Cloud Chemistry, J. Geophys. Res.-Atmos., 126, e2021JD035486, https://doi.org/10.1029/2021JD035486, 2021. a
Chakraborty, A., Ervens, B., Gupta, T., and Tripathi, S. N.: Characterization of organic residues of size-resolved fog droplets and their atmospheric implications, J. Geophys. Res.-Atmos., 121, 4317–4332, https://doi.org/10.1002/2015JD024508, 2016. a, b
Chebbi, A. and Carlier, P.: Carboxylic acids in the troposphere, occurrence, sources, and sinks: A review, Atmos. Environ., 30, 4233–4249, https://doi.org/10.1016/1352-2310(96)00102-1, 1996. a, b, c
Chen, X., Millet, D. B., Neuman, J. A., Veres, P. R., Ray, E. A., Commane, R., Daube, B. C., McKain, K., Schwarz, J. P., Katich, J. M., Froyd, K. D., Schill, G. P., Kim, M. J., Crounse, J. D., Allen, H. M., Apel, E. C., Hornbrook, R. S., Blake, D. R., Nault, B. A., Campuzano-Jost, P., Jimenez, J. L., and Dibb, J. E.: HCOOH in the remote atmosphere: Constraints from Atmospheric Tomography (ATom) airborne observations, ACS Earth Space Chem., 5, 1436–1454, https://doi.org/10.1021/acsearthspacechem.1c00049, 2021. a
DeLeon-Rodriguez, N., Lathem, T. L., Rodriguez-R, L. M., Barazesh, J. M., Anderson, B. E., Beyersdorf, A. J., Ziemba, L. D., Bergin, M., Nenes, A., and Konstantinidis, K. T.: Microbiome of the upper troposphere: Species composition and prevalence, effects of tropical storms, and atmospheric implications, P. Natl. Acad. Sci. USA, 110, 2575, https://doi.org/10.1073/pnas.1212089110, 2013. a
Ervens, B.: Modeling the Processing of Aerosol and Trace Gases in Clouds and Fogs, Chem. Rev., 115, 4157–4198, https://doi.org/10.1021/cr5005887, 2015. a, b
Ervens, B., Carlton, A. G., Turpin, B. J., Altieri, K. E., Kreidenweis, S. M., and Feingold, G.: Secondary organic aerosol yields from cloud-processing of isoprene oxidation products, Geophys. Res. Lett., 35, L02816, https://doi.org/10.1029/2007gl031828, 2008. a
Ervens, B., Sorooshian, A., Lim, Y. B., and Turpin, B. J.: Key parameters controlling OH-initiated formation of secondary organic aerosol in the aqueous phase (aqSOA), J. Geophys. Res.-Atmos., 119, 3997–4016, https://doi.org/10.1002/2013JD021021, 2014. a, b, c
Facchini, M. C., Fuzzi, S., Lind, J. A., Fierlinger-Oberlinninger, H., Kalina, M., Puxbaum, H., Winiwarter, W., Arends, B. G., Wobrock, W., Jaeschke, W., Berner, A., and Kruisz, C.: Phase-partitioning and chemical rections of low molecular weight organic compounds in fog, Tellus, 44B, 533–544, https://doi.org/10.3402/tellusb.v44i5.15566, 1992. a
Fankhauser, A. M., Antonio, D. D., Krell, A., Alston, S. J., Banta, S., and McNeill, V. F.: Constraining the Impact of Bacteria on the Aqueous Atmospheric Chemistry of Small Organic Compounds, ACS Earth Space Chem., 3, 1485–1491, https://doi.org/10.1021/acsearthspacechem.9b00054, 2019. a, b, c, d, e, f, g
Franco, B., Clarisse, L., Stavrakou, T., Müller, J.-F., Taraborrelli, D., Hadji-Lazaro, J., Hannigan, J. W., Hase, F., Hurtmans, D., Jones, N., Lutsch, E., Mahieu, E., Ortega, I., Schneider, M., Strong, K., Vigouroux, C., Clerbaux, C., and Coheur, P.-F.: Spaceborne Measurements of Formic and Acetic Acids: A Global View of the Regional Sources, Geophys. Res. Lett., 47, e2019GL086239, https://doi.org/10.1029/2019GL086239, 2020. a
Franco, B., Blumenstock, T., Cho, C., Clarisse, L., Clerbaux, C., Coheur, P.-F., De Mazière, M., De Smedt, I., Dorn, H.-P., Emmerichs, T., Fuchs, H., Gkatzelis, G., Griffith, D. W. T., Gromov, S., Hannigan, J. W., Hase, F., Hohaus, T., Jones, N., Kerkweg, A., Kiendler-Scharr, A., Lutsch, E., Mahieu, E., Novelli, A., Ortega, I., Paton-Walsh, C., Pommier, M., Pozzer, A., Reimer, D., Rosanka, S., Sander, R., Schneider, M., Strong, K., Tillmann, R., Van Roozendael, M., Vereecken, L., Vigouroux, C., Wahner, A., and Taraborrelli, D.: Ubiquitous atmospheric production of organic acids mediated by cloud droplets, Nature, 593, 233–237, https://doi.org/10.1038/s41586-021-03462-x, 2021. a
Fröhlich-Nowoisky, J., Kampf, C. J., Weber, B., Huffman, J. A., Pöhlker, C., Andreae, M. O., Lang-Yona, N., Burrows, S. M., Gunthe, S. S., Elbert, W., Su, H., Hoor, P., Thines, E., Hoffmann, T., Després, V. R., and Pöschl, U.: Bioaerosols in the Earth system: Climate, health, and ecosystem interactions, Atmos. Res., 182, 346–376, https://doi.org/10.1016/j.atmosres.2016.07.018, 2016. a
Fuzzi, S., Mandrioli, P., and Perfetto, A.: Fog droplets – An atmospheric source of secondary biological aerosol particles, Atmos. Environ., 31, 287–290, https://doi.org/10.1016/1352-2310(96)00160-4, 1997. a
Gandolfi, I., Bertolini, V., Ambrosini, R., Bestetti, G., and Franzetti, A.: Unravelling the bacterial diversity in the atmosphere, Appl. Microbiol. Biot., 97, 4727–4736, https://doi.org/10.1007/s00253-013-4901-2, 2013. a
Gao, M., Yan, X., Qiu, T., Han, M., and Wang, X.: Variation of correlations between factors and culturable airborne bacteria and fungi, Atmos. Environ., 128, 10–19, https://doi.org/10.1016/j.atmosenv.2015.12.008, 2016. a
Gao, Z., Vasilakos, P., Nah, T., Takeuchi, M., Chen, H., Tanner, D. J., Ng, N. L., Kaiser, J., Huey, L. G., Weber, R. J., and Russell, A. G.: Emissions, chemistry or bidirectional surface transfer? Gas phase formic acid dynamics in the atmosphere, Atmos. Environ., 274, 118995, https://doi.org/10.1016/j.atmosenv.2022.118995, 2022. a
Gong, J., Qi, J., E, B., Yin, Y., and Gao, D.: Concentration, viability and size distribution of bacteria in atmospheric bioaerosols under different types of pollution, Environ. Pollut., 257, 1–11, https://doi.org/10.1016/j.envpol.2019.113485, 2020. a
Herckes, P., Valsaraj, K. T., and Collett Jr., J. L.: A review of observations of organic matter in fogs and clouds: Origin, processing and fate, Atmos. Res., 132–133, 434–449, https://doi.org/10.1016/j.atmosres.2013.06.005, 2013. a
Herlihy, L. J., Galloway, J. N., and Mills, A. L.: Bacterial utilization of formic and acetic acid in rainwater, Atmos. Environ., 21, 2397–2402, https://doi.org/10.1016/0004-6981(87)90374-X, 1987. a, b, c
Herrmann, H.: Kinetics of aqueous phase reactions relevant for atmospheric chemistry, Chem. Rev., 103, 4691–4716, 2003. a
Hu, W., Murata, K., Fan, C., Huang, S., Matsusaki, H., Fu, P., and Zhang, D.: Abundance and viability of particle-attached and free-floating bacteria in dusty and nondusty air, Biogeosciences, 17, 4477–4487, https://doi.org/10.5194/bg-17-4477-2020, 2020. a
Jaber, S., Lallement, A., Sancelme, M., Leremboure, M., Mailhot, G., Ervens, B., and Delort, A.-M.: Biodegradation of phenol and catechol in cloud water: comparison to chemical oxidation in the atmospheric multiphase system, Atmos. Chem. Phys., 20, 4987–4997, https://doi.org/10.5194/acp-20-4987-2020, 2020. a, b
Jaber, S., Joly, M., Brissy, M., Leremboure, M., Khaled, A., Ervens, B., and Delort, A.-M.: Biotic and abiotic transformation of amino acids in cloud water: experimental studies and atmospheric implications, Biogeosciences, 18, 1067–1080, https://doi.org/10.5194/bg-18-1067-2021, 2021. a, b
Jacob, D. J.: Chemistry of OH in Remote Clouds and its Role in the Production of Formic Acid and Peroxymonosulfate, J. Geophys. Res.-Atmos., 91, 9807–9826, 1986. a
Khaled, A., Zhang, M., Amato, P., Delort, A.-M., and Ervens, B.: Biodegradation by bacteria in clouds: an underestimated sink for some organics in the atmospheric multiphase system, Atmos. Chem. Phys., 21, 3123–3141, https://doi.org/10.5194/acp-21-3123-2021, 2021. a, b, c, d, e, f, g, h
Khare, P., Kumar, N., Kumari, K. M., and Srivastava, S. S.: Atmospheric Formic and Acetic Acids: An Overview, Rev. Geophys., 37, 227–248, 1999. a, b
Krumins, V., Mainelis, G., Kerkhof, L. J., and Fennell, D. E.: Substrate-Dependent rRNA Production in an Airborne Bacterium, Environ. Sci. Technol. Lett., 1, 376–381, https://doi.org/10.1021/ez500245y, 2014. a
Lawrence, C. E., Casson, P., Brandt, R., Schwab, J. J., Dukett, J. E., Snyder, P., Yerger, E., Kelting, D., VandenBoer, T. C., and Lance, S.: Long-term monitoring of cloud water chemistry at Whiteface Mountain: the emergence of a new chemical regime, Atmos. Chem. Phys., 23, 1619–1639, https://doi.org/10.5194/acp-23-1619-2023, 2023. a
Liu, Y., Lim, C. K., Shen, Z., Lee, P. K. H., and Nah, T.: Effects of pH and light exposure on the survival of bacteria and their ability to biodegrade organic compounds in clouds: implications for microbial activity in acidic cloud water, Atmos. Chem. Phys., 23, 1731–1747, https://doi.org/10.5194/acp-23-1731-2023, 2023. a, b, c, d, e
Luo, P.-L., Chen, I.-Y., Khan, M. A. H., and Shallcross, D. E.: Direct gas-phase formation of formic acid through reaction of Criegee intermediates with formaldehyde, Commun. Chem., 6, 130, https://doi.org/10.1038/s42004-023-00933-2, 2023. a
Millet, D. B., Baasandorj, M., Farmer, D. K., Thornton, J. A., Baumann, K., Brophy, P., Chaliyakunnel, S., de Gouw, J. A., Graus, M., Hu, L., Koss, A., Lee, B. H., Lopez-Hilfiker, F. D., Neuman, J. A., Paulot, F., Peischl, J., Pollack, I. B., Ryerson, T. B., Warneke, C., Williams, B. J., and Xu, J.: A large and ubiquitous source of atmospheric formic acid, Atmos. Chem. Phys., 15, 6283–6304, https://doi.org/10.5194/acp-15-6283-2015, 2015. a, b, c
Mungall, E. L., Abbatt, J. P. D., Wentzell, J. J. B., Wentworth, G. R., Murphy, J. G., Kunkel, D., Gute, E., Tarasick, D. W., Sharma, S., Cox, C. J., Uttal, T., and Liggio, J.: High gas-phase mixing ratios of formic and acetic acid in the High Arctic, Atmos. Chem. Phys., 18, 10237–10254, https://doi.org/10.5194/acp-18-10237-2018, 2018. a
Nah, T., Guo, H., Sullivan, A. P., Chen, Y., Tanner, D. J., Nenes, A., Russell, A., Ng, N. L., Huey, L. G., and Weber, R. J.: Characterization of aerosol composition, aerosol acidity, and organic acid partitioning at an agriculturally intensive rural southeastern US site, Atmos. Chem. Phys., 18, 11471–11491, https://doi.org/10.5194/acp-18-11471-2018, 2018. a
Nathanson, G. M., Davidovits, P., Worsnop, D. R., and Kolb, C. E.: Dynamics and Kinetics at the Gas-Liquid Interface, J. Phys. Chem., 100, 13007–13020, https://doi.org/10.1021/jp953548e, 1996. a
Nuñez Lopez, L.: Nunez_ACP2023, Zenodo [data set], https://doi.org/10.5281/zenodo.8406017, 2023. a
Pailler, L., Wirgot, N., Joly, M., Renard, P., Mouchel-Vallon, C., Bianco, A., Leriche, M., Sancelme, M., Job, A., Patryl, L., Armand, P., Delort, A.-M., Chaumerliac, N., and Deguillaume, L.: Assessing the efficiency of water-soluble organic compound biodegradation in clouds under various environmental conditions, Environ. Sci.: Atmos., 3, 731–748, https://doi.org/10.1039/D2EA00153E, 2023. a, b, c, d, e, f, g
Paulot, F., Wunch, D., Crounse, J. D., Toon, G. C., Millet, D. B., DeCarlo, P. F., Vigouroux, C., Deutscher, N. M., González Abad, G., Notholt, J., Warneke, T., Hannigan, J. W., Warneke, C., de Gouw, J. A., Dunlea, E. J., De Mazière, M., Griffith, D. W. T., Bernath, P., Jimenez, J. L., and Wennberg, P. O.: Importance of secondary sources in the atmospheric budgets of formic and acetic acids, Atmos. Chem. Phys., 11, 1989–2013, https://doi.org/10.5194/acp-11-1989-2011, 2011. a, b, c, d, e
Péguilhan, R., Rossi, F., Joly, M., Nasr, E., Batut, B., Enault, F., Ervens, B., and Amato, P.: Clouds, oases for airborne microbes – Differential metagenomics/ metatranscriptomics analyses of cloudy and clear atmospheric situations, bioRxiv [preprint], https://doi.org/10.1101/2023.12.14.571671, 2023. a
Petersson Sjögren, M., Alsved, M., Šantl-Temkiv, T., Bjerring Kristensen, T., and Löndahl, J.: Measurement report: Atmospheric fluorescent bioaerosol concentrations measured during 18 months in a coniferous forest in the south of Sweden, Atmos. Chem. Phys., 23, 4977–4992, https://doi.org/10.5194/acp-23-4977-2023, 2023. a
Pye, H. O. T., Nenes, A., Alexander, B., Ault, A. P., Barth, M. C., Clegg, S. L., Collett Jr., J. L., Fahey, K. M., Hennigan, C. J., Herrmann, H., Kanakidou, M., Kelly, J. T., Ku, I.-T., McNeill, V. F., Riemer, N., Schaefer, T., Shi, G., Tilgner, A., Walker, J. T., Wang, T., Weber, R., Xing, J., Zaveri, R. A., and Zuend, A.: The acidity of atmospheric particles and clouds, Atmos. Chem. Phys., 20, 4809–4888, https://doi.org/10.5194/acp-20-4809-2020, 2020. a
Šantl-Temkiv, T., Amato, P., Casamayor, E. O., Lee, P. K. H., and Pointing, S. B.: Microbial ecology of the atmosphere, FEMS Microbiol. Rev., 46, fuac009, https://doi.org/10.1093/femsre/fuac009, 2022. a
Sattler, B., Puxbaum, H., and Psenner, R.: Bacterial growth in supercooled cloud droplets, Geophys. Res. Lett., 28, 239–242, https://doi.org/10.1029/2000GL011684, 2001. a
Schipper, L. A., Hobbs, J. K., Rutledge, S., and Arcus, V. L.: Thermodynamic theory explains the temperature optima of soil microbial processes and high Q10 values at low temperatures, Glob. Change Biol., 20, 3578–3586, https://doi.org/10.1111/gcb.12596, 2014. a
Schwartz, S.: Mass transport considerations pertinent to aqueous phase reactions of gases in liquid water clouds, in: Chemistry of Multiphase Atmospheric Systems, edited by: Jaeschke, W., Springer, Berlin, Heidelberg, NATO ASI Series, Series G: Ecological Sciences, vol. 6, https://doi.org/10.1007/978-3-642-70627-1_16, 1986. a
Vaïtilingom, M., Amato, P., Sancelme, M., Laj, P., Leriche, M., and Delort, A.-M.: Contribution of Microbial Activity to Carbon Chemistry in Clouds, Appl. Environ. Microb., 76, 23–29, https://doi.org/10.1128/AEM.01127-09, 2010. a, b, c, d, e
Vaïtilingom, M., Charbouillot, T., Deguillaume, L., Maisonobe, R., Parazols, M., Amato, P., Sancelme, M., and Delort, A.-M.: Atmospheric chemistry of carboxylic acids: microbial implication versus photochemistry, Atmos. Chem. Phys., 11, 8721–8733, https://doi.org/10.5194/acp-11-8721-2011, 2011. a, b, c, d, e, f
Vaïtilingom, M., Deguillaume, L., Vinatier, V., Sancelme, M., Amato, P., Chaumerliac, N., and Delort, A. M.: Potential impact of microbial activity on the oxidant capacity and organic carbon budget in clouds, P. Natl. Acad. Sci. USA, 110, 559–564, https://doi.org/10.1073/pnas.1205743110, 2013. a, b
Voisin, D., Legrand, M., and Chaumerliac, N.: Scavenging of acidic gases (HCOOH, CH3COOH, HNO3, HCl and SO2) and ammonia in mixed liquid-solid water clouds at the Puy de Dome mountain (France), J. Geophys. Res., 105, 6817–6835, 2000. a
Vyas, P. and Gulati, A.: Organic acid production in vitro and plant growth promotion in maize under controlled environment by phosphate-solubilizing fluorescent Pseudomonas, BMC Microbiol., 9, 174, https://doi.org/10.1186/1471-2180-9-174, 2009. a
Winiwarter, W., Fierlinger, H., Puxbaum, H., Facchini, M. C., Arends, B. G., Fuzzi, S., Schell, D., Kaminski, U., Pahl, S., Schneider, T., Berner, A., Solly, I., and Kruisz, C.: Henry's Law and the Behavior of Weak Acids and Bases in Fog and Clouds, J. Atmos. Chem., 19, 173–188, https://doi.org/10.1007/BF00696588, 1994. a
Yuan, B., Veres, P. R., Warneke, C., Roberts, J. M., Gilman, J. B., Koss, A., Edwards, P. M., Graus, M., Kuster, W. C., Li, S.-M., Wild, R. J., Brown, S. S., Dubé, W. P., Lerner, B. M., Williams, E. J., Johnson, J. E., Quinn, P. K., Bates, T. S., Lefer, B., Hayes, P. L., Jimenez, J. L., Weber, R. J., Zamora, R., Ervens, B., Millet, D. B., Rappenglück, B., and de Gouw, J. A.: Investigation of secondary formation of formic acid: urban environment vs. oil and gas producing region, Atmos. Chem. Phys., 15, 1975–1993, https://doi.org/10.5194/acp-15-1975-2015, 2015. a, b
Zhai, Y., Li, X., Wang, T., Wang, B., Li, C., and Zeng, G.: A review on airborne microorganisms in particulate matters: Composition, characteristics and influence factors, Environ. Int., 113, 74–90, https://doi.org/10.1016/j.envint.2018.01.007, 2018. a