the Creative Commons Attribution 4.0 License.
the Creative Commons Attribution 4.0 License.
 | 26 Apr 2024
A sensitivity study on radiative effects due to the parameterization of dust optical properties in models
Ilias Fountoulakis
Alexandra Tsekeri
Stelios Kazadzis
Vassilis Amiridis
Angelos Nersesian
Maria Tsichla
Emmanouil Proestakis
Antonis Gkikas
Kyriakoula Papachristopoulou
Vasileios Barlakas
Claudia Emde
Bernhard Mayer
Most of the dust models underestimate the load of the large dust particles, consider spherical shapes instead of irregular ones, and have to deal with a wide range of the dust refractive index (RI) to be used. This leads to an incomplete assessment of the dust radiative effects and dust-related impacts on climate and weather. The current work aims to provide an assessment, through a sensitivity study, of the limitations of models to calculate the dust direct radiative effect (DRE) due to the underrepresentation of its size, RI, and shape. We show that the main limitations stem from the size and RI, while using a more realistic shape plays only a minor role, with our results agreeing with recent findings in the literature. At the top of the atmosphere (TOA) close to dust sources, the underestimation of size issues an underestimation of the direct warming effect of dust of ∼ 18–25 W m−2, for DOD = 1 (dust optical depth) at 0.5 µm, depending on the solar zenith angle (SZA) and RI. The underestimation of the dust size in models is less above the ocean than above dust sources, resulting in an underestimation of the direct cooling effect of dust above the ocean by up to 3 W m−2, for aerosol optical depth (AOD) of 1 at 0.5 µm. We also show that the RI of dust may change its DRE by 80 W m−2 above the dust sources and by 50 W m−2 at downwind oceanic areas for DOD = 1 at 0.5 µm at TOA. These results indicate the necessity of including more realistic sizes and RIs for dust particles in dust models, in order to derive better estimations of the dust DRE, especially near the dust sources and mostly for studies dealing with local radiation effects of dust aerosols.
- Article
(11632 KB) - Full-text XML
- BibTeX
- EndNote


One of the most abundant aerosols in Earth's atmosphere is mineral dust, with ∼ 57 % of its total load originating from North Africa (Huneeus et al., 2011; IPCC, 2013). Saharan dust has a significant impact on global climate through long-range-transported dust particles mainly over the Atlantic Ocean to the Americas (Parkin et al., 1972; Doherty et al., 2008; Prospero et al., 2010) and over Europe and the Mediterranean basin (e.g., Meloni et al., 2018; Papachristopoulou et al., 2022). The radiative forcing of dust on the global climate includes the direct interaction of the particles with the radiation in the atmosphere, i.e., through absorbing and/or scattering of shortwave (SW) and longwave (LW) radiation, called the direct radiative effect (DRE), and through the indirect radiative effect (IRE) and semidirect radiative effect (SRE) of dust by altering the physical and optical properties of clouds and subsequently their radiative forcing. The quantification of both effects is currently uncertain (e.g., Adebiyi et al., 2023; Li et al., 2022).
Whether desert dust aerosols warm or cool the planet by their DRE is still a matter of debate (e.g., Kok et al., 2017), with Kok et al. (2023) reporting a DRE of W m−2. Mineral particles scatter and absorb SW radiation, causing cooling and warming, correspondingly, whereas they induce a warming through scattering and absorption of the LW radiation emitted by Earth's surface. Dust particles of a radius smaller than 1 µm tend to cause cooling in the SW region, since scattering dominates over spectral absorption in the SW region, while for larger particles the warming due to absorption in the SW region is not negligible (e.g., Song et al., 2022). Moreover, in the LW region, the effect of absorption becomes comparable to scattering, both for fine and coarse particles (e.g., Song et al., 2022). Dust models typically exclude the larger dust particles and underestimate coarse-mode concentrations, introducing uncertainties in the assessment of dust-induced impacts on climate, weather, and biochemistry (e.g., Kok et al., 2023; Adebiyi and Kok, 2022; Drakaki et al., 2022).
Regarding dust IRE, through altering the properties of clouds, larger particles may produce cloud condensation nuclei and initiate precipitation depending on their mixture with soluble material (e.g., Adebiyi et al., 2023). Larger dust particles are also more effective ice condensation nuclei (e.g., Petters and Kreidenweis, 2007; Diehl et al., 2014) than smaller dust particles, which are less hygroscopic (e.g., Ibrahim et al., 2018). Thus, the dust size has an impact on the number, properties, and spatial distribution of clouds and subsequently on global precipitation and climate (e.g., Nenes et al., 2014; Karydis et al., 2017). Larger dust particles also contribute more to dust mass, which controls the impact of dust on ocean and tropical rainforest ecosystems (Jickells et al., 2005; Yu et al., 2015), and also to the ocean carbon cycle (van der Does et al., 2018).
In more detail, the radiative effects of dust particles depend on their microphysical properties, i.e., the size, shape, orientation, and refractive index (RI) (e.g., Ulanowski et al., 2007; Haywood et al., 2001, 2003). Regarding the size, even state-of-the-art dust models heavily underestimate the portion of the dust burden attributed to large mineral particles, considering a maximum radii of 10 µm (e.g., Mahowald et al., 2014; Adebiyi and Kok, 2022; Adebiyi et al., 2020), while in the widely used Optical Properties of Aerosols and Clouds (OPAC) scattering database the maximum radius of coarse-mode aerosols is 30 µm (Koepke et al., 2015). The size of the coarser dust grains is found to be much larger, with radii of up to > 200 µm (e.g., Ryder et al., 2019; van der Does et al., 2018; Kandler et al., 2011). Moreover, a significant fraction of particles with radii between 10 and 50 µm have been measured in many experimental campaigns in North Africa (e.g., Weinzierl et al., 2009). Ryder et al. (2019) reported that excluding the larger particles over the Sahara can lead to an underestimation of both shortwave and longwave extinction by up to 18 % and 26 %, respectively. Kok et al. (2017) found that by using an observationally constrained particle size distribution (SD) of the emitted dust, global model calculations of dust radiative forcing resulted in less cooling compared to previous estimates from AeroCom models (Huneeus et al., 2011), wherein smaller, more cooling particles were overrepresented and coarser, more warming particles were underestimated.
In addition, many dust models consider a spherical shape for dust grains, although the grains have irregular shapes (Huang et al., 2020a; Kandler et al., 2009). The calculations of the optical properties are much simpler for spherical particles, but their deviation from the optical properties of dust with non-spherical shapes has been shown to affect the quantification of the dust radiative effect. For example, Otto et al. (2011) have quantified the effect on dust direct radiative forcing when considering spheroids to be 5 % at the top of the atmosphere (TOA) over land, 55 % at TOA over the ocean, and 15 % at the bottom of the atmosphere (BOA) over land and ocean. Ito et al. (2021), considering ellipsoidal shapes instead of spheres, reported no effect at TOA and an atmospheric warming of 0.18 W m−2 at BOA. Irregular hexahedral shapes have also been used to describe the optical properties of dust (Saito and Yang, 2021) but not for estimating its radiative effects. More realistic irregular shapes have been also suggested (Gasteiger et al., 2011) but not for a wide range of sizes and RIs, due to their costly computations.
Moreover, modeling studies commonly use RIs (e.g., Patterson et al., 1977; D'Almeida et al., 1991; Shettle and Fenn, 1979; Sokolik et al., 1993) that result in systematic overprediction of the absorption of mineral dust compared to satellite retrievals (Balkanski et al., 2007). According to a recent study by Huang et al. (2020b), there is a need for considerably more research in order to better constrain the uncertainties related to the dust aerosol RIs. The efficiency of dust to absorb SW radiation (and subsequently the RI) depends strongly on its content in iron oxides, which usually represent up to ∼ 6 % of desert dust (Di Biagio et al., 2019). Iron oxides are mixtures of hematite and goethite. It is common for the calculation of RIs to represent iron oxide in dust with solely hematite optical properties which leads to an overestimation of shortwave DRE by +0.10 W m−2 at TOA, as goethite is not as absorbing as hematite in the shortwave spectrum range (Li et al., 2021). RIs with lower imaginary parts (e.g., Balkanski et al., 2007; Colarco et al., 2014) are considered to be more appropriate and are consistent with recent observations for Saharan dust (Rocha-Lima et al., 2018). Song et al. (2022) have provided a quantification of the DRE on a global scale for different sizes, RIs, and shapes (spheres vs. spheroids) of dust. According to their findings, the RI used in a model is the most important factor in determining the dust DRE, inducing large uncertainties, up to 45 %. The authors also showed that not considering very large particles results in uncertainties of 15 %–20 % in dust DRE at TOA and in the atmosphere, while dust non-sphericity induces a negligible effect.
Other important parameters for a complete assessment of the dust radiative effects are the surface albedo, the dust layer height (e.g., Liao and Seinfeld, 1998), and the amount of water vapor found in dust layers (Gutleben et al., 2019, 2020; Ryder, 2021). Regarding the surface albedo, the induced SW cooling is enhanced above dark surfaces (e.g., the ocean), since the presence of dust hinders the absorption of the incoming radiation at the surface. On the contrary, SW warming is enhanced above bright surfaces (e.g., desert) because in the absence of dust the surface would reflect more incoming radiation (Kok et al., 2023, and references therein).
Here a sensitivity study has been conducted emphasizing the determinant factors for the quantification of dust DREs in models, such as the mineral particles' size, shape, and composition. More specifically, we investigated the effects of the following:
-
neglecting particles with diameters larger than 10 µm in the simulations, as done in dust models;
-
assuming spheroidal instead of the spherical particle shapes considered in dust models;
-
taking into account the wide range of RI of dust particles (representing different particle compositions), which is not considered in dust models.
Moreover, the dust-induced radiative SW and LW effects, both at BOA and TOA under clear-sky conditions, are quantified above the desert and the ocean for varying dust loads and different sun geometries. It is important to clarify at this point that our study aims to contribute towards the understanding of how the dust optical properties parameterization in models affect the calculated dust DRE under different atmospheric and land surface conditions rather than provide quantitative estimates of the (local or global) dust radiative effects. Small-scale measurement-based modeling studies are necessary to understand the interactions between dust and solar/thermal radiation, which, in turn, would improve the accuracy of the large-scale modeling simulations (Yu et al., 2006). Section 2 presents the data and methodology followed in the study, Sect. 3 presents the results, Sect. 4 provides a summary and comparison with other studies, and Sect. 5 presents the main findings of this study. For the convenience of the readers, the acronyms that are frequently used in the paper are presented in Table A1 (in the Appendix).
We quantified the effect on the radiation fluxes and direct radiative effect (DRE) of dust due to the underestimation in size and the assumption of sphericity in models, using more realistic shapes, size distributions (SDs), and refractive indices (RIs) for the dust particles. Optical properties were calculated using the MOPSMAP scattering database (Modeled optical properties of ensembles of aerosol particles; Gasteiger and Wiegner, 2018), considering spherical or spheroidal shapes for the dust particles. The radiative transfer calculations were performed using the radiative transfer solver MYSTIC (Monte Carlo code for the physically correct tracing of photons in cloudy atmospheres; Mayer, 2009).
2.1 Microphysical properties of dust particles
2.1.1 Volume size distributions
The volume size distributions used were acquired from airborne in situ measurements above dust sources in the Sahara and in the Saharan air layer (SAL) above the ocean during the Fennec experimental campaign (Ryder et al., 2019). Fennec was held in June 2011, above the Sahara and above the ocean close to the Canary Islands (Fig. 1). The Fennec campaign was selected for this study since it provides size distributions near to dust sources, with radii as large as ∼ 150 µm above the sources. A comparison with respect to the findings of other experimental campaigns is shown in Fig. 9 in Ryder et al. (2019).
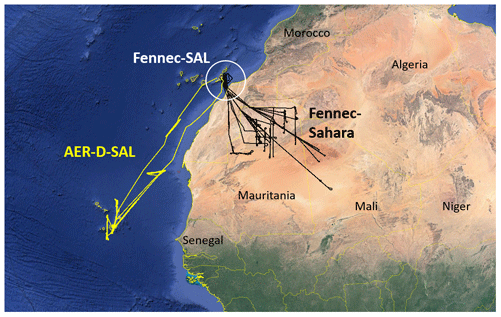
Figure 1The location of the Fennec campaign, with measurements above dust sources in Sahara (“Fennec-Sahara” – black lines) and above the ocean in the SAL (“Fennec-SAL” – white circle). The measurements from the AERosol Properties – Dust (AER-D) campaign (yellow lines) were not used here. Reproduced from Ryder et al. (2019) under a CC-BY license.
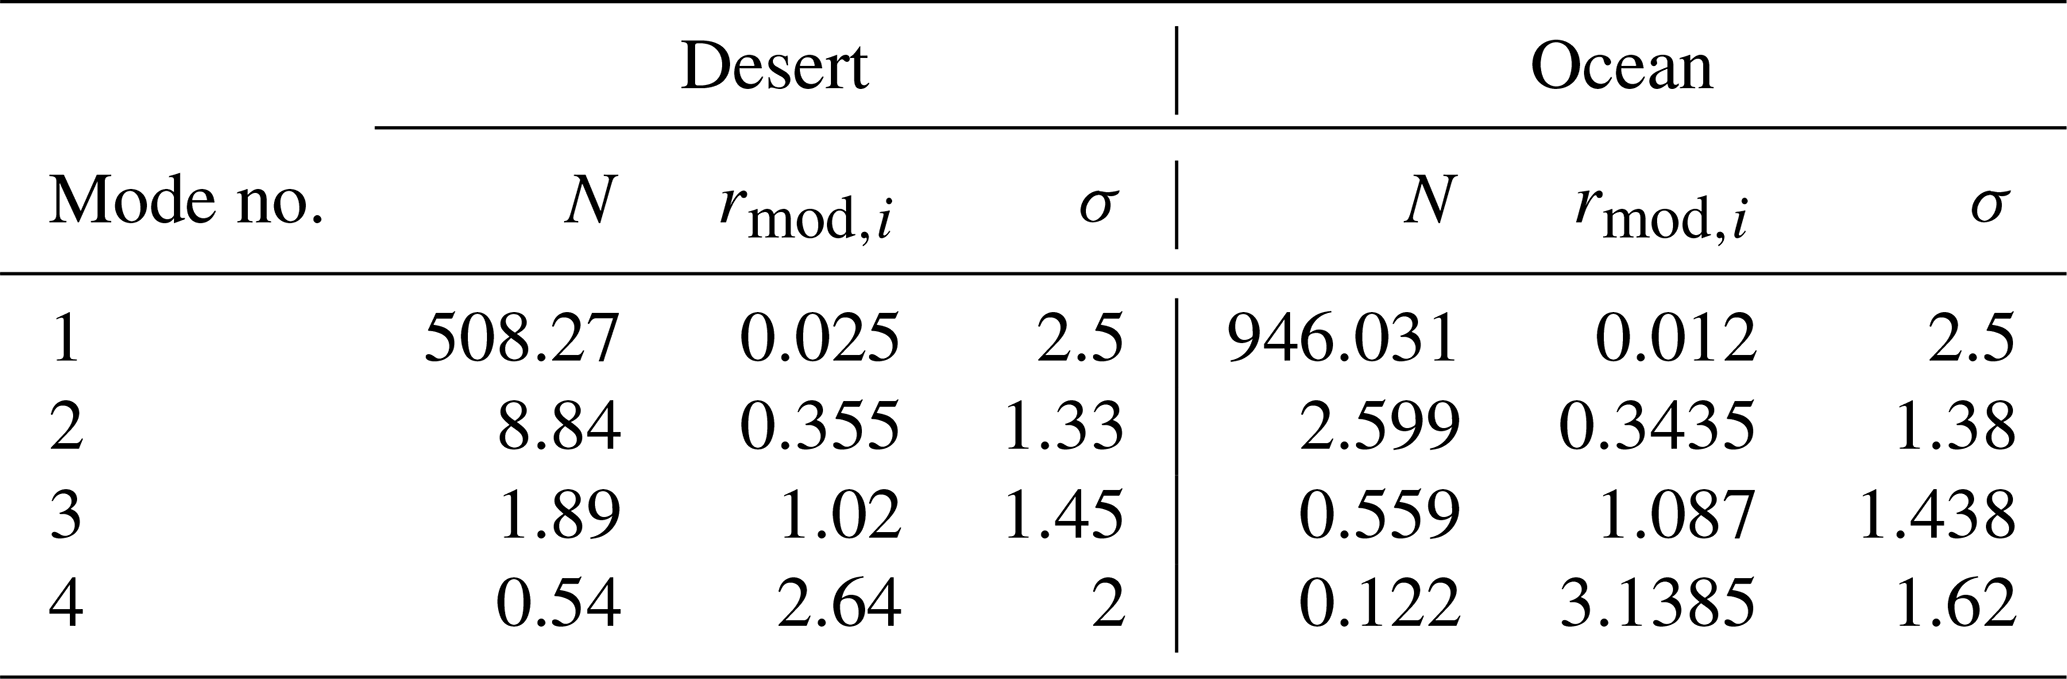
Figure 2 shows the mean log fit of the volume size distributions measured for dust particles during the Fennec campaign above dust sources and above the ocean in the SAL. A detailed presentation about the in situ measurements can be found in Ryder et al. (2013b, a, 2019). Equation (1) provides the formulation of the measured volume size distributions, as the summation of four log-normal modes, and Table 1 provides the corresponding parameters for each mode above the desert and the ocean (Ryder et al., 2013b, 2019).
Ni is the total number of particles (no. cm−3) of log-normal mode i, r is the particle radius, rmod,i is the median radius of log-normal mode i (with respect to the number size distribution), and σi is the width of log-normal mode i.
In many models the maximum radius of dust particles spans up to 10 µm (since dust is not spherical, the “radius” usually refers to the radius of the volume-equivalent sphere), whereas the measurements have shown that particles with radii of even more than 50 µm can be found. The size distributions of the dust particles considered in the models are here called SD10 (i.e., with maximum radii of 10 µm), whereas the more realistic size distributions of dust are called SD50 (i.e., with maximum radii of 50 µm). The size distributions of SD10 and SD50 above the desert and the ocean are shown in Fig. 2.
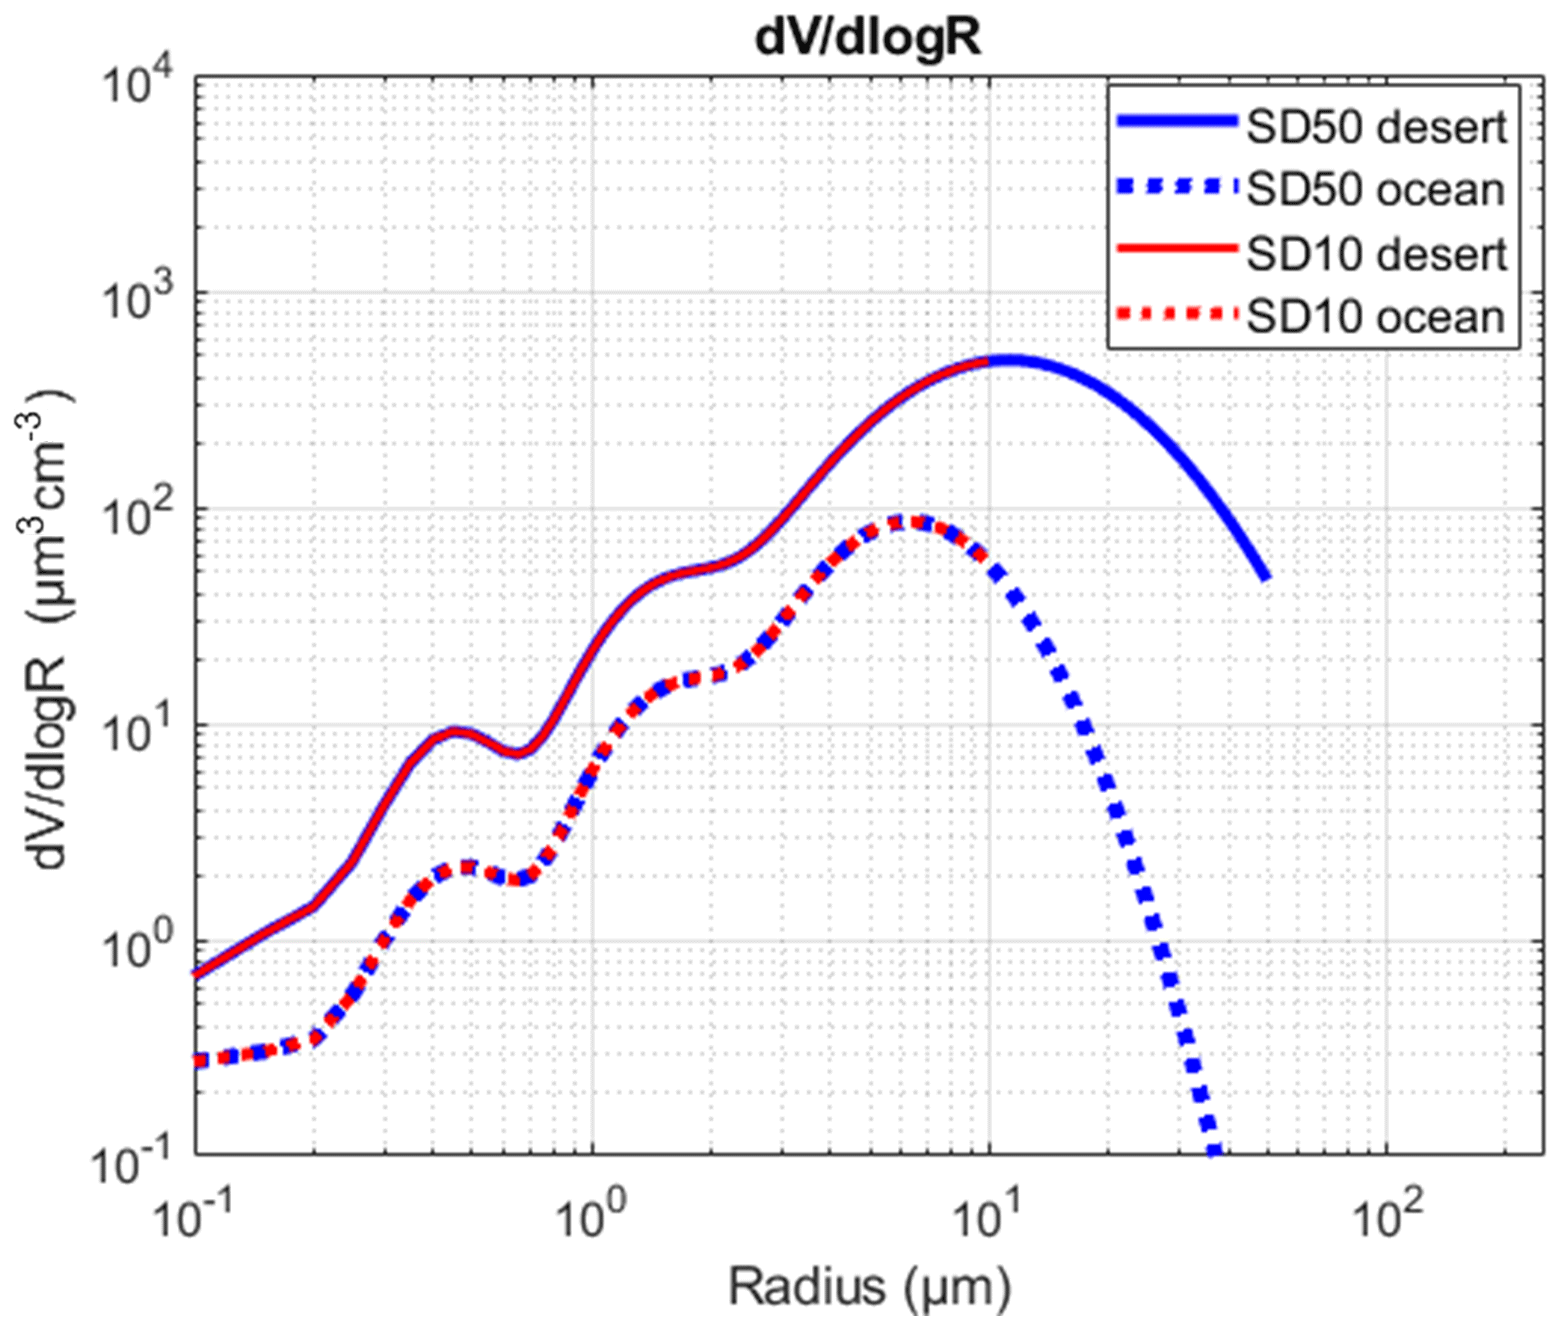
Figure 2Mean log fit of the volume size distributions measured during the Fennec campaign above the desert (solid lines) and above the ocean in the SAL (dash lines). The volume size distributions of “SD50” with a maximum radius up to 50 µm are in blue. The volume size distributions of “SD10” with a maximum radius up to 10 µm are in red.
Table 1The parameters of the mean log fit of the volume size distributions for the volume size distributions above the desert and the ocean in Fig. 2.
2.1.2 Refractive indices
We used three different spectrally resolved RIs for dust particles, as these are provided from the OPAC scattering database (d'Almeida et al., 1991; Hess et al., 1998), Colarco et al. (2014)1, and Balkanski et al. (2007) (Fig. 3). As shown in Ryder et al. (2019), these refractive indices represent the maximum, mean, and minimum values for the imaginary part of the refractive index of dust particles in the visible and near-infrared, as these are reported in the literature, thus covering the whole range of the reported values for dust. The lower imaginary part of the RI by Balkanski et al. (2007) is considered to be more appropriate for accurately representing dust properties over the region of the campaign (Rocha-Lima et al., 2018; Ryder et al., 2019) relative to the OPAC and Colarco et al. (2014) RIs.

Figure 3Spectrally resolved real (a) and imaginary (b) parts of the complex RI of desert dust particles, derived from Balkanski et al. (2007) (green), Colarco et al. (2014) (red), and OPAC (blue; d'Almeida et al., 1991; Hess et al., 1998).
2.1.3 Dust particle shape
The dust particles are typically irregularly shaped; thus, their optical properties are not easy to obtain for a wide range of RIs and wavelengths, especially for the larger sizes (e.g., Gasteiger et al., 2011). Here, we use spheres and spheroids to model the shape of dust particles, with the latter being the widely used alternative for modeling the non-spherical shape of dust grains (e.g., Dubovik et al., 2006). The shape of a spheroid is described using the ratio of the longest to the shortest diameter of the spheroid, i.e., the “aspect ratio”. If the aspect ratio is 1, then the particle is a sphere. In our work we consider that the dust particles have different spheroidal shapes described with the aspect ratio distribution (Fig. 4) measured during the Saharan Mineral Dust Experiment (SAMUM) campaign in southern Morocco (Kandler et al., 2009).
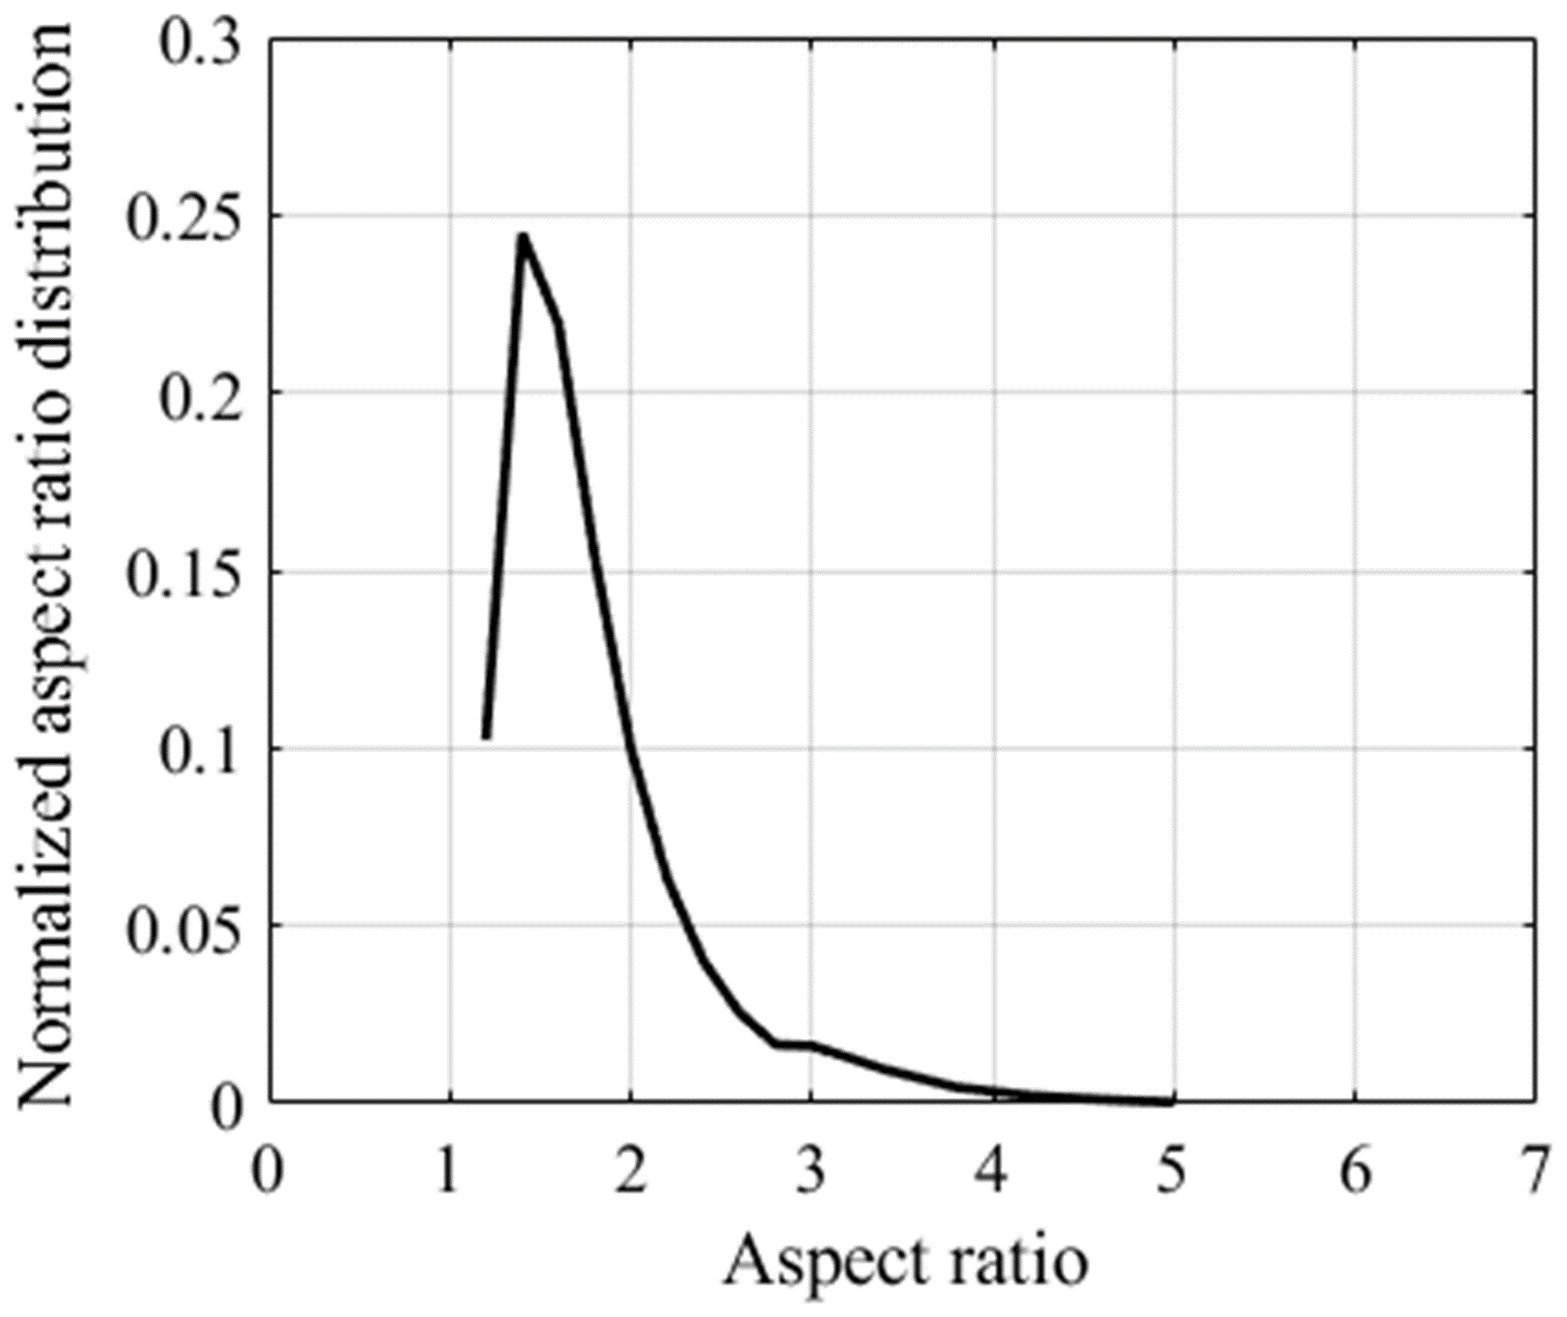
Figure 4The aspect ratio distribution of the spheroids used to model the non-spherical shape of dust in the current study, normalized by the total number of particles. The aspect ratio distribution was measured during the SAMUM campaign in southern Morocco (adapted by Kandler et al., 2009).
2.2 Optical properties
We calculated the optical properties of SD10 and SD50 dust particles using the MOPSMAP scattering database (Gasteiger and Wiegner, 2018). In MOPSMAP the optical properties are pre-calculated for single particles for a wide range of sizes and RIs for spheres, spheroids, and a set of irregular particle shapes (the latter for a small range of sizes and RIs; thus they cannot be used here). The scattering properties of the spherical particles are pre-calculated in MOPSMAP using the Mie theory (Mishchenko et al., 2002; Mie, 1908). For the spheroidal particles the scattering properties are derived with the T-matrix method (TMM) (Mishchenko et al., 1996) for size parameters (i.e., , where r is the radius of the particle and λ is the wavelength of light) 5–125 and the improved geometric optics method (IGOM) (Bi and Yang, 2013; Sun et al., 2017; Bi et al., 2009; Yang et al., 2007) for size parameters > 125. The optical properties of the particle ensembles are derived after interpolating the discrete values and performing ensemble averaging (Gasteiger and Wiegner, 2018).
The optical properties that are used as inputs for the radiative transfer calculations are the extinction coefficient, the single-scattering albedo (SSA), and the phase function, all for a spectral range of 0.35–40 µm. For the temperatures at Earth's surface considered in this study, 4 %–5 % of the total longwave radiation is emitted in the range of 40–150 µm. As in other similar studies (e.g., Ryder et al., 2019) we consider only wavelengths that are shorter than 40 µm, mainly because RIs are not available for longer wavelengths. Nevertheless, changes in aerosol properties do not practically impact the transfer of terrestrial radiation at wavelengths longer than 40 µm in the atmosphere, since water vapor absorbs all radiation in the particular spectral region. Figure 5 shows the extinction, scattering, and absorption coefficients for SD10 (dashed lines) and SD50 particles (solid lines) above the desert and the ocean. For these calculations we consider the volume size distributions discussed in Sect. 2.1 (Fig. 2). Moreover, the optical properties are calculated for the different RIs of dust used here, provided by Balkanski et al. (2007) (green line), Colarco et al. (2014) (red line), and the OPAC scattering database (blue line).
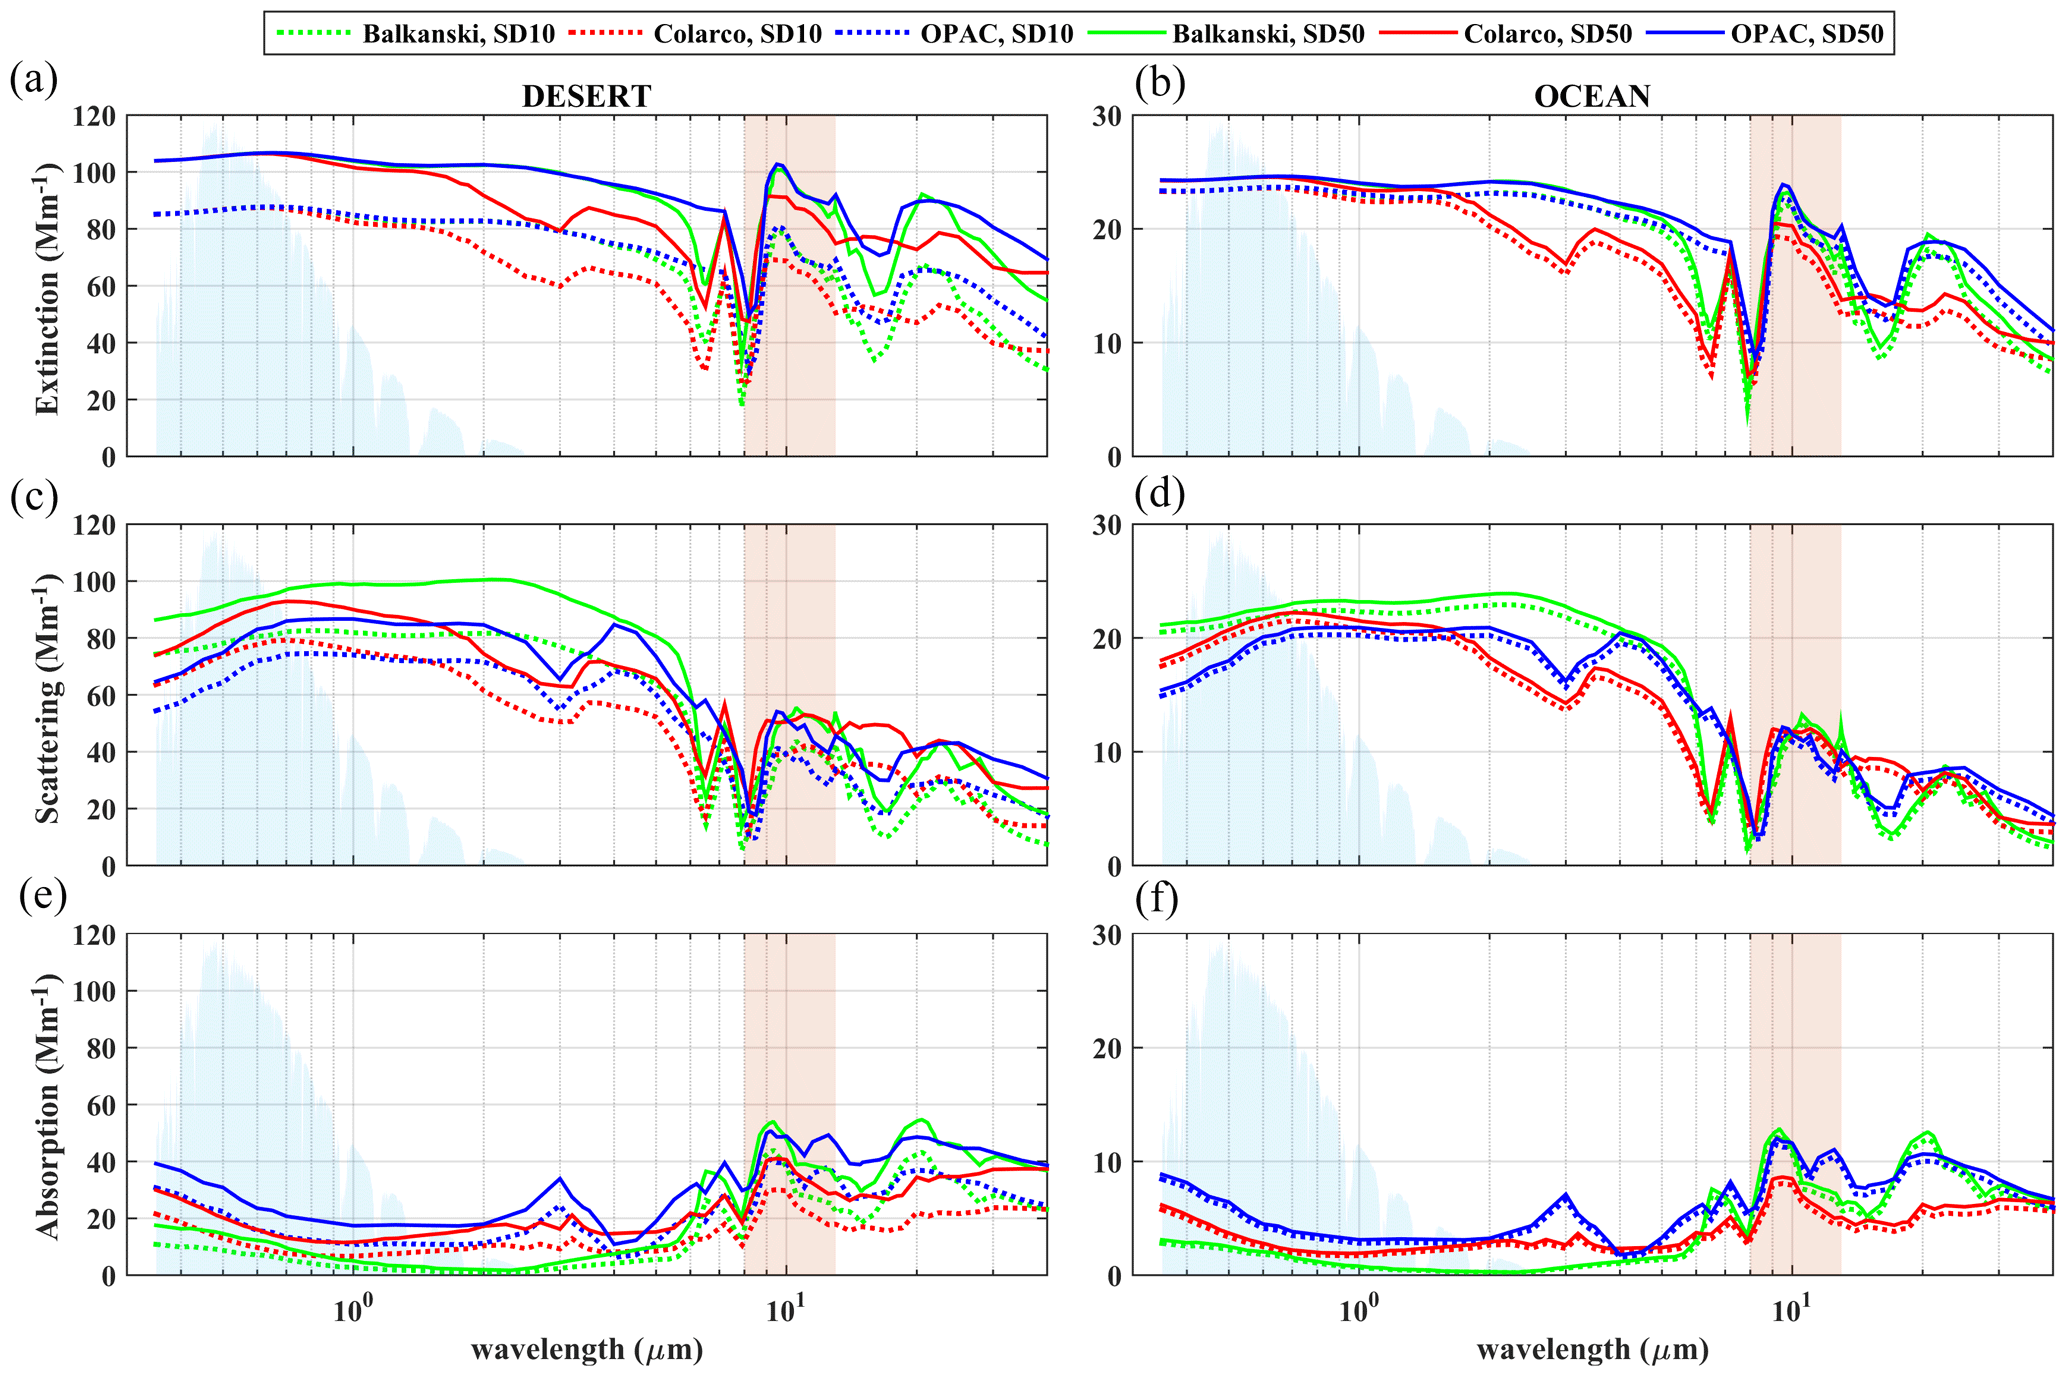
Figure 5Spectral dependence of the extinction (a, b), scattering (c, d), and absorption coefficients (e, f) for SD10 (dashed lines) and SD50 dust particles (solid lines) above the desert (a, c, e) and the ocean (b, d, f) for the three different dust RIs from Balkanski et al. (2007) (green), Colarco et al. (2014) (red), and OPAC (blue). The light-blue-shaded area represents the normalized spectrum of the SW irradiance (aerosol- and cloud-free atmosphere, SZA = 0; solar zenith angle), while the red-shaded area represents the atmospheric window in the LW region.
Above the desert (Fig. 5, left) considering the large-particle (diameter > 10 µm) increases the scattering and absorption of solar and terrestrial radiation relative to the SD10 particles. Over the ocean the differences between SD10 and SD50 particles are much smaller (Fig. 5, right) mainly because there are fewer particles with diameters between 10 and 50 µm in the mixture. In general, scattering plays a more important role relative to absorption in the SW region, whereas in the LW region the scattering and absorption efficiencies are comparable (for both SD10 and SD50).
It is a common practice in dust transport models to change the calculated dust mass concentration in order to reproduce aerosol optical depth (AOD) observations at specific wavelengths from the ground or space (e.g., Drakaki et al., 2022). Thus, the same dust optical depth (DOD) (at 500 nm) has been used for the radiative transfer calculations (see Sect. 3) for the different SDs, shapes, and RIs considered in this study.
Considering the same DOD value at 0.5 µm means that the extinction coefficient is normalized at this wavelength (i.e., the overall aerosol mass and volume are implicitly modified in order to achieve the same DOD at 0.5 µm for different particles). Thus, at 0.5 µm, differences in the radiative effects of dust depend on the relative contribution of scattering and absorption (i.e., the SSA). For different SDs and RIs, absorption and scattering coefficients change differently with wavelength, which means that the DOD does not remain the same for the different dust species with changing wavelength and that differences in the SSA also depend on wavelength. To better understand how changing dust optical properties affect radiative transfer, the extinction, scattering, and absorption coefficients normalized by their respective values at 0.5 µm, along with the SSA, are presented in Fig. 6. As shown in Fig. 6b, d, f, and h, the very small fraction of large particles in the aerosol mixture above the ocean results in similar behavior for SD10 and SD50. Over the desert, however, the fraction of large particles is higher considering SD50 instead of SD10, resulting in larger differences in scattering and absorption (Fig. 6a, c, e, g). Thus, for example, the same DOD at 0.5 µm results in higher DOD at 10 µm for SD50 relative to SD10. In the SW region, the SSA (Fig. 6g) for SD50 is lower than the SSA for SD10 (i.e., the relative contribution of absorption is more important). In the region of 8–13 µm (atmospheric window), as well as in the SW region, differences in the SSA depend strongly on the RI used.
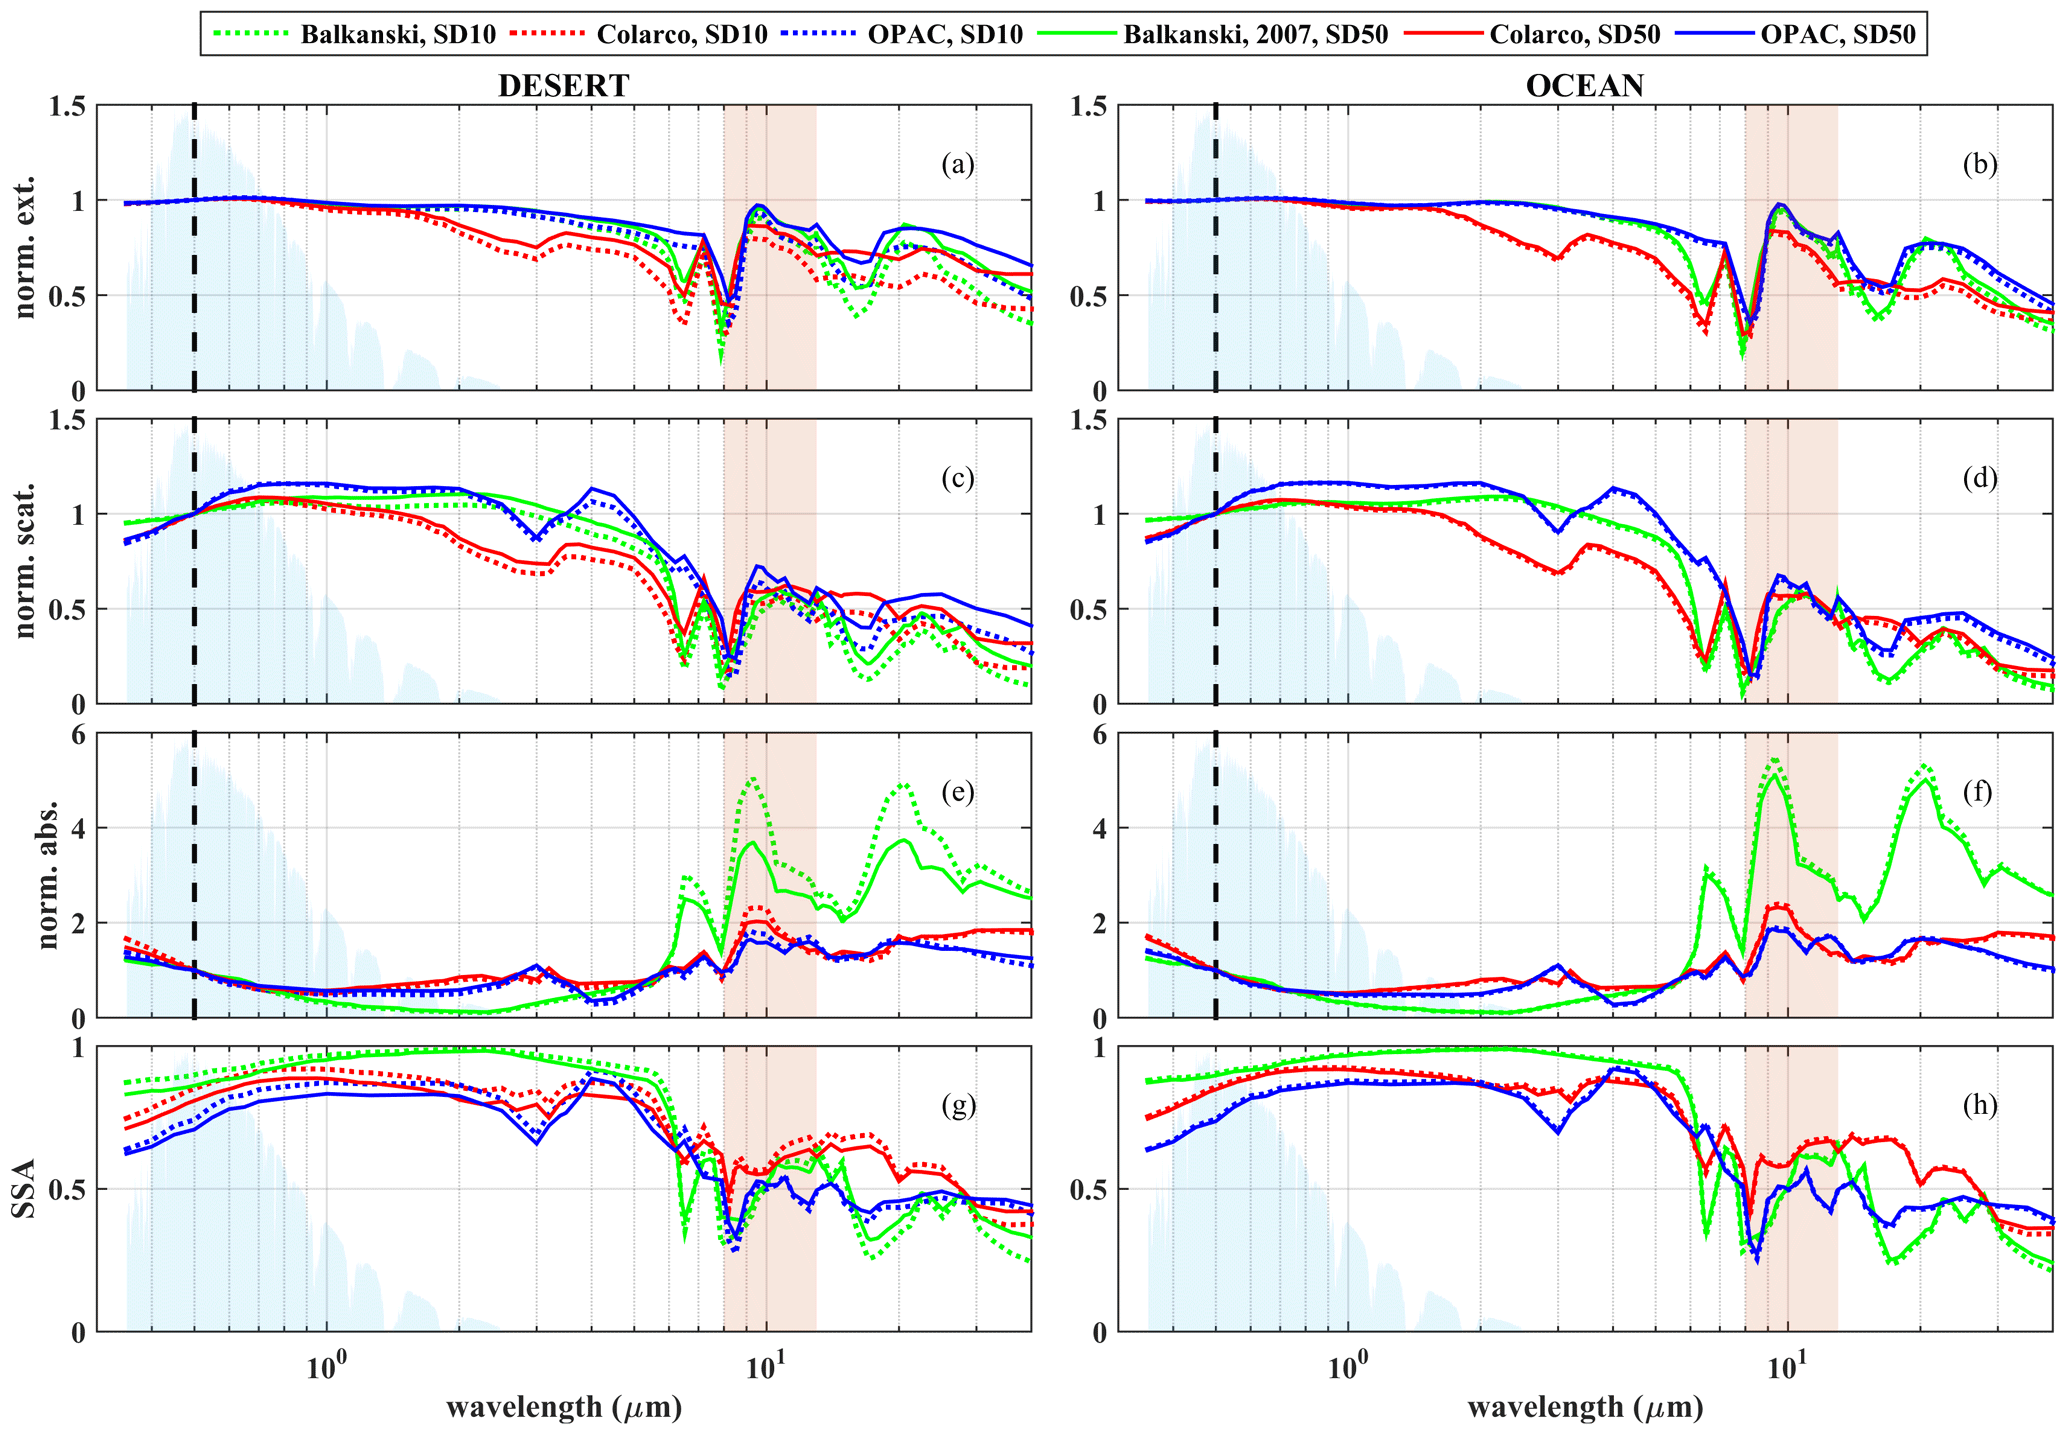
Figure 6Spectral dependence of the normalized extinction coefficient (a, b), normalized scattering coefficient (c, d), absorption coefficients (e, f), and SSA (g, h) for SD10 (dash lines) and SD50 dust particles (solid lines) above the desert (left) and the ocean (right) for the three different dust RIs from Balkanski et al. (2007) (green), Colarco et al. (2014) (red), and OPAC (blue). Normalization has been performed relative to the extinction, scattering, and absorption values at 0.5 µm. The light-blue-shaded area represents the normalized spectrum of the SW irradiance (aerosol- and cloud-free atmosphere, SZA = 0), while the red-shaded area represents the atmospheric window in the LW region.
Figure 7 shows the effect of the shape in the optical properties of dust, when considering spheroidal shapes instead of spheres, for SD50 dust particles near the dust sources (blue solid line in Fig. 2). The differences in the extinction, scattering, and absorption coefficients are small, at 1 %–10 % for the whole range of the spectrum and for the three different RIs considered here (Fig. 7a). The differences are even smaller for dust particles above the ocean (not shown here), due to the presence of fewer large dust particles. The differences are larger for the angular distribution of the scattered light, at large scattering angles, as shown for the normalized phase function at 0.5 µm in Fig. 7b. As discussed in Sect. 3.1, these differences do not result in large differences in the irradiance at TOA and BOA. This does not necessarily mean that the shape of dust does not play a role in the calculation of its optical and radiative properties. It only indicates that for spherical and spheroidal particles with the aspect ratio distribution considered here (Fig. 4), the differences are small. This may not be the case though for more realistic shapes of dust particles (e.g., Saito and Yang, 2021; Gasteiger et al., 2011).
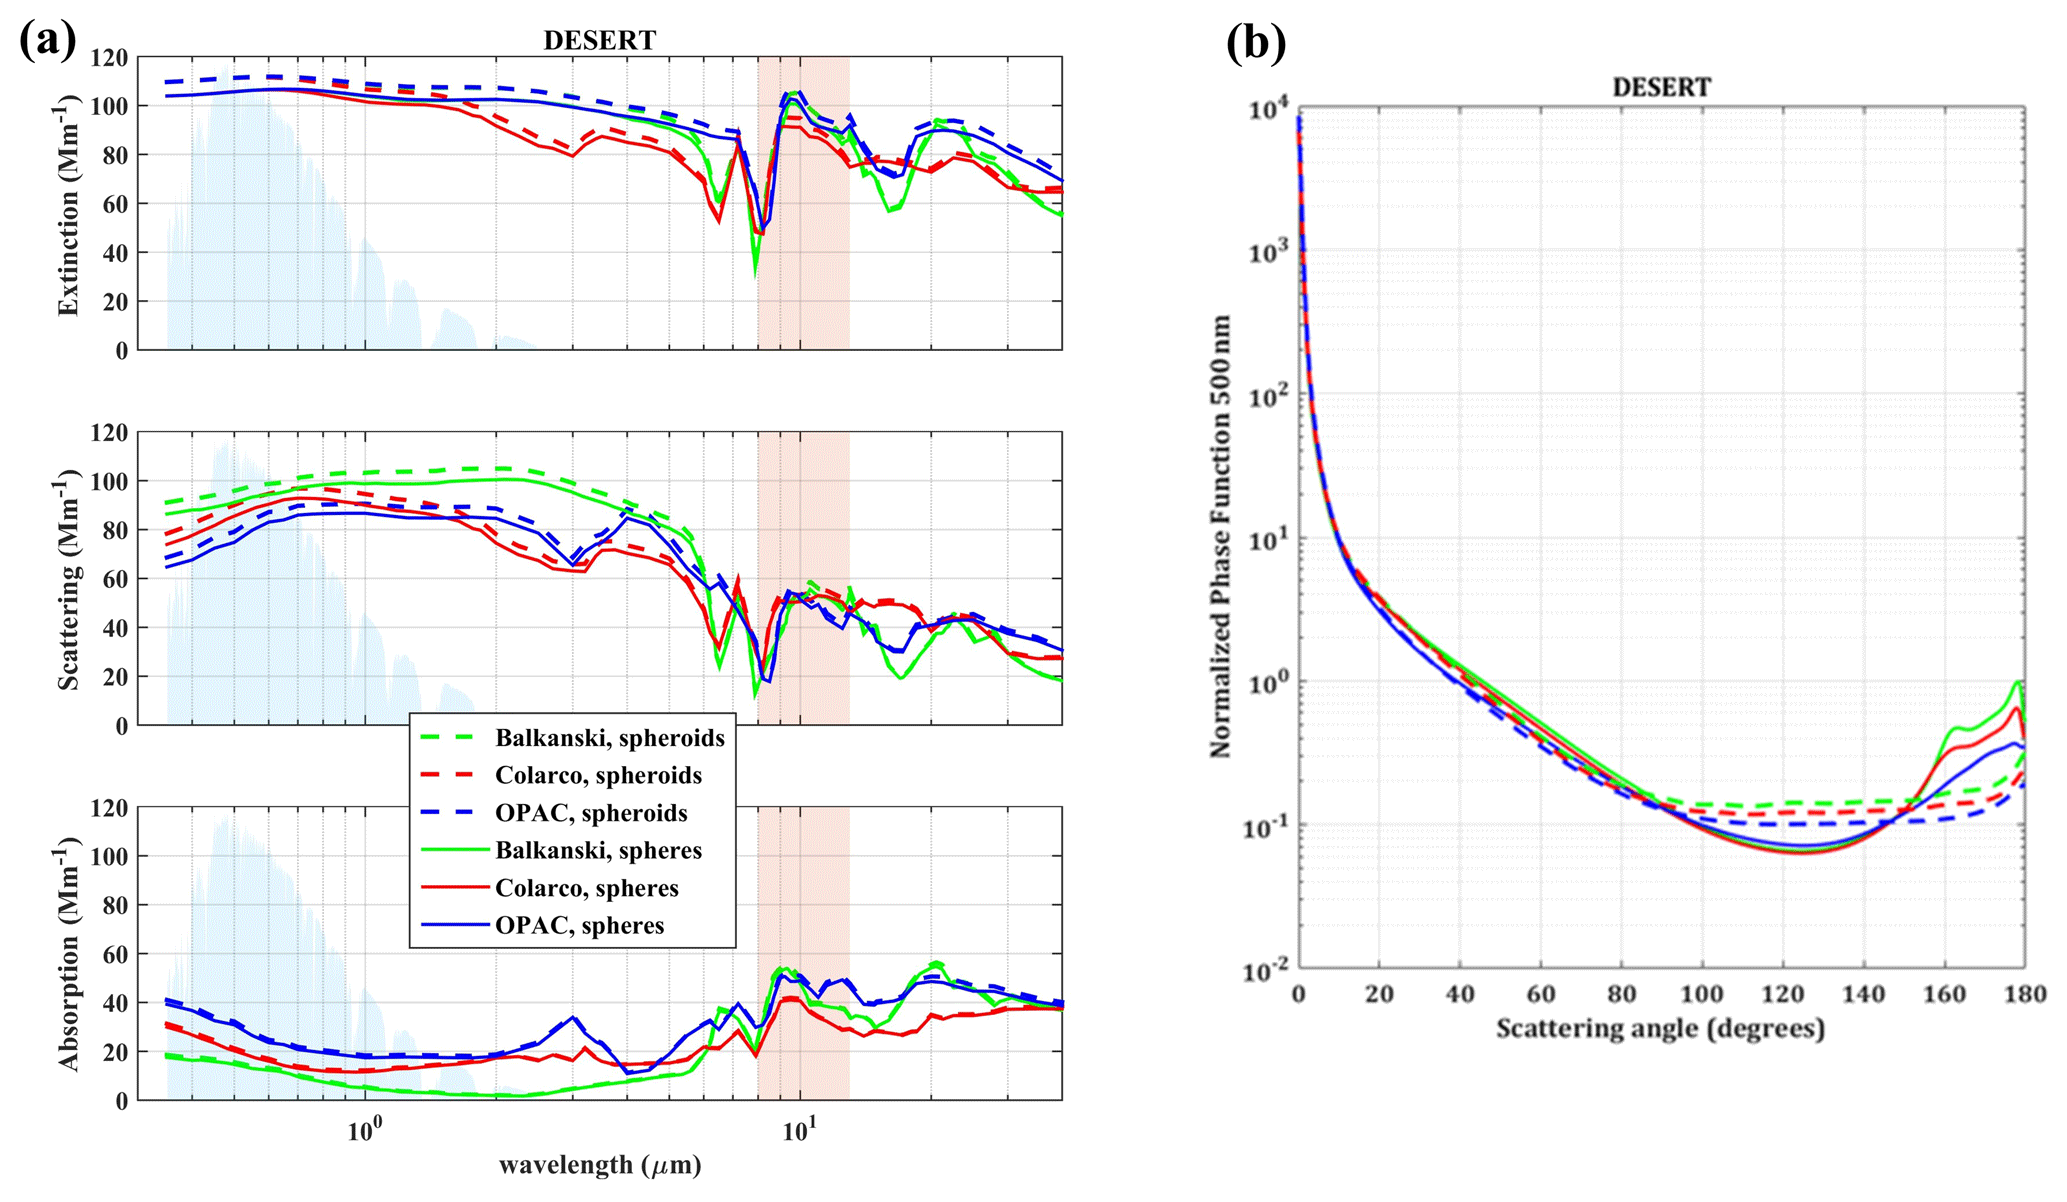
Figure 7(a) Spectral dependence of the extinction (up), scattering (middle), and absorption coefficients (bottom). The light-blue-shaded area represents the normalized spectrum of the SW irradiance (aerosol- and cloud-free atmosphere, SZA = 0), while the red-shaded area represents the atmospheric window. (b) Normalized phase function at 0.5 µm. The optical properties are calculated for SD50 dust particles, with spherical (solid lines) and spheroidal shapes (dash lines) above the desert for the three different dust RIs from Balkanski et al. (2007) (green), Colarco et al. (2014) (red), and OPAC (blue).
2.3 Radiative transfer modeling
Radiative transfer calculations were performed with the libRadtran software (Mayer and Kylling, 2005; Emde et al., 2016). libRadtran is a library of radiative transfer solvers, atmospheric and topographic data, and various aerosol optical properties. Here, we employed the radiative transfer solver MYSTIC (Mayer, 2009), which simulates the random path of the photons through the atmosphere (in one, two, or three dimensions in space) and calculates the radiance, irradiance, and actinic flux at any height. MYSTIC follows the Monte Carlo approach to determine a step width for each photon, the probability of the photon to be absorbed or scattered, and the new direction of the photon in the case of scattering. MYSTIC calculations can be performed in scalar mode neglecting polarization and in vector mode where polarization is fully considered. The implementation of vector radiative transfer calculations in MYSTIC is described in detail in Emde et al. (2010). Using highly peaked phase matrices increases computational time and the level of noise in the results. The number of photons needed to yield a noise-free result can be diminished by applying variance reduction techniques. A sophisticated variance reduction technique is applied in MYSTIC, which works in the same way for scalar and vector simulations (Buras and Mayer, 2011). Furthermore, MYSTIC applies periodic boundary conditions in the x and y directions, which means that photons that leave the domain on one side at a certain vertical position re-enter the domain on the opposite side at the same vertical position without changing their propagation direction.
We used MYSTIC and performed radiative transfer calculations in vector mode. MYSTIC was chosen instead of one of the simpler and faster (deterministic) solvers included in libRadtran (e.g., DISORT, discrete ordinate radiative transfer; Stamnes et al., 1988) because it allows for including polarization in the simulations. Nevertheless, polarization was found to have very small effect on the results of the study. After a comprehensive testing, the number of photons selected for the simulations is 108 photons, which results in differences that are well below 1 % when the simulated spectral irradiance is on the order of 0.1 W m−2 nm−1 or larger. For weaker signals the uncertainty increases. However, spectral regions where the signal is weaker have a negligible impact on the calculation of the integrals of the SW and LW irradiances and thus on the results of this study. The libRadtran settings that were used for the study are summarized in Table 1.
Table 2libRadtran settings used for the radiative transfer simulations.
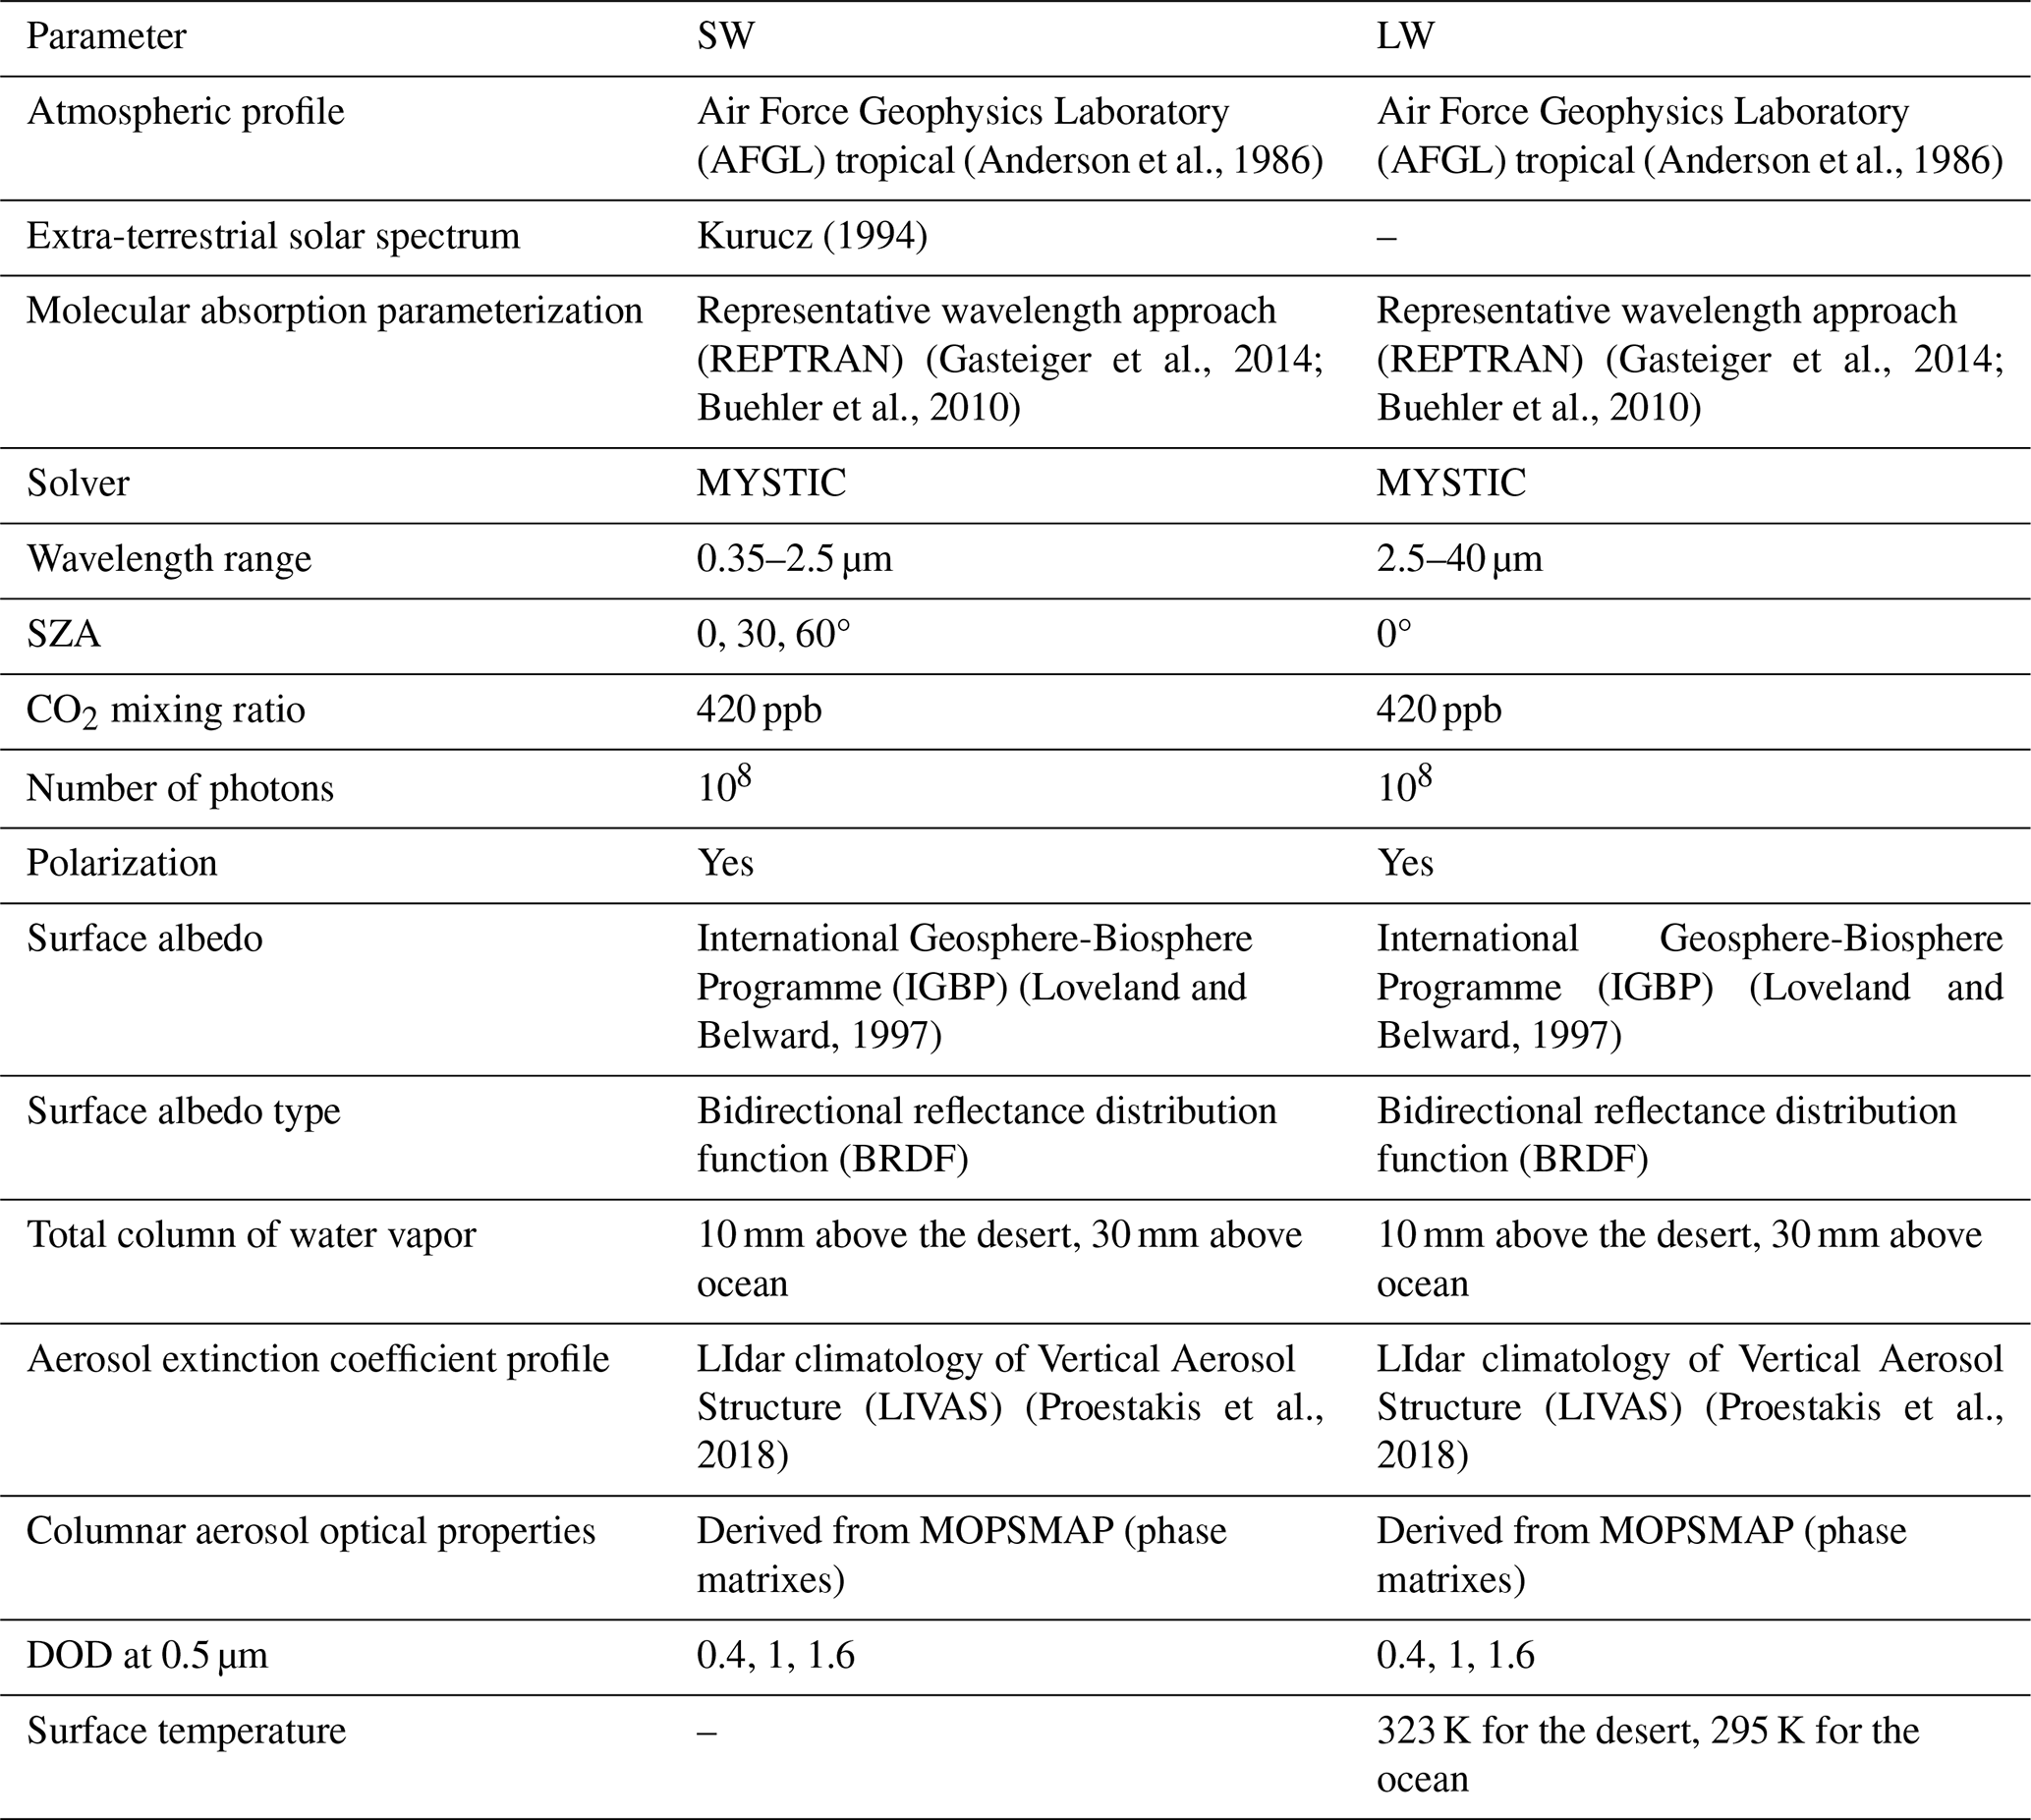
The spectral SW and LW irradiances at BOA and TOA were simulated assuming two different types of reflective surfaces: ocean and desert. The total column water vapor (TCWV) was considered at 10 and 30 mm over the desert and the ocean, respectively, based on reanalysis data from the Modern-Era Retrospective analysis for Research and Applications, Version 2 (MERRA-2; GMAO, 2015), for the area of the study. Surface temperatures of 323 and 295 K were considered typical values for the desert and the ocean (SAMUM; Otto et al., 2009). In all cases, a default climatological tropical atmospheric profile (Anderson et al., 1986) and a default CO2 concentration of 420 ppb were considered. For the spectral simulations of the SW irradiance the Kurucz extra-terrestrial solar spectrum (Kurucz, 1994) was used. Simulations were performed in vector mode for a DOD at 0.5 µm (from here referred as DOD) of 0.4, 1, and 1.6 and an SZA of 0, 30, and 60°. For the LW region the results of the simulations are independent of the SZA, and thus simulations for the LW region were performed only for SZA = 0°. Nevertheless, for the sake of comparability these simulations are also referred to as simulations for SZA = 30° and SZA = 60°. The extinction coefficient profiles that we used in the calculations were derived from the European Space Agency (ESA) LIdar climatology of Vertical Aerosol Structure for space-based lidar simulation studies activity (LIVAS) database (Amiridis et al., 2015). More specifically, we have used the LIVAS pure-dust extinction coefficient product (Amiridis et al., 2013; Marinou et al., 2017; Proestakis et al., 2018), as established based on the Cloud-Aerosol Lidar with Orthogonal Polarization (CALIOP) backscatter coefficient and particulate depolarization ratio profiles at 532 nm. The LIVAS pure-dust extinction coefficient profiles in this study are extracted following climatological aggregation of all LIVAS profiles for the months of June, July, and August of 2006 to 2018 over the areas of interest. We should note though that the extinction coefficient profiles used provide only the vertical distribution of the extinction coefficient, whereas the actual values of the extinction coefficient at each height are scaled according to the fixed total AOD we use, as mentioned above. Based on the extinction coefficient profiles and the assumed dust optical properties, the mass concentration profiles have been estimated and used as inputs for the simulations over the desert and the ocean (Fig. A1 in the Appendix). It should be mentioned however that, at least for the SW region, the aerosol profile has a minor impact on the amount of radiation that finally reaches the top or the bottom of the atmosphere (Fountoulakis et al., 2022). The surface albedo used for the simulations in the LW region is ∼ 0.05 at 10 µm. For the SW region it depends more significantly on the type of the surface (Fig. A2)
Simulations were performed for all (four) possible combinations of the following cases:
-
assuming that particles are spheres or spheroids
-
considering that size distribution spans up to 10 µm (i.e., SD10) or up to 50 µm (i.e., SD50).
We also considered two reference cases, one for desert and one for ocean, for aerosol-free skies, providing the “reference irradiances” above the desert and the ocean.
The dust radiative effects, under the assumption of different particles shapes (spheres vs. spheroids) and sizes (SD10 vs. SD50), have been assessed, and they have been expressed as differences in corresponding irradiances, as well as differences in the integrated values for the corresponding SW and LW spectra. The results are discussed separately for the SW and LW irradiances, due to the significant differences in the physical mechanisms that control the radiative transfer of light in these spectral regions. Changes in aerosols practically affect LW irradiance only in the range of 8–13 µm (atmospheric window). At shorter and longer wavelengths of the thermal spectrum the absorption from water vapor and CO2 are so strong that changes in any other atmospheric constituent have a minor contribution to the overall absorption and emission of the thermal irradiance. Thus, differences in LW irradiance that were estimated for wavelengths outside the atmospheric window were in all cases within the uncertainty of the simulations. In the following, differences in SW irradiance refer to the spectral range of 0.35–2.5 µm and differences in the LW irradiance refer to the atmospheric window at 8–13 µm, while the total LW irradiance, when calculated, is the integral of the irradiance in the range of 2.5–40 µm.
3.1 Differences in irradiance due to shape
As a first step, the differences in SW and LW irradiances (Fspheroids and Fspheres) due to the different shape of the particles were calculated. For the calculations we considered only large dust particles (i.e., SD50).
The presented relative differences are calculated as shown in Eqs. (2) and (3).
For the number of photons used to perform the simulations (i.e., 108 photons), the estimated statistical noise in the integrals of the simulated SW is very small (< 0.1 %), while the noise in the simulated LW region is larger (on the order of 1 %).
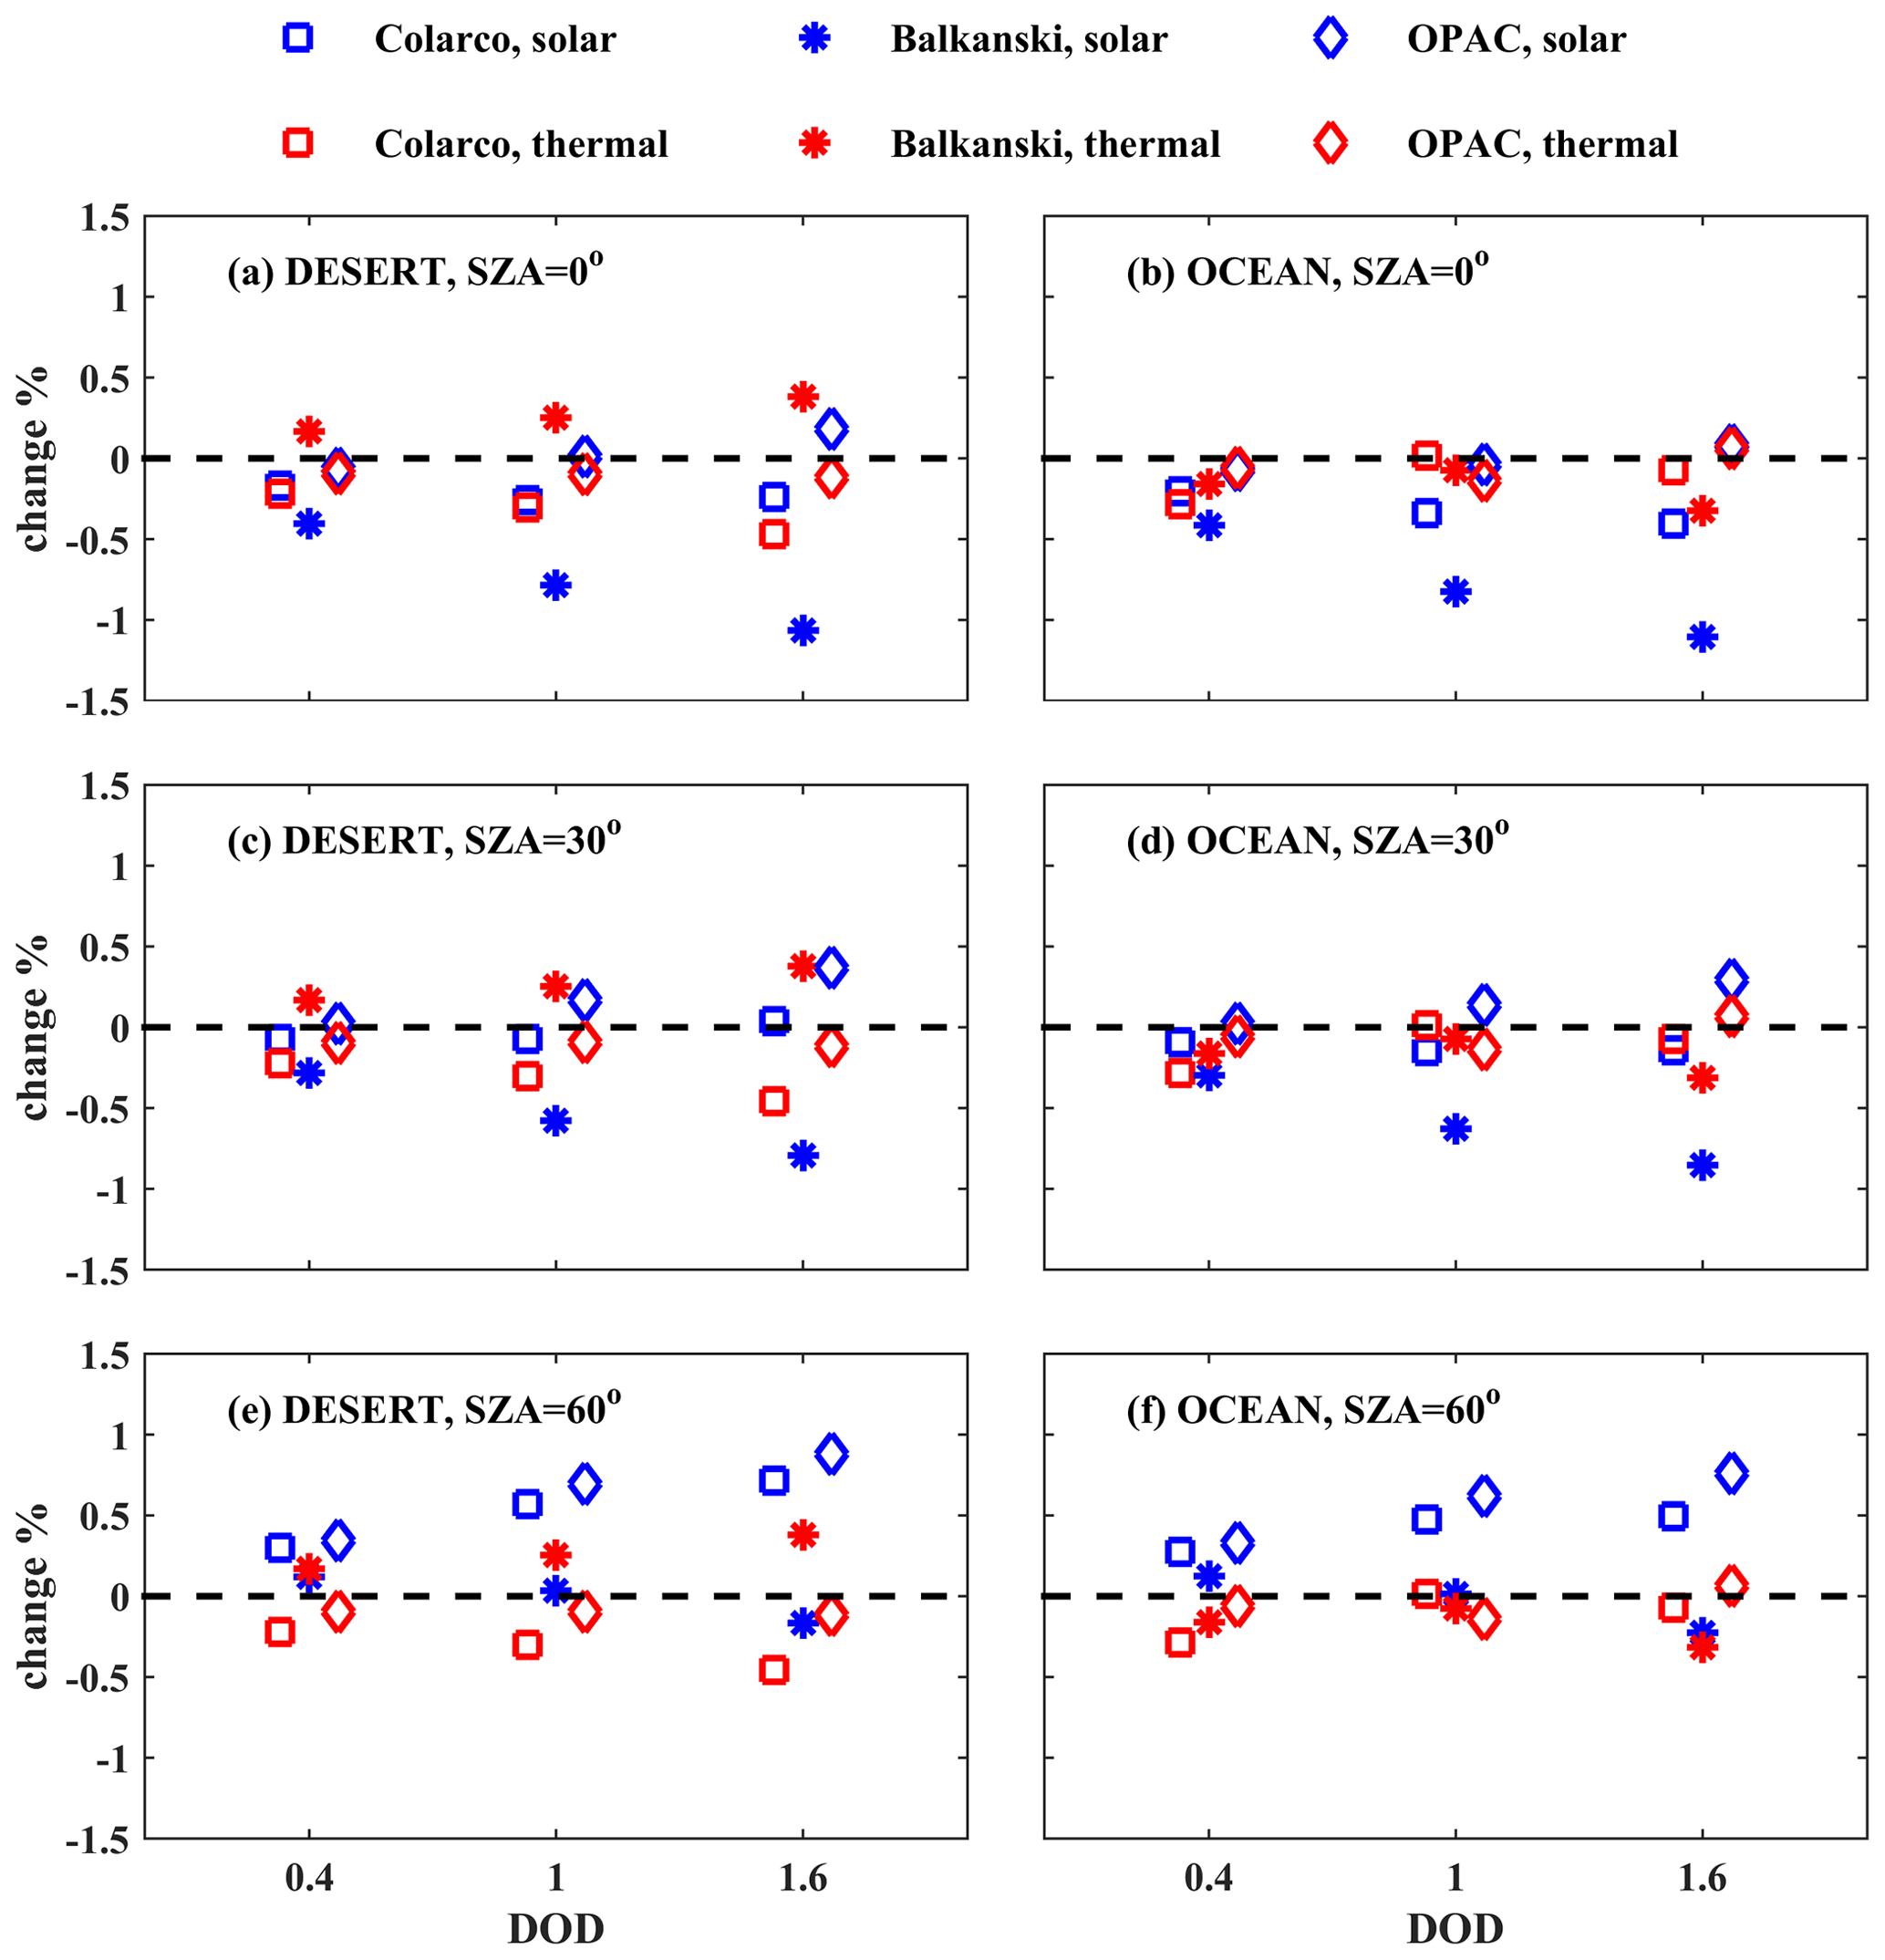
Figure 8Relative differences (%) for the irradiances in the SW (blue) and LW (red) regions at BOA for SD50 considering spherical and spheroidal shapes (see Eq. 2). The differences are presented for calculations above the desert and the ocean for different RIs of the dust particles, DODs, and SZAs.
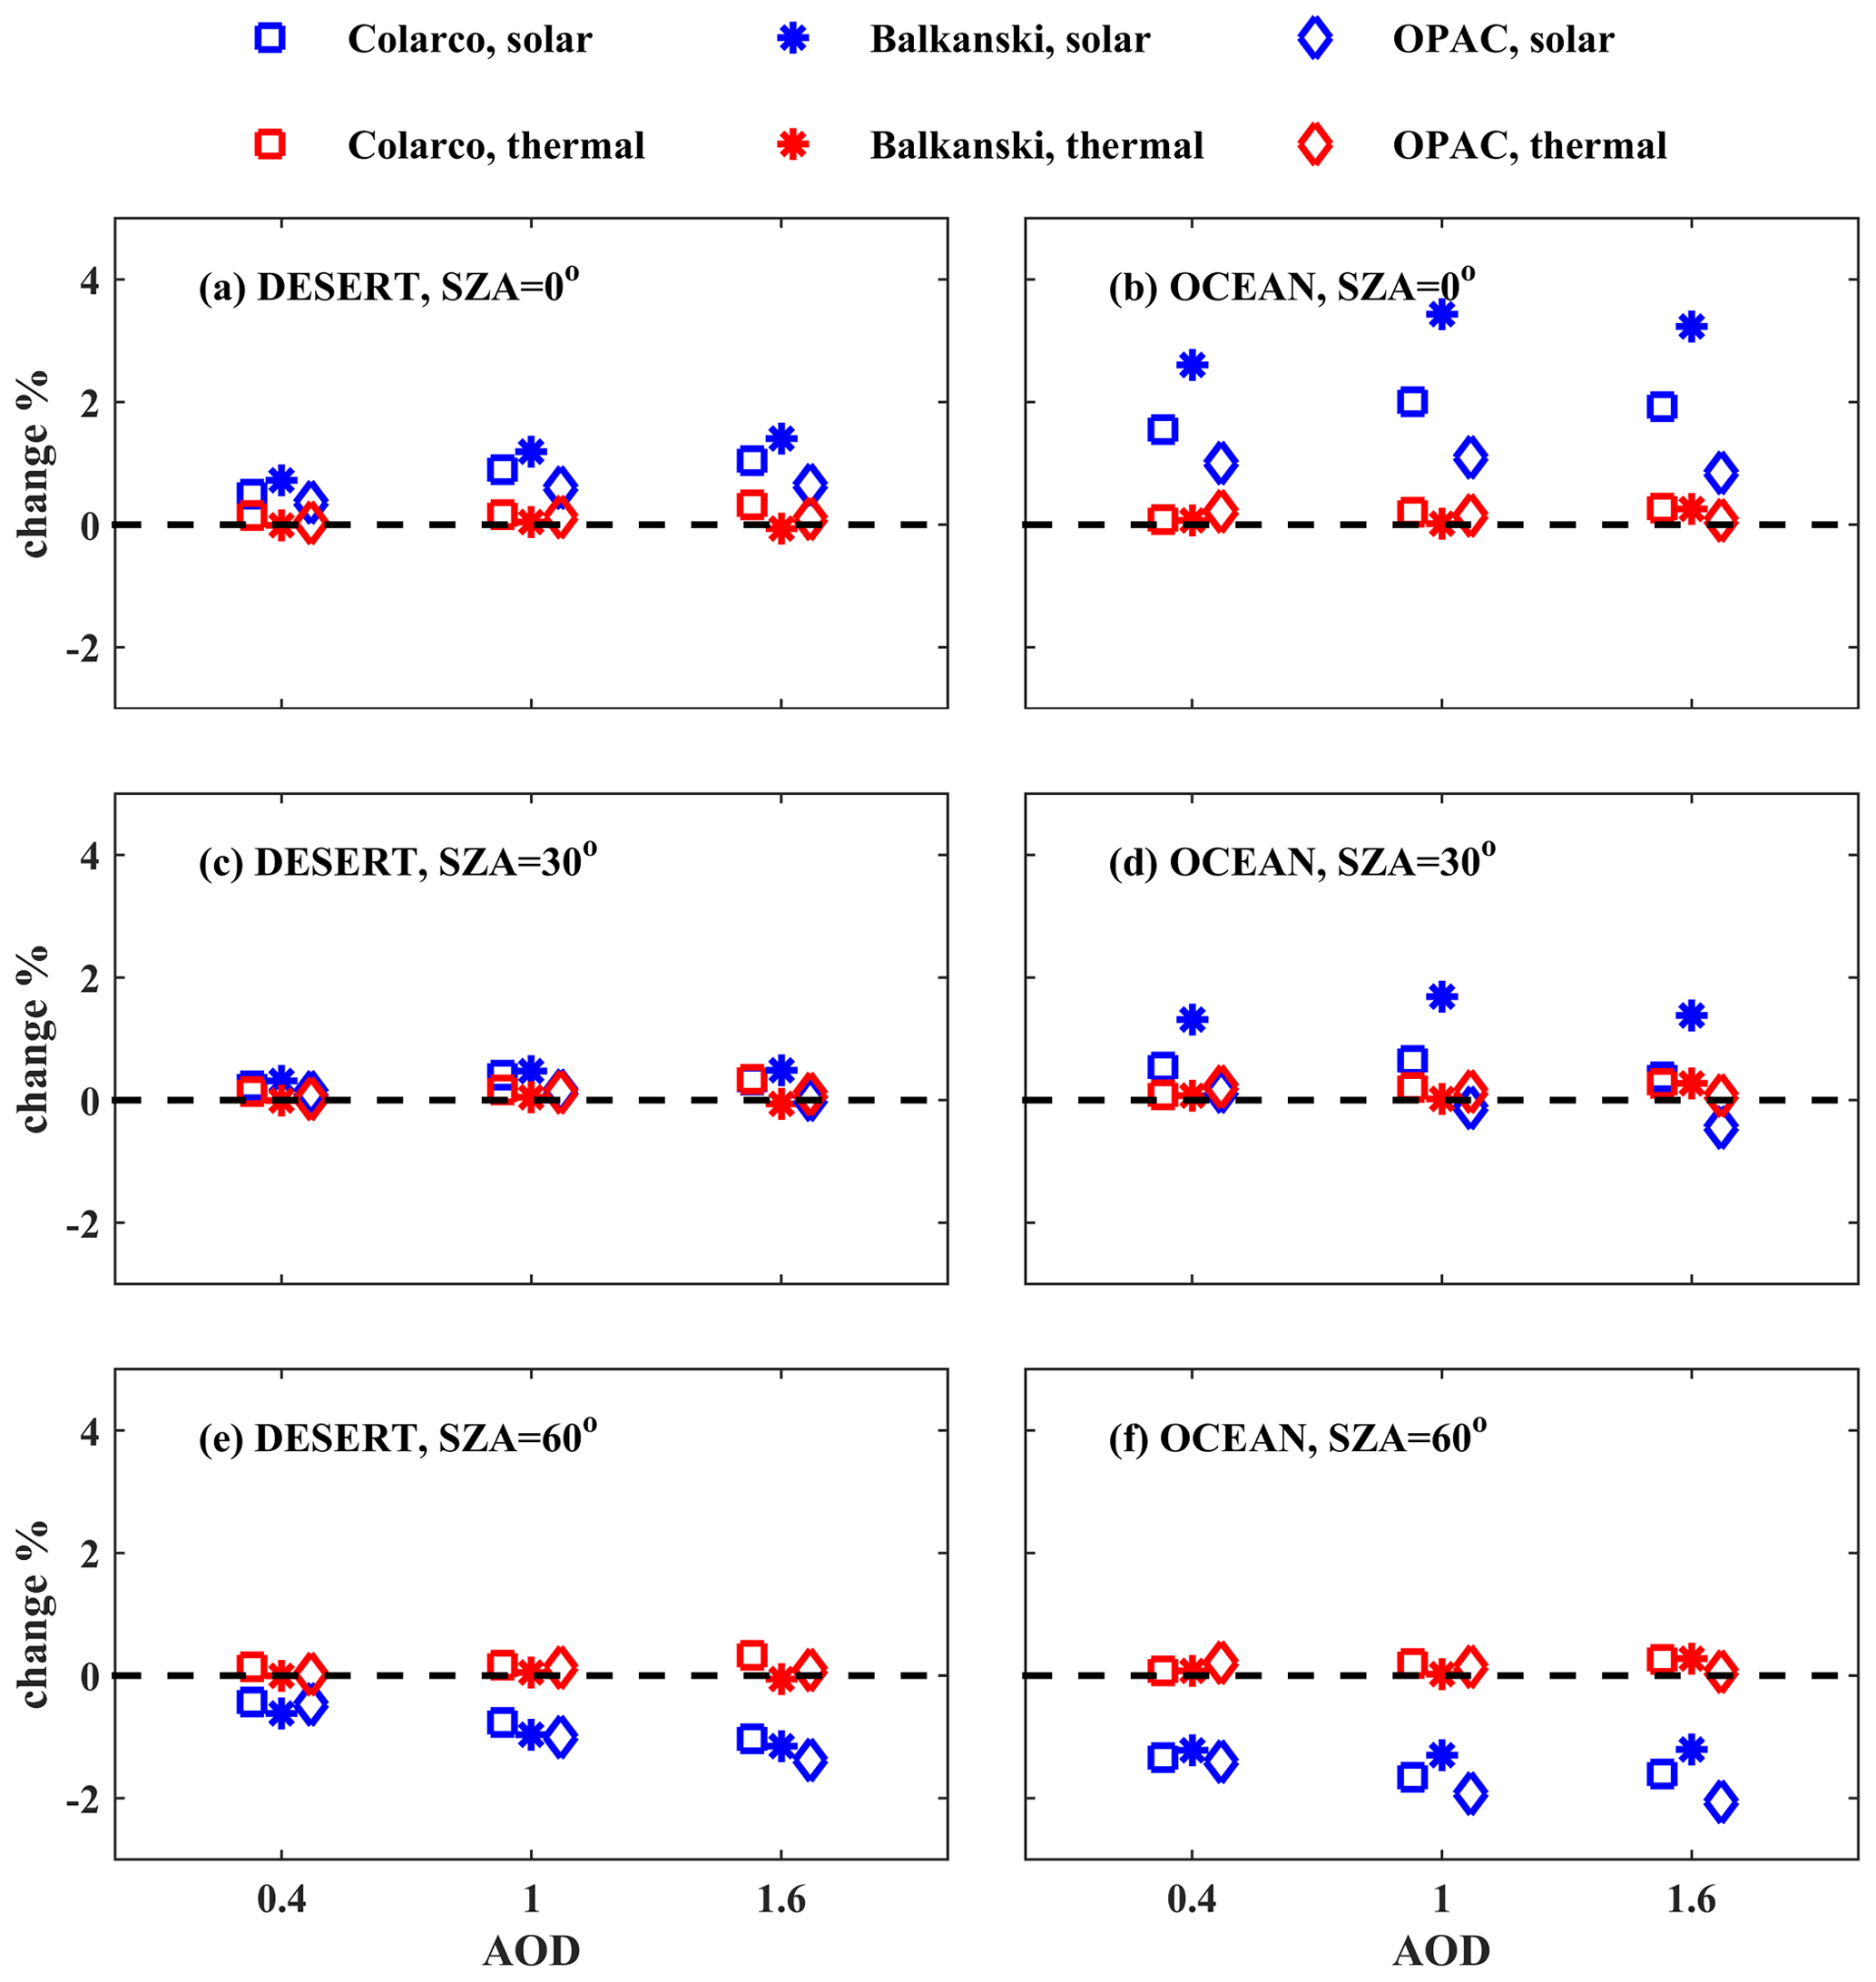
Figure 9Same as Fig. 8 for the relative differences (%) for the irradiances in the SW (blue) and LW (red) regions at TOA.
As shown in Fig. 8, for different dust particle shapes, differences below 1.5 % for the SW region and below 0.5 % for the LW region were found at BOA for all conditions considered in the study (i.e., different values of RI, surface albedo, DOD, and SZA), whereas at TOA the differences were below 4 % (Fig. 9). Although differences are small, it is still interesting that the sign of differences in the SW region can alter depending on the SZA, as well as that differences in the SW region increase with an increasing DOD. While at BOA differences are similar over the desert and over the ocean, at TOA the differences in the SW region are larger over the ocean than over the desert. In the LW the differences are generally within the level of noise. In the SW region, using the RI of Balkanski et al. (2007) leads to more positive differences relative to using the RIs of OPAC and WMO (1983), due to the higher scattering imposed by the former (Fig. 7a). The differences that are shown in Fig. 8 (for BOA) are comparable to the level of statistical noise and should be treated with caution. While the absolute magnitude of the differences for TOA shown in Fig. 9 should be also treated with caution, the change in the sign of the differences is possibly real and not the result of statistical noise.
3.2 Differences in irradiance due to size
This section presents the differences in SW and LW irradiances for different SDs considered for dust particles (i.e., SD10 and SD50). We found larger differences relative to the ones related to shape (Sect. 3.1). Spectral differences are also discussed in this section in order to understand how differences in spectral optical properties affect the results. Equation (4) provides the absolute difference, and Eq. (5) provides the corresponding relative difference. FSD10 is the irradiance for SD10, while FSD50 is the irradiance for SD50.
3.2.1 Spectral differences
In this section, the absolute and relative differences in the SW and LW irradiances, when SD10 and when SD50 dust particles are considered, are discussed with respect to wavelength. The differences are presented, when dust is above the desert, for SZA = 30° and DOD = 1.6 (Fig. 10). Changing any of these parameters (i.e., type of surface, SZA, DOD) has a very small impact on the spectral patterns of the differences and affects mainly their magnitude. It should be kept in mind that in the following figures the x axis is in logarithmic scale. In spectral regions where the effect of components such as water vapor dominates over the effect of aerosols, the absolute differences are practically zero and the calculated differences (%) are highly uncertain. Thus, for clarity the differences in the LW region are presented only for 8–13 µm. Differences in upwelling irradiances at TOA and downwelling irradiances at BOA are presented.
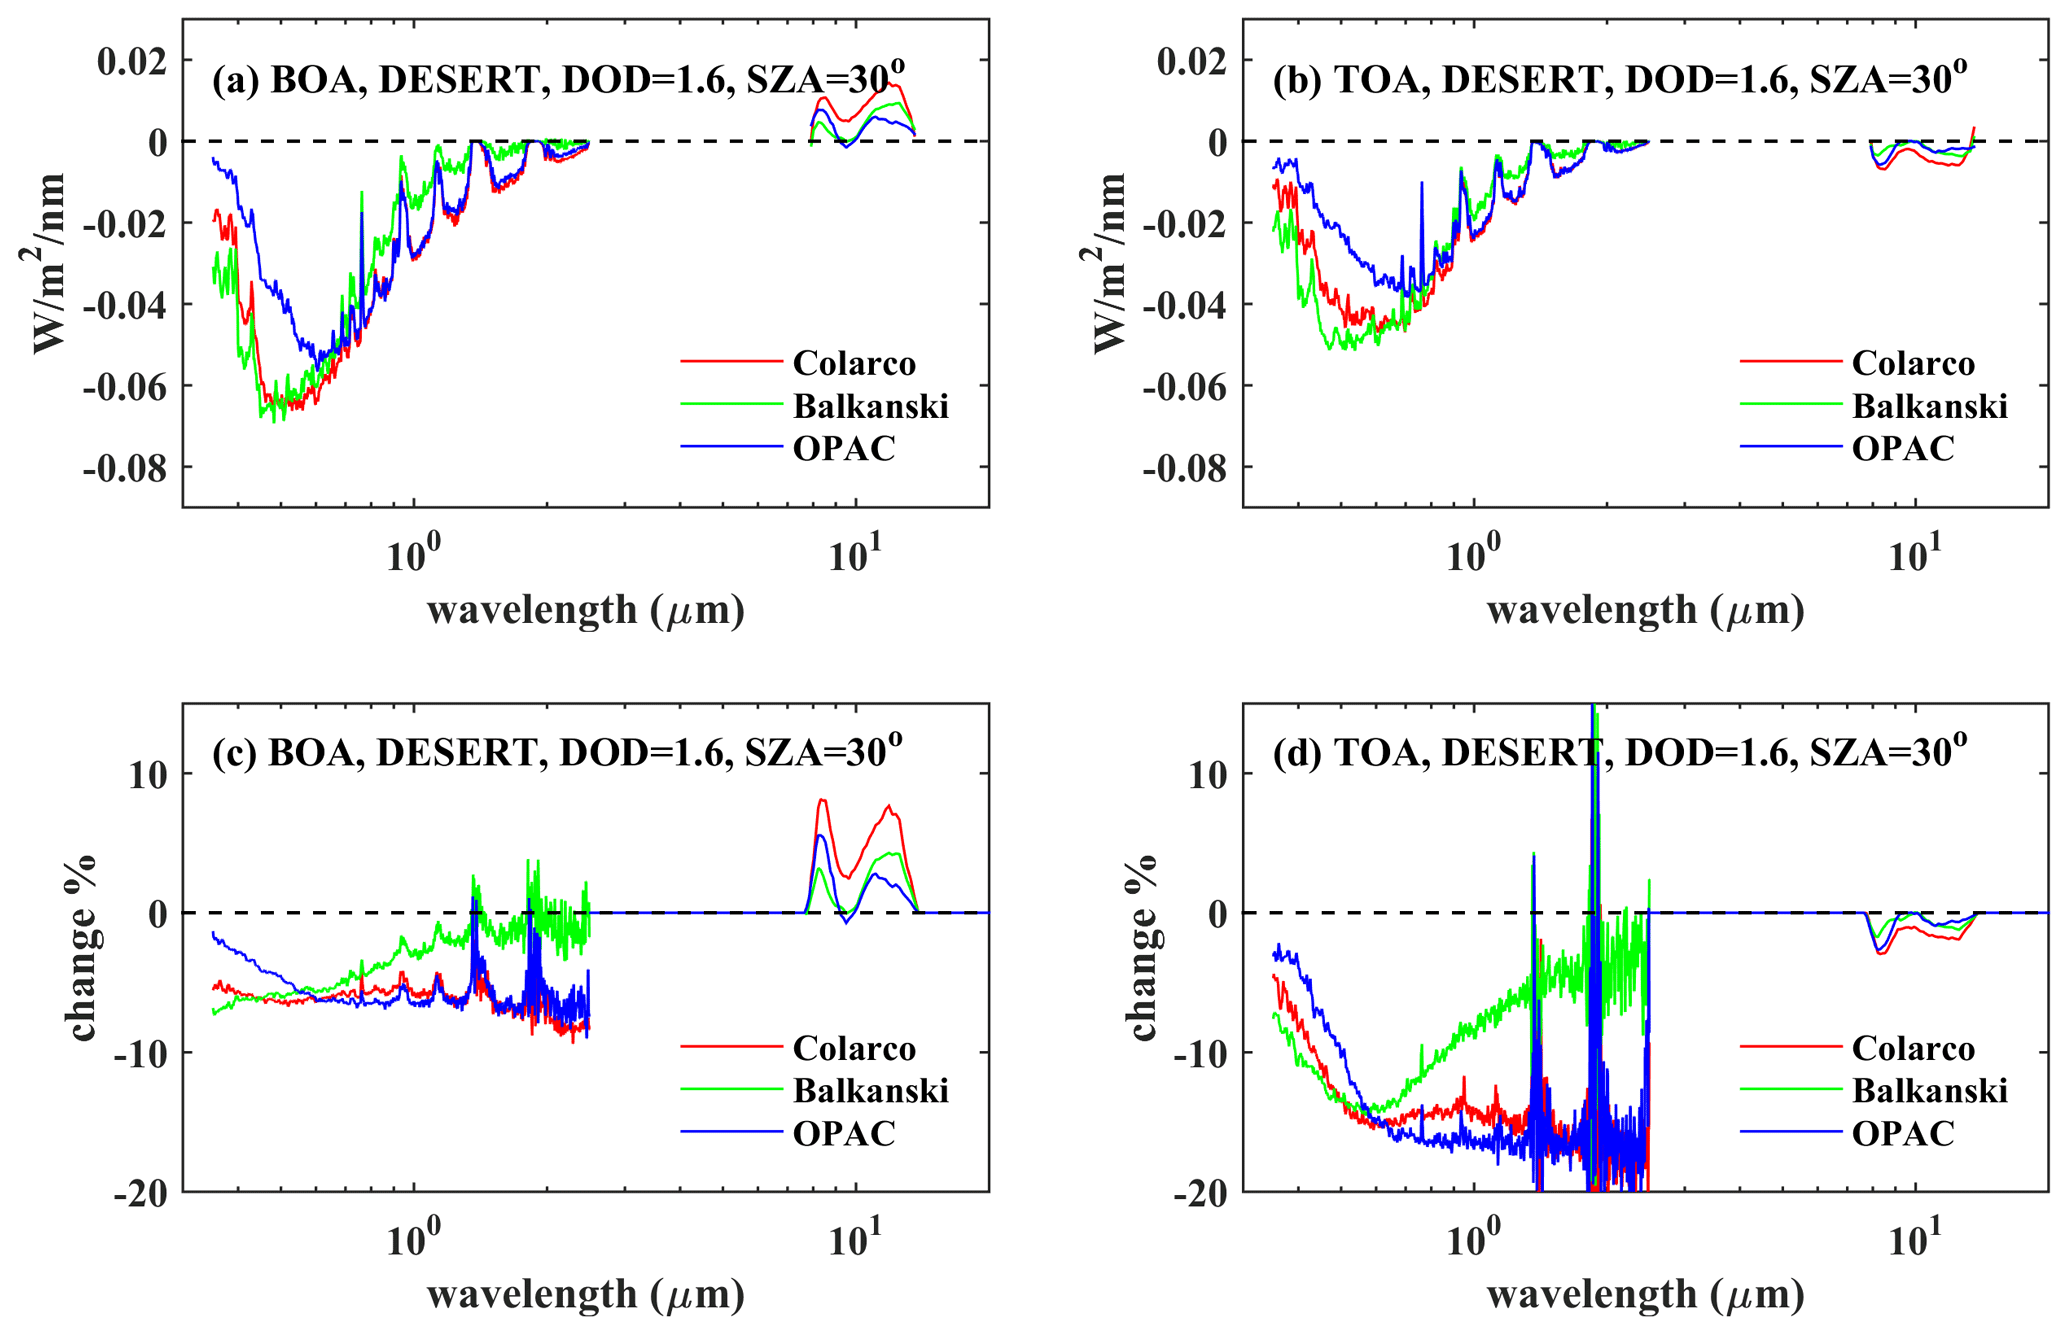
Figure 10Absolute (a, b) and relative (c, d) spectral differences for downwelling irradiances at BOA (a, c) and upwelling irradiances at TOA (b, d), considering SD10 and SD50 dust particles, with spherical shapes. The differences are presented for calculations above the desert, for SZA = 30° and DOD = 1.6, for different RIs of the dust particles.
As shown in Fig. 6, considering SD50 instead of SD10 results in a lower SSA in the SW region (i.e., more absorption). The extinction coefficient (and consequently the DOD) varies slightly with respect to wavelength in the SW region (Fig. 6a), and thus the relative differences in the SW irradiances at TOA and BOA are strongly anticorrelated with differences in the SSA (Fig. 6g). Increased absorption in the atmosphere due to the presence of larger aerosols results in less SW radiation at TOA and BOA. The absolute differences in the SW region (at TOA and BOA) are determined by the differences in the SSA (anticorrelated) and are proportional to the absolute values of the solar irradiance. In the LW region, differences in the irradiances at TOA and BOA are primarily affected by differences in the DOD (Fig. 6a). The DOD spectral dependence is different for SD10 and SD50 and in the range of 8–13 µm it is larger for SD50 for a given DOD at 0.5 µm. Downwelling LW irradiance increases at BOA and upwelling LW irradiance decreases at TOA. The role of the changing SSA seems to be less important relative to the role of differences in AOD in the range of 8–13 µm. Using SD50 for the simulations results in higher DOD in the LW region relative to using SD10. Thus, more LW photons are either absorbed or scattered, resulting in decreased upwelling SW radiation at TOA. Some of the scattered photons (that would be heading towards TOA for SD10) return to the surface, increasing the downwelling radiation at BOA.
In UV–VIS, at BOA and TOA, the smallest absolute differences were found for the RI used in OPAC. Absolute differences in UV–VIS are similar for the RIs of Balkanski et al. (2007) and Colarco et al. (2014) but larger than the ones calculated by the use of OPAC. For SW wavelengths that are longer than ∼ 1 µm, Balkanski et al. (2007) consider that absorption is insignificant either for SD50 or for SD10 (see Fig. 6), which results in the smallest absolute and relative differences in irradiance for SD10 and SD50. For the LW region the absolute and relative differences (positive for BOA, negative for TOA) are generally larger when the RI of Colarco et al. (2014) is used. The main reason why the smallest absolute differences in UV–VIS were found for OPAC is possibly that in this spectral region differences between the SSA for SD10 and SD50 are smaller relative to the corresponding differences of the Balkanski et al. (2007) and Colarco et al. (2014) RIs (Fig. 6g), which means that absorption of the solar radiation at these wavelengths changes less (relative to Balkanski et al., 2007, and Colarco et al., 2014) with the inclusion of large particles in the dust mixture. At the NIR the differences in SSA for SD10 and SD50 are much smaller for Balkanski et al. (2007) relative to the other two RIs, which correspondingly results in smaller differences between the irradiances (see Fig. 10).
3.2.2 Differences in SW and LW irradiances
The relative differences in the SW and LW irradiances (calculated from the integrated irradiances in 0.35–2.5 µm for the SW region and 2.5–40 µm for the LW region) at BOA are shown in Fig. 11, while the corresponding absolute differences are shown in the Appendix (Fig. A3). The same differences for TOA are shown in Fig. 12 (and in Fig. A4). The differences are presented for the desert and the ocean with respect to SZA and DOD. As shown in the figures, they are generally larger for the SW region relative to LW irradiances (with the differences in the LW region to be comparable to the level of noise), especially over the desert.
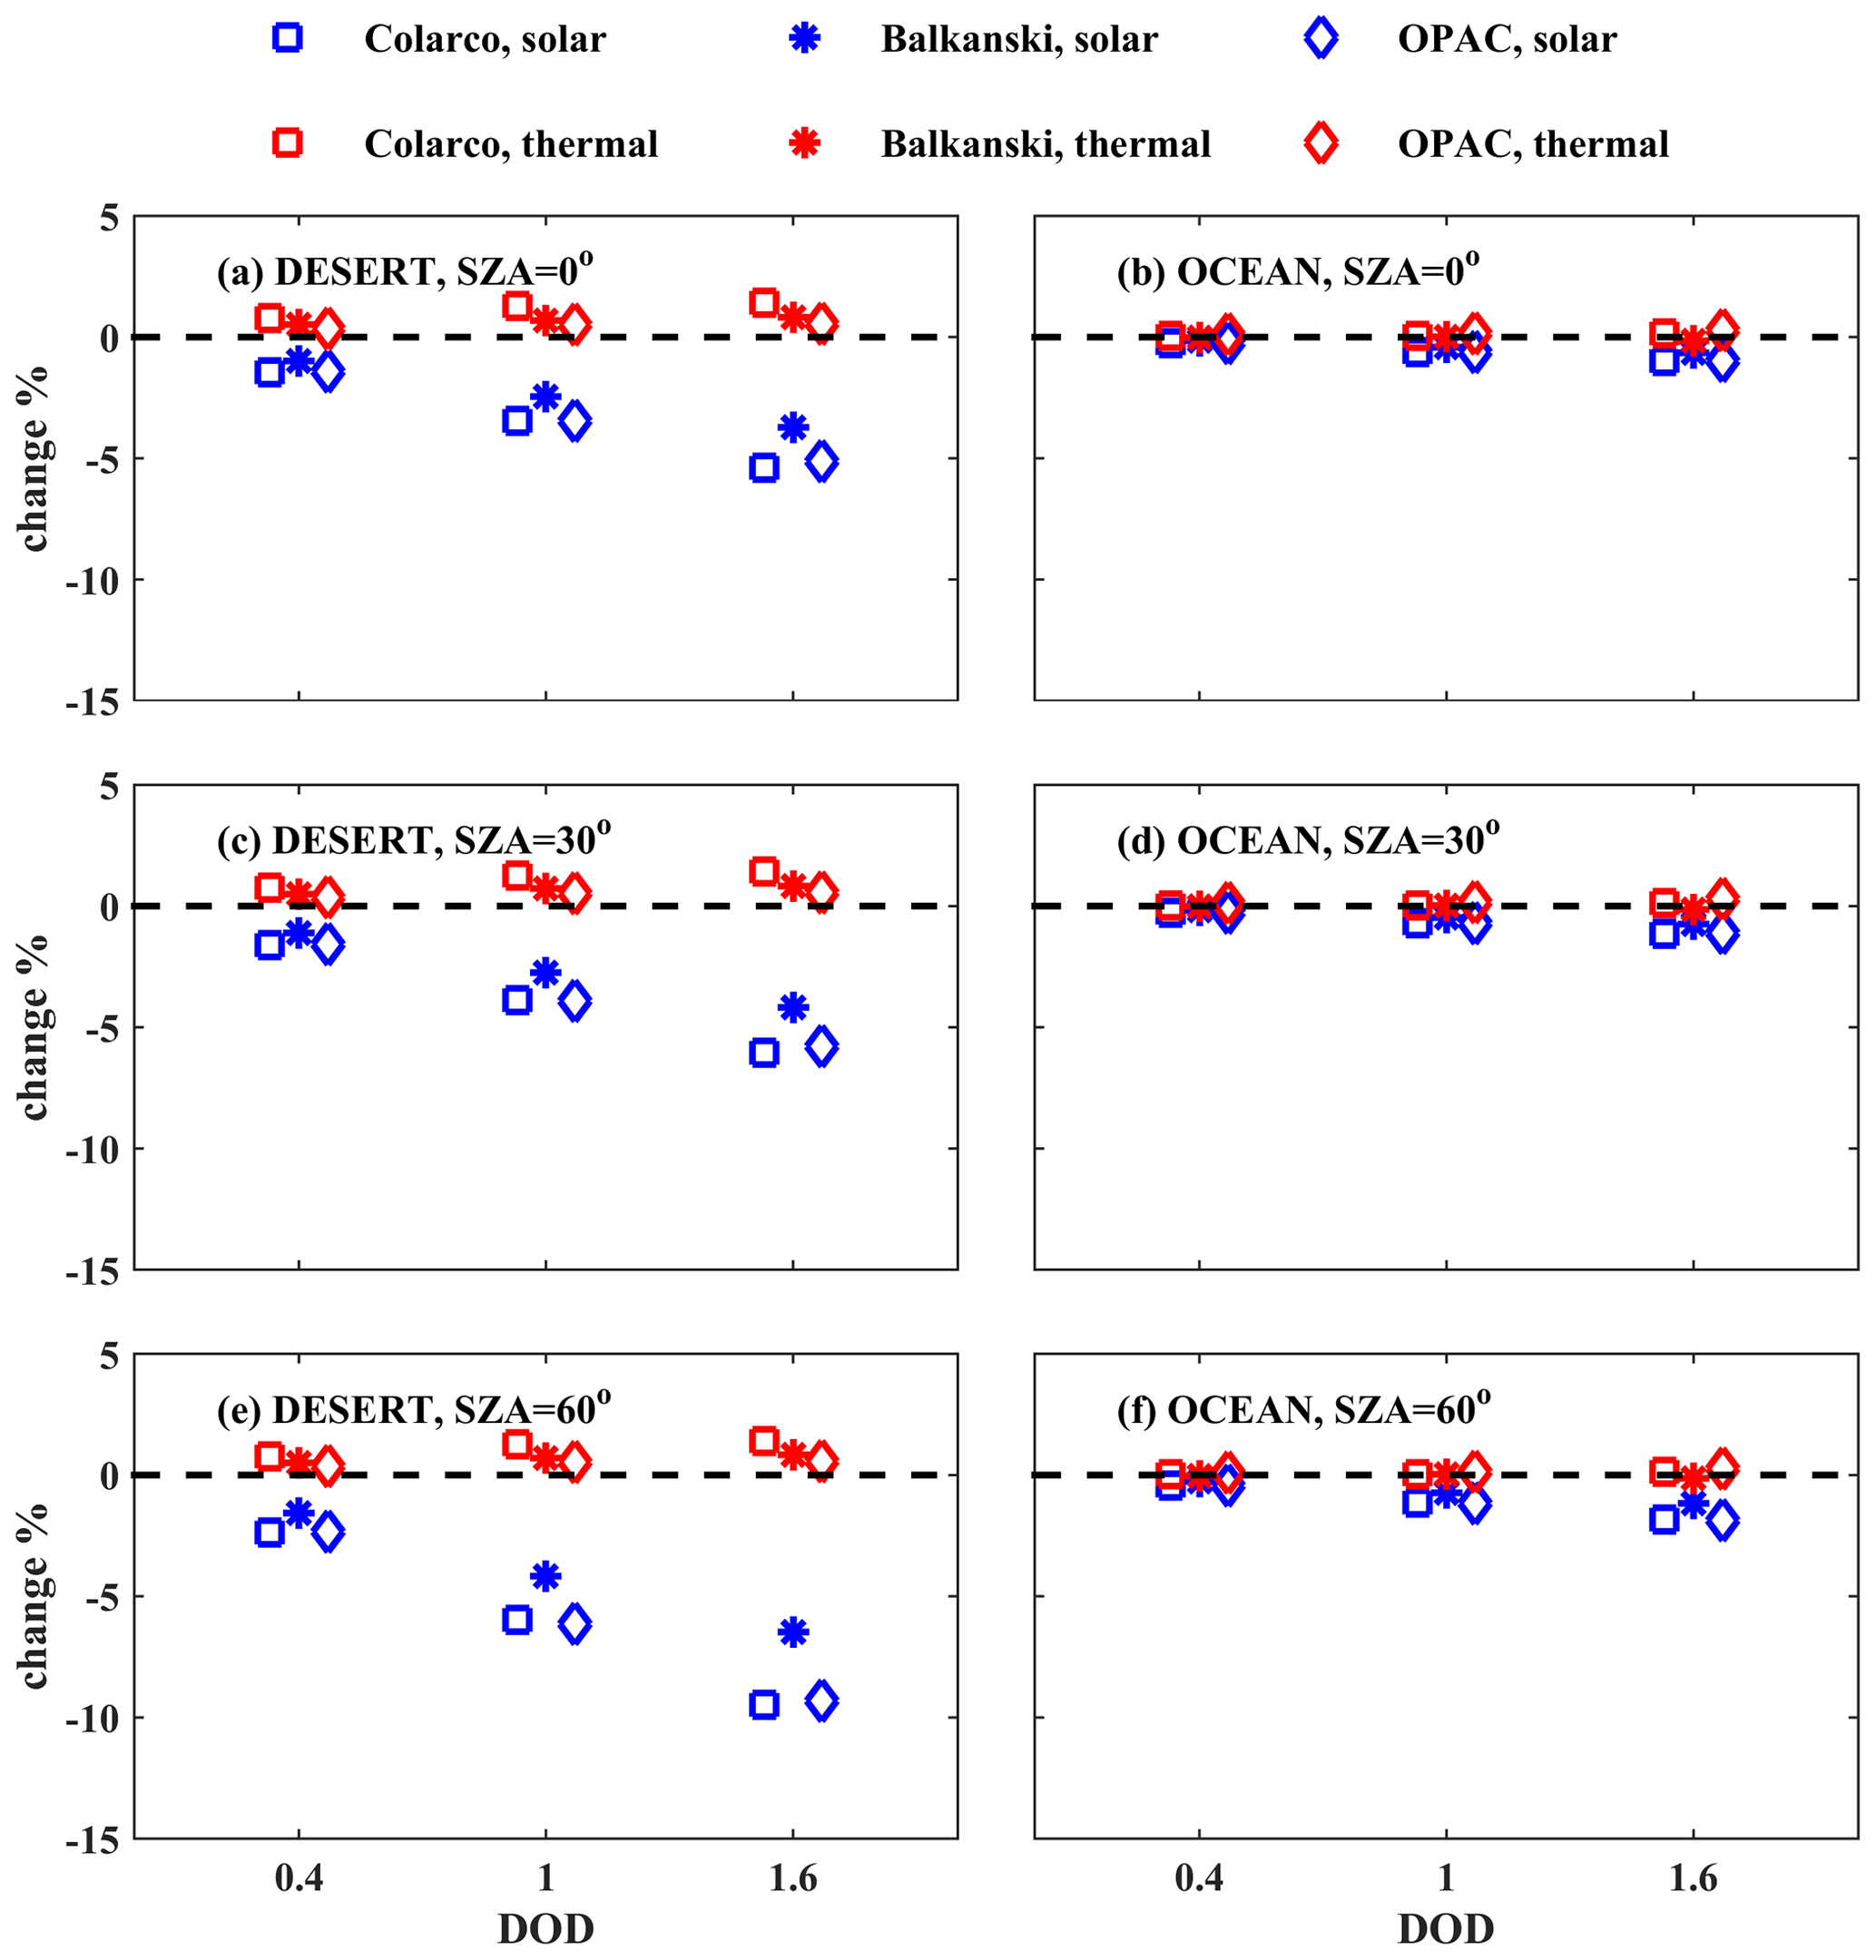
Figure 11Relative differences (%) between the irradiances in the SW (blue) and LW (red) regions at BOA considering SD10 and SD50 dust particles with spheroidal shapes (Eq. 5). The differences are presented for calculations above the desert and the ocean for different RIs of the dust particles, DODs, and SZAs.
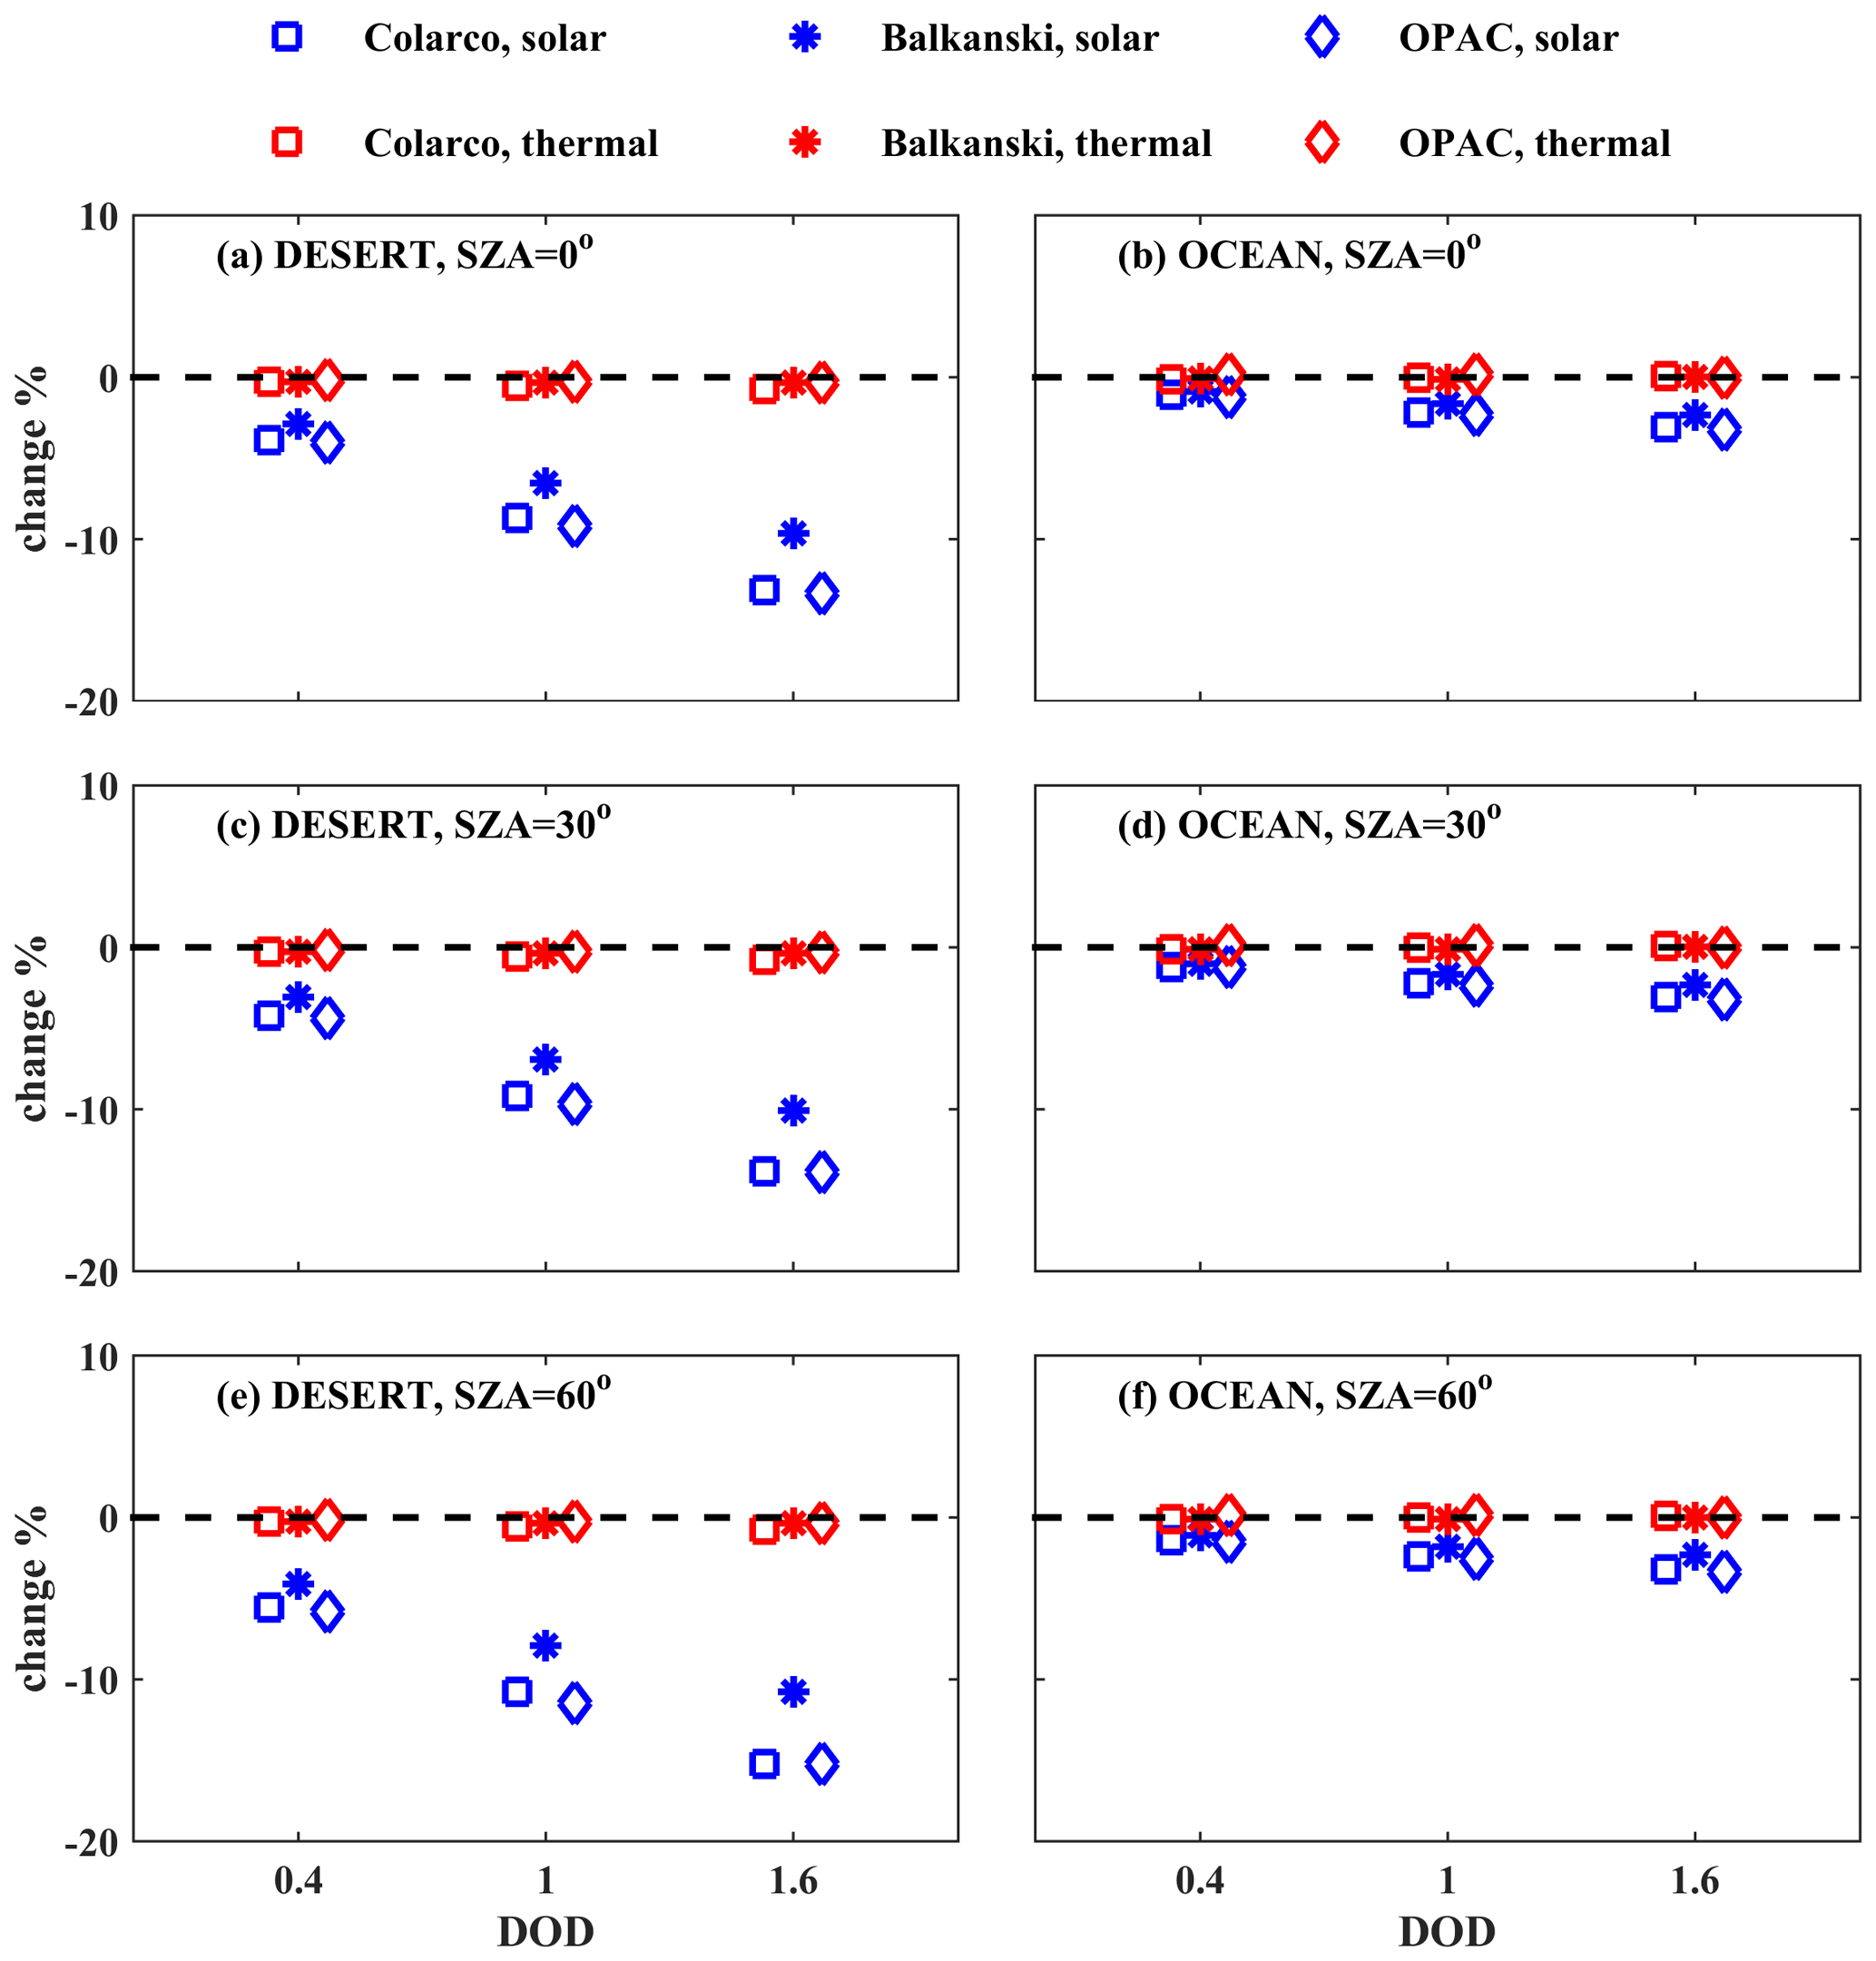
Over the ocean, considering large dust particles results in a reduction in the SW irradiance, which however is less than 2 % (or 5 W m−2) at BOA and less than 3 % (or 5 W m−2) at TOA. The differences over the ocean are smaller relative to the desert, mainly due to the fewer dust particles with diameters larger than 10 µm above the ocean (see Fig. 2), which leads to very small differences in aerosol optical properties (see Figs. 5 and 6 and discussion in Sect. 2.2).
Since the different albedo and temperature of the two surfaces, desert and ocean, also impact the differences between the simulations for SD10 and SD50, we tried to quantify at what extent they are responsible for the results shown in Figs. 11 and 12. To estimate the impact of including large particles in the simulations with respect to surface albedo and surface temperature, we repeated the simulations using the Balkanski et al. (2007) RI and the same SD, aerosol vertical profiles, and TCWV over the ocean and the desert (for the surface albedo and temperatures that have been assumed for the two surface types). The results are shown in Figs. A5 and A6 in the supplement for BOA and TOA, respectively. The results change by less than 1 % and 2 % over BOA and TOA, respectively, for both the SW region and the LW region, which shows the minor role of surface temperature and surface albedo for the differences over the desert and the ocean in the results presented in Figs. 11 and 12.
Over the desert, the reduction in SW irradiance at BOA can be up to ∼ 5 % (or ∼ 50 W m−2) for DOD = 1.6 and SZA = 0° and up to ∼ 10 % (∼ 30 W m−2) for DOD = 1.6 and SZA = 60°. As SZA increases, absolute differences in the SW region at BOA decrease (Fig. S1), while relative differences increase (Fig. 11). Larger SZAs correspond to longer paths of the SW photons in the layer of dust and subsequently to increased attenuation. Thus, the relative contribution of large dust particles in attenuating the SW irradiance also increases, leading to larger relative differences. Nevertheless, at larger SZAs, less downwelling solar radiation reaches the aerosol layer because it has been already attenuated in the atmosphere. Subsequently, less photons interact with aerosols, resulting in smaller absolute differences. At TOA, the reduction in SW irradiance is larger relative to BOA and the role of SZA becomes less significant. The reduction in the outgoing SW irradiance at TOA for DOD = 1.6 is 15 %–18 % (∼ 20–30 W m−2). The smallest differences (up to ∼ 3 % and ∼ 5 % at BOA and TOA, respectively) among the three RIs were calculated for the RIs reported in Balkanski et al. (2007), for which the difference in the SSA between SD10 and SD50 particles is the smallest for SW wavelengths longer than 1 µm (Fig. 6).
Regarding the calculations in the LW region, aerosols scatter and absorb part of the radiation emitted by Earth's surface that would exit the atmosphere, with part of the scattered and (absorbed and then) emitted radiation returning to the surface. When large dust particles are considered, the scattering and absorption of the radiation is larger, mainly over the desert (Figs. 5 and 6). Thus, the LW radiation that returns to BOA increases (Fig. 11), and the LW radiation that exits the atmosphere (i.e., at TOA) decreases (Fig. 12). At BOA the increase is however below 2 % for desert and below 0.5 % for ocean. At TOA the outgoing LW irradiance decreases by less than 1 % over the desert (and even less over the ocean) when large dust particles are considered, which, as has been already discussed, is within the noise of the simulations.
3.3 Direct radiative effects
In this section, the effects of shape and size on the DRE of dust over the desert and the ocean are discussed for different SZAs. For each of the three RIs, the SW and LW DREs at TOA and BOA were calculated. First, the net irradiances were calculated for BOA and TOA (FNET,BOA and FNET,TOA, respectively) using Eq. (6):
where F↓ and F↑ are the downwelling and upwelling irradiances, respectively.
Then, the direct radiative effect (DRE) was calculated as the difference between the test (FNET,TEST) and the reference (FNET,REF) net irradiances, as shown in Eq. (7):
In this study, the reference net irradiance corresponds to aerosol-free atmosphere, while the test net irradiance corresponds to the same conditions when aerosols are considered.
3.3.1 Direct radiative effects for different model inputs
In this section we present the DRE of dust particles when considering SD50 and spheroidal shapes (more realistic representation of dust) and SD10 and spherical shapes (less realistic representation of dust, used in current dust models). Figures 13 and 14 present the calculations for DOD = 1 for different RIs for BOA and TOA, respectively. The direct radiative effects were calculated for the SW and LW region, as well as for the total (SW + LW) irradiances.
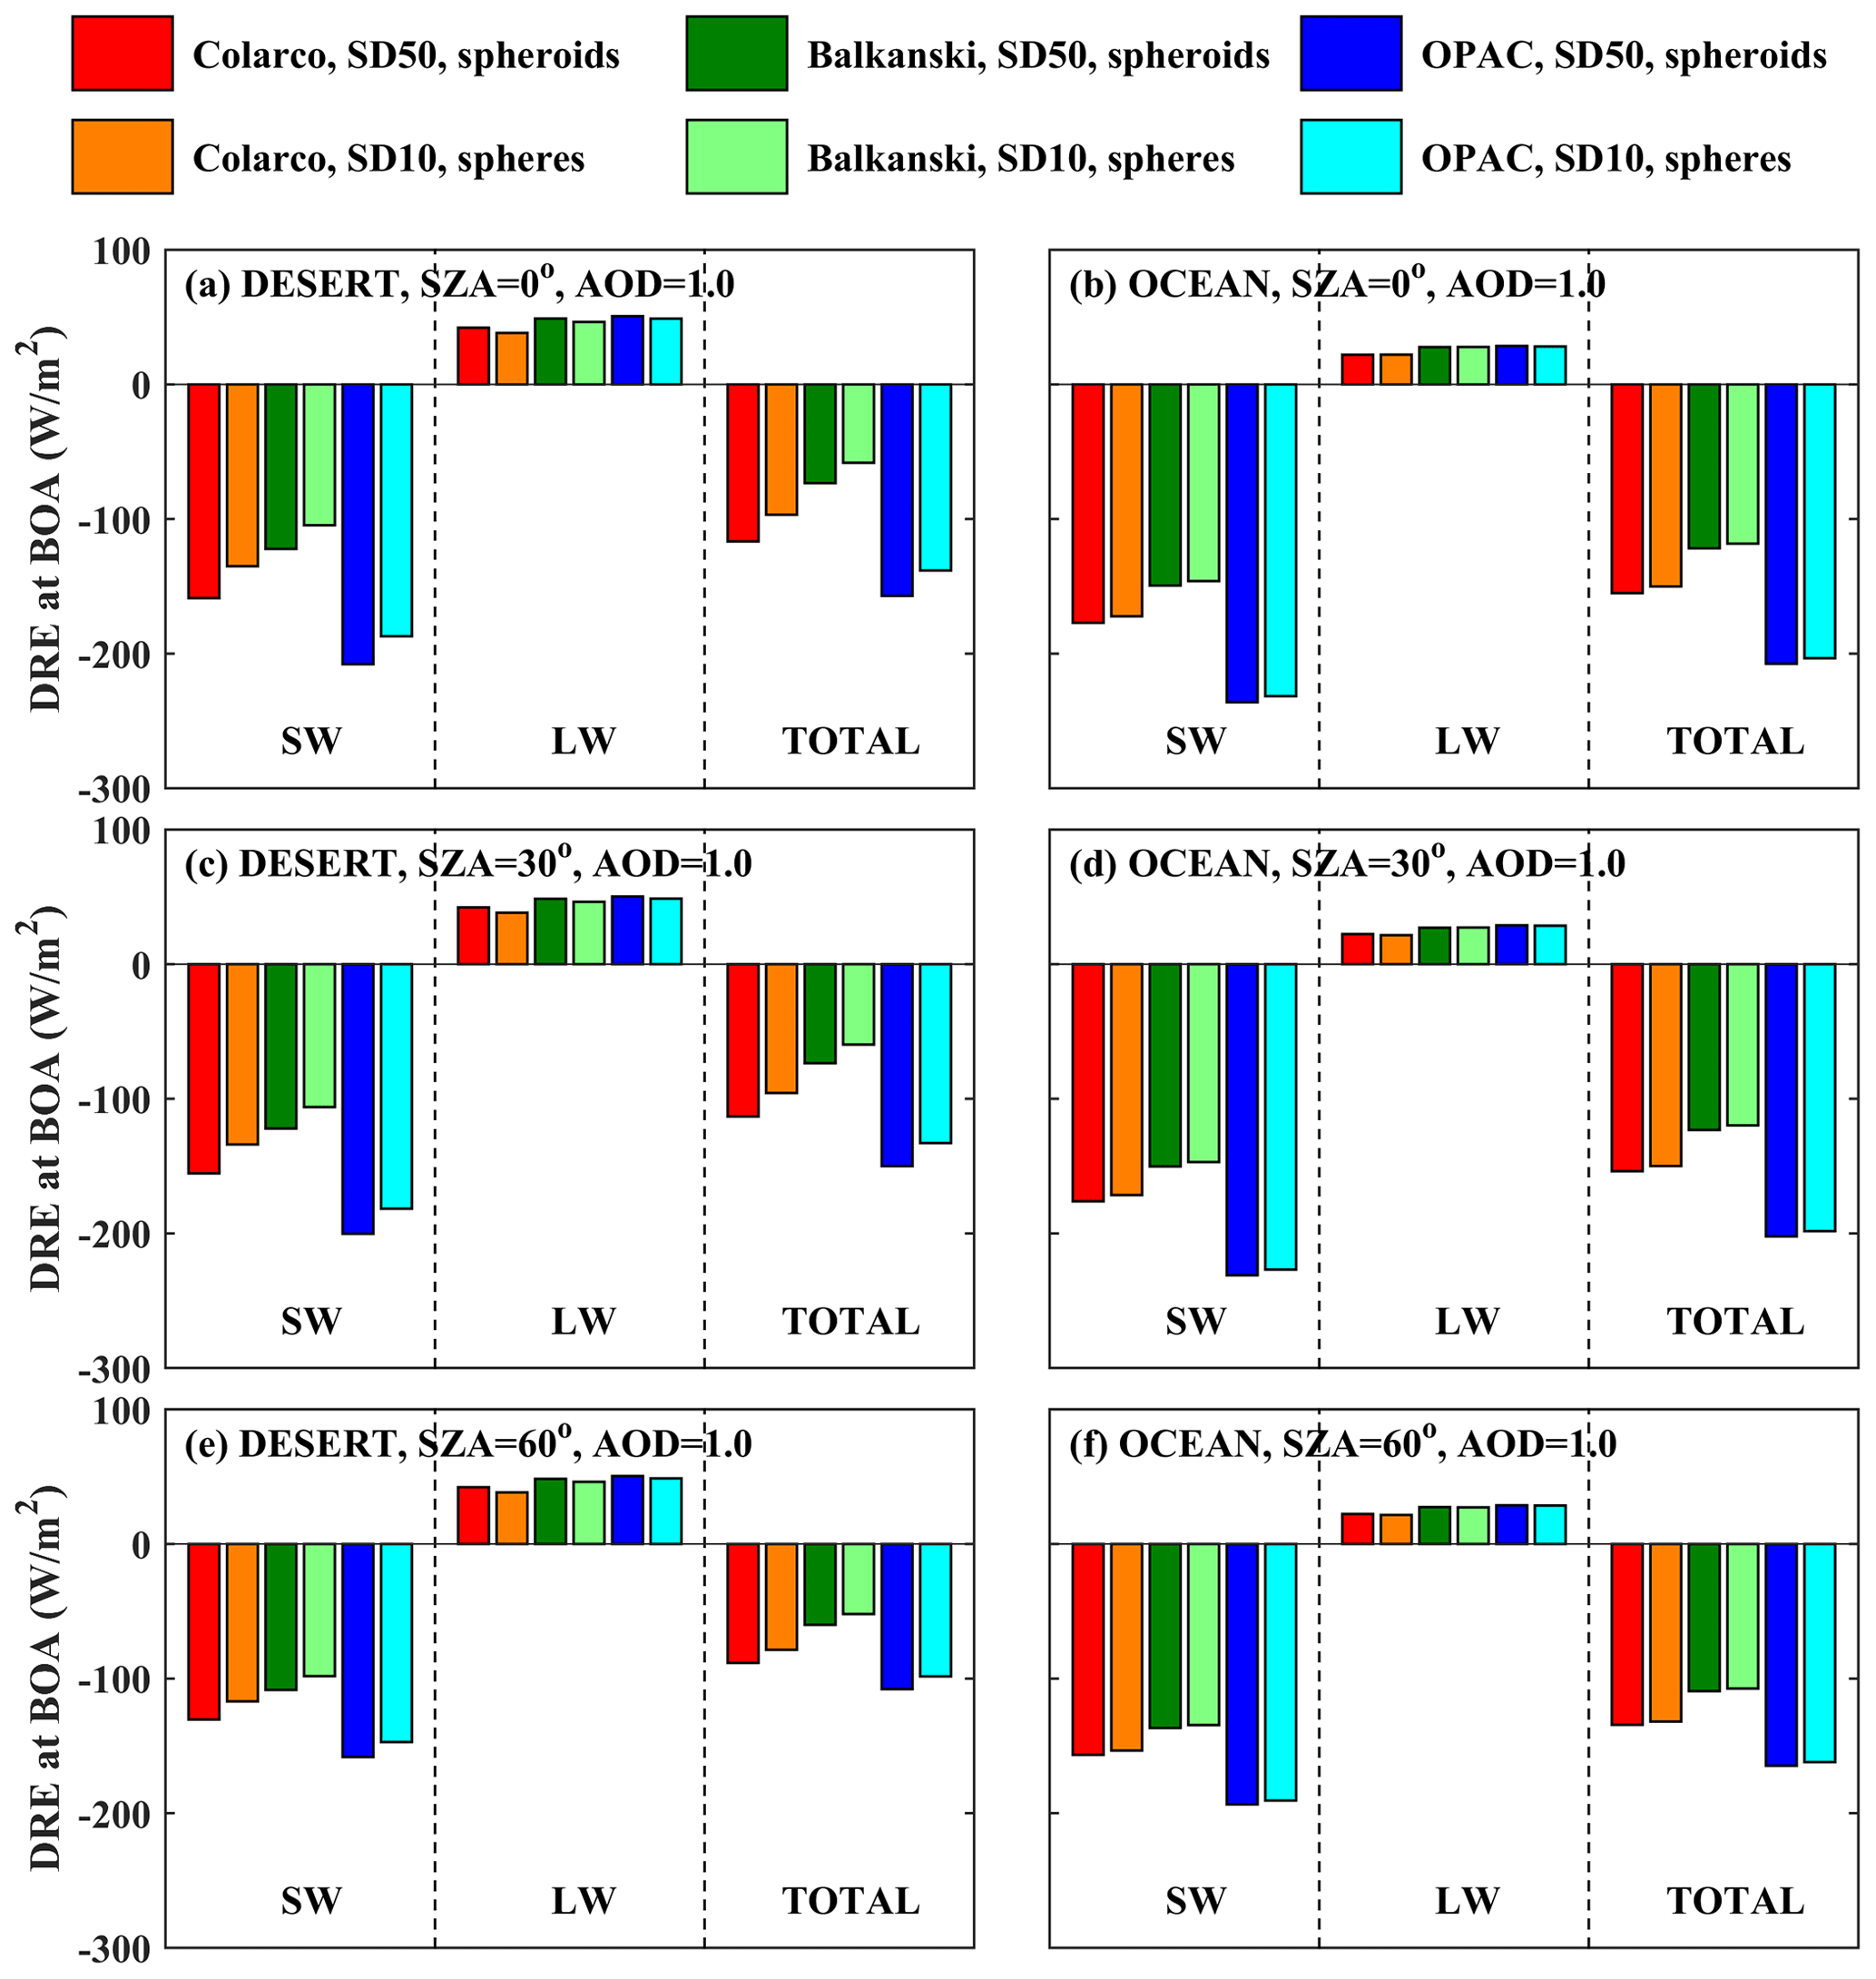
Figure 13DRE at BOA for different RIs and SZA for SD10 with spherical shapes (DRESD10,spheres) and SD50 with spheroidal shapes (DRESD50,spheroids).
DRE at BOA
In the following discussion we must keep in mind that differences shown in Fig. 13 (DRE at BOA) are positive when more radiation reaches Earth's surface, while differences in Fig. 14 (DRE at TOA) are positive when less radiation exits the atmosphere.
At BOA the total DRE ranges between ∼ −200 and −100 W m−2 for different dust properties and SZA ranges between 0 and 60°. Using more realistic aerosol properties leads to less total radiation at BOA. The results are similar over the desert and the ocean. For more realistic dust properties (i.e., SD50 and spheroids) the DRE is less negative over the desert (by up to 25 % for the RI of Balkanski et al., 2007, at SZA = 0°) and over the ocean, although the difference is small, less than 5 % over the ocean. Differences are mainly due to the RIs used and SZA rather than differences in size and shape.
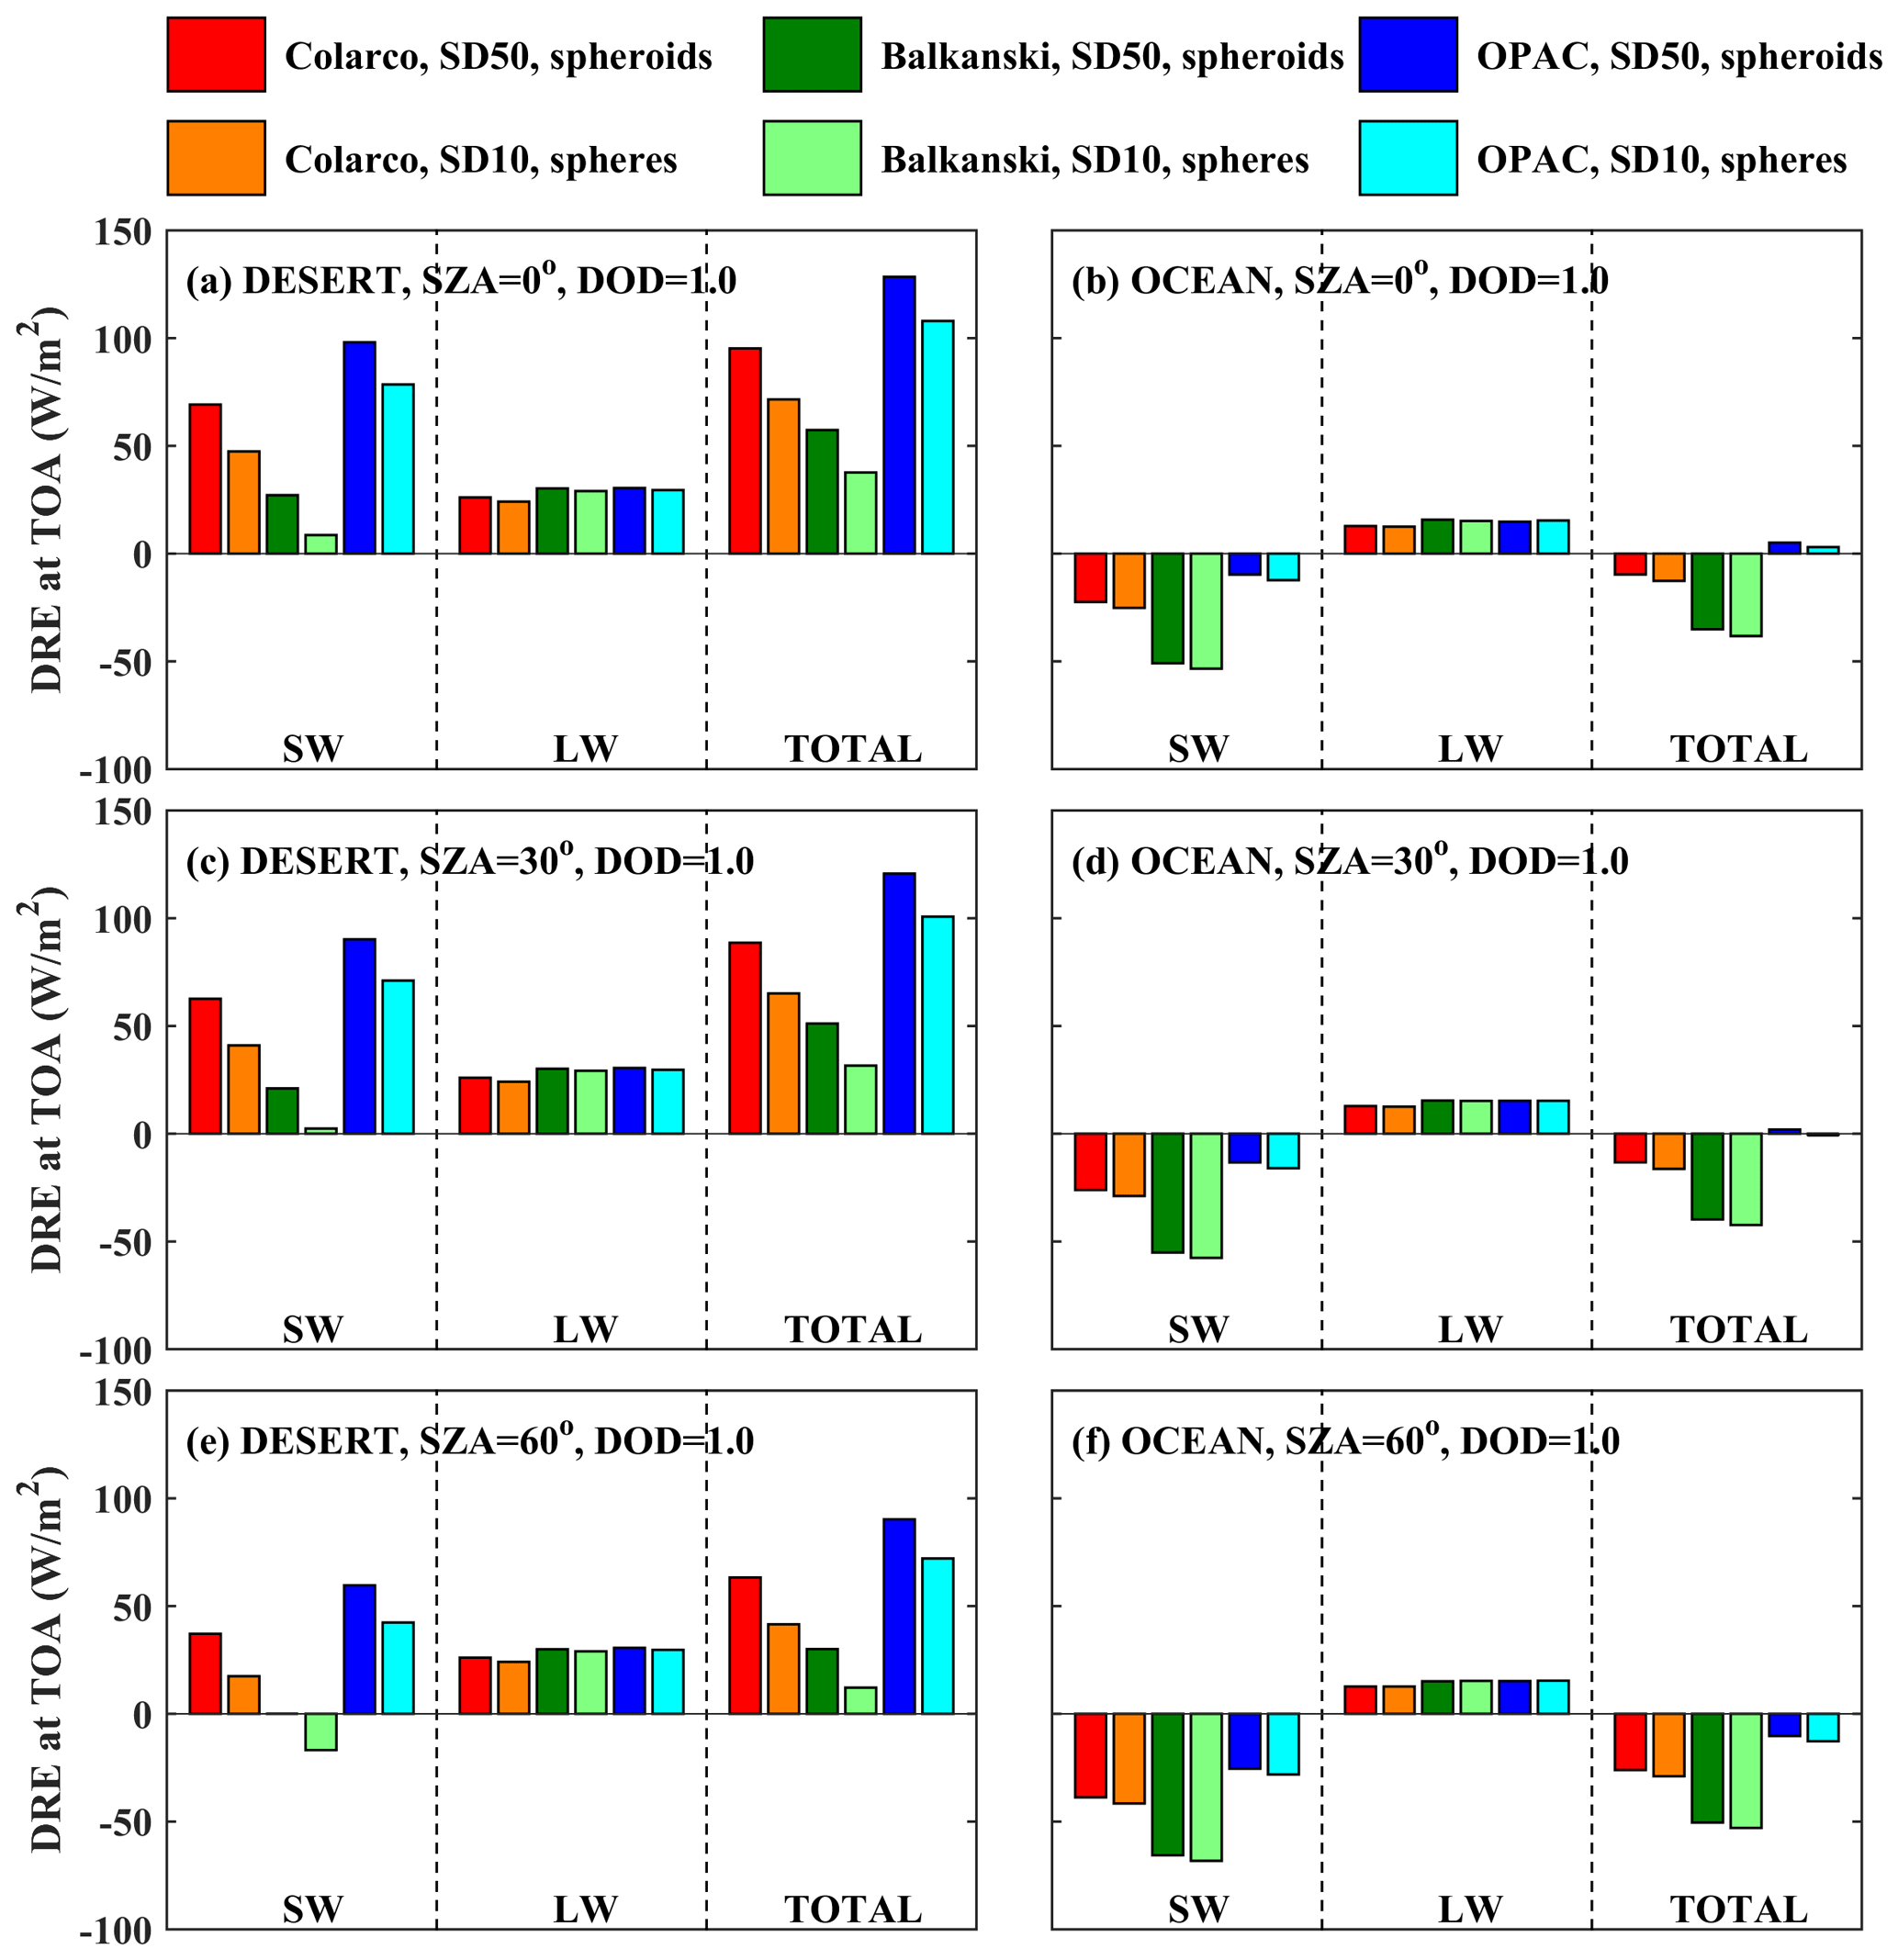
DRE at TOA
Over the desert, the presence of dust particles results in all cases in heating of the Earth–atmosphere system considering the total radiation at TOA, the magnitude of which however depends strongly on the RI used and SZA but also on SD (as discussed in Sect. 3.3.2). While the DRE differences for different RIs are small for the LW region and independent of SZA (as expected, since the LW radiation is mainly emitted from Earth's surface), the SW DRE depends strongly on the RIs used and changes significantly with SZA (Fig. 14). A negative SW DRE of ∼ −20 W m−2 was calculated for the RI provided by Balkanski et al. (2007), at SZA = 60°, when SD10 spheres were considered. Differences of 15–25 W m−2 were found for the total DRE that was calculated for more (SD50 spheroids) and less (SD10 spheres) realistic dust optical properties. Using different RIs results in very large differences, up to 80 W m−2 in total DRE.
Over the ocean, the sign of the DRE also depends on SZA and the RI used, whereas the overall effect of SD and shape is minor due to the small contribution of larger dust particles in SD50. The DRE in the SW region is always negative (i.e., increase of the outgoing SW radiation at TOA resulting in cooling of the Earth–atmosphere system), with an increasing absolute value as the SZA increases. The DRE in the LW region is positive (i.e., warming) and independent of SZA. As a result, the total DRE is positive and negative for SZA = 0 and 30° for different RIs, and it is negative for SZA = 60°. Differences in DRE up to ∼ 40 W m−2 due to different RIs were calculated over the ocean.
By comparing the results in Figs. 13 and 14 we see that the impact of the RI used for the calculation of DRE at BOA is less significant than for TOA (at least in terms of fractional differences). Nevertheless, the results presented in Fig. 13 and 14 show that the RI used is still the main uncertainty factor for the calculation of the DRE.
3.3.2 Effects of size and shape
The present section aims to show and compare the effects of using a more realistic size and shape on DRE. As discussed in the previous sections, for a given RI, differences in the irradiances at BOA and TOA that are significantly larger than the uncertainty in the simulations emerge mainly when we compare the effect of using different SDs over the desert. This is also depicted in the DRE calculations presented here.
For different RIs, the differences in DRE due to the size of the particles (when considering SD50 vs. SD10) above the desert change up to 12 W m−2 at BOA (decrease) and TOA (increase), as shown in Figs. 15 and 16, respectively. The differences are much smaller above the ocean. At BOA (Fig. 15), considering SD50 instead of SD10 results in less SW and total radiation (more cooling at the surface) above the desert and the ocean. For the LW radiation, the DRE at BOA increases when considering larger particles (SD50). This does not happen when considering the RI provided in Balkanski et al. (2007) (for all SZAs) and in Colarco et al. (2014) (for SZA = 0°) over the ocean, where very small decreases were found (< 1 W m−2). The decrease of the total radiation at BOA (i.e., more cooling at the surface) due to larger particles generally decreases with SZA. For the studied cases, the corresponding differences in Fig. 15 range between 3 and 11 W m−2 over the desert and between 1 and 2 W m−2 over the ocean.
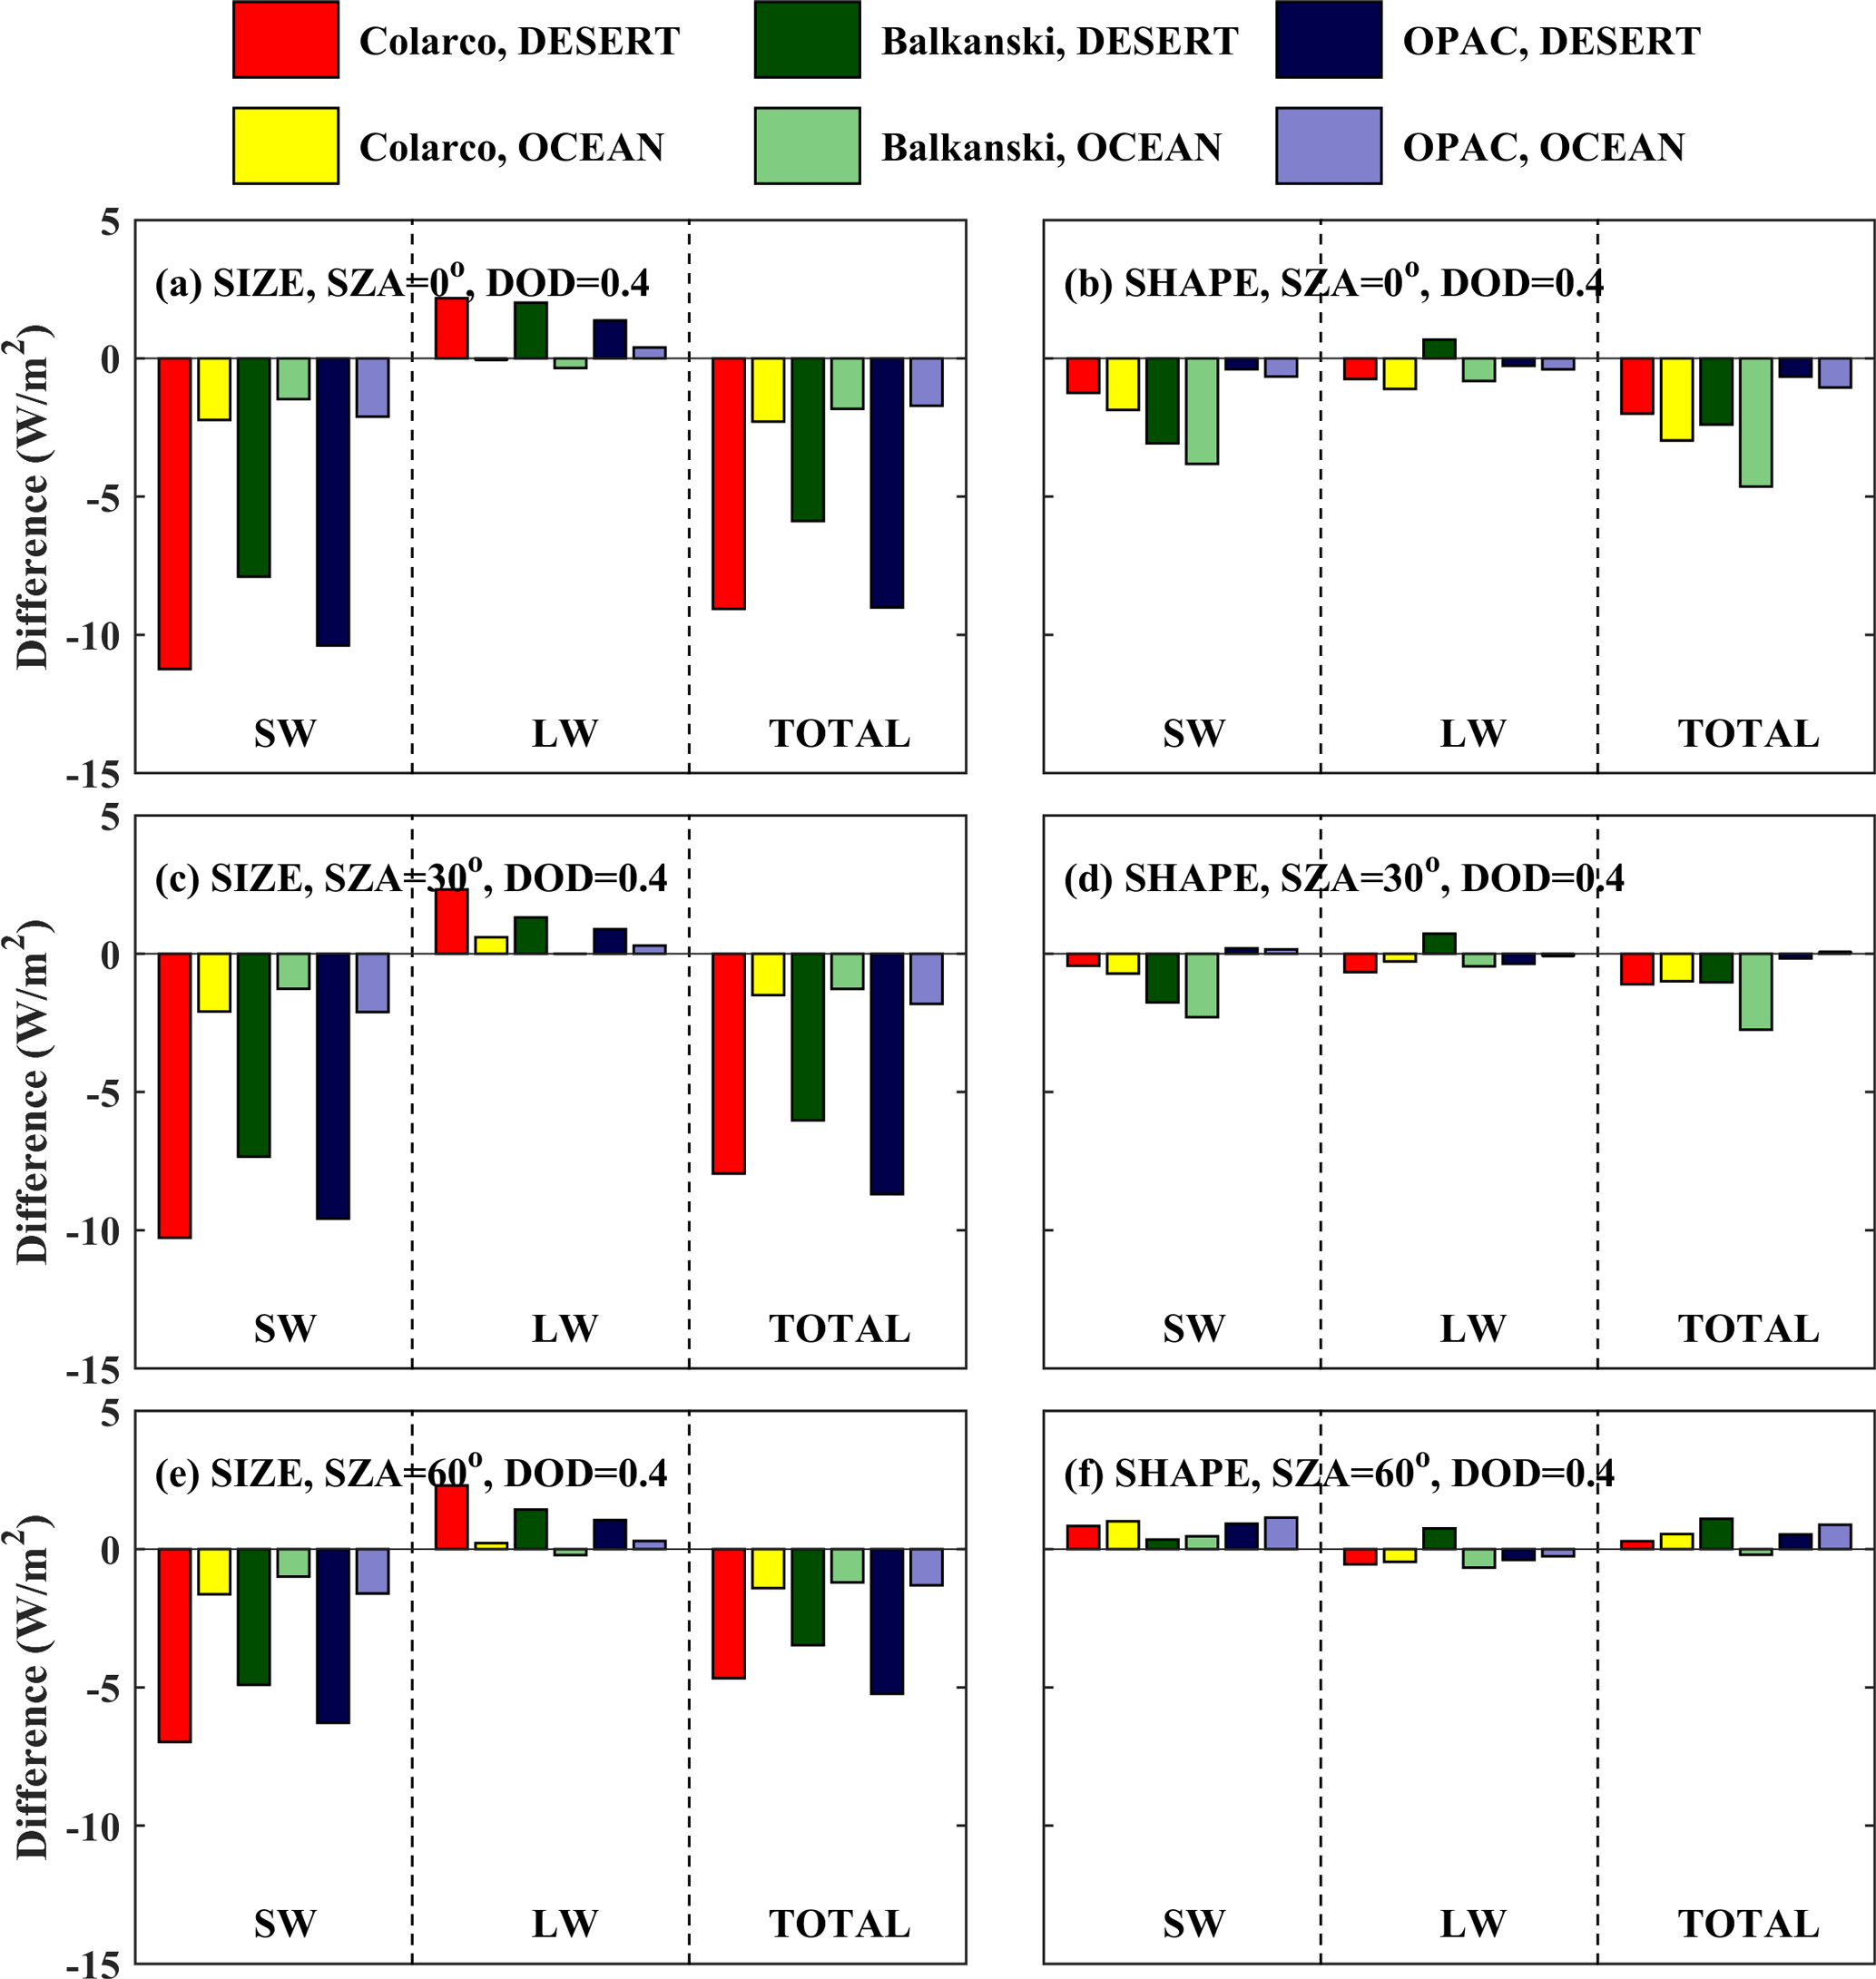
Figure 15Absolute differences in DRE at BOA for DOD = 0.4 for different shapes and sizes of the dust particles. (a, c, e) Absolute differences in DRE due to size (DRESD50 − DRESD10). (b, d, f) Absolute differences due to shape (DRESD50,spheroids − DRESD50,spheres).
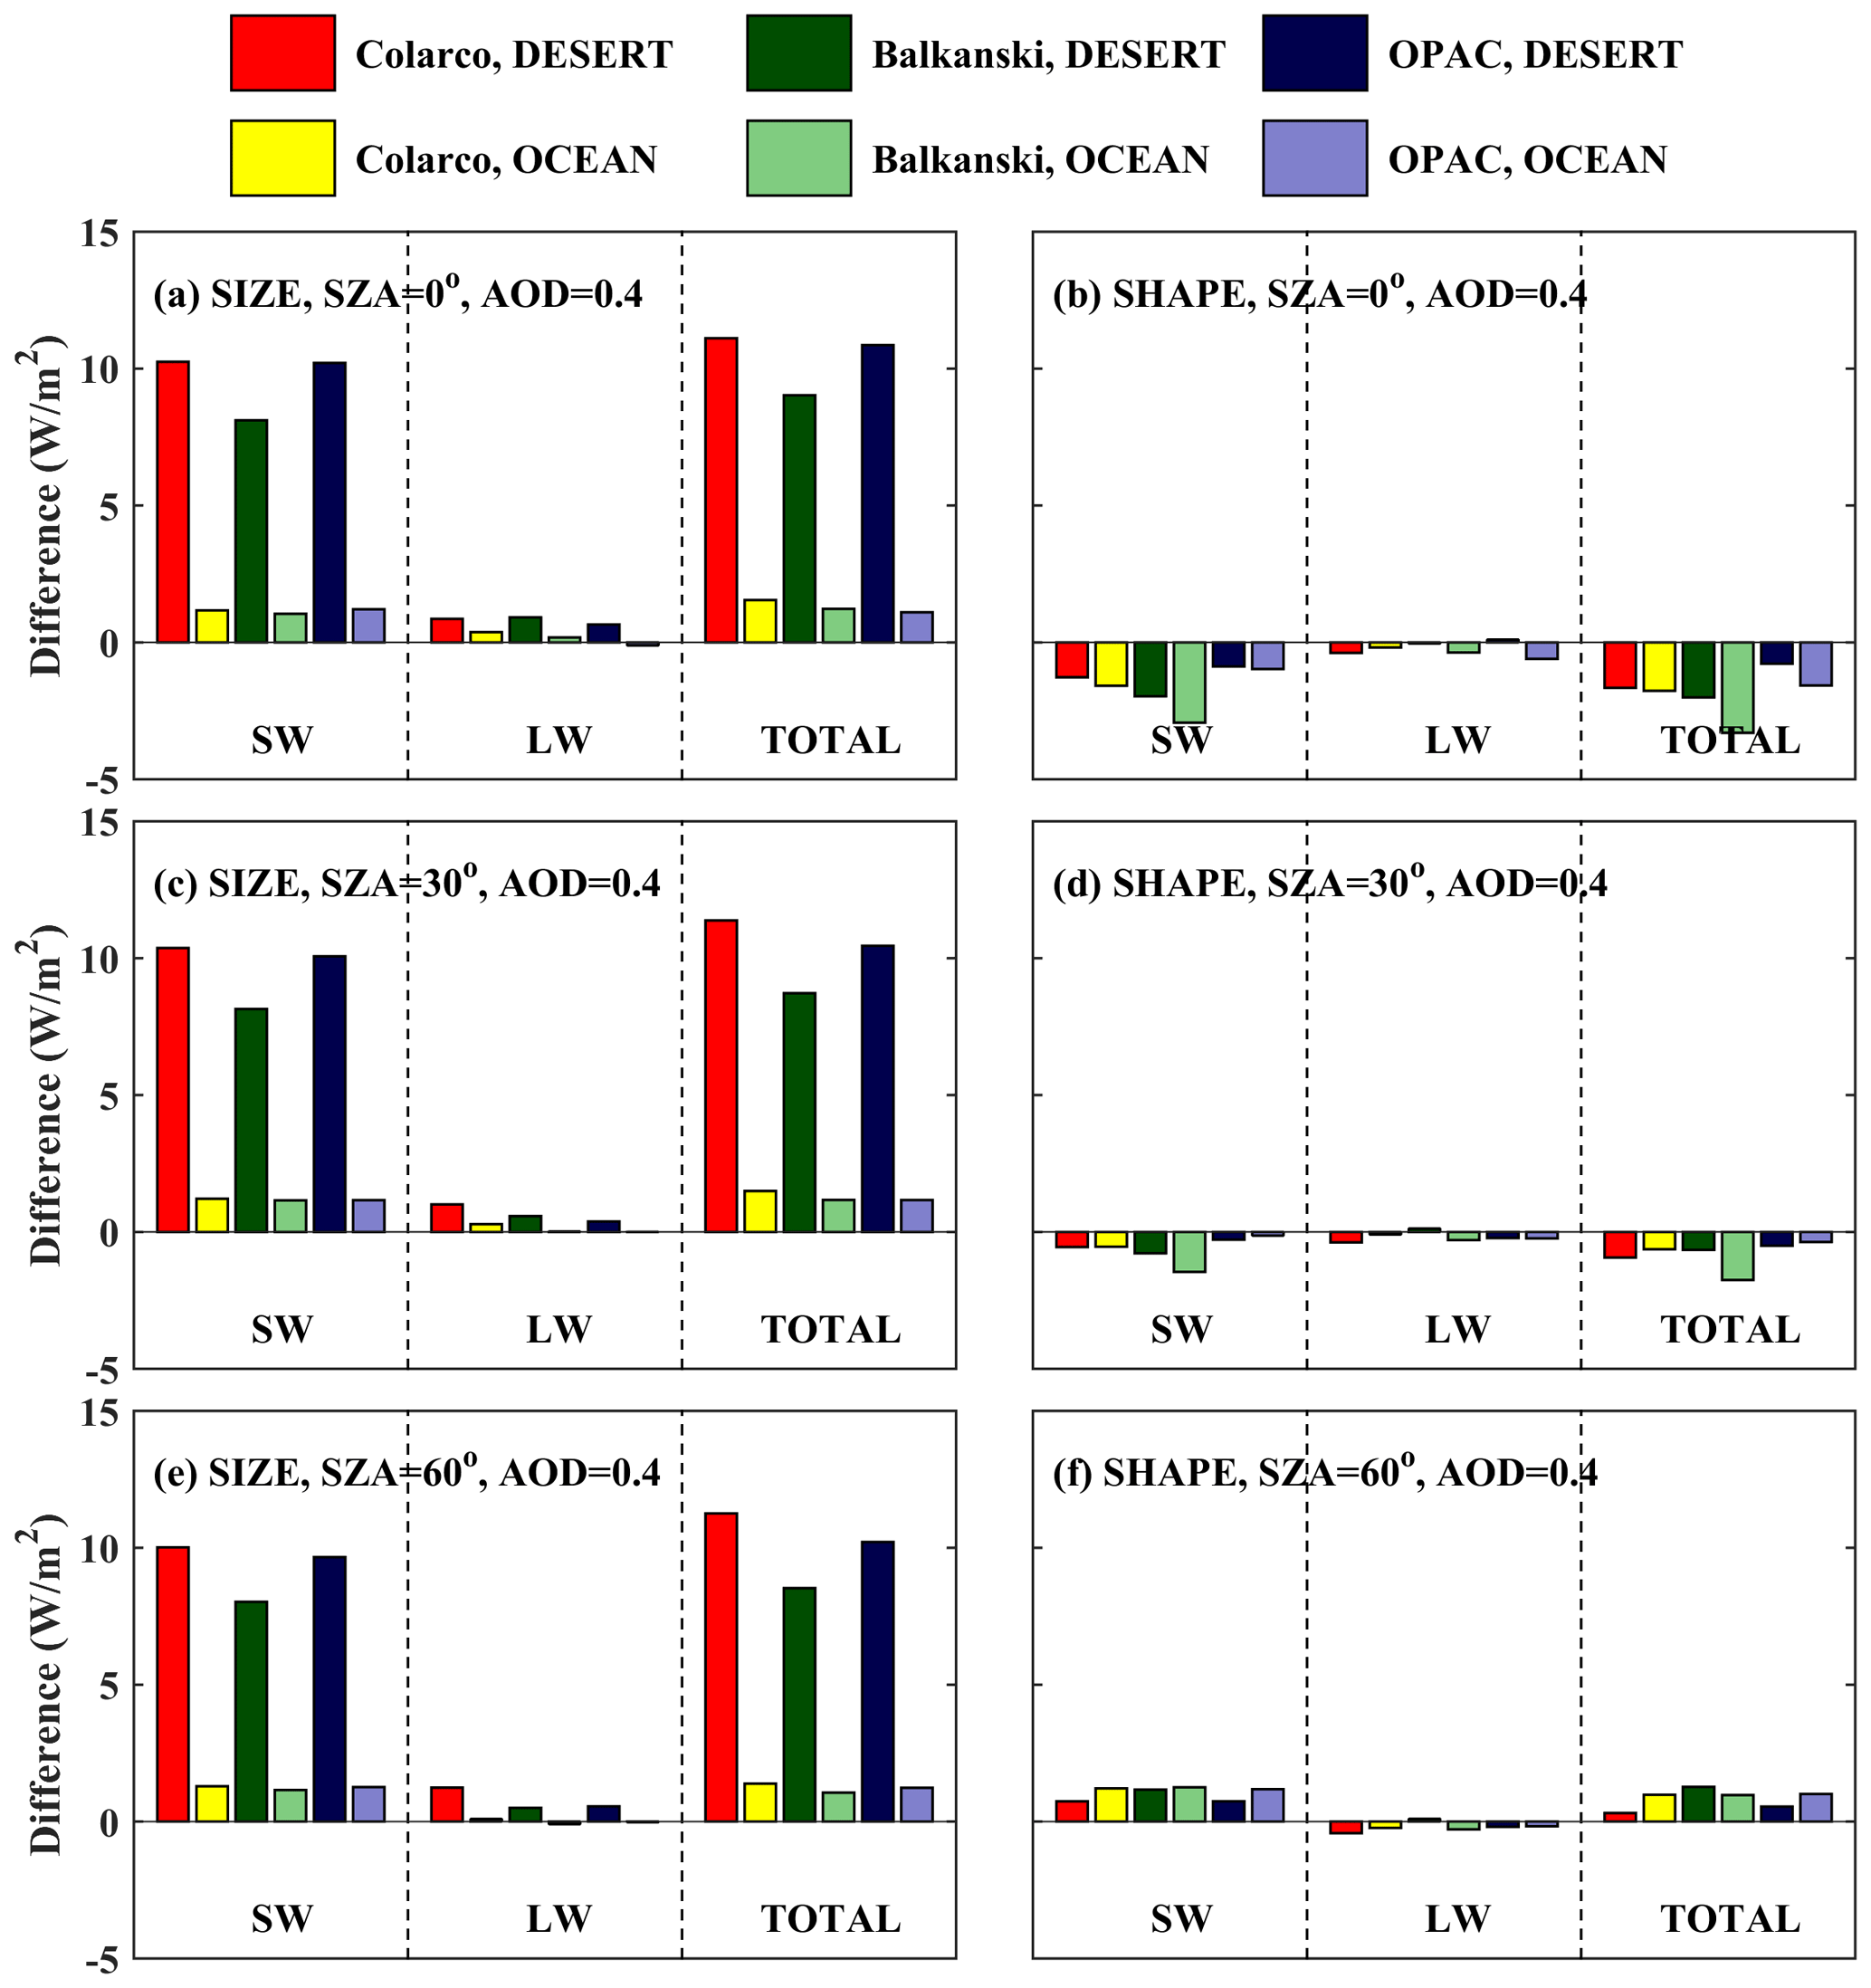
At BOA, using spheroids instead of spheres results in a smaller DRE due to total radiation at SZAs of 0 and 30° and a greater DRE due to total radiation at 60°, with the differences being much smaller relative to differences due to size (< 5 W m−2). However, there are specific cases where the effect of shape is comparable to the effect of size. For example, for SZA = 0° over the desert, when considering the RI provided by Balkanski et al. (2007), the difference in total DRE due to size is ∼ 6 W m−2, while the difference due to shape is ∼ 2 W m−2. Over the ocean, for the same case, the differences are ∼ 2 and ∼ 6 W m−2, respectively. This case indicates that, although at TOA the uncertainties in climate model simulations due to size are clearly dominant over the uncertainties due to shape, at BOA the effect of shape may be larger under specific conditions, although the differences will still be small, less than 5 W m−2 (for AOD = 0.4).
Different SZAs do not practically affect the differences due to size at TOA, but they have a stronger impact at BOA. Differences due to shape change however with a changing SZA at both TOA and BOA. For example, as the SZA increases from 0 to 60°, the differences due to shape change from negative to positive at TOA (Fig. 16), although in all cases they are small.
At TOA, considering SD50 instead of SD10 results in less SW, LW, and total radiation leaving TOA, thus in more warming of the Earth–atmosphere system, with the differences being larger over the desert relative to the ocean by about an order of magnitude. The corresponding plots with the relative changes instead of the absolute changes are shown in the Appendix (Figs. A3 and A4 for BOA and TOA, respectively). Relative changes due to size at TOA can be as high as 300 %, confirming the findings of previous studies (e.g., Otto et al., 2011), which however correspond to small differences, of less than 3 W m−2, in absolute numbers.
From Fig. 16 it is clear that at TOA above the desert the effect of size on DRE is dominant over the effect of shape. Above the ocean, the effects of size and shape are comparable, but in all cases the differences are below 3 W m−2. As already discussed in Sect. 3.3.1, it is also clear from Figs. 15 and 16 that the estimated impact of using a less accurate size or shape for the simulations depends strongly on the RI used, i.e., on the composition of the dust particles.
In this section, results are presented for DOD = 0.4 because it is more representative of typical (and not extreme) dust events, and the results are directly comparable with the results from other studies (e.g., Otto et al., 2011). The corresponding differences for DOD = 1 and 1.6 are presented in Figs. S5 and S6 for BOA and Figs. A11 and A12 for TOA in the Appendix. Increasing the DOD from 0.4 to 1 results in differences that are nearly double compared to those presented in this section, while increasing DOD from 0.4 to 1.6 results in differences that are nearly triple.
The radiative effect of very large dust particles is usually underestimated in dust models. In fact, most dust models completely omit these particles. The underestimation is high closer to the desert dust sources (∼ 10 W m−2 for the SW irradiances at BOA, where cooling is underestimated, and TOA, where warming is underestimated, for DOD = 0.4). It is lower further away from the dust sources above the ocean, where, even for DOD = 1.6, the highest calculated underestimation is below 5 W m−2. This is due to the lower fraction of large dust particles (with diameters of 10–50 µm) over the ocean, with the fraction being more than 2 orders of magnitude lower than above the desert (Ryder et al., 2019). We should note though that the fraction of the large dust particles in the dust mixture over the ocean has been reported to be larger by other studies in the literature (e.g., Otto et al., 2009, 2011) than the one reported in Ryder et al. (2019) and used here.
The additional warming of the Earth–atmosphere system due to the large dust particles above the desert is generally in agreement with Ito et al. (2021), who showed that over major emission source regions (e.g., the Sahara) using more realistic optical properties results in less net downwelling radiation reaching BOA and less upwelling radiation at TOA, i.e., more atmospheric warming. The findings of our study also agree with the results of Kok et al. (2017), who showed that a more realistic representation of aerosols in global climate models would lead to less radiation leaving TOA. The findings of the latter study are not however directly comparable with our findings since they refer to the global scale.
The effect of dust size on aerosol optical properties has been discussed in Ryder et al. (2019), who (as in this study) used data from the Fennec campaign, as well as from the AER-D campaign and the RIs suggested by Colarco et al. (2014) and Balkanski et al. (2007). The fraction of the large dust particles in the dust mixture over the ocean reported in Ryder et al. (2019) was also significantly lower relative to the ones reported for other campaigns (e.g., Otto et al., 2009, 2011). They found that excluding giant particles over the Sahara results in underestimation of both SW and LW extinction by 18 % and 26 %, respectively. They also estimated smaller but non-negligible differences over the ocean. Their findings are consistent with the magnitude of the estimated differences of the three RIs considered in this study. We went a step further than Ryder et al. (2019) and quantified the effect of using more realistic SD and particle shapes for dust on the simulated irradiances and DREs at TOA and BOA.
We also confirm the findings of Song et al. (2022), who report that the RI used is the main uncertainty factor in the modeling of dust DRE. In the latter study the uncertainty due to RI is estimated to be ∼ 45 %. We show that under certain conditions, differences in the calculated DRE for different RIs can be much larger, exceeding 100 %. Song et al. (2022) also report that on a global scale the second most significant factor of uncertainty is the SD used, while the particle shape plays a negligible role. Our results verify the latter as well for the studied cases.
Otto et al. (2009) used data from the SAMUM campaign and showed that dust leads to cooling over the ocean but warming over the desert at TOA due to differences in their spectral surface albedo and surface temperature. In this study we show that the magnitude of the corresponding cooling and warming depends strongly on the RIs used, which again is consistent with the findings of Song et al. (2022). We further show that the use of specific RIs under specific conditions can result even in slight cooling at TOA over the ocean.
Otto et al. (2011) used spheroids instead of spheres for the modeling of the radiative effects of dust particles and estimated excessive cooling of ∼ 55 % over the ocean, a very weak change of ∼ 5 % over the desert, and cooling of ∼ 15 % at BOA over both the desert and the ocean (considering SZA = 0° and DOD = ∼ 0.4 at 0.5 µm, based on data from the SAMUM campaign). We also found a very weak change in DRE at TOA over the desert when spheroids were used instead of spheres. Over the ocean, we calculated cooling of the atmosphere, which in terms of relative difference was large in some cases, but it always corresponded to very small absolute differences of 5 W m−2 or less.
Our study focuses on quantifying the radiative effect of the underestimation of the size of dust particles and the misrepresentation of their RI and shape in models under different atmospheric and land surface conditions. It must be clear that it does not providing quantitative estimates of the dust radiative effects on a regional or a global scale. Although our findings are not directly comparable with regional or global average DREs, they are meaningful for comparison with actual measurements in related experiments (see, e.g., Otto et al., 2007). As can be also seen by the findings of other recent studies (e.g., Li et al., 2022, 2021; Song et al., 2022) the estimates of DRE on larger scales are strongly affected by the inhomogeneities in the characteristics of dust depending on its sources, on changes in its chemical and physical properties as it is transferred, and on the surface and environmental conditions. The present study contributes towards understanding the uncertainties in the estimates of regionally/globally averaged DREs by models that are commonly based on many assumptions (regarding, e.g., the shape, size, and composition of dust). Isolating the effects in a microscale sensitivity study can indirectly help modelers towards understanding the importance of each factor and their combined effects for determining the input uncertainties and their propagation to the outputs. In addition to the assessment of the regional/global DRE and its modeling parameterization, studies that are similar to the present one are also useful, for example, for evaluating satellite-based data or radiative closure studies.
We show that although the effect of the dust size is substantial for the radiative impact of dust, the main uncertainty factor is the RI (i.e., the chemical composition) of dust, which affects both the magnitude of the DRE and the differences in DRE due to size. Using a more realistic shape (spheroids instead of spheres) for the dust particles generally plays a minor role relative to all other factors, but under specific conditions the differences may be comparable to the differences due to the size of the particles (although they are always small, < 5 W m−2).
Regarding the spectral shape of differences in irradiance at BOA and TOA due to the use of more realistic shapes and SDs for the dust particles, again the differences strongly depend on the RI used. For a given DOD, the differences in the SW irradiances at TOA (upwelling) and BOA (downwelling) depend strongly on the change of the SSA. The differences in the LW region are practically significant only in the region of 8–13 µm and depend mostly on the changes in the extinction coefficient (i.e., the DOD) with wavelength.
We showed that the SZA also plays a significant role regarding the radiative effects of dust, and different SZAs may even result in a different sign for DRE. At BOA, at SZA = 0°, as in Otto et al. (2011), we calculated similar differences over the desert and the ocean when spheroids are considered instead of spheres, i.e., excessive cooling at TOA up to ∼ 15 %. However, as the SZA increases, the decrease in DRE weakens, and at SZA = 60° using spheroids instead of spheres results in positive changes in DRE at BOA. Nevertheless, it should be kept in mind that absolute differences were small in these cases.
From our analysis it is clear that in the case of dust the LW DRE at TOA should not be considered negligible, as also stated by Sicard et al. (2014). We showed that over highly reflective surfaces the LW DRE contributes significantly in the warming at TOA and the cooling at BOA. Over darker surfaces (i.e., the ocean) warming due to the LW DRE counterbalances cooling due to the SW DRE. The LW DRE can be even dominant at low SZAs, resulting in total warming above the ocean.
In our study we tried to estimate the effect of using more realistic shapes and SDs for the quantification of the dust DRE close to and away from a dust source and investigated the sensitivity of our findings to the SZA and the chemical composition of dust (RIs). It is an effort to show how better parameterization of dust in the models can improve the modeling of the DRE and which parameters are the most important regarding the uncertainties they introduce. This analysis is not exhaustive, since there are many instances of feedback and mechanisms that should be taken into account in order to accurately quantify the DRE. For example, excessive absorption of SW radiation in the atmosphere results in warming and subsequently in emission of LW radiation by the atmosphere. Excessive LW radiation at Earth's surface results in warming of the surface (i.e., changing temperature) and subsequently in differences in the spectral shape of the LW radiation emitted by the surface. Such phenomena have not been taken into account.
Further investigation, which is out of the scope of the present study, is necessary to quantify how interactions between solar and thermal radiation and different aerosol species would alter the radiative impact of dust particles. For example, we neglected the presence of scattering sea-salt particles, accumulated within the marine boundary layer, below the overlying absorbing dust particles when these are advected over maritime downwind areas. Under these conditions, an enhancement of the SW atmospheric warming is expected, depending on the dust burden intensity, thus affecting the sign at TOA (weaker cooling or even warming effect). Furthermore, according to Ryder et al. (2021), despite the usually dry conditions during dust events, the presence of dust favors the formation of water vapor in the SAL, which in turn increases the positive LW DRE at TOA and decreases the LW DRE at BOA. It must be also noticed that the dust shapes are various and usually irregular and a single model (e.g., spheres or spheroids) cannot represent accurately the complex shapes of dust (Luo et al., 2022; Connolly et al., 2020; Kalashnikova and Sokolik, 2002). Thus, further research is necessary in order to more precisely determine the effect of shape in radiative transfer modeling.
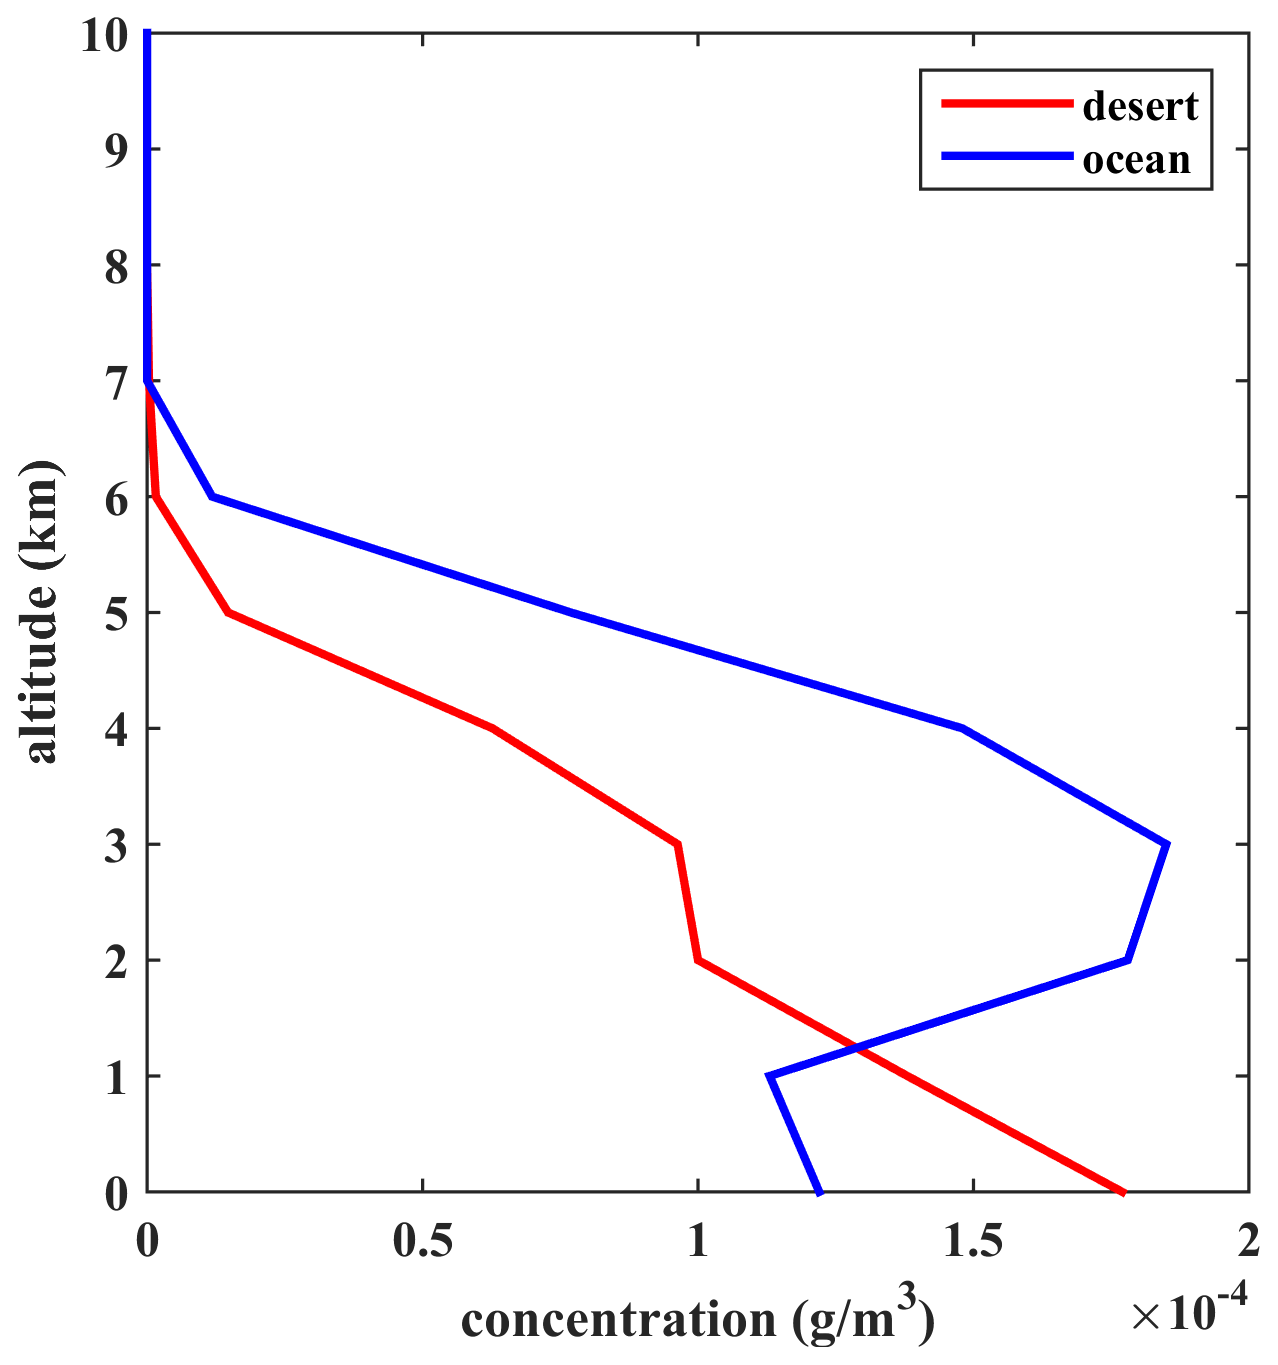
Figure A1Dust concentration that has been assumed for the libRadtran simulations over the desert and the ocean.
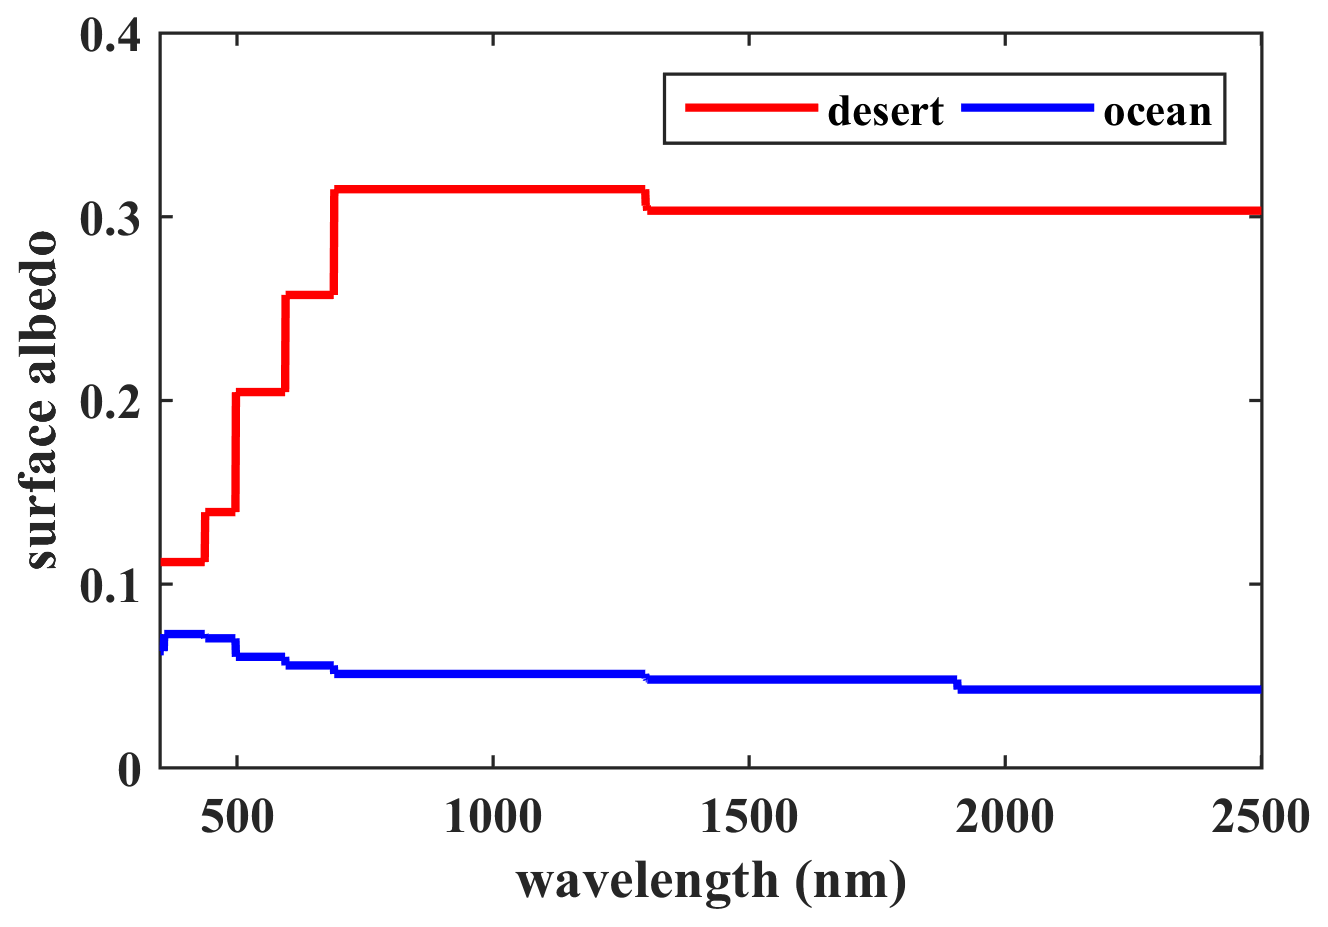
Figure A2Surface albedo that has been used for the simulations over the desert and the ocean (International Geosphere-Biosphere Programme, IGBP; Loveland and Belward, 1997).
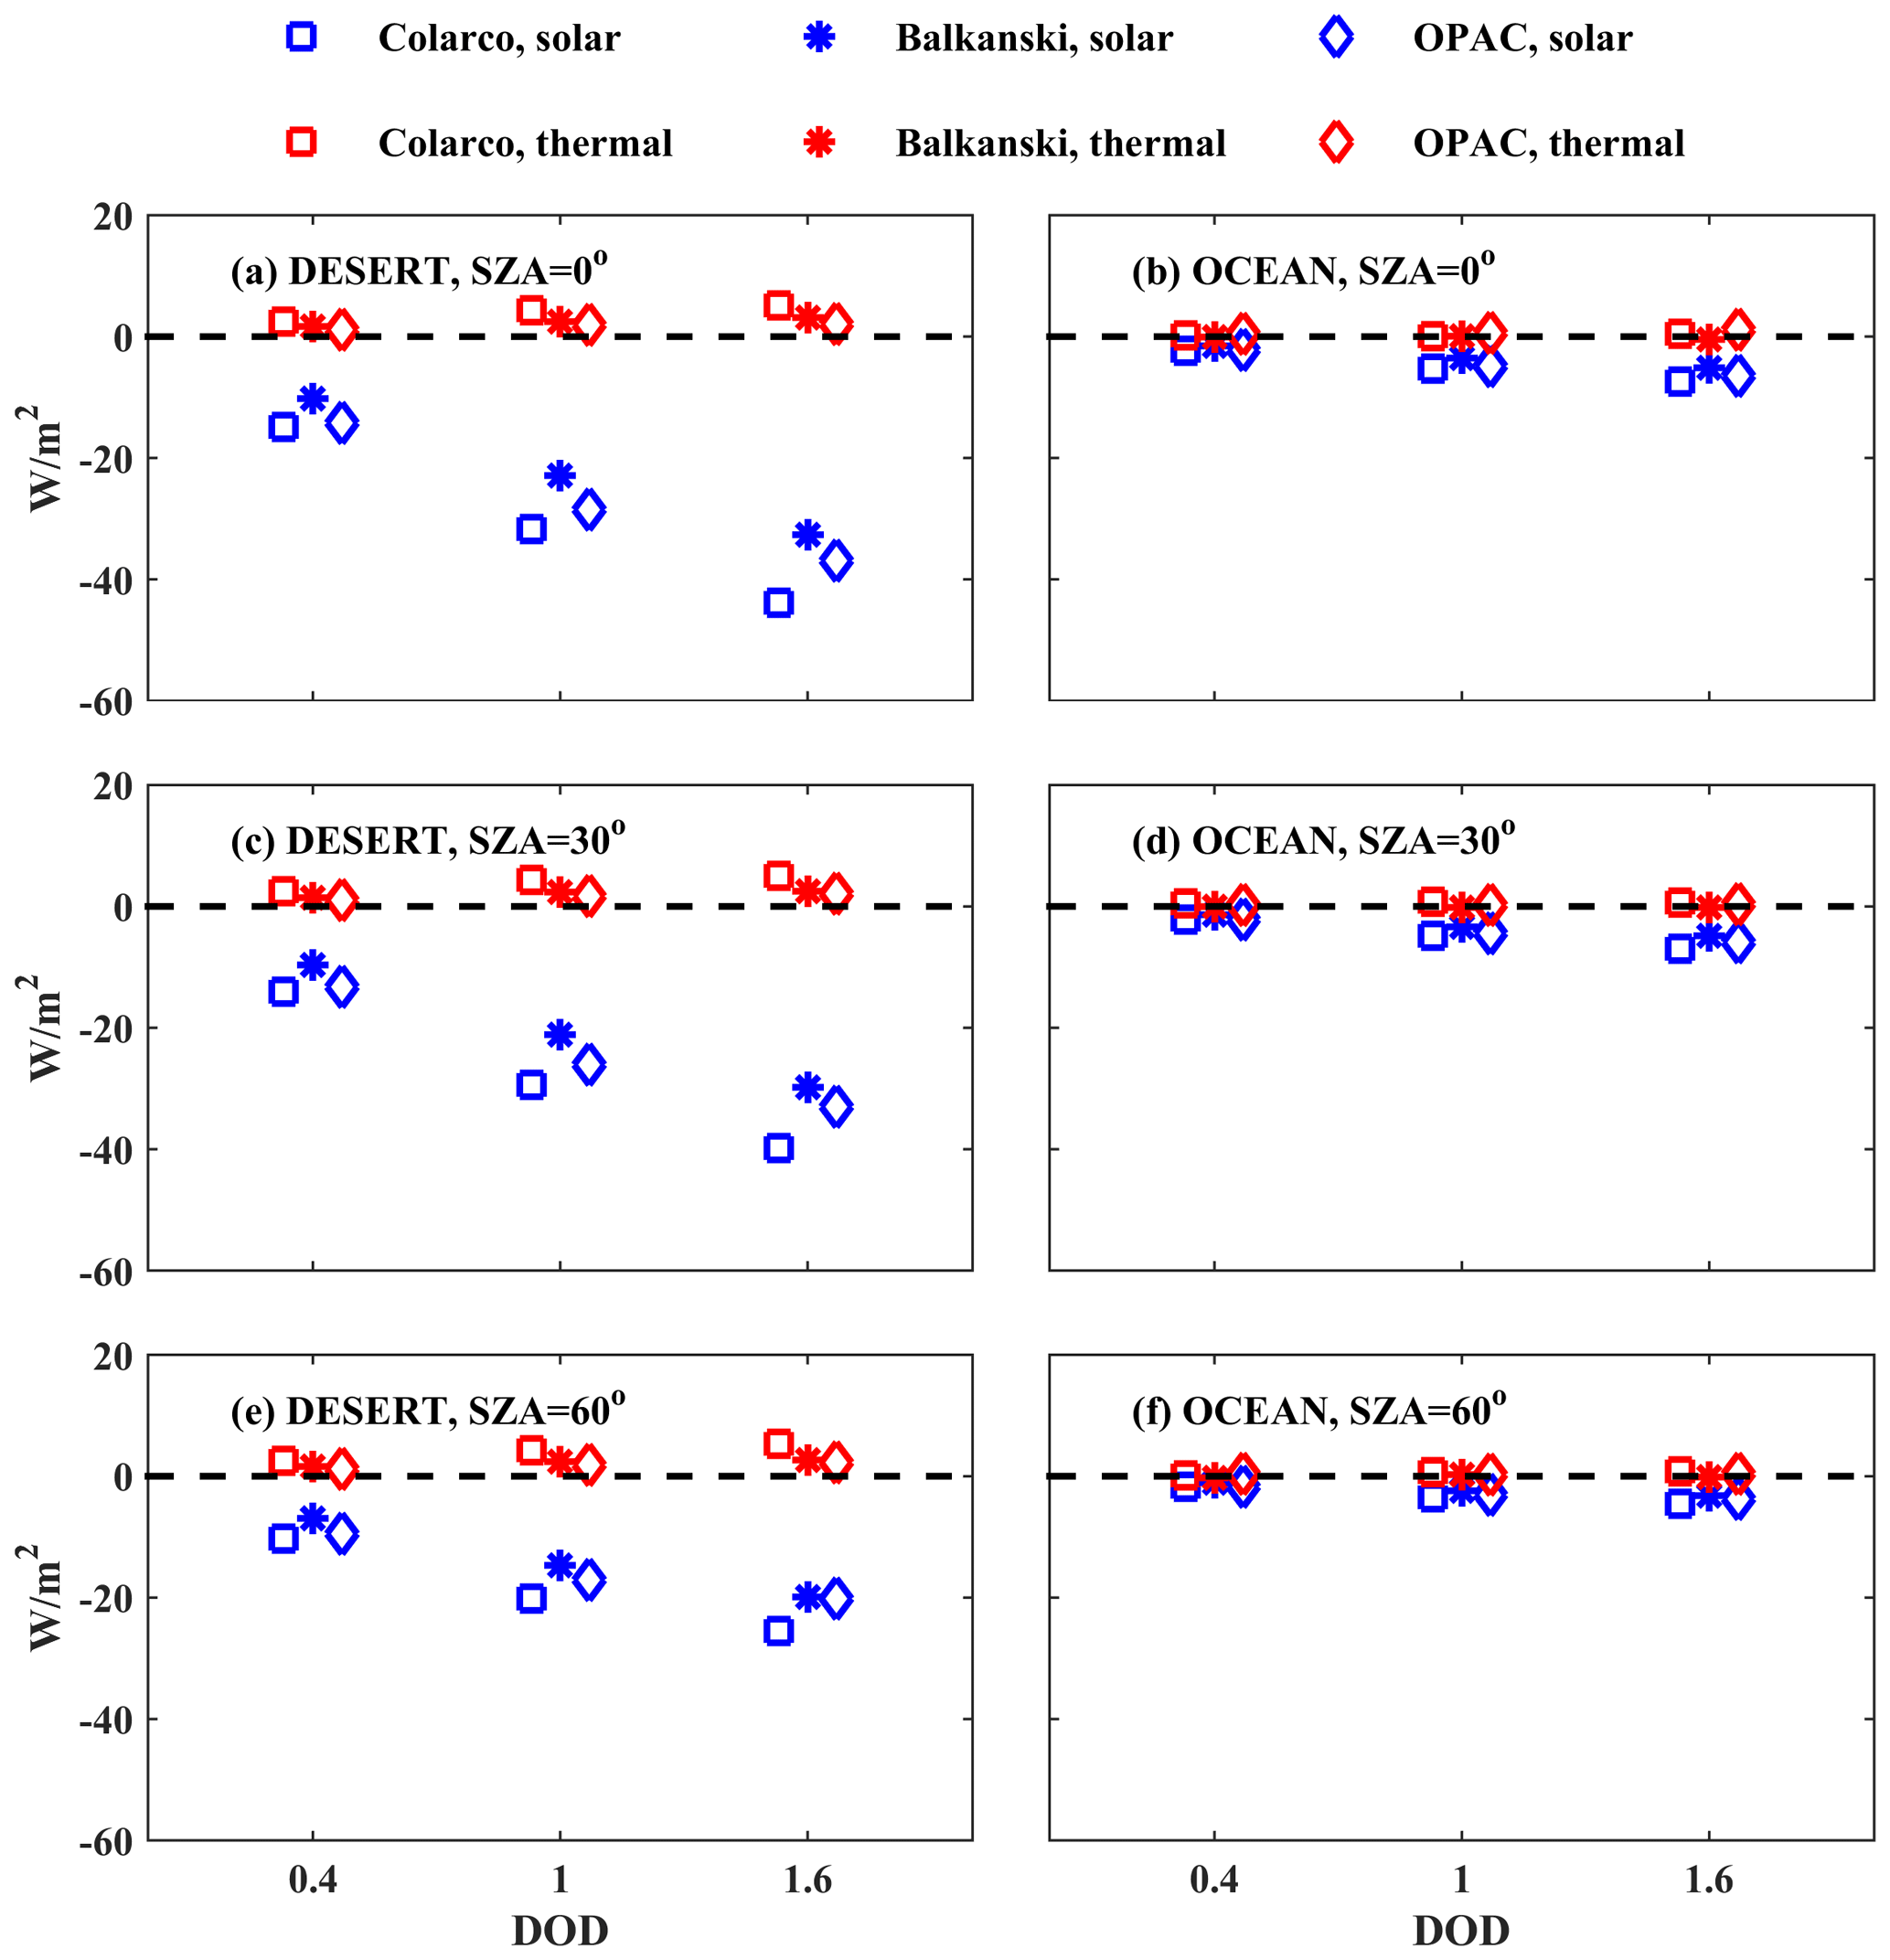
Figure A3Absolute differences between the irradiances in the SW (blue) and LW (red) regions at BOA considering SD10 and SD50 dust particles with spheroidal shapes (, Eq. 4). The differences are presented for calculations above the desert and the ocean for different RIs of the dust particles, DODs, and SZAs.

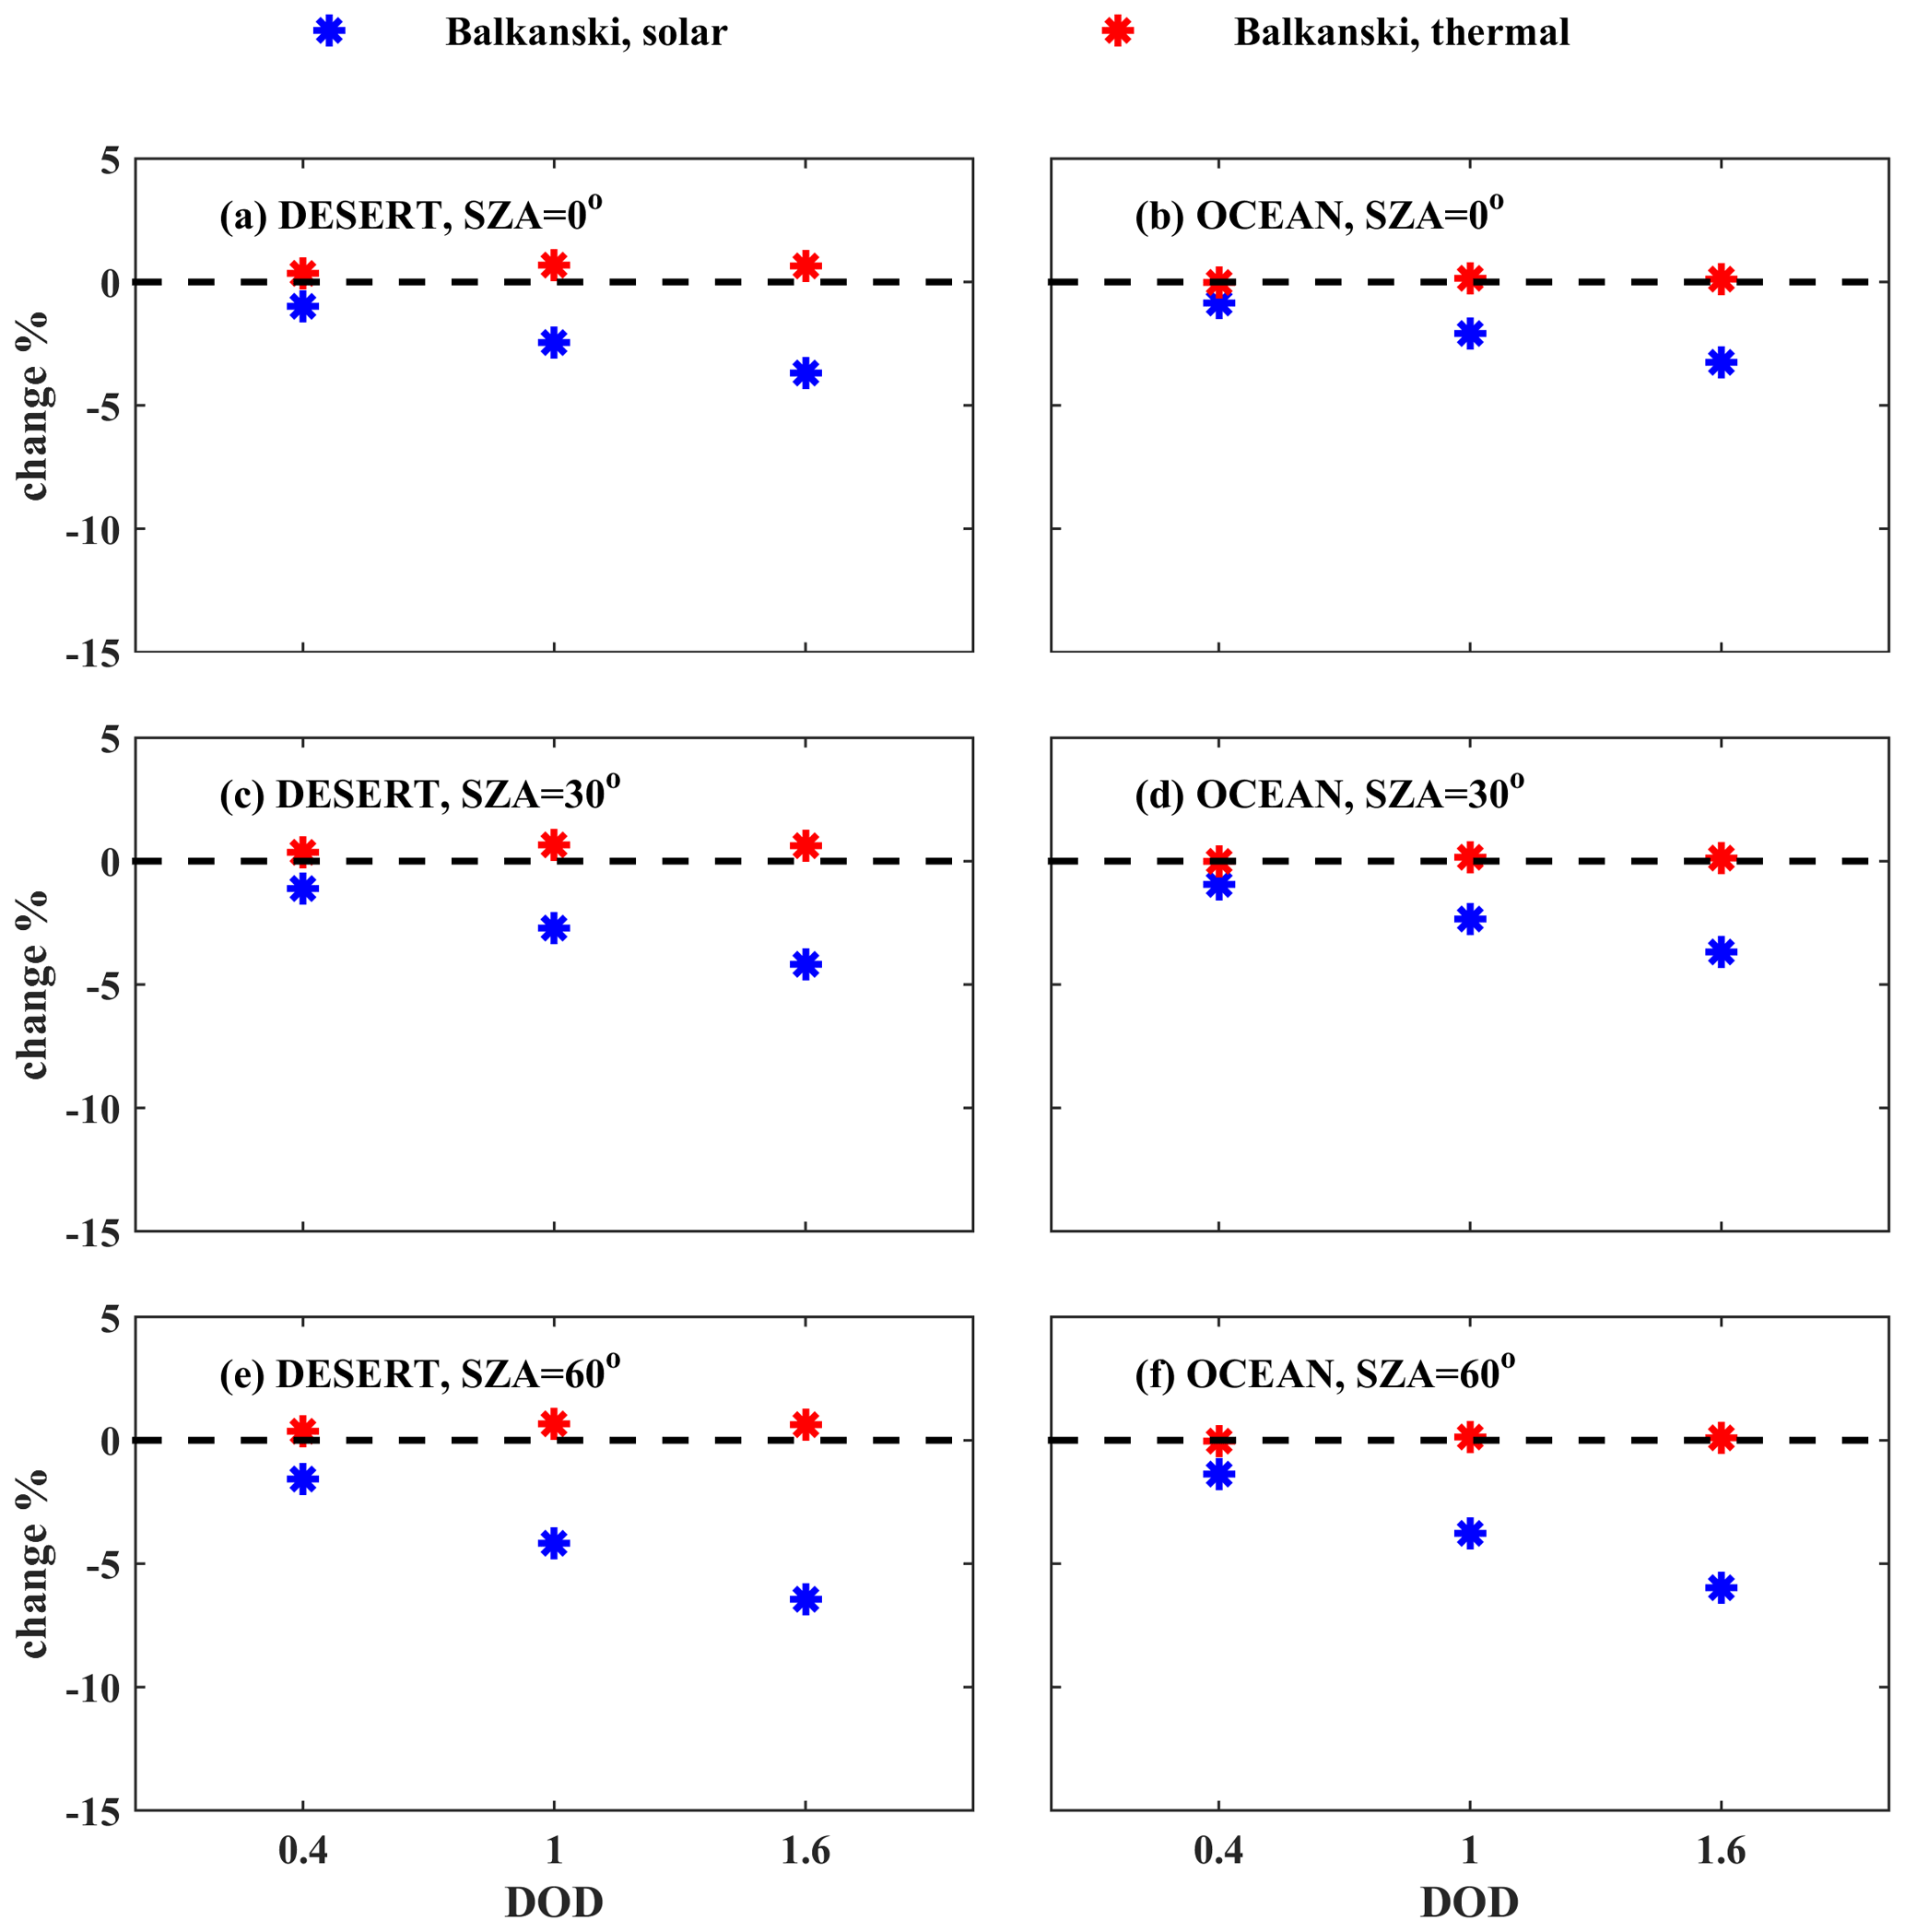
Figure A5Relative differences (%) between the irradiances in the SW (blue) and LW (red) regions at BOA considering SD10 and SD50 dust particles with spheroidal shapes (, Eq. 4) for the same aerosol SD and vertical distribution and the same atmospheric parameters. The differences are presented for calculations above the desert and the ocean for the Balkanski RI and for different DODs and SZAs of the dust particles.
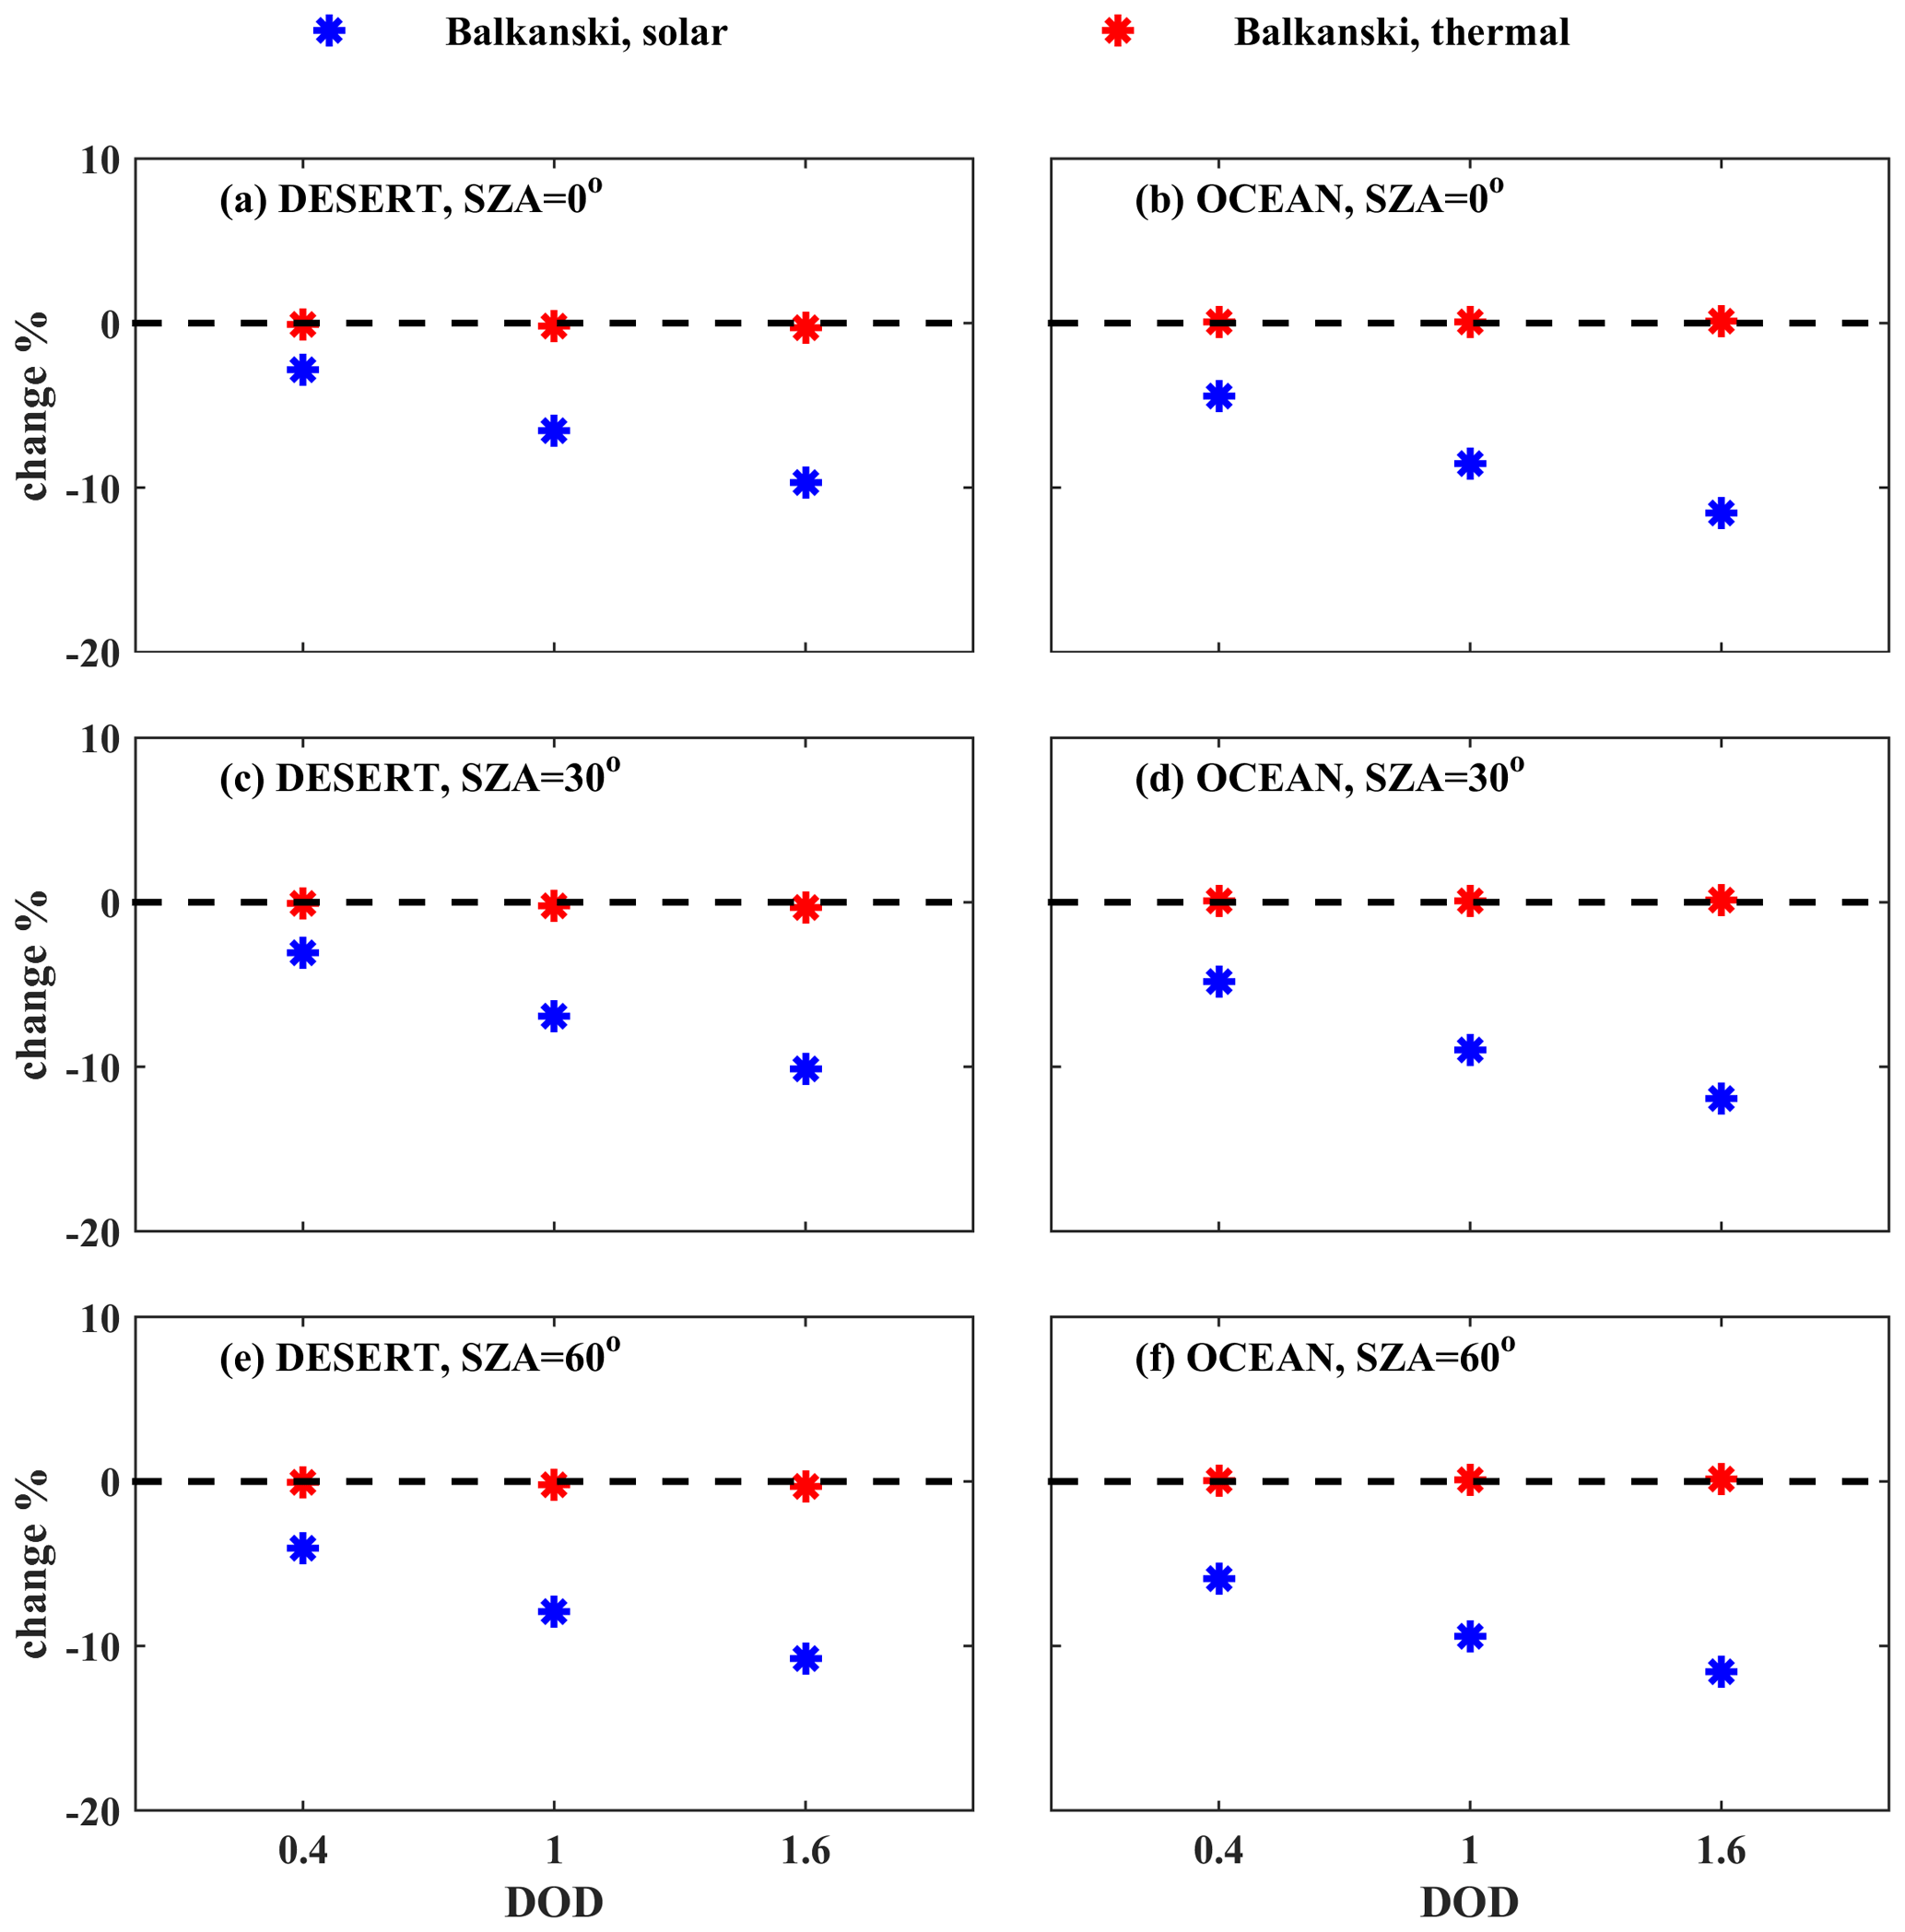

Figure A7Relative differences (%) in DRE at BOA for DOD = 0.4 due to the shape and size of the dust particles. Left: relative differences in DRE due to size (DRESD50 − DRESD10). Right: relative differences due to shape (DRESD50,spheroids − DRESD50,spheres).
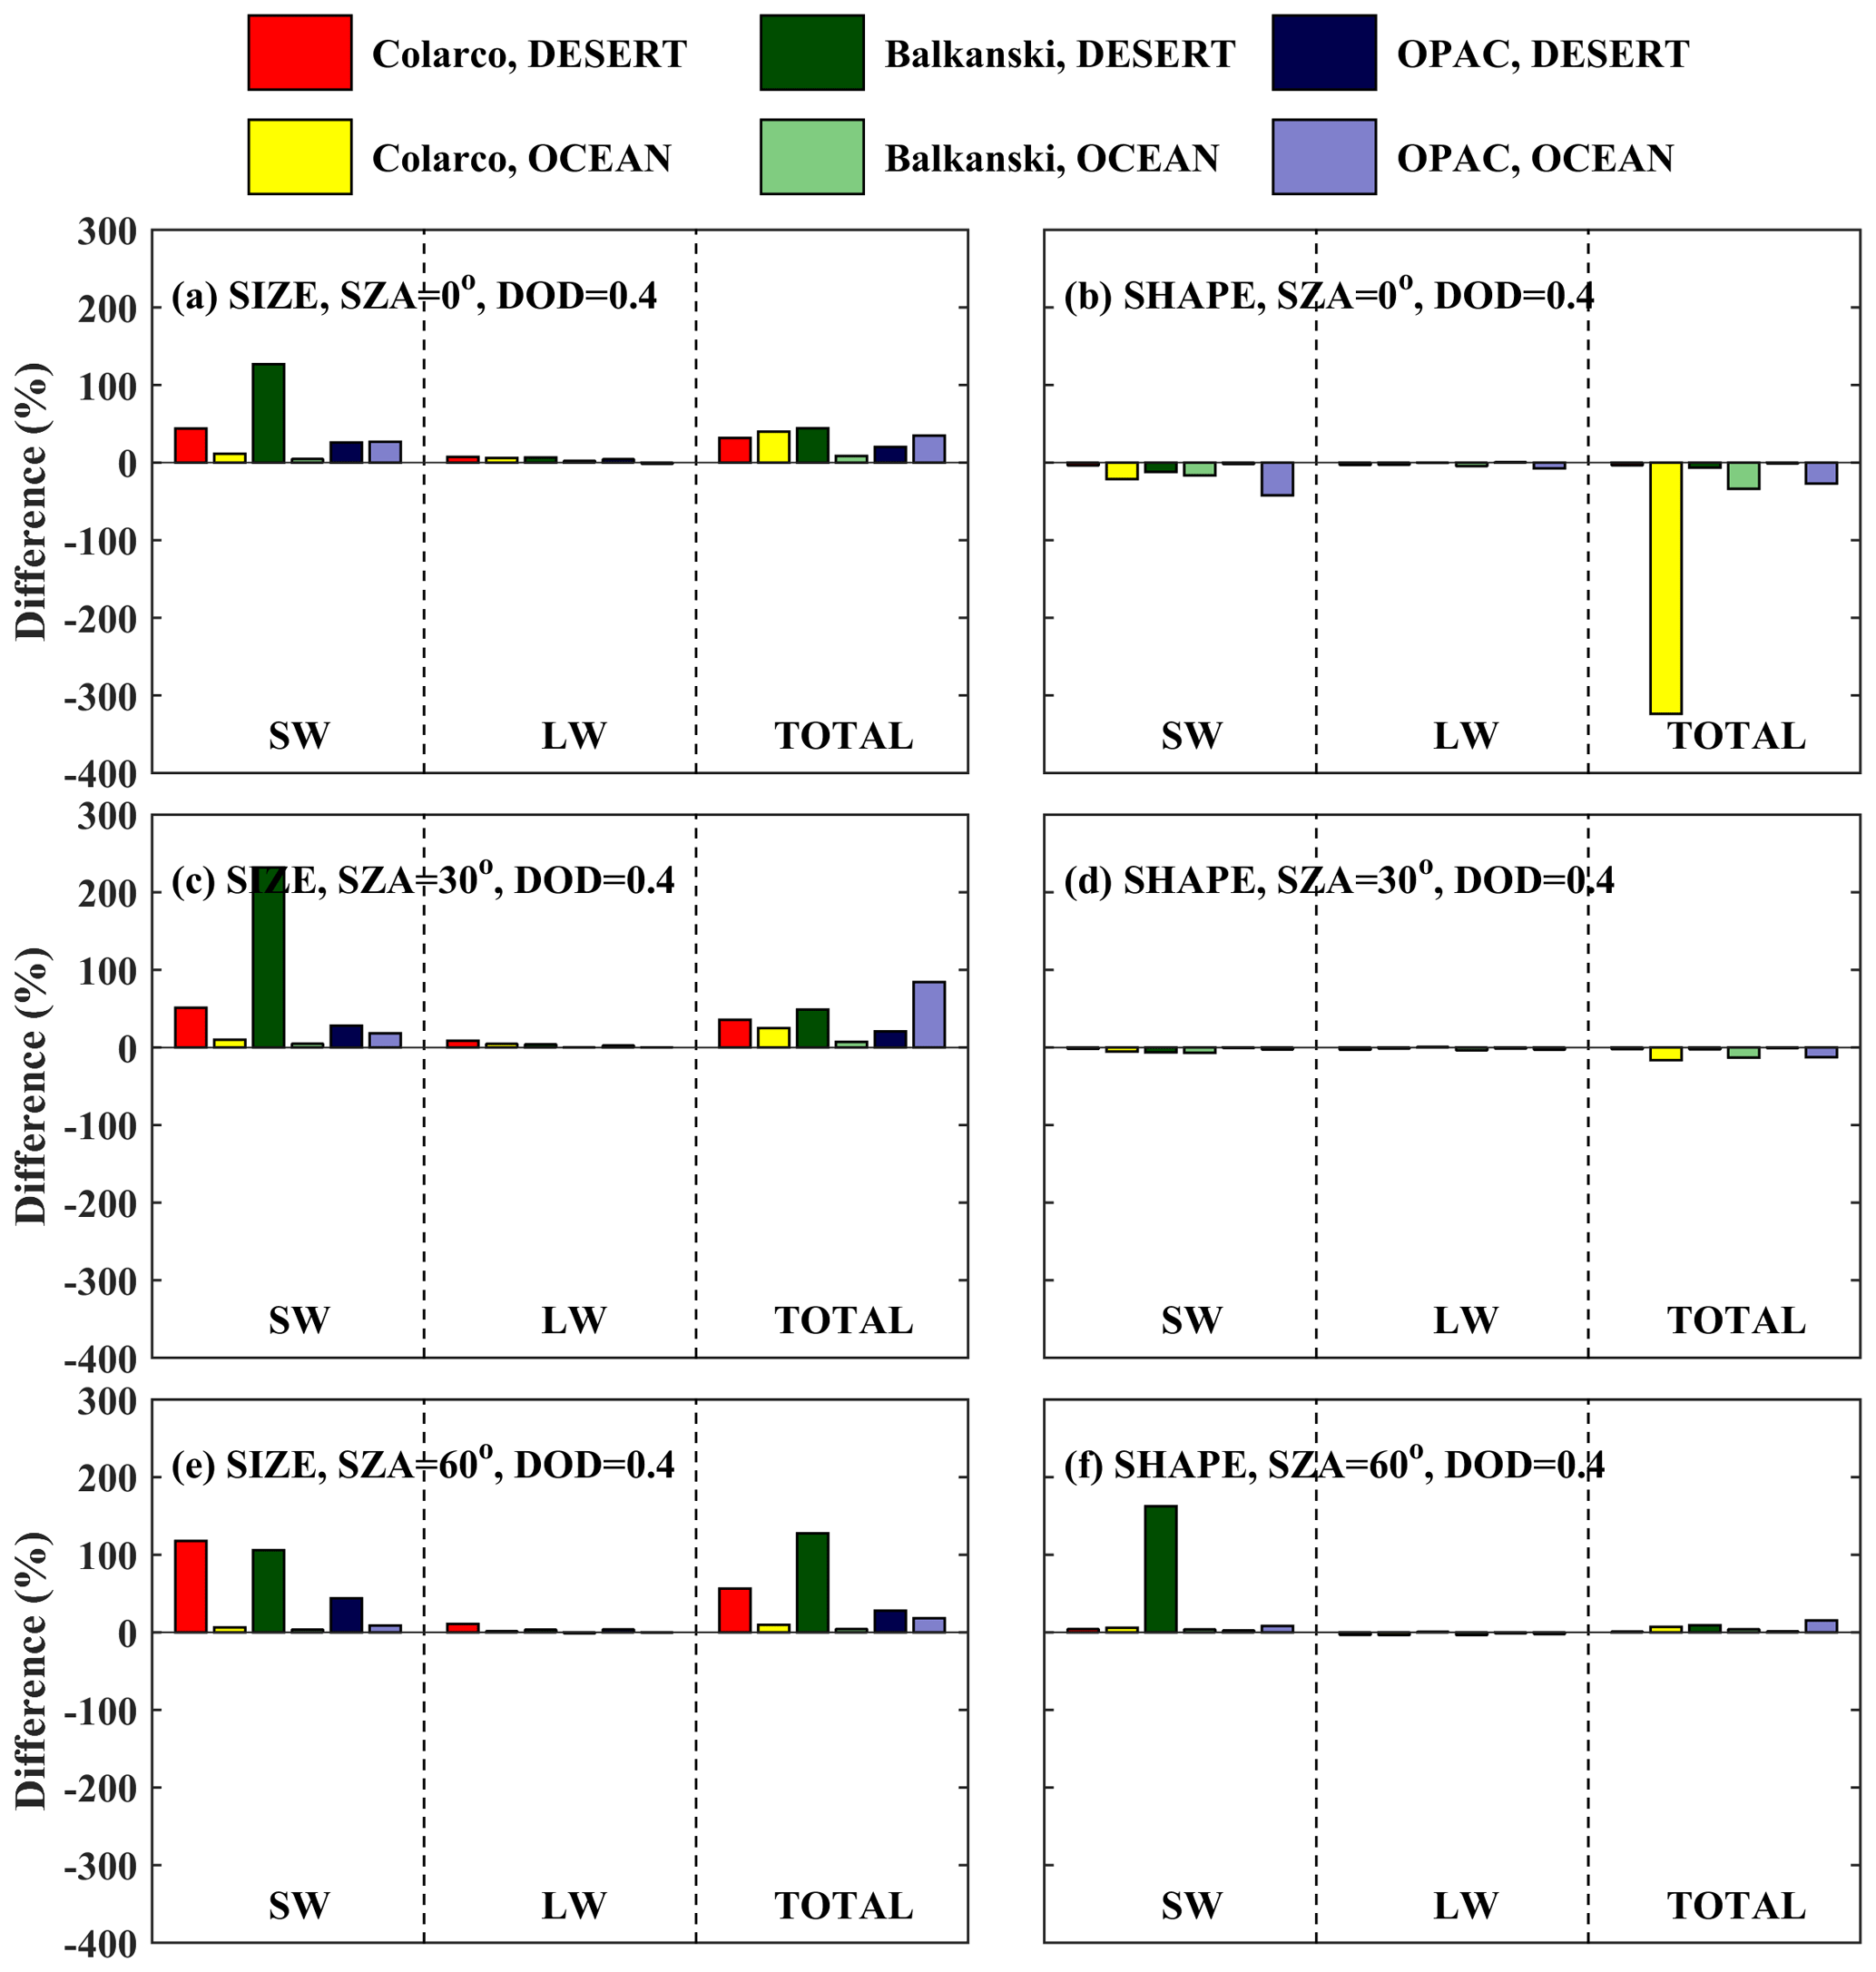
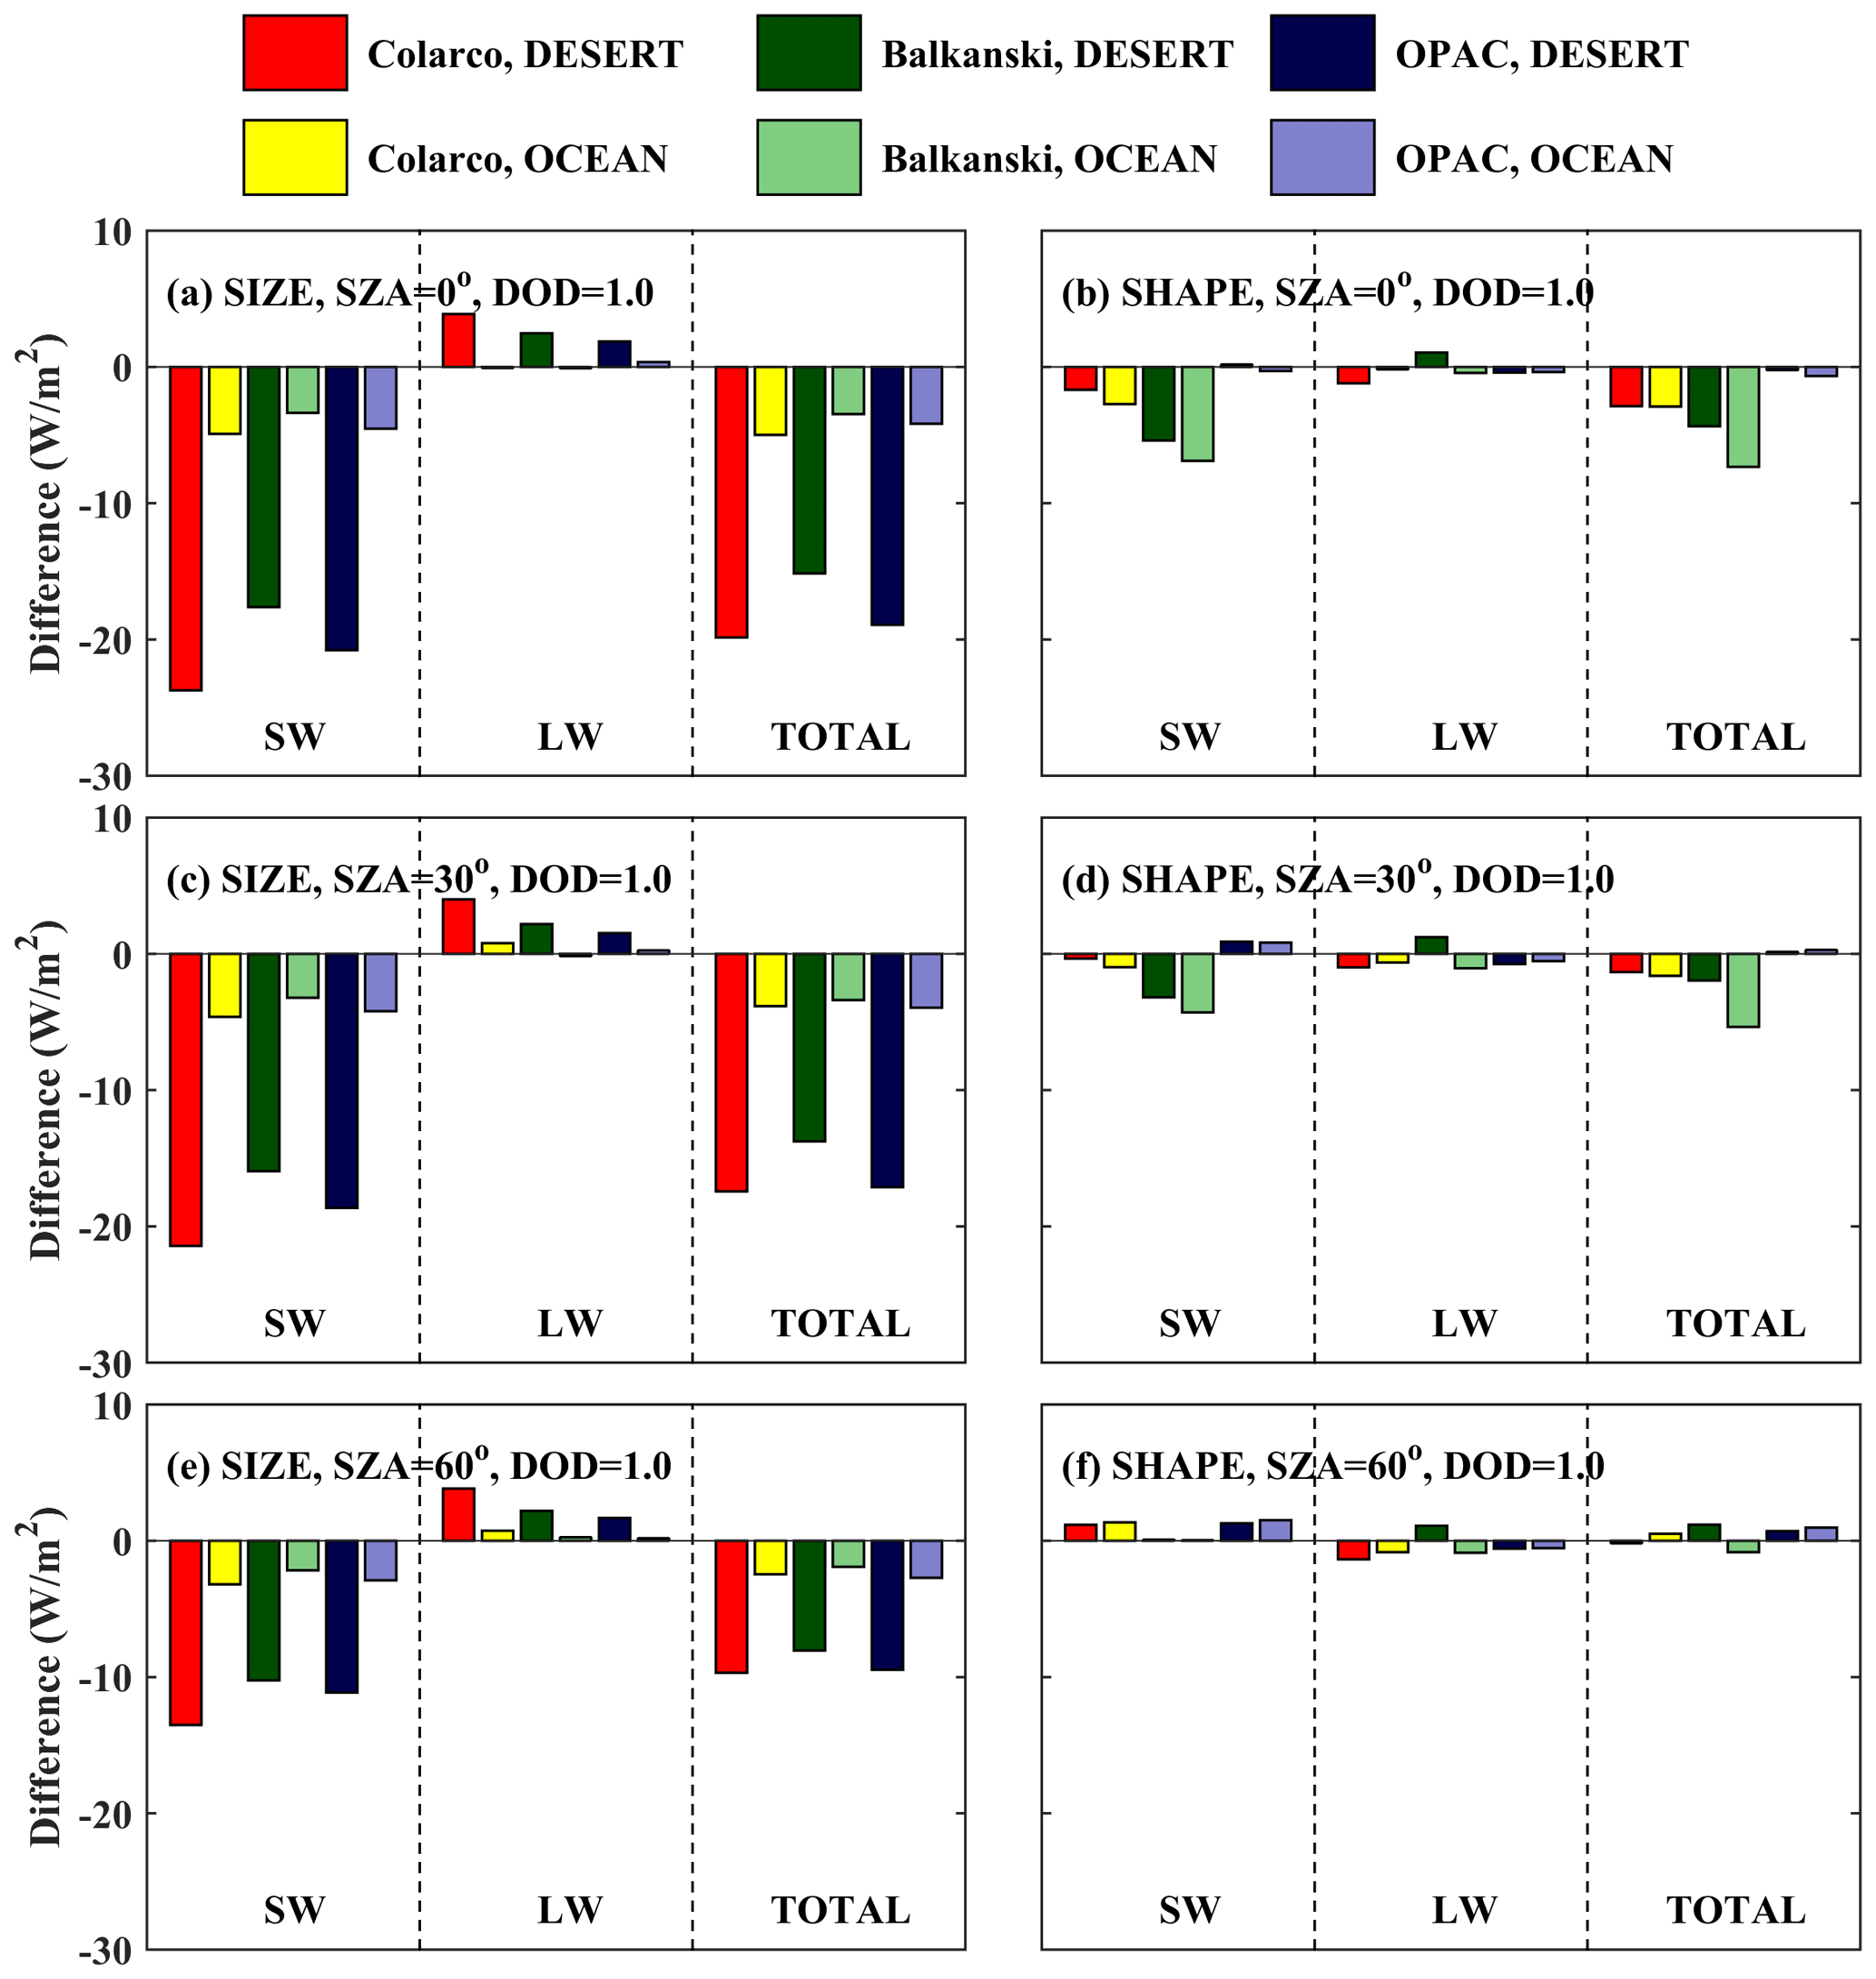
Figure A9Absolute differences in DRE at BOA for DOD = 1 due to the shape and size of the dust particles. (a, c, e) Absolute differences in DRE due to size (DRESD50 − DRESD10). (b, d, f) Absolute differences due to shape (DRESD50,spheroids − DRESD50,spheres).


Figure A11Absolute differences in DRE at TOA for DOD = 1 due to the shape and size of the dust particles. (a, c, e) Absolute differences in DRE due to size (DRESD50 − DRESD10). (b, d, f) Absolute differences due to shape (DRESD50,spheroids − DRESD50,spheres).

List of acronyms used in the paper
| Acronym | Explanation |
| AOD | Aerosol optical depth |
| BOA | Bottom of the atmosphere |
| DOD | Dust optical depth |
| DRE | Direct radiative effect |
| IRE | Indirect radiative effect |
| LW | Longwave |
| RI | Refractive index |
| SAL | Saharan air layer |
| SD | Size distribution |
| SD10 | Size distribution with maximum radii of 10 µm |
| SD50 | Size distribution with maximum radii of 50 µm |
| SRE | Semidirect radiative effect |
| SW | Shortwave |
| SZA | Solar zenith angle |
| TCWV | Total column of water vapor |
| TOA | Top of the atmosphere |
The LIVAS dust products are available upon request from Vassilis Amiridis (vamoir@noa.gr) and/or Emmanouil Proestakis (proestakis@noa.gr).
Conceptualization: SK, VA, and AT. Methodology: IF and AT. Formal analysis: IF, AT, MT, and AN. Software: IF, AT, MT, and AN. Validation: SK, AG, KP, VB, CE, and BM. Investigation: IF and AT. Resources: AT and VA. Data curation: IF, AT, MT, and MP. Visualization: IF and AT. Writing (original draft preparation): IF and AT. Supervision: SK and VA. Writing (review and editing): all authors. All authors gave final approval for publication.
At least one of the (co-)authors is a member of the editorial board of Atmospheric Chemistry and Physics. The peer-review process was guided by an independent editor, and the authors also have no other competing interests to declare.
Publisher’s note: Copernicus Publications remains neutral with regard to jurisdictional claims made in the text, published maps, institutional affiliations, or any other geographical representation in this paper. While Copernicus Publications makes every effort to include appropriate place names, the final responsibility lies with the authors.
Authors would like to acknowledge Harmonia Action (no. CA21119) supported by COST (European Cooperation in Science and Technology). Stelios Kazadzis acknowledges ACTRIS-CH (Aerosol, Clouds and Trace Gases Research Infrastructure – Swiss contribution) funded by the State Secretariat for Education, Research and Innovation. Emmanouil Proestakis was supported by the AXA Research Fund for postdoctoral researchers under the project entitled Earth Observation for Air-Quality – Dust Fine-Mode – EO4AQ-DustFM. Antonis Gkikas acknowledges support by the Hellenic Foundation for Research and Innovation (H.F.R.I.) under the 2nd Call for H.F.R.I. Research Projects to support Post-Doctoral Researchers (ATLANTAS, project no. 544).
This research was financially supported by D-TECT (grant agreement no. 725698) funded by the European Research Council (ERC) under the European Union's Horizon 2020 research and innovation program and by PANGEA4CalVal (grant agreement no. 101079201) funded by the European Union.
This paper was edited by N'Datchoh Evelyne Touré and reviewed by I. Pérez and two anonymous referees.
Adebiyi, A. A. and Kok, J. F.: Climate models miss most of the coarse dust in the atmosphere, Sci. Adv., 6, eaaz9507, https://doi.org/10.1126/sciadv.aaz9507, 2022.
Adebiyi, A. A., Kok, J. F., Wang, Y., Ito, A., Ridley, D. A., Nabat, P., and Zhao, C.: Dust Constraints from joint Observational-Modelling-experiMental analysis (DustCOMM): comparison with measurements and model simulations, Atmos. Chem. Phys., 20, 829–863, https://doi.org/10.5194/acp-20-829-2020, 2020.
Adebiyi, A., Kok, J. F., Murray, B. J., Ryder, C. L., Stuut, J.-B. W., Kahn, R. A., Knippertz, P., Formenti, P., Mahowald, N. M., Pérez García-Pando, C., Klose, M., Ansmann, A., Samset, B. H., Ito, A., Balkanski, Y., Di Biagio, C., Romanias, M. N., Huang, Y., and Meng, J.: A review of coarse mineral dust in the Earth system, Aeolian Res., 60, 100849, https://doi.org/10.1016/j.aeolia.2022.100849, 2023.
Amiridis, V., Wandinger, U., Marinou, E., Giannakaki, E., Tsekeri, A., Basart, S., Kazadzis, S., Gkikas, A., Taylor, M., Baldasano, J., and Ansmann, A.: Optimizing CALIPSO Saharan dust retrievals, Atmos. Chem. Phys., 13, 12089–12106, https://doi.org/10.5194/acp-13-12089-2013, 2013.
Amiridis, V., Marinou, E., Tsekeri, A., Wandinger, U., Schwarz, A., Giannakaki, E., Mamouri, R., Kokkalis, P., Binietoglou, I., Solomos, S., Herekakis, T., Kazadzis, S., Gerasopoulos, E., Proestakis, E., Kottas, M., Balis, D., Papayannis, A., Kontoes, C., Kourtidis, K., Papagiannopoulos, N., Mona, L., Pappalardo, G., Le Rille, O., and Ansmann, A.: LIVAS: a 3-D multi-wavelength aerosol/cloud database based on CALIPSO and EARLINET, Atmos. Chem. Phys., 15, 7127–7153, https://doi.org/10.5194/acp-15-7127-2015, 2015.
Anderson, G. P., Clough, S. A., Kneizys, F. X., Chetwynd, J. H., and Shettle, E. P.: AFGL atmospheric constituent profiles (0.120 km), Technical Report, Air Force Geophysics Lab Hanscom AFB MA, 1986.
Balkanski, Y., Schulz, M., Claquin, T., and Guibert, S.: Reevaluation of Mineral aerosol radiative forcings suggests a better agreement with satellite and AERONET data, Atmos. Chem. Phys., 7, 81–95, https://doi.org/10.5194/acp-7-81-2007, 2007.
Bi, L. and Yang, P.: Physical-geometric optics hybrid methods for computing the scattering and absorption properties of ice crystals and dust aerosols BT – Light Scattering Reviews 8: Radiative transfer and light scattering, edited by: Kokhanovsky, A. A., Springer Berlin Heidelberg, Berlin, Heidelberg, 69–114, https://doi.org/10.1007/978-3-642-32106-1_2, 2013.
Bi, L., Yang, P., Kattawar, G. W., and Kahn, R.: Single-scattering properties of triaxial ellipsoidal particles for a size parameter range from the Rayleigh to geometric-optics regimes, Appl. Opt., 48, 114–126, https://doi.org/10.1364/AO.48.000114, 2009.
Buehler, S. A., John, V. O., Kottayil, A., Milz, M., and Eriksson, P.: Efficient radiative transfer simulations for a broadband infrared radiometer – Combining a weighted mean of representative frequencies approach with frequency selection by simulated annealing, J. Quant. Spectrosc. Ra., 111, 602–615, https://doi.org/10.1016/j.jqsrt.2009.10.018, 2010.
Buras, R. and Mayer, B.: Efficient unbiased variance reduction techniques for Monte Carlo simulations of radiative transfer in cloudy atmospheres: The solution, J. Quant. Spectrosc. Ra., 112, 434–447, https://doi.org/10.1016/j.jqsrt.2010.10.005, 2011.
Colarco, P. R., Nowottnick, E. P., Randles, C. A., Yi, B., Yang, P., Kim, K.-M., Smith, J. A., and Bardeen, C. G.: Impact of radiatively interactive dust aerosols in the NASA GEOS-5 climate model: Sensitivity to dust particle shape and refractive index, J. Geophys. Res.-Atmos., 119, 753–786, https://doi.org/10.1002/2013JD020046, 2014.
Connolly, B. J., Loth, E., and Smith, C. F.: Shape and drag of irregular angular particles and test dust, Powder Technol., 363, 275–285, https://doi.org/10.1016/j.powtec.2019.12.045, 2020.
d’Almeida, G. A., Koepke, P., and Shettle, E. P.: Atmospheric Aerosols: Global Climatology and Radiative Characteristics, A. Deepak Publishing, 561 pp., https://apps.dtic.mil/sti/citations/ADA175173 (last access: 15 April 2024), 1991.
Di Biagio, C., Formenti, P., Balkanski, Y., Caponi, L., Cazaunau, M., Pangui, E., Journet, E., Nowak, S., Andreae, M. O., Kandler, K., Saeed, T., Piketh, S., Seibert, D., Williams, E., and Doussin, J.-F.: Complex refractive indices and single-scattering albedo of global dust aerosols in the shortwave spectrum and relationship to size and iron content, Atmos. Chem. Phys., 19, 15503–15531, https://doi.org/10.5194/acp-19-15503-2019, 2019.
Diehl, K., Debertshäuser, M., Eppers, O., Schmithüsen, H., Mitra, S. K., and Borrmann, S.: Particle surface area dependence of mineral dust in immersion freezing mode: investigations with freely suspended drops in an acoustic levitator and a vertical wind tunnel, Atmos. Chem. Phys., 14, 12343–12355, https://doi.org/10.5194/acp-14-12343-2014, 2014.
Doherty, O. M., Riemer, N., and Hameed, S.: Saharan mineral dust transport into the Caribbean: Observed atmospheric controls and trends, J. Geophys. Res.-Atmos., 113, D07211, https://doi.org/10.1029/2007JD009171, 2008.
Drakaki, E., Amiridis, V., Tsekeri, A., Gkikas, A., Proestakis, E., Mallios, S., Solomos, S., Spyrou, C., Marinou, E., Ryder, C. L., Bouris, D., and Katsafados, P.: Modeling coarse and giant desert dust particles, Atmos. Chem. Phys., 22, 12727–12748, https://doi.org/10.5194/acp-22-12727-2022, 2022.
Dubovik, O., Sinyuk, A., Lapyonok, T., Holben, B. N. , Mishchenko, M., Yang, P., Eck, T. F., Volten, H., Muñoz, O., Veihelmann, B., van der Zande, W. J., Leon, J.-F., Sorokin, M., and Slutsker, I.: Application of spheroid models to account for aerosol particle nonsphericity in remote sensing of desert dust, J. Geophys. Res., 111, D11208, https://doi.org/10.1029/2005JD006619, 2006.
Emde, C., Buras, R., Mayer, B., and Blumthaler, M.: The impact of aerosols on polarized sky radiance: model development, validation, and applications, Atmos. Chem. Phys., 10, 383–396, https://doi.org/10.5194/acp-10-383-2010, 2010.
Emde, C., Buras-Schnell, R., Kylling, A., Mayer, B., Gasteiger, J., Hamann, U., Kylling, J., Richter, B., Pause, C., Dowling, T., and Bugliaro, L.: The libRadtran software package for radiative transfer calculations (version 2.0.1), Geosci. Model Dev., 9, 1647–1672, https://doi.org/10.5194/gmd-9-1647-2016, 2016.
Fountoulakis, I., Papachristopoulou, K., Proestakis, E., Amiridis, V., Kontoes, C., and Kazadzis, S.: Effect of Aerosol Vertical Distribution on the Modeling of Solar Radiation, Remote Sensing, 14, 1143, https://doi.org/10.3390/rs14051143, 2022.
Gasteiger, J. and Wiegner, M.: MOPSMAP v1.0: a versatile tool for the modeling of aerosol optical properties, Geosci. Model Dev., 11, 2739–2762, https://doi.org/10.5194/gmd-11-2739-2018, 2018.
Gasteiger, J., Wiegner, M., Groß, S., Freudenthaler, V., Toledano, C., Tesche, M., and Kandler, K.: Modelling lidar-relevant optical properties of complex mineral dust aerosols, Tellus B, 63, 725–741, https://doi.org/10.1111/j.1600-0889.2011.00559.x, 2011.
Gasteiger, J., Emde, C., Mayer, B., Buras, R., Buehler, S. A., and Lemke, O.: Representative wavelengths absorption parameterization applied to satellite channels and spectral bands, J. Quant. Spectrosc. Ra., 148, 99–115, https://doi.org/10.1016/j.jqsrt.2014.06.024, 2014.
GMAO: MERRA-2 tavg1_2d_slv_Nx: 2d,1-Hourly,Time-Averaged,Single-Level,Assimilation,Single-Level Diagnostics 0.625',× 0.5 degree V5.12.4 (M2T1NXSLV) at GES DISC, Greenbelt, MD, USA, Goddard Earth Sciences Data and Information Services Center (GES DISC) [data set], https://doi.org/10.5067/VJAFPLI1CSIV, 2015.
Gutleben, M., Groß, S., Wirth, M., Emde, C., and Mayer, B.: Impacts of water vapor on Saharan air layer radiative heating, Geophys. Res. Lett., 46, 14854–14862, https://doi.org/10.1029/2019GL085344, 2019.
Gutleben, M., Groß, S., Wirth, M., and Mayer, B.: Radiative effects of long-range-transported Saharan air layers as determined from airborne lidar measurements, Atmos. Chem. Phys., 20, 12313–12327, https://doi.org/10.5194/acp-20-12313-2020, 2020.
Haywood, J., Francis, P., Osborne, S., Glew, M., Loeb, N., Highwood, E., Tanré, D., Myhre, G., Formenti, P., and Hirst, E.: Radiative properties and direct radiative effect of Saharan dust measured by the C-130 aircraft during SHADE: 1. Solar spectrum, J. Geophys. Res.-Atmos., 108, 8577, https://doi.org/10.1029/2002JD002687, 2003.
Haywood, J. M., Francis, P. N., Glew, M. D., and Taylor, J. P.: Optical properties and direct radiative effect of Saharan dust: A case study of two Saharan dust outbreaks using aircraft data, J. Geophys. Res.-Atmos., 106, 18417–18430, https://doi.org/10.1029/2000JD900319, 2001.
Hess, M., Koepke, P., and Schult, I.: Optical Properties of Aerosols and Clouds: The Software Package OPAC, B. Am. Meteorol. Soc., 79, 831–844, https://doi.org/10.1175/1520-0477(1998)079<0831:OPOAAC>2.0.CO;2, 1998.
Huang, Y., Kok, J. F., Kandler, K., Lindqvist, H., Nousiainen, T., Sakai, T., Adebiyi, A., and Jokinen, O.: Climate Models and Remote Sensing Retrievals Neglect Substantial Desert Dust Asphericity, Geophys. Res. Lett., 47, e2019GL086592, https://doi.org/10.1029/2019GL086592, 2020a.
Huang, Y., Liu, C., Yao, B., Yin, Y., and Bi, L.: Scattering matrices of mineral dust aerosols: a refinement of the refractive index impact, Atmos. Chem. Phys., 20, 2865–2876, https://doi.org/10.5194/acp-20-2865-2020, 2020b.
Huneeus, N., Schulz, M., Balkanski, Y., Griesfeller, J., Prospero, J., Kinne, S., Bauer, S., Boucher, O., Chin, M., Dentener, F., Diehl, T., Easter, R., Fillmore, D., Ghan, S., Ginoux, P., Grini, A., Horowitz, L., Koch, D., Krol, M. C., Landing, W., Liu, X., Mahowald, N., Miller, R., Morcrette, J.-J., Myhre, G., Penner, J., Perlwitz, J., Stier, P., Takemura, T., and Zender, C. S.: Global dust model intercomparison in AeroCom phase I, Atmos. Chem. Phys., 11, 7781–7816, https://doi.org/10.5194/acp-11-7781-2011, 2011.
Ibrahim, S., Romanias, M. N., Alleman, L. Y., Zeineddine, M. N., Angeli, G. K., Trikalitis, P. N., and Thevenet, F.: Water Interaction with Mineral Dust Aerosol: Particle Size and Hygroscopic Properties of Dust, ACS Earth Space Chem., 2, 376–386, https://doi.org/10.1021/acsearthspacechem.7b00152, 2018.
IPCC: Climate Change 2013: The Physical Science Basis. Contribution of Working Group I to the Fifth Assessment Report of the Intergovernmental Panel on Climate Change, edited by: Stocker, T. F., Qin, D., Plattner, G.-K., Tignor, M., Allen, S. K., Boschung, J., Nauels, A., and Xia, Y., 2013.
Ito, A., Adebiyi, A. A., Huang, Y., and Kok, J. F.: Less atmospheric radiative heating by dust due to the synergy of coarser size and aspherical shape, Atmos. Chem. Phys., 21, 16869–16891, https://doi.org/10.5194/acp-21-16869-2021, 2021.
Jickells, T. D., An, Z. S., Andersen, K. K., Baker, A. R., Bergametti, G., Brooks, N., Cao, J. J., Boyd, P. W., Duce, R. A., Hunter, K. A., Kawahata, H., Kubilay, N., laRoche, J., Liss, P. S., Mahowald, N., Prospero, J. M., Ridgwell, A. J., Tegen, I., and Torres, R.: Global Iron Connections Between Desert Dust, Ocean Biogeochemistry, and Climate, Science, 308, 67–71, https://doi.org/10.1126/science.1105959, 2005.
Kalashnikova, O. V. and Sokolik, I. N.: Importance of shapes and compositions of wind-blown dust particles for remote sensing at solar wavelengths, Geophys. Res. Lett., 29, 34–38, https://doi.org/10.1029/2002GL014947, 2002.
Kandler, K., SchutzZ, L., Deutsher, C., Ebert, M., Hofmann, H., Jackel, S., Jaenicke, R., Knippertz, P., Lieke, K., Massling, A., Petzold, A., Schladitz, A., Weinzierl, B., Wiedensohler, A., Zorn, S., and Weinbruch, S.: Size distribution, mass concentration, chemical and mineralogical composition and derived optical parameters of the boundary layer aerosol at Tinfou, Morocco, during SAMUM 2006, Tellus B, 61, 32–50, https://doi.org/10.1111/j.1600-0889.2008.00385.x, 2009.
Kandler, K., Schütz, L., Jäckel, S., Lieke, K., Emmel, C., Müller-Ebert, D., Ebert, M., Scheuvens, D., Schladitz, A., Šegvić, B., Wiedensohler, A., and Weinbruch, S.: Ground-based off-line aerosol measurements at Praia, Cape Verde, during the Saharan Mineral Dust Experiment: microphysical properties and mineralogy, Tellus B, 63, 459–474, https://doi.org/10.1111/j.1600-0889.2011.00546.x, 2011.
Karydis, V. A., Tsimpidi, A. P., Bacer, S., Pozzer, A., Nenes, A., and Lelieveld, J.: Global impact of mineral dust on cloud droplet number concentration, 17, 5601–5621, https://doi.org/10.5194/acp-17-5601-2017, 2017.
Koepke, P., Gasteiger, J., and Hess, M.: Technical Note: Optical properties of desert aerosol with non-spherical mineral particles: data incorporated to OPAC, Atmos. Chem. Phys., 15, 5947–5956, https://doi.org/10.5194/acp-15-5947-2015, 2015.
Kok, J. F., Ridley, D. A., Zhou, Q., Miller, R. L., Zhao, C., Heald, C. L., Ward, D. S., Albani, S., and Haustein, K.: Smaller desert dust cooling effect estimated from analysis of dust size and abundance, Nat. Geosci., 10, 274–278, https://doi.org/10.1038/ngeo2912, 2017.
Kok, J. F., Storelvmo, T., Karydis, V. A., Adebiyi, A. A., Mahowald, N. M., Evan, A. T., He, C., and Leung, D. M.: Mineral dust aerosol impacts on global climate and climate change, Nat. Rev. Earth Environ., 4, 71–86, https://doi.org/10.1038/s43017-022-00379-5, 2023.
Kurucz, R. L.: Synthetic Infrared Spectra, Symp. – Int. Astron. Union, 154, 523–531, https://doi.org/10.1017/S0074180900124805, 1994.
Li, L., Mahowald, N. M., Miller, R. L., Pérez García-Pando, C., Klose, M., Hamilton, D. S., Gonçalves Ageitos, M., Ginoux, P., Balkanski, Y., Green, R. O., Kalashnikova, O., Kok, J. F., Obiso, V., Paynter, D., and Thompson, D. R.: Quantifying the range of the dust direct radiative effect due to source mineralogy uncertainty, Atmos. Chem. Phys., 21, 3973–4005, https://doi.org/10.5194/acp-21-3973-2021, 2021.
Li, L., Mahowald, N. M., Kok, J. F., Liu, X., Wu, M., Leung, D. M., Hamilton, D. S., Emmons, L. K., Huang, Y., Sexton, N., Meng, J., and Wan, J.: Importance of different parameterization changes for the updated dust cycle modeling in the Community Atmosphere Model (version 6.1), Geosci. Model Dev., 15, 8181–8219, https://doi.org/10.5194/gmd-15-8181-2022, 2022.
Liao, H. and Seinfeld, J. H.: Radiative forcing by mineral dust aerosols: Sensitivity to key variables, J. Geophys. Res.-Atmos., 103, 31637–31645, https://doi.org/10.1029/1998JD200036, 1998.
Loveland, T. R. and Belward, A. S.: The IGBP-DIS global 1 km land cover data set, DISCover: First results, Int. J. Remote Sens., 18, 3289–3295, https://doi.org/10.1080/014311697217099, 1997.
Luo, J., Li, Z., Fan, C., Xu, H., Zhang, Y., Hou, W., Qie, L., Gu, H., Zhu, M., Li, Y., and Li, K.: The polarimetric characteristics of dust with irregular shapes: evaluation of the spheroid model for single particles, Atmos. Meas. Tech., 15, 2767–2789, https://doi.org/10.5194/amt-15-2767-2022, 2022.
Mahowald, N., Albani, S., Kok, J. F., Engelstaeder, S., Scanza, R., Ward, D. S., and Flanner, M. G.: The size distribution of desert dust aerosols and its impact on the Earth system, Aeolian Res., 15, 53–71, https://doi.org/10.1016/j.aeolia.2013.09.002, 2014.
Marinou, E., Amiridis, V., Binietoglou, I., Tsikerdekis, A., Solomos, S., Proestakis, E., Konsta, D., Papagiannopoulos, N., Tsekeri, A., Vlastou, G., Zanis, P., Balis, D., Wandinger, U., and Ansmann, A.: Three-dimensional evolution of Saharan dust transport towards Europe based on a 9-year EARLINET-optimized CALIPSO dataset, Atmos. Chem. Phys., 17, 5893–5919, https://doi.org/10.5194/acp-17-5893-2017, 2017.
Mayer, B.: Radiative transfer in the cloudy atmosphere, EPJ Web Conf., 1, 75–99, 2009.
Mayer, B. and Kylling, A.: Technical note: The libRadtran software package for radiative transfer calculations - description and examples of use, Atmos. Chem. Phys., 5, 1855–1877, https://doi.org/10.5194/acp-5-1855-2005, 2005
Meloni, D., di Sarra, A., Brogniez, G., Denjean, C., De Silvestri, L., Di Iorio, T., Formenti, P., Gómez-Amo, J. L., Gröbner, J., Kouremeti, N., Liuzzi, G., Mallet, M., Pace, G., and Sferlazzo, D. M.: Determining the infrared radiative effects of Saharan dust: a radiative transfer modelling study based on vertically resolved measurements at Lampedusa, Atmos. Chem. Phys., 18, 4377–4401, https://doi.org/10.5194/acp-18-4377-2018, 2018.
Mishchenko, M. I., Travis, L. D., and Mackowski, D. W.: T-matrix computations of light scattering by nonspherical particles: A review, J. Quant. Spectrosc. Ra., 55, 535–575, https://doi.org/10.1016/0022-4073(96)00002-7, 1996.
Mishchenko, M. I., Travis, L. D., and Lacis, A. A.: Scattering, absorption, and emission of light by small particles, Cambridge University Press, https://pubs.giss.nasa.gov/books/2002_Mishchenko_mi06300n/ (last access: 17 April 2024), 2002.
Nenes, A., Murray, B., and Bougiatioti, A.: Mineral Dust and its Microphysical Interactions with Clouds BT – Mineral Dust: A Key Player in the Earth System, edited by: Knippertz, P. and Stuut, J.-B. W., Springer Netherlands, Dordrecht, 287–325, https://doi.org/10.1007/978-94-017-8978-3_12, 2014.
Otto, S., de Reus, M., Trautmann, T., Thomas, A., Wendisch, M., and Borrmann, S.: Atmospheric radiative effects of an in situ measured Saharan dust plume and the role of large particles, Atmos. Chem. Phys., 7, 4887–4903, https://doi.org/10.5194/acp-7-4887-2007, 2007.
Otto, S., Bierwirth, E., Weinzierl, B., Kandler, K., Esselborn, M., Tesche, M., Schladitz, A., Wendisch, M., and Trautmann, T.: Solar radiative effects of a Saharan dust plume observed during SAMUM assuming spheroidal model particles, Tellus B, 61, 270–296, https://doi.org/10.1111/j.1600-0889.2008.00389.x, 2009.
Otto, S., Trautmann, T., and Wendisch, M.: On realistic size equivalence and shape of spheroidal Saharan mineral dust particles applied in solar and thermal radiative transfer calculations, Atmos. Chem. Phys., 11, 4469–4490, https://doi.org/10.5194/acp-11-4469-2011, 2011.
Papachristopoulou, K., Fountoulakis, I., Gkikas, A., Kosmopoulos, P. G., Nastos, P. T., Hatzaki, M., and Kazadzis, S.: 15-Year Analysis of Direct Effects of Total and Dust Aerosols in Solar Radiation/Energy over the Mediterranean Basin, Remote Sensing, 2022, 1535, https://doi.org/10.3390/rs14071535, 2022.
Parkin, D. W., Phillips, D. R., Sullivan, R. A. L., and Johnson, L. R.: Airborne dust collections down the Atlantic, Q. J. Roy. Meteorol. Soc., 98, 798–808, https://doi.org/10.1002/qj.49709841807, 1972.
Patterson, E. M., Filette, D. A., and Stockton, B. H.: Complex index of refraction between 300 and 700 nm for Saharan aerosols, J. Geophys. Res., 82, 3153–3160, https://doi.org/10.1029/JC082i021p03153, 1977.
Petters, M. D. and Kreidenweis, S. M.: A single parameter representation of hygroscopic growth and cloud condensation nucleus activity, Atmos. Chem. Phys., 7, 1961–1971, https://doi.org/10.5194/acp-7-1961-2007, 2007.
Proestakis, E., Amiridis, V., Marinou, E., Georgoulias, A. K., Solomos, S., Kazadzis, S., Chimot, J., Che, H., Alexandri, G., Binietoglou, I., Daskalopoulou, V., Kourtidis, K. A., de Leeuw, G., and van der A, R. J.: Nine-year spatial and temporal evolution of desert dust aerosols over South and East Asia as revealed by CALIOP, Atmos. Chem. Phys., 18, 1337–1362, https://doi.org/10.5194/acp-18-1337-2018, 2018.
Prospero, J. M., Landing, W. M., and Schulz, M.: African dust deposition to Florida: Temporal and spatial variability and comparisons to models, J. Geophys. Res.-Atmos., 115, D13304, https://doi.org/10.1029/2009JD012773, 2010.
Rocha-Lima, A., Martins, J. V., Remer, L. A., Todd, M., Marsham, J. H., Engelstaedter, S., Ryder, C. L., Cavazos-Guerra, C., Artaxo, P., Colarco, P., and Washington, R.: A detailed characterization of the Saharan dust collected during the Fennec campaign in 2011: in situ ground-based and laboratory measurements, Atmos. Chem. Phys., 18, 1023–1043, https://doi.org/10.5194/acp-18-1023-2018, 2018.
Ryder, C. L.: Radiative effects of increased water vapor in the upper Saharan Air Layer associated with enhanced dustiness, J. Geophys. Res.-Atmos., 126, e2021JD034696, https://doi.org/10.1029/2021JD034696, 2021.
Ryder, C. L., Highwood, E. J., Lai, T. M., Sodemann, H., and Marsham, J. H.: Impact of atmospheric transport on the evolution of microphysical and optical properties of Saharan dust, Geophys. Res. Lett., 40, 2433–2438, https://doi.org/10.1002/grl.50482, 2013a.
Ryder, C. L., Highwood, E. J., Rosenberg, P. D., Trembath, J., Brooke, J. K., Bart, M., Dean, A., Crosier, J., Dorsey, J., Brindley, H., Banks, J., Marsham, J. H., McQuaid, J. B., Sodemann, H., and Washington, R.: Optical properties of Saharan dust aerosol and contribution from the coarse mode as measured during the Fennec 2011 aircraft campaign, Atmos. Chem. Phys., 13, 303–325, https://doi.org/10.5194/acp-13-303-2013, 2013b.
Ryder, C. L., Highwood, E. J., Walser, A., Seibert, P., Philipp, A., and Weinzierl, B.: Coarse and giant particles are ubiquitous in Saharan dust export regions and are radiatively significant over the Sahara, Atmos. Chem. Phys., 19, 15353–15376, https://doi.org/10.5194/acp-19-15353-2019, 2019.
Saito, M. and Yang, P.: Advanced bulk optical models linking the backscattering and microphysical properties of mineral dust aerosol, Geophys. Res. Lett., 48, e2021GL095121, https://doi.org/10.1029/2021GL095121, 2021.
Shettle, P. E. and Fenn, R. W.: Models for the aerosols of the lower atmosphere and the effects of humidity variations on their optical properties, AFCRL Tech. Report, 79 0214, Research Papers No. 676, Air Force Cambridge Research Laboratory, Hanscom Airforce Base, MA, 100 pp., https://apps.dtic.mil/sti/citations/ADA085951 (last access: 17 April 2024), 1979.
Sicard, M., Bertolín, S., Mallet, M., Dubuisson, P., and Comerón, A.: Estimation of mineral dust long-wave radiative forcing: sensitivity study to particle properties and application to real cases in the region of Barcelona, Atmos. Chem. Phys., 14, 9213–9231, https://doi.org/10.5194/acp-14-9213-2014, 2014.
Sokolik, I. N., Andronova, A. V., and Jonhson, T. C.: Complex refractive index of atmospheric dust aerosols, Atmos. Environ., 16, 2495–2502, https://doi.org/10.1016/0960-1686(93)90021-P, 1993.
Song, Q., Zhang, Z., Yu, H., Kok, J. F., Di Biagio, C., Albani, S., Zheng, J., and Ding, J.: Size-resolved dust direct radiative effect efficiency derived from satellite observations, Atmos. Chem. Phys., 22, 13115–13135, https://doi.org/10.5194/acp-22-13115-2022, 2022.
Stamnes, K., Tsay, S.-C., Wiscombe, W., and Jayaweera, K.: Numerically stable algorithm for discrete-ordinate-method radiative transfer in multiple scattering and emitting layered media, Appl. Opt., 27, 2502–2509, https://doi.org/10.1364/AO.27.002502, 1988.
Sun, B., Yang, P., Kattawar, G. W., and Zhang, X.: Physical-geometric optics method for large size faceted particles, Opt. Express, 25, 24044–24060, https://doi.org/10.1364/OE.25.024044, 2017.
Ulanowski, Z., Bailey, J., Lucas, P. W., Hough, J. H., and Hirst, E.: Alignment of atmospheric mineral dust due to electric field, Atmos. Chem. Phys., 7, 6161–6173, https://doi.org/10.5194/acp-7-6161-2007, 2007.
van der Does, M., Knippertz, P., Zschenderlein, P., Giles Harrison, R., and Stuut, J.-B. W.: The mysterious long-range transport of giant mineral dust particles., Sci. Adv., 4, eaau2768, https://doi.org/10.1126/sciadv.aau2768, 2018.
Weinzierl, B., Petzold, A., Esselborn, M., Wirth, M., Rasp, K., Kandler, K., Schutz, L., Koepke, P., and Fiebig, M.: Airborne measurements of dust layer properties, particle size distribution and mixing state of Saharan dust during SAMUM 2006, Tellus B, 61, 96–117, https://doi.org/10.1111/j.1600-0889.2008.00392.x, 2009.
WMO: Report of the Experts Meeting on Aerosols and Their Climatic Effects, WCP-55, Geneva, Switzerland, https://library.wmo.int/records/item/36979-report-of-the-experts-meeting-on-aerosols-and-their-climatic-effects?offset=39 (last access: 17 April 2024), 1983.
Yang, P., Feng, Q., Hong, G., Kattawar, G. W., Wiscombe, W. J., Mishchenko, M. I., Dubovik, O., Laszlo, I., and Sokolik, I. N.: Modeling of the scattering and radiative properties of nonspherical dust-like aerosols, J. Aerosol Sci., 38, 995–1014, https://doi.org/10.1016/j.jaerosci.2007.07.001, 2007.
Yu, H., Kaufman, Y. J., Chin, M., Feingold, G., Remer, L. A., Anderson, T. L., Balkanski, Y., Bellouin, N., Boucher, O., Christopher, S., DeCola, P., Kahn, R., Koch, D., Loeb, N., Reddy, M. S., Schulz, M., Takemura, T., and Zhou, M.: A review of measurement-based assessments of the aerosol direct radiative effect and forcing, Atmos. Chem. Phys., 6, 613–666, https://doi.org/10.5194/acp-6-613-2006, 2006.
Yu, H., Chin, M., Yuan, T., Bian, H., Remer, L. A., Prospero, J. M., Omar, A., Winker, D., Yang, Y., Zhang, Y., Zhang, Z., and Zhao, C.: The fertilizing role of African dust in the Amazon rainforest: A first multiyear assessment based on data from Cloud-Aerosol Lidar and Infrared Pathfinder Satellite Observations, Geophys. Res. Lett., 42, 1984–1991, https://doi.org/10.1002/2015GL063040, 2015.
The RI provided for Colarco et al. (2014) is available up to 2.5 µm. Thus, we used the RI by Colarco et al. (2014) for the SW region and the RI by WMO (1983) for the LW region. For the convenience of the readers, we refer to this combination as Colarco et al. (2014).