the Creative Commons Attribution 4.0 License.
the Creative Commons Attribution 4.0 License.
 | 12 Jan 2024
CAMx–UNIPAR simulation of secondary organic aerosol mass formed from multiphase reactions of hydrocarbons under the Central Valley urban atmospheres of California
Yujin Jo
Sanghee Han
Azad Madhu
Bonyoung Koo
Yiqin Jia
Zechen Yu
Soontae Kim
Jinsoo Park
The UNIfied Partitioning-Aerosol phase Reaction (UNIPAR) model was integrated into the Comprehensive Air quality Model with extensions (CAMx) to process secondary organic aerosol (SOA) formation by capturing multiphase reactions of hydrocarbons (HCs) in regional scales. SOA growth was simulated using a wide range of anthropogenic HCs, including 10 aromatics and linear alkanes with different carbon lengths. The atmospheric processes of biogenic HCs (isoprene, terpenes, and sesquiterpene) were simulated for major oxidation paths (ozone, OH radicals, and nitrate radicals) to predict day and night SOA formation. The UNIPAR model streamlined the multiphase partitioning of the lumping species originating from semi-explicitly predicted gas products and their heterogeneous chemistry to form non-volatile oligomeric species in both organic aerosol and inorganic aqueous phase. The CAMx–UNIPAR model predicted SOA formation at four ground urban sites (San Jose, Sacramento, Fresno, and Bakersfield) in California, United States, during wintertime 2018. Overall, the simulated mass concentrations of the total organic matter, consisting of primary organic aerosol and SOA, showed a good agreement with the observations. The simulated SOA mass in the urban areas of California was predominated by alkane and terpene oxidation products. During the daytime, low-volatility products originating from the autoxidation of long-chain alkanes considerably contributed to the SOA mass. In contrast, a significant amount of nighttime SOA was produced by the reaction of terpene with ozone or nitrate radicals. The spatial distributions of anthropogenic SOA associated with aromatic and alkane HCs were noticeably affected by the southward wind direction, owing to the relatively long lifetime of their atmospheric oxidation, whereas those of biogenic SOA were nearly insensitive to wind direction. During wintertime 2018, the impact of inorganic aerosol hygroscopicity on the total SOA budget was not evident because of the small contribution of aromatic and isoprene products, which are hydrophilic and reactive in the inorganic aqueous phase. However, an increased isoprene SOA mass was predicted during the wet periods, although its contribution to the total SOA was little.
- Article
(6537 KB) - Full-text XML
-
Supplement
(10891 KB) - BibTeX
- EndNote


Secondary organic aerosol (SOA) contributes a significant portion of the particulate matter (PM) burden globally, with adverse impacts on health (Pye et al., 2021), visibility (Liu et al., 2022), and climate (Hallquist et al., 2009; Mahrt et al., 2022). SOA forms via gas–particle partitioning (Odum et al., 1996) of oxygenated products formed from the photooxidation of various hydrocarbons (HCs). Additionally, heterogeneous chemistry of oxidized carbons in the aerosol phase significantly contributes to SOA growth by forming non-volatile oligomeric mass (Hallquist et al., 2009; Kalberer et al., 2004; Tolocka et al., 2004). In particular, the contribution of heterogeneous chemistry to SOA mass increases with the aerosol water content associated with the hygroscopicity of electrolytic inorganic aerosol (Volkamer et al., 2009) and aerosol acidity (Jang et al., 2002).
SOA models have been used at regional and global scales to predict the contribution of SOA mass to the total atmospheric organic aerosol (Zhang et al., 2021; Hodzic et al., 2015). The prediction of SOA formation has been approached by a conventional gas–particle partitioning of surrogate products (Odum et al., 1996) or the volatility basis set (VBS) approach (Donahue et al., 2006). However, these partitioning-based models poorly integrate the heterogeneous reactions of multifunctional organic products. SOA models include isoprene but have no features for aqueous reactions of products originating from various HCs (Vasilakos et al., 2021; Yu et al., 2022). Evidently, the limitation in the heterogeneous chemistry of various products can lead to deviations in the predicted SOA mass concentration from observations (Baker et al., 2015; Hayes et al., 2013; Carlton and Baker, 2011). For example, SOA formation has been underestimated in highly humid regions, such as the southeastern United States (USA) in summer, when the hygroscopic inorganic aerosol is wet and aqueous reactions of reactive organic species are increased (Zhang et al., 2018). To improve the prediction of SOA, SOA models have employed large partitioning-based parameters, gas mechanisms to form low-volatile products via autoxidation (Mayorga et al., 2022; Jokinen et al., 2015; Pye et al., 2019), or nighttime oxidations of biogenic HCs with nitrate radical and ozone (Zaveri et al., 2020; Gao et al., 2019). These model parameters and reactions can improve SOA predictions, but they can lead to overprediction of SOA under certain situations. For example, Liu et al. (2021) reported in their regional simulation using the Community Earth System Model (CESM2.1) that the model parameters in the VBS model were too high for terpenes and led to overprediction of SOA mass with biased parameters that can overpredict organic matter (OM) mass.
The UNIfied Partitioning-Aerosol phase Reaction (UNIPAR) model predicts SOA mass by employing the multiphase partitioning of organic species between gas, organic, and inorganic phases with improved prediction of thermodynamic parameters (i.e., activity coefficients of organic species in the salted inorganic phase under various humidity conditions) and in-particle chemistry (Beardsley and Jang, 2016; Im et al., 2014; Yu et al., 2021c; Zhou et al., 2019). Chemical species originating from explicit gas mechanisms are lumped based on volatility and reactivity in the aerosol phase. The physicochemical parameters of lumping species allow the UNIPAR model to process multiphase partitioning and in-particle reactions (i.e., oligomerization and acid catalyzed reactions). The model parameters and equations in UNIPAR have been demonstrated for various SOA originating from a wide range of HCs such as isoprene, terpenes, aromatics, and gasoline and demonstrated through chamber data under different levels of NOx and different types of inorganic aerosols associated with aerosol's acidity, hygroscopicity, and phase states (i.e., dry and wet) (Im et al., 2014; Beardsley and Jang, 2016; Cao and Jang, 2010; Zhou et al., 2019; Yu et al., 2021c; Han and Jang, 2022).
In a recent study by Yu et al. (2022), the UNIPAR model was integrated with the Comprehensive Air Quality Model with extensions (CAMx) (Environ, 2020) and demonstrated its ability to predict SOA mass for South Korea during the Korea–United States Air Quality (2016 KORUS-AQ) campaign. The CAMx–UNIPAR model well predicted SOA formation through the processing of aqueous phase reactions of organics and their gas–aqueous partitioning during wet periods during the KORUS-AQ campaign. Although the OM mass predicted with CAMx–UNIPAR was noticeably better than that of the CAMx model with the conventional partitioning-based two-product model, the OM mass was somewhat underestimated compared with the observations. The underestimated OM was possibly due to missing precursors and missing chemistry in both the gas and aerosol phases.
In this study, the CAMx–UNIPAR model has been updated to include the SOA formation from long-chain alkanes and nighttime chemistry of biogenic HCs. Long-chain alkanes are regarded as essential precursors for SOA formation (Aumont et al., 2012; Madhu et al., 2022). Madhu et al. (2022) have recently added an autoxidation mechanism into alkane semi-explicit oxidation mechanisms, improving the predictability of alkane SOA using the UNIPAR model against their chamber study. The resulting alkane model parameters have been newly implemented into CAMx–UNIPAR. In addition, the UNIPAR model of this study has been expanded to simulate biogenic SOA based on three major oxidation paths (i.e., OH radicals, ozone and nitrate radicals) being capable of nighttime SOA formation that is dominated by oxidation with ozone and nitrate radicals (Han and Jang, 2023). The performance of the extended CAMx–UNIPAR model has been demonstrated to predict the SOA budget under urban environments in the Central Valley, California (CA), USA, during the winter (January–February) in 2018. The impacts of aerosol hygroscopicity on SOA formation under varied humidity conditions, spatial distributions of each SOA species, and diurnal patterns of SOA formation associated with nighttime oxidation of biogenic HCs were characterized using the CAMx–UNIPAR simulation in California's urban environments.
Table 1List of SOA precursors and SOA species in the UNIPAR model.
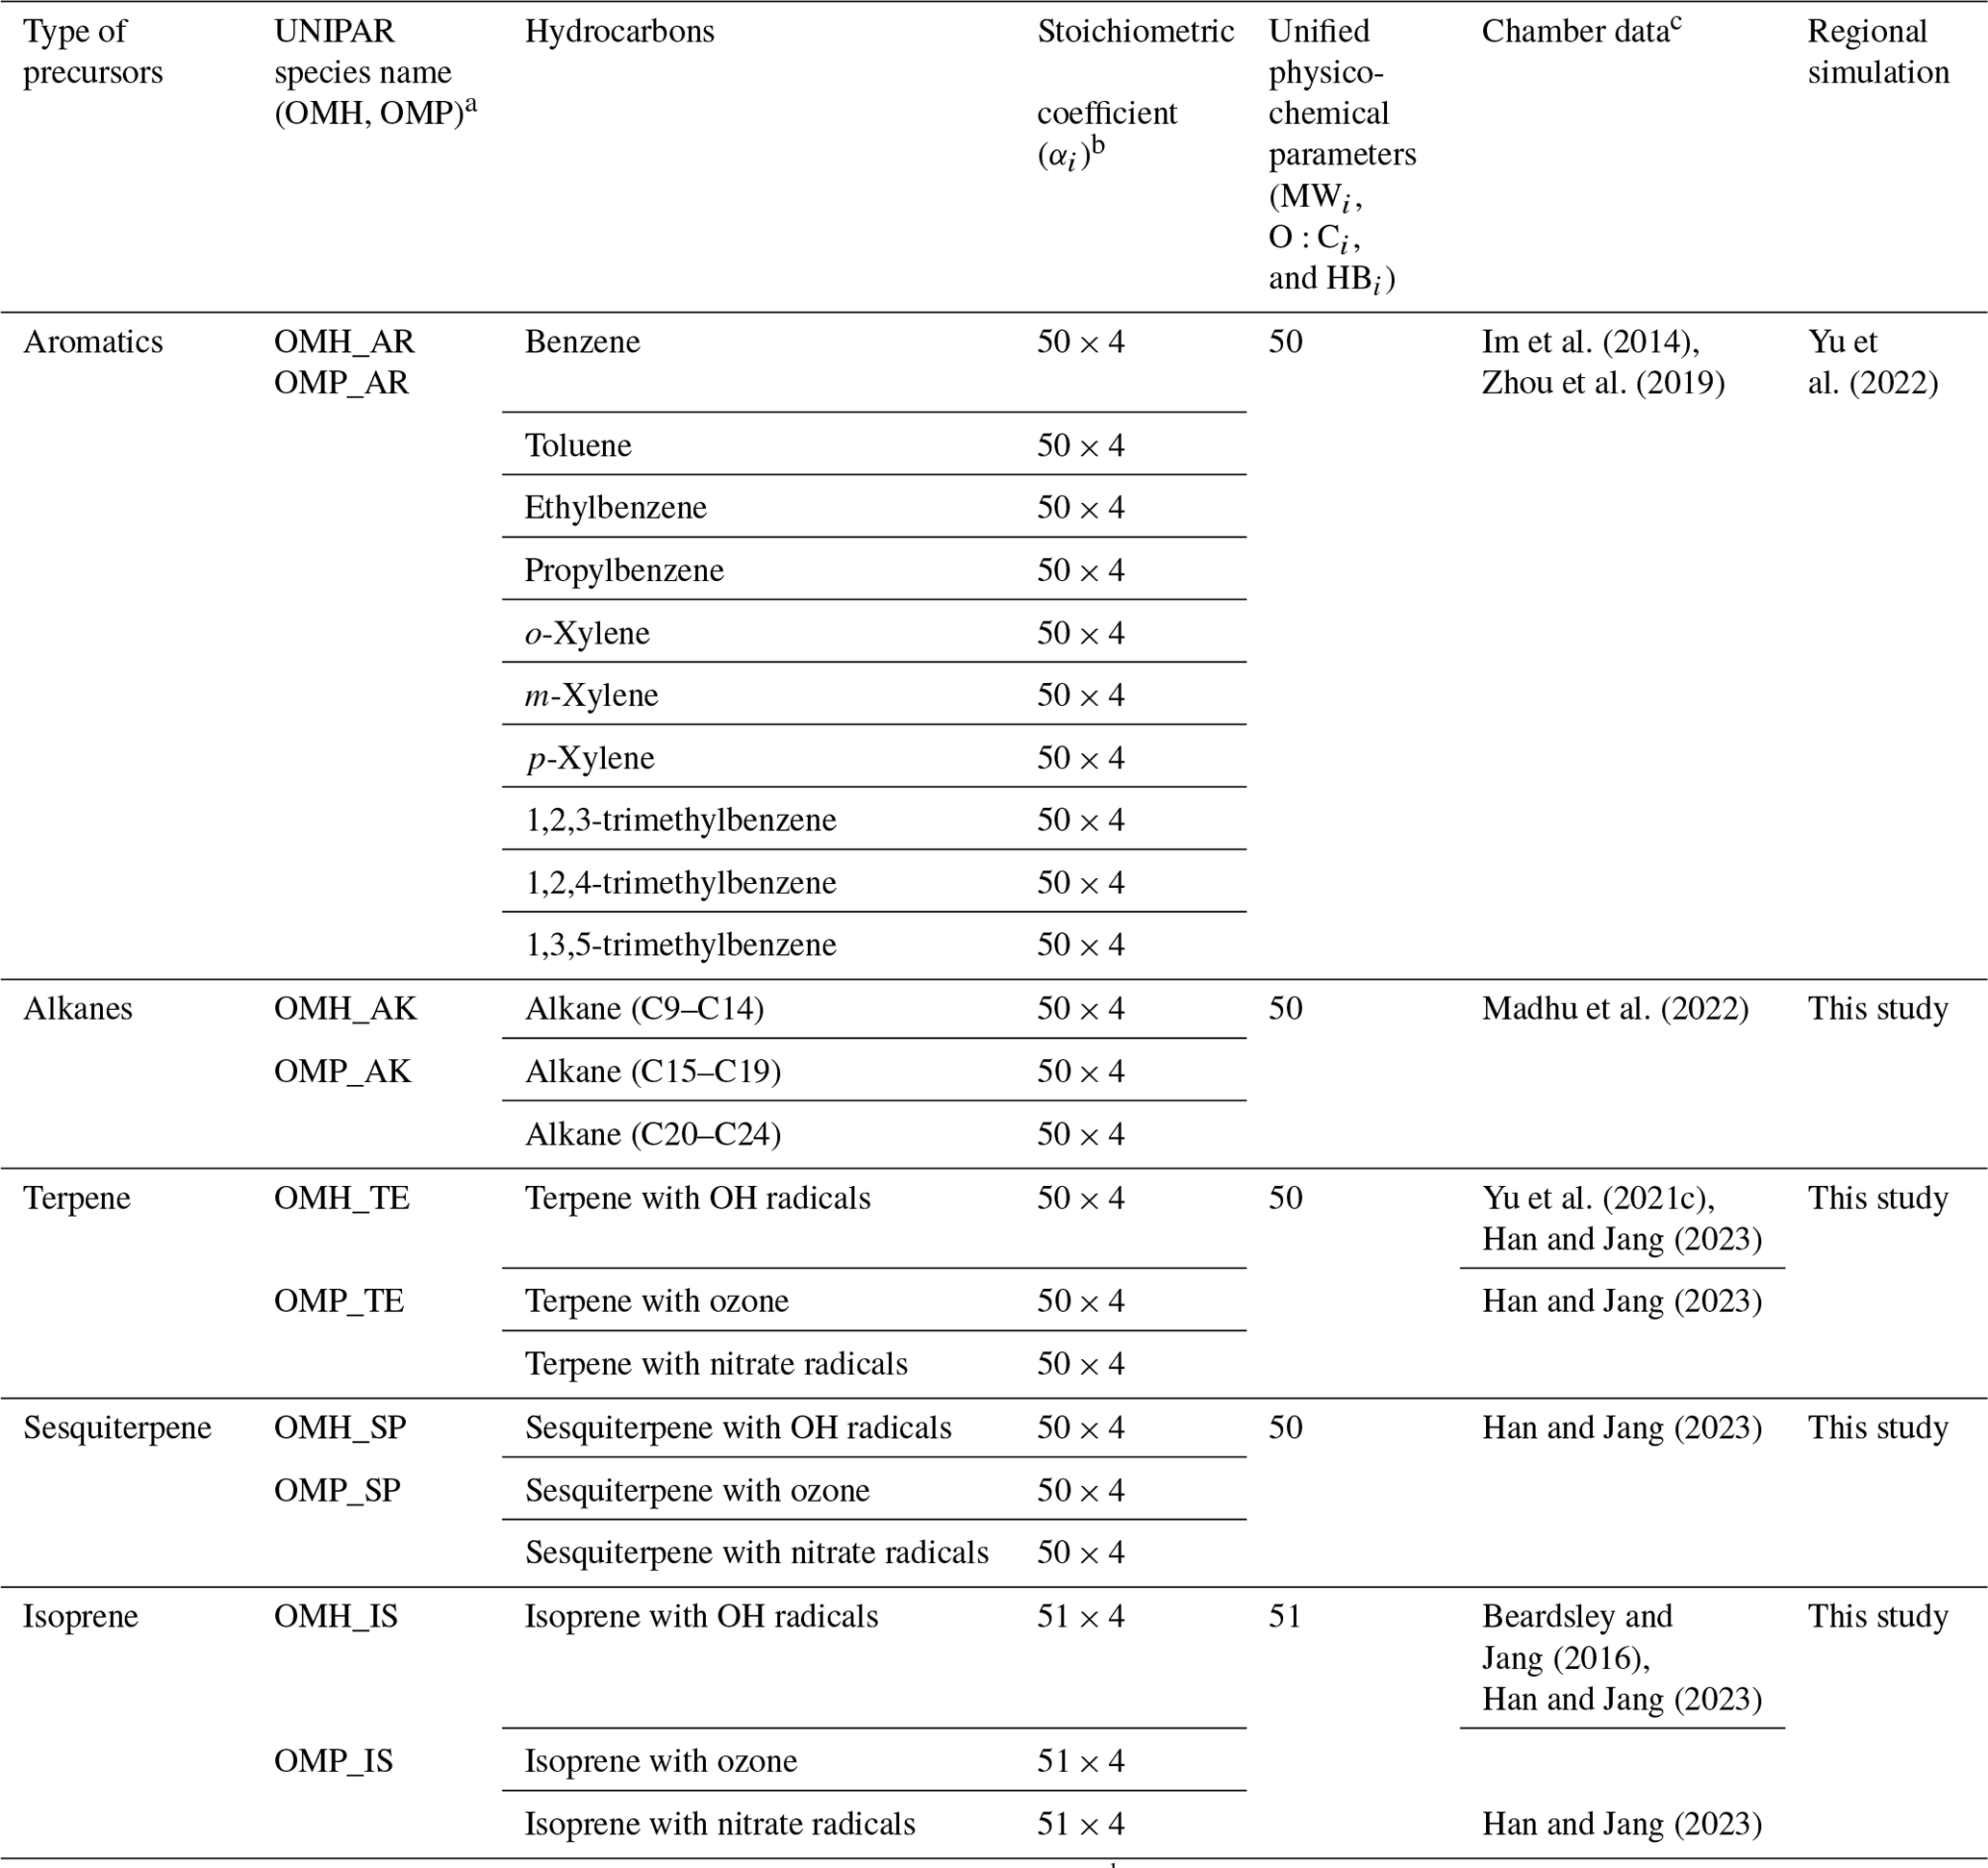
a OMH is the SOA mass heterogeneously formed and OMP is that produced via multiphase partitioning. b Four different mathematical equation sets for αi. For aromatics and alkanes, the mathematical equation sets for αi include “Low NOx-Fresh”, “Low NOx-Aged”, “High NOx-Fresh”, and “High NOx-Aged”. For terpene, sesquiterpene, and isoprene, the mathematical equation sets for αi include “Low NOx-Daytime”, “Low NOx-Nighttime”, “High NOx-Daytime”, and “High NOx-Nighttime”. c Demonstration of SOA model parameters by using data from UF-APHOR chamber studies.
2.1 The UNIPAR SOA model
The structure of the UNIPAR SOA model has been described previously (Cao and Jang, 2010; Im et al., 2014; Beardsley and Jang, 2016; Zhou et al., 2019; Yu et al., 2021c, 2022; Choi and Jang, 2022; Madhu et al., 2022; Han and Jang, 2023). The CAMx–UNIPAR of this study simulates SOA formation via multiphase reactions of 10 aromatics, 3 biogenics (isoprene, terpene, and sesquiterpene), and 3 alkane groups as summarized in Table 1. The lumping species, which are generated by using semi-explicitly predicted products of the oxidation of HCs, are involved in multiphase partitioning and aerosol-phase reactions to form SOA mass.
The prediction of stoichiometric coefficients associated with the lumping species from the oxidation of 10 aromatics (MCM v3.3.1; Jenkin, 2004) potentially increases the accuracy of the prediction of aromatic SOA formation under varying emissions. For biogenic HCs, recently identified biogenic oxidation mechanisms that yielded low-volatility products have been applied to the prediction of lumping species. For example, the peroxy radical autoxidation mechanism (Roldin et al., 2019) is known to form highly oxygenated organic molecules (HOMs) (Molteni et al., 2019). Additionally, HOMs form via the accretion reaction to form ROOR from RO2 species (Bates et al., 2022; Zhao et al., 2021). These HOMs are included in biogenic lumping species in the current CAMx–UNIPAR. In order to represent day and night chemistry, CAMx–UNIPAR is equipped with the oxidation-path-dependent stoichiometric coefficients from individually processed reactions of biogenic HCs with three major oxidants (OH radicals, ozone, and nitrate radicals) (Han and Jang, 2023). Thus, nighttime SOA formation, which is dominated by oxidation via ozone and nitrate radicals, can be simulated in CAMx–UNIPAR. By using the recent chamber study by Madhu et al. (2022), the lumping species generated from the oxidation of long-chain alkanes ranging from C9 to C24 have been newly integrated with CAMx–UNIPAR, which increases the predictability of SOA formation from intermediate volatility organic compounds (IVOCs). Alkane gas mechanisms include autoxidation of alkoxy radicals to form HOMs (Madhu et al., 2022; Crounse et al., 2013; Bianchi et al., 2019; Roldin et al., 2019). Importantly, the estimation of activity coefficients of lumping species in both the organic phase and the inorganic aqueous-phase enables the simulation of multiphase partitioning of lumping species and their aerosol phase reactions. Aqueous reactions in CAMx–UNIPAR facilitate the evaluation of the impact of humidity, aerosol acidity, and aerosol-phase state on SOA formation in regional scales. Briefly, the key components of the UNIPAR model are described as follows:
-
The SOA mass forms via multiphase partitioning, organic-phase oligomerization, and aqueous reactions in a wet inorganic salted solution. For the multiphase SOA formation, a fundamental assumption is that organic constituents are internally mixed with inorganic constituents under the liquid–liquid phase separation between organic phase and salted aqueous phase.
-
As shown in Table 1, the 251 lumping groups in the current UNIPAR cover oxygenated products predicted from explicit gas mechanisms (MCM v3.3.1 (Jenkin, 2004)) of 16 precursors (10 aromatics, 3 alkane groups in different carbon lengths, isoprene, terpene, and sesquiterpene) with 3 major oxidation paths (OH radicals, ozone, and nitrate radicals) to represent HC oxidation in both day and night. Pre-determined mathematical equations dynamically build the stoichiometric coefficient arrays, which are connected to volatility-reactivity based 251 lumping species and applied to gas–particle partitioning and heterogeneous reactions to from SOA. The stoichiometric coefficient array reflects the influence of NOx levels and gas aging on gas–product distributions. The impact of NOx is linked to RO2 paths between RO2+NO and RO2 + HO2 reactions under varying NOx conditions. For aging, the stoichiometric coefficient array is a function of the aging scale, which is connected to the concentration ratio of peroxide radicals (HO2 + RO2) to HCs.
-
Lumping species' physicochemical parameters, such as molecular weight (MWi), oxygen-to-carbon ratio (O : Ci), and hydrogen bonding (HBi), are used to determine their multiphase partitioning. Each precursor group uses a single set of physicochemical parameter arrays associated with lumping species: for example, 50 arrays for aromatics, 50 arrays for alkanes, 50 arrays for terpene, 50 arrays for sesquiterpene, and 51 arrays for isoprene as shown in Table 1. The physicochemical parameters of lumping species for MWi, HBi, and the O : Ci ratios are reported in Tables S1–S3, respectively.
-
The concentration of lumping species is distributed into gas (Cg), organic (Cor), and inorganic phases (Cin) using partitioning coefficients estimated based on Pankow's absorptive partitioning model (Pankow, 1994) with vapor pressure, the estimated activity coefficients of lumping species in both the organic and inorganic phases (Zhou et al., 2019; Yu et al., 2021c; Madhu et al., 2022; Han and Jang, 2022; Han and Jang, 2023), and aerosol's average molecular weight in each phase.
-
Aerosol phase reaction rate constants of lumping species in the organic phase and inorganic phase are calculated with kinetic parameters, such as lumping species' reactivity scales (Table S4) and their basicity constants (Table S5). The kinetic parameters used in CAMx–UNIPAR are updated by removing the artifact from gas–wall partitioning (Han and Jang, 2020, 2022).
-
Heterogeneously formed OM (OMH), which is produced via oligomerization in the organic phase and the inorganic phase, is treated as non-volatile OM. The impact of viscosity on aerosol growth is also considered by including the equation term into aerosol-phase rate constants as a function of the average molecular weight of OM and the O:C ratio (Han and Jang, 2022). Aqueous reactions in the presence of wet inorganic aerosol are linked to acid-catalyzed reactions, which are processed under broad ranges of aerosol acidity ([H+]) and relative humidity (RH) levels to form both dry and wet inorganic aerosols. The species in the lowest volatility group, which are multifunctional and dominantly present in aerosol phase, can easily react in aerosol phase via various unidentified reactions (esterification and oxidations) and form non-volatile species. Thus, the lumping species in the lowest volatility group are involved in oligomerization with a high reaction rate constant used for glyoxal, regardless of lumping groups' reactivity scale.
-
The SOA mass in UNIPAR is estimated by gas–particle partitioning (OMP) and heterogeneous reactions (OMH) in both organic and inorganic phase. The SOA mass formed from partitioning (OMP) is estimated using the Newtonian method (Schell et al., 2001) based on a mass balance of organic compounds between the gas and particle phases governed by Raoult's law. OMH is considered as a pre-existing absorbing organic material for gas–particle partitioning (Cao and Jang, 2010; Im et al., 2014). The resulting OMP is updated by the addition of Cin.
-
To treat SOA formation in the inorganic aqueous phase, inorganic composition and aerosol acidity are predicted using an inorganic thermodynamic model, ISORROPIA (Fountoukis and Nenes, 2007), and then incorporated into the UNIPAR model. Mutual deliquescence relative humidity (MDRH) is predicted from the ISORROPIA model. The efflorescence relative humidity (ERH) is predicted using a pre-trained neural network model based on the inorganic composition (Yu et al., 2021b). The aerosol state is determined to be wet (organic phase + inorganic aqueous phase) or dry (organic phase + solid-dry inorganic phase) with MDRH and ERH.
-
The formation of organosulfate in the form of dialkylsulfate, a non-electrolytic and neutral ester of sulfuric acid with organic species, is reported in numerous laboratory studies (Liggio et al., 2005; Surratt et al., 2007; Li et al., 2015). In the model, the formation of dialkylsulfate is simulated by using the Hinshelwood-type reaction (Im et al., 2014). The decreased acidic sulfate due to the dialkylsulfate formation is applied to inorganic thermodynamic model (ISORROPIA) to calculate aerosol acidity and aerosol water content for the next step.
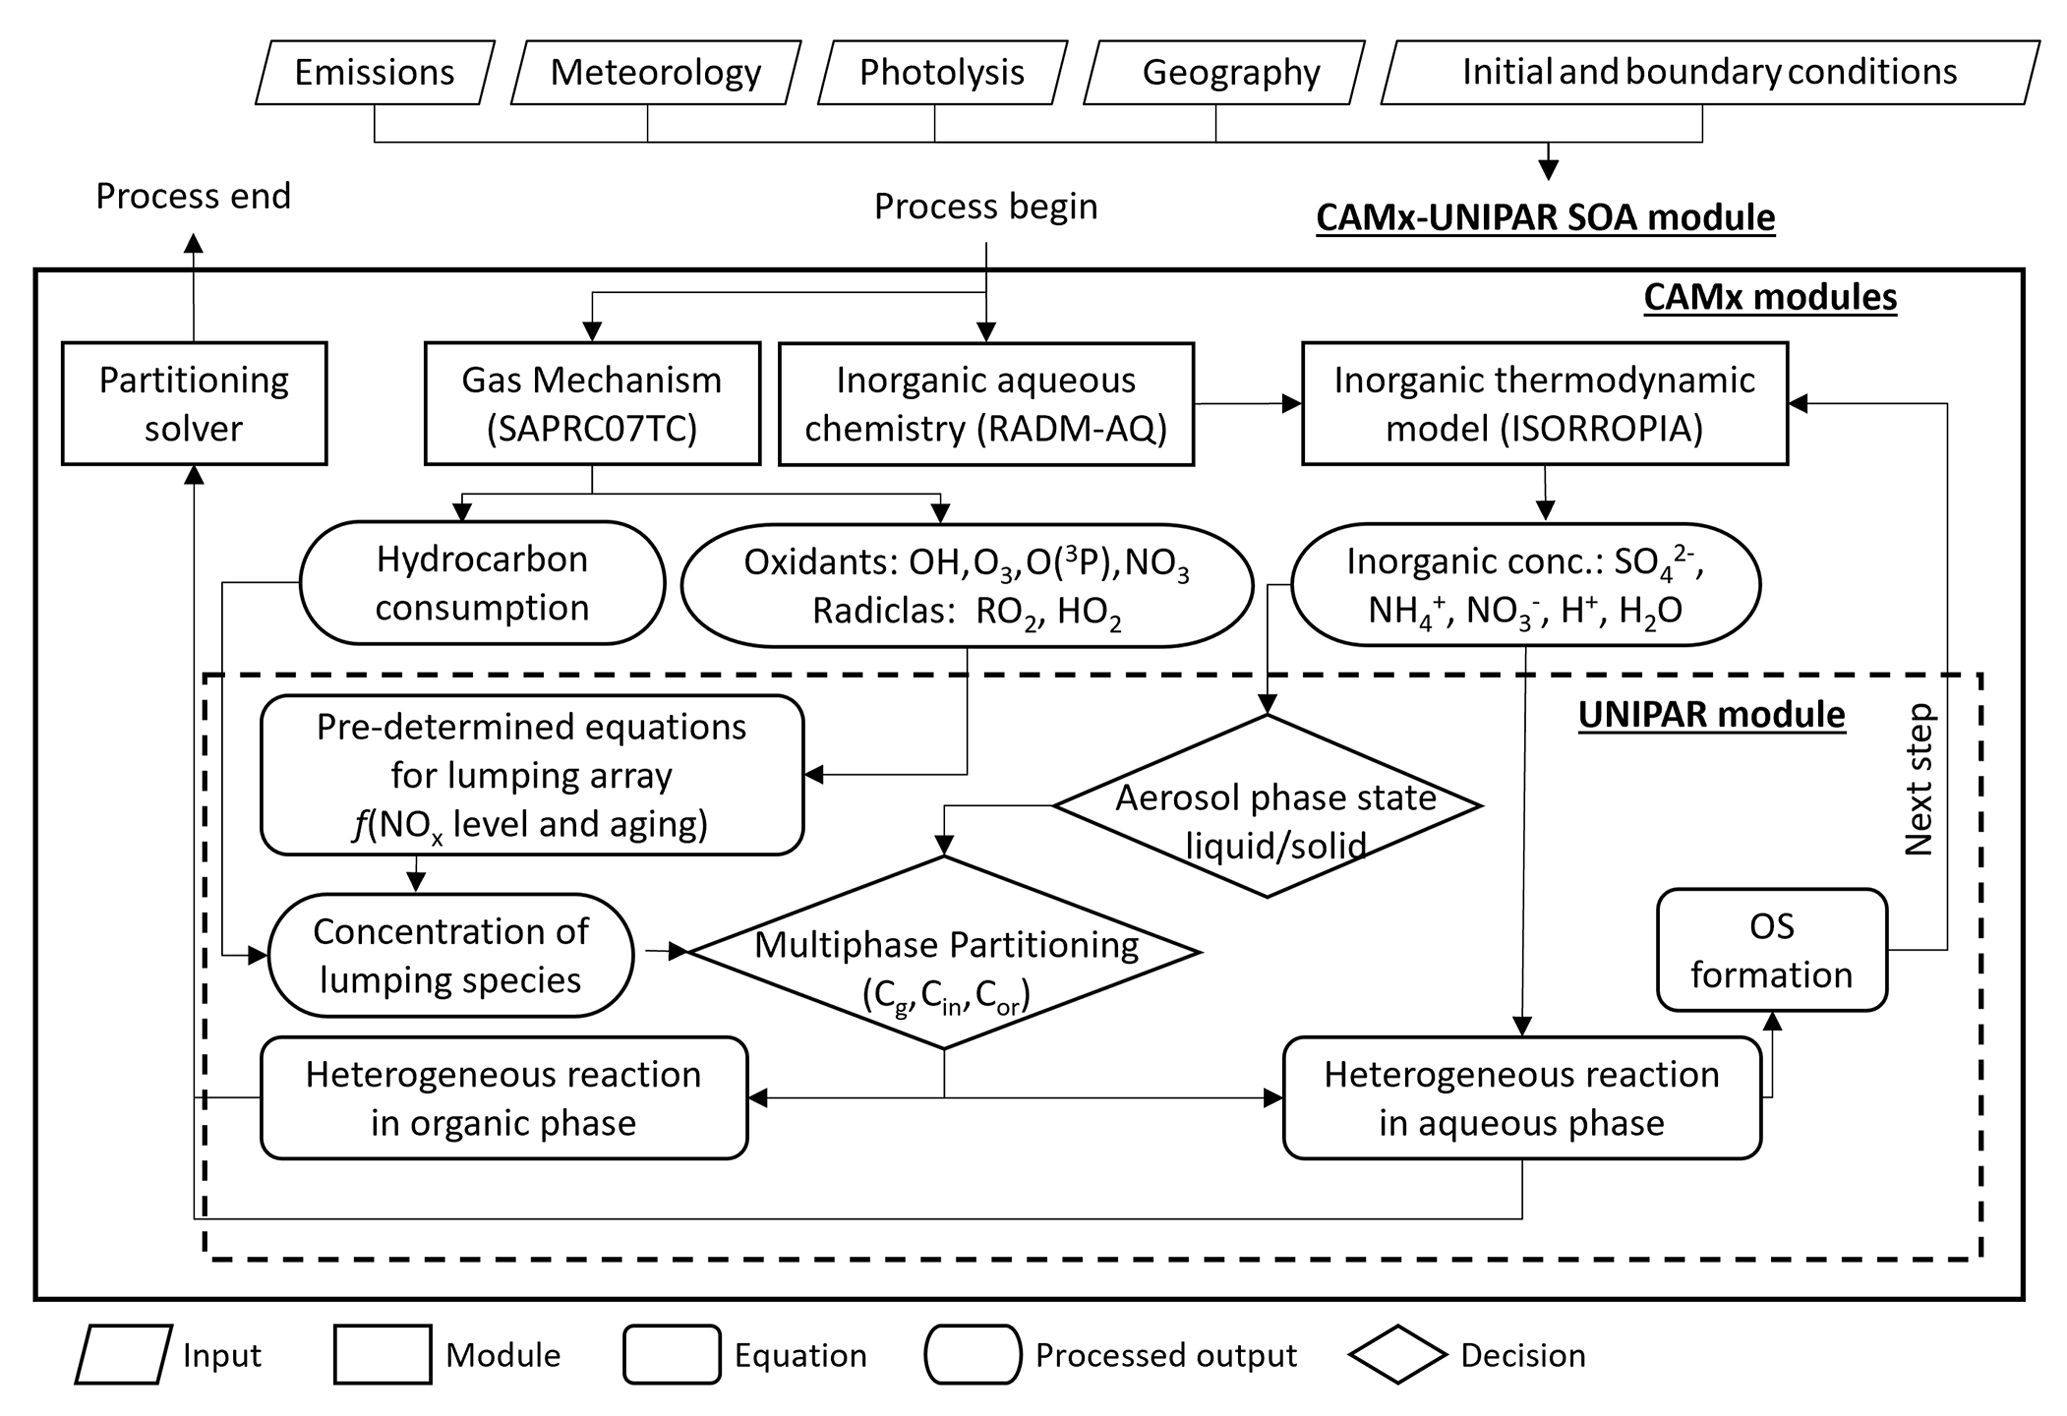
Figure 1The structure of the CAMx model integrated with UNIPAR to form SOA via multiphase reactions of hydrocarbons.
2.2 The CAMx–UNIPAR integration
Figure 1 shows the overall structure of the CAMx–UNIPAR model. The Weather Research and Forecast model (WRF v4.1) generated meteorological input data to drive the CAMx v7.1 using the North American Mesoscale (NAM) data of the National Centers for Environmental Prediction (NCEP). The WRF modeling domains comprised three nested grids with horizontal resolutions of 36, 12, and 4 km. The outer domain, with a 36 km horizontal resolution, covered the entire western USA. The second domain, with a 12 km horizontal resolution, covered California and portions of Nevada. The third domain, with a 4 km horizontal resolution, covered central California. The air quality simulation for gas and particle pollutants in central California was performed for the third domain (Fig. 2a) with 185×185 grids and 22 vertical layers. The detailed configurations of the WRF and CAMx modeling system are described in Table S6. Emission inputs are based on California Air Resources Board regional inventories and provided by the Bay Area Air Quality Management District (BAAQMD, 2023).
The UNIPAR SOA model was incorporated with the CAMx model as a sub-model to predict SOA formation in California. Precursor HC consumption and other gas species were estimated using the SAPRC07TC gas mechanism (Hutzell et al., 2012) in the CAMx model. The inorganic thermodynamic model (ISORROPIA) provides the inorganic aerosol composition at equilibrium for inorganic aerosol species. The current CAMx–UNIPAR model includes 251 lumping species, of which 50 originate from 10 aromatics; 50 originate from three alkane groups; 50 originate from terpene; 50 originate from sesquiterpene; and 51 originate from isoprene (Table 1).
The emissions of 10 aromatic HCs were sourced from benzene, toluene, three xylenes, and 1,2,4-trimethylbenzene. Toluene was used to estimate the emissions of ethylbenzene and propylbenzene using factor of 0.082, and 1,2,4-trimethylbenzene was used to estimate the emissions of 1,2,3-trimethylbenzene and 1,3,5-trimethylbenzene using a factor of 0.3. Long-chain alkanes are important IVOCs, which are emitted from automobile exhaust (Pye and Pouliot, 2012; Ensberg et al., 2014) and plants (Simoneit, 2002; Yao et al., 2009; Li et al., 2022). Laboratory studies showed that SOA yields from alkanes changed with carbon length (Lim and Ziemann, 2009; Tkacik et al., 2012; Presto et al., 2010; Srivastava et al., 2022). In the model, alkanes in different carbon-chain lengths are split into three groups due to their different SOA formation potential: C9–C14, C15–C19, and C20–C24 (Table 1). Speciation factor of 0.52 was used to estimate the emission of alkanes from SAPRC07 ALK5 species, which contains other non-aromatic compounds (i.e., alcohols, ethers, esters, and carboxylic acids) in addition to alkanes (Carter, 2015). The emission factor of alkanes that were not fully covered by ALK5 (i.e., alkanes longer than C19; Carter, 2015) was estimated using the HC emission recently reported by the US Environmental Protection Agency (US EPA) (Pye et al., 2023) and the study by Mcdonald et al. (2018). In this study, all types of alkanes including linear, branched, and cyclic alkanes were surrogated with linear alkanes based on a carbon number.
The SOA mass in the CAMx–UNIPAR model is attributed to the OMH and OMP for each precursor (Table 1). The total SOA is the sum of OMH_AR, OMH_AK, OMH_TE, OMH_SP, OMH_IS, OMP_AR, OMP_AK, OMP_TE, OMP_SP, and OMP_IS. Total OM is the sum of total SOA and single primary organic aerosol (POA) species. POA is a single non-volatile species that does not chemically evolve (Environ, 2020). The simulation period was the winter (January–February) in 2018, excluding the wildfire season in California. Here, we focused on the simulation results that showed considerable OM levels between 23 January and 24 February 2018.
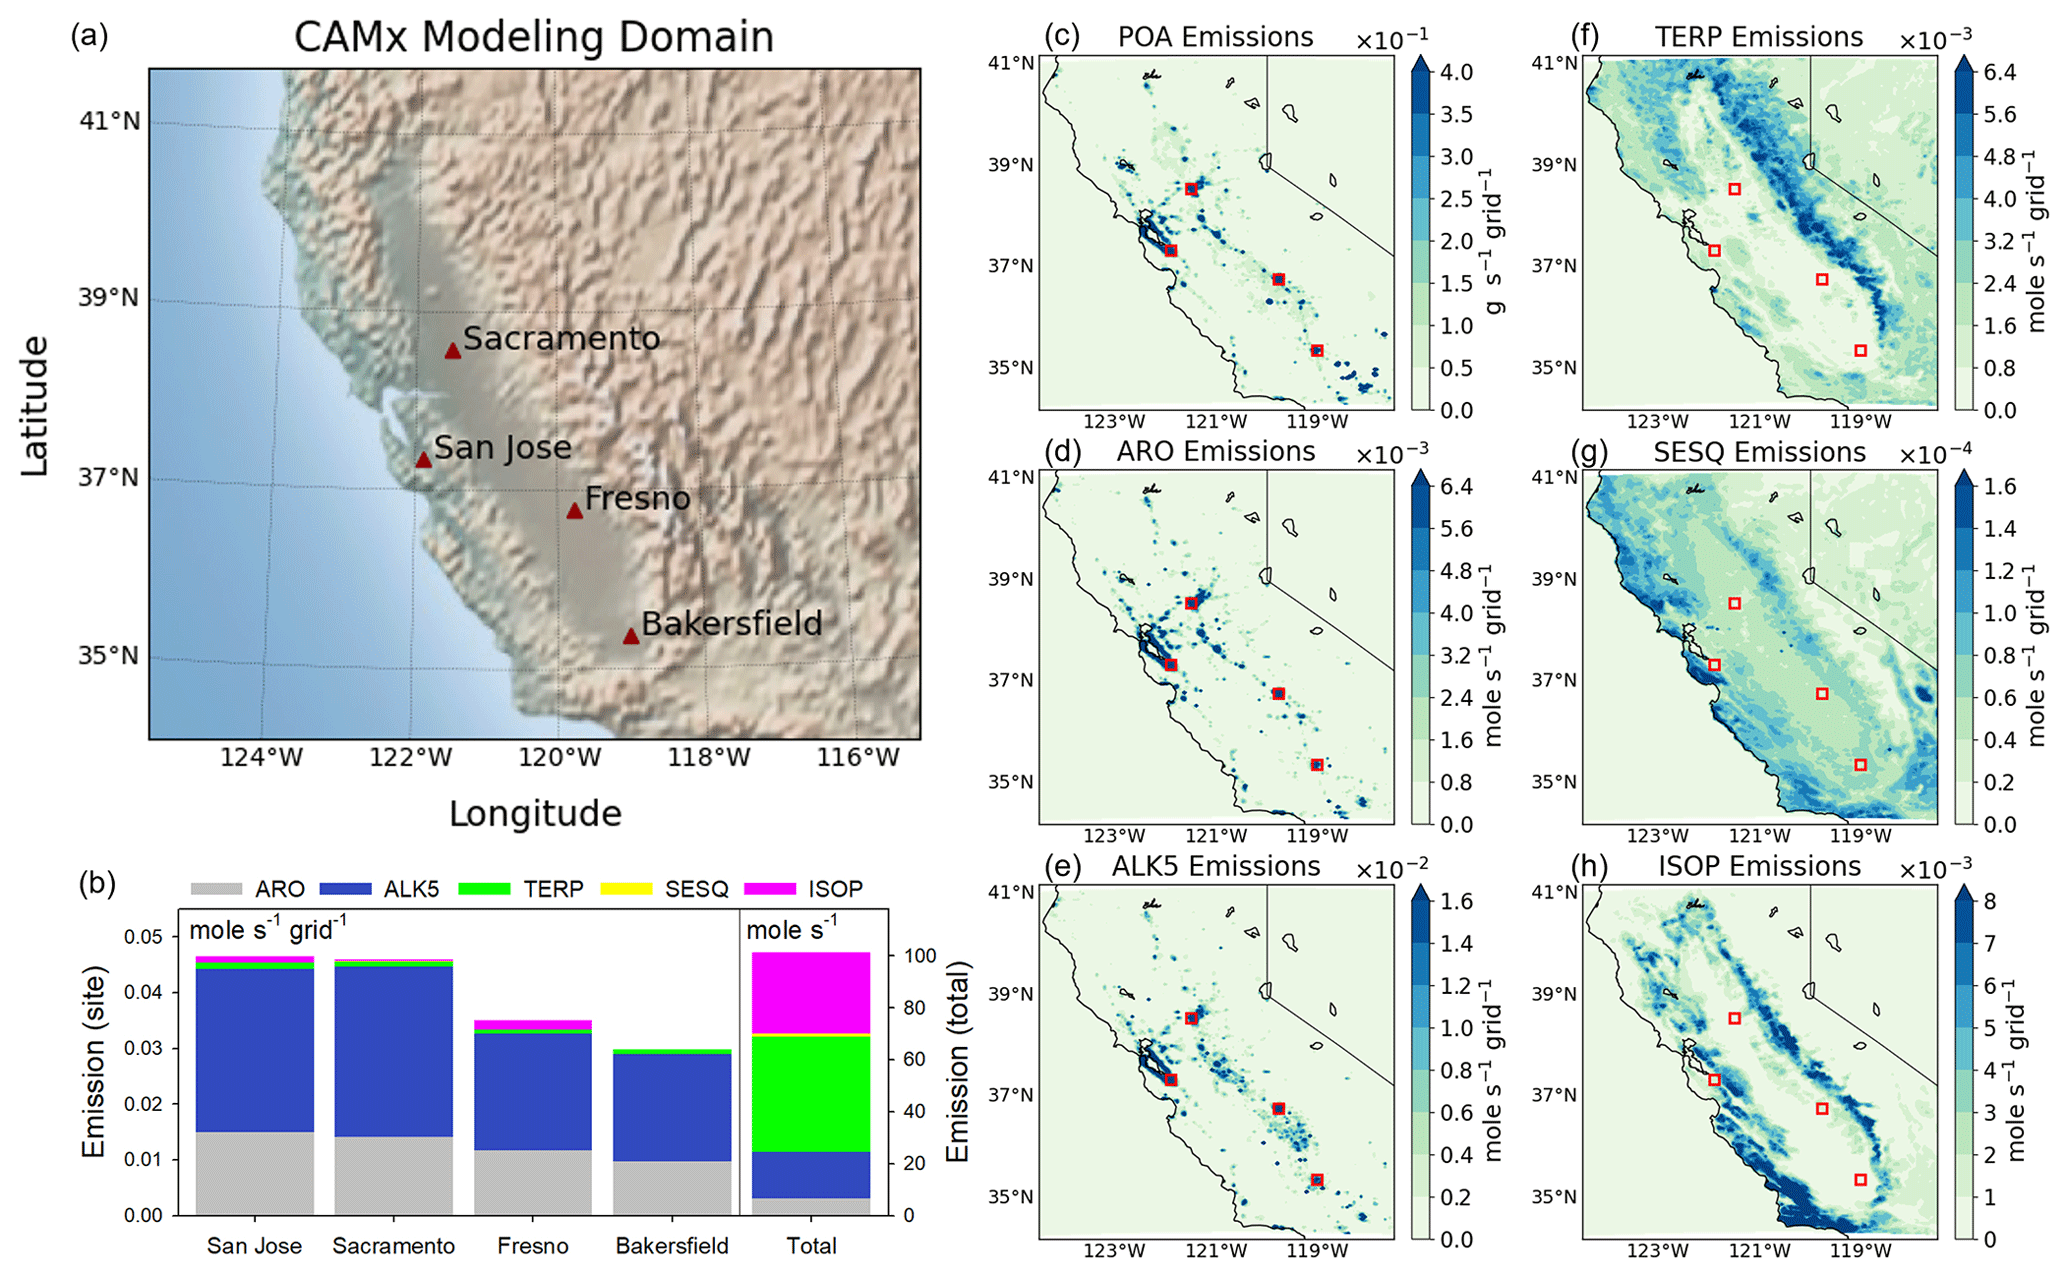
Figure 2(a) The CAMx modeling domain and selected observation sites in this study. (b) The amount of major SOA precursor emission for each site and the total of the domain. (c–h) Spatial distributions of POA and major SOA precursor emission. The emission data are SAPRC07-based and averaged from January to February 2018. ARO is the sum of benzene, toluene, o-xylene, p-xylene, m-xylene, and 1,2,4-trimethylbenzene.
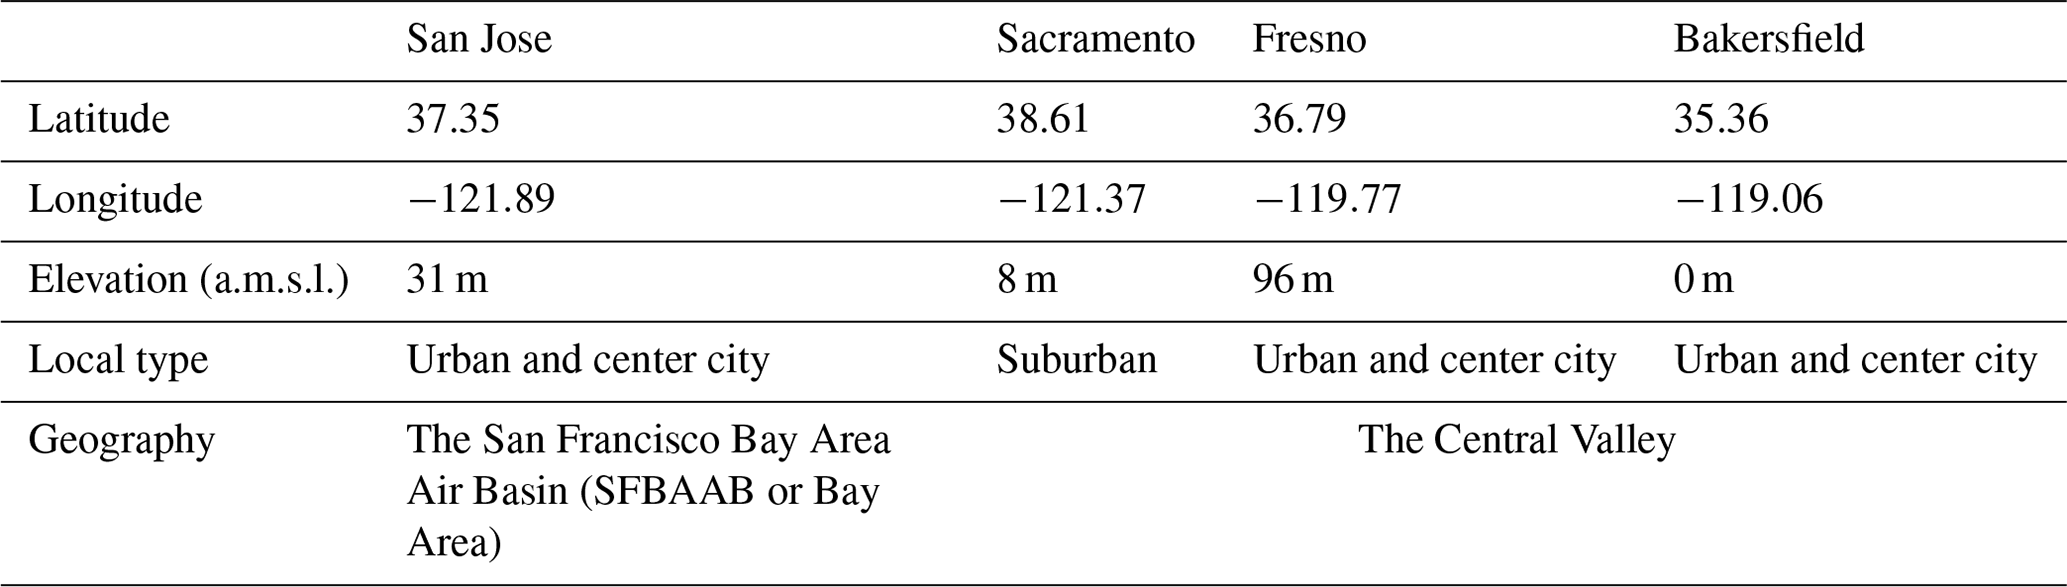
2.3 Observation sites in California
The US EPA has operated the national Chemical Speciation Monitoring Network (CSN) since 2000 to obtain information on the spatial and temporal chemical composition of ambient fine particles (Solomon et al., 2014). CSN measures the major components of fine particles that are 2.5 µm or less in diameter (PM2.5) including sulfate, nitrate, ammonium, organic carbon (OC), and elemental carbon (EC) and operates on a 1-in-3-day sample collection schedule. Figure 2a shows four CSN sites in California – San Jose, Sacramento, Fresno, and Bakersfield selected in this study. Table 2 summarizes information on the observation sites. The San Jose site is within the boundaries of the San Francisco Bay Area Air Basin (SFBAAB or Bay Area). The Sacramento, Fresno, and Bakersfield sites are located on flat land in the Central Valley. The Central Valley is bounded by mountain ranges and coastal areas. This bowl-shaped geography of the Central Valley creates conditions conducive to holding pollutants in place and the accumulation of secondary photochemical compounds.
The Great Basin High occurs in California during the cold season (Herner et al., 2005). When the Great Basin High develops, the pressure gradients between the coast and the Central Valley decline, and the planetary boundary layer (PBL) height becomes low. This condition holds pollutants close to the ground, allowing them to accumulate over several days, as fine particles and their precursors continue to be emitted. Due to a combination of unfavorable geographical and meteorological factors for ventilation, many cities in the bowl-shaped region, including San Jose, Sacramento, Fresno, and Bakersfield, undergo persistent air quality issues (Lurmann et al., 2006; Young et al., 2016; Prabhakar et al., 2017; Chen et al., 2020; Sun et al., 2022).
2.4 Organic carbon and elemental carbon data
The measured mass concentrations of EC at the San Jose, Sacramento, Fresno, and Bakersfield sites during the simulation period were used to separate the concentration of the measured total OC (OCtot) into primary OC (POC) and secondary OC (SOC) (Turpin and Huntzicker, 1995). Because EC and POC often have the same sources, there is a representative ratio of for a given area (Strader et al., 1999). The POC is calculated based on Eq. (1) and the SOC is estimated by subtracting the resulting POC from the OCtot as shown in Eq. (2) (Turpin and Huntzicker, 1995).
EC and OCtot were measured from the same CSN system. In this study, the ratio reported by Strader et al. (1999) by using field data obtained in California during the winter of 1995–1996 has been applied to estimate POC and SOC. The averaged ratio was set to 2.4 with an upper limit of 2.75 and a lower limit of 2.05. OCtot data, the estimated POC, and the estimated SOC were converted to total OM, POA, and SOA, respectively, using a conversion factor of 1.7 (Mcdonald et al., 2015).
2.5 Emissions in California
To show the overall tendency, emissions of HCs and POA were averaged between January and February in 2018 as shown in Fig. 2. HC emissions are speciated according to SAPRC07 gas mechanisms. The amounts of major SOA precursors – aromatics (ARO), alkane (ALK5), terpene (TERP), sesquiterpene (SESQ), and isoprene (ISOP) emissions for each site and the total of the domain – are shown in Fig. 2b. The spatial distributions of POA and major SOA precursors emissions for California are shown in Fig. 2c–h. Aromatic emission is the sum of benzene, toluene, o-xylene, p-xylene, m-xylene, and 1,2,4-trimethylbenzene. The alkane corresponds to ALK5 in SAPRC07 emission data.
On average, terpene, isoprene, alkane, aromatics, and sesquiterpene emissions in California accounted for 44 %, 31 %, 18 %, 7 %, and 1 %, respectively, indicating the dominance of biogenic emissions, particularly terpene emissions, in California. For the selected sites, alkane emissions accounted for more than 60 %, followed by aromatic emissions at approximately 32 %. Terpene and isoprene emissions accounted for less than 5 %, and sesquiterpene emission was negligible, indicating the dominance of alkane emission in urban areas. Figure 2c–h depict a distinct difference in the spatial distribution of biogenic (terpene, sesquiterpene, and isoprene) and anthropogenic (POA, aromatics, and alkane) emissions. The spatial patterns of biogenic emissions followed the distribution of mountain ranges surrounding the Central Valley, whereas the spatial patterns of POA, aromatics, and alkane emissions were concentrated in the source area such as industrial, transportation, and buildings in the Central Valley and Bay Area. In addition, long-chain alkanes can also be attributed to biogenic sources. For example, alkanes are emitted from terrestrial higher plants, cuticle wax, suspended spores, and aquatic plants, and they can be emitted to atmosphere during wildfires (Simoneit, 2002; Yao et al., 2009; Li et al., 2022).
2.6 Meteorological variables
The time series and scatter plots of the surface temperature, relative humidity, and wind speed simulated by the WRF model against observations at the four sites are shown in Figs. S1–S3, respectively, and their statistical summaries of correlation coefficient (R), index of agreement (IOA), and mean bias (MB) are described in Table S7. Detailed descriptions of these statistical parameters are presented in Table S8. Overall, the surface temperature, relative humidity, and wind speed were well predicted with high R and IOA values, reducing uncertainties caused by the meteorological input data in the air quality simulation. Figure S4 shows the wind rose plots for the four sites. Northwesterly winds prevailed at all sites, leading to the convergence of the pollutants in the southern area. Figure S5 shows the time series of the hourly simulated PBL height at the four sites. The relatively low PBL height and weak wind speed appeared together in some periods (i.e., 26 January 2018–13 February 2018), creating conditions conducive to the accumulation of pollutants.
In the CAMx–UNIPAR model, the phase state of inorganic aerosol is determined by using the calculated ERH based on a pre-trained neural network mathematical equation (Yu et al., 2021b) and inorganic compositions (sulfate, nitrate, and ammonium) predicted from an inorganic thermodynamic model, ISORROPIA (Fountoukis and Nenes, 2007). The ERH and DRH of the salted aerosol and its phase state (wet or dry) are illustrated in Fig. S6. During the simulation period, the inorganic aerosol phase was mostly wet, except for a few dry periods.
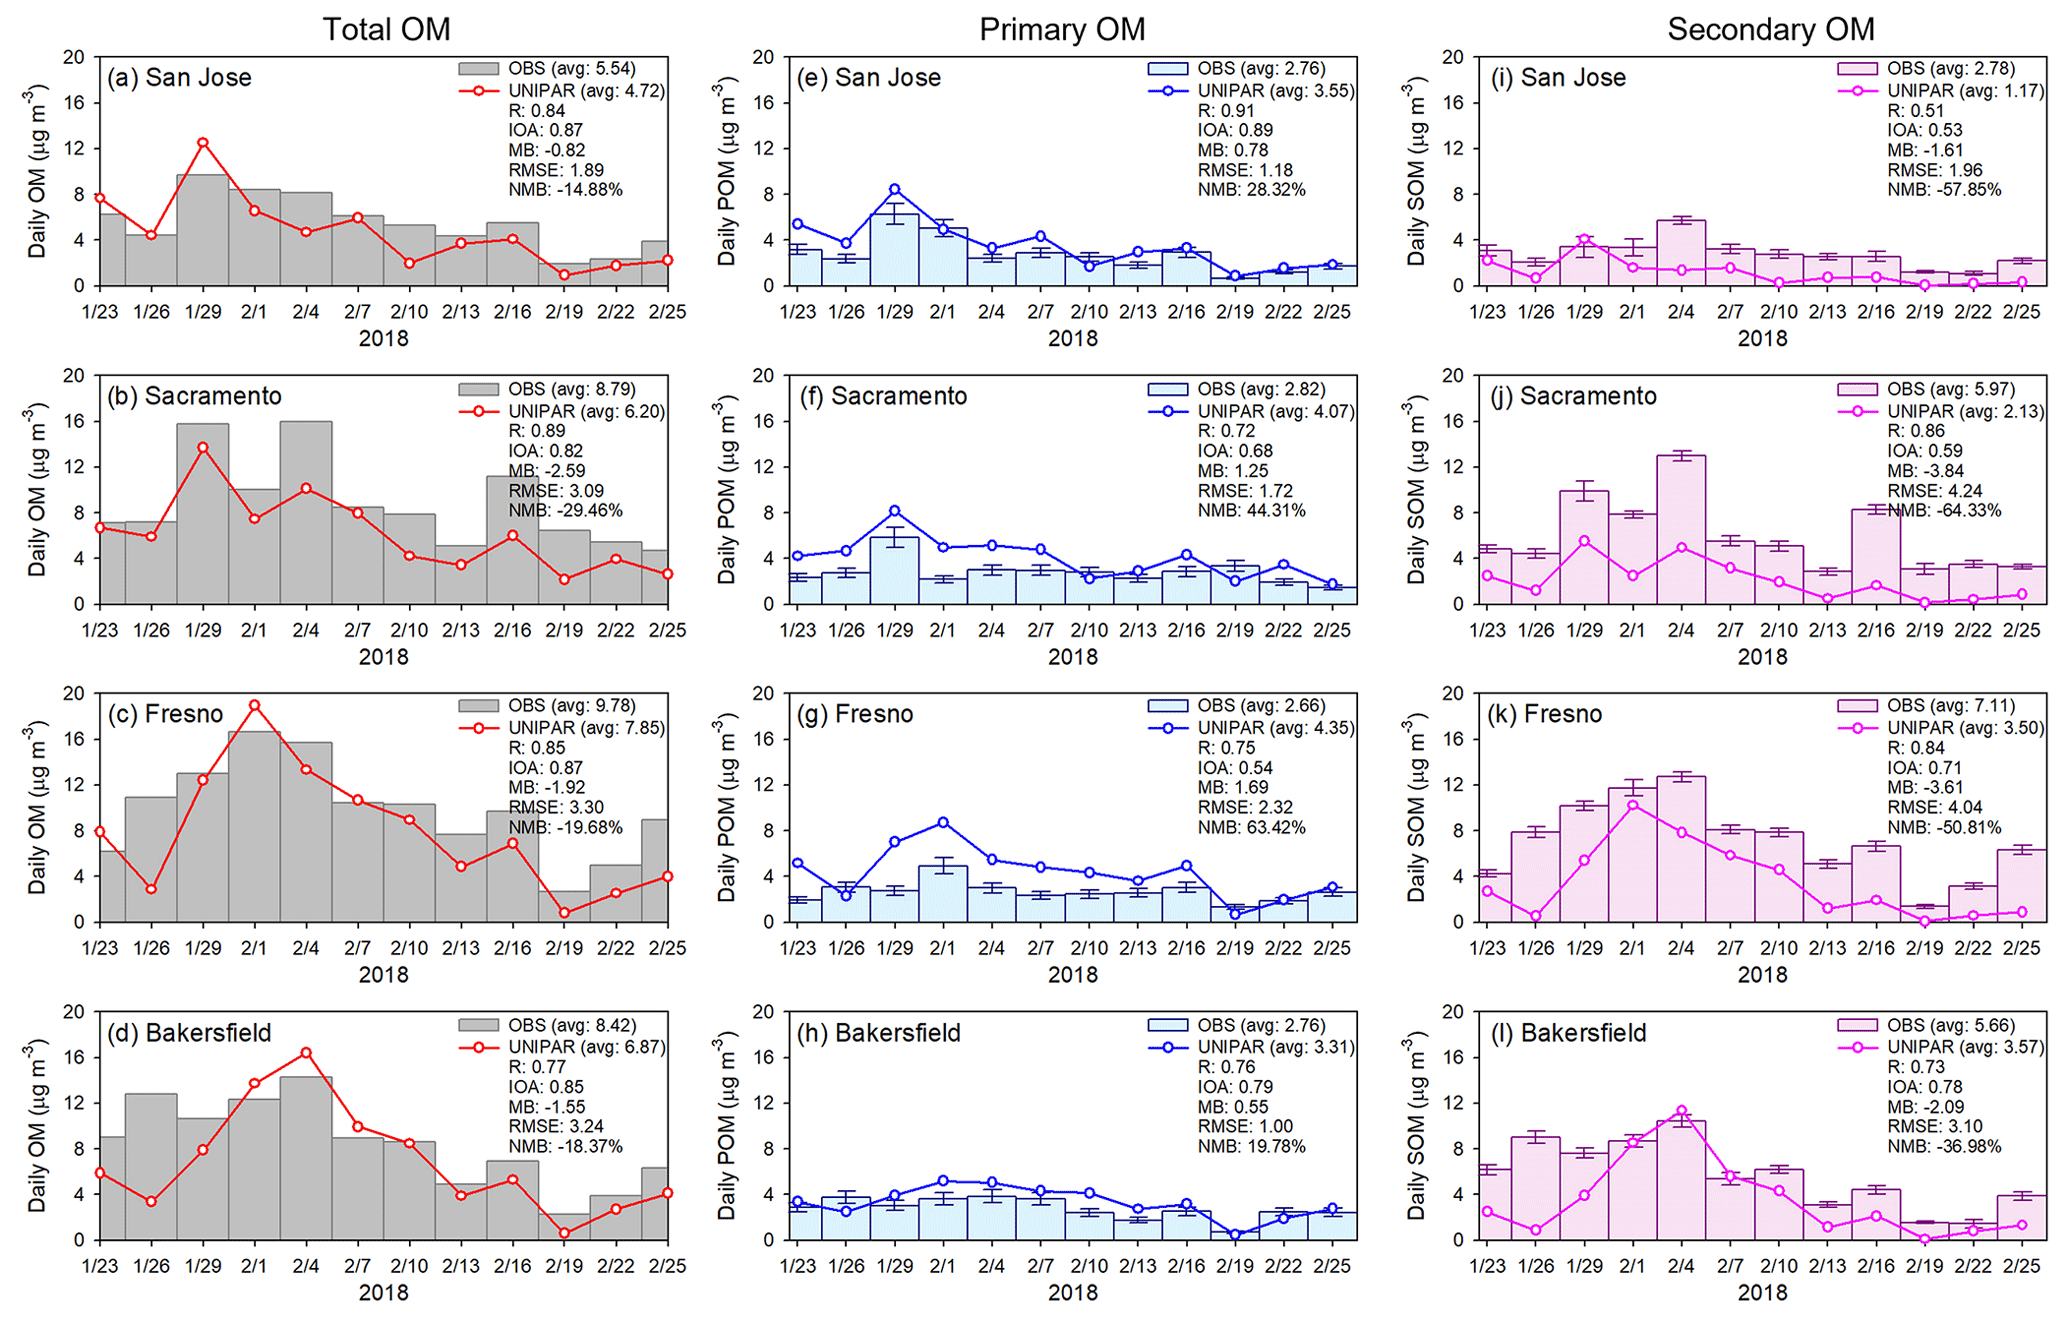
Figure 3(a–d) Time series of observed and simulated total OM mass concentration (µg m−3) at the CSN (Chemical Speciation Network) sites selected in this study. (e–h) Time series of observed POA and simulated POA. (i–l) Time series of observed SOA and simulated SOA. Vertical bars represent observed POA and SOA estimated using a value of 2.4 for the ratio, while the error bars represent a range of ratio from 2.05 to 2.75. The OM mass concentrations are displayed in a daily averaged value every three days since the CSN sites operate on a 1-in-3-day sample collection schedule. The equations for statistical parameters are described in Table S8. R is correlation coefficient, IOA is index of agreement, MB is mean bias, RMSE is root mean square error, and NMB is normalized mean bias.
3.1 Simulation of organic matter
Figure 3 shows the time series of the simulation of the total OM (Fig. 3a–d), POA (Fig. 3e–h), and SOA (Fig. 3i–l) with the CAMx–UNIPAR model against the observations at the four sites with statistical parameters (R, IOA, MB, root mean square error (RMSE), and normalized MB (NMB) as described in Table S8). Overall, the simulated mass concentrations of total OM, consisting of POA and SOA, at four ground sites (San Jose, Sacramento, Fresno, and Bakersfield) showed a good agreement with the observations. The high R (0.77–0.89) and IOA values (0.82–0.87) in Fig. 3 indicate a good agreement between the predicted total OM and observed total OM concentrations. The marginally negative values for MB and NMB indicate that the model underestimated the total OM to some extent.
The simulation of the POA and SOA could capture observations, but it shows a marginal decrease in their R and IOA values compared with the total OM. The simulated POA was slightly overpredicted, and the simulated SOA was somewhat underestimated at the four urban sites. Both MB and NMB values of POA were positive, while those of SOA were negative. The negative bias of the predicted SOA is generally greater than the positive bias of the POA, which affects the negative bias of the total OM from the observations.
The underestimation of SOA mass can be attributed to missing precursor HCs and unidentified chemistry in the gas and aerosol phases. The precursor HCs such as phenols (Bruns et al., 2016; Majdi et al., 2019; Choi and Jang, 2022), branched and cyclic alkanes (Chan et al., 2013; Gentner et al., 2017; Madhu et al., 2023), and polycyclic aromatic HCs (PAHs) (i.e., naphthalene) (Riva et al., 2015; Wang et al., 2021) are currently missing in the UNIPAR model. For example, all alkanes in this study are treated as linear alkanes, increasing some uncertainties. Branched alkane SOA can be slightly overestimated by substituting it with linear alkanes at the same carbon length, but cyclic alkane SOA can be underestimated by using linear alkanes (Madhu et al., 2022, 2023). Zhang and Ying (2012) reported that PAHs including naphthalene, methylnaphthalene and dimethylnaphthalene can contribute to 4 % of the anthropogenic SOA mass. Pye et al. (2023) reported in their regional simulation using the Community Regional Atmospheric Chemistry Multiphase Mechanism (CRACMM) that a significant amount of phenolic compounds is missing in the current models. They estimated that most phenol mass (69 %) is directly emitted with the balance from benzene oxidation, and cresols are mainly chemically produced (80 %). The missing emissions of phenol and cresol can account for 30% of the total aromatic SOA mass (Pye et al., 2023). The SOA formation from low-volatility aromatic HCs (aromatics substituted with long-chain alkyl groups) is also missing in the SOA simulation of this study.
Additionally, the statistical analysis may vary, owing to the lack of observational data for the simulation periods. For example, the OC and EC observation data were only available for daily averaged data every three days (Sect. 2.3), and this low-time-resolution observational data limited the verifications of the simulated OM mass, especially SOA formation during daytime and nighttime from the CAMx–UNIPAR simulations. In addition, the observed POA estimated using the ratio (Sect. 2.4) also has uncertainties because the ratio is inconsistent from source to source but varies between sources (Strader et al., 1999). The simulated POA can also be inaccurate due to the uncertainty in primary OC emission data.
The OM mass ratios estimated from the observation data ranged from 0.50 to 0.73 indicating a significant contribution of SOA mass to total OM. The simulated OM ratios (0.25–0.52) were relatively lower than those in the observed ratios, which are calculated using decoupled SOA and POA with a ratio (Sect. 2.4), suggesting that POA is overpredicted and SOA is underpredicted in the CAMx–UNIPAR simulations. For both observations and simulations, OM mass ratios in southern areas, such as Fresno and Bakersfield, were higher than those in northern areas, such as San Jose and Sacramento. The northern area, including the Bay Area, is located on the upwind side of the southern area. A strong wind appeared in the northern area during the simulation period (Table S7 and Fig. S4), decreasing the residence time of pollutants, which reduced secondary products of pollutants in this region. The concentration of total OM, POA, and SOA increased from 23 January 2018 and maintained the high OM mass by early February. During this period, the wind speed was relatively weak (Fig. S3) and the PBL height was suppressed (Fig. S5), which is favorable for the accumulation of pollutants in urban areas.
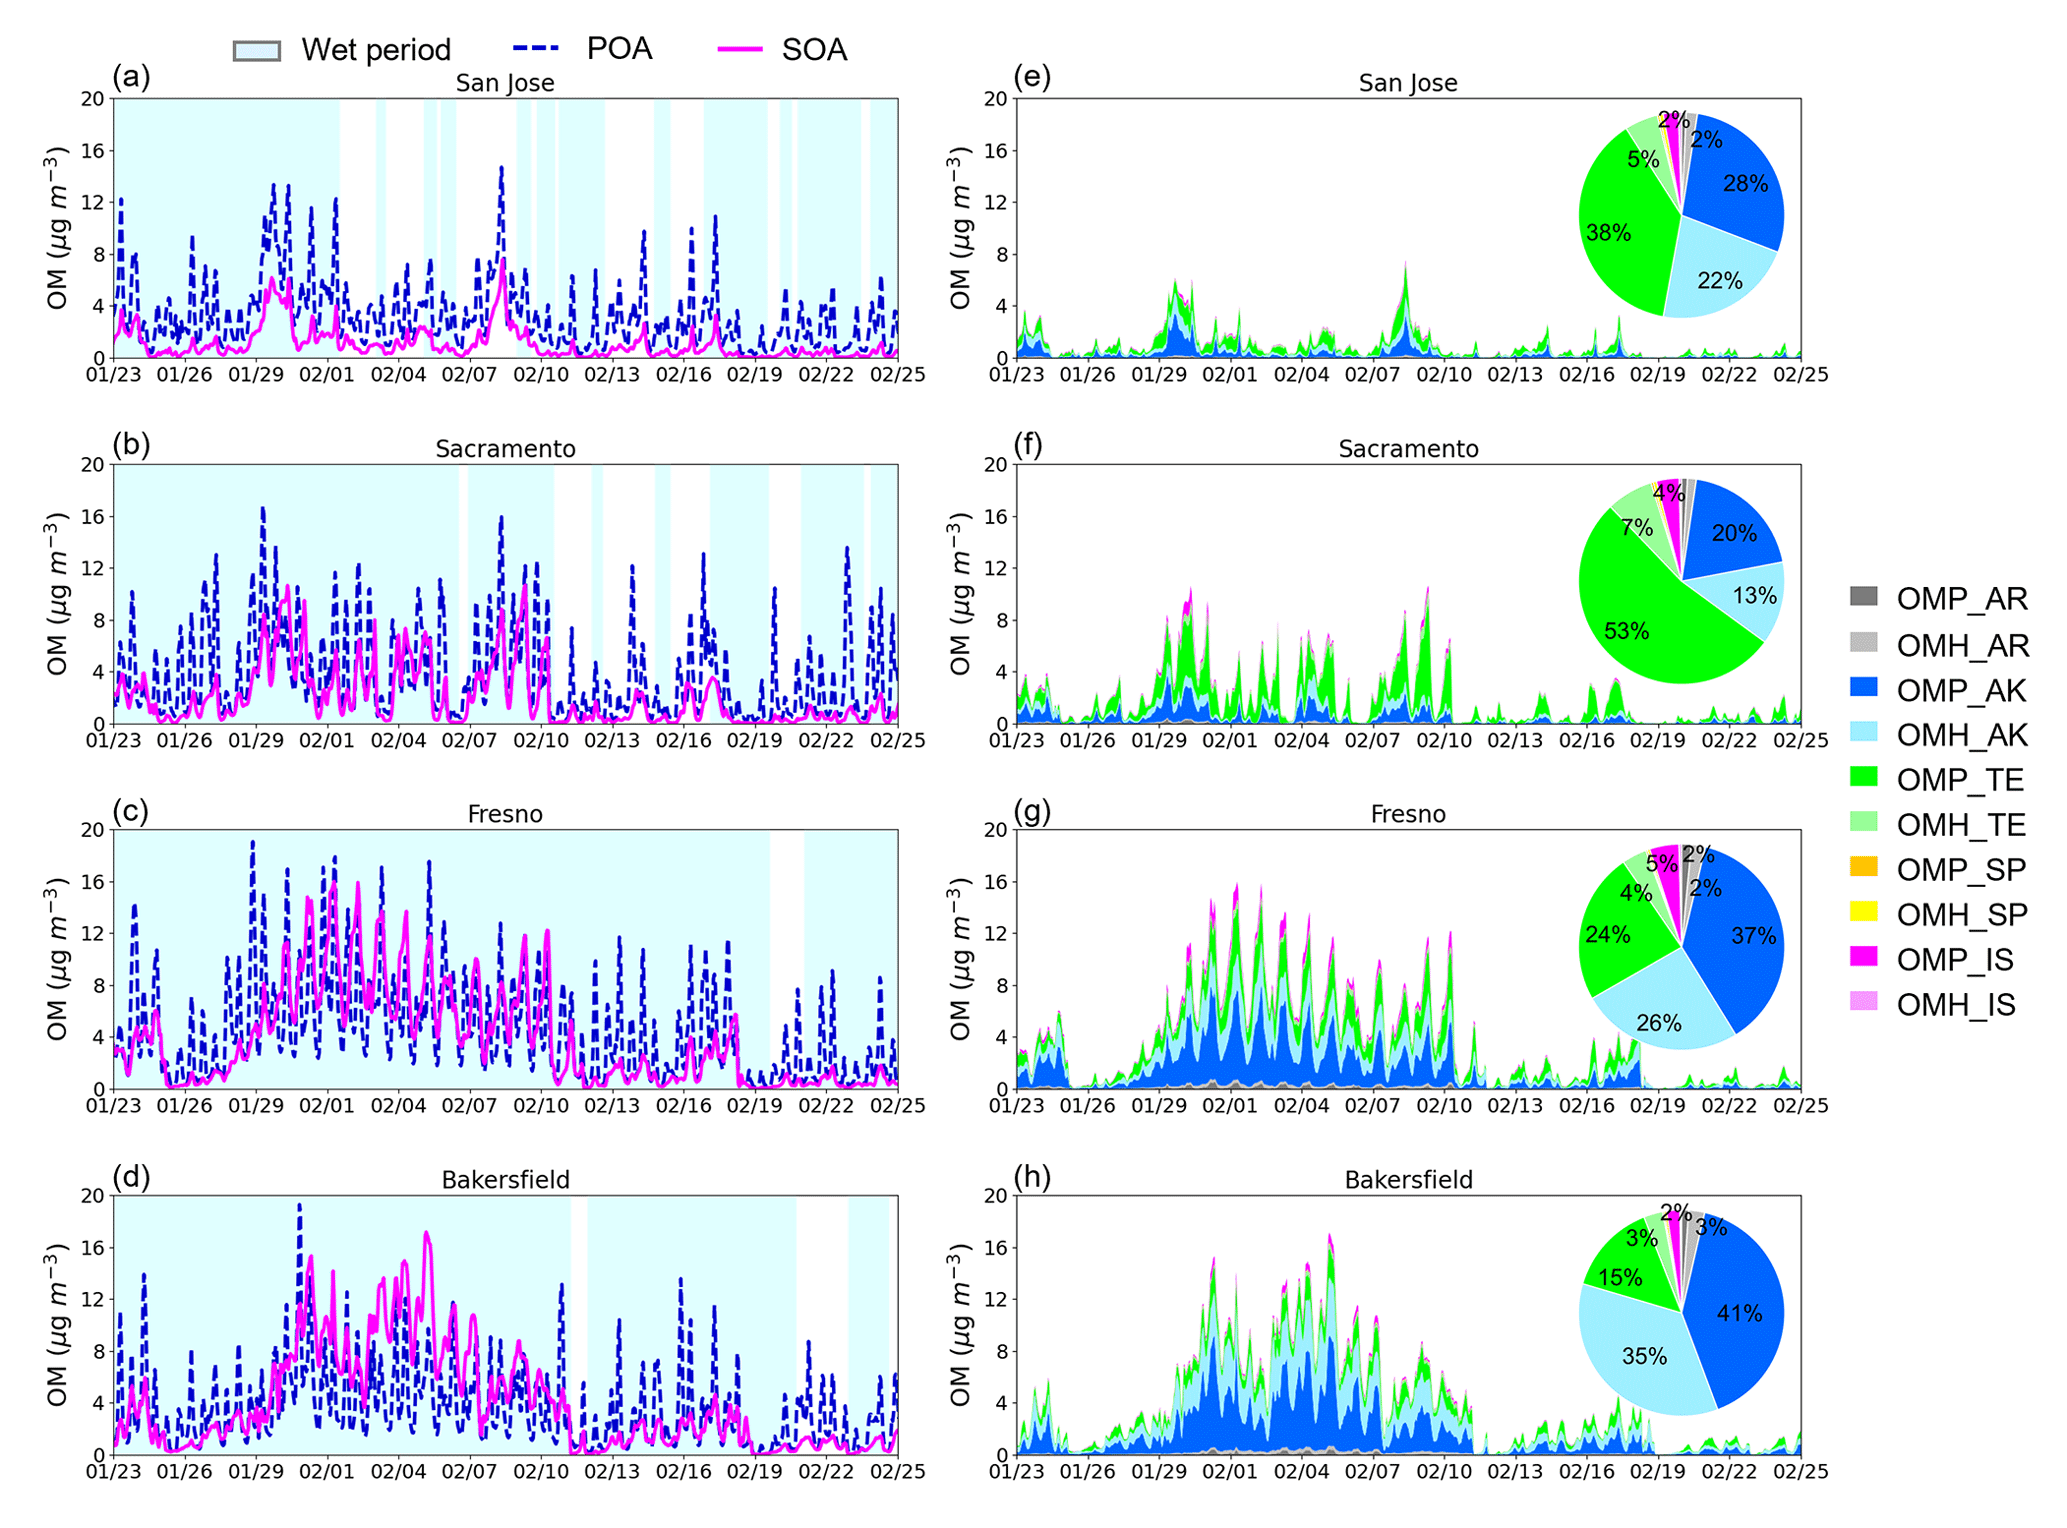
Figure 4(a–d) Time series of simulated POA, SOA, and salted aerosol phase state (wet and dry). (e–h) Time series of simulated SOA species in the UNIPAR model at each site and the pie charts to represent the fraction of SOA species associated with graphs (e–h).
3.2 Simulation of individual SOA species and their diurnal pattern
Figure 4a–d show the time series of the simulated POA and total SOA with the predicted aerosol phase state (wet and dry) at the four sites. Both POA and SOA mass were noticeably high between 23 January and 13 February 2018. Figure 4e–h show the time series of the simulated SOA species and pie charts to represent the averaged fraction of each SOA species during the period in Fig. 4. The predicted total SOA mass was predominated by alkane SOA (33 %–76 %) and terpene SOA (18 %–60 %) across all four sites. The contribution of alkane SOA and terpene SOA to the local SOA mass burden varied according to the location of the sites. For example, the fraction of alkane SOA was higher than that of terpene SOA in all sites except Sacramento. The terpene concentrations can be high at the Sacramento site due to the proximity to the northern and eastern mountain ranges. Overall, the contributions of the isoprene SOA and aromatic SOA to the total SOA mass were small (∼5 %) and that of sesquiterpene SOA was nearly negligible.
A high fraction of OMP mass attributed to the total SOA ranging from 0.59 to 0.77 as shown in Fig. 4e–h. In particular, the alkane OMP fraction of total SOA ranged from 0.2 to 0.41, and the terpene OMP fraction of total SOA ranged from 0.15 to 0.53. In the current UNIPAR model, the low-volatility products produced from the oxidation of long-chain alkanes can significantly increase SOA growth via their gas–particle partitioning to the pre-existing OM. Additionally, the model includes the low-volatility products originating from autoxidation of α-pinene ozonolysis products (Roldin et al., 2019; Crounse et al., 2013; Bianchi et al., 2019). The importance of autoxidation mechanisms on terpene SOA formation was demonstrated in a recent study by Yu et al. (2021c) for daytime chemistry. In their study, the peroxy radical autoxidation mechanism (PRAM) developed by Roldin et al. (2019) was included in UNIPAR to evaluate the impact of HOMs on terpene SOA formation. In the sensitivity test of SOA prediction associated with PRAM, α-pinene SOA mass increased by 15 %–35 % in the presence of PRAM, suggesting that substantial impact of PRAM on the total SOA mass (Yu et al., 2021c).
In addition, the chamber study and the UNIPAR simulation by Han and Jang (2023) showed a significant potential for nighttime biogenic SOA formation. In their study, α-pinene and isoprene SOA growth during nighttime is even more significant than their daytime growth due to the considerable contribution of both ozonolysis of biogenic HCs and the reaction with nitrate radicals, which yield low-volatility products. Ozone is produced via the atmospheric oxidation of HCs integrated with a photochemical cycle of NOx that extends through nighttime and promotes the formation of a nitrate radical in the presence of NO2. This nitrate radical can attack an alkene in terpenes to form an alkylperoxy radical, leading to the formation of low-volatility peroxide accretion products (ROOR) (Hasan et al., 2021; Bates et al., 2022; Han and Jang, 2023).
The fractions of OMH in anthropogenic SOA (aromatic and alkane SOA) ranged from 0.41 to 0.47, and those of biogenic SOA ranged from 0.13 to 0.18. The anthropogenic OMH fractions are consistent with reported values predicted by Pye and Pouliot (2012) in regional scales in the US domain. For example, they reported that the oligomeric SOA simulated mainly from alkanes and partly from PAHs accounted for about half of the anthropogenic SOA in the US domain. In the regional simulation by Yu et al. (2022), the SOA mass was simulated with both the two-product SOA (SOAP) model and the UNIPAR SOA model during the KORUS-AQ campaign. The fraction of OMH to the total SOA is on average 0.31 and 0.40 with the SOAP SOA model and the UNIPAR SOA model, respectively, (Yu et al., 2022). The alkane OMH fractions of the total SOA ranged from 0.13 to 0.35, which indicates that alkane OMH is significant, although less than alkane OMP (Fig. 4e–h). In the UNIPAR model, this alkane OMH is mainly associated with non-volatile products originating from the autoxidation of long-chain alkanes. Unlike alkanes, other precursor HCs yield OMH via oligomerization of reactive semi-volatile organic species. Under California's 2018 winter simulation, the alkane OMH was larger than that sourced from non-alkane OMH. The attribution of autoxidation-driven low-volatility products (alkane and terpene) to the total SOA mass can also promote gas–particle partitioning of other products (non-autoxidation products), by increasing the preexisting OM. Furthermore, OMP is dependent on temperature with a negative relation with temperature (Odum et al., 1996). The contribution of OMH to the total SOA can also be impacted by HC species.
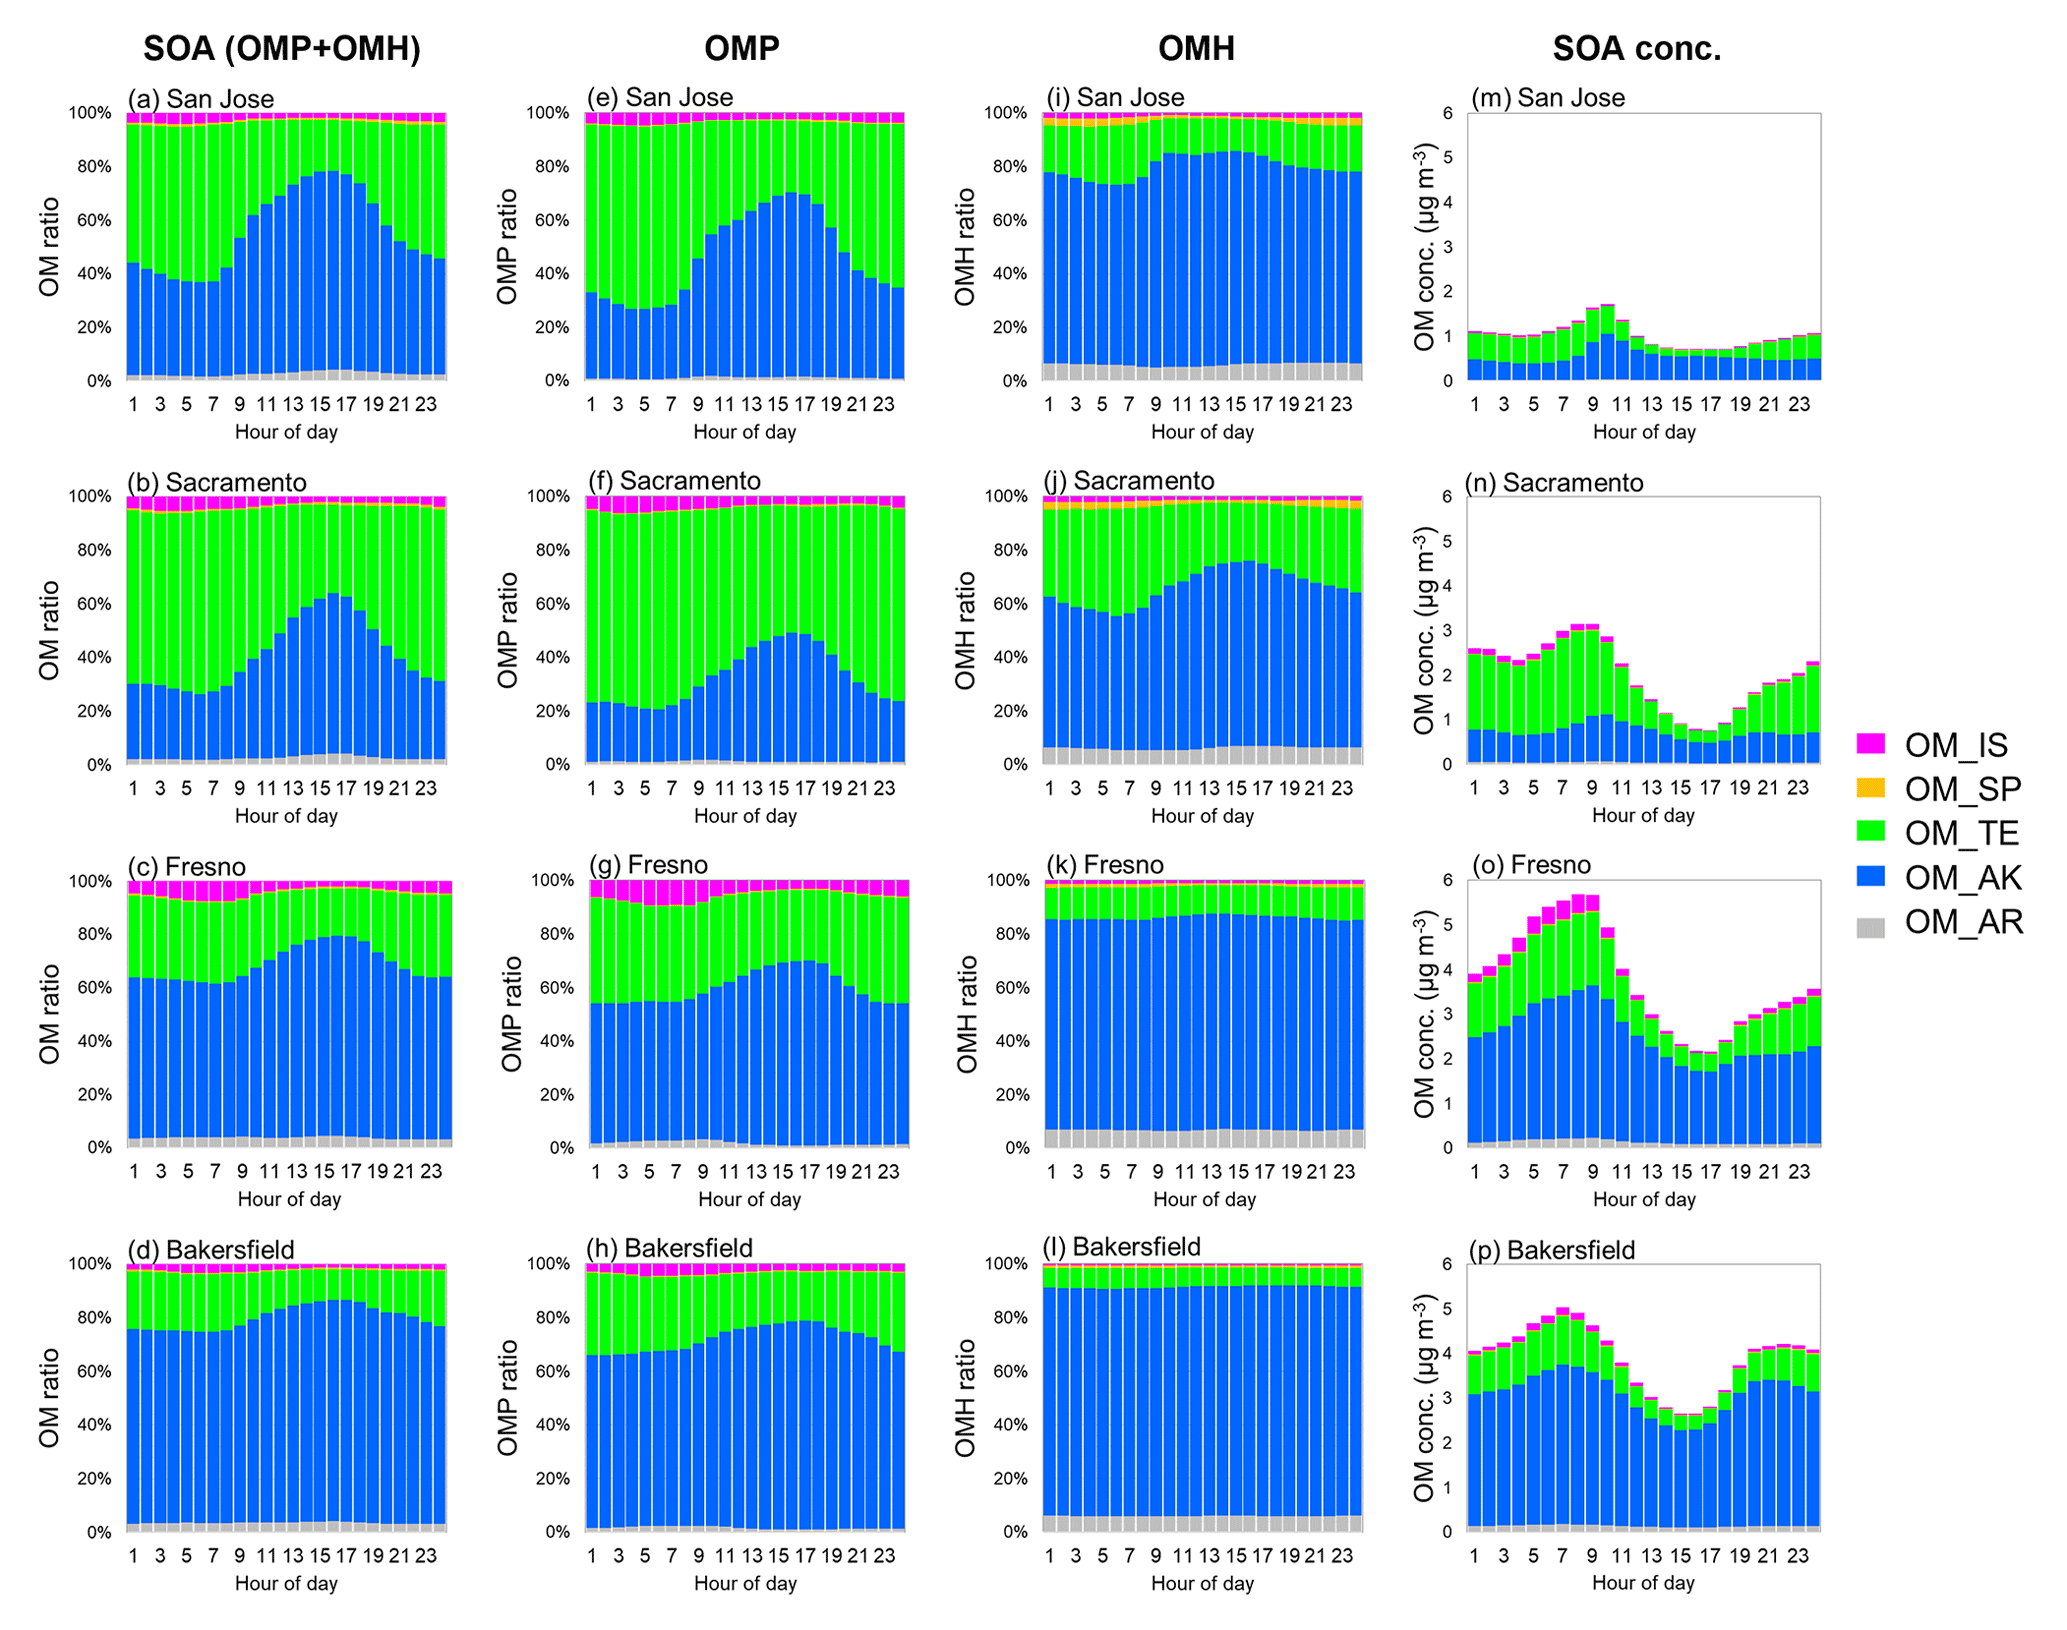
Figure 5Averaged diurnal variations of (a–d) the total SOA (OMP + OMH) species (%), (e–h) the OMP SOA species (%), (i–l) the OMH SOA species (%), and (m–p) the total SOA (OMP + OMH) species (µg m−3) during the simulation period (23 January–24 February 2018).
Figure 5 shows the diurnal variation of SOA species averaged between 23 January and 24 February 2018. The alkane SOA increased during the daytime because alkanes are mainly oxidized by reactions with an OH radical. As discussed above, terpene can be oxidized with an OH radical, a dominant oxidant in daytime, and furthermore terpene reacts with ozone and nitrate radicals during nighttime to form low-volatility products, which can be a significant source of OMP. The time series of the simulated concentrations of NO2, ozone, and nitrate radicals are shown in Fig. S7. The time series of simulated SOA precursor HC concentrations (i.e., aromatic HCs, alkane, terpene, sesquiterpene, and isoprene) are shown in Fig. S8. Figures S9 and S10 show the time series of emissions of precursor HCs and SOA species, respectively. The terpene SOA mass at Fresno and Bakersfield noticeably increased (Fig. S10) between 29 January and 11 February 2018 when the concentrations of ozone and nitrate radicals were high (Fig. S7). During the simulation period, no specific fluctuations appeared in both terpene concentrations (Fig. S8) and terpene emissions (Fig. S9), suggesting that terpene SOA formation is positively influenced by the concentrations of ozone and nitrate radicals.
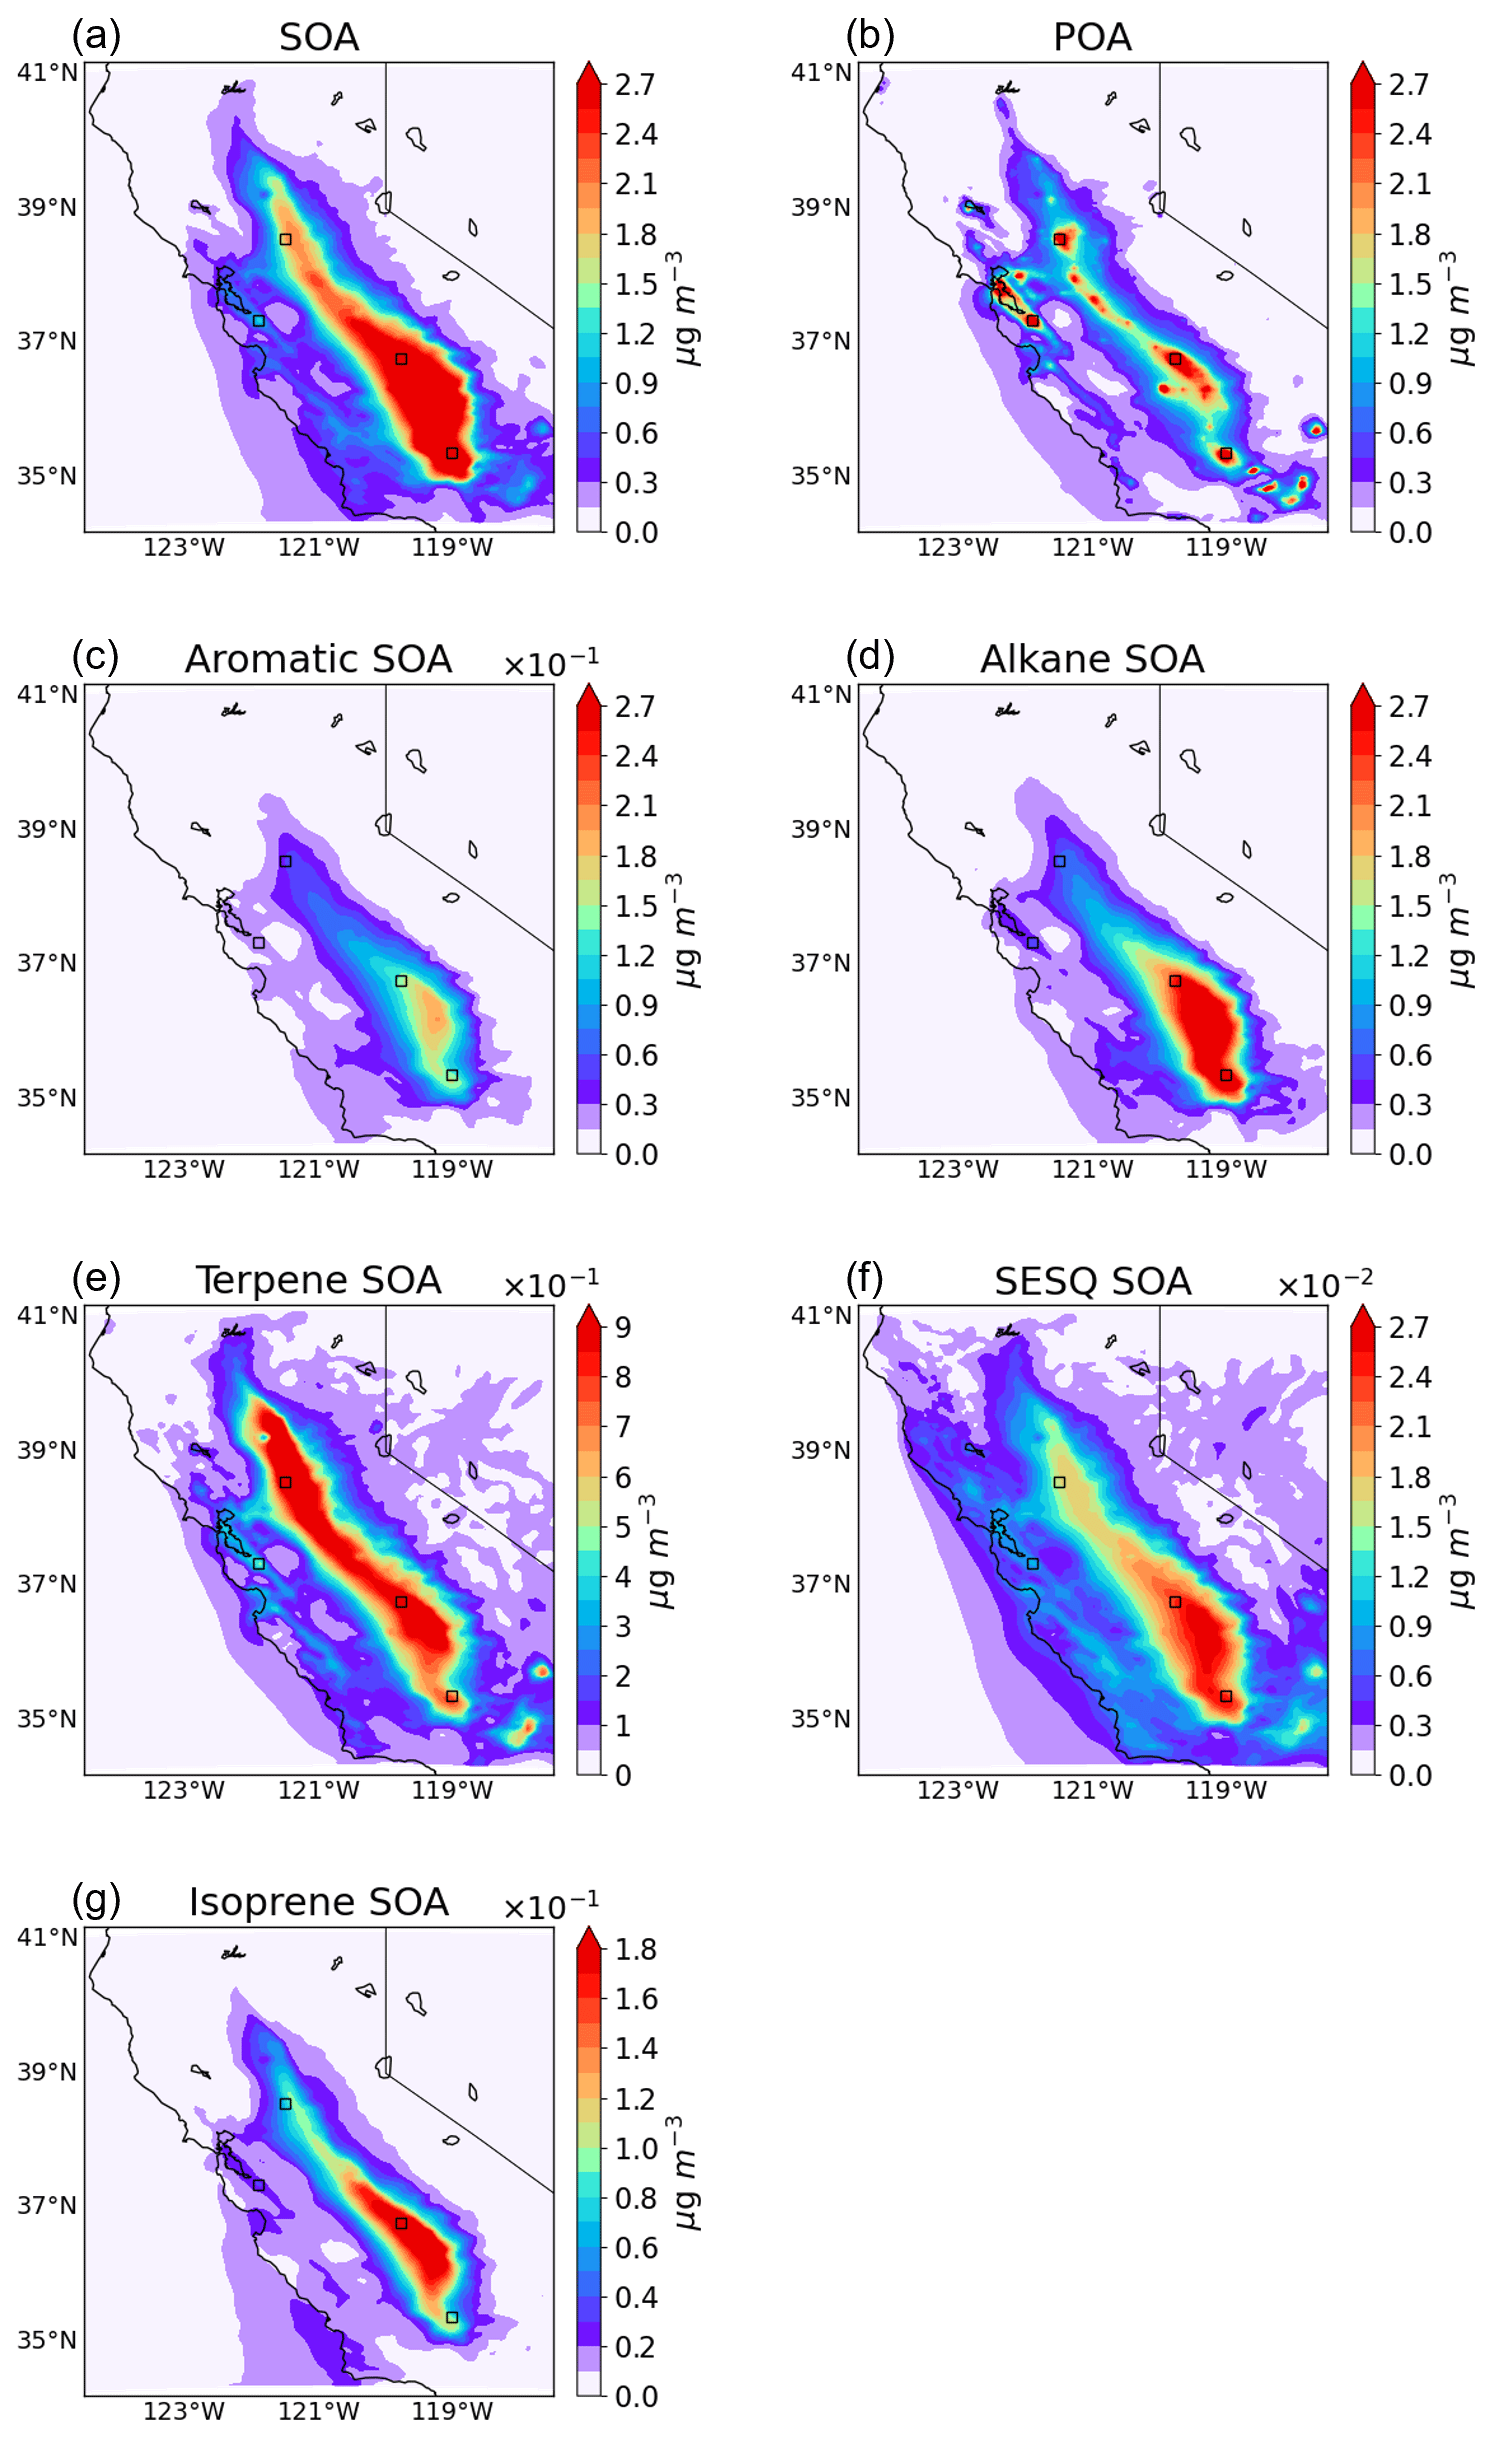
Figure 6Spatial distribution of (a) total SOA, (b) POA, (c) aromatic SOA (OMP_AR + OMH_AR), (d) alkane SOA (OMP_AK + OMH_AK), (e) terpene SOA (OMP_TE + OMH_TE), (f) sesquiterpene SOA (OMP_SP + OMH_SP), and (g) isoprene SOA (OMP_IS + OMH_IS). The simulation results at the surface level were averaged between 23 January and 24 February 2018.
3.3 Spatial distribution of SOA species
The surface-level spatial distributions of the total SOA, POA, and individual SOA species, averaged between 23 January and 24 February 2018, are displayed in Fig. 6. The spatial distribution of individual SOA species can be influenced by the emission of each HC, available atmospheric oxidants, the reactivity of each HC with atmospheric oxidants, and winds (speed and direction). Figure 2c–h illustrate the spatial distributions of the emission of POA and each HC, and Fig. S11a–c show those of NO2 and atmospheric oxidants (ozone and nitrate radicals), respectively. The spatial distribution of the concentrations of each HC is shown in Fig. S11d–h.
Biogenic HCs are rapidly consumed day and night, due to their fast rate constants with OH radicals, ozone, and nitrate radicals, and quickly form SOA. Hence, the spatial distributions of biogenic SOA were substantially influenced by the distribution of precursor HC emission sources. As shown in Fig. 6e, the terpene SOA mass was evenly distributed along the Central Valley, which was influenced by the high terpene emission from the surrounding mountains including the Cascade Range to the north, the Sierra Nevada to the east, and the Tehachapi Mountains to the south. On the other hand, high NO2 concentrations appeared in urban areas of the Central Valley as shown in Fig. S11a. Both ozone and nitrate radicals react with biogenic HCs to effectively form SOA via the production of low-volatility products as discussed in Sect. 3.2 (Li et al., 2011; Jenkin, 2004; Han and Jang, 2023). The formation of nitrate radicals is favorable in urban areas because of the high concentrations of NO2. Owing to the reaction of terpene with this nitrate radicals, the concentration of nitrate radicals was, however, low in the Central Valley. The maximum terpene SOA concentration appeared between the terpene ridge (Fig. S11f) and the NO2 ridge (Fig. S11a) where the reaction rate between terpene and nitrate radicals was high. The sesquiterpene SOA distribution (Fig. 6f) was slightly southward compared with the terpene SOA distribution. In addition to emissions from mountain ranges, sesquiterpene can be sourced from various areas as shown in Fig. 2g. California's isoprene emissions (Fig. 2h) are expected to originate from oak trees and from eucalyptus trees and are distributed in the central California foothills and South Coast Ranges. Thus, the isoprene SOA distribution (Fig. 6g) was oriented more southward than that of the terpene SOA. Both sesquiterpene SOA and isoprene SOA concentrations were extremely small as discussed in Sect. 3.2.
The spatial distributions of anthropogenic SOA were noticeably impacted by the southward wind direction. For example, the spatial distributions of both aromatic SOA (Fig. 6c) and alkane SOA (Fig. 6d) were extremely southward, although their emissions were relatively even along with the Central Valley (Fig. 2d and e). Unlike biogenic HCs, both aromatic and alkane HCs have a relatively long lifetime for their atmospheric oxidation. Additionally, their major oxidation path with OH radicals occurs in daytime. Thus, anthropogenic HCs can be transported along with the southward wind during the simulation period, which can increase the formation of anthropogenic SOA in the southern area. A PM2.5 particle has an average lifetime of approximately eight days (Hodan and Barnard, 2004; Chowdhury et al., 2022). Noticeably, the POA also drifted to the south due to the transportation by the southward wind (Fig. 2c vs. Fig. 6b) and the high POA concentration augmented anthropogenic SOA growth in the southern area.
3.4 Impact of aerosol hygroscopicity on SOA formation
Numerous studies (Lim et al., 2010; Liu et al., 2012; Mcneill, 2015; Srivastava et al., 2022) have revealed that aqueous reactions of hydrophilic, reactive organic species in electrolytic inorganic aerosol produce non-volatile oligomeric matter and increase SOA mass. These heterogeneous reactions are known to be accelerated by acid catalyst species (Jang et al., 2002; Hallquist et al., 2009). In order to simulate the SOA formation potential by aerosol acidity at the four sites, the time series of hourly simulated concentrations of ionic species (sulfate, nitrate, and ammonium in Fig. S12) were applied to estimate the aerosol acidity by the charge balance of the inorganic electrolytes. In Fig. S13, the charge balance estimated using the simulated and observed ionic concentrations suggested that the aerosol acidity was nearly neutral. The one-to-one line shown in Fig. S13 shows the fully titrated inorganic composition. Thus, SOA growth by the acid-catalyzed heterogeneous reactions of reactive lumping species might not have been effective during the simulation period of this study. Overall, nitrate concentrations in aerosol were high in the urban areas of California during the winter of 2018. The aerosols, which are enriched with ammonium nitrate salt, can be hygroscopic and lower the aerosol ERH and DRH (Fig. S6). As described in Sect. 2.6, the inorganic aerosol phase was mostly wet due to the low ERH and DRH with the abundant nitrate ammonium salt.
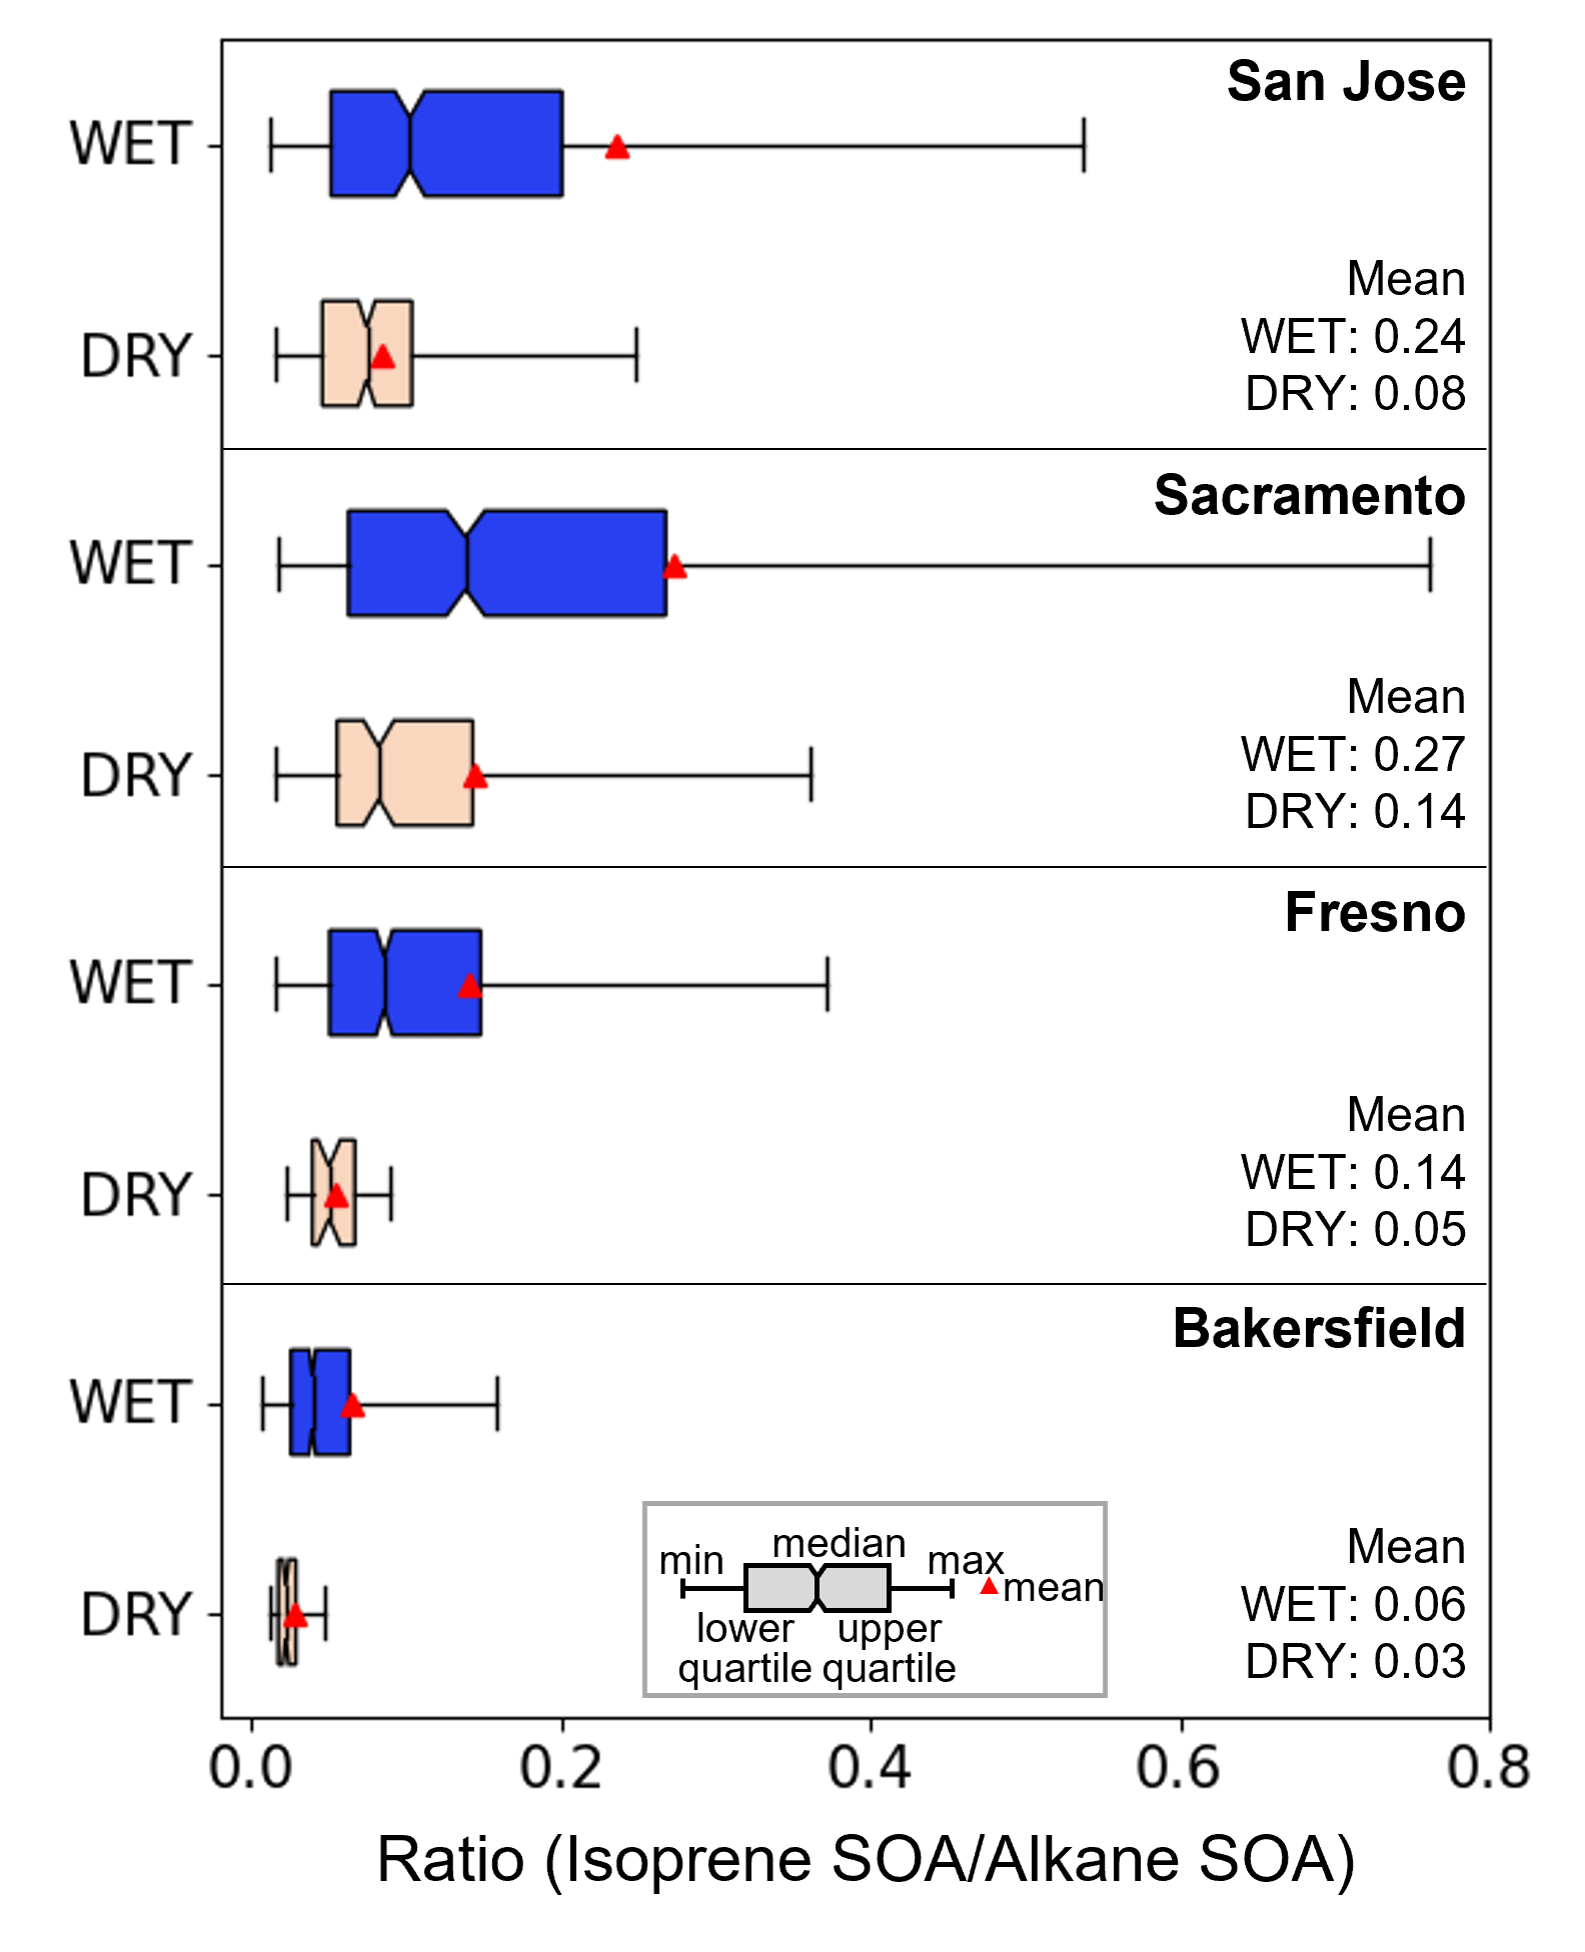
Figure 7The mass ratio of isoprene SOA to alkane SOA at the San Jose, Fresno, Sacramento, and Bakersfield sites during the wet and dry periods.
The sensitivities of different SOA species to aerosol hygroscopicity are dissimilar. For example, aromatic and isoprene oxidation products are reactive for heterogeneous reactions and hydrophilic. Thus, they can effectively yield SOA in inorganic salted aqueous phase (Yu et al., 2021b). In contrast, both alkane and terpene oxidation products are relatively hydrophobic. Thus, their solubility in the aqueous phase is low due to their large activity coefficients. Evidently, α-pinene SOA and alkane SOA have a low O:C ratio (∼0.55) (Zhang et al., 2015; Galeazzo et al., 2021; Madhu et al., 2022) compared with isoprene SOA (∼1.1) (Song et al., 2015). In order to evaluate the sensitivity of different SOA species to aerosol hygroscopicity, the isoprene to alkane SOA mass ratios were calculated during the wet and dry periods as shown in Fig. 7. The SOA mass ratios of isoprene to alkane during the wet period were higher than those during the dry periods for all sites: San Jose, Sacramento, Fresno, and Bakersfield by factors of 3.0, 1.9, 2.8, and 2.0, respectively. Such high SOA mass ratios of isoprene to alkane during the wet period indicate the importance of the role of aerosol hygroscopicity on the SOA formation in an environment with a high emission of isoprene or aromatic HCs. The impact of aerosol hygroscopicity on SOA mass was minimal under California's atmospheric environment during the simulation period because of the dominance of alkane and terpene SOA. In contrast, the SOA mass simulated during the KORUS-AQ campaign was dominated by aromatic HCs, which produced reactive and hydrophilic products (Yu et al., 2022). In their study, the CAMx–UNIPAR model well captured a significant contribution of aromatic SOA to the total OM during the low-level transport/haze period (Crawford et al., 2021) where the aerosol water content was high.
Table 3Correlation coefficients (R) between NO2, nitrate (NO, and SOA species mass at four sites. NO2, nitrate, and SOA species concentrations during the high PBL height period (11–24 February 2018)∗ were used to minimize the impact of pollutant accumulation due to the suppressed vertical diffusion.
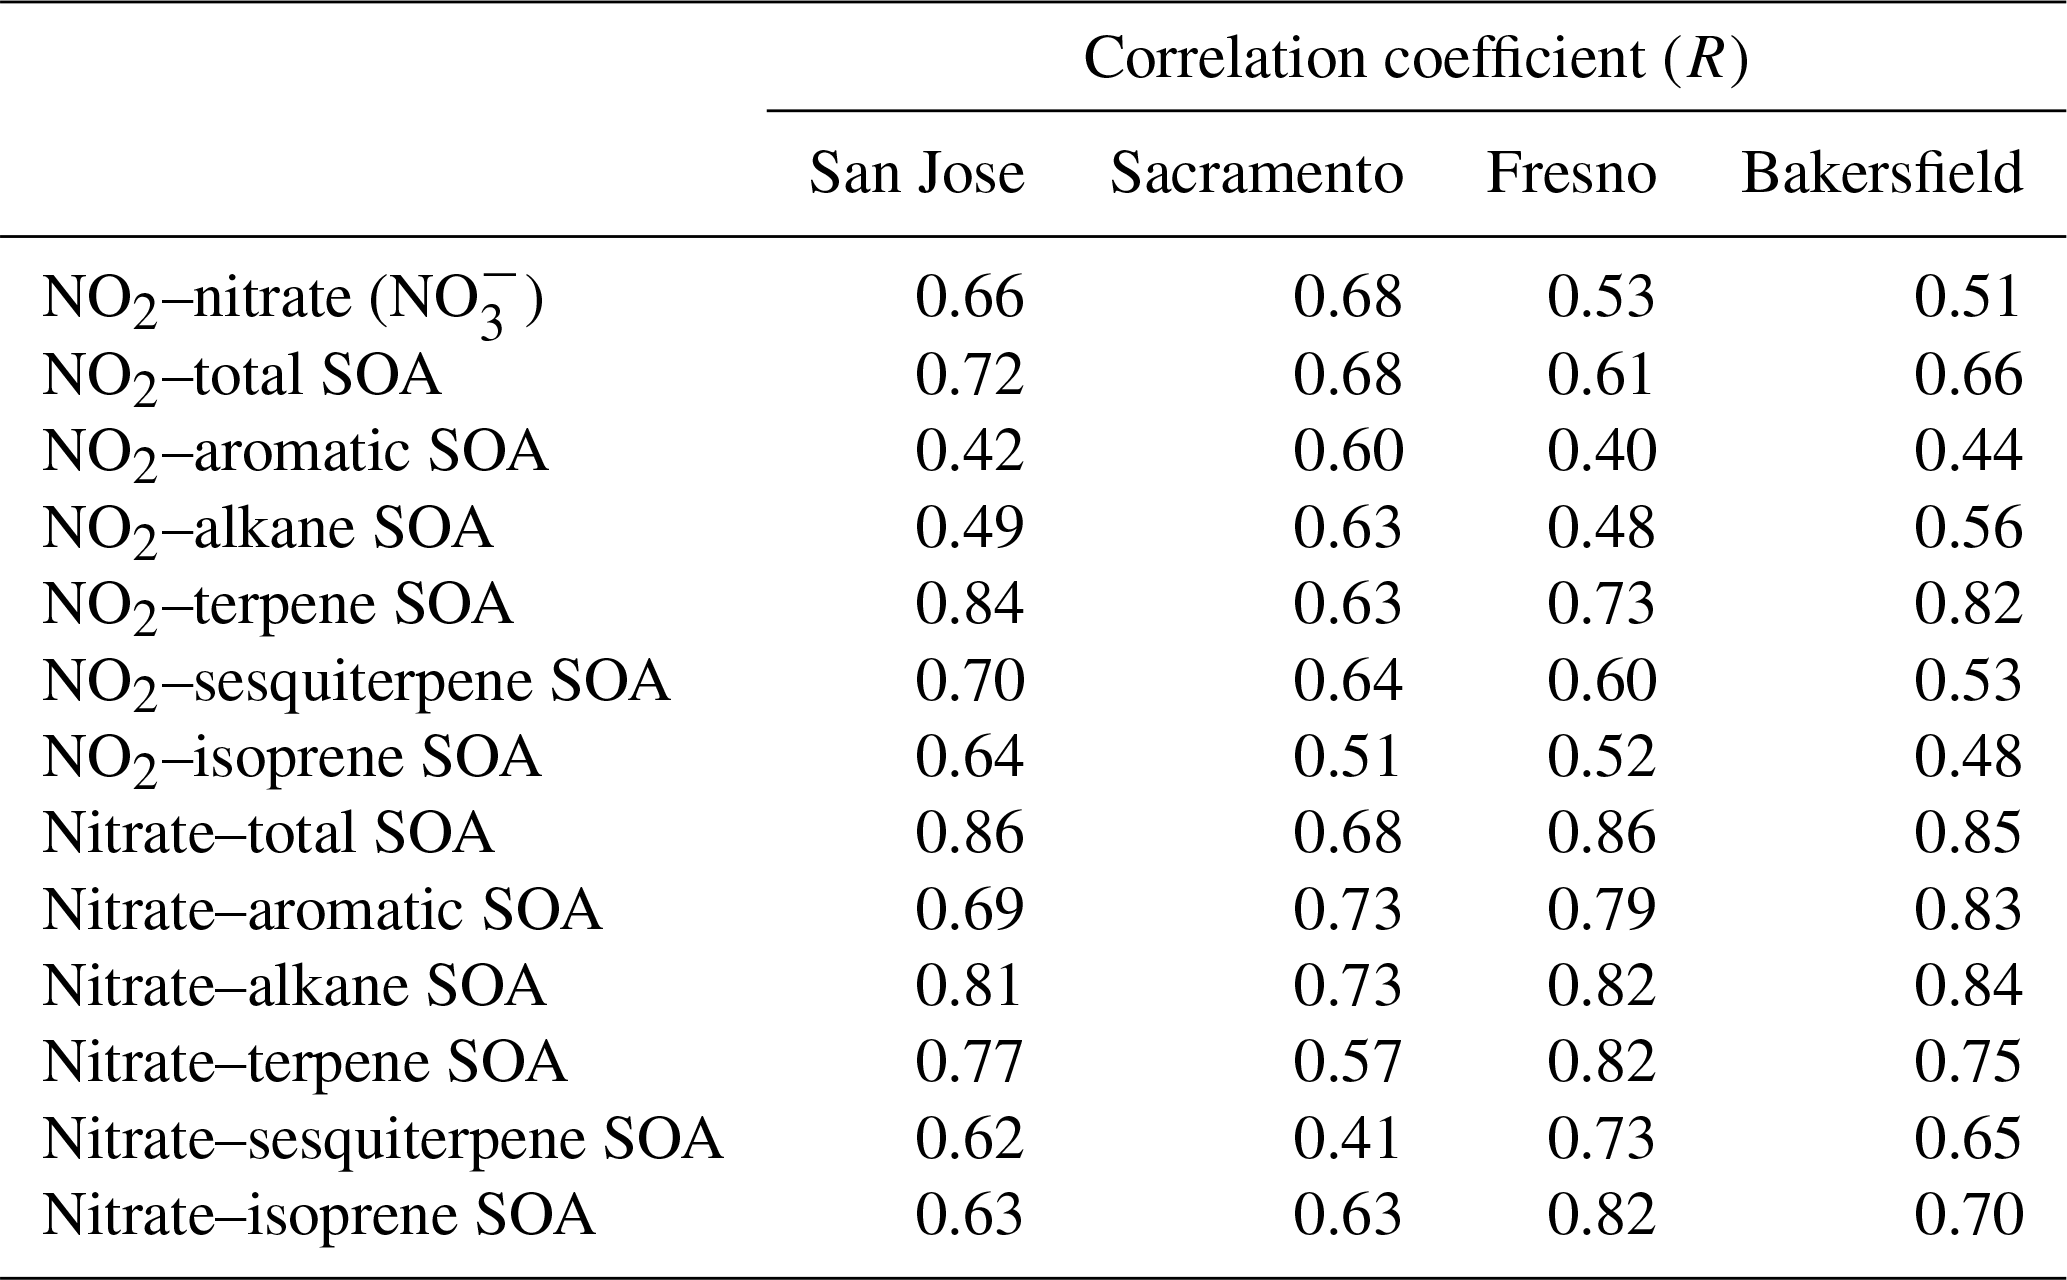
∗ Refer to Fig. S5.
3.5 Impact of NO2 on SOA formation
To understand the impact of NO2 on SOA formation, the correlation coefficients (R) between NO2, nitrate aerosol, and SOA mass associated with each HC were estimated as shown in Table 3. The analysis of R between NO2, nitrate, and SOA was performed during high PBL height periods (11–24 February 2018). The formaldehyde-to-NO2 ratio (FNR) is typically used to indicate NOx levels. When FNR is less than 1, it represents VOC-limited condition (Duncan et al., 2010; Hoque et al., 2022). Based on the spatial distribution of FNR in Fig. S14, the four urban sites of this study were VOC-limited (high NOx levels) conditions. Under this environment, a typical SOA production in daytime is negatively correlated with NO2 concentrations (Presto et al., 2005; Yang et al., 2020; Madhu et al., 2022). However, all correlation coefficients between NO2 and SOA mass shown in Table 3 were positive. Biogenic SOA was more strongly correlated with NO2 (larger positive R) than anthropogenic SOA.
As discussed in Sect. 3.2 and 3.3, biogenic HCs, particularly terpene, react with a nitrate radical to form low-volatile products and effectively increase SOA mass. NO2 is linked to the formation of nitrate radicals at nighttime, and it can be positively related to biogenic SOA mass. Increased nighttime biogenic SOA mass (Fig. 5) can also influence OMP of anthropogenic SOA, weakening the negative correlation between NO2 and anthropogenic SOA formation. For example, the last column in Fig. 5, which displays the diurnal variation of the SOA concentrations, evinces the influence of terpene SOA on anthropogenic SOA mass. Anthropogenic SOA mass still gradually increased after sunset (17:00 local standard time (LST)) when the production of OH radical was nearly inactive, and it continued until midnight (i.e., 00:00 LST at Fresno). As shown in Fig. S15, a rapid change in the PBL height appeared between 15:00 and 17:00 LST, and no change appeared in the PBL height after 19:00 LST. Thus, the influence of PBL height changes on anthropogenic SOA mass after 19:00 LST can be trivial.
Under the Central Valley's environments in this study, ammonia was rich, temperature was relatively low, and humidity was high. The high concentration of NO2 in this region is favorable to form inorganic nitrate aerosol, which can promote aqueous phase reactions of organic species. Evidently, a strong positive correlation appeared between inorganic nitrate concentrations and SOA mass (R: 0.41–0.86 in Table 3) declining a conventional negative correlation between NOx concentration and anthropogenic SOA formation at high NOx levels.
The CAMx–UNIPAR model utilized 251 lumping species, which were constructed by using the semi-explicitly predicted products for three major oxidation paths (OH radicals, ozone, and nitrate radicals) of a wide range of HCs including aromatics, long-chain alkanes with different carbon lengths, isoprene, terpene, and sesquiterpene. Semi-explicit gas mechanisms captured the emerging chemistry in both the gas and aerosol phases as a function of the NOx level and gas aging. In CAMx–UNIPAR, the calculation of the activity coefficient of lumping species in the multiphase allowed the simulation of the impact of temperature and humidity on the multiphase partitioning of lumping species and their heterogeneous reactions in the aerosol phase to form oligomeric OM. The OM budget was reasonably simulated by CAMx–UNIPAR for the urban environments in the Central Valley during the winter of 2018 (Fig. 3). However, the predicted POA was slightly overpredicted and the predicted SOA was somewhat underestimated compared with the decoupled POA and SOA from the observed OC.
In-depth analyses of individual SOA species in the Central Valley under California's environment showed that the total SOA mass was predominated by daytime oxidation of long-chain alkanes ranging from C9 to C24 and nighttime terpene oxidation with ozone and nitrate radicals (Sect. 3.2). SOA growth considerably increased with the low-volatility products originating from the autoxidation of terpene and alkane oxidation products, as well as the nighttime chemistry of biogenic HCs. The prevalence of alkane and terpene SOA was the unique feature of California although their relative fractions to total OM may be switched seasonally. Unlike California, a significant SOA species in East Asia was aromatic SOA because of the high emissions of aromatic HCs as seen in the CAMx–UNIPAR simulation during the KORUS-AQ campaign (Yu et al., 2022). We also concluded that the significance of inorganic hygroscopicity on SOA formation is influenced by the major SOA species. The aerosol's hygroscopicity effect on SOA formation is particularly pronounced in the region rich in isoprene or aromatic HC. Seemingly, the sensitivity of SOA formation to inorganic aerosol hygroscopicity in California was somewhat weaker than that simulated in South Korea during the KORUS-AQ campaign. In the future, the CAMx–UNIPAR model needs to be demonstrated to predict SOA burdens in the southeastern USA, where isoprene is abundant due to its high emission from deciduous tree species (Palmer et al., 2003; Mauzerall et al., 2005) and it is humid, especially in summer.
An important feature of this study was the characterization of the influence of HC's atmospheric lifetime on the spatial distributions of each SOA species (Fig. 6). The simulated terpene SOA appeared in the region proximate to terpene emission sources because of terpene's rapid oxidation day and night. Unlike terpene, the spatial distributions of aromatic and alkane HCs, which are relatively slowly oxidized in daytime with an OH radical, were influenced by the wind direction. Both alkane SOA and aromatic SOA were high in the south of the Central Valley due to the southward wind during wintertime. The similar tendency was simulated during the KORUS-AQ campaign (Yu et al., 2022). Aromatic HC emissions are high in the industrial areas of Shandong Province in East China, and aromatic SOA was eastward along the wind direction. However, terpene SOA was almost synchronized with terpene sources, which were high from southeastern mountains in China.
Due to efforts by the government, NOx and SO2 emissions from anthropogenic sources have been gradually reduced (Winkler et al., 2018; Zheng et al., 2018; Yu et al., 2021a; Aas et al., 2019). The sensitivity of each SOA species to the NOx level can be various according to their oxidation mechanisms. For example, chamber studies showed that aromatic SOA yields increased with decreasing the NOx level within the NOx-rich region (Yang et al., 2020). A gradual increase in alkane SOA was reported in the recent chamber study by Madhu et al. (2022) with decreasing the NOx level over both NOx-rich and NOx-poor regions. The reduction of NOx in the NOx-rich region dramatically decreases nighttime biogenic SOA yields owing to the reaction of biogenic HCs with decreased nitrate radicals, but the reduced NOx increases daytime biogenic SOA yields (Han and Jang, 2023). As discussed in Sect. 3.5, the anthropogenic SOA formation can be influenced by the amount of biogenic SOA via gas–organic phase partitioning of organic products and vice versa. Hence the impact of NO2 on SOA formation can be varied with the composition of precursor HCs. The SOA mass in California urban areas possibly would decrease as NOx decreases because of the dominance of terpene SOA, which has a strongly positive correlation with NO2 as shown in Table 3. For the polluted urban area where anthropogenic SOA is dominant and NOx is rich, SOA formation can be negatively correlated with NOx.
The impact of SO2 changes on SOA formation is complicated due to the aerosol acidity and the amount of wet inorganic aerosol. The reduction of SO2 reduces the SOA formation via oligomerization of organics, which is catalyzed by aerosol acid. However, the reduced aerosol acidity with decreasing SO2 under ammonia-rich environments can increase the deposition of nitric acid forming very hygroscopic ammonium nitrate. Both ERH and DRH drop as increasing nitrate fraction in ammonium sulfate nitrate aerosol. Reduced ERH and DRH increase wettability of aerosols. Elevated ammonium nitrate mass increases partitioning of polar organics onto the wet aerosol and enhances oligomerization of reactive organic species in aqueous phase.
The possible uncertainties in the SOA simulation using the CAMx–UNIPAR model are associated with missing precursors, the classification of precursors due to uncertainties in emission data and the use of surrogates, and the mass balance between gas chemistry and the aerosol module. Numerous precursors are still missing in UNIPAR because of the lack of emission data and model parameters of HCs such as phenols, branched and cyclic alkane, and polyaromatic HCs. In order to reduce the computational time, some HC classes use a surrogate compound. For example, α-pinene was a surrogate for all terpenes and this substitution causes uncertainties in terpene SOA due to the different reactivity to oxidants, the formation of autoxidation products and SOA yields (Yu et al., 2021c). In this study, all alkanes were surrogated by linear alkanes. Overall, branched alkanes have lower SOA yields than linear alkanes at a given carbon number, whereas cyclic alkanes have higher SOA yields. Additionally, emissions of long-chain alkanes might be uncertain. The deposition flux of IVOCs, such as long alkanes, onto PM and various ground-level surfaces can increase with increasing IVOC molecular weight due to their low volatility. Hitherto, the impact of partitioning on IVOCs emissions or the dry deposition is poorly treated in the regional models. Omitting dry deposition of IVOCs could overpredict SOA production (Bessagnet et al., 2010).
Pye et al. (2023) recently developed the Community Regional Atmospheric Chemistry Multiphase Mechanism (CRACMM v1.0), which employs explicit oxidized products to improve the carbon balance between gas mechanisms and the SOA model (Pye et al., 2023). In CAMx–UNIPAR, the carbon balance between gas chemistry and the aerosol module, which is caused by consumption of carbon to form SOA, has not been addressed. Interconnecting atmospheric gas chemistry with SOA formation is essential because SOA formation is a dynamic process as a function of precursor HCs, NOx, SO2, and atmospheric oxidants. In order to expand the suitability of CAMx–UNIPAR to more field observations, emission species of precursors HCs need to be integrated with Carbon Bond 6 mechanism (CB6) (Yarwood et al., 2010), which is frequently used for HC gas oxidation.
The code to run the CAMx–UNIPAR model in this study is available upon request for appropriate purposes. The model parameters of CAMx–UNIPAR are currently being updated to include more precursors, and the user manual is in preparation. When the manual and parameters for essential precursors are ready, CAMx–UNIPAR will be freely available to the public.
Regional simulation input data are available upon request for appropriate purposes.
The supplement related to this article is available online at: https://doi.org/10.5194/acp-24-487-2024-supplement.
YJo simulated the air quality by using the CAMx–UNIPAR model for the urban environments in the Central Valley, CA. YJo and MJ interpreted the air quality simulation results. YJo, MJ, and ZY integrated the UNIPAR code and model parameters into CAMx. SH and AM produced model parameters for UNIPAR. BK and YJi provided emission and meteorological inputs for California's air quality simulation and reviewed the paper with comments. SK and JP generated emission split factors for SOA precursors.
The contact author has declared that none of the authors has any competing interests.
Publisher’s note: Copernicus Publications remains neutral with regard to jurisdictional claims made in the text, published maps, institutional affiliations, or any other geographical representation in this paper. While Copernicus Publications makes every effort to include appropriate place names, the final responsibility lies with the authors.
Emissions and meteorological inputs for the 2018 California regional modeling were provided by the Bay Area Air Quality Management District.
This research was supported by the National Institute of Environmental Research (grant no. NIER2020-01-01-010), the National Science Foundation (grant no. AGS1923651), and the National Research Foundation of Korea funded by the Ministry of Science and ICT (grant no. 2020M3G1A1114556).
This paper was edited by Rebecca Garland and reviewed by two anonymous referees.
Aas, W., Mortier, A., Bowersox, V., Cherian, R., Faluvegi, G., Fagerli, H., Hand, J., Klimont, Z., Galy-Lacaux, C., Lehmann, C. M. B., Myhre, C. L., Myhre, G., Olivie, D., Sato, K., Quaas, J., Rao, P. S. P., Schulz, M., Shindell, D., Skeie, R. B., Stein, A., Takemura, T., Tsyro, S., Vet, R., and Xu, X.: Global and regional trends of atmospheric sulfur, Sci. Rep.-UK, 9, 953, https://doi.org/10.1038/s41598-018-37304-0, 2019.
Aumont, B., Valorso, R., Mouchel-Vallon, C., Camredon, M., Lee-Taylor, J., and Madronich, S.: Modeling SOA formation from the oxidation of intermediate volatility n-alkanes, Atmos. Chem. Phys., 12, 7577–7589, https://doi.org/10.5194/acp-12-7577-2012, 2012.
Baker, K. R., Carlton, A. G., Kleindienst, T. E., Offenberg, J. H., Beaver, M. R., Gentner, D. R., Goldstein, A. H., Hayes, P. L., Jimenez, J. L., Gilman, J. B., de Gouw, J. A., Woody, M. C., Pye, H. O. T., Kelly, J. T., Lewandowski, M., Jaoui, M., Stevens, P. S., Brune, W. H., Lin, Y.-H., Rubitschun, C. L., and Surratt, J. D.: Gas and aerosol carbon in California: comparison of measurements and model predictions in Pasadena and Bakersfield, Atmos. Chem. Phys., 15, 5243–5258, https://doi.org/10.5194/acp-15-5243-2015, 2015.
Bates, K. H., Burke, G. J. P., Cope, J. D., and Nguyen, T. B.: Secondary organic aerosol and organic nitrogen yields from the nitrate radical (NO3) oxidation of alpha-pinene from various RO2 fates, Atmos. Chem. Phys., 22, 1467–1482, https://doi.org/10.5194/acp-22-1467-2022, 2022.
Bay Area Air Quality Management District (BAAQMD), https://www.baaqmd.gov/, last access: 2 November 2023, 2023.
Beardsley, R. L. and Jang, M.: Simulating the SOA formation of isoprene from partitioning and aerosol phase reactions in the presence of inorganics, Atmos. Chem. Phys., 16, 5993–6009, https://doi.org/10.5194/acp-16-5993-2016, 2016.
Bessagnet, B., Seigneur, C., and Menut, L.: Impact of dry deposition of semi-volatile organic compounds on secondary organic aerosols, Atmos. Environ., 44, 1781–1787, https://doi.org/10.1016/j.atmosenv.2010.01.027, 2010.
Bianchi, F., Kurten, T., Riva, M., Mohr, C., Rissanen, M., Roldin, P., Berndt, T., Crounse, J., Wennberg, P., Mentel, T., Wildt, J., Junninen, H., Jokinen, T., Kulmala, M., Worsnop, D., Thornton, J., Donahue, N., Kjaergaard, H., and Ehn, M.: Highly Oxygenated Organic Molecules (HOM) from Gas-Phase Autoxidation Involving Peroxy Radicals: A Key Contributor to Atmospheric Aerosol, Chem. Rev., 119, 3472–3509, https://doi.org/10.1021/acs.chemrev.8b00395, 2019.
Bruns, E. A., El Haddad, I., Slowik, J. G., Kilic, D., Klein, F., Baltensperger, U., and Prevot, A. S.: Identification of significant precursor gases of secondary organic aerosols from residential wood combustion, Sci. Rep.-UK, 6, 27881, https://doi.org/10.1038/srep27881, 2016.
Cao, G. and Jang, M.: An SOA Model for Toluene Oxidation in the Presence of Inorganic Aerosols, Environ. Sci. Technol., 44, 727–733, https://doi.org/10.1021/es901682r, 2010.
Carlton, A. G. and Baker, K. R.: Photochemical modeling of the Ozark isoprene volcano: MEGAN, BEIS, and their impacts on air quality predictions, Environ. Sci. Technol., 45, 4438–4445, https://doi.org/10.1021/es200050x, 2011.
Carter, W. P.: Development of a database for chemical mechanism assignments for volatile organic emissions, J. Air Waste Manag. Assoc., 65, 1171–1184, https://doi.org/10.1080/10962247.2015.1013646, 2015.
Chan, A. W. H., Isaacman, G., Wilson, K. R., Worton, D. R., Ruehl, C. R., Nah, T., Gentner, D. R., Dallmann, T. R., Kirchstetter, T. W., Harley, R. A., Gilman, J. B., Kuster, W. C., de Gouw, J. A., Offenberg, J. H., Kleindienst, T. E., Lin, Y. H., Rubitschun, C. L., Surratt, J. D., Hayes, P. L., Jimenez, J. L., and Goldstein, A. H.: Detailed chemical characterization of unresolved complex mixtures in atmospheric organics: Insights into emission sources, atmospheric processing, and secondary organic aerosol formation, J. Geophys. Res.-Atmos., 118, 6783–6796, https://doi.org/10.1002/jgrd.50533, 2013.
Chen, J., Yin, D., Zhao, Z., Kaduwela, A. P., Avise, J. C., DaMassa, J. A., Beyersdorf, A., Burton, S., Ferrare, R., Herman, J. R., Kim, H., Neuman, A., Nowak, J. B., Parworth, C., Scarino, A. J., Wisthaler, A., Young, D. E., and Zhang, Q.: Modeling air quality in the San Joaquin valley of California during the 2013 Discover-AQ field campaign, Atmos. Environ. X, 7, 100067, https://doi.org/10.1016/j.aeaoa.2020.100067, 2020.
Choi, J. and Jang, M.: Suppression of the phenolic SOA formation in the presence of electrolytic inorganic seed, Sci. Total Environ., 851, 158082, https://doi.org/10.1016/j.scitotenv.2022.158082, 2022.
Chowdhury, S., Pozzer, A., Haines, A., Klingmuller, K., Munzel, T., Paasonen, P., Sharma, A., Venkataraman, C., and Lelieveld, J.: Global health burden of ambient PM2.5 and the contribution of anthropogenic black carbon and organic aerosols, Environ. Int., 159, 107020, https://doi.org/10.1016/j.envint.2021.107020, 2022.
Crawford, J. H., Ahn, J. Y., Al-Saadi, J., Chang, L., Emmons, L. K., Kim, J., Lee, G., Park, J. H., Park, R. J., Woo, J. H., Song, C. K., Hong, J. H., Hong, Y. D., Lefer, B. L., Lee, M., Lee, T., Kim, S., Min, K. E., Yum, S. S., Shin, H. J., Kim, Y. W., Choi, J. S., Park, J. S., Szykman, J. J., Long, R. W., Jordan, C. E., Simpson, I. J., Fried, A., Dibb, J. E., Cho, S., and Kim, Y. P.: The Korea-United States Air Quality (KORUS-AQ) field study, Elementa 9, 1–27, https://doi.org/10.1525/elementa.2020.00163, 2021.
Crounse, J. D., Nielsen, L. B., Jørgensen, S., Kjaergaard, H. G., and Wennberg, P. O.: Autoxidation of organic compounds in the atmosphere, J. Phys. Chem. Lett., 4, 3513–3520, https://doi.org/10.1021/jz4019207, 2013.
Donahue, N. M., Robinson, A. L., Stanier, C. O., and Pandis, S. N.: Coupled Partitioning, Dilution, and Chemical Aging of Semivolatile Organics, Environ. Sci. Technol., 40, 2635–2643, https://doi.org/10.1021/es052297c, 2006.
Duncan, B. N., Yoshida, Y., Olson, J. R., Sillman, S., Martin, R. V., Lamsal, L., Hu, Y., Pickering, K. E., Retscher, C., Allen, D. J., and Crawford, J. H.: Application of OMI observations to a space-based indicator of NOx and VOC controls on surface ozone formation, Atmos. Environ., 44, 2213–2223, https://doi.org/10.1016/j.atmosenv.2010.03.010, 2010.
Ensberg, J. J., Hayes, P. L., Jimenez, J. L., Gilman, J. B., Kuster, W. C., de Gouw, J. A., Holloway, J. S., Gordon, T. D., Jathar, S., Robinson, A. L., and Seinfeld, J. H.: Emission factor ratios, SOA mass yields, and the impact of vehicular emissions on SOA formation, Atmos. Chem. Phys., 14, 2383–2397, https://doi.org/10.5194/acp-14-2383-2014, 2014.
Environ, R.: User’s Guide Comprehensive Air Quality Model with Extensions version 7.10, https://camx-wp.azurewebsites.net/Files/CAMxUsersGuide_v7.10.pdf (last access: 18 December 2023), 2020.
Fountoukis, C. and Nenes, A.: ISORROPIA II: a computationally efficient thermodynamic equilibrium model for aerosols, Atmos. Chem. Phys., 7, 4639–4659, https://doi.org/10.5194/acp-7-4639-2007, 2007.
Galeazzo, T., Valorso, R., Li, Y., Camredon, M., Aumont, B., and Shiraiwa, M.: Estimation of secondary organic aerosol viscosity from explicit modeling of gas-phase oxidation of isoprene and α-pinene, Atmos. Chem. Phys., 21, 10199–10213, https://doi.org/10.5194/acp-21-10199-2021, 2021.
Gao, S., Lathem, T., and Nyadong, L.: Nighttime secondary organic aerosol formation from unburned fuel vapors, Atmos. Environ., 204, 125–134, https://doi.org/10.1016/j.atmosenv.2019.02.028, 2019.
Gentner, D. R., Jathar, S. H., Gordon, T. D., Bahreini, R., Day, D. A., El Haddad, I., Hayes, P. L., Pieber, S. M., Platt, S. M., de Gouw, J., Goldstein, A. H., Harley, R. A., Jimenez, J. L., Prevot, A. S., and Robinson, A. L.: Review of Urban Secondary Organic Aerosol Formation from Gasoline and Diesel Motor Vehicle Emissions, Environ. Sci. Technol., 51, 1074–1093, https://doi.org/10.1021/acs.est.6b04509, 2017.
Hallquist, M., Wenger, J. C., Baltensperger, U., Rudich, Y., Simpson, D., Claeys, M., Dommen, J., Donahue, N. M., George, C., Goldstein, A. H., Hamilton, J. F., Herrmann, H., Hoffmann, T., Iinuma, Y., Jang, M., Jenkin, M. E., Jimenez, J. L., Kiendler-Scharr, A., Maenhaut, W., McFiggans, G., Mentel, Th. F., Monod, A., Prévôt, A. S. H., Seinfeld, J. H., Surratt, J. D., Szmigielski, R., and Wildt, J.: The formation, properties and impact of secondary organic aerosol: current and emerging issues, Atmos. Chem. Phys., 9, 5155–5236, https://doi.org/10.5194/acp-9-5155-2009, 2009.
Han, S. and Jang, M.: Simulating the impact of gas-wall partitioning on SOA formation using the explicit gas mechanism integrated with aqueous reactions containing electrolytes, Sci. Total Environ., 748, 141360, https://doi.org/10.1016/j.scitotenv.2020.141360, 2020.
Han, S. and Jang, M.: Prediction of secondary organic aerosol from the multiphase reaction of gasoline vapor by using volatility–reactivity base lumping, Atmos. Chem. Phys., 22, 625–639, https://doi.org/10.5194/acp-22-625-2022, 2022.
Han, S. and Jang, M.: Modeling daytime and nighttime secondary organic aerosol formation via multiphase reactions of biogenic hydrocarbons, Atmos. Chem. Phys., 23, 1209–1226, https://doi.org/10.5194/acp-23-1209-2023, 2023.
Hasan, G., Valiev, R. R., Salo, V.-T., and Kurtén, T.: Computational Investigation of the Formation of Peroxide (ROOR) Accretion Products in the OH-and NO3-Initiated Oxidation of α-Pinene, J. Phys. Chem. A, 125, 10632–10639, https://doi.org/10.1021/acs.jpca.1c08969, 2021.
Hayes, P. L., Ortega, A. M., Cubison, M. J., Froyd, K. D., Zhao, Y., Cliff, S. S., Hu, W. W., Toohey, D. W., Flynn, J. H., Lefer, B. L., Grossberg, N., Alvarez, S., Rappenglück, B., Taylor, J. W., Allan, J. D., Holloway, J. S., Gilman, J. B., Kuster, W. C., de Gouw, J. A., Massoli, P., Zhang, X., Liu, J., Weber, R. J., Corrigan, A. L., Russell, L. M., Isaacman, G., Worton, D. R., Kreisberg, N. M., Goldstein, A. H., Thalman, R., Waxman, E. M., Volkamer, R., Lin, Y. H., Surratt, J. D., Kleindienst, T. E., Offenberg, J. H., Dusanter, S., Griffith, S., Stevens, P. S., Brioude, J., Angevine, W. M., and Jimenez, J. L.: Organic aerosol composition and sources in Pasadena, California, during the 2010 CalNex campaign, J. Geophys. Res.-Atmos., 118, 9233–9257, https://doi.org/10.1002/jgrd.50530, 2013.
Herner, J. D., Aw, J., Gao, O., Chang, D. P., and Kleeman, M. J.: Size and composition distribution of airborne particulate matter in northern California: I – particulate mass, carbon, and water-soluble ions, J. Air Waste Manag. Assoc., 55, 30–51, https://doi.org/10.1080/10473289.2005.10464600, 2005.
Hodan, W. M. and Barnard, W. R.: Evaluating the Contribution of PM2.5 Precursor Gases and Re-entrained Road Emissions to Mobile Source PM2.5 Particulate Matter Emissions, https://api.semanticscholar.org/CorpusID:28139041 (last access: 18 December 2023), 2004.
Hodzic, A., Madronich, S., Kasibhatla, P. S., Tyndall, G., Aumont, B., Jimenez, J. L., Lee-Taylor, J., and Orlando, J.: Organic photolysis reactions in tropospheric aerosols: effect on secondary organic aerosol formation and lifetime, Atmos. Chem. Phys., 15, 9253–9269, https://doi.org/10.5194/acp-15-9253-2015, 2015.
Hoque, H. M. S., Sudo, K., Irie, H., Damiani, A., Naja, M., and Fatmi, A. M.: Multi-axis differential optical absorption spectroscopy (MAX-DOAS) observations of formaldehyde and nitrogen dioxide at three sites in Asia and comparison with the global chemistry transport model CHASER, Atmos. Chem. Phys., 22, 12559–12589, https://doi.org/10.5194/acp-22-12559-2022, 2022.
Hutzell, W. T., Luecken, D. J., Appel, K. W., and Carter, W. P. L.: Interpreting predictions from the SAPRC07 mechanism based on regional and continental simulations, Atmos. Environ., 46, 417–429, https://doi.org/10.1016/j.atmosenv.2011.09.030, 2012.
Im, Y., Jang, M., and Beardsley, R. L.: Simulation of aromatic SOA formation using the lumping model integrated with explicit gas-phase kinetic mechanisms and aerosol-phase reactions, Atmos. Chem. Phys., 14, 4013–4027, https://doi.org/10.5194/acp-14-4013-2014, 2014.
Jang, M., Czoschke, N. M., Lee, S., and Kamens, R. M.: Heterogeneous Atmospheric Aerosol Production by Acid-Catalyzed Particle-Phase Reactions, Science, 298, 814–817, https://doi.org/10.1126/science.1075798, 2002.
Jenkin, M. E.: Modelling the formation and composition of secondary organic aerosol from α- and β-pinene ozonolysis using MCM v3, Atmos. Chem. Phys., 4, 1741–1757, https://doi.org/10.5194/acp-4-1741-2004, 2004.
Jokinen, T., Berndt, T., Makkonen, R., Kerminen, V. M., Junninen, H., Paasonen, P., Stratmann, F., Herrmann, H., Guenther, A. B., Worsnop, D. R., Kulmala, M., Ehn, M., and Sipila, M.: Production of extremely low volatile organic compounds from biogenic emissions: Measured yields and atmospheric implications, P. Natl. Acad. Sci. USA, 112, 7123–7128, https://doi.org/10.1073/pnas.1423977112, 2015.
Kalberer, M., Paulsen, D., Sax, M., Steinbacher, M., Dommen, J., Prevot, A. S., Fisseha, R., Weingartner, E., Frankevich, V., Zenobi, R., and Baltensperger, U.: Identification of Polymers as Major Components of Atmospheric Organic Aerosols, Science, 303, 1659–1662, https://doi.org/10.1126/science.1092185, 2004.
Li, J., Jang, M., and Beardsley, R.: Dialkylsulfate Formation in Sulfuric Acid Seeded Secondary Organic Aerosol Produced Using an Outdoor Chamber Under Natural Sunlight, Environ. Chem., 13, 590–601, https://doi.org/10.1071/EN15129, 2015.
Li, J., Li, K., Li, H., Wang, X., Wang, W., Wang, K., and Ge, M.: Long-chain alkanes in the atmosphere: A review, J. Environ. Sci., 114, 37–52, https://doi.org/10.1016/j.jes.2021.07.021, 2022.
Li, Y. J., Chen, Q., Guzman, M. I., Chan, C. K., and Martin, S. T.: Second-generation products contribute substantially to the particle-phase organic material produced by β-caryophyllene ozonolysis, Atmos. Chem. Phys., 11, 121–132, https://doi.org/10.5194/acp-11-121-2011, 2011.
Liggio, J., Li, S.-M., and McLaren, R.: Heterogeneous Reactions of Glyoxal on Particulate Matter: Identification of Acetals and Sulfate Esters, Environ. Sci. Technol., 39, 1532–1541, https://doi.org/10.1021/es048375y, 2005.
Lim, Y. B. and Ziemann, P. J.: Chemistry of Secondary Organic Aerosol Formation from OH Radical-Initiated Reactions of Linear, Branched, and Cyclic Alkanes in the Presence of NOx, Aerosol Sci. Tech., 43, 604–619, https://doi.org/10.1080/02786820902802567, 2009.
Lim, Y. B., Tan, Y., Perri, M. J., Seitzinger, S. P., and Turpin, B. J.: Aqueous chemistry and its role in secondary organic aerosol (SOA) formation, Atmos. Chem. Phys., 10, 10521–10539, https://doi.org/10.5194/acp-10-10521-2010, 2010.
Liu, L., Kuang, Y., Zhai, M., Xue, B., He, Y., Tao, J., Luo, B., Xu, W., Tao, J., Yin, C., Li, F., Xu, H., Deng, T., Deng, X., Tan, H., and Shao, M.: Strong light scattering of highly oxygenated organic aerosols impacts significantly on visibility degradation, Atmos. Chem. Phys., 22, 7713–7726, https://doi.org/10.5194/acp-22-7713-2022, 2022.
Liu, Y., Dong, X., Wang, M., Emmons, L. K., Liu, Y., Liang, Y., Li, X., and Shrivastava, M.: Analysis of secondary organic aerosol simulation bias in the Community Earth System Model (CESM2.1), Atmos. Chem. Phys., 21, 8003–8021, https://doi.org/10.5194/acp-21-8003-2021, 2021.
Liu, Y., Siekmann, F., Renard, P., El Zein, A., Salque, G., El Haddad, I., Temime-Roussel, B., Voisin, D., Thissen, R., and Monod, A.: Oligomer and SOA formation through aqueous phase photooxidation of methacrolein and methyl vinyl ketone, Atmos. Environ., 49, 123–129, https://doi.org/10.1016/j.atmosenv.2011.12.012, 2012.
Lurmann, F. W., Brown, S. G., McCarthy, M. C., and Roberts, P. T.: Processes influencing secondary aerosol formation in the San Joaquin Valley during winter, J. Air Waste Manag. Assoc., 56, 1679–1693, https://doi.org/10.1080/10473289.2006.10464573, 2006.
Madhu, A., Jang, M., and Deacon, D.: Modeling the Influence of Chain Length on SOA Formation via Multiphase Reactions of Alkanes, EGUsphere [preprint], https://doi.org/10.5194/egusphere-2022-681, 2022.
Madhu, A., Jang, M., and Jo, Y.: Modeling the influence of carbon branching structure on SOA formation via multiphase reactions of alkanes, EGUsphere [preprint], https://doi.org/10.5194/egusphere-2023-1500, 2023.
Mahrt, F., Peng, L., Zaks, J., Huang, Y., Ohno, P. E., Smith, N. R., Gregson, F. K. A., Qin, Y., Faiola, C. L., Martin, S. T., Nizkorodov, S. A., Ammann, M., and Bertram, A. K.: Not all types of secondary organic aerosol mix: two phases observed when mixing different secondary organic aerosol types, Atmos. Chem. Phys., 22, 13783–13796, https://doi.org/10.5194/acp-22-13783-2022, 2022.
Majdi, M., Sartelet, K., Lanzafame, G. M., Couvidat, F., Kim, Y., Chrit, M., and Turquety, S.: Precursors and formation of secondary organic aerosols from wildfires in the Euro-Mediterranean region, Atmos. Chem. Phys., 19, 5543–5569, https://doi.org/10.5194/acp-19-5543-2019, 2019.
Mauzerall, D., Sultan, B., Kim, N., and Bradford, D.: Charging NOx Emitters for Health Damages: An Exploratory Analysis, Available at SSRN: https://doi.org/10.2139/ssrn.706782 (last access: 18 December 2023), 2005.
Mayorga, R., Xia, Y., Zhao, Z., Long, B., and Zhang, H.: Peroxy Radical Autoxidation and Sequential Oxidation in Organic Nitrate Formation during Limonene Nighttime Oxidation, Environ. Sci. Technol., 56, 15337–15346, https://doi.org/10.1021/acs.est.2c04030, 2022.
McDonald, B. C., Goldstein, A. H., and Harley, R. A.: Long-term trends in California mobile source emissions and ambient concentrations of black carbon and organic aerosol, Environ. Sci. Technol., 49, 5178–5188, https://doi.org/10.1021/es505912b, 2015.
McDonald, B. C., de Gouw, J. A., Gilman, J. B., Jathar, S. H., Akherati, A., Cappa, C. D., Jimenez, J. L., Lee-Taylor, J., Hayes, P. L., McKeen, S. A., Cui, Y. Y., Kim, S. W., Gentner, D. R., Isaacman-VanWertz, G., Goldstein, A. H., Harley, R. A., Frost, G. J., Roberts, J. M., Ryerson, T. B., and Trainer, M.: Volatile chemical products emerging as largest petrochemical source of urban organic emissions, Science, 359, 760–764, https://doi.org/10.1126/science.aaq0524, 2018.
McNeill, V. F.: Aqueous organic chemistry in the atmosphere: sources and chemical processing of organic aerosols, Environ. Sci. Technol., 49, 1237–1244, https://doi.org/10.1021/es5043707, 2015.
Molteni, U., Simon, M., Heinritzi, M., Hoyle, C. R., Bernhammer, A.-K., Bianchi, F., Breitenlechner, M., Brilke, S., Dias, A., Duplissy, J., Frege, C., Gordon, H., Heyn, C., Jokinen, T., Kürten, A., Lehtipalo, K., Makhmutov, V., Petäjä, T., Pieber, S. M., Praplan, A. P., Schobesberger, S., Steiner, G., Stozhkov, Y., Tomé, A., Tröstl, J., Wagner, A. C., Wagner, R., Williamson, C., Yan, C., Baltensperger, U., Curtius, J., Donahue, N. M., Hansel, A., Kirkby, J., Kulmala, M., Worsnop, D. R., and Dommen, J.: Formation of Highly Oxygenated Organic Molecules from α-Pinene Ozonolysis: Chemical Characteristics, Mechanism, and Kinetic Model Development, ACS Earth Space Chem., 3, 873–883, https://doi.org/10.1021/acsearthspacechem.9b00035, 2019.
Odum, J. R., Hoffmann, T., Bowman, R., Collins, D., Flagan, R. C., and Seinfeld, J. H.: Gas/Particle Partitioning and Secondary Organic Aerosol Yields, Environ. Sci. Technol., 30, 8, 2580–2585, https://doi.org/10.1021/es950943+, 1996.
Palmer, P. I., Jacob, D. J., Fiore, A. M., Martin, R. V., Chance, K., and Kurosu, T. P.: Mapping isoprene emissions over North America using formaldehyde column observations from space, J. Geophys. Res.-Atmos., 108, D6, 4180, https://doi.org/10.1029/2002JD002153, 2003.
Pankow, J. F.: An Absorption Model of the Gas/Aerosol Partitioning Involved in the Formation of Secondary Oorganic Aerosol, Atmos. Environ., 28, 189–193, https://doi.org/10.1016/1352-2310(94)90094-9, 1994.
Prabhakar, G., Parworth, C. L., Zhang, X., Kim, H., Young, D. E., Beyersdorf, A. J., Ziemba, L. D., Nowak, J. B., Bertram, T. H., Faloona, I. C., Zhang, Q., and Cappa, C. D.: Observational assessment of the role of nocturnal residual-layer chemistry in determining daytime surface particulate nitrate concentrations, Atmos. Chem. Phys., 17, 14747–14770, https://doi.org/10.5194/acp-17-14747-2017, 2017.
Presto, A. A., Hartz, K. E. H., and Donahue, N. M.: Secondary organic aerosol production from terpene ozonolysis, 2. Effect of NOx concentration, Environ. Sci. Technol., 39, 7046–7054, https://doi.org/10.1021/es050400s, 2005.
Presto, A. A., Miracolo, M. A., Donahue, N. M., and Robinson, A. L.: Secondary organic aerosol formation from high-NOx photo-oxidation of low volatility precursors: n-Alkanes, Environ. Sci. Technol., 44, 2029–2034, https://doi.org/10.1021/es903712r, 2010.
Pye, H. O. T and Pouliot, G. A.: Modeling the role of alkanes, polycyclic aromatic hydrocarbons, and their oligomers in secondary organic aerosol formation, Environ. Sci. Technol., 46, 6041–6047, https://doi.org/10.1021/es300409w, 2012.
Pye, H. O. T., D'Ambro, E. L., Lee, B. H., Schobesberger, S., Takeuchi, M., Zhao, Y., Lopez-Hilfiker, F., Liu, J., Shilling, J. E., Xing, J., Mathur, R., Middlebrook, A. M., Liao, J., Welti, A., Graus, M., Warneke, C., de Gouw, J. A., Holloway, J. S., Ryerson, T. B., Pollack, I. B., and Thornton, J. A.: Anthropogenic enhancements to production of highly oxygenated molecules from autoxidation, P. Natl. Acad. Sci. USA, 116, 6641–6646, https://doi.org/10.1073/pnas.1810774116, 2019.
Pye, H. O. T., Ward-Caviness, C. K., Murphy, B. N., Appel, K. W., and Seltzer, K. M.: Secondary organic aerosol association with cardiorespiratory disease mortality in the United States, Nat. Commun., 12, 7215, https://doi.org/10.1038/s41467-021-27484-1, 2021.
Pye, H. O. T., Place, B. K., Murphy, B. N., Seltzer, K. M., D'Ambro, E. L., Allen, C., Piletic, I. R., Farrell, S., Schwantes, R. H., Coggon, M. M., Saunders, E., Xu, L., Sarwar, G., Hutzell, W. T., Foley, K. M., Pouliot, G., Bash, J., and Stockwell, W. R.: Linking gas, particulate, and toxic endpoints to air emissions in the Community Regional Atmospheric Chemistry Multiphase Mechanism (CRACMM), Atmos. Chem. Phys., 23, 5043–5099, https://doi.org/10.5194/acp-23-5043-2023, 2023.
Riva, M., Robinson, E. S., Perraudin, E., Donahue, N. M., and Villenave, E.: Photochemical aging of secondary organic aerosols generated from the photooxidation of polycyclic aromatic hydrocarbons in the gas-phase, Environ. Sci. Technol., 49, 5407–5416, https://doi.org/10.1021/acs.est.5b00442, 2015.
Roldin, P., Ehn, M., Kurtén, T., Olenius, T., Rissanen, M. P., Sarnela, N., Elm, J., Rantala, P., Hao, L., and Hyttinen, N.: The role of highly oxygenated organic molecules in the Boreal aerosol-cloud-climate system, Nat. Commun., 10, 4370, https://doi.org/10.1038/s41467-019-12338-8, 2019.
Schell, B., Ackermann, I. J., Hass, H., Binkowski, F. S., and Ebel, A.: Modeling the formation of secondary organic aerosol within a comprehensive air quality model system, J. Geophys. Res.-Atmos., 106, 28275–28293, https://doi.org/10.1029/2001jd000384, 2001.
Simoneit, B. R. T.: Biomass burning – a review of organic tracers for smoke from incomplete conbustion, Appl. Geochem., 17, 129–162, https://doi.org/10.1016/S0883-2927(01)00061-0, 2002.
Solomon, P. A., Crumpler, D., Flanagan, J. B., Jayanty, R. K., Rickman, E. E., and McDade, C. E.: U.S. national P2.5 Chemical Speciation Monitoring Networks-CSN and IMPROVE: description of networks, J. Air Waste Manag. Assoc., 64, 1410–1438, https://doi.org/10.1080/10962247.2014.956904, 2014.
Song, M., Liu, P. F., Hanna, S. J., Li, Y. J., Martin, S. T., and Bertram, A. K.: Relative humidity-dependent viscosities of isoprene-derived secondary organic material and atmospheric implications for isoprene-dominant forests, Atmos. Chem. Phys., 15, 5145–5159, https://doi.org/10.5194/acp-15-5145-2015, 2015.
Srivastava, D., Vu, T. V., Tong, S., Shi, Z., and Harrison, R. M.: Formation of secondary organic aerosols from anthropogenic precursors in laboratory studies, npj Clim. Atmos. Sci., 5, 4180, https://doi.org/10.1038/s41612-022-00238-6, 2022.
Strader, R., Lurmann, F., and Pandis, S. N.: Evaluation of secondary organic aerosol formation in winter, Atmos. Environ., 33, 4849–4863, https://doi.org/10.1016/S1352-2310(99)00310-6, 1999.
Sun, P., Farley, R. N., Li, L., Srivastava, D., Niedek, C. R., Li, J., Wang, N., Cappa, C. D., Pusede, S. E., Yu, Z., Croteau, P., and Zhang, Q.: P2.5 composition and sources in the San Joaquin Valley of California: A long-term study using ToF-ACSM with the capture vaporizer, Environ. Pollut., 292, 118254, https://doi.org/10.1016/j.envpol.2021.118254, 2022.
Surratt, J. D., Kroll, J. H., Kleindienst, T. E., Edney, E. O., Claeys, M., Sorooshian, A., Ng, N. L., Offenberg, J. H., Lewandowski, M., Jaoui, M., Flagan, R. C., and Seinfeld, J. H.: Evidence for Organosulfates in Secondary Organic Aerosol, Environ. Sci. Technol., 41, 517–527, https://doi.org/10.1021/es062081q, 2007.
Tkacik, D. S., Presto, A. A., Donahue, N. M., and Robinson, A. L.: Secondary organic aerosol formation from intermediate-volatility organic compounds: cyclic, linear, and branched alkanes, Environ. Sci. Technol., 46, 8773–8781, https://doi.org/10.1021/es301112c, 2012.
Tolocka, M. P., Jang, M., Ginter, J. M., Cox, F. J., Kanmens, R. M., and Johnston, M. V.: Formation of Oligomers in Secondary Organic Aerosol, Environ. Sci. Technol., 38, 1428–1434, https://doi.org/10.1021/es035030r 2004.
Turpin, B. J. and Huntzicker, J. J.: Identification of secondary organic aerosol episodes and quantification of primary and secondary organic aerosol concentration during SCAQS, Atmos. Environ., 29, 3527–3544, https://doi.org/10.1016/1352-2310(94)00276-Q, 1995.
Vasilakos, P., Hu, Y., Russell, A., and Nenes, A.: Determining the Role of Acidity, Fate and Formation of IEPOX-Derived SOA in CMAQ, Atmosphere, 12, 707, https://doi.org/10.3390/atmos12060707, 2021.
Volkamer, R., Ziemann, P. J., and Molina, M. J.: Secondary Organic Aerosol Formation from Acetylene (C2H2): seed effect on SOA yields due to organic photochemistry in the aerosol aqueous phase, Atmos. Chem. Phys., 9, 1907–1928, https://doi.org/10.5194/acp-9-1907-2009, 2009.
Wang, X., Gemayel, R., Baboomian, V. J., Li, K., Boreave, A., Dubois, C., Tomaz, S., Perrier, S., Nizkorodov, S. A., and George, C.: Naphthalene-Derived Secondary Organic Aerosols Interfacial Photosensitizing Properties, Geophys. Res. Lett., 48, e2021GL093465, https://doi.org/10.1029/2021gl093465, 2021.
Winkler, S. L., Anderson, J. E., Garza, L., Ruona, W. C., Vogt, R., and Wallington, T. J.: Vehicle criteria pollutant (PM, NOx, CO, HCs) emissions: how low should we go?, npj Clim. Atmos. Sci., 1, 26, https://doi.org/10.1038/s41612-018-0037-5, 2018.
Xavier, C., Rusanen, A., Zhou, P., Dean, C., Pichelstorfer, L., Roldin, P., and Boy, M.: Aerosol mass yields of selected biogenic volatile organic compounds – a theoretical study with nearly explicit gas-phase chemistry, Atmos. Chem. Phys., 19, 13741–13758, https://doi.org/10.5194/acp-19-13741-2019, 2019.
Yang, Z., Tsona, N. T., Li, J., Wang, S., Xu, L., You, B., and Du, L.: Effects of NOx and SO2 on the secondary organic aerosol formation from the photooxidation of 1,3,5-trimethylbenzene: A new source of organosulfates, Environ. Pollut., 264, 114742, https://doi.org/10.1016/j.envpol.2020.114742, 2020.
Yao, L., Li, X.-R., Guo, X.-Q., Liu, X.-R., and Wang, Y.-S.: Pollution characteristics of n-alkanes in atmospheric fine particles during Spring Festival of 2007 in Beijing, Huanjing Kexue/Environmental, Science, 30, 589–593, 2009.
Yarwood, G., Jung, J., Whitten, G. Z., Heo, G., Mellberg, J., and Estes, M.: Updates to the Carbon Bond Mechanism for Version 6 (CB6), 9th Annual CMAS Conference, Chapel Hill, NC, 11–13 October 2010, https://www.cmascenter.org/conference/2010/abstracts/emery_updates_carbon_2010.pdf (last access: 18 December 2023), 2010.
Young, D. E., Kim, H., Parworth, C., Zhou, S., Zhang, X., Cappa, C. D., Seco, R., Kim, S., and Zhang, Q.: Influences of emission sources and meteorology on aerosol chemistry in a polluted urban environment: results from DISCOVER-AQ California, Atmos. Chem. Phys., 16, 5427–5451, https://doi.org/10.5194/acp-16-5427-2016, 2016.
Yu, K. A., McDonald, B. C., and Harley, R. A.: Evaluation of Nitrogen Oxide Emission Inventories and Trends for On-Road Gasoline and Diesel Vehicles, Environ. Sci. Technol., 55, 6655–6664, https://doi.org/10.1021/acs.est.1c00586, 2021a.
Yu, Z., Jang, M., and Madhu, A.: Prediction of Phase State of Secondary Organic Aerosol Internally Mixed with Aqueous Inorganic Salts, J. Phys. Chem. A, 125, 10198–10206, https://doi.org/10198-10206, 2021b.
Yu, Z., Jang, M., Zhang, T., Madhu, A., and Han, S.: Simulation of Monoterpene SOA Formation by Multiphase Reactions Using Explicit Mechanisms, ACS Earth Space Chem., 5, 1455–1467, https://doi.org/10.1021/acsearthspacechem.1c00056, 2021c.
Yu, Z., Jang, M., Kim, S., Son, K., Han, S., Madhu, A., and Park, J.: Secondary organic aerosol formation via multiphase reaction of hydrocarbons in urban atmospheres using CAMx integrated with the UNIPAR model, Atmos. Chem. Phys., 22, 9083–9098, https://doi.org/10.5194/acp-22-9083-2022, 2022.
Zaveri, R. A., Shilling, J. E., Fast, J. D., and Springston, S. R.: Efficient Nighttime Biogenic SOA Formation in a Polluted Residual Layer, J. Geophys. Res.-Atmos., 125, e2019JD031583, https://doi.org/10.1029/2019jd031583, 2020.
Zhang, H. and Ying, Q.: Secondary organic aerosol from polycyclic aromatic hydrocarbons in Southeast Texas, Atmos. Environ., 55, 279–287, https://doi.org/10.1016/j.atmosenv.2012.03.043, 2012.
Zhang, H., Yee, L. D., Lee, B. H., Curtis, M. P., Worton, D. R., Isaacman-VanWertz, G., Offenberg, J. H., Lewandowski, M., Kleindienst, T. E., Beaver, M. R., Holder, A. L., Lonneman, W. A., Docherty, K. S., Jaoui, M., Pye, H. O. T., Hu, W., Day, D. A., Campuzano-Jost, P., Jimenez, J. L., Guo, H., Weber, R. J., de Gouw, J., Koss, A. R., Edgerton, E. S., Brune, W., Mohr, C., Lopez-Hilfiker, F. D., Lutz, A., Kreisberg, N. M., Spielman, S. R., Hering, S. V., Wilson, K. R., Thornton, J. A., and Goldstein, A. H.: Monoterpenes are the largest source of summertime organic aerosol in the southeastern United States, P. Natl. Acad. Sci. USA, 115, 2038–2043, https://doi.org/10.1073/pnas.1717513115, 2018.
Zhang, J., He, X., Gao, Y., Zhu, S., Jing, S., Wang, H., Yu, J. Z., and Ying, Q.: Assessing Regional Model Predictions of Wintertime SOA from Aromatic Compounds and Monoterpenes with Precursor-specific Tracers, Aerosol Air Qual. Res., 21, 210233, https://doi.org/10.4209/aaqr.210233, 2021.
Zhang, X., McVay, R. C., Huang, D. D., Dalleska, N. F., Aumont, B., Flagan, R. C., and Seinfeld, J. H.: Formation and evolution of molecular products in alpha-pinene secondary organic aerosol, P. Natl. Acad. Sci. USA, 112, 14168–14173, https://doi.org/10.1073/pnas.1517742112, 2015.
Zhao, D., Pullinen, I., Fuchs, H., Schrade, S., Wu, R., Acir, I.-H., Tillmann, R., Rohrer, F., Wildt, J., Guo, Y., Kiendler-Scharr, A., Wahner, A., Kang, S., Vereecken, L., and Mentel, T. F.: Highly oxygenated organic molecule (HOM) formation in the isoprene oxidation by NO3 radical, Atmos. Chem. Phys., 21, 9681–9704, https://doi.org/10.5194/acp-21-9681-2021, 2021.
Zheng, B., Tong, D., Li, M., Liu, F., Hong, C., Geng, G., Li, H., Li, X., Peng, L., Qi, J., Yan, L., Zhang, Y., Zhao, H., Zheng, Y., He, K., and Zhang, Q.: Trends in China's anthropogenic emissions since 2010 as the consequence of clean air actions, Atmos. Chem. Phys., 18, 14095–14111, https://doi.org/10.5194/acp-18-14095-2018, 2018.
Zhou, C., Jang, M., and Yu, Z.: Simulation of SOA formation from the photooxidation of monoalkylbenzenes in the presence of aqueous aerosols containing electrolytes under various NOx levels, Atmos. Chem. Phys., 19, 5719–5735, https://doi.org/10.5194/acp-19-5719-2019, 2019.