the Creative Commons Attribution 4.0 License.
the Creative Commons Attribution 4.0 License.
 | 23 Apr 2024
Extreme ozone episodes in a major Mediterranean urban area
Jordi Massagué
Eduardo Torre-Pascual
Cristina Carnerero
Miguel Escudero
Andrés Alastuey
Marco Pandolfi
Xavier Querol
Gotzon Gangoiti
This study analyses three extreme ozone (O3) episodes that occurred in Barcelona (NE Spain) during the summers of 2015, 2018, and 2019. These episodes exceeded the EU's hourly information threshold (180 µg m−3) for the first time since at least the year 2000, raising concerns due to Barcelona's large population. By employing experimental data and various modelling tools, our main objective is to elucidate the underlying phenomena of these recent O3 episodes and improve predictive capabilities. The findings indicate that the factors contributing to these occurrences are largely consistent across episodes. These factors, with estimated O3 contributions specified for particular instances, comprise (i) initial O3 accumulation in surrounding coastal areas; (ii) weekend occurrence, accompanied by the corresponding weekend effect (+15 µg m−3); and (iii) the prevalence of Tramontana meteorological conditions during above-normal temperatures, which (iv) force the convergence of multiregional polluted air masses to the city (+45–65 µg m−3). Major source areas include regions of southern France through the Gulf of Lion, the interior of the Mediterranean, and eastern Spanish coastal regions, including Barcelona's pollution plume. Some of these factors, which may manifest in the days preceding the episodes, are observable or can be anticipated. This study enhances understanding of the mechanisms driving extreme O3 episodes recently observed in Barcelona and provides valuable insights for prediction.
- Article
(13034 KB) - Full-text XML
-
Supplement
(8618 KB) - BibTeX
- EndNote


Tropospheric ozone (O3) is a strong oxidising secondary atmospheric pollutant adversely affecting human health, ecosystems, and materials (WHO, 2021; GBD, 2016; Fowler et al., 2009; IPCC, 2021). The formation of O3 depends primarily on complex photochemical reactions between precursors (mainly nitrogen oxides (NOx) and non-methane volatile organic compounds (VOCs)) in the presence of sunlight. The ratio considerably influences O3 formation. Urban areas, with high NOx levels, typically experience VOC-limited O3 production (Sillman, 1999; Sillman and He, 2002), leading to the “weekend effect” – higher O3 concentrations on non-working days predominantly due to reduced emissions of O3-depleting pollutants (Heuss et al., 2003; Jiménez et al., 2005). Conversely, suburban and rural environments, with low levels, typically exhibit NOx-limited O3 formation. The production of O3 is enhanced by high solar radiation and temperatures and low relative humidity (Monks et al., 2015), which contributes to extreme O3 events. These events have been linked to heatwaves and increased mortality globally (e.g. Vautard et al., 2007; Guo et al., 2017; Pu et al., 2017; Jaen et al., 2021).
Southern Europe, particularly the Mediterranean region, faces substantial O3 pollution (EEA, 2020). In the western Mediterranean Basin (WMB), many factors influence high O3 concentrations (e.g. Millán et al., 1997, 2000; Gangoiti et al., 2001; Millán, 2014): meteorological-, climatic-, and topographic-specific patterns, high biogenic emissions during hot seasons (Seco et al., 2011); recurrent mesoscale circulations during summer (Castell et al., 2008; Diéguez et al., 2009, 2014); regional and hemispheric O3 transport (Pay et al., 2019); high emissions of precursors in specific atmospheric basins (Querol et al., 2017, 2018; Escudero et al., 2019); and stratospheric intrusions (Kalabokas et al., 2017). The causes of air quality (AQ) standard exceedances can vary considerably, even within a given basin, as O3 contributions to surface concentrations can vary widely in time and space. Therefore, O3 concentrations can result from (i) local formation from precursors emitted in the atmospheric basin, which can be favoured by complex vertical recirculation of air masses; (ii) regional transport from other air basins and other parts of Europe; (iii) hemispheric transport; or (iv) stratospheric intrusions. Concentrations of O3 in Barcelona (NE Spain) are not particularly higher than in other regions of the country (Querol et al., 2016; Massagué et al., 2023), likely owing to strong O3 titration and ozonolysis (Monks et al., 2015), which results in infrequent exceedances of the legal thresholds set by the European AQ Directive (2008/50/EC; EC, 2008). However, exceedances of the hourly Information Threshold (IT; O3 concentration > 180 µg m−3) were detected in 2015, 2018, and 2019 (Gencat, 2022), representing the only instances of such occurrences since at least the year 2000. These events exposed a large population segment to exceptionally high O3 concentrations, which is particularly concerning, as Barcelona is Spain's second most populous urban area.
This study aims to identify the underlying factors contributing to recent episodes of extreme O3 concentrations in Barcelona by investigating the meteorological, transport, and formation mechanisms associated with these occurrences. Additionally, it aims to gain novel insights to advance future event prediction. The study is structured as follows: Sect. 2 outlines the methodology. Section 3 is subdivided into three parts (Sect. 3.2, 3.3, and 3.4), where each episode is systematically analysed and adheres to the same order: discussion of the meteorological context, surface observations, and trajectory and photochemical simulations. The final section presents a joint analysis of the episodes, including estimations of O3 contributions and drawing conclusions from the combined findings.
To comprehensively analyse the episodes, we propose a combined methodology that integrates multiple approaches and datasets, including ground-based and satellite observational data, meteorological reanalyses, high-resolution backward and forward trajectory simulations, and photochemical modelling.
2.1 Study area
This study is focused on Barcelona, Spain's second most populous municipality, located on the NE coast of the Iberian Peninsula (IP), with 1.6 million inhabitants within the city limits and up to 5.2 million people in neighbouring urban areas (MITMA, 2021). Barcelona is located on a 170 km2 coastal plain bordered by the Mediterranean to the east, with the Collserola mountain range (up to 516 m a.s.l. (above sea level) to the NW, and two river mouths to the north and SW (Besòs and Llobregat, Fig. 1b). The intricate topography of the region, coupled with the prevailing summer conditions in the IP, influences local airflow patterns (Toll and Baldasano, 2000) and facilitates mesoscale circulations, including the northward channelling of sea/mountain breezes towards the Pyrenees (e.g. Barros et al., 2003; Pérez et al., 2004; Diéguez et al., 2009).
Barcelona and its surrounding metropolitan area (BMA) has significant sources of NOx and VOC emissions from road traffic, industry, shipping activities, and domestic sources. In summer, air masses loaded with O3 and its precursors are transported inland and, combined with high biogenic VOC emissions from nearby forested areas, may cause severe O3 episodes in downwind areas (e.g. Toll and Balsano, 2000; Pérez et al., 2004; Gonçalves et al., 2009; Diéguez et al., 2009; Valverde et al., 2016; Querol et al., 2017). Diéguez et al. (2009) proposed three routes for emissions from the BMA and surrounds to reach the oriental Pyrenees (Fig. 1c): (i) the Llobregat basin (Llobregat axis), (ii) the Besòs–Ter basin (Besòs axis), and (iii) the NE axis between the coastal and pre-coastal ranges, which includes a major road with high levels of traffic emissions (AP-7 highway). Air masses can flow along these routes, with meteorological conditions favouring one over the others (Diéguez et al., 2009). These transport patterns lead to frequent exceedances of O3 thresholds at air quality monitoring stations (AQMSs) along these axes. A representative example is the Vic Plain, located in the Besòs axis, 60 km north of Barcelona, which has been a hotspot for IT exceedances in Spain (Querol et al., 2016; Massagué et al., 2023).

Figure 1(a, b, c) Area of study. Blue dots represent air quality monitoring stations (AQMSs). Only the names of the AQMSs used in the study are displayed in panel (c); others are kept for reference. Red stars indicate meteorological stations. The yellow star indicates the location of radiosounding launches. Bottom table shows the main characteristics of the AQMSs. Types are UB for urban background, UT for urban traffic, SB for suburban background, ST for suburban traffic, and RB for rural background. Meteorological stations are identified by their meteorological office's code. For Barcelona, wind data are from the Barcelona port, and temperature and relative humidity data are from the same location as the AQMS Fabra. The white shaded area depicts the municipality of Barcelona. © Google Maps 2023.
Similar to the BMA, emissions of industrial and urban pollutants from Tarragona contribute to the typical high-O3 levels in the northern and northwestern areas (Querol et al., 2016). Tarragona is located on the coast 90 km SW of Barcelona (Fig. 1b), and it is surrounded by notable chemical and petrochemical industrial complexes.
Gangoiti et al. (2001, 2006) described the recurrent warm-season weather pattern in the region, directing Mistral and Tramontana (NW and N through the Gulf of Lion) winds into the lower layers of the WMB through the Gulf of Lion. This flow has a diurnal pulsation, shifting eastward during the daytime and southward in the late evening and night due to general compensatory subsidence coinciding with sea breezes. Consequently, air masses entering through the Gulf of Lion at night can be captured by sea breezes along the eastern coast of Iberia, re-entering in the same cycles over several days.
In this context, accumulation by the vertical recirculation of air masses loaded with O3 may occur over several days, particularly during the typical summer absence of significant synoptic advection. Therefore, under persistent anticyclonic conditions, air masses can gradually accumulate O3, leading to progressively higher concentrations in the same areas on subsequent days. These situations typically end with the arrival of a frontal system, which vents out the accumulated O3 and can eventually transport prefrontal dust-loaded African air masses with different properties leading the cold front (Millán et al., 1997, 2000, 2002; Toll and Baldasano, 2000; Gangoiti et al., 2001; Gangoiti et al., 2006; Jiménez et al., 2005; Diéguez et al., 2009, 2014; Millán, 2014; Querol et al., 2017).
In the study area, these conditions can lead to either an open- or closed-circulation system (Querol et al., 2017, and references therein). Thus, the BMA can function as a significant source of O3 precursors, with downwind areas serving as receptor zones. Hence, we examined the evolution of surface O3 concentrations not only at AQMSs within the city where the episodes were recorded but also at locations along the mentioned axes and surroundings (Fig. 1c).
2.2 Observational data
We employed the following datasets:
-
Hourly O3, NO2, and NO concentrations provided by the European Environment Agency (EEA, https://www.eea.europa.eu/data-and-maps/data/aqereporting-9, last access: 16 April 2024) for all the AQMSs with available O3 measurements during the study periods in southern France and NE Spain.
-
Hourly meteorological data (temperature, relative humidity, solar radiation, and wind speed and direction) from two meteorological stations located in the study area (Fig. 1) retrieved from the Meteorological Office of Catalonia (https://analisi.transparenciacatalunya.cat/en/Medi-Ambient/Dades-meteorol-giques-de-la-XEMA/nzvn-apee, last access: 16 April 2024).
-
High-resolution vertical meteorological data (temperature, relative humidity, and wind speed and direction) from radiosoundings conducted in Barcelona at 00:00 and 12:00 UTC provided by the Faculty of Physics, University of Barcelona. We also used estimations of the mixing layer height (MLH) at 12:00 UTC using the simple parcel method (Holzworth, 1964).
-
Daily NO2 tropospheric column observations (only for the 2019 episode) obtained from the TROPOspheric Monitoring Instrument (TROPOMI), a high-resolution nadir-viewing satellite sensor aboard the ESA's Sentinel-5 Precursor (Veefkind et al., 2012). Observations at 13:30 local solar time organised as daily gridded data (5.5 × 3.5 km2 resolution) were derived from the offline operational product (Van Geffen et al., 2019) using a script in Google Earth Engine (Gorelick et al., 2017) and a quality assurance of > 0.75.
2.3 Modelling tools
We conducted high-resolution backward- and forward-trajectory simulations using the mesoscale Regional Atmospheric Modeling System (RAMS) (http://www.atmet.com/software/rams_soft.shtml, last access: 16 April 2024) and the HYbrid PArticle and Concentration Transport (HYPACT) model (http://www.atmet.com/software/hypact_soft.shtml, last access: 16 April 2024). We used three nested square domains, centred on Barcelona, with grid resolutions of 3, 12, and 48 km, extending up to 190, 1000, and 2600 km around the city, respectively. Backward trajectories ending at less than 400 m a.g.l. (above ground level) in the city were used to identify upwind sources of precursors and O3. Tracer particles emitted from a selection of these upwind sources (cities) were then used to evaluate the eventual convergence of forward trajectories into Barcelona, using a similar methodology to Gangoiti et al. (2001, 2002, 2006, 2011) and more recently In`t Veld et al. (2021). Because we used constant emission rates from all the city sources, this tool could not evaluate the real contribution of each source but instead the efficiency of the atmospheric transport into the planetary boundary layer (PBL) of Barcelona. This was conducted at an hourly resolution during the pollution episodes. The methodology is useful for identifying possible location of sources and the potential of convergence from different source regions. The PBL height (PBLH) and ground elevation influence the number of particles reaching the receptor sites and the distribution of confluent sources. Receptor sites considered in Barcelona were Ciutadella and Palau Reial, located nearly at sea level, as well as Fabra, located 400 m a.s.l. (above sea level). These locations align with the corresponding AQMSs with the same names (Fig. 1).
The PBLH was retrieved from the ERA5 reanalysis from the European Centre for Medium-Range Weather Forecasts (ECMWF), https://cds.climate.copernicus.eu/cdsapp#!/dataset/reanalysis-era5-single-levels?tab=form (last access: 16 April 2024). Data used were hourly ERA5 reanalysis at midday in the nearest grid point to the corresponding coordinates of the Palau Reial AQMS.
We also conducted photochemistry and dispersion simulations using the Comprehensive Air Quality Model with extensions (CAMx, version 6.5; Ramboll Environment and Health, 2018). We employed the gas-phase mechanism CB6r4 and used the SPECIATE tool (EPA, 2016) to speciate NOx and VOCs. For a detailed description of the model, see Torre-Pascual et al. (2024), who analysed a 2018 high-O3 episode in the Bay of Biscay a few days prior to the 2018 Barcelona episode assessed here. In our study, we used the same general model configurations described in the reference but with higher vertical resolution, 44 levels up to 6000 m a.g.l., as shown in Sect. S5 in the Supplement. Emissions were simulated using MEGAN (Model of Emissions of Gases and Aerosols from Nature) 3.0 to account for biogenic emissions and EDGAR v4.3.2 for anthropogenic emissions. The MEGAN model incorporated recently updated Spanish land use and vegetation map databases sourced from the National Forest Inventory, as demonstrated in Torre-Pascual et al. (2021). We utilised version 4.3.2 of the Emissions Database for Global Atmospheric Research (EDGAR) global anthropogenic emission inventory (Crippa et al., 2018) published in December 2017. This inventory includes anthropogenic emissions from the European and African continents within our study area. We focused on analysing the following key compounds for tropospheric O3 pollution episodes: CO, NH3, VOCs, NOx, SO2, and CH4. Emissions change significantly over time, but due to the ease of calculation, and to conduct an analysis independent of emission variations, we have utilised the emissions inventory published in the year 2017, which is valid for the monthly averages for 2010. The use of this inventory will introduce uncertainties but may not impact the main qualitative findings of our study.
The results of photochemical models in air pollution studies typically present pollutant concentrations and wind fields at the surface level. To enhance the visualisation and interpretation of the dynamics driving O3 episodes, Torre-Pascual et al. (2024) recommended expanding the analyses to higher atmospheric levels, particularly in complex terrains, such as the Spanish territory, due to the multiple processes involved. In this study, we present the results of integrated O3 concentrations and average wind fields at up to 500 m a.g.l., surface and upper-level O3 concentrations and wind fields, and vertical cross sections along the Besòs axis to illustrate recirculations, fumigations, and subsidence processes. Section S6 contains a brief assessment of the simulations performance conducted by the photochemical model.
3.1 Extreme episodes in Barcelona
Table 1 summarises the only three episodes during which Europe's IT has been exceeded in Barcelona since (at least) the year 2000. Notably, during the 2019 episode, concentrations approached Europe's hourly alert threshold (AT; O3 concentration > 240 µg m−3).
Table 1General information about the episodes with Europe's Information Threshold (IT) exceedances. Types of air quality monitoring stations (AQMSs) include UB for urban background, SB for suburban background, and UT for urban traffic.

3.2 2015 episode (6 June)
3.2.1 Meteorological context
Synoptic situation
From 1 to 5 June 2015, a low-pressure system was located NW of the British Isles (observed from 3 June in Fig. 2), while a high-pressure ridge moved from SW to NE across the IP towards central Europe. This situation favoured persistent easterly winds in the WMB, which turned southeast along the Catalan coast and then south with sea breezes. The ERA-Interim reanalysis indicated a 50 ppb (∼ 100 µg m−3) O3 accumulation at low levels (1000–925 hPa) over the Catalan coast, possibly due to the mentioned persistent easterly winds from various origins, including Italy and the Balearic Islands. In this scenario, the usual diurnal Tramontana cycle (Gangoiti et al., 2001) was absent, and in the interior of the IP, there might have been the uncoupling of nocturnal drainage flows with down-valley or seaward winds and diurnal couplings with the combined flows of coastal breezes and synoptic easterly winds.

Figure 2Episode 2015. For each day (top), the Climate Forecast System Reanalysis for the 500 hPa geopotential heights and mean sea level pressure (hPa) at 00:00 UTC (https://www.wetterzentrale.de, last access: 16 April 2024) (bottom) ERA-Interim (ECMWF) reanalysis (0.75° resolution) of O3 concentration (ppb, contour lines; 1 ppb ≈ 2 µg m−3 at sea level) and relative humidity (shaded colours) and wind field on the 1000–925 hPa level.
On 6 June, there was a change in surface pressures in the Bay of Biscay and southern France, with higher pressures than in the Mediterranean (Fig. 2). As a result, Tramontana (northerly) winds developed and persisted until 9 June, at which time there was a change in the synoptic conditions (not shown).
Local observations
Notably, the maximum temperatures (Fig. S2b) during this episode in the Barcelona area were 3–4 °C higher than the usual June temperatures (Observatori Fabra, 2022), despite it not being a declared heatwave as with the other episodes.
The radiosoundings conducted in Barcelona (Fig. S1) showed persistent easterly winds above 1500–2000 m a.s.l. throughout the period, while land–sea breezes and Tramontana cycles dominated in the lower layers. Before 6 June, lower-atmosphere winds followed a daily pattern of W–SW at night, shifting to the south during the day (Fig. S1), resulting in a net inland transport towards the north due to coastal sea breeze regimes. The change in synoptic conditions on 6 June caused a noticeable change in the lower-atmosphere winds, with an abrupt shift to the east in the early morning. This was accompanied by a temperature increase and relative humidity decrease (Fig. S2a–b), likely related to a brief period of vertical coupling with dry easterlies from the free atmosphere (Fig. S1). Then, a progressive increase in humidity, coinciding with the wind backing to the south, marked the onset of the sea breeze. Subsequently, a surface temperature inversion developed at 200 m during the following night, leading to calm conditions in a saturated air layer completely decoupled from the easterlies above.
3.2.2 Surface O3 concentrations
From 3 to 5 June, diurnal O3 concentrations in the BMA (Fig. 3) were relatively low to moderate (up to 60–113 µg m−3), displaying a nearly square-shaped daily cycle observed in low-altitude coastal locations in the WMB (e.g. Millán et al., 2000). This pattern showed peak concentrations during the central diurnal hours and the lowest levels at night (Fig. 3b–c). Traffic stations (Eixample, Montcada, or Granollers) had minimal concentrations due to O3 titration from local emissions (e.g. Solberg et al., 2005). On 4 and 5 June, the aforementioned persistent moderate southerly winds in the lower 1000 m of the atmosphere led to significantly high O3 concentrations downwind of the BMA. This was evident in AQMSs, such as Berga (at the end of the Llobregat axis) and stations in the Vic Plain (at the end of the Besòs axis), where the IT was either exceeded or nearly reached (Fig. 3a and c).
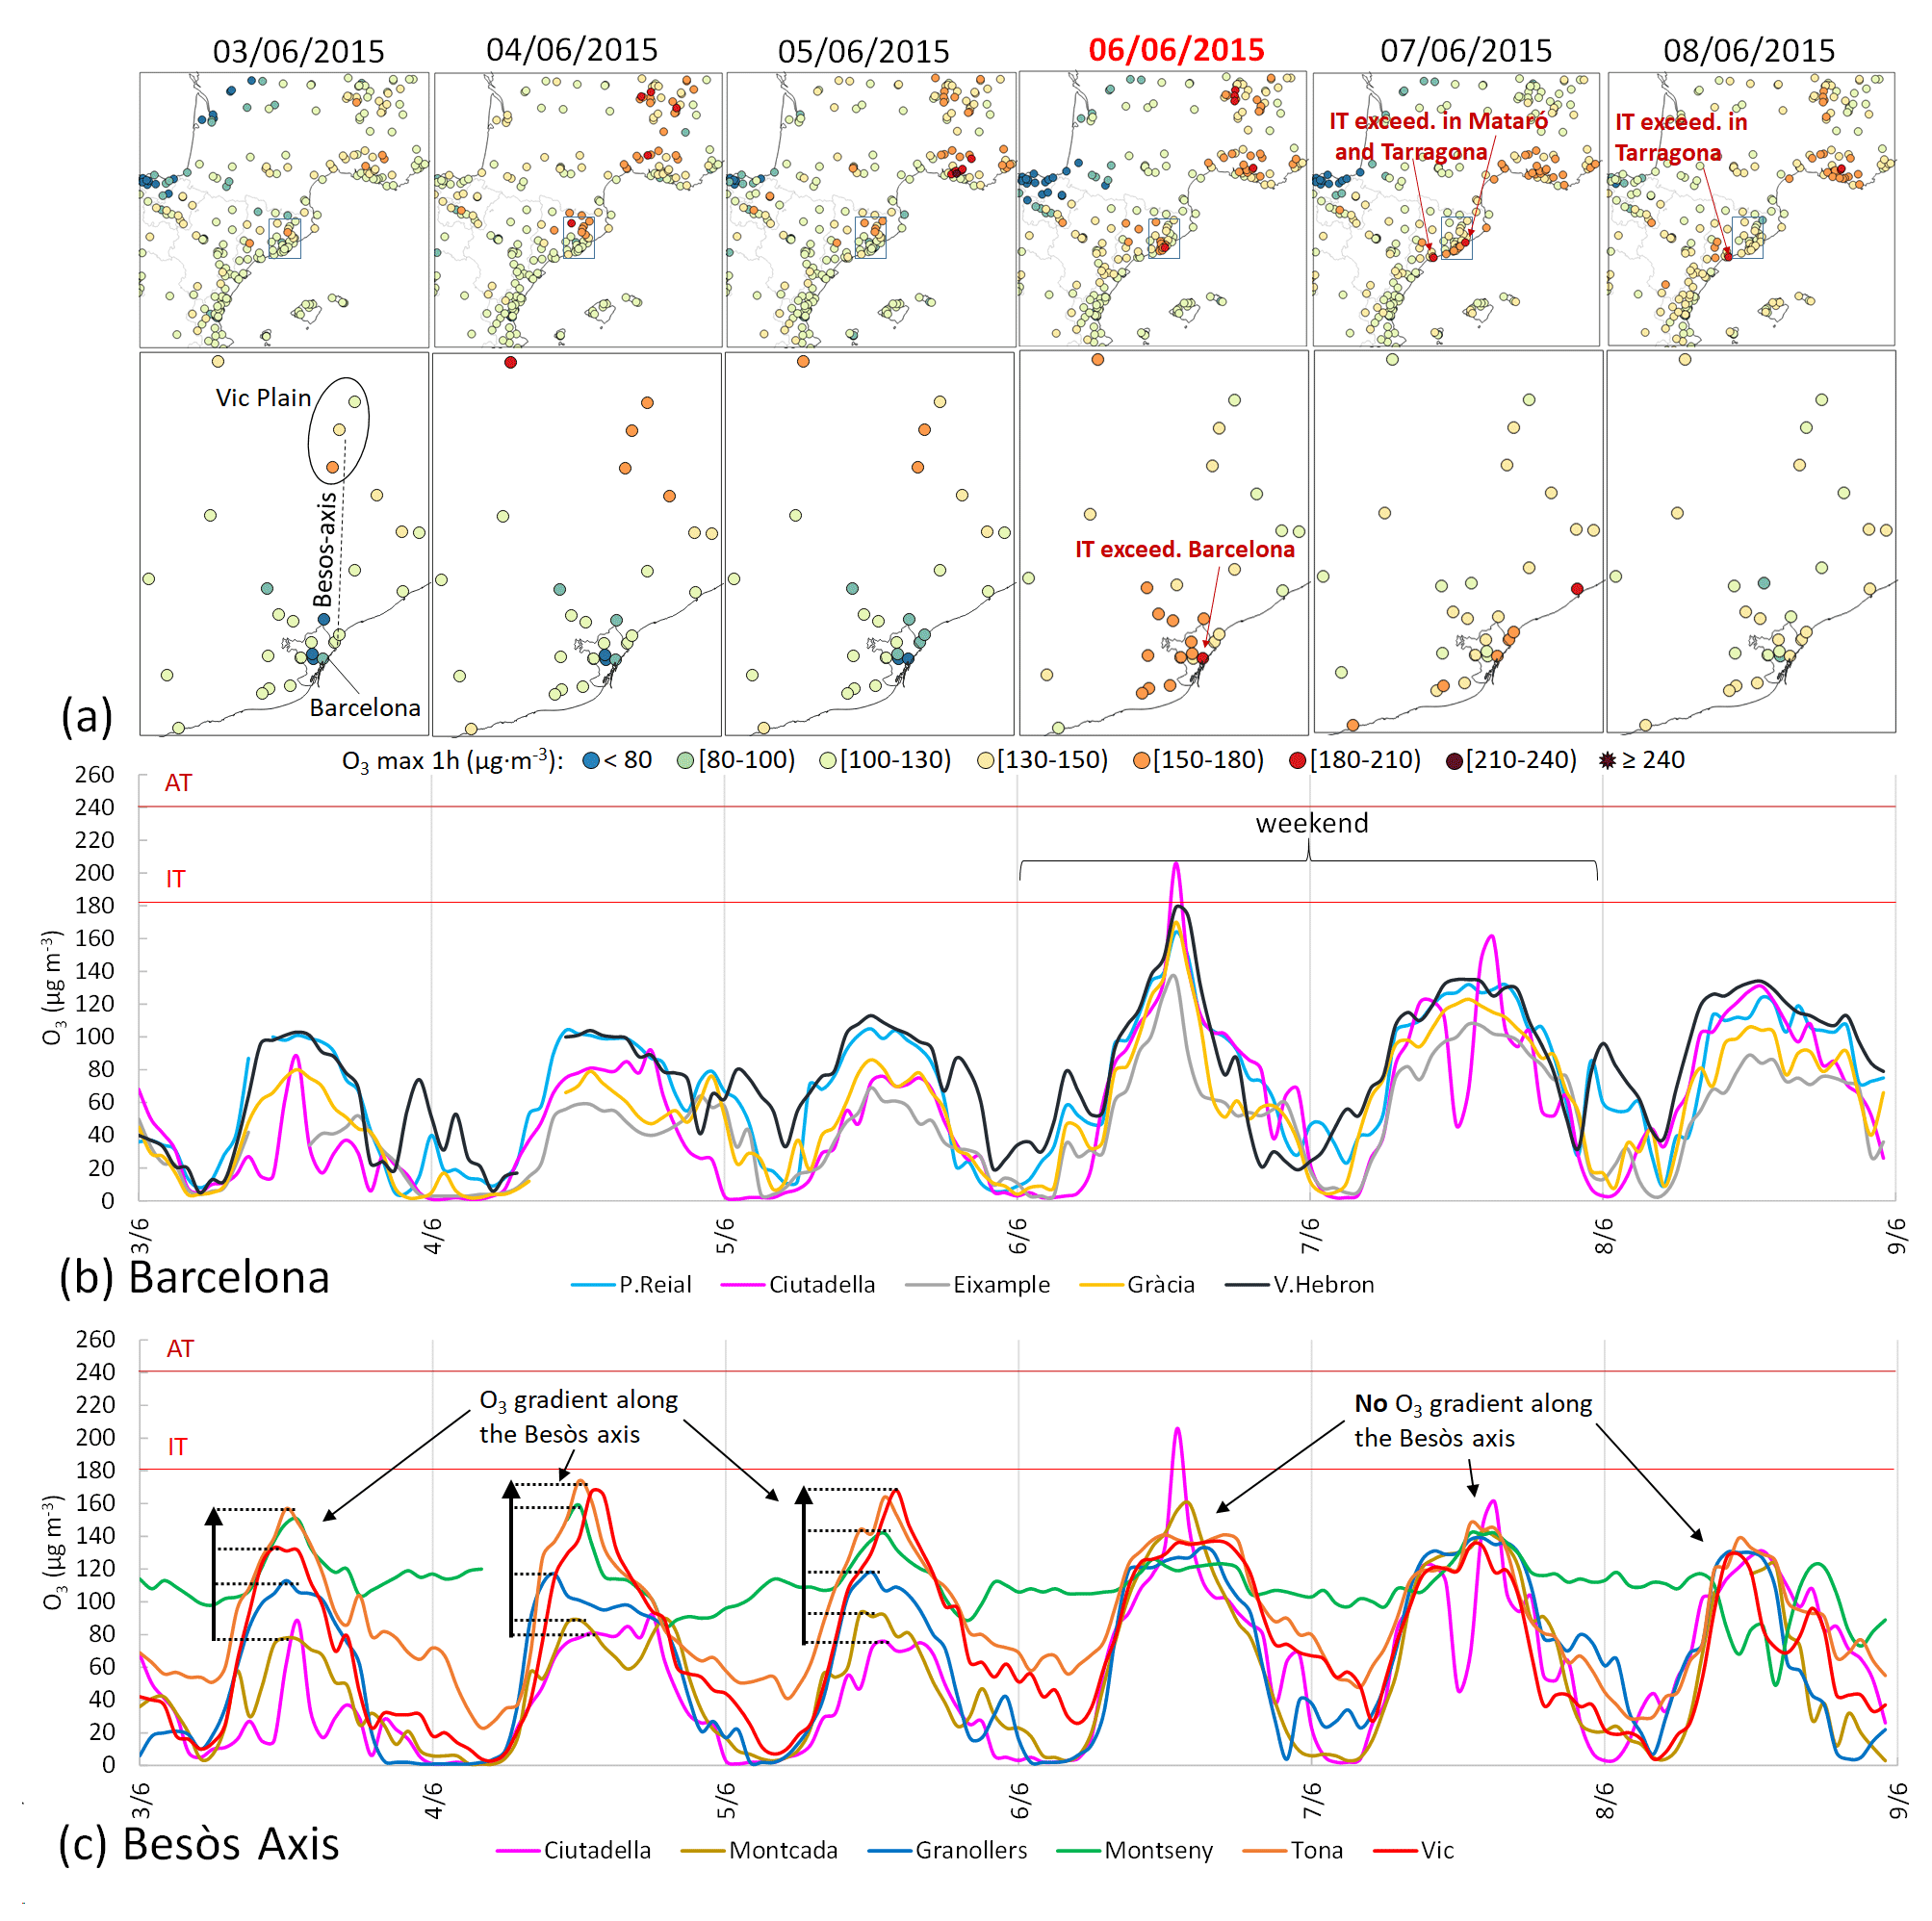
Figure 3Episode 2015. (a) Spatial distribution of maximum hourly O3 concentrations. Daily O3 cycles at the surface stations. (b) Barcelona city (no data from Fabra). (c) Along the Besòs axis, ordered with increasing distance to Barcelona: Ciutadella, Montcada, Granollers, Montseny, Tona, and Vic. Horizontal red lines represent the Information and Alert thresholds of the EU's Directive (IT and AT).
The O3 daily cycles along the Besòs axis (Fig. 3c) and the aforementioned combined upslope winds and sea breezes suggest the usual dynamics of summer O3 episodes downwind (northward) of Barcelona (e.g. Querol et al., 2017) in the days before the episode. This recurring pattern, here termed “Besòs-axis dynamics”, is characterised by the gradual increase in diurnal O3 concentrations from Barcelona to the Vic Plain (see the O3 gradients highlighted in Fig. 3c) and the early-afternoon O3 peaks that occur at later times based on their distance from Barcelona, illustrating the northward path of the BMA plume loaded with new O3 contributions.
The rural background station in Montseny (∼ 700 m a.s.l.) showed minimal daily O3 variation, with concentrations remaining constant at approximately 120 µg m−3 (Fig. 3c). This is due to the limited nighttime consumption, owing to its remote location away from O3-consuming emissions and above the stable nocturnal boundary layer, ensuring a continuous supply of O3 from reservoir layers (e.g. Millán et al., 2000; Millán et al., 2002; Chevalier et al., 2007). A detailed discussion of multiple typified O3 cycles in an air basin with similar O3 phenomenology to our study area can be found in Millán et al. (2000).
On Saturday, 6 June (episode in Barcelona), only one station exceeded the IT, but most sites in the city, including the traffic type, recorded very high O3 concentrations (up to 179 µg m−3) and a considerable concentration peak at 12:00–13:00 UTC (Fig. 3b). This coincided with the shift in surface winds from the NE to SE during the afternoon (Fig. S2a). Stations along the Besòs axis, farther from Barcelona, recorded significantly lower diurnal O3 concentrations compared to the preceding days (< 140 µg m−3), with constant levels in the Vic Plain and lacking the usual early-afternoon O3 peak (Fig. 3c). The development of a weaker breeze, as mentioned earlier, along with reduced weekend emissions of precursors from the BMA (see NOx concentrations in Fig. S3), likely contributed to this pattern. This behaviour is common during summer weekends, with the Vic Plain typically exhibiting lower O3 levels than on weekdays (e.g. Massagué et al., 2019).
In the subsequent days, peak O3 concentrations in the city decreased but remained significantly higher than before the episode (Fig. 3c), possibly due to the aforementioned O3 vertical recirculations and the stagnation of air masses over the Barcelona area. This situation contributed to the exceedances of the IT at two relatively close coastal stations on 7 and 8 June (Fig. 3a). By 9 June, O3 concentrations in the city returned to pre-episode levels (not shown) because of the aforementioned changing meteorological conditions.
3.2.3 Modelling output
Trajectory analyses results
The RAMS/HYPACT analyses (Fig. S4) show two groups of arrival trajectories to Barcelona (Ciutadella). First, trajectories on 6 June crossed the WMB with E–SE winds from 3 to 5 June, arriving in Barcelona from the east and south, following the Mediterranean gyre (Fig. S4a–e). Second, on 7 June, trajectories passed through southern France from 5 and 6 June with westerly winds and then transitioned through the Gulf of Lion with the Tramontana winds (Fig. S4c–e).
The temporal evolution of tracer particles (Fig. 4a), emitted in forward trajectories from 18 cities (coloured dots in Fig. 4b) reaching Barcelona's PBL, indicates the highest impacts originated from multiple sources, including Marseille, Toulouse, Tarragona, Palma (de Mallorca), Cagliari, Montpellier, and Barcelona. This was different from the previous days, where the origin was solely Mediterranean from the east (Palma and Cagliari) and south (Tarragona).
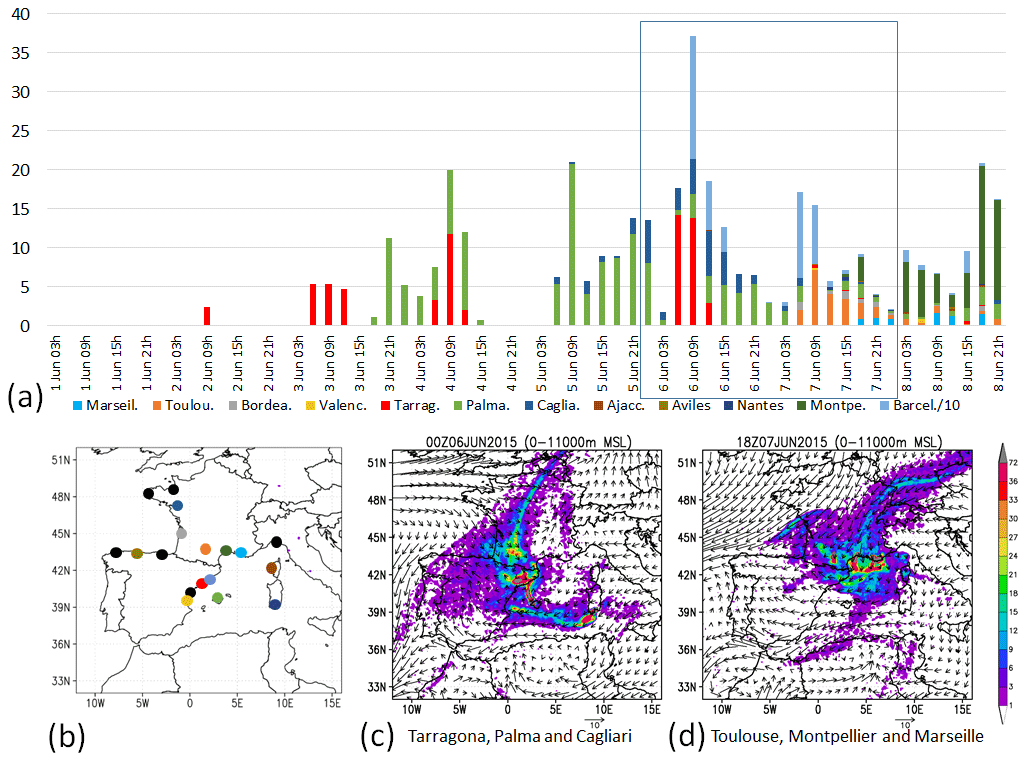
Figure 4Episode 2015. (a) Temporal evolution of impacts (number of tracer particles) emitted from cities shown in the map (b) and reaching the Barcelona PBL (Ciutadella) in forward trajectories. Emission point “Barcelona” impacts were divided by 10 due to proximity to the receptor site. Cities not represented in panel (a) have a negligible contribution, which is shown as black dots on the map. Sources in panel (a) use the same colour code as in the panel (b) map. (c–d) Burden of tracer particles (0–11 000 m) impacting Barcelona during the weekend from three selected Mediterranean cities with the main impact on 6 June (c) from the east and south and (d) three more sources in southern France with the main impact on 7 June from the north.
Figure S5 depicts a Barcelona-originating plume dispersion simulation with northward transport before 6 June and no circulation of coastal emissions over the WMB. Starting on 6 June with Tramontana winds, a land–sea recirculation developed along the Barcelona coast. The plume underwent a complete rotation, with Barcelona at the centre of a convergence zone. Barcelona received pollution from the Gulf of Lion and from the eastern and SE areas, which was transported by sea breezes and the Mediterranean gyre. These inputs merged with the local emissions from the eastern Spanish coast.
The key finding of these analyses is the convergence of a set of multiple sources on the day of the episode, located to the NW of the city (southern France), to the east (other Mediterranean cities), to the south (Tarragona), and in Barcelona.
Photochemical model results
Outcomes from the photochemical simulation from 5 June are shown in Figs. 5 and S6. The model replicates intense sea breezes along the Catalan coast, aligning with local observations. These breezes transported the BMA plume northeastward, nearly reaching the Pyrenees (Fig. S6). The vertical section in the same figure also shows O3 accumulation northward of the Pyrenees (circle on 5 June at 16:00 UTC in Fig. S6). The presence of a high-pressure cell over the Balearic Islands suggests subsidence of upper layers over the sea. In the afternoon, stagnant high-altitude air masses over Barcelona contributed to O3 accumulation (Fig. S6), consistent with the ERA-Interim results. Notably, Fig. 5 indicates a localised transport of O3 from Barcelona/Girona towards the Gulf of Lion.
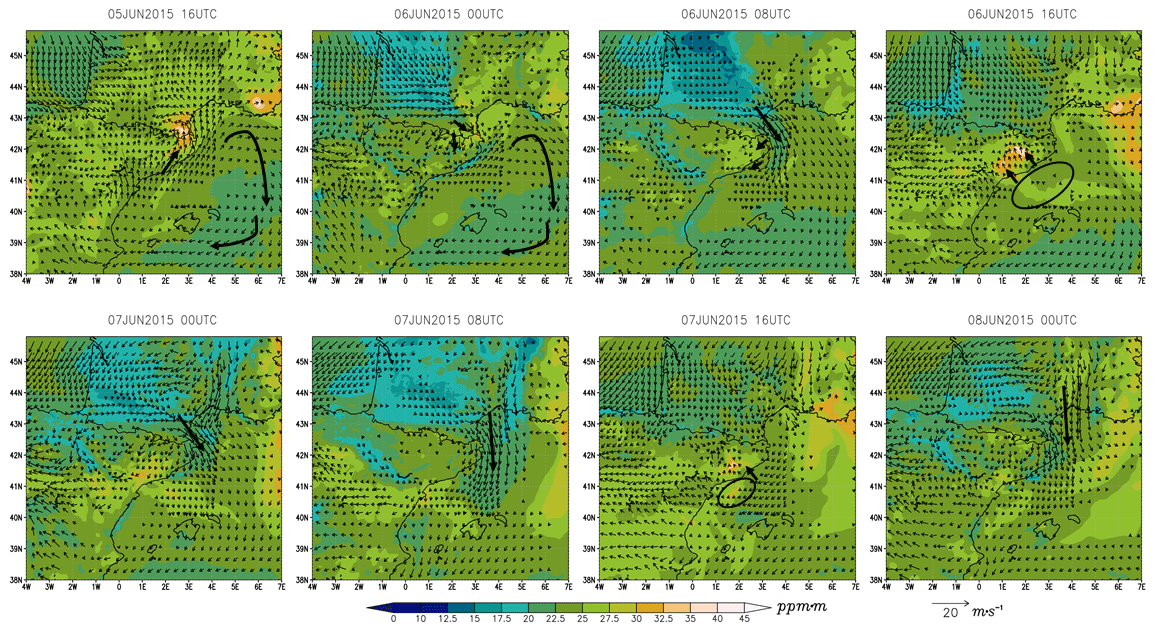
Figure 5Episode 2015. Simulated O3 concentrations (colour scale; in ppm m) integrated at 0–500 m a.g.l. and average wind fields (vectors) between 0 and 500 m a.g.l. Wind speeds < 2 m s−1 are not represented.
In the early morning of 6 June (episode day in Barcelona), this contribution added to O3 from the Gulf of Lion and returned over the Catalan coast, coinciding with the onset of the Tramontana wind (Fig. 5). This is consistent with the back-trajectory analyses. At this point, there was no longer O3 accumulation northward of the Pyrenees (circle on 6 June at 00:00 UTC in Fig. S6). On 6 June, the impact of the transported air masses from the previous day (Fig. 5) and the vertically recirculated O3 (Fig. S6) in the city were observed. Simulated breezes were not intense, consistent with local observations, and this partially disrupted the Besòs-axis dynamics and facilitated the increase in O3 in the city. Additionally, the potential impact of the weekend effect should be considered.
Simulations show vertical recirculations of O3 towards the sea on 7 and 8 June and low-O3 levels in the Gulf of Lion. The Tramontana showed limited O3 transport (Figs. 5 and S6). The O3 accumulated aloft and over the sea surface (mostly from the preceding days) shifted southwestward, affecting other areas (Figs. 5 and S6). This is consistent with the observed O3 surface concentrations, which decreased in Barcelona but still remained high in other coastal cities where the IT was exceeded, e.g. Tarragona. On 8 June, a similar transport pattern was observed over the WMB, with a slight decrease in the O3 concentration, probably partially due to the restoration of weekday emissions of O3-consuming compounds. This pattern persisted until 9 and 10 June (not shown), at which time the Tramontana wind ceased, and easterly winds transported surface O3 westward, inhibiting the accumulation processes of the previous days.
3.3 2018 episode (4 and 5 August)
3.3.1 Meteorological context
Synoptic situation
From 1 to 3 August 2018, NE winds (1000–900 hPa) persisted over the western part of the European continent from the Jutland peninsula to northern Iberia (Fig. 6), giving rise to Tramontana winds in the study area. This flow, associated with high-pressure systems over Scandinavia, extended through a broad NE–SW ridge to Iberia and North Africa. On the afternoon of 3 August, the anticyclone retreated from Jutland, strengthening west of Ireland on 4 and 5 August (episode days). Consequently, the NE winds rotated north along the Atlantic European coast, while the Tramontana persisted, driven by the pressure difference between southern France and the Mediterranean. The ERA-Interim reanalysis shows easterly winds in the Gibraltar Strait from 1 to 5 August, along with the Tramontana winds, following the continuity of the airflow in the marine boundary layer of the WMB (as in In't Veld et al., 2021). This airflow, which was more evident at nighttime, moved into the relative lower pressure in the Gulf of Cádiz, following the eastern coast of Iberia. On 6 August, as the surface high pressures weakened in the Bay of Biscay and western France and the anticyclone shifted towards western Portugal, meteorological conditions changed, preceding the approximation of an Atlantic front through the west of the Iberian Peninsula. This marked the conclusion of the Tramontana period and the decay of the episode.
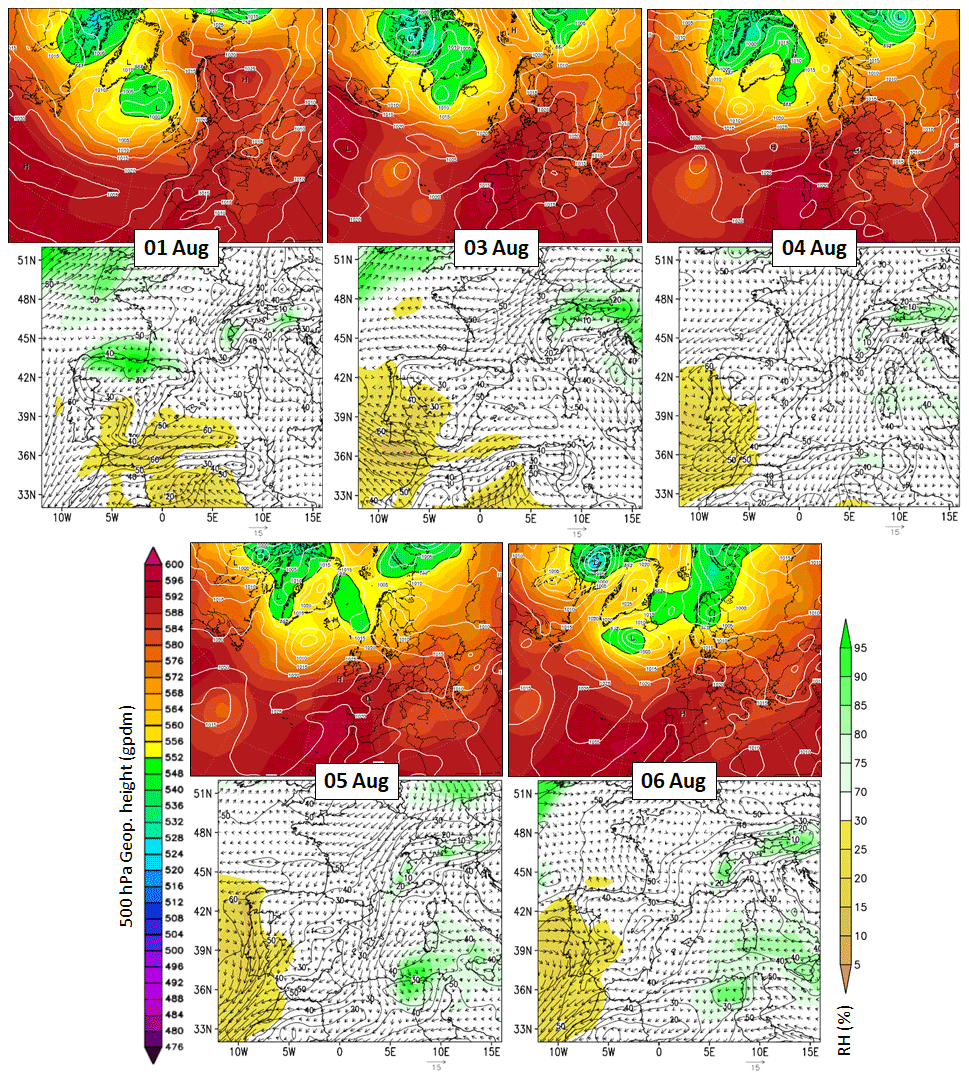
Figure 6Episode 2018. For each day (top), Climate Forecast System Reanalysis for the 500 hPa geopotential heights and mean sea level pressure (hPa) at 00:00 UTC (https://www.wetterzentrale.de, last access: 16 April 2024) ERA-Interim (ECMWF) reanalysis (bottom) (0.75° resolution) of O3 concentration (ppb, contour lines; 1 ppb ≈ 2 µg m−3 at sea level), relative humidity (shaded colours), and wind field on the 950–850 hPa level.
Local observations
The most intense heat episode of 2018 occurred from the first few days of August until 8 August, with coastal regions, including Barcelona, experiencing exceptionally high temperatures, with some regions setting record high temperatures. The peak temperatures during the episode days (Fig. S8b) in the city were conditioned by a light N–NE flow. This limited the tempering effect of the southerly sea breezes, which weakened during the episode, as discussed below (Meteocat, 2022).
The radiosoundings conducted in Barcelona (Fig. S7) show well-developed sea breezes from 1 to 3 August, also observed at the Barcelona and Parets stations (Fig. S8a and c). In the upper levels of the atmosphere, the wind shifted to a northerly pattern on 2 August at 12:00 UTC, which probably resulted in the entry of the upper-level polluted air masses documented by Torre-Pascual et al. (2024). On 3 and 4 August, MLHs were high between 2000 and 3000 m a.g.l. in the city (data from 5 August are not available). The wind pattern observed at the surface on 4 and 5 August was different from the previous days, likely suggesting a weaker sea breeze development during that period (Fig. S8a and c), also suggested by the model simulations (see below). On 6 and 7 August, the previously mentioned meteorological change became evident on surface measurements, with a drop in maximum temperatures (−6 °C), an increase in relative humidity (+30 %–35 %), and weaker solar radiation (−11 %), compared to the episode days (Fig. S8).
3.3.2 Surface O3 concentrations
In early August 2018, O3 concentrations were high on a regional scale. For instance, AQMSs in southern France reached extreme O3 levels, with several AT exceedances northward from Marseille (Fig. 7a), and the Atlantic coast of the IP showed abnormally high concentrations, according to Torre-Pascual et al. (2024). Background concentrations in the study area from 1 to 3 August were high, as background stations in Barcelona (Ciutadella, Fabra, and V. Hebron) recorded concentrations of up to 140 µg m−3 (Fig. 7b). The Besòs-axis dynamics appear to be well established, causing very high diurnal O3 concentrations (up to 214 µg m−3 in the Vic Plain) and multiple exceedances of the IT (Fig. 7a and c). On 3 August, peak O3 concentrations decreased in the Vic Plain but remained close to the IT.
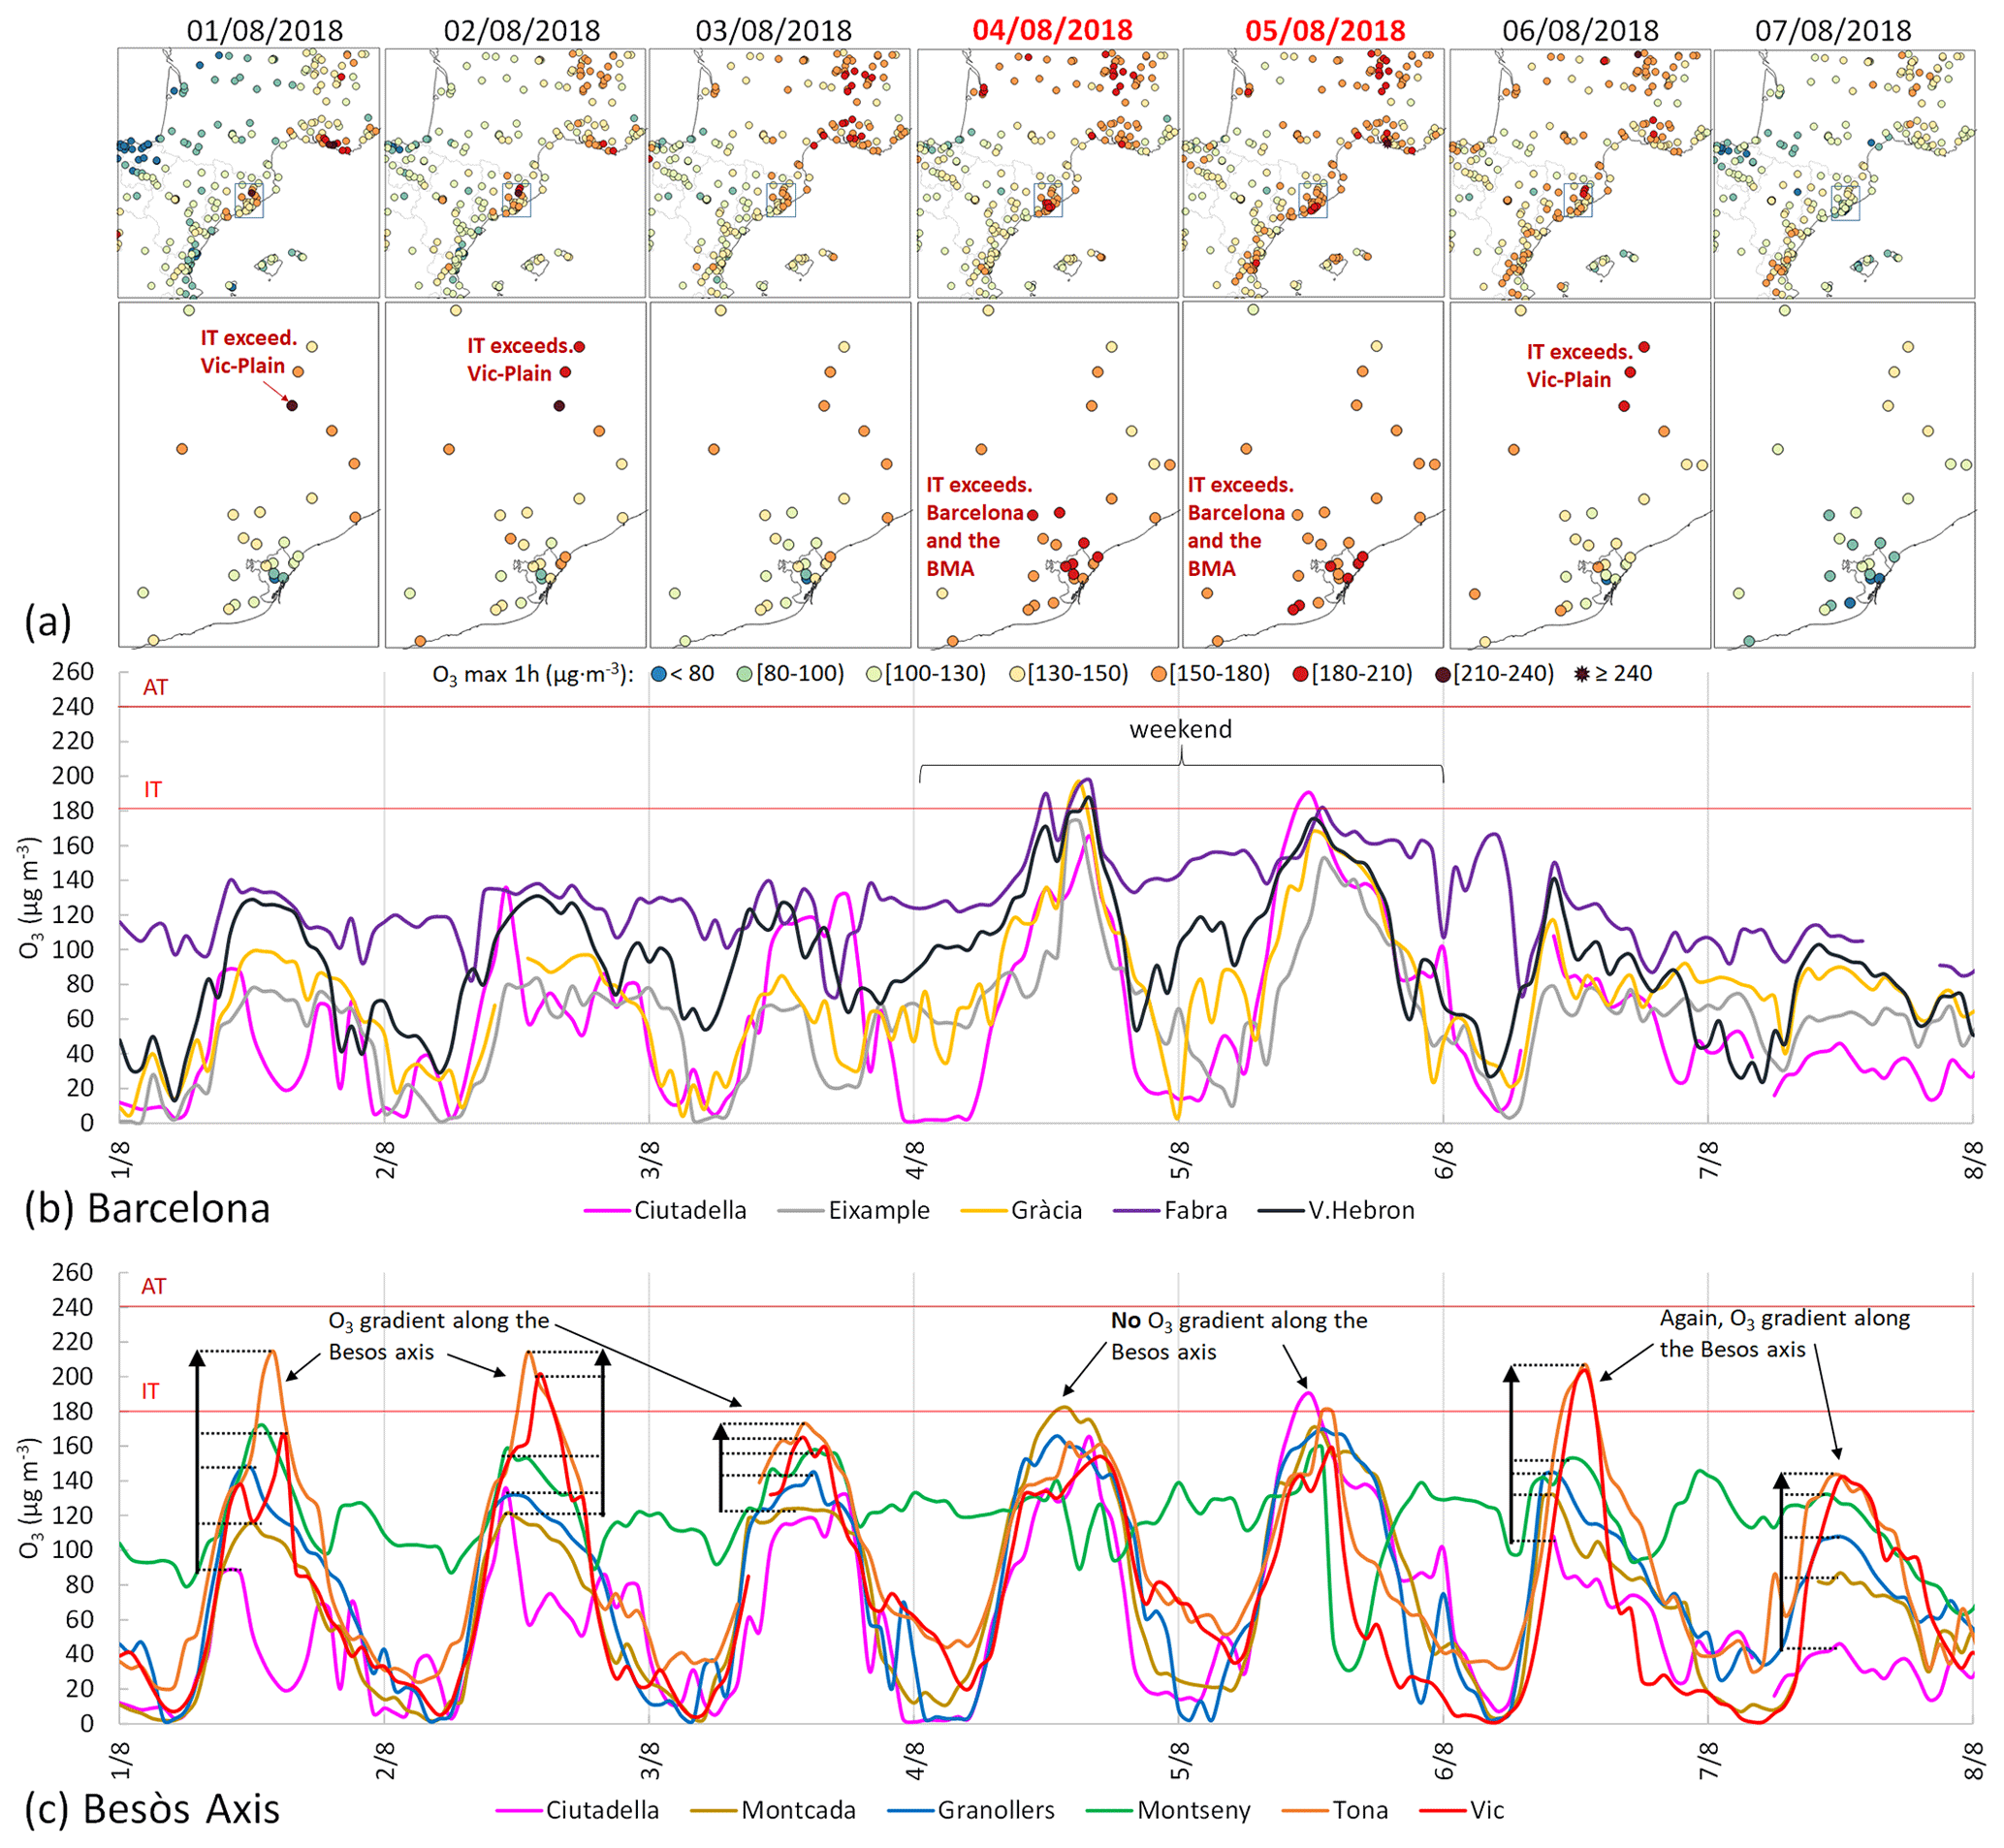
Figure 7Episode 2018. (a) Spatial distribution of maximum hourly O3 concentrations. Daily O3 cycles at the surface stations (b) in Barcelona (no data from Palau Reial). (c) Along the Besòs axis, ordered with increasing distance to Barcelona: Ciutadella, Montcada, Granollers, Montseny, Tona, and Vic. Horizontal red lines represent the Information and Alert thresholds of the EU's Directive (IT and AT).
During the episode in Barcelona (4 and 5 August), multiple AQMSs in the city and the BMA recorded very high O3 concentrations, reaching up to 197 µg m−3 (Fig. 7a). At the suburban Fabra station in Barcelona, exceptionally high concentrations were observed during the night of 4 to 5 August. Along the Besòs axis, although the O3 concentrations remained high and close to the IT, they significantly decreased compared to 1 and 2 August, and no O3 gradient was observed (Fig. 7c), suggesting the disruption of the Besòs-axis dynamics. This resembled the 2015 episode and could have been partially attributed to the aforementioned reduced development of breezes during the episode days and to the lower weekend precursor emissions in the BMA, as indicated by the low NOx concentrations (Fig. S9).
The approximation of the Atlantic front on 6 August (Monday) caused the episode in Barcelona to decay. Diurnal O3 concentrations dropped to 80–140 µg m−3 (Fig. 7b), especially at low-altitude stations, likely partially due to the restoration of local emissions of O3-consuming compounds typical of workdays. The Besòs-axis dynamics seemed to re-establish, displaying a marked gradient of O3 concentrations in AQMSs farther north and concentrations of up to 206 µg m−3 in the Vic Plain (Fig. 7c).
3.3.3 Modelling output
Trajectory analyses results
The RAMS/HYPACT analyses (Fig. S10) show the arrival of tracer trajectories crossing France from central Europe to Barcelona (Fabra) on 4 and 5 August (episode days). Air masses entered the WMB, following the Tramontana winds associated with relatively high pressures over Europe. Additionally, daytime sea breeze circulations along the east coast of Iberia generated southerly flows, potentially recirculating precursors and O3 and adding new sources, including Tarragona and a short impact from Castellón.
Figure 8b shows the temporal evolution of tracer particles emitted in forward trajectories from a selection of 14 selected cities reaching the Barcelona PBL (Ciutadella). The impact of Toulouse, representing the arrival of precursors from southern France, was characteristic throughout the Tramontana period. The influence from Tarragona occurred nearly every day but was not consistent. During the episode (marked with a square in Fig. 8b), a convergence of multiple sources from various regions occurred, resulting in higher overall concentrations, similar to the 2015 episode. The main sources on the episode days were from central Europe, southern France and the SE Iberian coast (Fig. 8c–d).

Figure 8Episode 2018. (b) Temporal evolution of impacts (number of tracer particles) emitted from cities shown in panel (a) and reaching the Barcelona PBL (Ciutadella) in forward trajectories. Cities not represented in the bar chart had a negligible contribution and are shown as black dots on the map. (c) Burden of tracer particles (0–11 000 m) impacting Barcelona emitted from Stuttgart, Zurich, Prague, Munich, and Paris and (d) Toulouse, Bordeaux, Tarragona, and Castellón.
Photochemical model results
The results from the photochemical simulation are shown in Figs. 9 and S11. The model reproduces the presence of Tramontana and accumulation of O3 at mid-tropospheric levels across most of Iberia on 2 and 3 August (see Torre-Pascual et al., 2024). Transport of polluted air masses entering the western Mediterranean from the Gulf of Lion can be observed (Fig. 9), consistent with the trajectory results. For these days, simulations reproduced the breezes and return flows on the east coast (Figs. 9 and S11), causing an increase in O3 over the sea in front of Barcelona, as also shown in the ERA-Interim reanalysis (Fig. 6). These mechanisms caused an accumulation of O3 at the surface, resulting from transport over the sea and local production.

Figure 9Episode 2018. Simulated O3 concentrations (colour scale; in ppm m) integrated at 0–500 m a.g.l. and average wind fields (vectors) between 0 and 500 m a.g.l. Wind speeds < 2 m s−1 are not represented.
The results indicate that on 4 and 5 August (episode days), Barcelona was impacted by the arrival of polluted air masses from Europe through the Gulf of Lion (Figs. 9 and S11), consistent with the trajectory analyses. Furthermore, O3 contributions from the south (e.g. from Tarragona) on 4 August (Fig. 9) and the accumulation of O3 over the sea from the vertical recirculations on the previous days affected the city. Return flows continued mixing upper-level O3 with that situated below, contributing to more accumulation at the surface. Additionally, the intensity of the episode was likely influenced again by weakened sea breezes on 4 August (Fig. 9), as also suggested by local observations, resulting in less inland penetration of polluted air masses than on previous days. This pattern is similar to the 2015 episode. Similarly, as in the 2015 event, the weekend effect should also be considered, which likely contributed to reduced O3 titration and ozonolysis.
On 6 August (Monday), O3 concentrations decreased, owing to meteorological changes and the recovery of O3-consuming emissions. This decay of the episode is reflected in the simulations with the end of the Tramontana winds and the absence of discernible O3 contributions from Europe (6 August at 00:00 UTC in Fig. 9).
3.4 2019 episode (29 June)
3.4.1 Meteorological context
Synoptic situation
From 20 to 25 June 2019, a low-pressure centre detached from the main westerly current and moved to the NW of Iberia, weakening at the surface during its trajectory (not shown). By 25 June, it persisted as an upper-level low that was isolated from the polar front. Simultaneously, a high-pressure ridge developed over the WMB after its associated warm southerly African winds advanced ahead of the low-pressure centre in the Atlantic sector, inducing a heatwave event in eastern Iberia, including Barcelona (Fig. 10). This ridge was particularly well defined on 25 and 26 June, as mid-tropospheric southerly winds were observed over the Barcelona sounding site (Fig. S12). In the lower layers, surface low pressures on the coasts of Portugal and the Bay of Biscay, associated with the described upper-level low and relatively higher surface pressures on the WMB, inhibited the Tramontana winds, suppressing the diurnal pulsation in the WMB (Gangoiti et al., 2001). This situation led to persistent easterly circulation from the central Mediterranean to the eastern Iberian coast until 27 June (Fig. 10), possibly contributing to the accumulation of O3 (55–60 ppb; ∼ 110–120 µg m−3), as also shown in the ERA-Interim reanalysis (see below). This was likely due to the transport of O3 precursors from Italy and North Africa.
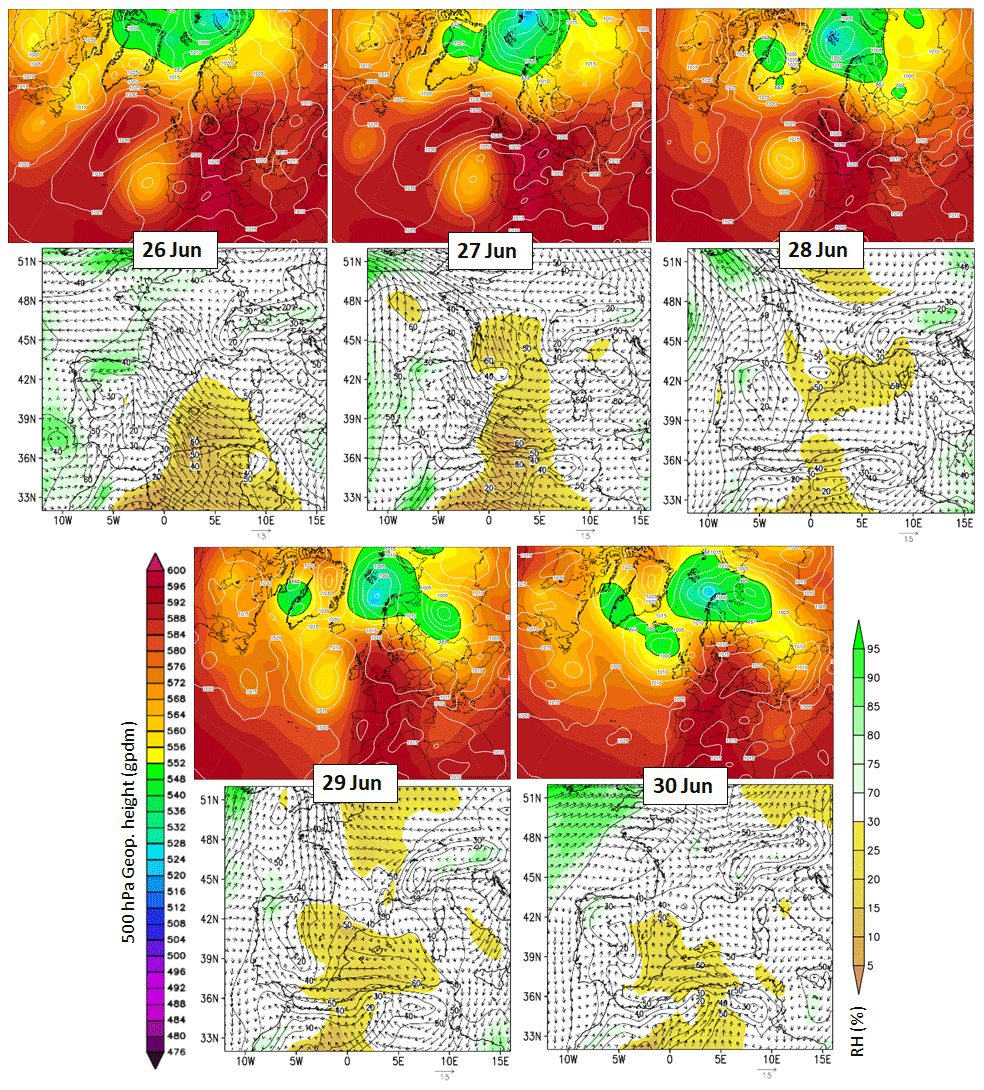
Figure 10Episode 2019. For each day (top), Climate Forecast System Reanalysis for the 500 hPa geopotential heights and the mean sea level pressure (hPa) at 00:00 UTC (https://www.wetterzentrale.de, last access: 16 April 2024) (bottom) ERA-Interim (ECMWF) reanalysis (0.75° resolution) of O3 concentration (ppb, contour lines; 1 ppb ≈ 2 µg m−3 at sea level), relative humidity (shaded colours), and wind field at 950–850 hPa.
On 28 June, the Atlantic low-pressure centre started displacing northwards to integrate again with a polar front trough NW of Ireland on 30 June. During this transition, the Tramontana flow was activated, and W–NW winds prevailed up to a height of 1000–1500 m (Fig. S12; from 28 June at 12:00 UTC to 29 June), which caused a drastic decrease in humidity at surface stations and the maximum temperature during the period, even at nighttime (see the next section). The sea breeze regime and inland convergence (SW; Fig. S12) showed a very shallow (250 m) layer on 28 June at 12:00 UTC, influenced by a drier and warmer Tramontana flow. These westerlies, associated with the Tramontana, continued blowing during the following day. This situation favoured the development of return flows after the onset of the coastal easterlies and southeasterlies during the sea breeze regime on 29 June, with subsequent pollution accumulation on the coast, as discussed in Sect. 3.4.3. Notably, the synoptic situation during the build-up and peak of this episode was similar to the previously described 2015 episode. On 30 June, the situation changed with the onset of more intense southerlies above 1000 m height (Fig. S12), preventing the formation of sea breeze return flows and favouring venting conditions.
Local observations
The persistent easterlies before the episode were also observed at the surface with steady and relatively intense NE–E winds (5–9 m s−1) on 25 and 26 June (Fig. S13a), which combined with the southerlies above 1000 m (Fig. S12) and likely favoured the dispersion of pollutants to the NW. The synoptic situation described above caused Catalonia to experience an intense heatwave from 27 to 30 June (Meteocat, 2022), peaking in maximum temperatures from 28 to 29 June. In Barcelona, temperatures increased progressively to over 36 °C on 28 June (Fig. S13b). During the night before the episode, abnormally high temperatures persisted, possibly due to dry westerlies observed in the soundings (29 June at 00:00 UTC; Fig. S12), with the absolute minimum relative humidity. We interpret this as a Foehn episode of the Tramontana winds at the lee of the mountain ranges, running parallel to the coast to the west and NW of the city. On 30 June, surface conditions shifted, with the maximum temperatures decreasing by 5 °C and the relative humidity peaking at 90 %. This coincided with the onset of the marine easterlies at lower levels (29 and 30 June) and the upper-level southerlies on 30 June (Fig. S12).
3.4.2 Surface O3 concentrations
On 25 and 26 June, O3 levels in the study area were moderate for that time of year (Fig. 11a), whereas in Barcelona, concentrations (< 110 µg m−3) showed little variation throughout the day (Fig. 11b). This stable pattern is attributed to the aforementioned favourable dispersion conditions, which maintained low NOx levels (Fig. S13), thus weakening/eliminating nocturnal titration. On 27 June, the usual nighttime titration in Barcelona was restored (Fig. 11b), and the Besòs-axis dynamics seemed to develop (Fig. 11c), with O3 concentrations reaching up to 193 µg m−3.
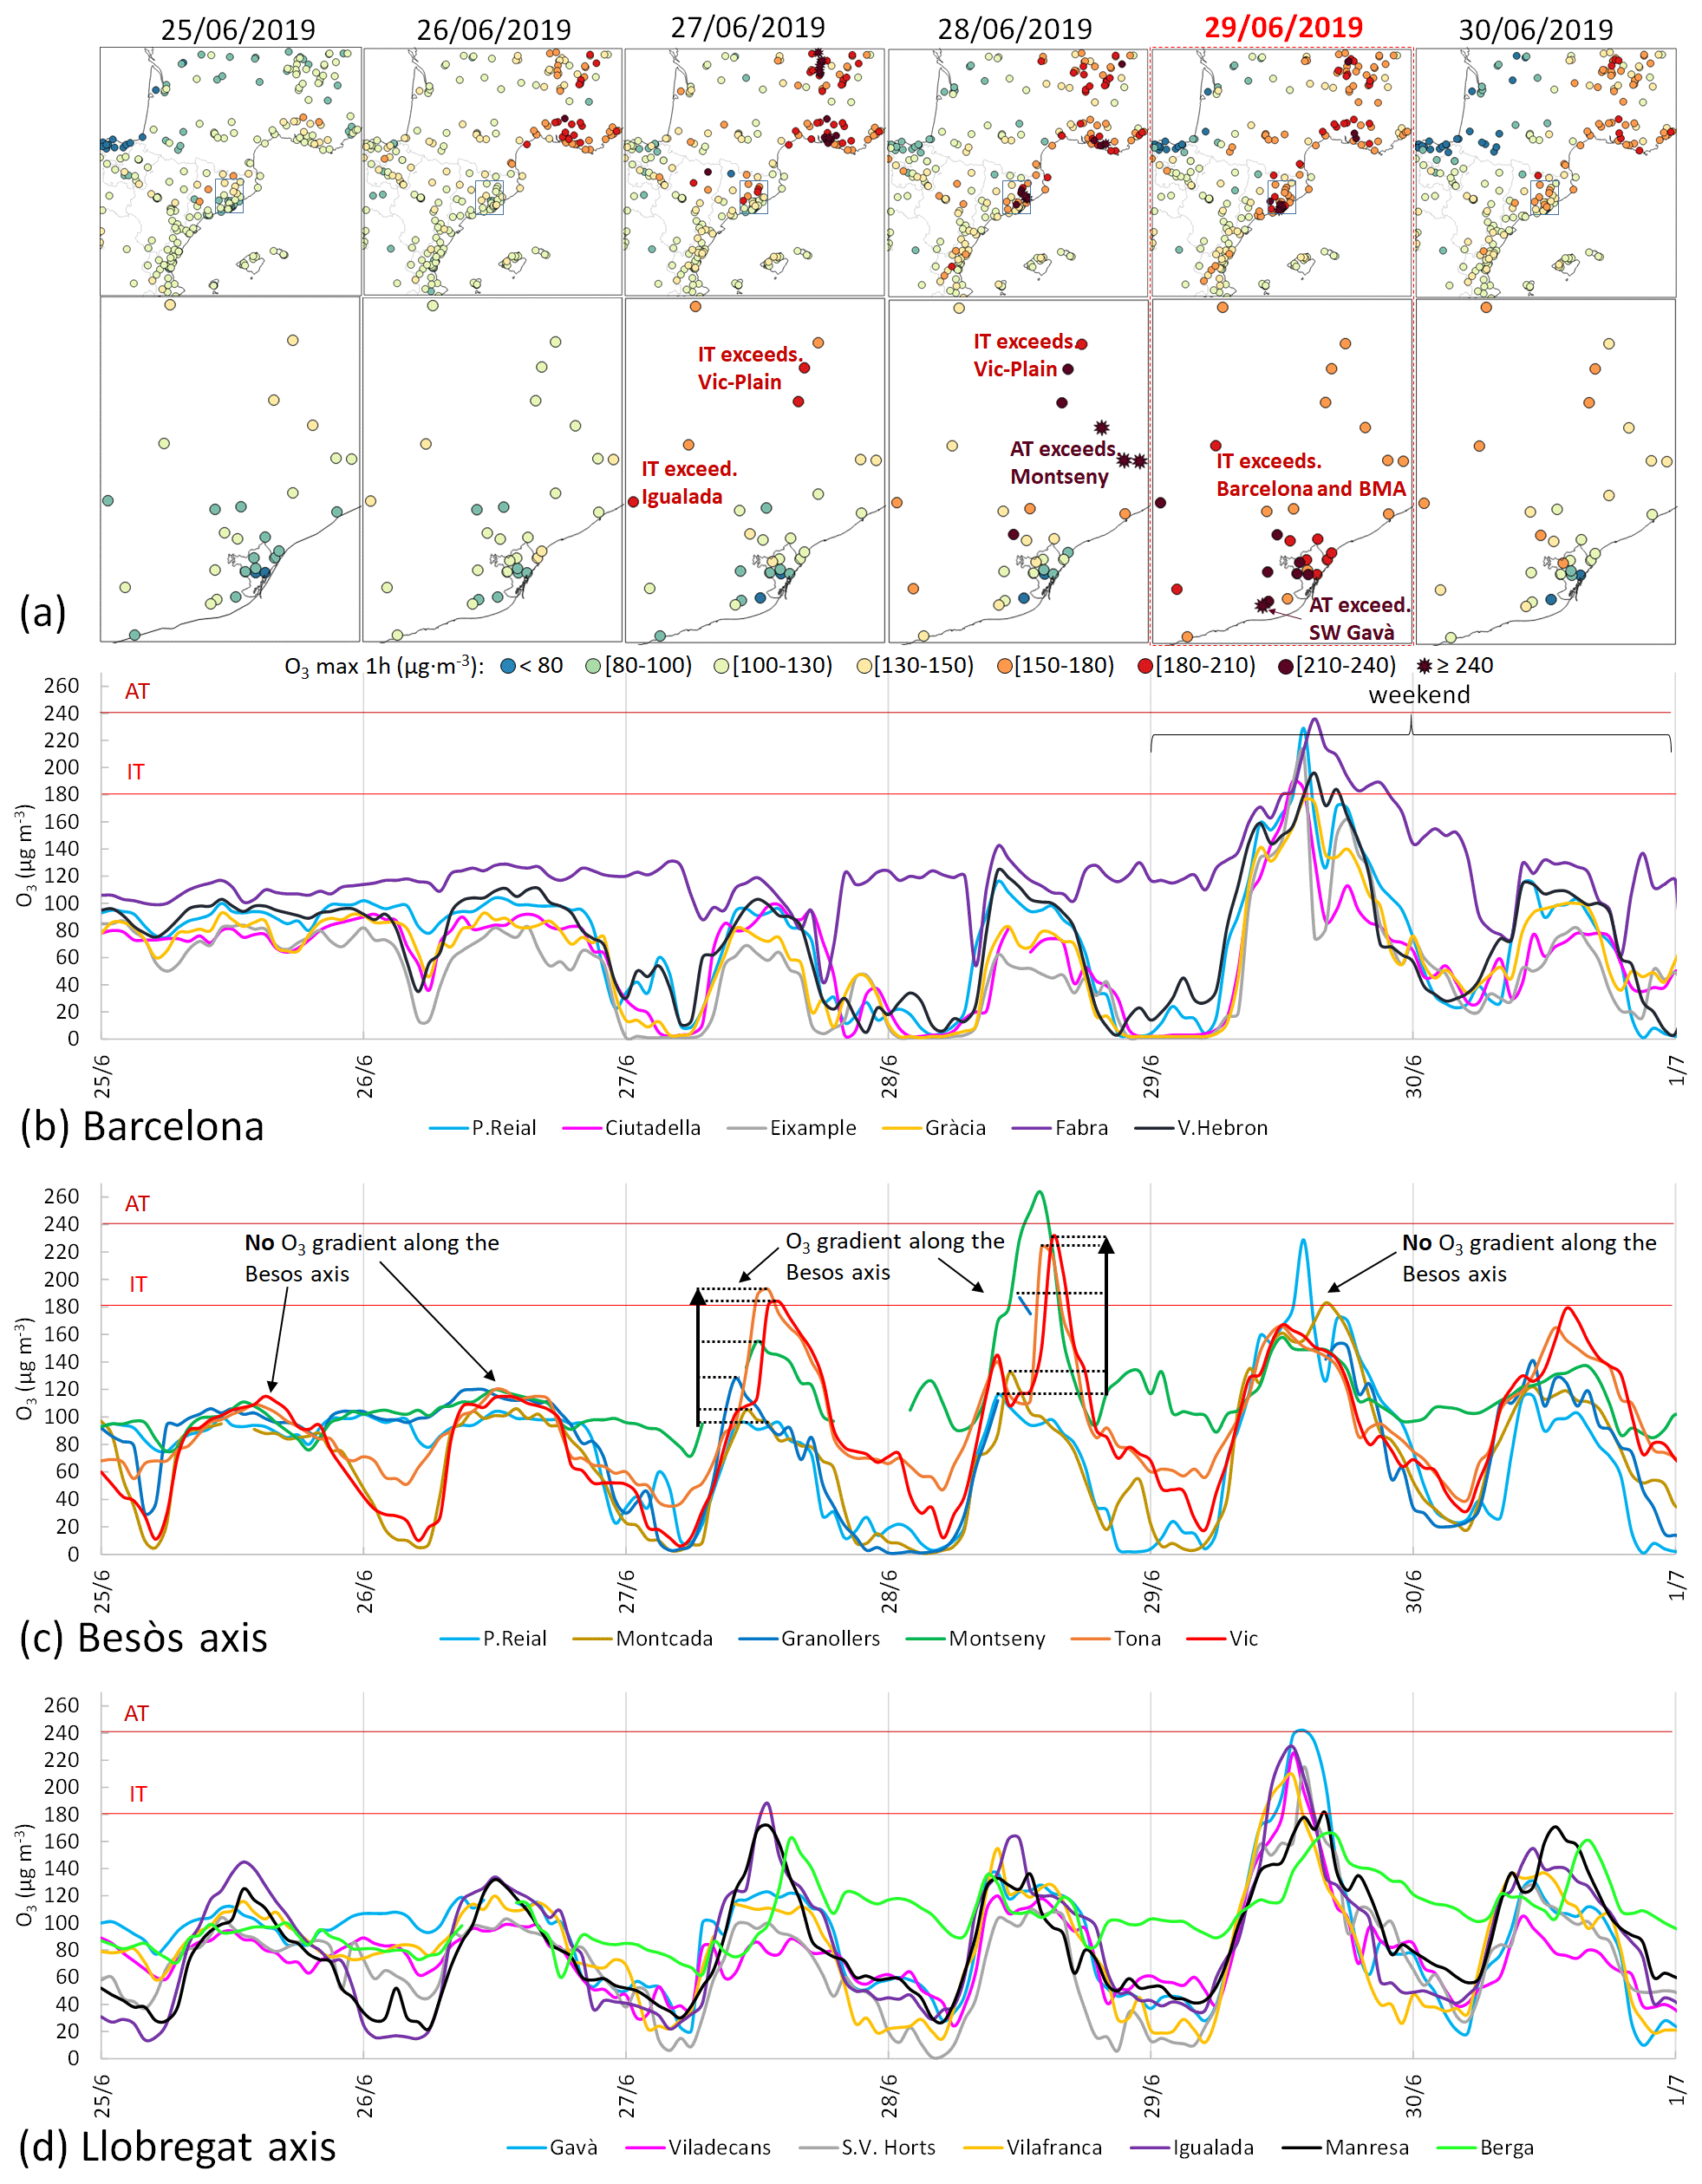
Figure 11Episode 2019. (a) Spatial distribution of maximum hourly O3 concentrations. Daily O3 cycles at surface stations. (b) Barcelona. (c) Along the Besòs axis, ordered with increasing distance to Barcelona: Palau Reial, Montcada, Granollers, Montseny, Tona, and Vic (some hourly data are missing from Granollers and Montseny) and (d) the Llobregat axis. Horizontal red lines represent Information and Alert thresholds of the EU's Directive (IT and AT).
On 28 June, O3 concentrations increased significantly along the Besòs axis, where the Montseny station registered extreme O3 levels (263 µg m−3). Concentrations approached the AT in the Vic Plain (Fig. 11a). Simultaneously, the AT was exceeded at stations along the NE axis (Fig. 11a), pointing to another of three possible transport routes of the BMA plume (Diéguez et al., 2009). Jaén et al. (2021), who also studied this 2019 episode, indicated that high NOx levels likely favoured O3 production in these downwind (NOx-limited) areas. Indeed, high NO2 levels in the morning were observed in the city, reaching up to 233 µg m−3 (both at the surface, as depicted in Fig. S14, and in the tropospheric column, as shown in Fig. S15). These elevated NO2 levels could partially result from the holiday exodus, as the date coincided with a Friday preceding a vacation for a significant portion of the population. Additionally, emissions from a fire in Ribera d'Ebre (Tarragona) from 27 June onwards (clearly observed by TROPOMI; Fig. S15) could have contributed to the unusually high O3 concentrations at the Montseny station (located at altitude). However, after subsequent simulations and analysis of trajectories, we concluded that the fire plume passed over Barcelona at a height above 1500 m a.s.l. on the episode day, well above the PBLH, suggesting no direct effect on O3 levels in the city.
On Saturday, 29 June (episode in Barcelona), extreme O3 concentrations were recorded in the city, with levels reaching up to 236 µg m−3 and nearly all the active stations exceeding the IT (Fig. 11a). Interestingly, O3 concentrations in Barcelona, especially those recorded in Fabra, exhibited a relative maximum at 10:00 UTC (time of low photochemical production), followed by the absolute peak at approximately 15:00 UTC, aligning with the typical time of maximum O3 concentrations.
In the SW BMA areas, several stations exceeded the IT, with one station exceeding the AT (Gavà; Fig. 11a). Jaén et al. (2021) attributed this pattern to a shift in the wind conditions, diverting the BMA plume (comprising recirculated and fresh emissions) westward instead of northward, which is consistent with the observed diurnal light surface winds from the eastern quadrant (Fig. S13a) and the model results (see below). Consistent with this, the O3 daily cycles suggest an alternate BMA plume route (Diéguez et al., 2009) along the Llobregat axis instead of the Besòs axis (Fig. 11c and d).
In the following days, the episode decayed due to the changing meteorological conditions. This is evident from the considerable decrease in O3 concentrations, particularly at the low-altitude stations in Barcelona, with levels similar to pre-episode days (Fig. 11a).
3.4.3 Modelling output
Trajectory analyses results
The RAMS/HYPACT analyses (Fig. S16) revealed two groups of arrival trajectories to Barcelona (Fabra) on 29 June. The first group crossed the WMB with the aforementioned easterly winds on 26 and 27 June and came from central Europe with northerly winds. The second group on 28 and 29 June came from the south, following the coast (“Mediterranean” contributions) with the Mediterranean gyre circulation, and from the north, with the characteristic entry through the Gulf of Lion, sweeping across southern France (continental European contributions).
The temporal evolution of tracer particles emitted in forward trajectories from 14 selected cities (Fig. 12b) shows that the Barcelona PBL received impacts from multiple sources, as also observed in the other two episodes. The city lies in a convergence zone of northerly winds (Tramontana winds carrying pollution from Marseille and Toulouse) and southerly winds (evening anticyclonic shallow vortex with inland convergence bringing pollutants from Tarragona, Castellón, and Palma). Traces from Rome, Bologna, Genoa, and Stuttgart also appeared, although to a lesser extent (with higher emissions above Barcelona). Figure 12c shows the total particle burden (0–11 000 m) emitted from 5 of the 14 cities (Toulouse, Marseille, Palma, Castellón, and Tarragona) before the episode (left) and during the episode (right). The joint plume initially moved westward (27 June) within the persistent easterly regime, but on 28 and 29 June, the onset of the Tramontana and the WMB circulations forced its convergence into Barcelona from the south, east and north. Thus, the results again indicate multisource convergence from the main contributors in France, Spain, and Italy.
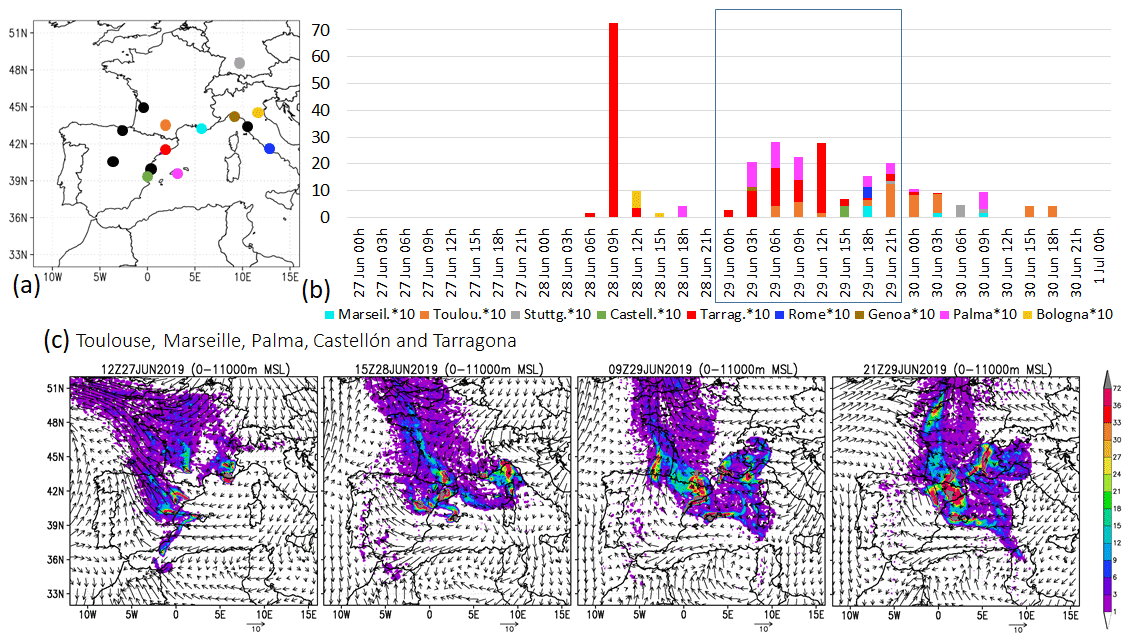
Figure 12Episode 2019. (b) Temporal evolution of impacts (number of tracer particles) emitted from cities shown in panel (a) reaching Barcelona PBL (Fabra). To account for (b) variations in impact intensity between Tarragona and other cities, the concentrations of the remaining cities were multiplied by 10. Cities not represented in the (b) bar chart had negligible contributions, shown as black dots in the map (a). (c) Burden of tracer particles (0–11 000 m) impacting Barcelona emitted from five selected cities: Toulouse, Marseille, Palma, Castellón, and Tarragona.
Photochemical model results
The results indicated high O3 concentrations on 27 June along the Besòs axis, consistent with the observed concentrations (Fig. 13). On the morning of 28 June and throughout the day, the simulated O3 concentrations were slightly higher, shifted towards the NE, and located in a relatively calm area. This was due to the convergence of SW winds and the Tramontana wind, suggesting O3 accumulation the night before. On 28 June, the sea breezes penetrated far less inland than on the previous day. The circulation induced by the Balearic daytime anticyclonic gyre carried the plume from the BMA through the Besòs axis in a northeastward direction, coinciding with IT exceedances observed at the surface (Fig. 11a). During the night of 28 to 29 June, the Tramontana winds caused the plume to return towards the sea. This plume could be enriched with O3 or precursors arriving from France, as inferred from the increased tropospheric NO2 levels shown in Fig. S15. Simulations show high integrated O3 concentrations over the BMA throughout that night, which, together with low-wind conditions, resulted in relatively high concentrations the next morning (Fig. 13).
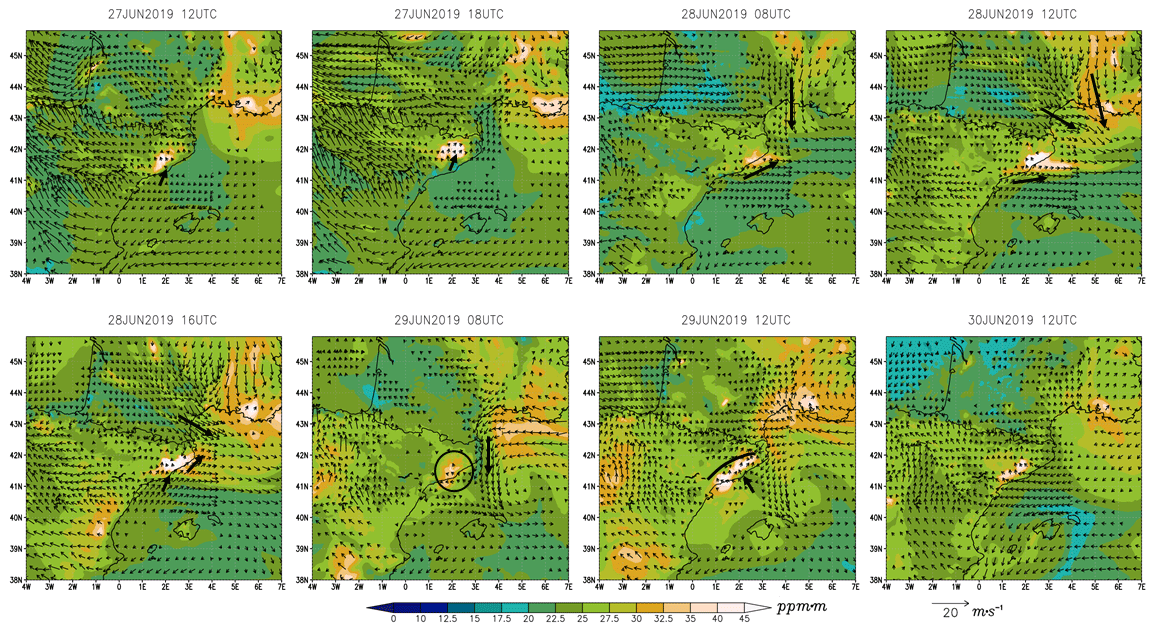
Figure 13Episode 2019. Simulated O3 concentrations (colour scale; in ppm m) integrated at 0–500 m a.g.l. and average wind fields (vectors) between 0 and 500 m a.g.l. Wind speeds < 2 m s−1 are not represented.
On 29 June (episode day), off the coast of Barcelona over the sea, TROPOMI detected high levels of NO2, consistent with the surface O3 titration suggested by the simulations (upper panels in Fig. S17). This was likely caused both by a very light nocturnal sea breeze that carried precursors out to sea and by the high emissions from the holiday exodus mentioned above. During the morning and midday, with relatively weak sea breezes, the entire O3-polluted air mass that was transported by the Tramontana during the previous day, combined with fresh NOx emissions along the coast, entered into the BMA, leading to the elevated O3 concentrations. Notably, the surface O3 concentrations observed in the city (Fig. 11) displayed two distinct peaks. The first peak was likely caused by the fumigation of the O3-polluted air mass before midday (bottom panels in Fig. S17), which was present at upper levels in a relatively warm and dry air mass and decoupled from the surface during the nighttime (Fig. S12). These observations highlight the presence of upper-level O3 pollution resulting from the vertical recirculation of pollution initiated on the day before (28 June) due to the onset of the Tramontana northwesterlies and the sea breeze convergence (easterlies) at the coastal strip.
On 30 June, upper-level winds changed to south and SW, also increasing their intensity and persisting for several days (Fig. S12). At the surface, sea breezes penetrated further inland, with no significant return flows due to the intensity of the upper-level southerlies. The simulation reproduced this behaviour with its subsequent O3 decrease in the BMA (not shown) and the associated decay of the episode.
Since at least the year 2000, Barcelona, situated in northeast Spain, has witnessed three extreme ozone (O3) episodes exceeding the EU's hourly Information Threshold (180 µg m−3). These episodes, observed in the summers of 2015, 2018, and 2019, are particularly concerning, considering Barcelona's status as the second most populous city in Spain. This study aims to comprehensively analyse their phenomenology using both experimental data and modelling tools to identify key drivers and provide predictive insights.
A key finding of this study is the consistent presence of common contributing factors across the three episodes. We summarise the most significant ones and, in specific cases, provide concentration-based estimates of O3 contributions linked to these factors, with the estimation process detailed in Sect. S4. Thus, the episodes are driven by the combined contribution of the following factors:
-
Prior O3 accumulation in the coastal regions adjacent to Barcelona. This factor results from vertical recirculation and accumulation processes in the days preceding all episodes (Querol et al., 2017, and references therein). Additionally, in the 2015 and 2019 events, a continuous contribution of O3 from the central Mediterranean is added due to a very similar synoptic situation, featuring inhibited Tramontana winds (northerly winds) and persistent easterly winds. In 2018, there is an earlier build-up of O3 at mid-tropospheric levels on a regional scale (see Torre-Pascual et al., 2024). Furthermore, the higher-than-normal temperatures during all three episodes, declared as heatwaves in 2018 and 2019, might have intensified O3 concentrations through various mechanisms (see Porter and Health, 2019, and references therein).
-
Weekend effect. In all cases, the episode day begins on Saturday, where the shift in pollutant emission patterns over the weekend results in an O3 weekend effect, leading to an increase of approximately 15 µg m−3 in O3 levels. This is in a similar range to that of the Castell-Balaguer et al. (2012) findings in a Mediterranean urban area within an air basin with O3 phenomenology comparable to that in our study (Querol et al., 2016).
-
Presence of Tramontana during the episode. In all episodes, Tramontana meteorological conditions prevail, starting on the day of the episode (in the case of 2015) or the day before (in the episodes of 2018 and 2019). These conditions (Gangoiti et al., 2001), can lead to inhibited or weakened summer breezes and convergence over the city of polluted air masses from regional/remote sources, including the recirculation of the local metropolitan plume. In all instances, these conditions also induce the mobilisation of previously accumulated O3 along the coastal areas (see factor 1) towards the city.
-
Multiregional convergence of polluted air masses. This factor is apparent in all episodes, with O3 contributions originating from at least two of the following source areas (see Sect. S4): (i) southern France through the Gulf of Lion (+20 µg m−3), the interior of the Mediterranean (+30–35 µg m−3), and/or the eastern Spanish coastal regions (+25–30 µg m−3), including the city of Barcelona itself.
Consequently, during these extreme episodes, a contribution of at least 45–65 µg m−3 is made to both the weekend effect (15 µg m−3) and the background levels, which have already initiated an accumulation in the preceding days (factor 1).
Some of these factors are readily observable or can be forecasted. First is the observation of recirculation and accumulation processes (inferred from the analysis of daily O3 cycles observed at specific monitoring stations). Second, the proximity to weekends or holidays, whose associated emission changes can trigger a weekend effect. Additionally, certain meteorologically related factors can be anticipated, including heatwaves or unusually high temperatures, weakened/absent breezes, stagnation at high altitudes, and/or the presence of Tramontana winds in the western Mediterranean Basin. Considering and understanding the potential effects of these factors and their interactions with the O3 phenomenology can contribute to the prediction of high O3 episodes in the city.
It is important for models to accurately reproduce the processes identified in this study. A subsequent step involves quantifying the diverse contributions of O3 and its precursors in detail, understanding their sources, and discerning key emitting sectors, among other aspects. Considering the observation that such episodes have occurred only in recent years, another future direction to explore is assessing whether urban episodes of this nature may become more prevalent in a context of global warming and declining anthropogenic emissions of O3 precursors.
The code and data utilised in this study are accessible upon request to the corresponding author (jordi.massague@idaea.csic.es).
The supplement related to this article is available online at: https://doi.org/10.5194/acp-24-4827-2024-supplement.
JM: conceptualisation; data curation; formal analysis; investigation; methodology; software; validation; visualisation; writing – original draft; writing – review and editing.
ETP: conceptualisation; data curation; formal analysis; investigation; methodology; software; validation; visualisation; writing – original draft; writing – review and editing.
CC: conceptualisation; data curation; formal analysis; investigation; methodology; software; visualisation; writing – review and editing.
ME: conceptualisation; formal analysis; investigation; supervision; methodology; software; validation; visualisation; writing – original draft; writing – review and editing.
AA: investigation; funding acquisition; supervision; formal analysis; investigation; methodology; software; validation; visualisation; writing – original draft; writing – review and editing.
MP: data curation; formal analysis; investigation; methodology; software; visualisation; writing – review and editing.
XQ: conceptualisation; formal analysis; funding acquisition; investigation; supervision; methodology; validation; visualisation; writing – original draft; writing – review and editing.
GG: conceptualisation; data curation; formal analysis; investigation; supervision; methodology; software; validation; visualisation; writing – original draft; writing – review and editing.
At least one of the (co-)authors is a member of the editorial board of Atmospheric Chemistry and Physics. The peer-review process was guided by an independent editor, and the authors also have no other competing interests to declare.
Publisher’s note: Copernicus Publications remains neutral with regard to jurisdictional claims made in the text, published maps, institutional affiliations, or any other geographical representation in this paper. While Copernicus Publications makes every effort to include appropriate place names, the final responsibility lies with the authors.
We wish to express our gratitude to the Spanish Ministry of Ecological Transition and Demographic Challenge for supporting this study within the framework of the Spanish Ozone Abatement Plan. Additionally, we acknowledge the support received from the Generalitat de Catalunya (grant no. AGAUR 2021 SGR 00447) and the University of the Basque Country (UPV/EHU) for providing financial support through the GIA Consolidated Research Groups (GIU21/050) (https://www.ehu.eus/es/web/gia, last access: 16 April 2024). We also thank the Spanish Ministry of Universities and the European Union for the Margarita Salas Grant (grant no. MARSA21/23) awarded to Eduardo Torre-Pascual, which was funded by the European Union – NextGenerationEU. These funding bodies have solely provided financial assistance for this study. We would also like to extend our appreciation to Yolanda Sola (University of Barcelona, Faculty of Physics) for providing data from the radiosoundings, Ana Rodríguez-García for producing figures for the validation of the photochemical model simulations, the European Environment Agency (EEA) for providing air quality data from European monitoring stations, Meteocat for supplying meteorological surface data, the European Space Agency (ESA) for remote-sensing NO2 data (Sentinel-5 Precursor, TROPOMI), https://www.wetterzentrale.de (last access: 16 April 2024) for the synoptic maps, and QGIS for their open-source GIS software. Finally, we acknowledge the anonymous reviewers whose insightful comments and discussions significantly contributed to improving this work.
This research has received financial support from the Spanish Ministry of Ecological Transition and Demographic Challenge, the Generalitat de Catalunya (grant no. AGAUR 2021 SGR 00447), the University of the Basque Country (UPV/EHU) (grant no. GIU21/050) and Eduardo Torre-Pascual's Margarita Salas grant (grant no. MARSA21/23).
The article processing charges for this open-access publication were covered by the CSIC Open Access Publication Support Initiative through its Unit of Information Resources for Research (URICI).
This paper was edited by Joshua Fu and reviewed by two anonymous referees.
Barros, N., Borrego, C., Toll, I., Soriano, C., Jiménez, P., and Baldasano, J. M.: Urban Photochemical Pollution in the Iberian Peninsula: Lisbon and Barcelona Airsheds, J. Air Waste Manage., 53, 347–359, 2003.
Castell, N., Mantilla, E., and Millán, M. M.: Analysis of tropospheric ozone concentration on a Western Mediterranean site: Castellon (Spain), Environ. Monit. Assess., 136, 3–11, 2008.
Castell-Balaguer, N., Téllez, L., and Mantilla, E.: Daily, seasonal and monthly variations in ozone levels recorded at the Turia river basin in Valencia (Eastern Spain), Environ. Sci. Pollut. R., 19, 3461–3480, https://doi.org/10.1007/s11356-012-0881-5, 2012.
Chevalier, A., Gheusi, F., Delmas, R., Ordóñez, C., Sarrat, C., Zbinden, R., Thouret, V., Athier, G., and Cousin, J.-M.: Influence of altitude on ozone levels and variability in the lower troposphere: a ground-based study for western Europe over the period 2001–2004, Atmos. Chem. Phys., 7, 4311–4326, https://doi.org/10.5194/acp-7-4311-2007, 2007.
Crippa, M., Guizzardi, D., Muntean, M., Schaaf, E., Dentener, F., van Aardenne, J. A., Monni, S., Doering, U., Olivier, J. G. J., Pagliari, V., and Janssens-Maenhout, G.: Gridded emissions of air pollutants for the period 1970–2012 within EDGAR v4.3.2, Earth Syst. Sci. Data, 10, 1987–2013, https://doi.org/10.5194/essd-10-1987-2018, 2018.
Dieguez, J. J., Millán, M., Padilla, L., and Palau, J. L.: Estudio y evaluación de la contaminación atmosférica por ozono troposférico en España, CEAM Report for the Ministry of Agriculture, Food and Environment, INF FIN/O3/2009, 372 pp., https://www.miteco.gob.es/content/dam/miteco/es/calidad-y-evaluacion-ambiental/temas/atmosfera-y-calidad-del-aire/8_A_Informe final ozono-ceam Julio 2009_tcm30-188048.pdf (last access: 16 April 2024), 2009.
Dieguez, J. J., Calatayud, V., and Mantilla, E.: CEAM Report for the Ministry of Agriculture, Food and Environment, Fundación Biodiversidad, Informe Final, Memoria Técnica Proyecto CONOZE, CONtaminación por OZono en España, 137 pp., 2014.
EEA: Air quality in Europe – 2020 report, European Environment Agency, EEA Report, No. 09/2020, 160 pp., https://doi.org/10.2800/786656, 2020.
EC: Directive 2008/50/EC, Of The European Parliament And Of The Council of 21 May 2008 on ambient air quality and cleaner air for Europe, http://eur-lex.europa.eu/legal-content/ES/TXT/?uri=CELEX:32008L0050 (last access: 30 December 2022), 2008.
EPA: U.S. Environmental Protection Agency. SPECIATE Version 4.5, Database Development Documentation, EPA/600/R-16/294, https://www.epa.gov/sites/default/files/2016-09/documents/speciate_4.5.pdf (last access: 16 April 2024), 2016.
Escudero, M., Segers, A., Kranenburg, R., Querol, X., Alastuey, A., Borge, R., de la Paz, D., Gangoiti, G., and Schaap, M.: Analysis of summer O3 in the Madrid air basin with the LOTOS-EUROS chemical transport model, Atmos. Chem. Phys., 19, 14211–14232, https://doi.org/10.5194/acp-19-14211-2019, 2019.
Fowler, D., Pilegaard, K., Sutton, M. A., Ambus, P., Raivonen, M., Duyzer, J., Simpson, D., Fagerli, H., Fuzzi, S., Schjoerring, J. K., Granier, C., Neftel, A., Isaksen, I. S. A., Laj, P., Maione, M., Monks, P. S., Burkhardt, J., Daemmgen, U., Neirynck, J., Personne, E., Wichink-Kruit, R., Butterbach-Bahl, K., Flechard, C., Tuovinen, J. P., Coyle, M., Gerosa, G., Loubet, B., Altimir, N., Gruenhage, L., Ammann, C., Cieslik, S., Paoletti, E., Mikkelsen, T. N., Ro-Poulsen, H., Cellier, P., Cape, J. N., Horváth, L., Loreto, F., Niinemets, Ü., Palmer, P. I., Rinne, J., Misztal, P., Nemitz, E., Nilsson, D., Pryor, S., Gallagher, M. W., Vesala, T., Skiba, U., Brüggemann, N., Zechmeister-Boltenstern, S., Williams, J., O’Dowd, C., Facchini, M. C., De Leeuw, G., Flossman, A., Chaumerliac, N., and Erisman, J. W.: Atmospheric composition change: Ecosystems-Atmosphere interactions, Atmos. Environ., 43, 5193–5267, https://doi.org/10.1016/j.atmosenv.2009.07.068, 2009.
Gangoiti, G., Millán, M. M., Salvador, R., and Mantilla, E.: Long range transport and recirculation of pollutants in the western Mediterranean during the project Regional Cycles of Air Pollution in the West-Central Mediterranean Area, Atmos. Environ., 35, 6267–6276, 2001.
Gangoiti, G. Alonso, L., Navazo, M., Albizuri, A., Perez-Landa, G., Matabuena, M., Valdenebro, V., Maruri, M., Antonio García, J., and Millán, M. M.: Regional transport of pollutants over the Bay of Biscay: analysis of an ozone episode under a blocking anticyclone in west-central Europe, Atmos. Environ., 36, 1349–1361, 10.1016/S1352-2310(01)00536-2, 2002.
Gangoiti, G., Albizuri, A., Alonso, L., Navazo, M., Matabuena, M., Valdenebro, V., García, J. A., and Millán, M. M.: Sub-continental transport mechanisms and pathways during two ozone episodes in northern Spain, Atmos. Chem. Phys., 6, 1469–1484, https://doi.org/10.5194/acp-6-1469-2006, 2006.
Gangoiti, G., Sáez de Cámara, E., Alonso, L., Navazo, Gómez, M. C., Iza, J., García, J. A., Ilardia, J. L., and Millán, M. M.: Origin of the water vapor responsible for the European extreme rainfalls of August 2002: 1. High-resolution simulations and tracking of air masses, J. Geophys. Res., 116, D21102, https://doi.org/10.1029/2010JD015530, 2011.
GBD: Global Burden of Disease Study 2016 Cause-Specific Mortality 1980–2016, Seattle, United States: Institute for Health Metrics and Evaluation (IHME), https://doi.org/10.1016/S0140-6736(17)32152-9, 2016.
Gencat: Llista de superacions i informes anuals. Medi Ambient i Sostenibilitat, https://mediambient.gencat.cat/ca/05_ambits_dactuacio/atmosfera/qualitat_de_laire/avaluacio/campanya_ozo/Llista-superacions-i-informes-anuals/ (last access: 14 July 2022), 2022.
Gonçalves, M., Jiménez-Guerrero, P., and Baldasano, J. M.: Contribution of atmospheric processes affecting the dynamics of air pollution in South-Western Europe during a typical summertime photochemical episode, Atmos. Chem. Phys., 9, 849–864, https://doi.org/10.5194/acp-9-849-2009, 2009.
Gorelick, N., Hancher, M., Dixon, M., Ilyushchenko, S., Thau, D., and Moore, R.: Google Earth Engine: planetary-scale geospatial analysis for everyone, Remote Sens. Environ., 202, 18–27, 2017.
Guo, Y., Gasparrini, A., Armstrong, B. G., Tawatsupa, B., Tobias, A., Lavigne, E., Coelho, M. D. S. Z. S., Pan, X., Kim, H., Hashizume, M., Honda, Y., Guo, Y. L., Wu, C.-F., Zanobetti, A., Schwartz, J. D., Bell, M. L., Overcenco, A., Punnasiri, K., Li, S., Tian, L., Saldiva, P., Williams, G., and Tong, S.: Temperature variability and mortality: a multi-country study, Environ. Health Persp., 124, 1554–1559, 2017.
Heuss, J. M., Kahlbaum, D. F., and Wolff, G. T.: Weekday/Weekend ozone differences: what can we learn from them?, J. Air Waste Manage., 53, 772–788, 2003.
Holzworth, G. C.: Estimates of mean maximum mixing depths in the contiguous United States, Mon. Weather Rev., 92, 235–242, 1964.
In't Veld, M., Carnerero, C., Massagué, J., Alastuey, A., De La Rosa, J. D., Sánchez De La Campa, A. M., Escudero, M., Mantilla, E., Gangoiti, G., García-Pando, C. P., Olid, M., Moreta, J. R., Hernández, J. L., Santamaría, J., Millán, M., and Querol, X.: Understanding the local and remote source contributions to ambient O3 during a pollution episode using a combination of experimental approaches in the Guadalquivir valley, Southern Spain, Sci. Total Environ., 777, 144579, https://doi.org/10.1016/j.scitotenv.2020.144579, 2021.
IPCC: Climate Change 2021: The Physical Science Basis. Contribution of Working Group I to the Sixth Assessment Report of the Intergovernmental Panel on Climate Change. Cambridge University Press, Cambridge, United Kingdom and New York, NY, USA, 2391 pp., https://doi.org/10.1017/9781009157896, 2021.
Jaén, C. Udina, M., and Bech, J.: Analysis of two heat wave driven ozone episodes in Barcelona and surrounding region: Meteorological and photochemical modeling, Atmos. Environ., 146, 118037, https://doi.org/10.1016/j.atmosenv.2020.118037, 2021.
Jiménez, P., Parra, R., Gassó, S., and Baldasano, J. M.: Modeling the ozone weekend effect in very complex terrains: a case study in the Northeastern Iberian Peninsula, Atmos. Environ., 39, 429–444, https://doi.org/10.1016/j.atmosenv.2004.09.065, 2005.
Kalabokas, P., Hjorth, J., Foret, G., Dufour, G., Eremenko, M., Siour, G., Cuesta, J., and Beekmann, M.: An investigation on the origin of regional springtime ozone episodes in the western Mediterranean, Atmos. Chem. Phys., 17, 3905–3928, https://doi.org/10.5194/acp-17-3905-2017, 2017.
Massagué, J., Carnerero, C., Escudero, M., Baldasano, J. M., Alastuey, A., and Querol, X.: 2005–2017 ozone trends and potential benefits of local measures as deduced from air quality measurements in the north of the Barcelona metropolitan area, Atmos. Chem. Phys., 19, 7445–7465, https://doi.org/10.5194/acp-19-7445-2019, 2019.
Massagué, J., Escudero, M., Alastuey, A., Mantilla, E., Monfort, E., Gangoiti, G., Pérez García-Pando, C., and Querol, X.: Spatiotemporal variations of tropospheric ozone in Spain (2008–2019), Environ. Int., 176, 107961, ttps://doi.org/10.1016/j.envint.2023.107961, 2023.
Meteocat: Butlletí climàtic mensual, Servei Meteorològic de Catalunya, https://www.meteo.cat/wpweb/climatologia/butlletins-i-episodis-meteorologics/butlleti-mensual/#mesan (last access: 16 April 2024), 2022.
MITMA: Áreas Urbanas en España, Ministerio de Transportes, Movilidad y Agencia Urbana, DG de Vivienda y Suelo. NIPO: 796-20-112-X, https://cvp.mitma.gob.es/areas-urbanas-en-espana--2021 (last access: 16 April 2024), 2021.
Millán, M. M.: Extreme hydrometeorological events and climate change predictions in Europe, J. Hydrol., 518B, 206–224, 2014.
Millán, M. M., Salvador, R., Mantilla, E., and Kallos, G.: Photooxidant dynamics in the Mediterranean basin in summer: Results from European research projects, J. Geophys. Res., 102, 8811–8823, 1997.
Millán, M. M., Mantilla, E., Salvador, R., Carratalá, A., Sanz, M. J., Alonso, L., Gangoiti, G., and Navazo, M.: Ozone Cycles in the Western Mediterranean Basin: Interpretation of Monitoring Data in Complex Coastal Terrain, J. Appl. Meteorol., 39, 487–508, 2000.
Millán, M. M., Sanz, M. J., Salvador, R., and Mantilla, E.: Atmospheric dynamics and ozone cycles related to nitrogen deposition in the western Mediterranean, Environ. Pollut., 118, 167–186, 2002.
Monks, P. S., Archibald, A. T., Colette, A., Cooper, O., Coyle, M., Derwent, R., Fowler, D., Granier, C., Law, K. S., Mills, G. E., Stevenson, D. S., Tarasova, O., Thouret, V., von Schneidemesser, E., Sommariva, R., Wild, O., and Williams, M. L.: Tropospheric ozone and its precursors from the urban to the global scale from air quality to short-lived climate forcer, Atmos. Chem. Phys., 15, 8889–8973, https://doi.org/10.5194/acp-15-8889-2015, 2015.
Observatori Fabra: RACAB. Dades meteorològiques i climàtiques. Resums anuals, https://observatorifabra.cat/meteorologia/dades-metereologiques-i-climatiques/ (last access: 16 April 2024), 2022.
Pay, M. T., Gangoiti, G., Guevara, M., Napelenok, S., Querol, X., Jorba, O., and Pérez García-Pando, C.: Ozone source apportionment during peak summer events over southwestern Europe, Atmos. Chem. Phys., 19, 5467–5494, https://doi.org/10.5194/acp-19-5467-2019, 2019.
Pérez, C., Sicard, M., Jorba, O., Comerón, A., and Baldasano, J. M.: Summertime re-circulations of air pollutants over the north-eastern Iberian coast observed from systematic EARLINET lidar measurements in Barcelona, Atmos. Environ., 38, 3983–4000, 2004.
Porter, W. C. and Heald, C. L.: The mechanisms and meteorological drivers of the summertime ozone–temperature relationship, Atmos. Chem. Phys., 19, 13367–13381, https://doi.org/10.5194/acp-19-13367-2019, 2019.
Pu, X., Wang, T., Huang, X., Melas, D., Zanis, P., Papanastasiou, D., and Poupkou, A.: Enhanced surface ozone during the heat wave of 2013 in yangtze river Delta region, China Sci. Total Environ., 603, 807–816, https://doi.org/10.1016/j.scitotenv.2017.03.056, 2017.
Querol, X., Alastuey, A., Orio, A., Pallares, M., Reina, F., Dieguez, J. J., Mantilla, E., Escudero, M., Alonso, L., Gangoiti, G., and Millán, M.: On the origin of the highest ozone episodes in Spain, Sci. Total Environ., 572, 379–389, 2016.
Querol, X., Gangoiti, G., Mantilla, E., Alastuey, A., Minguillón, M. C., Amato, F., Reche, C., Viana, M., Moreno, T., Karanasiou, A., Rivas, I., Pérez, N., Ripoll, A., Brines, M., Ealo, M., Pandolfi, M., Lee, H.-K., Eun, H.-R., Park, Y.-H., Escudero, M., Beddows, D., Harrison, R. M., Bertrand, A., Marchand, N., Lyasota, A., Codina, B., Olid, M., Udina, M., Jiménez-Esteve, B., Soler, M. R., Alonso, L., Millán, M., and Ahn, K.-H.: Phenomenology of high-ozone episodes in NE Spain, Atmos. Chem. Phys., 17, 2817–2838, https://doi.org/10.5194/acp-17-2817-2017, 2017.
Querol, X., Alastuey, A., Gangoiti, G., Perez, N., Lee, H. K., Eun, H. R., Park, Y., Mantilla, E., Escudero, M., Titos, G., Alonso, L., Temime-Roussel, B., Marchand, N., Moreta, J. R., Revuelta, M. A., Salvador, P., Artíñano, B., García dos Santos, S., Anguas, M., Notario, A., Saiz-Lopez, A., Harrison, R. M., Millán, M., and Ahn, K.-H.: Phenomenology of summer ozone episodes over the Madrid Metropolitan Area, central Spain, Atmos. Chem. Phys., 18, 6511–6533, https://doi.org/10.5194/acp-18-6511-2018, 2018.
Ramboll Environment and Health: User's Guide: Comprehensive Air Quality Model with Extensions, Version 6.5, Novato, California, https://www.camx.com/Files/CAMxUsersGuide_v6.50.pdf (last access: 16 April 2024), 2018.
Seco, R., Peñuelas, J., Filella, I., Llusià, J., Molowny-Horas, R., Schallhart, S., Metzger, A., Müller, M., and Hansel, A.: Contrasting winter and summer VOC mixing ratios at a forest site in the Western Mediterranean Basin: the effect of local biogenic emissions, Atmos. Chem. Phys., 11, 13161–13179, https://doi.org/10.5194/acp-11-13161-2011, 2011.
Sillman, S.: The relation between ozone, NOx and hydrocarbons in urban and polluted rural environments, Atmos. Environ., 33, 1821–1845, https://doi.org/10.1016/S1352-2310(98)00345-8, 1999.
Sillman, S. and He, D.: Some theoretical results concerning O3-NOx-VOC chemistry and NOx-VOC indicators, J. Geophys. Res., 107, 4659, https://doi.org/10.1029/2001JD001123, 2002.
Solberg, S., Bergström, R., Langner, J., Laurila, T., and Lindskog, A.: Changes in Nordic surface ozone episodes due to European emission reductions in the 1990s, Atmos. Environ., 39, 179–192, 2005.
Toll, I. and Baldasano, J. M.: Modeling of photochemical air pollution in the Barcelona area with highly disaggregated anthropogenic and biogenic emissions, Atmos. Environ., 34, 3069–3084, https://doi.org/10.1016/S1352-2310(99)00498-7, 2000.
Torre-Pascual, E., Sáez de Cámara, E., Gangoiti, G., and Zuazo, I.: Biogenic VOC Emission Modeling for Spain: Adaptation of the National Forest Inventory as Input for MEGANv3, Air Pollution Modeling and its Application XXVII, edited by: Mensink, C. and Volker, M., 45–50, Springer, https://doi.org/10.1007/978-3-662-63760-9_7, 2021.
Torre-Pascual, E., Gangoiti, G., Rodríguez-García, A., Sáez de Cámara, E., Ferreira, J., Gama, C., Gómez, M. C., Zuazo, I., García, J. A., and de Blas, M.: Analysis of an intense O3 pollution episode on the Atlantic coast of the Iberian Peninsula using photochemical modeling: characterization of transport pathways and accumulation processes, Atmos. Chem. Phys., 24, 4305–4329, https://doi.org/10.5194/acp-24-4305-2024, 2024.
Valverde, V., Pay, M. T., and Baldasano, J. M.: Ozone attributed to Madrid and Barcelona on-road transport emissions: characterization of plume dynamics over the Iberian Peninsula, Sci. Total Environ., 543, 670–682, 2016.
Van Geffen, J., Eskes, H. J., Boersma, K. F., Maasakkers, J. D., and Veefkind, J. P.: TROPOMI ATBD of the total and tropospheric NO2 data products. Royal Netherlands Meteorological Institute, #S5P-KNMI-L2–0005-RP, https://sentinels.copernicus.eu/documents/247904/2476257/Sentinel-5P-TROPOMI-ATBD-NO2-data-products.pdf/7a4fdde7-516e-48e7-bf44-da60c62b1e4d?t=1658312240128 (last access: 16 April 2024), 2019.
Vautard, R., Beekmann, M., Desplat, J., Hodzic, A., and Morel, S.: Air quality in Europe during the summer of 2003 as a prototype of air quality in a warmer climate, CR Geosci., 339, 747–763, https://doi.org/10.1016/j.crte.2007.08.003, 2007.
Veefkind, J. P., Aben, I., McMullan, K., Föorster, H., deVries, J., Otter, G., Claas, J., Eskes, H. J., De Haan, J. F., Kleipool, Q., and Van Weele, M.: TROPOMI on the ESA Sentinel-5 Precursor: a GMES mission for global observations of the atmospheric composition for climate, air quality and ozone layer applications. Remote Sens. Environ., 120, 70–83, https://doi.org/10.1016/j.rse.2011.09.027, 2012.
WHO: Global Air Quality Guidelines. Particulate matter (PM2.5 and PM10), ozone, nitrogen dioxide, sulphur dioxide and carbon monoxide, Geneva: World Health Organization, https://www.who.int/publications/i/item/9789240034228 (last access: 25 January 2021), 2021.