the Creative Commons Attribution 4.0 License.
the Creative Commons Attribution 4.0 License.
 | 17 Apr 2024
Constraining long-term NOx emissions over the United States and Europe using nitrate wet deposition monitoring networks
Loretta J. Mickley
Nitrogen oxides (NOx= NO + NO2) play a critical role in regulating tropospheric chemistry, yet NOx emission estimates are subject to large uncertainties, casting doubt on our ability to accurately model secondary pollutants such as ozone. Bottom-up emissions inventories are subject to a number of uncertainties related to estimates of emission activities, scaling factors, and fuel sources. Here, we provide an additional constraint on NOx emissions and trends using nitrate wet deposition (NWD) fluxes from the United States National Atmospheric Deposition Program (NADP) and the European Monitoring and Evaluation Programme (EMEP). We use these NWD measurements to evaluate anthropogenic and total NOx trends and magnitudes in the global Community Emissions Data System (CEDS) emissions inventory and the GEOS-Chem chemical transport model from 1980–2020. Over both the United States and Europe, observed NWD trends track well with anthropogenic NOx emissions from the CEDS inventory until 2010, after which NWD trends level out in contrast to continued decreases in CEDS. After 2010, NWD trends are able to reproduce total NOx emissions trends when the influences of both anthropogenic and background sources are considered. Observed NWD fluxes are also able to capture NOx emissions decreases over the 2020 COVID-19 lockdown period and are consistent with satellite and surface measurements of NO2. These results suggest that NWD fluxes constrain total NOx emissions well, whether trends are driven by anthropogenic or background sources. We further compare modeled and observed NWD to provide an additional line of evidence for potential overestimates of anthropogenic NOx in emissions inventories. Over the United States, we find that NWD is overestimated in summer from 1980–2017 by 15 %–20 % on average (interquartile range: 11 %–31 %), with overestimates most prominent in the eastern US after 2000 (20 % on average), implying an overestimate of NOx emissions in the CEDS inventory (0.5×0.5° resolution). Over Europe, we find that modeled NWD is overestimated in all seasons from 1980–2017, with the strongest average overestimates occurring in summer and fall (175 % and 170 %, respectively). These overestimates may be reduced by cutting anthropogenic NOx emissions by 50 % in CEDS over Europe (i.e., cutting the 1980–2017 average annual emissions from 2.6 to 1.3 Tg N), but summertime and fall NOx may still need to be reduced further for observations and models to align. Overestimates may extend to other inventories such as the EMEP inventory, which estimates comparable but lower emissions than CEDS, with a 1990–2017 average of 2.1 Tg N relative to the CEDS 1990–2017 average of 2.4 Tg N. We find that NOx emission reductions over Europe improve model ozone at the surface, reducing the model summertime ozone overestimate from 14 % to 2 %.
- Article
(5959 KB) - Full-text XML
-
Supplement
(1263 KB) - BibTeX
- EndNote


Nitrogen oxides (NOx), the sum of nitric oxide (NO) and nitrogen dioxide (NO2), play a critical role in regulating ozone, aerosol, and hydroxyl radical levels in the troposphere (Monks et al., 2009; Murray et al., 2013; Hu et al., 2017). Direct exposure to NOx is linked to increased instances of childhood asthma (Takenoue et al., 2012; Gauderman et al., 2005). Health impacts of the photochemical products of NOx, such as ozone and particulate matter, include respiratory illness, cardiovascular disease, and premature mortality (Burnett et al., 2014; Pope et al., 2015; Turner et al., 2011; Monks et al., 2015; Bell et al., 2006). At the surface, NOx has a short lifetime of 4–21 h depending on season (Shah et al., 2020; Liu et al., 2016; Laughner and Cohen, 2019) and is rapidly oxidized to higher oxides such as peroxy nitrates (RO2NO2), alkyl nitrates (RONO2), and nitric acid (HNO3), which are typically removed via deposition (Kenagy et al., 2018). Recent observations have shown increases in NOx lifetimes of a few hours since 2006 (Laughner and Cohen, 2019), which may increase the distance NOx travels before it eventually deposits. However, the small increase in lifetimes is not expected to substantially impact wet deposition since deposition processes such as rainout occur on longer timescales (e.g., days). This suggests that NWD measurements can be used over long timeframes to track NOx emissions trends, despite potential changes in NOx lifetime over decades. Nitric acid deposits as acid rain and negatively impacts plant and wildlife health (Singh and Agrawal, 2008). Anthropogenic fossil fuel combustion contributes to a majority of total NOx emissions, while natural processes such as biomass burning, soil microbial activities, and lightning are important sources for certain seasons and regions. Anthropogenic NOx emissions have shifted rapidly in the past few decades due to emissions control regulations, technological innovations, and economic development (Lamsal et al., 2011; Duncan et al., 2016; Krotkov et al., 2016; Barkley et al., 2017; Miyazaki et al., 2017; Jiang et al., 2018).
Bottom-up NOx emissions estimates are subject to many uncertainties, hindering the accurate estimation of NOx emissions in inventories commonly used in atmospheric chemistry models and thus representation of secondary products such as ozone and particulate matter. Bottom-up inventories are typically calculated by accounting for all activities that generate emissions, then applying measurement- or model-based emission factors to those activities. Emission factors of anthropogenic sources depend on fuel type, technology, and combustion condition. In addition, natural sources of NOx are also difficult to quantify in part due to their sporadic nature. Top-down studies based on urban or near-source NOx emissions suggest that mobile emissions are overestimated in many emissions inventories (McDonald et al., 2013; Anderson et al., 2014; Canty et al., 2015; Goldberg et al., 2016; McDonald et al., 2018; Kota et al., 2014). For example, NOx emissions from the United States (US) Environmental Protection Agency (EPA) National Emissions Inventory (NEI) must be reduced by 30 %–60 % in order to reconcile models with aircraft observations of NOx and ozone in the southeastern US during summer 2013 (Travis et al., 2016; McDonald et al., 2018). Most top-down studies have attributed model–observation disagreements to emissions errors from mobile sources, as power plant emissions in the US are considered to be better known due to regulatory continuous emission monitoring systems (CEMS) that report hourly averaged emissions (Frost et al., 2006; Peischl et al., 2010). On an annual basis, total mobile emissions from diesel engines generally agree well with NEI estimates (Dallmann and Harley, 2010), but the source contributions to these totals do not agree. Dallman and Harley (2010) found that on-road diesel emissions may be underestimated in the NEI 2005, indicating uncertainty in source sectors and emission factors. However, other analyses performed during wintertime showed good agreement between aircraft measurements and both the NEI 2011 and NEI 2014 (Salmon et al., 2018; Jaeglé et al., 2018).
Figure 1 shows estimates of on-road mobile emissions from various emissions inventories and inferred emissions from ground, aircraft, and satellite-based observations (Jiang et al., 2018; Travis et al., 2016; Parrish, 2006), providing a further illustration of the wide range of NOx emissions estimates within and between inventories and measurements. Magnitudes do not agree across different estimates, even amongst the EPA NEI from different years, although it should be noted that methods for calculating NEI estimates change from year to year (e.g., NEI 2003 vs. NEI 2007 vs. NEI 2017), and previous NEI version estimates are not changed to reflect these updates. For example, the most recent NEI (2017) used an updated version of the Motor Vehicle Emissions Simulator (MOVES) model, increasing non-road NOx emissions estimates from previous NEIs. While NEI versions are not meant to be used as a time series, the large changes in NOx magnitudes between NEI versions brought about by updated methods illustrate the uncertainty inherent in NOx emissions inventories. Emissions inventories show similar trends after 2005 but differ greatly in trends prior to 2005 (Fig. S1 in the Supplement). Disagreement in magnitudes and trends amongst a wide variety of bottom-up and top-down emissions inventories occurs in many regions around the world and highlights the uncertainty in current NOx emissions estimates (Elguindi et al., 2020).
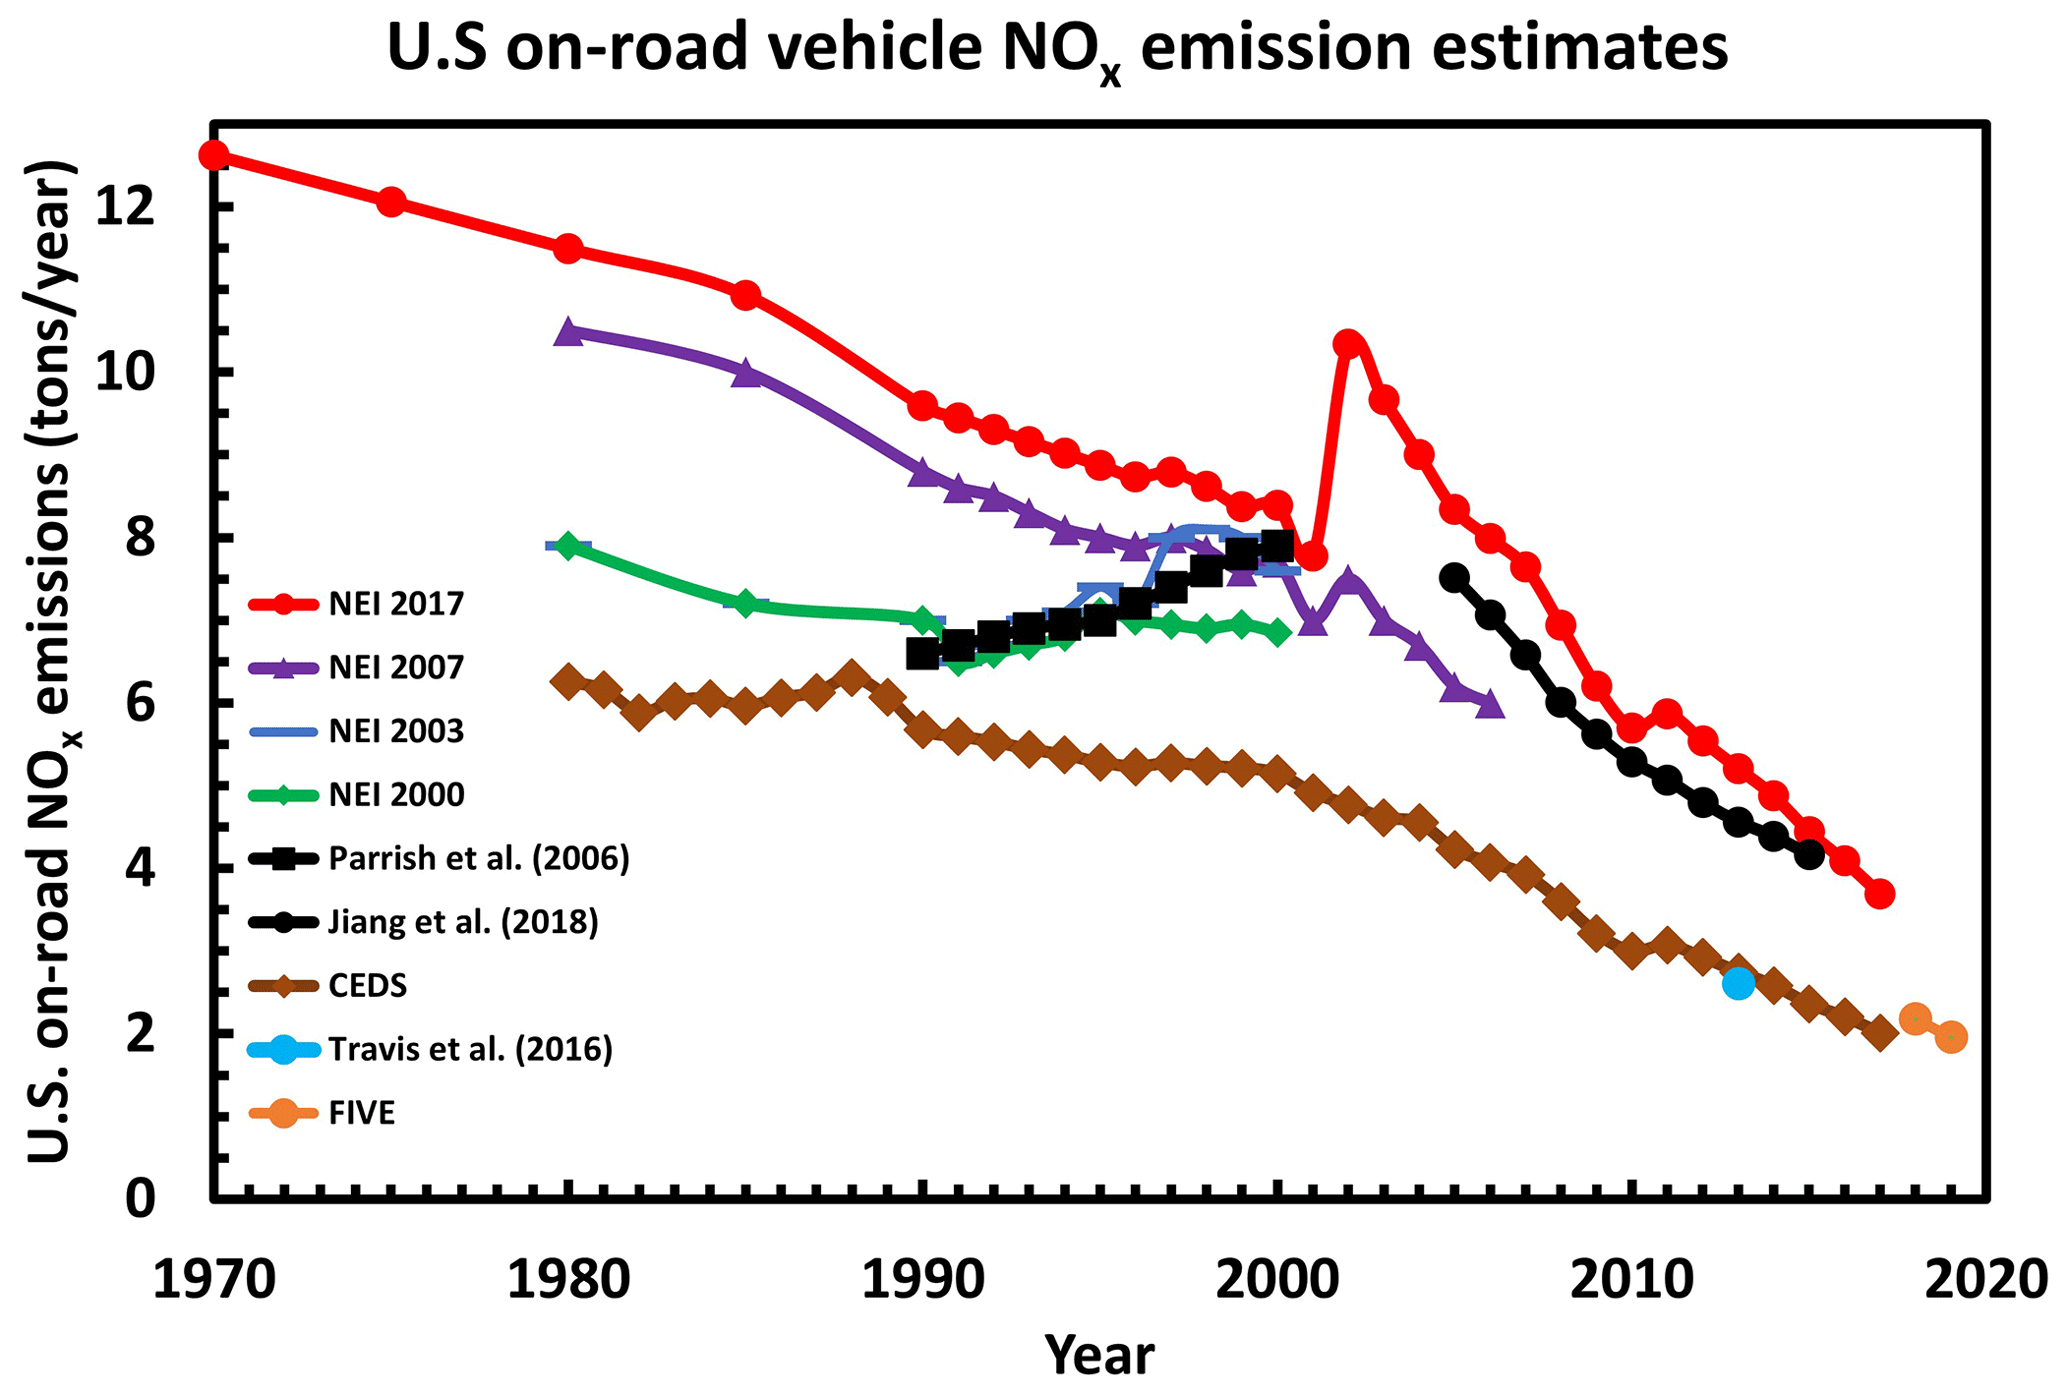
Figure 1Comparison of US on-road mobile NOx emissions estimates from the NEI, the Community Emissions Data System (CEDS) inventory, the Fuel-Based Inventory for Vehicle Emissions (FIVE) (Harkins et al., 2021), and satellite, ground, and aircraft-based measurements. Note that the jump in the NEI 2017 between 2001 and 2002 is due to a change in the emissions model used for mobile sources (from MOBILE6.2 to MOVES 2010), not from real increases in NOx emissions from mobile sources. Values from the NEI, CEDS, and FIVE inventories are taken directly from the on-road vehicle emissions sectors. The estimate from Travis et al. (2016) was obtained by scaling highway vehicle emissions from the NEI 2014 by 50 %, as suggested in their work to align model ozone values with observations. Values from Jiang et al. (2018) and Parrish (2006) were taken directly from their respective analyses.
Recent studies have shown discrepancies in NOx trends between bottom-up emissions inventories and observational constraints (Jiang et al., 2018; Silvern et al., 2019; Elguindi et al., 2020). For example, Jiang et al. (2018) and Silvern et al. (2019) noted a slowdown in the decrease in NOx emissions over the US after 2010 in satellite NO2 and ground-based nitrate wet deposition (NWD) measurements that was not represented in the NEI. In this post-2010 period, NEI NOx emissions continued to decrease steadily, while both satellite and NWD measurements leveled off. Silvern et al. (2019) suggested that this leveling off of NOx emissions trends was due to anthropogenic emissions becoming less prominent in recent years, allowing relatively steady background NOx emissions (e.g., lightning, soils) to play a larger role in determining total NOx trends. More recently, He et al. (2022) applied a deep learning model to investigate drivers of observed NOx trends and confirmed that satellite NO2 measurements were more representative of background sources, leading to a slowdown in NOx decreases. This idea will be explored in depth in this work in Sect. 3.1 and 3.2.
Traditional top-down evaluations of emissions inventories often use surface monitoring networks, aircraft campaigns, and satellite measurements as constraints (Anderson et al., 2014; Brioude et al., 2013; Canty et al., 2015; Castellanos et al., 2011; Jaeglé et al., 2018; Jiang et al., 2018; Lamsal et al., 2011; Oner and Kaynak, 2016; Salmon et al., 2018; Souri et al., 2016; Szymankiewicz et al., 2021; Goldberg et al., 2019), yet these methods contain limitations. Ground-based NO2 monitoring stations are primarily located in urban areas that mostly reflect local emissions due to the short lifetime of NO2, and thus they are not representative of an entire region. Aircraft campaigns collect intensive measurements during a short period but only offer information for a few snapshots in the weeks they are conducted. Daily satellite retrievals improve on spatial and temporal limitations of aircraft and surface measurements, but these measurements are more sensitive to free-tropospheric than boundary layer NO2 by a factor of 3–4 (Martin, 2002; Krotkov et al., 2017), confounding satellite-derived trends for near-surface NOx. Further, satellite-derived NO2 columns rely on air mass factors calculated from atmospheric models which employ a priori estimates of gas vertical profiles. These profiles also contain errors in their representation of transport and chemical processes (Elguindi et al., 2020; Jiang et al., 2013; Stavrakou et al., 2013), which can stem from uncertainties in the observations used to constrain the models. Current low-orbital satellites also detect at only one time point every day or every few days. As NOx emissions show strong diurnal patterns and changes with planetary boundary layer height, these single-time-point observations may not be fully representative of emissions.
Long-term, regular measurements of NWD located in non-urban areas provide another independent and often overlooked constraint on NOx emissions that is sensitive to anthropogenic and background sources of NOx. NOx is quickly oxidized to form nitric acid gas and nitrate aerosol, both of which are scavenged efficiently by precipitation. The magnitude of nitrate deposited via precipitation is related to total NOx emissions due to the short lifetime of NOx (Silvern et al., 2019). Most NOx is derived from combustion processes, and thus NWD is closely related to anthropogenic sources (Butler et al., 2003; Galloway et al., 2003; Du et al., 2014; Paulot et al., 2014; Sickles II and Shadwick, 2015; Li et al., 2016). Background sources of NOx, such as soils and lightning, also contribute substantially to NWD (Zhang et al., 2012). Both the US National Atmospheric Deposition Program (NADP) and the European Monitoring and Evaluation Programme (EMEP) have been monitoring atmospheric composition, including precipitation chemistry, since the 1970s, providing a long-term, independent network of observations that can be related to NOx emissions (Tørseth et al., 2012; Lamb and Bowersox, 2000). Both networks are designed for sampling regionally representative background air and precipitation chemistry with high quality control procedures (Tørseth et al., 2012; Lamb and Bowersox, 2000).
Here, we use long-term measurements of NWD to constrain NOx emissions from 1980–2020 over the US and Europe. We calculate NWD for each measurement site and use these observed NWD fluxes to assess NOx emissions from a commonly used global anthropogenic emission inventory (the Community Emissions Data System; CEDS) for potential biases in trends. To determine drivers of NWD trends and test the sensitivity of NWD to changes in NOx emissions, we perform a series of sensitivity tests in the 3D chemical transport model GEOS-Chem and analyze the observed sensitivity of NWD to urban NOx emission reductions during COVID-19 lockdowns in spring 2020. We also compare modeled and measured NWD to assess potential biases in NOx emissions magnitudes. Finally, we investigate the impact of NWD-constrained anthropogenic NOx emissions on tropospheric and surface ozone.
2.1 Observations
For the contiguous United States (CONUS) domain, long-term monthly average measurements of NWD were downloaded from NADP (Lamb and Bowersox, 2000; National Atmospheric Deposition Program), and nitrate deposition was calculated in kg N ha−1. The NADP configures each site in its network with an automated precipitation collector and a rain gauge, and composite samples are collected year-round and analyzed on a weekly basis. All samples are analyzed at the Central Analytical Laboratory (CAL) at the Wisconsin State Laboratory of Hygiene in Madison, WI, USA, for a variety of ions, acidity, and conductance. Ion concentrations are measured via ion chromatography. The network performs quality assurance for data completeness and accuracy before making it publicly available, and previous analyses have found good agreement (<7 % difference) between the network and co-located independent nitrate ion measurements (Nilles et al., 1994; Lamb and Comrie, 1993). In our analysis, we use data from 156 NADP sites that have at least 32 years of data from 1980–2020 and at least 80 % of valid monthly measurements (Fig. 2). Sites are located primarily in rural areas away from point sources of pollution.
Monthly mean NWD measurements for the European domain were provided by EMEP, the data from which are compiled and made available by the Norwegian Institute for Air Research (NILU) (https://ebas.nilu.no/data-access/, last access: 9 May 2022) (Tørseth et al., 2012). Measurement data are compiled from many countries on a year-round basis. Daily precipitation samples are collected via automatic collectors and analyzed by laboratories weekly via ion chromatography, similar to the protocols used by the NADP. To quantify the accuracy and precision of the samples, internal checks are performed by comparing samples against known concentrations, and external checks are occasionally implemented. Evaluation of nitrate ion measurements during laboratory intercomparisons shows good agreement among measurements and with expected values (Tørseth et al., 2012). Only valid, non-contaminated samples are used in the calculation of monthly mean concentrations. In our analysis, we ensure all data have at least 28 years from 1980–2020 and at least 70 % of valid monthly measurements. These data requirements are relaxed from those for NADP due to the smaller size of this network. We find only 28 sites that meet these requirements (Fig. 2). Similar to NADP, most sites are located in areas that are considered representative of the air mass (avoiding inversion areas and mountaintops) away from sources of pollution including point, road, and agricultural sources. All samplers are required to be placed >1 km away from gravel roads, farmyards, and tilled agricultural fields to limit the impact of dust particles (Tørseth et al., 2012).
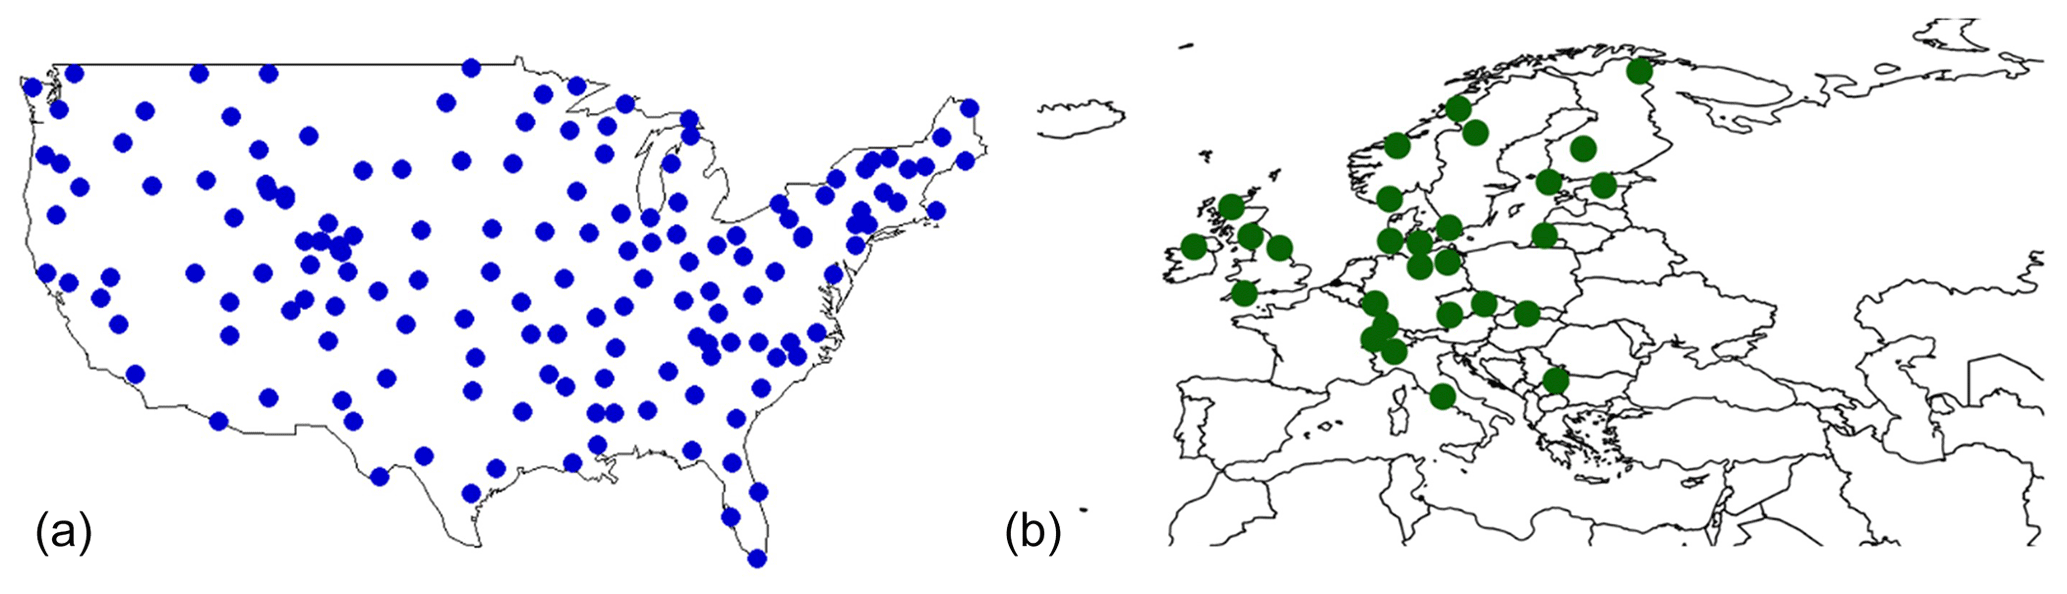
Figure 2Location of NADP (a) and EMEP (b) long-term monitoring sites for nitrate wet deposition measurements used in this study. See the text for data selection criteria.
We do not consider dry deposition in this analysis due to timeframe limits and inherent limitations in its determination. Dry deposition estimates are available only after 2000 over the CONUS from the Clean Air Status and Trends Network (CASTNET) and there are only four sites over Europe (EMEP) with analysis timeframes long enough to include. There are also many uncertainties with regard to both estimates and model representation of dry deposition. Dry deposition estimates are not direct observations, and are instead based on modeled deposition velocities. These estimates are typically done by using a multi-layer model (Finkelstein et al., 2000; Meyers et al., 1998), which calculates deposition velocity as a function of chemical composition, meteorology, and vegetation. Limitations to this method include the lack of meteorological measurements co-located with observation sites, requiring the use of a chemical transport model to estimate deposition velocities. These velocities are uncertain, and different velocity estimation methods can result in fluxes that differ by (Schwede and Lear, 2014). A recent study also shows a high bias in GEOS-Chem for nitrate dry deposition that persists throughout seasons and across multidecadal timeframes (Dutta and Heald, 2023), largely due to a model overestimate of dry deposition velocity of HNO3. The uncertainty inherent to the dry deposition estimates, the limitations of these estimates, and the known bias in GEOS-Chem make dry deposition a more uncertain comparator for NOx trends than wet deposition. Excluding dry deposition may lead to some bias in capturing anthropogenic trends, as dry deposition tends to be more influenced by urban sources, but natural sources are important for determining regional trends, and these are captured better by wet deposition (Dutta and Heald, 2023). Magnitudes may be more uncertain, as the geographic distribution between wet and dry deposition differs. For example, over the CONUS, wet deposition is most prominent in the northeastern US, and dry deposition is most prominent in the southeastern US. Thus, dry deposition may be more adept at capturing biases in NOx emissions in the southeastern US, which may not be as apparent in the wet deposition data. This introduces uncertainty to our regional analysis of NOx magnitudes using just NWD (Sect. 3.3); this uncertainty is currently difficult to quantify given observational limitations in dry deposition and known model biases in GEOS-Chem.
Surface ozone data from 1990–2014 over Europe were obtained from the Tropospheric Ozone Assessment Report (TOAR) Surface Ozone Database (Schultz et al., 2017a), which has been compiled and processed by the TOAR database team and made public via https://doi.org/10.1594/PANGAEA.876108 (Schultz et al., 2017b). We obtain monthly aggregates from sites over Europe that have at least 70 % of all hourly ozone measurements available for each year. The following criteria were followed to ensure consistent data for the long timeframe: (1) at least two monthly observations per season, (2) at least eight monthly observations per year, and (3) at least 15 years of data (Christiansen et al., 2022). The 186 TOAR site locations are shown in Fig. S2. All sites are classified as “rural,” which is defined as (1) NO2 column molecules cm−2 as measured by the Ozone Monitoring Instrument (OMI), (2) an averaged nighttime light intensity index of ≤25 within a 5 km radius of the site, and (3) a maximum population density of ≤3000 people km−2 within a 5 km radius of the site (Schultz et al., 2017a). Additionally, only daytime ozone data are used, which is defined as measurements between 8 and 20 h local time. The surface site locations are summarized in Fig. S2.
Ozone observations above the surface were provided by ozonesonde vertical profile measurements. Individual vertical profiles from 1990–2017 were downloaded from the World Ozone and Ultraviolet Data Center (WOUDC) (https://woudc.org/data/explore.php, last access: 1 March 2022) and the Harmonization and Evaluation of Ground-based Instruments for Free Tropospheric Ozone Measurements (HEGIFTOM) working group of the Tropospheric Ozone Assessment Report Phase II (TOAR-II) (https://hegiftom.meteo.be/datasets/ozonesondes, last access: 31 March 2022). The most updated information available at each site was used. The ozonesonde community is currently reprocessing and homogenizing data to account for changes in ozonesonde preparation and procedures with the goal of reducing measurement biases associated with these changes (Tarasick et al., 2016; Van Malderen et al., 2016; Witte et al., 2018; Sterling et al., 2018; Ancellet et al., 2022). Over Europe, these homogenization efforts impact three of the seven ozonesonde sites: De Bilt, Hohenpeissenberg, and Uccle. It should be noted that, since the site Payerne has homogenized data for only part of the timeframe, we use the non-homogenized data in this analysis to remain consistent throughout. Following our previous work in Christiansen et al. (2022), we apply these data completion requirements for inclusion in the analysis: (1) at least three observations per month, (2) at least two monthly observations per season, (3) at least eight monthly observations per year, and (4) at least 16 years of data. The ozonesonde site locations are summarized in Fig. S2.
2.2 Model simulations
We used multiple simulations of GEOS-Chem version 12.9.3 (GC) (Bey et al., 2001) at different horizontal resolutions (GC 4°×5° latitude × longitude and GC 2°×2.5°; https://doi.org/10.5281/zenodo.3974569, The International GEOS-Chem User Community, 2020) in this analysis, as summarized here and in Table 1. We primarily show results from the GC 2°×2.5° simulation but used GC 4°×5° for sensitivity simulations due to computational constraints. These simulations were performed using the native 72 vertical pressure levels from 1980–2017 and were driven by reanalysis data from the Modern-Era Retrospective analysis for Research and Applications version 2 (MERRA-2) (Gelaro et al., 2017) developed by the NASA Global Modeling and Assimilation Office (GMAO). GEOS-Chem includes detailed HOx–NOx–VOC–ozone–BrOx–aerosol tropospheric chemistry with over 200 species, and this version includes updated halogen (Wang et al., 2019) and isoprene chemistry (Bates and Jacob, 2019). Emissions were computed by the Harvard–NASA Emissions Component (HEMCO) (Keller et al., 2014). We used the Community Emissions Data System (CEDS) for global anthropogenic emissions at a monthly 0.5°×0.5° resolution (Hoesly et al., 2018; McDuffie et al., 2020). Model simulations were carried out only until 2017 because the anthropogenic emissions from CEDS were available only until 2017 at the time. Biogenic VOC emissions were calculated at each emissions time step (every 30 min at 2°×2.5°) by the Model of Emissions of Gases and Aerosols from Nature version 2.1 (MEGAN) with meteorological inputs from MERRA-2 (Guenther et al., 2012) as implemented by Hu et al. (2015). Biomass burning emissions were provided by the Global Fire Emissions Database (GFED) version 4s for 1997 onward (Giglio et al., 2013) at a monthly resolution. Prior to 1997, biomass burning emissions were estimated using a GFED4s climatology with interannual variability imposed using scale factors from the Total Ozone Mapping Spectrometer (TOMS) aerosol index (Duncan, 2003). Biogenic soil NOx emissions were calculated online (Hudman et al., 2012). Lightning NOx emissions were constrained at ∼6 Tg N yr−1 to match satellite observations (Martin et al., 2007) and distributed to match satellite climatological observations of lightning flashes while maintaining coupling to deep convection from meteorological fields (Murray et al., 2012). Monthly mean methane concentrations were prescribed in the model surface layer from interpolation of the long-term NOAA ESRL GMD flask observations (Murray, 2016). Model wet deposition is described by Liu et al. (2001) for water-soluble aerosols and by Amos et al. (2012) for gases. For comparison to observations, model monthly averages of NWD, calculated as kg N ha−1, were sampled at the locations of each network site throughout the US and European domains. For simplicity, we refer to the GC 2°×2.5° simulation as GC throughout this work.
Table 1Description of GEOS-Chem simulations used in this study.
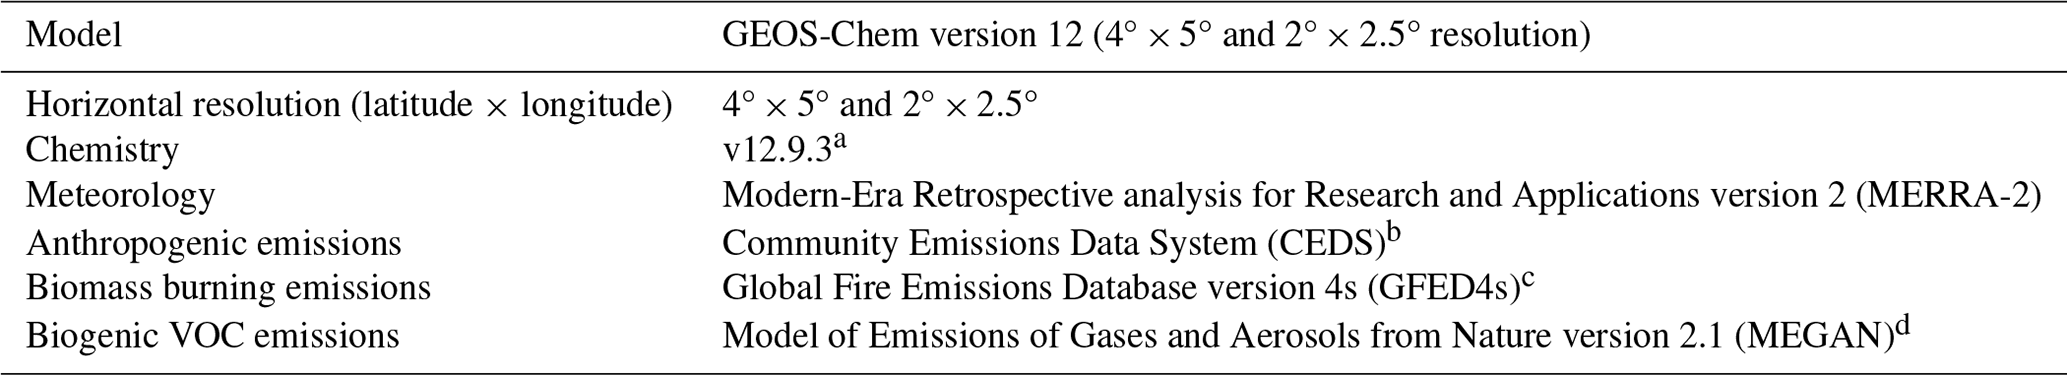
a https://doi.org/10.5281/zenodo.3974569 (International GEOS-Chem User Community, 2020). b Hoesly et al. (2018); CEDS provides monthly average anthropogenic emissions at the 0.5°×0.5° resolution using previously existing emissions inventories. c Giglio et al. (2013) after 1997; prior to 1997, estimated using a GFED4s climatology with interannual variability imposed using scale factors from the Total Ozone Mapping Spectrometer aerosol index as in Duncan (2003); monthly 0.25° resolution. d MEGANv2.1 from Guenther et al. (2012) as implemented by Hu et al. (2015). Biogenic VOC emissions are calculated online depending on the emissions time step (e.g., hourly at 4°×5°, every 30 min for 2°×2.5° resolution).
We also performed four sensitivity simulations for 1980–2017 at 4°×5° resolution: constant anthropogenic emissions but varying meteorological fields (“Meteorology”), constant meteorology with varying anthropogenic emission inputs (“Emissions”), halved anthropogenic NOx emissions over Europe (“Half-NOx”), and no global biomass burning emissions (“No-Fires”). Here, the Meteorology simulation cycled only anthropogenic emissions at constant 1980 values while allowing meteorology to proceed normally so that trends in the simulation were primarily due to the effects of changing meteorological factors. Similarly, the Emissions simulation cycled meteorological inputs at constant 1980 values, but emissions were allowed to evolve normally. The Half-NOx simulation was performed the same as the base simulation, but anthropogenic NOx emissions from the CEDS inventory were halved over Europe to investigate the impact on NWD, which is discussed in more detail in Sect. 3.4. Finally, in the No-Fires simulation, all emissions evolved normally except for biomass burning emissions, which were set to zero. These sensitivities allowed for the exploration of drivers of NWD trends, as well as the sensitivity of NWD to changes in NOx emissions.
To complement the simulations described above, we also used a simulation from a previous version of GEOS-Chem (version 10-01) at 4°×5° resolution from 1980–2010 as described by Hu et al. (2017). Differences relevant to our analysis, summarized in Christiansen et al. (2022), include (1) the MERRA reanalysis meteorological data (Rienecker et al., 2011), (2) 47 vertical pressure levels, (3) global anthropogenic and biomass burning emissions from the MACCity inventory, and (4) a coarser horizontal resolution. In the MACCity inventory, anthropogenic emissions are provided at a decadal resolution and interpolated to an annual basis, and monthly biomass burning emissions are provided by the MACCity inventory prior to 2005 and based on the Representative Concentration Pathway (RCP) 8.5 emissions scenario after 2005 (Granier et al., 2011). The 1980–2010 timeframe was chosen for the model because of the limited availability of MERRA meteorology fields at the time the run was performed. Including this simulation provides a point of comparison to our GC simulations. We use this to show that the discrepancies between modeled and observed NWD are not unique to a specific model version. Instead, we show that these discrepancies are consistent between model versions that use different settings, have different emissions inventories, and contain different chemistry updates. This allows us to assess whether model–observation discrepancies in NWD are due to internal model processes or emissions inventories.
In all models, we corrected for potential precipitation biases, as model errors in precipitation propagate to NWD. We corrected for these potential biases using independent, high-resolution observations which have been interpolated to a grid. We use the Parameter–elevation Relationships on Independent Slopes Model (PRISM) at 4 km grid cell resolution over the US and E-OBS over Europe (Daly et al., 2008; Haylock et al., 2008) at 0.25° grid cell resolution, which we sampled at the location of each network site. The precipitation correction is shown below in Eq. (1), which has been applied previously for analyses of wet deposition fluxes (Liu et al., 2021; Paulot et al., 2014; Silvern et al., 2019).
Here, p represents the amount of precipitation in each month from PRISM or E-OBS within the grid cell containing the NWD sites and the model output. All data analysis was performed using R statistical software (R Core Team, 2013).
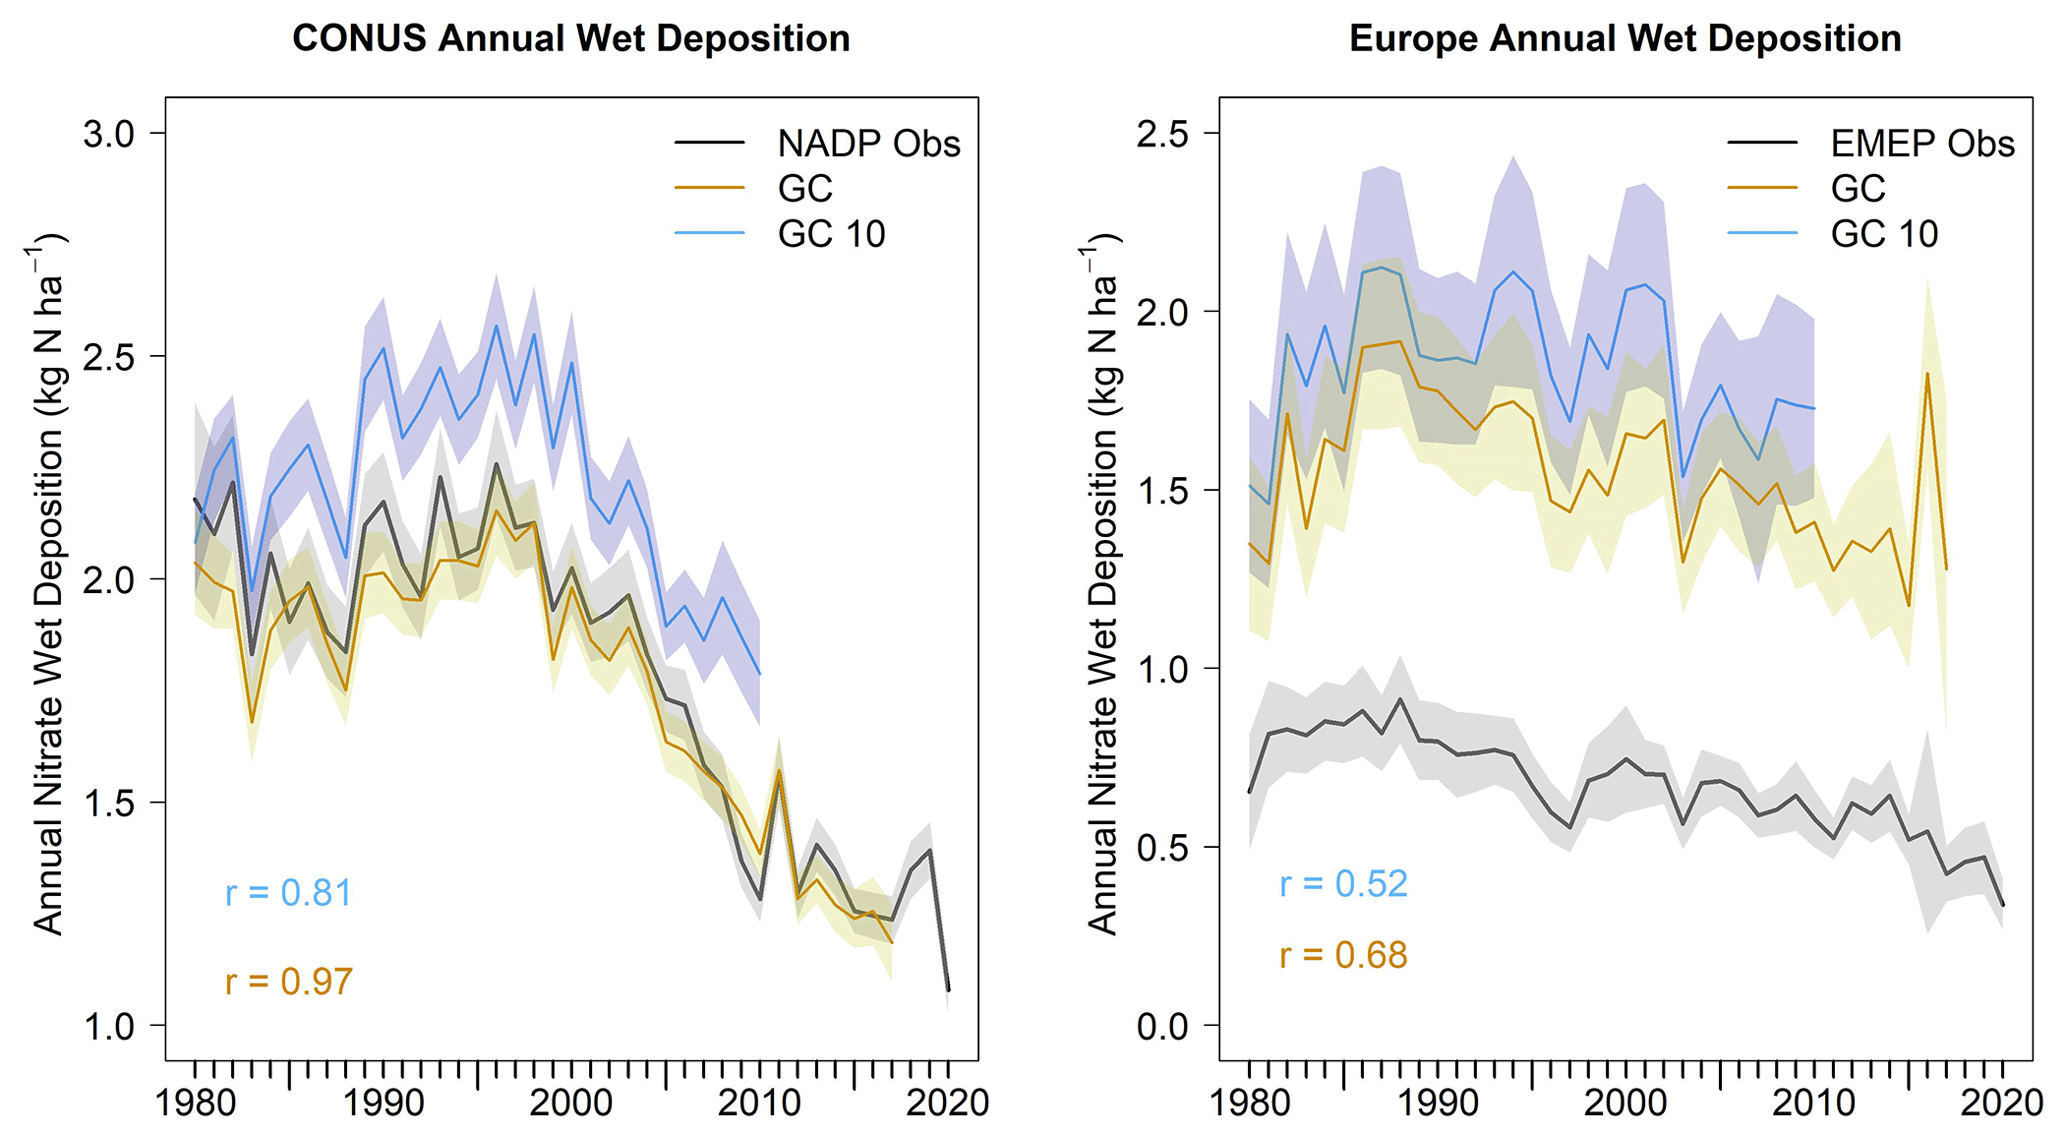
Figure 3Observed and modeled nitrate wet deposition (NWD) from 1980 to 2020, including the 2020 COVID lockdown period, averaged over the contiguous United States (CONUS) and Europe, in units of kg N ha−1. Shown are annually averaged monthly mean observations (black) and base simulation results (gold) from GEOS-Chem (GC) at 2°×2.5° resolution. Results from an earlier model version at different resolution (GC v10-01, 4°×5°) are shown in blue for 1980 to 2010. The shaded regions represent 1 standard deviation of the monthly mean NWD. Correlation coefficients for each simulation with observations are shown in the inset. The 2016 jump in NWD concentrations in GC in Europe is due to a spike in precipitation during that year in the E-OBS dataset (Fig. S3).
3.1 Observational trends
To establish how well NWD trends capture NOx trends, we first compare observed NWD trends to those from satellite NO2 measurements previously reported. NO2 measurements are commonly used to infer NOx concentrations due to the short lifetime of daytime NO2 (2–8 h), which results in robust correlations between NOx emissions and NO2 column amounts (Goldberg et al., 2021). This is especially useful over rural areas, such as where NWD observations sites are located, as the influence of background (e.g., non-anthropogenic) NOx is more prominent for both satellite and NWD observations. We find that over the CONUS, the strongest decreases in NWD occur from 2000–2010 and average % yr−1 (mean ± standard deviation). Prior to 2010, there is generally good agreement between NWD and measurements of NO2 from surface stations and satellites when analyzed on a regional scale. The EPA's Air Quality System (AQS) surface NO2 trends decrease by % yr−1 from 2005–2009 and satellite NO2 trends decrease by % yr−1 (Silvern et al., 2019), both of which are in good agreement with NWD measurements over that timeframe ( % yr−1). It should be noted NWD is most useful as a constraint on regional spatial scales, as NWD observations are located in rural areas influenced by transport and background emissions, which can show different trends from urban areas (Silvern et al, 2019).
Over Europe, decreases in NWD are evident since the late 1980s but occur most strongly since the 2000s and are in good agreement with satellite and surface NO2 measurements. We calculate a 1980–2017 decrease in NWD over Europe of 19±10 %, similar to the 23 % calculated by Tørseth et al. (2012) for 1990–2009. Trends in assimilated satellite NO2 measurements over western Europe show an average decrease of −0.9 % yr−1 from 2005–2014 (Miyazaki et al., 2017), which agrees with the decrease in western Europe NWD measurements over that same timeframe ( yr−1).
After 2010 over the CONUS, decreases in NWD observations slow down, averaging yr−1 from 2011–2019. This slowdown in trends is consistent with satellite measurements of NO2, which also record a flattening of the trend from 2011–2015 at −1.7 % yr−1 (Jiang et al., 2018). This slowdown in satellite NO2 has been attributed to the increasing sensitivity of satellite measurements to free-tropospheric NO2, which in recent years has contributed an increasingly larger portion of column NO2 as emissions of anthropogenic NOx have declined (Silvern et al., 2019). NWD observations may reflect satellite NO2 trends, as these sites are primarily rural and thus also influenced by background, non-anthropogenic NOx, similar to satellite measurements. Another reason for the similarity between NWD and satellite NO2 trends is that the NWD measurements capture NO2 concentrations through the precipitation column, which extends into the free troposphere. Consistent with this hypothesis, NWD and satellite NO2 trends over the CONUS do not agree with surface AQS NO2 measurements, which have decreased by −4.5 % yr−1 since 2010 (Silvern et al., 2019); the CEDS inventory also shows strong decreases after 2010, averaging % yr−1 (Fig. S4). Over Europe, although NWD trends are noisier due to a smaller number of sites compared to the CONUS, we also find a leveling off of trends since 2010. NWD trends level off from yr−1 from 2000 to 2010 to yr−1 from 2010–2019. Again, this is in contrast with the CEDS inventory (Fig. S4), which shows a ∼2 times faster decrease (an average decrease of yr−1) since 2010.
This discrepancy in trends between NWD, satellite NO2 measurements, surface NO2 concentrations, and anthropogenic NOx emissions has been noted previously and can be explained by a change in the relative importance of emissions sources in driving NOx trends. In CEDS and GEOS-Chem, prior to 2010, anthropogenic NOx made up 79 % of total NOx emissions in the CONUS and 88 % in Europe, but anthropogenic emissions have decreased rapidly since the 1980s in both regions. In contrast, the magnitude of lightning, soil, and biomass burning NOx emissions has remained relatively steady from 1980–2017; together they make up 34 % of the total NOx emissions profile in 2017 in the CONUS and 17 % in Europe in GEOS-Chem (Fig. S5). Post-2010 trends in NOx are therefore no longer primarily determined by anthropogenic emissions, and the flat trends of non-anthropogenic emissions now play a larger role in total trends. Since NWD sites are primarily rural and are influenced by background NOx emissions, we also observe a slowdown in NWD trends that reflects the increased importance of background NOx emissions in determining trends. Our results support the findings in Silvern et al. (2019) and He et al. (2022) that background emissions such as soils and lightning play an increasingly important role in determining NOx emissions trends in rural regions as NOx anthropogenic emissions rapidly decline over the US and Europe.
Observed trends in NWD also agree with satellite and surface-derived NO2 trends during the COVID-19 lockdown period in March and April 2020, providing further evidence of the ability of NWD to capture large changes in NOx emissions. Satellite measurements may be more influenced by urban emissions than NWD, but satellites are sensitive to background NO2, similar to how NWD is sensitive to background NOx, and trends between satellite NO2 and NWD have been shown to match closely when averaged over a regional scale (Silvern et al., 2019). Despite the influence of background emissions, both NWD and satellite NO2 observations capture large-scale changes in anthropogenic emissions (Fig. 3; pre-2010 trends). Figure 3 shows the decrease in NWD from 2019 to 2020 as measured across the NADP and EMEP networks. For the entire year of 2020, observations show a 22 % decrease in NWD values over the CONUS and 28 % over Europe. If we compare just March–April 2019 to March–April 2020, we find an average decrease of 37 % in NWD values over the CONUS and 42 % over Europe. These results are consistent with other analyses which estimate NOx emissions decreases during COVID-19 lockdowns. Over the United States, satellite NO2 total columns showed decreases over the lockdown period ranging from 20 %–40 % (Bauwens et al., 2020; Qu et al., 2021). Over Europe, satellites measured decreases of 7 %–40 % (Bar et al., 2021), with much of that decrease occurring over western Europe (20 %–30 %) and at the surface (20 %–50 %) (Bauwens et al., 2020). NOx decreases during lockdowns are mostly associated with a reduction in vehicle traffic (Rossi et al., 2020; Baldasano, 2020; Kerr et al., 2021), and background sources of NOx did not change considerably during this timeframe (Kerr et al., 2021). These results show that, despite becoming less sensitive to anthropogenic emission trends in the US and Europe, NWD is still useful for constraining changes such as those resulting from COVID-19 lockdowns or energy usage shifts occurring in developing countries.
3.2 Model reproduction of trends
Trends and magnitudes in NWD are well-reproduced by GC over the CONUS (Fig. 3). During the largest decrease from 2000–2010, GC shows a significantly (p<0.05) decreasing trend of yr−1, which agrees with significant observed decreases in NWD of yr−1. While annual NWD values predicted by GC agree with observations when taken over the entire CONUS domain, regional NWD predictions do not agree in certain regions and seasons. This issue is explored further in Sect. 3.3. GC v10-01 also shows a significant decrease of % yr−1 for the same period. The post-2010 leveling off of the decreasing trend in NWD described earlier ( % yr−1), also observed in satellite NO2 measurements (−1.7 % yr−1) (Jiang et al., 2018), is captured by GC ( % yr−1), suggesting that the CEDS NOx trends are correct with the constraints provided by NWD observations.
Trends in observed NWD over Europe are captured fairly well by both simulations (R>0.5) (Fig. 3). Observed NWD trends are small throughout the timeframe, with observations showing only a change of yr−1. GC shows an average decrease of throughout the timeframe, with large uncertainty due to increases at the beginning and end of the time series. If the timeframe is restricted to include the period of greatest decline from 1990–2015, GC shows a decrease of yr−1, in good agreement with the observed decrease of % yr−1 over this time period. However, the GC v10-01 simulation (driven by MACCity) does not capture trends as well (i.e., yr−1 vs. observed yr−1 in 1980–2010; yr−1 vs. observed yr−1 in 1990–2010). We attribute this discrepancy largely to the lack of fine temporal resolution in MACCity anthropogenic emissions (decadal in MACCity vs. monthly in CEDS). Despite the good agreement of trends over Europe in the newer GC version (driven by CEDS), our GC simulation predicts NWD fluxes that are on average 2.3 times greater than observed NWD, and GC v10-01 predicts slightly higher NWD (2.6×). These findings suggest that CEDS and MACCity NOx emissions over Europe are overestimated on a region-wide scale in GEOS-Chem, which will be explored further in Sect. 3.4.
Trends in GC-predicted NWD since 1980 are driven primarily by changes in anthropogenic emissions rather than meteorological factors. Figure 4 shows the results of the three sensitivity simulations that demonstrate the role of anthropogenic emissions, fire emissions, and meteorology in simulated NWD trends. Over both the United States and Europe, the only simulation that does not follow the trend line of the base simulation is the Meteorology simulation. Trends for the Emissions and No-Fires simulations are similar to the base simulation in both domains. As long as anthropogenic emissions are allowed to evolve over time, the trend line in NWD can be matched. Further, changes in precipitation are unlikely to be responsible for the observed changes in NWD, as precipitation rates have remained relatively flat, or even increased, in opposition to NWD trends (Fig. S3). This, along with our sensitivity simulations, suggests that the changes in anthropogenic emissions of NOx are most influential in driving overall NWD trends in GC. In sum, our findings suggest that the NWD mechanism within GC can capture observed NWD and that the NWD trend generated by GC is influenced most strongly by anthropogenic NOx emissions. Next, we explore trends in total NOx emissions in GEOS-Chem and anthropogenic NOx emissions from the CEDS inventory, focusing on differences in the period after 2010.
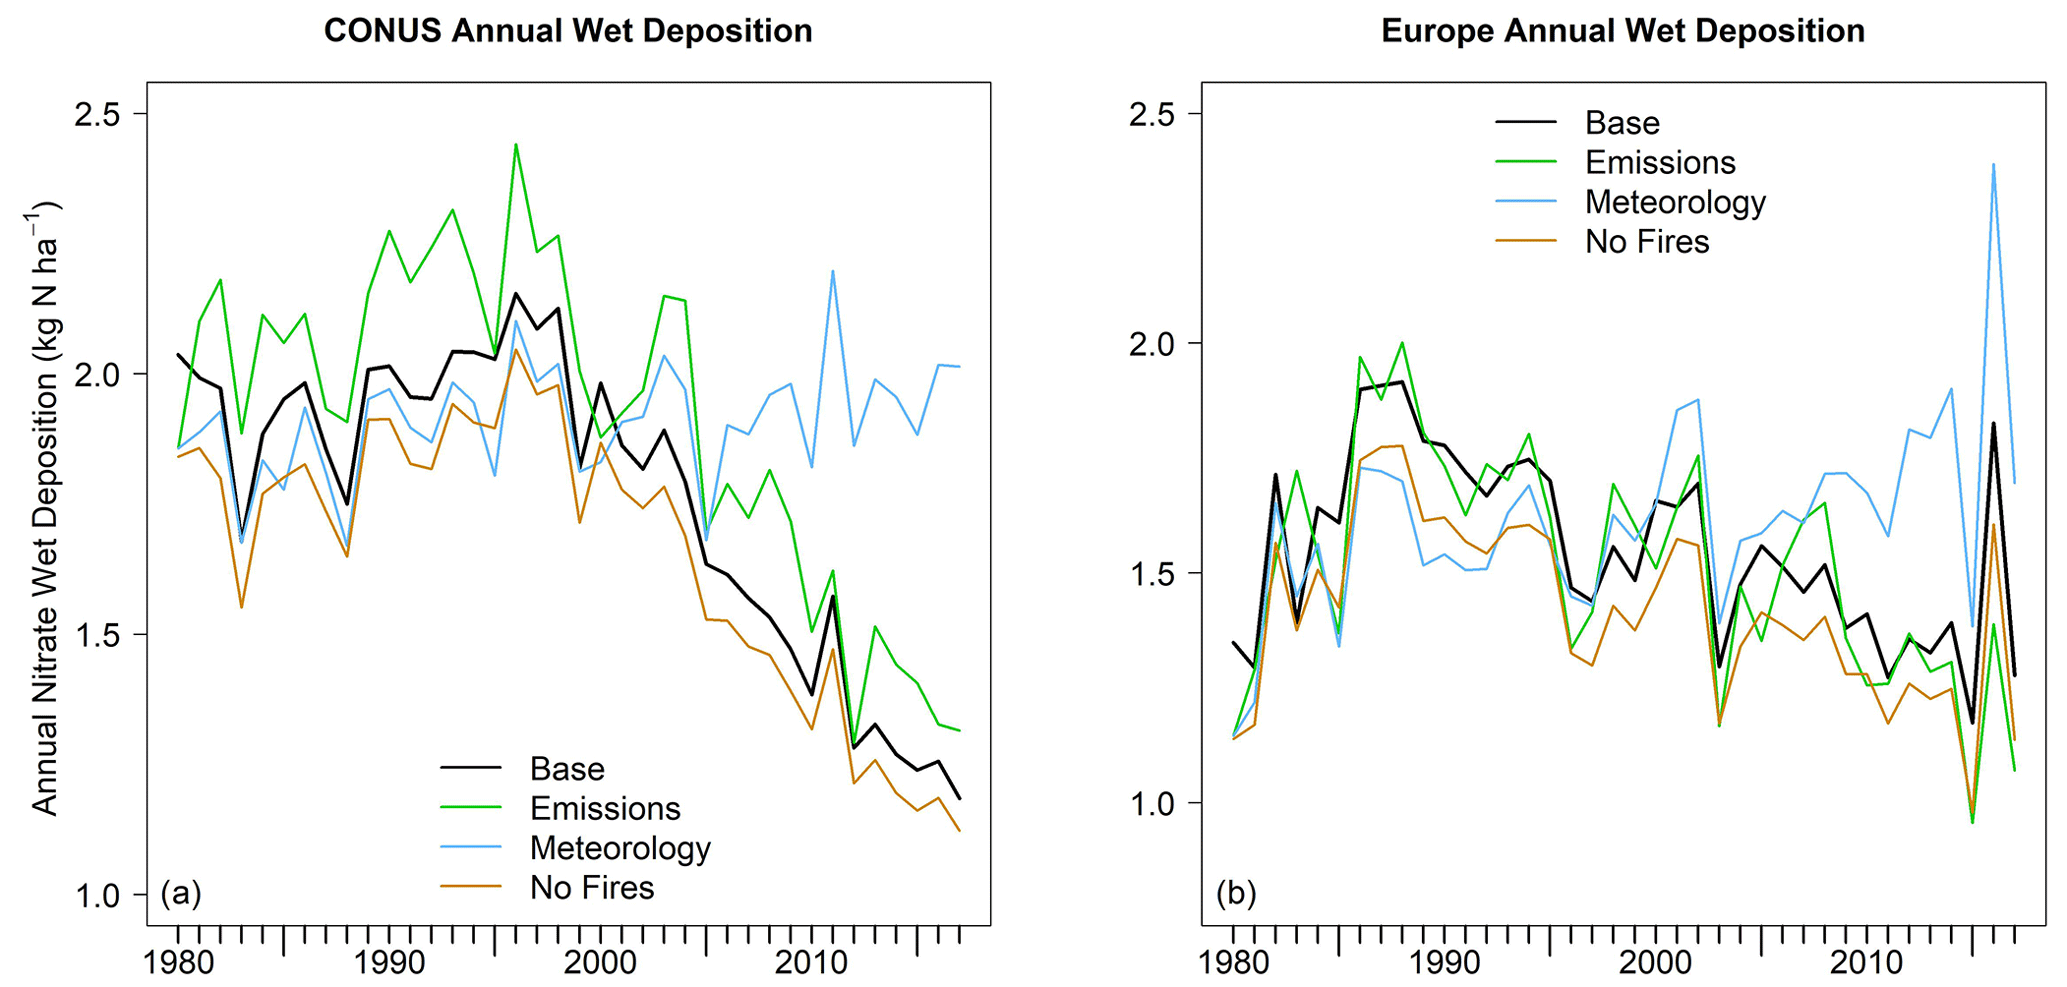
Figure 4Results of annual NWD (kg N ha−1) from each sensitivity simulation over (a) the CONUS and (b) Europe. The base GC simulation is shown in black, the simulation with changing emissions but constant meteorology (Emissions) is shown in green, the simulation with changing meteorology but constant anthropogenic emissions (Meteorology) is shown in blue, and the no-biomass-burning simulation (No-Fires) is shown in gold. See Sect. 2.2 for a detailed description of these sensitivity runs.
Figure 5 shows anthropogenic NOx emissions derived directly from the CEDS inventory (solid blue line) and total NOx emissions summed using GEOS-Chem (solid black line), which includes all sources of NOx emissions (anthropogenic from CEDS, soil, lightning, and biomass burning). Relative trends in observed NWD are overlaid (dashed purple line). In both the CONUS and Europe prior to 2010, NWD trends and NOx emissions trends show good agreement in the model (R>=0.8). We find that the European trends generally show more noise, as there are far fewer sites over Europe than over the CONUS (28 vs. 156 sites). Over both Europe and the CONUS, we find that annual trends in CEDS anthropogenic NOx emissions agree well with NWD measurements until 2010, reflecting the strong decrease in anthropogenic emissions. After 2010, NWD decreases slow down in both the CONUS and Europe and reflect trends in total NOx emissions. Over the CONUS, total NOx emissions trends decline to yr−1 and NWD-predicted trends level out to yr−1. Similarly, over Europe, total NOx emissions trends decline to yr−1 after 2010, and NWD-predicted trends decline to yr−1. As explored previously, these trends are in contrast to anthropogenic emissions inventories that continue to show strong NOx decreases after 2010. These results point to the decreased influence of anthropogenic NOx on total NOx emissions trends and provide further evidence of the ability of NWD to capture total NOx trends.
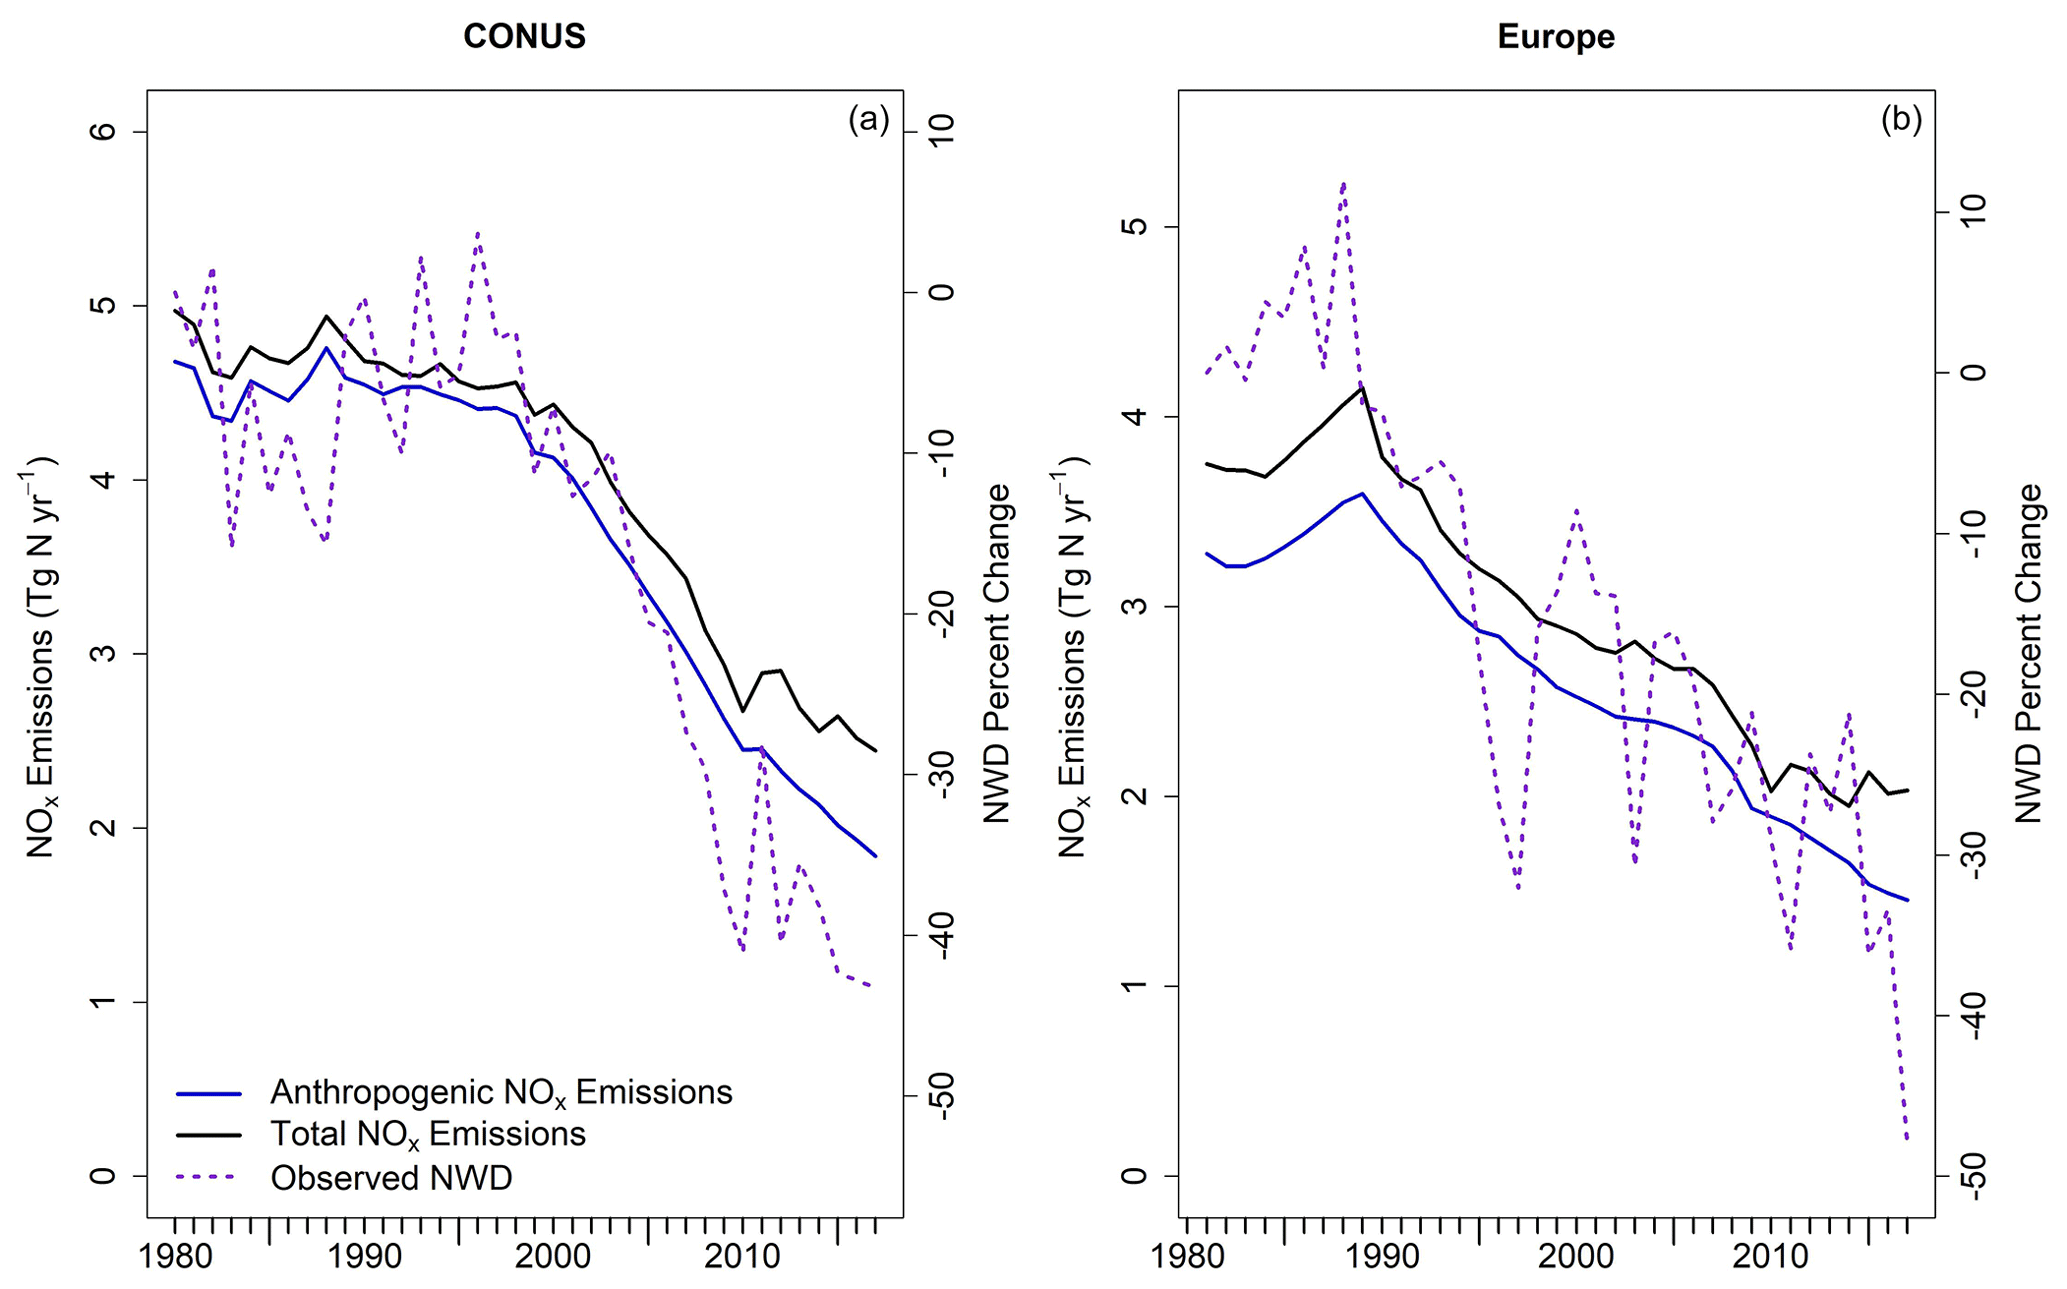
Figure 5NOx trends in the CEDS inventory (reported as Tg N), total NOx emissions (Tg N) estimated by GEOS-Chem, and observed trends in annual NWD data over (a) the CONUS and (b) Europe. Anthropogenic emissions from the CEDS inventory are shown in solid blue, total NOx emissions are shown in black, and trends from NWD are overlaid with the dashed purple line.
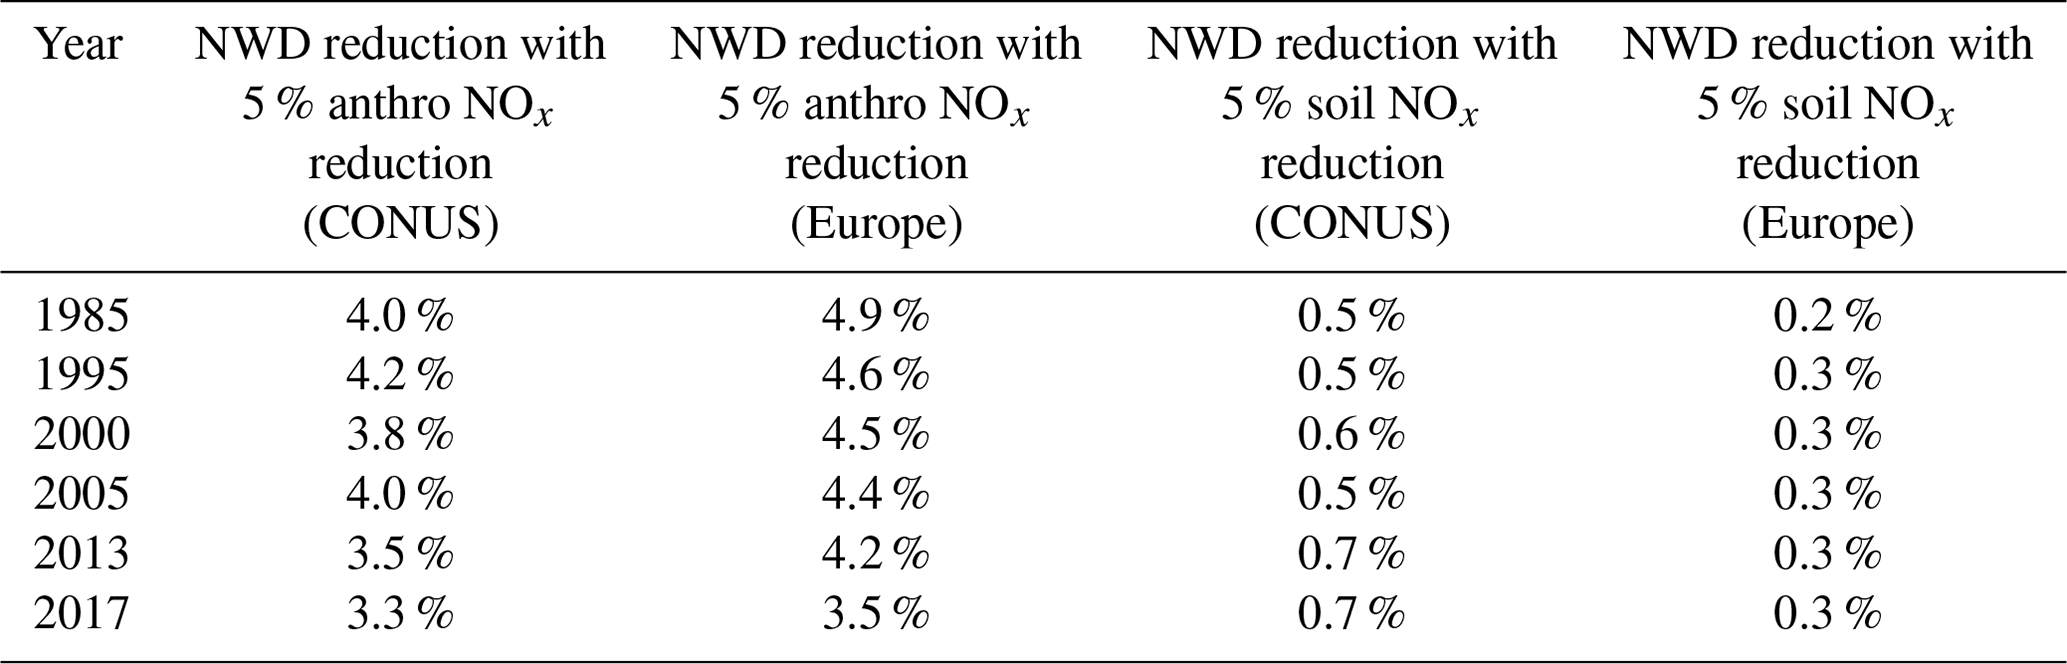
Through a series of sensitivity tests, we further illustrate this post-2010 flattening of the modeled total NOx emissions and observed NWD trends in response to the weakened sensitivity to anthropogenic emissions. We investigate the impact of a small perturbation (−5 %) in anthropogenic NOx emissions at various time points throughout the series (1985, 1995, 2000, 2005, 2013, and 2017) to investigate NWD sensitivity to a decrease in anthropogenic emissions (Table 2). We find that the sensitivity to anthropogenic NOx emissions is greatest in the 1980s and 1990s and decreases to its lowest sensitivity in 2017 over both the CONUS and Europe. This is in contrast to similar sensitivity simulations that reduced soil NOx emissions by 5 %. In these simulations, NWD trends become slightly more sensitive to changes in background soil NOx emissions later in the timeframe, especially over the CONUS. Our work underscores the value of measurements of NWD extending into the future for constraining total NOx trends.
Table 2Sensitivity of modeled NWD to a 5 % decrease in anthropogenic and soil NOx emissions at various time slices.
3.3 Evidence of summertime NOx overestimates over the CONUS
In addition to its usefulness in assessing the total NOx trend, NWD can also provide insights into the accuracy of total NOx magnitudes in models. While annual NWD values agree when taken over the entire CONUS domain, regional NWD measurements suggest that NOx emissions are overestimated in certain regions and seasons. The eastern US has been the subject of many studies related to the amount of NOx emissions, in which various versions of the NEI have been assessed using a variety of measurements. Multiple analyses have pointed to NOx overestimates in the NEI over the eastern US during summertime (Castellanos et al., 2011; Anderson et al., 2014; Goldberg et al., 2016; Souri et al., 2016; Travis et al., 2016), finding overestimates of 27 %–70 % depending on location and time. We investigated potential similar biases in the CEDS inventory by comparing seasonal and regional measured and modeled NWD magnitudes.
Similar to previous analyses of NEI inventories (Castellanos et al., 2011; Anderson et al., 2014; Goldberg et al., 2016; Souri et al., 2016; Travis et al., 2016), we find evidence of an overestimate of summertime (July–August–September or JAS) CEDS-estimated NOx across the entire CONUS from 1980–2017 (12 % on average), but most prominently in the eastern US after 2000 (Fig. 6a). Overestimates in the eastern US average ∼20 % and range up to 77 % after 2000. This implies that NOx emissions may be overestimated over the eastern US during JAS in the CEDS inventory and is consistent with previous analyses of inventories with similar emissions. We use JAS as a summertime definition for a better comparison to these previous analyses using one or multiple of these months to assess NOx overestimates. The CEDS inventory estimates that NOx emissions over the eastern US during JAS are 0.7 Tg N on average (0.9 Tg N in 1980, decreasing to 0.3 Tg N in 2017). These overestimates are likely present in other emissions inventories, such as the NEI 2017 and MACCity, as their emission trends and sizes over CONUS are similar across inventories (Fig. S4).
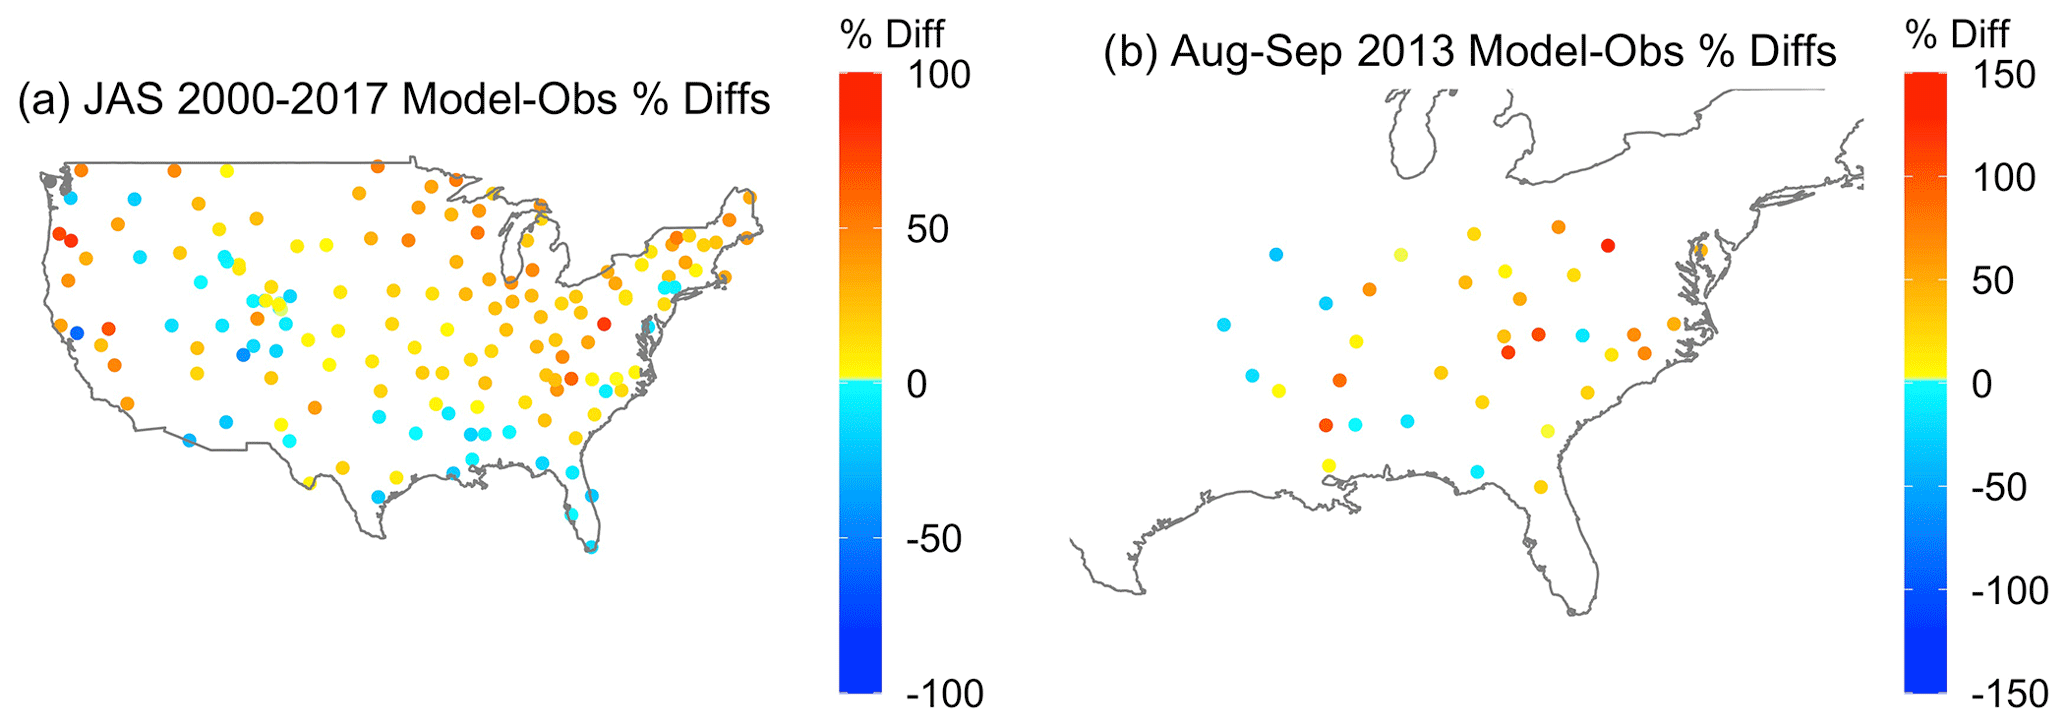
Figure 6Modeled overestimates of (a) 2000–2010 summertime (JAS) NWD in the eastern US and (b) 2013 August–September NWD in the southeastern US compared to the NADP observations. These overestimates likely signal that NOx emissions over this region are overestimated by the CEDS inventory. Note that the scales are different between panels.
Further agreement for NOx overestimates can be found by evaluating specific regions and timeframes where NOx overestimates have been previously identified. For example, over the southeastern US during August–September 2013, Travis et al. (2016) showed that the NEI 2011 overestimated NOx emissions by 71 % compared to aircraft measurements. We examine the same area and time using modeled and measured NWD to investigate if the CEDS inventory is similarly overestimated in this region (Fig. 6b). We find that modeled NWD values using our GC simulation are ∼30 % higher than measured, implying that NOx emissions may be overestimated by 30 % in the southeastern US, qualitatively agreeing with Travis et al. (2016). CEDS NOx emissions are slightly lower than the NEI 2011 by 15 % over the southeastern US (CEDS estimate is 0.1 Tg N), which partially explains the difference in overestimates. The remaining discrepancy in overestimates may be accounted for through differences in model resolution. Travis et al. (2016) used 0.25°×0.25° horizontal resolution, while our model has 2°×2.5° resolution. Travis et al. (2016) attributed much of this overestimate to uncertainties in mobile and industrial sectors as they accounted for the majority of the NOx emissions in the model.
Overestimates of NOx in emissions inventories extend beyond the eastern US. In the western US (longitudes west of 100° W) during summer (JAS), we find that modeled NWD fluxes are overestimated by 15 % on average from 1980–2017, and these overestimates are consistent throughout the timeframe. This finding suggests that NOx is slightly overestimated in the western US during summer in CEDS, which estimates average emissions of 0.2 Tg N (range of 0.3 in 1980 to 0.1 Tg N in 2017). This is consistent with a previous analysis that found that the NEI 2005 overestimated NOx in the Los Angeles area by 27 %–32 % during May–June 2010 (Brioude et al., 2013).
During winter, we find much better agreement between regional modeled and measured NWD. NWD is slightly underestimated during winter in the eastern US (∼7 %). This good agreement in the eastern US is consistent with a previous study during winter in the Washington, DC, and Baltimore area (WINTER) that showed the NEI 2011 and 2014 inventories were within measurement uncertainty from aircraft (Salmon et al., 2018; Jaeglé et al., 2018). In the western US, worse agreement is generally seen, with overestimates averaging 11 % during winter throughout the timeframe, but the standard deviations of the modeled and observed values overlap at each site.
The disagreement in NWD magnitudes during summer may also partially stem from overestimates of soil NOx emissions in the model. Soil NOx emissions are seasonal, with strong summertime emissions and small wintertime emissions. Soil NOx contributes an average of 16 % (ranging up to 26 %) of total NOx during summer and only 2 % during winter. This seasonal pattern observed over the CONUS is consistent with a seasonal overestimate of NOx, with summertime overestimates and good wintertime agreement. However, for most of the timeframe, the contribution of soil NOx emissions cannot fully explain the observed overestimates that range up to 77 %. Along with assessing anthropogenic NOx emissions, future work should focus on refining soil emissions in models, especially as these background emissions become more important in determining total NOx trends in countries with strongly decreasing anthropogenic NOx. Similarly, potential overestimates of biomass burning cannot fully resolve the model–measurement discrepancy. Over the CONUS, excluding all biomass burning emissions globally (No-Fires simulation) still results in summertime overestimates of NWD that average 12 %, with overestimates in the eastern US averaging 13 % and ranging up to 65 %.
The sensitivity of NWD to anthropogenic NOx emissions decreases from 1980–2017, and thus the relationship between anthropogenic NOx and NWD is not strictly 1:1, although NWD is most sensitive to changes in anthropogenic NOx emissions. This change in sensitivity can be attributed to the increasingly large role of background NOx emissions in total NOx and changes in NOx lifetime. It is more likely that these changes are better explained by the increasing prevalence of background NOx, as a previous investigation of NOx lifetime changes since the 2000s found that changes in lifetime alone cannot fully explain NOx trends (Laughner and Cohen, 2019). Changes in NOx lifetime impact NOx product composition and phase, and future analyses should investigate the role of a changing NOx lifetime in products such as nitric acid, nitrate aerosol, and organic nitrates.
It should be noted that the model does not overestimate NWD over all regions or seasons in the US. Some regions, such as the eastern US during spring, exhibit model underestimates. On an annual average basis across the CONUS, NWD is slightly overestimated, but certain regions and seasons show more prominent underestimates that should be explored more fully in future analyses (Fig. S6).
3.4 Evidence of widespread NOx overestimates over Europe
A recent analysis assessing NOx emissions over Europe via satellite measurements points out overestimates in southern Europe during winter and across the entire European domain during summer (Szymankiewicz et al., 2021). The study suggested that EMEP anthropogenic NOx emissions needed to be reduced by 40 % to match observations. Further, another study using OMI satellite NO2 measurements found that ship emissions may be overestimated by 35 %–130 % over Europe (Vinken et al., 2014). Here, we assess NWD overestimates seasonally and regionally to further assess potential NOx overestimates in the CEDS inventory. In this analysis, we use the meteorological definitions of the seasons: winter as December–January–February (DJF), spring as March–April–May (MAM), summer as June–July–August (JJA), and fall as September–October–November (SON).
Consistent with previous analyses, we find that overestimates of NOx occur throughout the European domain, but they are most prominent during summer (JJA) and fall (SON) (Fig. 7). Total anthropogenic NOx emissions over Europe are estimated by the CEDS inventory to be 2.6 Tg N on average (3.3 Tg N in 1980 declining to 1.5 Tg N in 2017). During summer and fall over the entire domain, we find that NWD is overestimated on average by 176 % (50 % to >500 %, factor of 2.9 on average) and 169 % (39 % to >500 %, factor of 2.7 on average), respectively, by the model. During winter and spring, this overestimate is smaller, but still ∼100 % (average factor of 2.4 and 1.9, respectively). These overestimates are strongest in central and southern Europe during winter and spring, but they exist throughout the domain during summer and fall. Anthropogenic NOx emissions make up the largest fraction of total NOx emissions from all sectors in the GC simulation, ranging from 74 % to 88 % of total emissions (Fig. S5). Therefore, it is most likely that overestimates of NWD stem from overestimates of anthropogenic NOx emissions rather than natural sources. In the CEDS inventory, the largest sector contribution to anthropogenic NOx is road emissions (39 % of the total on average; Fig. S7), suggesting that overestimates may come from this sector.
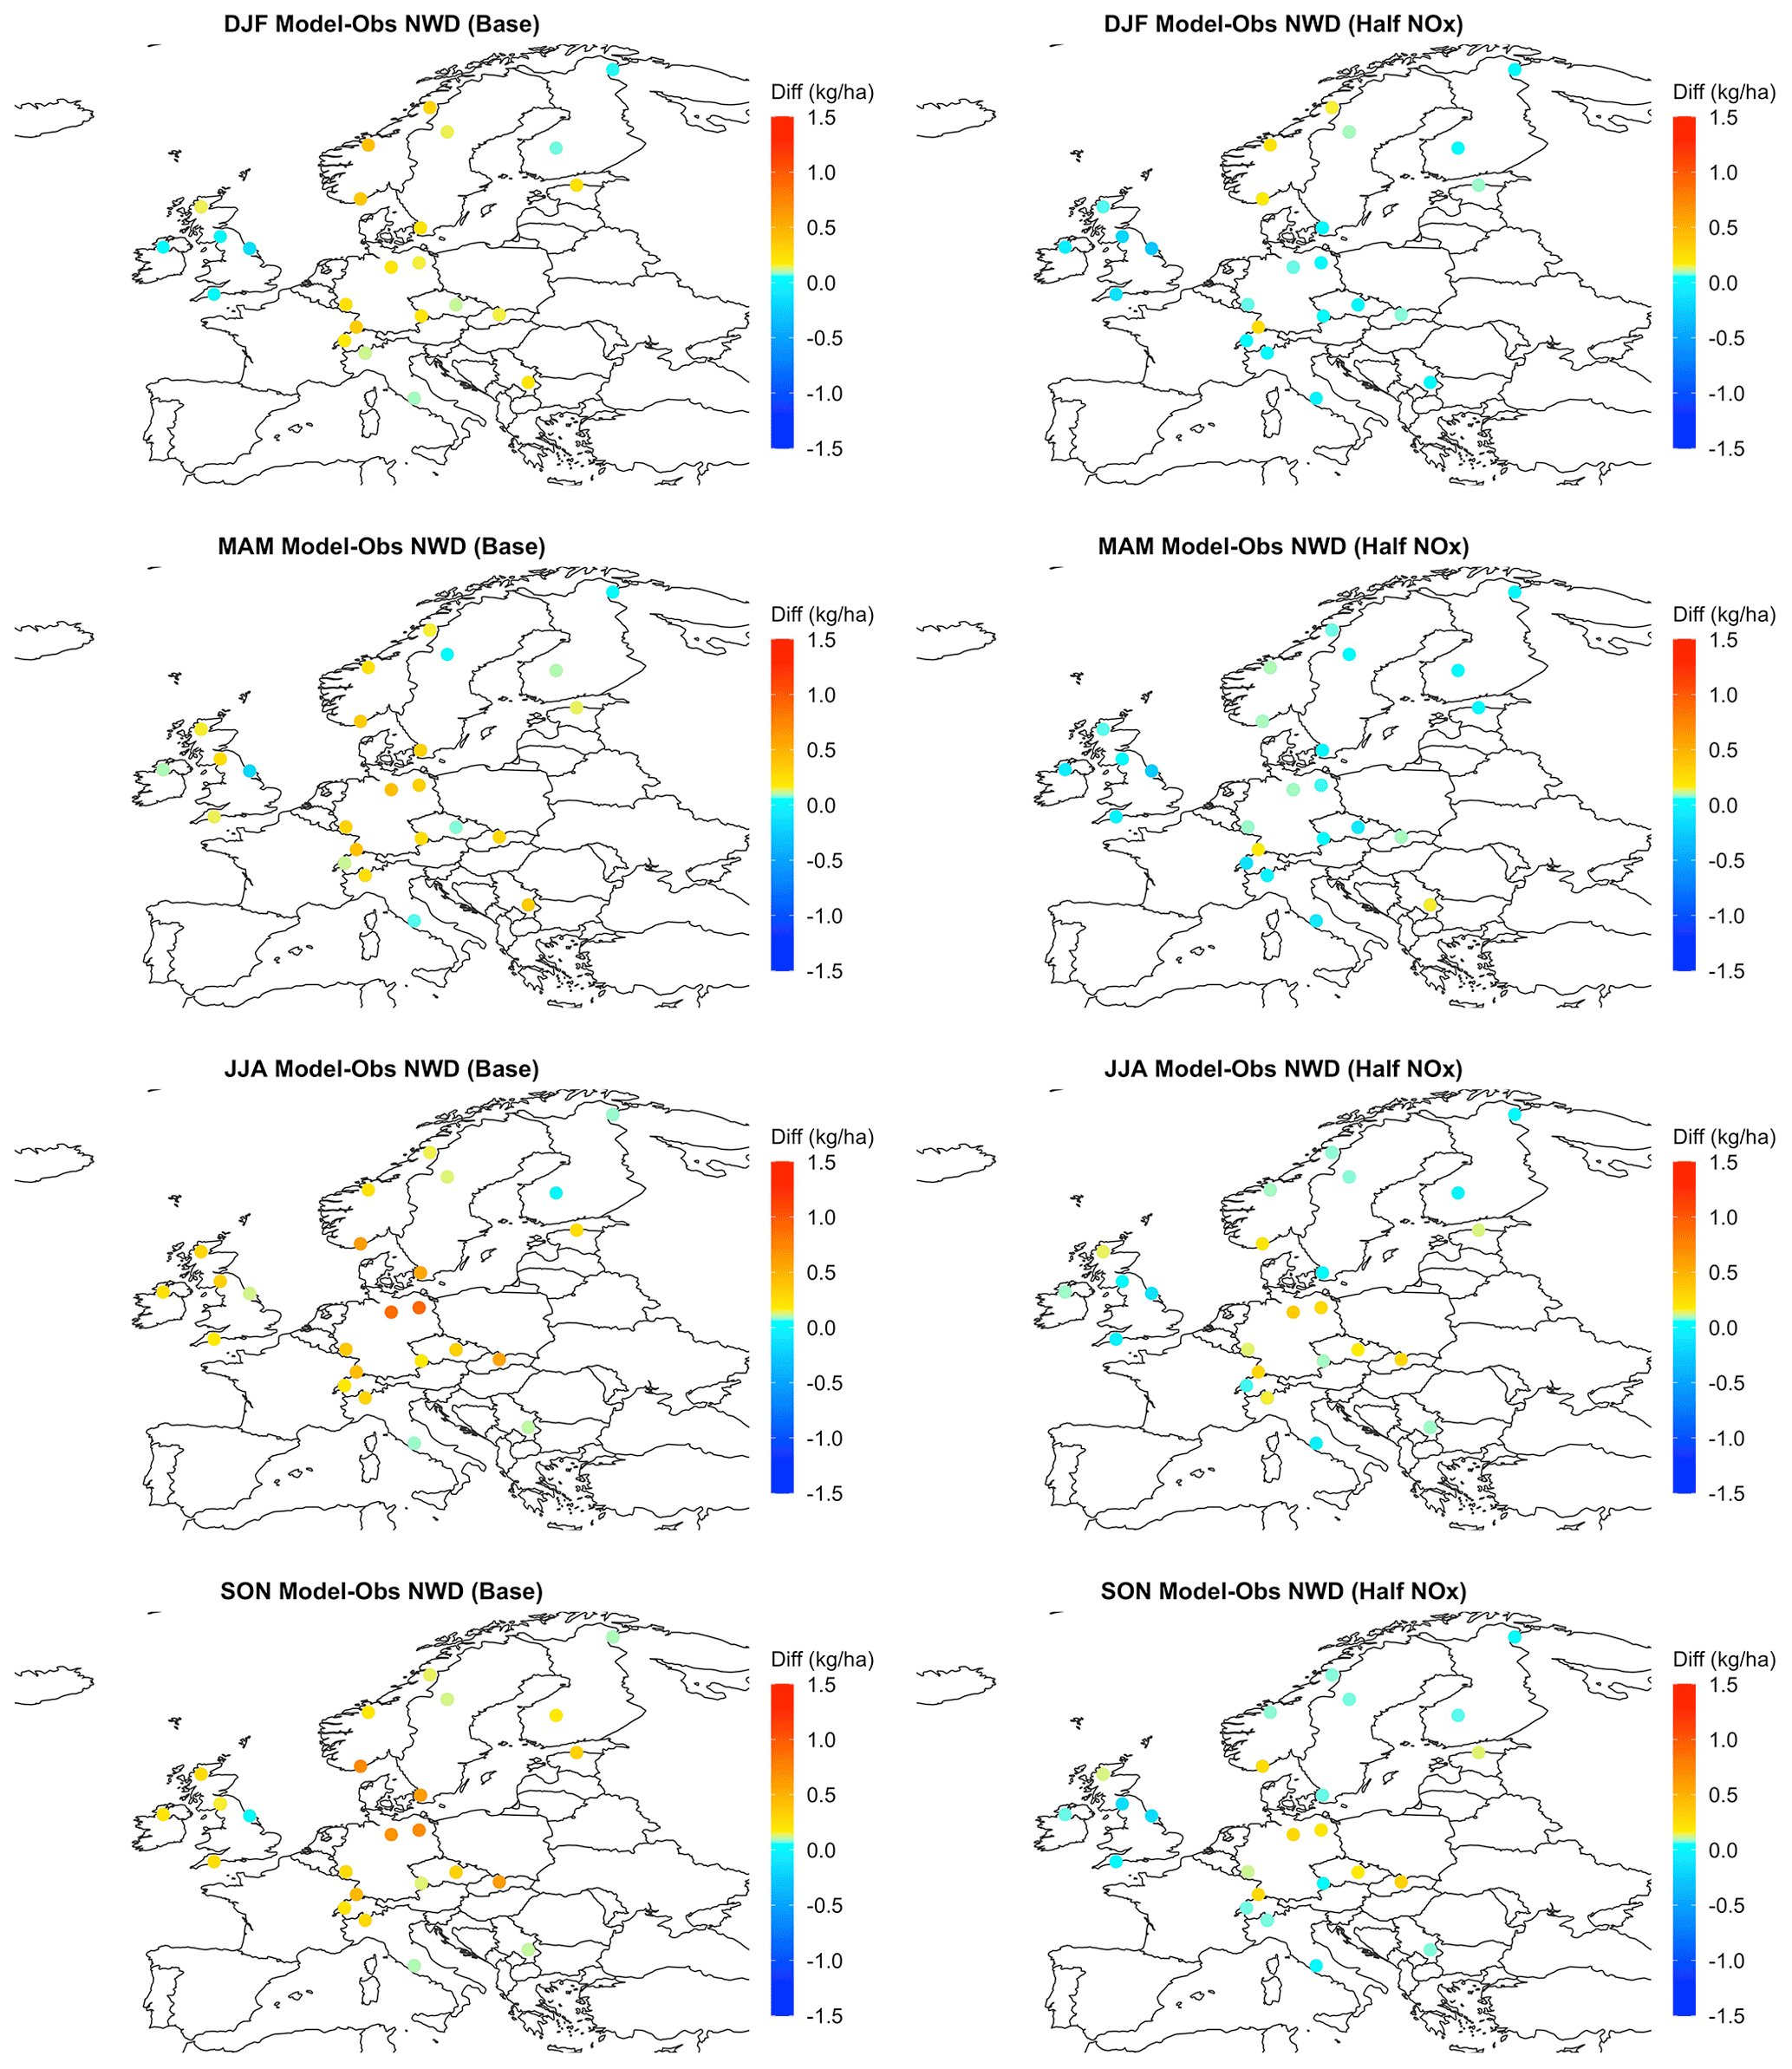
Figure 7Model–observation differences in NWD (kg N ha−1) in winter (DJF), spring (MAM), summer (JJA), and fall (SON). Warm colors indicate model overestimates. Differences between the base model results and observations are shown in the left panels, and the differences between the Half-NOx simulation and observations are shown in the right panels.
To test the impact of NOx emissions on model NWD, we perform a sensitivity test that cuts anthropogenic NOx emissions in the CEDS inventory in half (reducing the 1980–2017 average of 2.6 to 1.3 Tg N) over Europe using GC at the 4°×5° resolution (Fig. 7), as NOx and NWD correlate highly in all seasons (R>0.6). Halving NOx emissions also halves NWD fluxes over Europe, bringing the modeled NWD within 15 % of observations on an annual basis (Fig. S8). However, we find that summertime and autumnal NOx is still overestimated by ∼36 % in the sensitivity simulation, suggesting that further reductions of NOx may be appropriate in certain areas during summer and fall (Fig. 7), and these seasonal corrections should be a focus of future work. Winter and springtime biases are practically eliminated, with average model–measurement differences of <10 %. Anthropogenic NOx over Europe is overestimated by the CEDS inventory, especially in central and southern Europe during summer and fall. These overestimates likely extend to other inventories that show similar NOx emissions magnitudes, trends, and spatial distribution (e.g., MACCity, EMEP; Fig. S4).
As discussed previously for the CONUS, it is also possible that this disagreement in NWD magnitudes in Europe during summer stems partially from overestimates of soil NOx in the model. However, this difference is not large enough to fully explain these overestimates, as soil NOx emissions range from <2 % to 23 % of total NOx emissions over Europe. The elimination of global biomass burning emissions in the No-Fires simulation also does not resolve this discrepancy. On average, NWD overestimates in this simulation over Europe still average 115 % year-round, with overestimates of 145 % in summer and 140 % in fall in our No-Fires simulation.
Adjusting NOx emissions impacts ozone concentrations, and NOx is currently one of the largest uncertainties regarding model reproduction of ozone concentrations and trends. Currently, summertime ozone is overestimated at the surface over Europe in GEOS-Chem (Christiansen et al., 2022). GEOS-Chem also overestimates surface ozone over the CONUS at locations in the TOAR database by 8 % on average during summer and fall. Other studies have suggested that this may be due to NOx overestimates in regional anthropogenic inventories, issues in vertical mixing representation, excessive model biogenic VOC production, or missing sinks (Travis et al., 2016; Guo et al., 2018). Regional and seasonal overestimates in NOx emissions discussed in Sect. 3.3 may also contribute to these ozone overestimates. While we did not explore these sensitivities in this work, future efforts should focus on constraining potential NOx overestimates in the US that may contribute to model ozone discrepancies.
We find that reducing anthropogenic NOx emissions over Europe by half results in an average decrease in summertime ozone concentrations of 14 % (7 ppb) during summer below 700 hPa (Fig. 8). At the surface, this reduction in anthropogenic NOx emissions improves model reproduction of ozone compared to observations (Fig. 8). The surface ozone overestimate over Europe is reduced from 14 % (6 ppb) to 2 % (0.7 ppb) on average, bringing it within agreement of observations. Further, this adjustment improves the representation of downwind sites in Eurasia, reducing average summertime overestimates from 14 % to 7 %. It is important to note that this analysis was done on a regional scale. Ozone formation varies between urban and rural regions, where formation regimes can switch between NOx- and VOC-limited over a short spatial scale. Future analyses should investigate the impact of NOx constraints on model ozone at the urban scale.
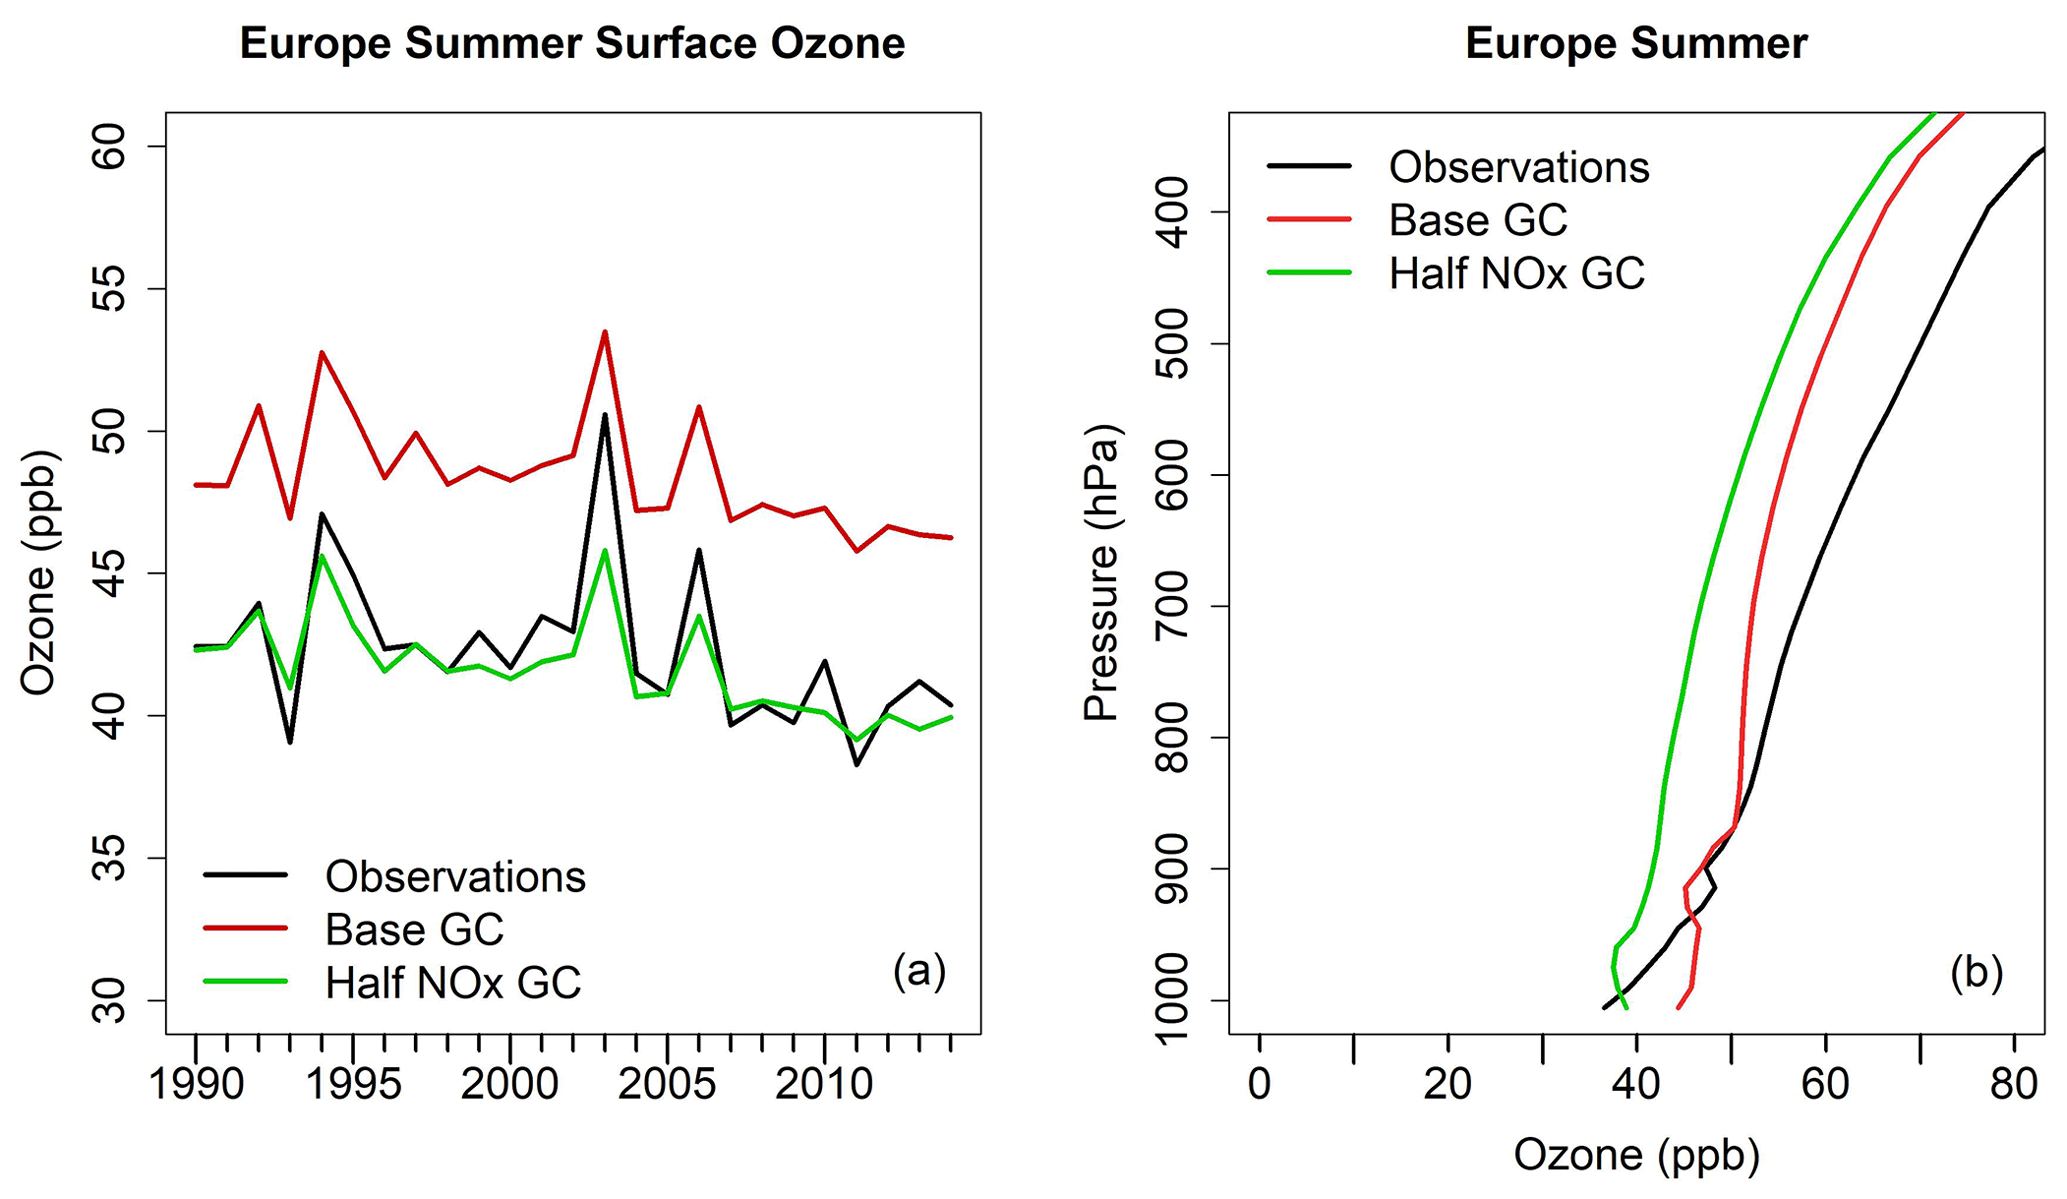
Figure 8Comparisons between observed and modeled summertime ozone concentrations, averaged over Europe. Results from the Half-NOx sensitivity simulation are also shown. (a) Observations of surface ozone compiled by the TOAR database team (Schultz et al., 2017a) are shown in black, GC surface ozone is shown in red, and surface ozone from the Half-NOx simulation is shown in green. (b) Vertical profiles of ozone observed by WOUDC and HEGIFTOM are shown in black, GC ozone is shown in red, and ozone from our Half-NOx simulation is shown in green. The vertical profiles are an average of summertime concentrations from 1990–2017. GC was sampled at the same launch time and location as all ozonesonde launches compiled here.
Above the surface, however, these ozone reductions do not improve model representation of ozone in Europe, instead further exacerbating existing underestimates. Figure 8 shows tropospheric ozone extending through the free troposphere over Europe during summer before and after NOx emissions reductions compared to ozonesonde measurements compiled by WOUDC and HEGIFTOM. Recent versions of GEOS-Chem record systemically low model ozone burdens, especially in the northern midlatitude free troposphere, most notably in winter and spring (Mao et al., 2021; Murray et al., 2021; Christiansen et al., 2022). GC underestimates ozone by ∼10 ppb in the midlatitude free troposphere (Christiansen et al., 2022). Reasons for these underestimates have been explored in depth recently. Briefly, model updates including more active halogen chemistry (Wang et al., 2021), increased NOy reactive uptake by clouds (Holmes et al., 2019), and underestimates of lightning-produced oxidants (Mao et al., 2021) all contribute to these systemic ozone underestimates, even as they improve the model's representation of different chemical processes in the troposphere. Such underestimates are not present in other chemical transport models, including MERRA2-GMI from NASA (http://acd-ext.gsfc.nasa.gov/Projects/GEOSCCM/MERRA2GMI; last access: 21 December 2023) and the previous version of GEOS-Chem explored in this work (v10-01), that do not include these updates (Christiansen et al., 2022). Future work is needed to update model chemistry and emissions to bring free-tropospheric ozone in line with observations. A recent study suggested that inclusion of particulate nitrate could also help reduce this bias by up to 5 ppb in the northern extratropics (Shah et al., 2023).
In this work, we provided a new, independent constraint on NOx emissions and trends over the United States and Europe using NWD flux measurements. We found that anthropogenic NOx trends in the CEDS emissions inventory are reproduced well by NWD until 2010 and that total (i.e., anthropogenic + lightning + soils + biomass burning) NOx emission trends are reproduced well by NWD after 2010. NWD trends are also capable of reproducing the large drop in NOx emissions during COVID-19 lockdowns, and relative changes in NWD magnitudes during the lockdown period are consistent with analyses from satellite and surface NO2 measurements, demonstrating the value of NWD in constraining NOx emission changes. NWD observations show a leveling off of decreasing trends after 2010 consistent with satellite measurements, suggesting the increasing importance of background NOx emissions in determining total NOx trends. We provided further evidence that NWD fluxes are becoming less sensitive to changes in anthropogenic emissions via sensitivity simulations in GEOS-Chem. We also used simulations of NWD via GEOS-Chem to provide evidence of potential overestimates in anthropogenic NOx emissions in standard inventories. While annual trends in the model over the CONUS agree well with observed NWD, we found that NWD magnitudes were overestimated during summer by an average of 20 % over the eastern US after 2000. We also found evidence of widespread NOx overestimates in CEDS (factor of >2) over Europe that persist in all seasons but are strongest during summer and fall. Some of the overestimates in these regions may be due to uncertainties in soil NOx estimates, although these emissions are too small to fully explain the discrepancy. Reducing anthropogenic NOx emissions by 50 % in the GEOS-Chem+CEDS simulation brings winter and springtime fluxes within 10 % of measurements, but summer and fall NWD is still overestimated by ∼36 %. These NOx emission reductions also improve model simulations of surface ozone, decreasing the summertime overestimate over Europe from 14 % to 2 %, but do not improve model free-tropospheric ozone biases. Our work shows that NWD fluxes can be a useful constraint on total (anthropogenic + background) NOx emissions and trends (rapid decrease from 1990–2010, and flattening after 2010), especially as anthropogenic NOx emissions continue to decrease in countries with strict emissions regulations and accurate representation of background sources of NOx becomes necessary to fully understand trends. Due to the model resolutions used here, these findings are most relevant at the regional scale, and future analyses should focus on smaller spatial and temporal (e.g., seasonal) scales to further refine NWD as an independent NOx constraint.
Data and R code used in this publication are available at https://doi.org/10.5281/zenodo.8141028 (Christiansen, 2023). The GEOS-Chem model is publicly available at https://doi.org/10.5281/zenodo.3974569 (The International GEOS-Chem User Community, 2020). Publicly available nitrate wet deposition can be found at https://nadp.slh.wisc.edu/networks/national-trends-network/ (National Atmospheric Deposition Program, 2022) for NADP and https://ebas-data.nilu.no/DataSets.aspx?projects=EMEP&components=nitrate&matrices=precip&fromDate=1970-01-01&toDate=2024-12-31 (Norwegian Institute for Air Research, 2022) for EMEP. High-resolution precipitation datasets are available at https://prism.oregonstate.edu/recent/ (PRISM Climate Group, 2014) and https://knmi-ecad-assets-prd.s3.amazonaws.com/ensembles/data/Grid_0.1deg_reg_ensemble/rr_ens_mean_0.1deg_reg_v22.0e.nc (Cornes et al., 2018). Publicly available surface ozone can be accessed from the TOAR network at https://doi.org/10.1594/PANGAEA.876108 (Schultz et al., 2017b), and publicly available ozonesonde information is available at https://doi.org/10.14287/10000001 (World Ozone and Ultraviolet Radiation Data Centre, 2022) with updates from HEGIFTOM at https://hegiftom.meteo.be/datasets/ozonesondes (TOAR-II HEGIFTOM Focus Working Group, 2022).
The supplement related to this article is available online at: https://doi.org/10.5194/acp-24-4569-2024-supplement.
LH and LJM designed the research. AC performed GEOS-Chem v12.9.3 model simulations, performed data analysis, and wrote the paper. LH performed the GEOS-Chem v10-01 model simulation.
The contact author has declared that none of the authors has any competing interests.
Publisher's note: Copernicus Publications remains neutral with regard to jurisdictional claims made in the text, published maps, institutional affiliations, or any other geographical representation in this paper. While Copernicus Publications makes every effort to include appropriate place names, the final responsibility lies with the authors.
The authors would like to acknowledge high-performance computing resources and support from Cheyenne (https://doi.org/10.5065/D6RX99HX, Computational and Information Systems Laboratory, 2019), provided by the National Center for Atmospheric Research (NCAR) Computational and Information Systems Laboratory and sponsored by the National Science Foundation and the University of Montana's Griz Shared Computing Cluster (GSCC). We thank the National Atmospheric Deposition Program (https://nadp.slh.wisc.edu/networks/national-trends-network/, last access: 9 May 2022) and the European Monitoring and Evaluation Programme (https://ebas.nilu.no/data-access/, last access: 9 May 2022) for the public availability of nitrate wet deposition data. We also thank the PRISM Climate Group at Oregon State University and the European Centre for Medium-Range Weather Forecasts (ECMWF) for the availability of their high-resolution precipitation datasets. The authors thank WOUDC for the public availability of ozonesonde data, which can be accessed at https://doi.org/10.14287/10000001. The authors also acknowledge the ongoing work toward ozonesonde data homogenization, including substantial efforts from the HEGIFTOM and Southern Hemisphere ADditional OZonesondes (SHADOZ) groups. The authors thank Forchungszentrum Jülich for the funding of the TOAR database development and its maintenance, as well as its data providers and Martin Schultz for providing publicly available compiled ozone data. We also thank the two reviewers, who added important insights to this work, including identifying areas for future investigation to continue developing this method to constrain NOx emissions.
This research has been supported by the NOAA Climate Program Office's Atmospheric Chemistry, Carbon Cycle, and Climate program under grant nos. NA19OAR4310174 (Montana) and NA19OAR4310176 (Harvard).
This paper was edited by Patrick Jöckel and reviewed by two anonymous referees.
Amos, H. M., Jacob, D. J., Holmes, C. D., Fisher, J. A., Wang, Q., Yantosca, R. M., Corbitt, E. S., Galarneau, E., Rutter, A. P., Gustin, M. S., Steffen, A., Schauer, J. J., Graydon, J. A., Louis, V. L. St., Talbot, R. W., Edgerton, E. S., Zhang, Y., and Sunderland, E. M.: Gas-particle partitioning of atmospheric Hg(II) and its effect on global mercury deposition, Atmos. Chem. Phys., 12, 591–603, https://doi.org/10.5194/acp-12-591-2012, 2012.
Ancellet, G., Godin-Beekmann, S., Smit, H. G. J., Stauffer, R. M., Van Malderen, R., Bodichon, R., and Pazmiño, A.: Homogenization of the Observatoire de Haute Provence electrochemical concentration cell (ECC) ozonesonde data record: comparison with lidar and satellite observations, Atmos. Meas. Tech., 15, 3105–3120, https://doi.org/10.5194/amt-15-3105-2022, 2022.
Anderson, D. C., Loughner, C. P., Diskin, G., Weinheimer, A., Canty, T. P., Salawitch, R. J., Worden, H. M., Fried, A., Mikoviny, T., Wisthaler, A., and Dickerson, R. R.: Measured and modeled CO and NO y in DISCOVER-AQ: An evaluation of emissions and chemistry over the eastern US, Atmos. Environ., 96, 78–87, https://doi.org/10.1016/j.atmosenv.2014.07.004, 2014.
Baldasano, J. M.: COVID-19 lockdown effects on air quality by NO2 in the cities of Barcelona and Madrid (Spain), Sci. Total Environ., 741, 140353, https://doi.org/10.1016/j.scitotenv.2020.140353, 2020.
Bar, S., Parida, B. R., Mandal, S. P., Pandey, A. C., Kumar, N., and Mishra, B.: Impacts of partial to complete COVID-19 lockdown on NO2 and PM2.5 levels in major urban cities of Europe and USA, Cities, 117, 103308, https://doi.org/10.1016/j.cities.2021.103308, 2021.
Barkley, M. P., González Abad, G., Kurosu, T. P., Spurr, R., Torbatian, S., and Lerot, C.: OMI air-quality monitoring over the Middle East, Atmos. Chem. Phys., 17, 4687–4709, https://doi.org/10.5194/acp-17-4687-2017, 2017.
Bates, K. H. and Jacob, D. J.: A new model mechanism for atmospheric oxidation of isoprene: global effects on oxidants, nitrogen oxides, organic products, and secondary organic aerosol, Atmos. Chem. Phys., 19, 9613–9640, https://doi.org/10.5194/acp-19-9613-2019, 2019.
Bauwens, M., Compernolle, S., Stavrakou, T., Müller, J. -F., Gent, J., Eskes, H., Levelt, P. F., A, R., Veefkind, J. P., Vlietinck, J., Yu, H., and Zehner, C.: Impact of Coronavirus Outbreak on NO2 Pollution Assessed Using TROPOMI and OMI Observations, Geophys. Res. Lett., 47, e2020GL087978, https://doi.org/10.1029/2020GL087978, 2020.
Bell, M. L., Peng, R. D., and Dominici, F.: The Exposure–Response Curve for Ozone and Risk of Mortality and the Adequacy of Current Ozone Regulations, Environ. Health Persp., 114, 532–536, https://doi.org/10.1289/ehp.8816, 2006.
Bey, I., Jacob, D. J., Yantosca, R. M., Logan, J. A., Field, B. D., Fiore, A. M., Li, Q., Liu, H. Y., Mickley, L. J., and Schultz, M. G.: Global modeling of tropospheric chemistry with assimilated meteorology: Model description and evaluation, J. Geophys. Res., 106, 23073–23095, https://doi.org/10.1029/2001JD000807, 2001.
Brioude, J., Angevine, W. M., Ahmadov, R., Kim, S.-W., Evan, S., McKeen, S. A., Hsie, E.-Y., Frost, G. J., Neuman, J. A., Pollack, I. B., Peischl, J., Ryerson, T. B., Holloway, J., Brown, S. S., Nowak, J. B., Roberts, J. M., Wofsy, S. C., Santoni, G. W., Oda, T., and Trainer, M.: Top-down estimate of surface flux in the Los Angeles Basin using a mesoscale inverse modeling technique: assessing anthropogenic emissions of CO, NOx and CO2 and their impacts, Atmos. Chem. Phys., 13, 3661–3677, https://doi.org/10.5194/acp-13-3661-2013, 2013.
Burnett, R. T., Pope, C. A., III, Ezzati, M., Olives, C., Lim, S. S., Mehta, S., Shin, H. H., Singh, G., Hubbell, B., Brauer, M., Anderson, H. R., Smith, K. R., Balmes, J. R., Bruce, N. G., Kan, H., Laden, F., Prüss-Ustün, A., Turner, M. C., Gapstur, S. M., Diver, W. R., and Cohen, A.: An Integrated Risk Function for Estimating the Global Burden of Disease Attributable to Ambient Fine Particulate Matter Exposure, Environ. Health Persp., 122, 397–503, https://doi.org/10.1289/ehp.1307049, 2014.
Butler, T. J., Likens, G. E., Vermeylen, F. M., and Stunder, B. J. B.: The relation between NOx emissions and precipitation NO in the eastern USA, Atmos. Environ., 37, 2093–2104, https://doi.org/10.1016/S1352-2310(03)00103-1, 2003.
Canty, T. P., Hembeck, L., Vinciguerra, T. P., Anderson, D. C., Goldberg, D. L., Carpenter, S. F., Allen, D. J., Loughner, C. P., Salawitch, R. J., and Dickerson, R. R.: Ozone and NOx chemistry in the eastern US: evaluation of CMAQ/CB05 with satellite (OMI) data, Atmos. Chem. Phys., 15, 10965–10982, https://doi.org/10.5194/acp-15-10965-2015, 2015.
Castellanos, P., Marufu, L. T., Doddridge, B. G., Taubman, B. F., Schwab, J. J., Hains, J. C., Ehrman, S. H., and Dickerson, R. R.: Ozone, oxides of nitrogen, and carbon monoxide during pollution events over the eastern United States: An evaluation of emissions and vertical mixing, J. Geophys. Res., 116, D16307, https://doi.org/10.1029/2010JD014540, 2011.
Christiansen, A.: Data & Code Repository for Christiansen et al. (2023) – Constraining Long-Term NOx Emissions over the United States and Europe using Nitrate Wet Deposition Monitoring Networks (1.0), Zenodo [code, data set], https://doi.org/10.5281/zenodo.8141028, 2023.
Christiansen, A., Mickley, L. J., Liu, J., Oman, L. D., and Hu, L.: Multidecadal increases in global tropospheric ozone derived from ozonesonde and surface site observations: can models reproduce ozone trends?, Atmos. Chem. Phys., 22, 14751–14782, https://doi.org/10.5194/acp-22-14751-2022, 2022.
Computational and Information Systems Laboratory: Cheyenne: HPE/SGI ICE XA System (University Community Computing), Boulder, CO, National Center for Atmospheric Research, https://doi.org/10.5065/D6RX99HX, 2019.
Cornes, R., van der Schrier, G., van den Besselaar, E. J. M., and Jones, P. D.: An Ensemble Version of the E-OBS Temperature and Precipitation Datasets, J. Geophys. Res.-Atmos., 123, 9391–9409, https://doi.org/10.1029/2017JD028200, 2018 (data available at: https://knmi-ecad-assets-prd.s3.amazonaws.com/ensembles/data/Grid_0.1deg_reg_ensemble/rr_ens_mean_0.1deg_reg_v22.0e.nc, last access: 10 November 2020).
Dallmann, T. R. and Harley, R. A.: Evaluation of mobile source emission trends in the United States, J. Geophys. Res., 115, D14305, https://doi.org/10.1029/2010JD013862, 2010.
Daly, C., Halbleib, M., Smith, J. I., Gibson, W. P., Doggett, M. K., Taylor, G. H., Curtis, J., and Pasteris, P. P.: Physiographically sensitive mapping of climatological temperature and precipitation across the conterminous United States, Int. J. Climatol., 28, 2031–2064, https://doi.org/10.1002/joc.1688, 2008.
Du, E., de Vries, W., Galloway, J. N., Hu, X., and Fang, J.: Changes in wet nitrogen deposition in the United States between 1985 and 2012, Environ. Res. Lett., 9, 095004, https://doi.org/10.1088/1748-9326/9/9/095004, 2014.
Duncan, B. N.: Interannual and seasonal variability of biomass burning emissions constrained by satellite observations, J. Geophys. Res., 108, 4100, https://doi.org/10.1029/2002JD002378, 2003.
Duncan, B. N., Lamsal, L. N., Thompson, A. M., Yoshida, Y., Lu, Z., Streets, D. G., Hurwitz, M. M., and Pickering, K. E.: A space-based, high-resolution view of notable changes in urban NOx pollution around the world (2005–2014), J. Geophys. Res.-Atmos., 121, 976–996, https://doi.org/10.1002/2015JD024121, 2016.
Dutta, I. and Heald, C. L.: Exploring Deposition Observations of Oxidized Sulfur and Nitrogen as a Constraint on Emissions in the United States, J. Geophys. Res.-Atmos., 128, e2023JD039610, https://doi.org/10.1029/2023JD039610, 2023.
Elguindi, N., Granier, C., Stavrakou, T., Darras, S., Bauwens, M., Cao, H., Chen, C., Denier van der Gon, H. A. C., Dubovik, O., Fu, T. M., Henze, D. K., Jiang, Z., Keita, S., Kuenen, J. J. P., Kurokawa, J., Liousse, C., Miyazaki, K., Müller, J.-F., Qu, Z., Solmon, F., and Zheng, B.: Intercomparison of Magnitudes and Trends in Anthropogenic Surface Emissions From Bottom-Up Inventories, Top-Down Estimates, and Emission Scenarios, Earth's Future, 8, e2020EF001520, https://doi.org/10.1029/2020EF001520, 2020.
Finkelstein, P. L., Ellestad, T. G., Clarke, J. F., Meyers, T. P., Schwede, D. B., Hebert, E. O., and Neal, J. A.: Ozone and sulfur dioxide dry deposition to forests: Observations and model evaluation, J. Geophys. Res., 105, 15365–15377, https://doi.org/10.1029/2000JD900185, 2000.
Frost, G. J., McKeen, S. A., Trainer, M., Ryerson, T. B., Neuman, J. A., Roberts, J. M., Swanson, A., Holloway, J. S., Sueper, D. T., Fortin, T., Parrish, D. D., Fehsenfeld, F. C., Flocke, F., Peckham, S. E., Grell, G. A., Kowal, D., Cartwright, J., Auerbach, N., and Habermann, T.: Effects of changing power plant NOx emissions on ozone in the eastern United States: Proof of concept, J. Geophys. Res., 111, D12306, https://doi.org/10.1029/2005JD006354, 2006.
Galloway, J. N., Aber, J. D., Erisman, J. W., Seitzinger, S. P., Howarth, R. W., Cowling, E. B., and Cosby, B. J.: The Nitrogen Cascade, BioScience, 53, 341–356, https://doi.org/10.1641/0006-3568(2003)053[0341:TNC]2.0.CO;2, 2003.
Gauderman, W. J., Avol, E., Lurmann, F., Kuenzli, N., Gilliland, F., Peters, J., and McConnell, R.: Childhood Asthma and Exposure to Traffic and Nitrogen Dioxide, Epidemiology, 16, 737–743, 2005.
Gelaro, R., McCarty, W., Suárez, M. J., Todling, R., Molod, A., Takacs, L., Randles, C. A., Darmenov, A., Bosilovich, M. G., Reichle, R., Wargan, K., Coy, L., Cullather, R., Draper, C., Akella, S., Buchard, V., Conaty, A., da Silva, A. M., Gu, W., Kim, G.-K., Koster, R., Lucchesi, R., Merkova, D., Nielsen, J. E., Partyka, G., Pawson, S., Putman, W., Rienecker, M., Schubert, S. D., Sienkiewicz, M., and Zhao, B.: The Modern-Era Retrospective Analysis for Research and Applications, Version 2 (MERRA-2), J. Climate, 30, 5419–5454, https://doi.org/10.1175/JCLI-D-16-0758.1, 2017.
Giglio, L., Randerson, J. T., and van der Werf, G. R.: Analysis of daily, monthly, and annual burned area using the fourth-generation global fire emissions database (GFED4): ANALYSIS OF BURNED AREA, J. Geophys. Res.-Biogeo., 118, 317–328, https://doi.org/10.1002/jgrg.20042, 2013.
Goldberg, D. L., Vinciguerra, T. P., Anderson, D. C., Hembeck, L., Canty, T. P., Ehrman, S. H., Martins, D. K., Stauffer, R. M., Thompson, A. M., Salawitch, R. J., and Dickerson, R. R.: CAMx ozone source attribution in the eastern United States using guidance from observations during DISCOVER-AQ Maryland, Geophys. Res. Lett., 43, 2249–2258, https://doi.org/10.1002/2015GL067332, 2016.
Goldberg, D. L., Lu, Z., Streets, D. G., de Foy, B., Griffin, D., McLinden, C. A., Lamsal, L. N., Krotkov, N. A., and Eskes, H.: Enhanced Capabilities of TROPOMI NO2: Estimating NOX from North American Cities and Power Plants, Environ. Sci. Technol., 53, 12594–12601, https://doi.org/10.1021/acs.est.9b04488, 2019.
Goldberg, D. L., Anenberg, S. C., Lu, Z., Streets, D. G., Lamsal, L. N., E McDuffie, E., and Smith, S. J.: Urban NOx emissions around the world declined faster than anticipated between 2005 and 2019, Environ. Res. Lett., 16, 115004, https://doi.org/10.1088/1748-9326/ac2c34, 2021.
Granier, C., Bessagnet, B., Bond, T., D'Angiola, A., Denier van der Gon, H., Frost, G. J., Heil, A., Kaiser, J. W., Kinne, S., Klimont, Z., Kloster, S., Lamarque, J.-F., Liousse, C., Masui, T., Meleux, F., Mieville, A., Ohara, T., Raut, J.-C., Riahi, K., Schultz, M. G., Smith, S. J., Thompson, A., van Aardenne, J., van der Werf, G. R., and van Vuuren, D. P.: Evolution of anthropogenic and biomass burning emissions of air pollutants at global and regional scales during the 1980–2010 period, Climatic Change, 109, 163–190, https://doi.org/10.1007/s10584-011-0154-1, 2011.
Guenther, A. B., Jiang, X., Heald, C. L., Sakulyanontvittaya, T., Duhl, T., Emmons, L. K., and Wang, X.: The Model of Emissions of Gases and Aerosols from Nature version 2.1 (MEGAN2.1): an extended and updated framework for modeling biogenic emissions, Geosci. Model Dev., 5, 1471–1492, https://doi.org/10.5194/gmd-5-1471-2012, 2012.
Guo, J. J., Fiore, A. M., Murray, L. T., Jaffe, D. A., Schnell, J. L., Moore, C. T., and Milly, G. P.: Average versus high surface ozone levels over the continental USA: model bias, background influences, and interannual variability, Atmos. Chem. Phys., 18, 12123–12140, https://doi.org/10.5194/acp-18-12123-2018, 2018.
Harkins, C., McDonald, B. C., Henze, D. K., and Wiedinmyer, C.: A fuel-based method for updating mobile source emissions during the COVID-19 pandemic, Environ. Res. Lett., 16, 065018, https://doi.org/10.1088/1748-9326/ac0660, 2021.
Haylock, M. R., Hofstra, N., Klein Tank, A. M. G., Klok, E. J., Jones, P. D., and New, M.: A European daily high-resolution gridded data set of surface temperature and precipitation for 1950–2006, J. Geophys. Res., 113, D20119, https://doi.org/10.1029/2008JD010201, 2008.
He, T., Jones, D. B. A., Miyazaki, K., Huang, B., Liu, Y., Jiang, Z., White, E. C., Worden, H. M., and Worden, J. R.: Deep Learning to Evaluate US NOx Emissions Using Surface Ozone Predictions, J. Geophys. Res.-Atmos., 127, e2021JD035597, https://doi.org/10.1029/2021JD035597, 2022.
Hoesly, R. M., Smith, S. J., Feng, L., Klimont, Z., Janssens-Maenhout, G., Pitkanen, T., Seibert, J. J., Vu, L., Andres, R. J., Bolt, R. M., Bond, T. C., Dawidowski, L., Kholod, N., Kurokawa, J.-I., Li, M., Liu, L., Lu, Z., Moura, M. C. P., O'Rourke, P. R., and Zhang, Q.: Historical (1750–2014) anthropogenic emissions of reactive gases and aerosols from the Community Emissions Data System (CEDS), Geosci. Model Dev., 11, 369–408, https://doi.org/10.5194/gmd-11-369-2018, 2018.
Holmes, C. D., Bertram, T. H., Confer, K. L., Graham, K. A., Ronan, A. C., Wirks, C. K., and Shah, V.: The Role of Clouds in the Tropospheric NO x Cycle: A New Modeling Approach for Cloud Chemistry and Its Global Implications, Geophys. Res. Lett., 46, 4980–4990, https://doi.org/10.1029/2019GL081990, 2019.
Hu, L., Millet, D. B., Baasandorj, M., Griffis, T. J., Turner, P., Helmig, D., Curtis, A. J., and Hueber, J.: Isoprene emissions and impacts over an ecological transition region in the U.S. Upper Midwest inferred from tall tower measurements: Isoprene emissions in US Upper Midwest, J. Geophys. Res.-Atmos., 120, 3553–3571, https://doi.org/10.1002/2014JD022732, 2015.
Hu, L., Jacob, D. J., Liu, X., Zhang, Y., Zhang, L., Kim, P. S., Sulprizio, M. P., and Yantosca, R. M.: Global budget of tropospheric ozone: Evaluating recent model advances with satellite (OMI), aircraft (IAGOS), and ozonesonde observations, Atmos. Environ., 167, 323–334, https://doi.org/10.1016/j.atmosenv.2017.08.036, 2017.
Hudman, R. C., Moore, N. E., Mebust, A. K., Martin, R. V., Russell, A. R., Valin, L. C., and Cohen, R. C.: Steps towards a mechanistic model of global soil nitric oxide emissions: implementation and space based-constraints, Atmos. Chem. Phys., 12, 7779–7795, https://doi.org/10.5194/acp-12-7779-2012, 2012.
Jaeglé, L., Shah, V., Thornton, J. A., Lopez-Hilfiker, F. D., Lee, B. H., McDuffie, E. E., Fibiger, D., Brown, S. S., Veres, P., Sparks, T. L., Ebben, C. J., Wooldridge, P. J., Kenagy, H. S., Cohen, R. C., Weinheimer, A. J., Campos, T. L., Montzka, D. D., Digangi, J. P., Wolfe, G. M., Hanisco, T., Schroder, J. C., Campuzano-Jost, P., Day, D. A., Jimenez, J. L., Sullivan, A. P., Guo, H., and Weber, R. J.: Nitrogen Oxides Emissions, Chemistry, Deposition, and Export Over the Northeast United States During the WINTER Aircraft Campaign, J. Geophys. Res.-Atmos., 123, 12368–12393, https://doi.org/10.1029/2018JD029133, 2018.
Jiang, Z., Jones, D. B. A., Worden, H. M., Deeter, M. N., Henze, D. K., Worden, J., Bowman, K. W., Brenninkmeijer, C. A. M., and Schuck, T. J.: Impact of model errors in convective transport on CO source estimates inferred from MOPITT CO retrievals, J. Geophys. Res.-Atmos., 118, 2073–2083, https://doi.org/10.1002/jgrd.50216, 2013.
Jiang, Z., McDonald, B. C., Worden, H., Worden, J. R., Miyazaki, K., Qu, Z., Henze, D. K., Jones, D. B. A., Arellano, A. F., Fischer, E. V., Zhu, L., and Boersma, K. F.: Unexpected slowdown of US pollutant emission reduction in the past decade, P. Natl. Acad. Sci. USA, 115, 5099–5104, https://doi.org/10.1073/pnas.1801191115, 2018.
Keller, C. A., Long, M. S., Yantosca, R. M., Da Silva, A. M., Pawson, S., and Jacob, D. J.: HEMCO v1.0: a versatile, ESMF-compliant component for calculating emissions in atmospheric models, Geosci. Model Dev., 7, 1409–1417, https://doi.org/10.5194/gmd-7-1409-2014, 2014.
Kenagy, H. S., Sparks, T. L., Ebben, C. J., Wooldrige, P. J., Lopez-Hilfiker, F. D., Lee, B. H., Thornton, J. A., McDuffie, E. E., Fibiger, D. L., Brown, S. S., Montzka, D. D., Weinheimer, A. J., Schroder, J. C., Campuzano-Jost, P., Day, D. A., Jimenez, J. L., Dibb, J. E., Campos, T., Shah, V., Jaeglé, L., and Cohen, R. C.: NOx Lifetime and NOy Partitioning During WINTER, J. Geophys. Res.-Atmos., 123, 9813–9827, https://doi.org/10.1029/2018JD028736, 2018.
Kerr, G. H., Goldberg, D. L., and Anenberg, S. C.: COVID-19 pandemic reveals persistent disparities in nitrogen dioxide pollution, P. Natl. Acad. Sci. USA, 118, e2022409118, https://doi.org/10.1073/pnas.2022409118, 2021.
Kota, S. H., Zhang, H., Chen, G., Schade, G. W., and Ying, Q.: Evaluation of on-road vehicle CO and NOx National Emission Inventories using an urban-scale source-oriented air quality model, Atmos. Environ., 85, 99–108, https://doi.org/10.1016/j.atmosenv.2013.11.020, 2014.
Krotkov, N. A., McLinden, C. A., Li, C., Lamsal, L. N., Celarier, E. A., Marchenko, S. V., Swartz, W. H., Bucsela, E. J., Joiner, J., Duncan, B. N., Boersma, K. F., Veefkind, J. P., Levelt, P. F., Fioletov, V. E., Dickerson, R. R., He, H., Lu, Z., and Streets, D. G.: Aura OMI observations of regional SO2 and NO2 pollution changes from 2005 to 2015, Atmos. Chem. Phys., 16, 4605–4629, https://doi.org/10.5194/acp-16-4605-2016, 2016.
Krotkov, N. A., Lamsal, L. N., Celarier, E. A., Swartz, W. H., Marchenko, S. V., Bucsela, E. J., Chan, K. L., Wenig, M., and Zara, M.: The version 3 OMI NO2 standard product, Atmos. Meas. Tech., 10, 3133–3149, https://doi.org/10.5194/amt-10-3133-2017, 2017.
Lamb, D. and Bowersox, V.: The national atmospheric deposition program: an overview, Atmos. Environ., 34, 1661–1663, https://doi.org/10.1016/S1352-2310(99)00425-2, 2000.
Lamb, D. and Comrie, L.: Comparability and precision of MAP3S and NADP/NTN precipitation chemistry data at an acidic site in eastern North America, Atmos. Environ. A-Gen., 27, 1993–2008, https://doi.org/10.1016/0960-1686(93)90273-2, 1993.
Lamsal, L. N., Martin, R. V., Padmanabhan, A., van Donkelaar, A., Zhang, Q., Sioris, C. E., Chance, K., Kurosu, T. P., and Newchurch, M. J.: Application of satellite observations for timely updates to global anthropogenic NO x emission inventories, Geophys. Res. Lett., 38, L05810, https://doi.org/10.1029/2010GL046476, 2011.
Laughner, J. L. and Cohen, R. C.: Direct observation of changing NO x lifetime in North American cities, Science, 366, 723–727, https://doi.org/10.1126/science.aax6832, 2019.
Li, Y., Schichtel, B. A., Walker, J. T., Schwede, D. B., Chen, X., Lehmann, C. M. B., Puchalski, M. A., Gay, D. A., and Collett, J. L.: Increasing importance of deposition of reduced nitrogen in the United States, P. Natl. Acad. Sci. USA, 113, 5874–5879, https://doi.org/10.1073/pnas.1525736113, 2016.
Liu, F., Beirle, S., Zhang, Q., Dörner, S., He, K., and Wagner, T.: NOx lifetimes and emissions of cities and power plants in polluted background estimated by satellite observations, Atmos. Chem. Phys., 16, 5283–5298, https://doi.org/10.5194/acp-16-5283-2016, 2016.
Liu, H., Jacob, D.J., Bey, I., and Yantosca, R.M.: Constraints from 210Pb and 7Be on wet deposition and transporting a global three-dimensional chemical tracer model driven by assimilated meteorological fields, J. Geophys. Res., 106, 12109–12128, https://doi.org/10.1029/2000JD900839, 2001.
Liu, P., Kaplan, J. O., Mickley, L. J., Li, Y., Chellman, N. J., Arienzo, M. M., Kodros, J. K., Pierce, J. R., Sigl, M., Freitag, J., Mulvaney, R., Curran, M. A. J., and McConnell, J. R.: Improved estimates of preindustrial biomass burning reduce the magnitude of aerosol climate forcing in the Southern Hemisphere, Sci. Adv., 7, eabc1379, https://doi.org/10.1126/sciadv.abc1379, 2021.
Mao, J., Zhao, T., Keller, C. A., Wang, X., McFarland, P. J., Jenkins, J. M., and Brune, W. H.: Global Impact of Lightning-Produced Oxidants, Geophys. Res. Lett., 48, e2021GL095740, https://doi.org/10.1029/2021GL095740, 2021.
Martin, R. V.: An improved retrieval of tropospheric nitrogen dioxide from GOME, J. Geophys. Res., 107, 4437, https://doi.org/10.1029/2001JD001027, 2002.
Martin, R. V., Sauvage, B., Folkins, I., Sioris, C. E., Boone, C., Bernath, P., and Ziemke, J.: Space-based constraints on the production of nitric oxide by lightning, J. Geophys. Res., 112, 2006JD007831, https://doi.org/10.1029/2006JD007831, 2007.
McDonald, B. C., Gentner, D. R., Goldstein, A. H., and Harley, R. A.: Long-Term Trends in Motor Vehicle Emissions in U.S. Urban Areas, Environ. Sci. Technol., 47, 10022–10031, https://doi.org/10.1021/es401034z, 2013.
McDonald, B. C., McKeen, S. A., Cui, Y. Y., Ahmadov, R., Kim, S.-W., Frost, G. J., Pollack, I. B., Peischl, J., Ryerson, T. B., Holloway, J. S., Graus, M., Warneke, C., Gilman, J. B., de Gouw, J. A., Kaiser, J., Keutsch, F. N., Hanisco, T. F., Wolfe, G. M., and Trainer, M.: Modeling Ozone in the Eastern U.S. using a Fuel-Based Mobile Source Emissions Inventory, Environ. Sci. Technol., 52, 7360–7370, https://doi.org/10.1021/acs.est.8b00778, 2018.
McDuffie, E. E., Smith, S. J., O'Rourke, P., Tibrewal, K., Venkataraman, C., Marais, E. A., Zheng, B., Crippa, M., Brauer, M., and Martin, R. V.: A global anthropogenic emission inventory of atmospheric pollutants from sector- and fuel-specific sources (1970–2017): an application of the Community Emissions Data System (CEDS), Earth Syst. Sci. Data, 12, 3413–3442, https://doi.org/10.5194/essd-12-3413-2020, 2020.
Meyers, T. P., Finkelstein, P., Clarke, J., Ellestad, T. G., and Sims, P. F.: A multilayer model for inferring dry deposition using standard meteorological measurements, J. Geophys. Res., 103, 22645–22661, https://doi.org/10.1029/98JD01564, 1998.
Miyazaki, K., Eskes, H., Sudo, K., Boersma, K. F., Bowman, K., and Kanaya, Y.: Decadal changes in global surface NOx emissions from multi-constituent satellite data assimilation, Atmos. Chem. Phys., 17, 807–837, https://doi.org/10.5194/acp-17-807-2017, 2017.
Monks, P. S., Granier, C., Fuzzi, S., Stohl, A., Williams, M. L., Akimoto, H., Amann, M., Baklanov, A., Baltensperger, U., Bey, I., Blake, N., Blake, R. S., Carslaw, K., Cooper, O. R., Dentener, F., Fowler, D., Fragkou, E., Frost, G. J., Generoso, S., Ginoux, P., Grewe, V., Guenther, A., Hansson, H. C., Henne, S., Hjorth, J., Hofzumahaus, A., Huntrieser, H., Isaksen, I. S. A., Jenkin, M. E., Kaiser, J., Kanakidou, M., Klimont, Z., Kulmala, M., Laj, P., Lawrence, M. G., Lee, J. D., Liousse, C., Maione, M., McFiggans, G., Metzger, A., Mieville, A., Moussiopoulos, N., Orlando, J. J., O'Dowd, C. D., Palmer, P. I., Parrish, D. D., Petzold, A., Platt, U., Pöschl, U., Prévôt, A. S. H., Reeves, C. E., Reimann, S., Rudich, Y., Sellegri, K., Steinbrecher, R., Simpson, D., ten Brink, H., Theloke, J., van der Werf, G. R., Vautard, R., Vestreng, V., Vlachokostas, Ch., and von Glasow, R.: Atmospheric composition change – global and regional air quality, Atmos. Environ., 43, 5268–5350, https://doi.org/10.1016/j.atmosenv.2009.08.021, 2009.
Monks, P. S., Archibald, A. T., Colette, A., Cooper, O., Coyle, M., Derwent, R., Fowler, D., Granier, C., Law, K. S., Mills, G. E., Stevenson, D. S., Tarasova, O., Thouret, V., von Schneidemesser, E., Sommariva, R., Wild, O., and Williams, M. L.: Tropospheric ozone and its precursors from the urban to the global scale from air quality to short-lived climate forcer, Atmos. Chem. Phys., 15, 8889–8973, https://doi.org/10.5194/acp-15-8889-2015, 2015.
Murray, L. T.: Lightning NOx and Impacts on Air Quality, Curr. Pollution Rep., 2, 115–133, https://doi.org/10.1007/s40726-016-0031-7, 2016.
Murray, L. T., Jacob, D. J., Logan, J. A., Hudman, R. C., and Koshak, W. J.: Optimized regional and interannual variability of lightning in a global chemical transport model constrained by LIS/OTD satellite data: IAV OF LIGHTNING CONSTRAINED BY LIS/OTD, J. Geophys. Res., 117, D20307, https://doi.org/10.1029/2012JD017934, 2012.
Murray, L. T., Logan, J. A., and Jacob, D. J.: Interannual variability in tropical tropospheric ozone and OH: The role of lightning: IAV IN OZONE AND OH-ROLE OF LIGHTNING, J. Geophys. Res.-Atmos., 118, 11468–11480, https://doi.org/10.1002/jgrd.50857, 2013.
Murray, L. T., Leibensperger, E. M., Orbe, C., Mickley, L. J., and Sulprizio, M.: GCAP 2.0: a global 3-D chemical-transport model framework for past, present, and future climate scenarios, Geosci. Model Dev., 14, 5789–5823, https://doi.org/10.5194/gmd-14-5789-2021, 2021.
National Atmospheric Deposition Program (NRSP-3): NADP Program Office, Wisconsin State Laboratory of Hygiene, 465 Henry Mall, Madison, WI 53706, https://nadp.slh.wisc.edu/networks/national-trends-network/ (last access: 9 May 2022), 2022.
Nilles, M. A., Gordon, J. D., and Schroder, L. J.: The precision of wet atmospheric deposition data from national atmospheric deposition program/national trends network sites determined with collocated samplers, Atmos. Environ., 28, 1121–1128, https://doi.org/10.1016/1352-2310(94)90289-5, 1994.
Norwegian Institute for Air Research: EBAS Database, https://ebas-data.nilu.no/DataSets.aspx?projects=EMEP&components=nitrate&matrices=precip&fromDate=1970-01-01&toDate=2024-12-31, last access: 9 May 2022.
Oner, E. and Kaynak, B.: Evaluation of NOx emissions for Turkey using satellite and ground-based observations, Atmos. Pollut. Res., 7, 419–430, https://doi.org/10.1016/j.apr.2015.10.017, 2016.
Parrish, D. D.: Critical evaluation of US on-road vehicle emission inventories, Atmos. Environ., 40, 2288–2300, https://doi.org/10.1016/j.atmosenv.2005.11.033, 2006.
Paulot, F., Jacob, D. J., Pinder, R. W., Bash, J. O., Travis, K., and Henze, D. K.: Ammonia emissions in the United States, European Union, and China derived by high-resolution inversion of ammonium wet deposition data: Interpretation with a new agricultural emissions inventory (MASAGE_NH3), J. Geophys. Res.-Atmos., 119, 4343–4364, https://doi.org/10.1002/2013JD021130, 2014.
Peischl, J., Ryerson, T. B., Holloway, J. S., Parrish, D. D., Trainer, M., Frost, G. J., Aikin, K. C., Brown, S. S., Dubé, W. P., Stark, H., and Fehsenfeld, F. C.: A top-down analysis of emissions from selected Texas power plants during TexAQS 2000 and 2006, J. Geophys. Res., 115, D16303, https://doi.org/10.1029/2009JD013527, 2010.
Pope, C. A., Turner, M. C., Burnett, R. T., Jerrett, M., Gapstur, S. M., Diver, W. R., Krewski, D., and Brook, R. D.: Relationships Between Fine Particulate Air Pollution, Cardiometabolic Disorders, and Cardiovascular Mortality, Circ. Res., 116, 108–115, https://doi.org/10.1161/CIRCRESAHA.116.305060, 2015.
PRISM Climate Group, Oregon State University: Recent Years (Jan 1981–Sep 2023), https://prism.oregonstate.edu/recent/, last access: 10 November 2020.
Qu, Z., Jacob, D. J., Silvern, R. F., Shah, V., Campbell, P. C., Valin, L. C., and Murray, L. T.: US COVID-19 Shutdown Demonstrates Importance of Background NO2 in Inferring NOx Emissions From Satellite NO2 Observations, Geophys. Res. Lett., 48, e2021GL092783, https://doi.org/10.1029/2021GL092783, 2021.
R Core Team: R: A language and environment for statistical computing., R Foundation for Statistical Computing, Vienna, Austria, https://www.r-project.org/ (last access: 16 April 2024), 2013.
Rienecker, M. M., Suarez, M. J., Gelaro, R., Todling, R., Bacmeister, J., Liu, E., Bosilovich, M. G., Schubert, S. D., Takacs, L., Kim, G.-K., Bloom, S., Chen, J., Collins, D., Conaty, A., da Silva, A., Gu, W., Joiner, J., Koster, R. D., Lucchesi, R., Molod, A., Owens, T., Pawson, S., Pegion, P., Redder, C. R., Reichle, R., Robertson, F. R., Ruddick, A. G., Sienkiewicz, M., and Woollen, J.: MERRA: NASA's Modern-Era Retrospective Analysis for Research and Applications, J. Climate, 24, 3624–3648, https://doi.org/10.1175/JCLI-D-11-00015.1, 2011.
Rossi, R., Ceccato, R., and Gastaldi, M.: Effect of Road Traffic on Air Pollution. Experimental Evidence from COVID-19 Lockdown, Sustainability, 12, 8984, https://doi.org/10.3390/su12218984, 2020.
Salmon, O. E., Shepson, P. B., Ren, X., He, H., Hall, D. L., Dickerson, R. R., Stirm, B. H., Brown, S. S., Fibiger, D. L., McDuffie, E. E., Campos, T. L., Gurney, K. R., and Thornton, J. A.: Top-Down Estimates of NOx and CO Emissions From Washington, D.C.-Baltimore During the WINTER Campaign, J. Geophys. Res.-Atmos., 123, 7705–7724, https://doi.org/10.1029/2018JD028539, 2018.
Schultz, M. G., Schröder, S., Lyapina, O., Cooper, O. R., Galbally, I., Petropavlovskikh, I., von Schneidemesser, E., Tanimoto, H., Elshorbany, Y., Naja, M., Seguel, R. J., Dauert, U., Eckhardt, P., Feigenspan, S., Fiebig, M., Hjellbrekke, A.-G., Hong, Y.-D., Kjeld, P. C., Koide, H., Lear, G., Tarasick, D., Ueno, M., Wallasch, M., Baumgardner, D., Chuang, M.-T., Gillett, R., Lee, M., Molloy, S., Moolla, R., Wang, T., Sharps, K., Adame, J. A., Ancellet, G., Apadula, F., Artaxo, P., Barlasina, M. E., Bogucka, M., Bonasoni, P., Chang, L., Colomb, A., Cuevas-Agulló, E., Cupeiro, M., Degorska, A., Ding, A., Fröhlich, M., Frolova, M., Gadhavi, H., Gheusi, F., Gilge, S., Gonzalez, M. Y., Gros, V., Hamad, S. H., Helmig, D., Henriques, D., Hermansen, O., Holla, R., Hueber, J., Im, U., Jaffe, D. A., Komala, N., Kubistin, D., Lam, K.-S., Laurila, T., Lee, H., Levy, I., Mazzoleni, C., Mazzoleni, L. R., McClure-Begley, A., Mohamad, M., Murovec, M., Navarro-Comas, M., Nicodim, F., Parrish, D., Read, K. A., Reid, N., Ries, L., Saxena, P., Schwab, J. J., Scorgie, Y., Senik, I., Simmonds, P., Sinha, V., Skorokhod, A. I., Spain, G., Spangl, W., Spoor, R., Springston, S. R., Steer, K., Steinbacher, M., Suharguniyawan, E., Torre, P., Trickl, T., Weili, L., Weller, R., Xiaobin, X., Xue, L., and Zhiqiang, M.: Tropospheric Ozone Assessment Report: Database and metrics data of global surface ozone observations, Elementa: Science of the Anthropocene, 5, 58, https://doi.org/10.1525/elementa.244, 2017a.
Schultz, M. G., Schröder, S., Lyapina, O., Cooper, O. R., Galbally, I., Petropavlovskikh, I., von Schneidemesser, E., Tanimoto, H., Elshorbany, Y., Naja, M., Seguel, R. J., Dauert, U., Eckhardt, P., Feigenspan, S., Fiebig, M., Hjellbrekke, A.-G., Hong, Y.-D., Kjeld, P. C., Koide, H., Lear, G., Tarasick, D., Ueno, M., Wallasch, M., Baumgardner, D., Chuang, M.-T., Gillett, R., Lee, M., Molloy, S., Moolla, R., Wang, T., Sharps, K., Adame, J. A., Ancellet, Ge., Apadula, F., Artaxo, P., Barlasina, M. E., Bogucka, M., Bonasoni, P., Chang, L., Colomb, A., Cuevas-Agulló, E., Cupeiro, M., Degorska, A., Ding, A., Fröhlich, M., Frolova, M., Gadhavi, H., Gheusi, F., Gilge, S., Gonzalez, M. Y., Gros, V., Hamad, S. H., Helmig, D., Henriques, D., Hermansen, O., Holla, R., Hueber, J., Im, U., Jaffe, D. A., Komala, N., Kubistin, D., Lam, K.-S., Laurila, T., Lee, H., Levy, I., Mazzoleni, C., Mazzoleni, L. R., McClure-Begley, A., Mohamad, M., Murovec, M., Navarro-Comas, M., Nicodim, F., Parrish, D., Read, K. A., Reid, N., Ries, L., Saxena, P., Schwab, J. J., Scorgie, Y., Senik, I., Simmonds, P., Sinha, V., Skorokhod, A. I., Spain, G., Spangl, W., Spoor, R., Springston, S. R., Steer, K., Steinbacher, M., Suharguniyawan, E., Torre, P., Trickl, T., Weili, L., Weller, R., Xu, X., Xue, L., and Ma, Z.: Tropospheric Ozone Assessment Report, links to Global surface ozone datasets, PANGAEA [data set], https://doi.org/10.1594/PANGAEA.876108, 2017b.
Schwede, D. B. and Lear, G. G.: A novel hybrid approach for estimating total deposition in the United States, Atmos. Environ., 92, 207–220, https://doi.org/10.1016/j.atmosenv.2014.04.008, 2014.
Shah, V., Jacob, D. J., Li, K., Silvern, R. F., Zhai, S., Liu, M., Lin, J., and Zhang, Q.: Effect of changing NOx lifetime on the seasonality and long-term trends of satellite-observed tropospheric NO2 columns over China, Atmos. Chem. Phys., 20, 1483–1495, https://doi.org/10.5194/acp-20-1483-2020, 2020.
Shah, V., Jacob, D. J., Dang, R., Lamsal, L. N., Strode, S. A., Steenrod, S. D., Boersma, K. F., Eastham, S. D., Fritz, T. M., Thompson, C., Peischl, J., Bourgeois, I., Pollack, I. B., Nault, B. A., Cohen, R. C., Campuzano-Jost, P., Jimenez, J. L., Andersen, S. T., Carpenter, L. J., Sherwen, T., and Evans, M. J.: Nitrogen oxides in the free troposphere: implications for tropospheric oxidants and the interpretation of satellite NO2 measurements, Atmos. Chem. Phys., 23, 1227–1257, https://doi.org/10.5194/acp-23-1227-2023, 2023.
Sickles II, J. E. and Shadwick, D. S.: Air quality and atmospheric deposition in the eastern US: 20 years of change, Atmos. Chem. Phys., 15, 173–197, https://doi.org/10.5194/acp-15-173-2015, 2015.
Silvern, R. F., Jacob, D. J., Mickley, L. J., Sulprizio, M. P., Travis, K. R., Marais, E. A., Cohen, R. C., Laughner, J. L., Choi, S., Joiner, J., and Lamsal, L. N.: Using satellite observations of tropospheric NO2 columns to infer long-term trends in US NOx emissions: the importance of accounting for the free tropospheric NO2 background, Atmos. Chem. Phys., 19, 8863–8878, https://doi.org/10.5194/acp-19-8863-2019, 2019.
Singh, A. and Agrawal, M.: Acid rain and its ecological consequences, J. Environ. Biol., 29, 15–24, 2008.
Souri, A. H., Choi, Y., Jeon, W., Li, X., Pan, S., Diao, L., and Westenbarger, D. A.: Constraining NOx emissions using satellite NO2 measurements during 2013 DISCOVER-AQ Texas campaign, Atmos. Environ., 131, 371–381, https://doi.org/10.1016/j.atmosenv.2016.02.020, 2016.
Stavrakou, T., Müller, J.-F., Boersma, K. F., van der A, R. J., Kurokawa, J., Ohara, T., and Zhang, Q.: Key chemical NOx sink uncertainties and how they influence top-down emissions of nitrogen oxides, Atmos. Chem. Phys., 13, 9057–9082, https://doi.org/10.5194/acp-13-9057-2013, 2013.
Sterling, C. W., Johnson, B. J., Oltmans, S. J., Smit, H. G. J., Jordan, A. F., Cullis, P. D., Hall, E. G., Thompson, A. M., and Witte, J. C.: Homogenizing and estimating the uncertainty in NOAA's long-term vertical ozone profile records measured with the electrochemical concentration cell ozonesonde, Atmos. Meas. Tech., 11, 3661–3687, https://doi.org/10.5194/amt-11-3661-2018, 2018.
Szymankiewicz, K., Kaminski, J. W., and Struzewska, J.: Application of Satellite Observations and Air Quality Modelling to Validation of NOx Anthropogenic EMEP Emissions Inventory over Central Europe, Atmosphere, 12, 1465, https://doi.org/10.3390/atmos12111465, 2021.
Takenoue, Y., Kaneko, T., miyamae, T., Mori, M., and Yokota, S.: Influence of outdoor NO 2 exposure on asthma in childhood: Meta-analysis: Influence of NO 2 exposure in childhood, Pediatr. Int., 54, 762–769, https://doi.org/10.1111/j.1442-200X.2012.03674.x, 2012.
Tarasick, D. W., Davies, J., Smit, H. G. J., and Oltmans, S. J.: A re-evaluated Canadian ozonesonde record: measurements of the vertical distribution of ozone over Canada from 1966 to 2013, Atmos. Meas. Tech., 9, 195–214, https://doi.org/10.5194/amt-9-195-2016, 2016.
The International GEOS-Chem User Community: geoschem/geos-chem: GEOS-Chem 12.9.3 (12.9.3), Zenodo [code], https://doi.org/10.5281/zenodo.3974569, 2020.
TOAR-II HEGIFTOM Focus Working Group: Ozonesondes, https://hegiftom.meteo.be/datasets/ozonesondes, last access: 24 September 2022.
Tørseth, K., Aas, W., Breivik, K., Fjæraa, A. M., Fiebig, M., Hjellbrekke, A. G., Lund Myhre, C., Solberg, S., and Yttri, K. E.: Introduction to the European Monitoring and Evaluation Programme (EMEP) and observed atmospheric composition change during 1972–2009, Atmos. Chem. Phys., 12, 5447–5481, https://doi.org/10.5194/acp-12-5447-2012, 2012.
Travis, K. R., Jacob, D. J., Fisher, J. A., Kim, P. S., Marais, E. A., Zhu, L., Yu, K., Miller, C. C., Yantosca, R. M., Sulprizio, M. P., Thompson, A. M., Wennberg, P. O., Crounse, J. D., St. Clair, J. M., Cohen, R. C., Laughner, J. L., Dibb, J. E., Hall, S. R., Ullmann, K., Wolfe, G. M., Pollack, I. B., Peischl, J., Neuman, J. A., and Zhou, X.: Why do models overestimate surface ozone in the Southeast United States?, Atmos. Chem. Phys., 16, 13561–13577, https://doi.org/10.5194/acp-16-13561-2016, 2016.
Turner, M. C., Krewski, D., Pope, C. A., Chen, Y., Gapstur, S. M., and Thun, M. J.: Long-term Ambient Fine Particulate Matter Air Pollution and Lung Cancer in a Large Cohort of Never-Smokers, Am. J. Resp. Crit. Care, 184, 1374–1381, https://doi.org/10.1164/rccm.201106-1011OC, 2011.
Van Malderen, R., Allaart, M. A. F., De Backer, H., Smit, H. G. J., and De Muer, D.: On instrumental errors and related correction strategies of ozonesondes: possible effect on calculated ozone trends for the nearby sites Uccle and De Bilt, Atmos. Meas. Tech., 9, 3793–3816, https://doi.org/10.5194/amt-9-3793-2016, 2016.
Vinken, G. C. M., Boersma, K. F., van Donkelaar, A., and Zhang, L.: Constraints on ship NOx emissions in Europe using GEOS-Chem and OMI satellite NO2 observations, Atmos. Chem. Phys., 14, 1353–1369, https://doi.org/10.5194/acp-14-1353-2014, 2014.
Wang, X., Jacob, D. J., Eastham, S. D., Sulprizio, M. P., Zhu, L., Chen, Q., Alexander, B., Sherwen, T., Evans, M. J., Lee, B. H., Haskins, J. D., Lopez-Hilfiker, F. D., Thornton, J. A., Huey, G. L., and Liao, H.: The role of chlorine in global tropospheric chemistry, Atmos. Chem. Phys., 19, 3981–4003, https://doi.org/10.5194/acp-19-3981-2019, 2019.
Wang, X., Jacob, D. J., Downs, W., Zhai, S., Zhu, L., Shah, V., Holmes, C. D., Sherwen, T., Alexander, B., Evans, M. J., Eastham, S. D., Neuman, J. A., Veres, P. R., Koenig, T. K., Volkamer, R., Huey, L. G., Bannan, T. J., Percival, C. J., Lee, B. H., and Thornton, J. A.: Global tropospheric halogen (Cl, Br, I) chemistry and its impact on oxidants, Atmos. Chem. Phys., 21, 13973–13996, https://doi.org/10.5194/acp-21-13973-2021, 2021.
Witte, J. C., Thompson, A. M., Smit, H. G. J., Vömel, H., Posny, F., and Stübi, R.: First Reprocessing of Southern Hemisphere ADditional OZonesondes Profile Records: 3. Uncertainty in Ozone Profile and Total Column, J. Geophys. Res.-Atmos., 123, 3243–3268, https://doi.org/10.1002/2017JD027791, 2018.
World Ozone and Ultraviolet Radiation Data Centre: Environment and Climate Change Canada [data set], https://doi.org/10.14287/10000001, last access: 1 March 2022.
Zhang, L., Jacob, D. J., Knipping, E. M., Kumar, N., Munger, J. W., Carouge, C. C., van Donkelaar, A., Wang, Y. X., and Chen, D.: Nitrogen deposition to the United States: distribution, sources, and processes, Atmos. Chem. Phys., 12, 4539–4554, https://doi.org/10.5194/acp-12-4539-2012, 2012.