the Creative Commons Attribution 4.0 License.
the Creative Commons Attribution 4.0 License.
 | 17 Apr 2024
Lifecycle of updrafts and mass flux in isolated deep convection over the Amazon rainforest: insights from cell tracking
Scott E. Giangrande
Thiago S. Biscaro
Michael P. Jensen
Long-term observations of deep convective cloud (DCC) vertical velocity and mass flux were collected during the Observations and Modelling of the Green Ocean Amazon (GoAmazon2014/5) experiment. Precipitation echoes from a surveillance weather radar near Manaus, Brazil, are tracked to identify and evaluate the isolated DCC lifecycle evolution during the dry and wet seasons. A radar wind profiler (RWP) provides precipitation and air motion profiles to estimate the vertical velocity, mass flux, and mass transport rates within overpassing DCC cores as a function of the tracked cell lifecycle stage. The average radar reflectivity factor (Z), DCC area (A), and surface rainfall rate (R) increased with DCC lifetime as convective cells were developing, reached a peak as the cells matured, and decreased thereafter as cells dissipated.
As the convective cells mature, cumulative DCC properties exhibit stronger updraft behaviors with higher upward mass flux and transport rates above the melting layer (compared with initial and later lifecycle stages). In comparison, developing DCCs have the lowest Z associated with weak updrafts, as well as negative mass flux and transport rates above the melting layer. Over the DCC lifetime, the height of the maximum downward mass flux decreased, whereas the height of the maximum net mass flux increased. During the dry season, the tracked DCCs had higher Z, propagation speed, and DCC area, and were more isolated spatially compared with the wet season. Dry season DCCs exhibit higher Z, mass flux, and mass transport rate while developing, whereas wet season DCCs exhibit higher Z, mass flux, and mass transport rates at later stages.
- Article
(16439 KB) - Full-text XML
-
Supplement
(933 KB) - BibTeX
- EndNote


Despite recent improvements in parameterization schemes and model resolutions (Marinescu et al., 2021; Prein et al., 2021; Wang et al., 2022), earth system models do not represent aerosols, convection, or convective updrafts accurately at their native resolutions (Tao and Moncrieff, 2009; Caldwell et al., 2021). These inaccuracies form the largest source of uncertainty in climate sensitivity estimates (Meehl et al., 2020; Chen et al., 2021). Model biases and the difficulty in evaluating model parameterizations arise from the disparity between model resolutions and process scales (Del Genio et al., 2012; Prein et al., 2021; Ramos-Valle et al., 2023). Process-level model evaluation is typically limited by the lack of long-term observations of convective cloud formation and organization (Bony et al., 2015). Observational datasets in regions like the Amazon rainforest can be of particular importance as they represent convective systems tied to global climate. The Amazon hosts 40 % of the global rainforest area and its hydrometeorology is related to the El Niño Southern–Oscillation and the Walker circulation (Marengo and Espinoza, 2015; Marengo et al., 2018; Barichivich et al., 2018; Machado et al., 2018). The diurnal cycle of the local convection is linked to surface topography and the local river network with regional variability (dos Santos et al., 2014; Saraiva et al., 2016a; Wu et al., 2021). The region exhibits thermodynamic contrasts between the local dry and wet seasons (Horel et al., 1989; Giangrande et al., 2017, 2020). The Sixth Assessment Report from the Intergovernmental Panel on Climate Change indicates that the effects of climate change will further enhance the seasonality of local precipitation over the Amazon rainforest (Chen et al., 2021; Douville et al., 2021).
Deep convection is a crucial component of the Amazon climate as it generates most of the regional precipitation and drives atmospheric circulations that redistribute moisture and energy (Betts et al., 2009; Nobre et al., 2009). Human activities like deforestation and burning events routinely influence the microphysical processes governing droplet nucleation and precipitation formation, which affects local hydrology and atmospheric dynamics (Andreae et al., 2004; Cecchini et al., 2016; Leite-Filho et al., 2019). Better understanding of the relative influence of aerosols and atmospheric thermodynamics on deep convection intensity and kinematic properties like updraft strength and mass flux is needed (Rosenfeld et al., 2008; Fan et al., 2018; Grabowski and Morrison, 2020). To constrain these influences, model simulations of deep convective cloud (DCC) microphysical processes (e.g., Marinescu et al., 2021; Igel and van den Heever, 2021) must be complemented by long-term measurements of updraft strength and mass flux (Varble, 2018; Veals et al., 2022; Öktem et al., 2023). Weather and climate models continue to overestimate the precipitation extremes, convective drafts, and vertical mass fluxes associated with Amazonian DCCs (Wang et al., 2022; Ramos-Valle et al., 2023) despite the improvements in model grid spacing (Prein et al., 2021, 2022). This motivates the need for fine-scale observations of vertical velocity and mass flux to understand how these properties evolve over the DCC lifetime.
Observations of the air motions within convective clouds under varying meteorological regimes remain scarce due to the challenges associated with measuring updraft and downdraft size, strength, and mass flux in deeper cloud contexts. Historically, aircraft provided the most direct in situ measurements of air motions within DCCs (e.g., LeMone and Zipser, 1980), but airborne data have limited spatial coverage and cannot measure the entire cloud lifecycle of stronger convective clouds due to safety and other practical flight/campaign considerations. While satellite-based retrievals would be of benefit for global observations, few techniques are currently available to adequately estimate profiles or proxy properties of vertical motions within DCCs (e.g., Jeyaratnam et al., 2021). Ground-based observations of the air motions within convective clouds can complement satellite missions aiming to quantify the vertical mass transport in convective storms, for example, the NASA Investigation of Convective Updrafts (INCUS) mission (Stephens et al., 2020; van den Heever, 2022; Prasanth et al., 2023). Recently, profiling radars, such as ground-based radar wind profilers (RWPs) or those radar on high-altitude aircraft (Heymsfield et al., 2010), have provided viable measurements of vertical motion and mass flux retrievals in DCCs with limited attenuation in rain (Williams et al., 1995; May and Rajopadhyaya, 1999; Protat and Williams, 2011; Giangrande et al., 2013, 2016; Tridon et al., 2013). During the Observations and Modelling of the Green Ocean Amazon (GoAmazon2014/5) field campaign (Martin et al., 2016, 2017), a 1290 MHz RWP was located at a heavily instrumented ground site near Manacapuru, Brazil (MAO). Over a 2-year period, the RWP sampled DCCs of varying sizes and intensity (Wang et al., 2019, 2020) in regimes that resemble both oceanic and continental meteorological conditions (Giangrande et al., 2017, 2020; Machado et al., 2018; Wang et al., 2018). These RWP observations provide a long-term dataset of vertical velocity measurements suited for retrievals of vertical mass flux and transport rate in various meteorological regimes.
In this study, an open-source tracking algorithm (Heikenfeld et al., 2019) is applied to a surveillance S-band radar dataset to identify and track precipitating DCCs. These tracking outputs are co-located with RWP profiles of updraft and downdraft strength, as well as an associated estimate for mass flux and transport rate. The RWP measurements spanning the Amazon wet and dry seasons are classified into convective lifecycle stages to understand the temporal evolution of isolated DCCs. Storm lifecycle tracking is applied to Centro Gestor e Operacional do Sistema de Proteção da Amazônia (SIPAM) S-band (10 cm wavelength) scanning radar data (Saraiva et al., 2016a) for a radar located 70 km east of MAO at the Ponta Pelada airport (3.15° S, 59.99° W). This RWP and surveillance radar lifecycle perspective on coupled DCC dynamical and microphysical variability is examined in conjunction with surface measurements that provide surface rainfall rates and thermodynamics at different stages of the convection lifecycle. This forms a unique framework to add new perspectives on the evolution of DCC dynamics over the DCC lifecycle.
2.1 Instrumentation and data
The MAO site was located at 3.21° S, 60.59° W near Manacapuru, Brazil (Martin et al., 2017) with an Atmospheric Radiation Measurement (ARM; Mather and Voyles, 2013) Climate Research Mobile Facility (AMF; Miller et al., 2016) operated by the US Department of Energy. An ARM RWP at MAO provided time–height profiles of vertical velocity (w) based on measurements of the radar reflectivity factor (Z) and the Doppler velocity at 6 s temporal, 120 m vertical, and approximately 1 km horizontal resolution, respectively (Feng and Giangrande, 2018; Giangrande, 2018). Details regarding the RWP retrievals are described by Wang et al. (2019, 2020). The AMF at MAO also deployed instruments to measure meteorological state variables. The 2 m temperature and relative humidity, as well as the 1 m pressure, were measured every minute by the ARM Surface Meteorology System (Ritsche, 2011). Surface equivalent potential temperature (θe) was calculated following Bolton (1980) using MetPy (May et al., 2022). Surface rainfall rates (R) and additional radar Z calibration references were estimated based on drop size distributions obtained from the ARM laser disdrometer value added product (Hardin, 2014; Hardin et al., 2019).
The SIPAM radar has a beamwidth of 1.8° and performs two volumetric radar scans every 12 min. The first scan covers a domain of 240 km from the radar location with a gate resolution of 500 m, azimuth resolution of 1°, and 17 elevation angles (0.9–19.5°). The second scan covers 400 km with three elevation angles (0.9–3.7°). Given these radar configuration parameters, Saraiva et al. (2016a) limited the 3D representation of the radar data only up to 150 km from the radar location and computed constant altitude plan position indicators (CAPPIs) for the 150 km domain. In comparison, this study uses a stricter threshold of 100 km from the radar location. The clutter-corrected SIPAM Z was gridded onto a 1×1 km grid for 2 km CAPPIs. The GOES-13 satellite (Hillger and Donald, 2007) was deployed as part of the National Oceanic and Atmospheric Administration's Geostationary Operational Environmental Satellite system. The radiance from GOES-13 channel 4 (10.7 µm) was collected at 30 min temporal and 4 km horizontal resolution (Hillger and Donald, 2007).
2.2 Tracking algorithm
Previous studies have used brightness temperature (Tb) from geostationary satellites to track the evolution of deep convection (e.g., Machado et al., 1998; Futyan and Del Genio, 2007; Fiolleau and Roca, 2013; Mattos and Machado, 2011; Jones et al., 2023). Geostationary satellites relate cloud-top properties of convective clouds to their evolution. For instance, satellite data from the infrared channel can be used to infer vertical cloud development based on a decrease in brightness temperatures and the cloud expansion rate based on the divergence at upper levels. In comparison, radars can infer the content and characteristics of hydrometeors and retrieve information about shallow precipitating clouds. Radar-based studies can also associate the development and decay of the precipitating core with the rate of mass flow and precipitation within the core. Previous studies have used radar data to track the evolution of convective systems for decades, not only for operational nowcasting purposes (Wilson et al., 1998; Keenan et al., 2003; Wilhelm et al., 2023) but also for studying convective cloud processes (Rosenfeld, 1987; Wapler, 2017; Feng et al., 2023; Giangrande et al., 2023).
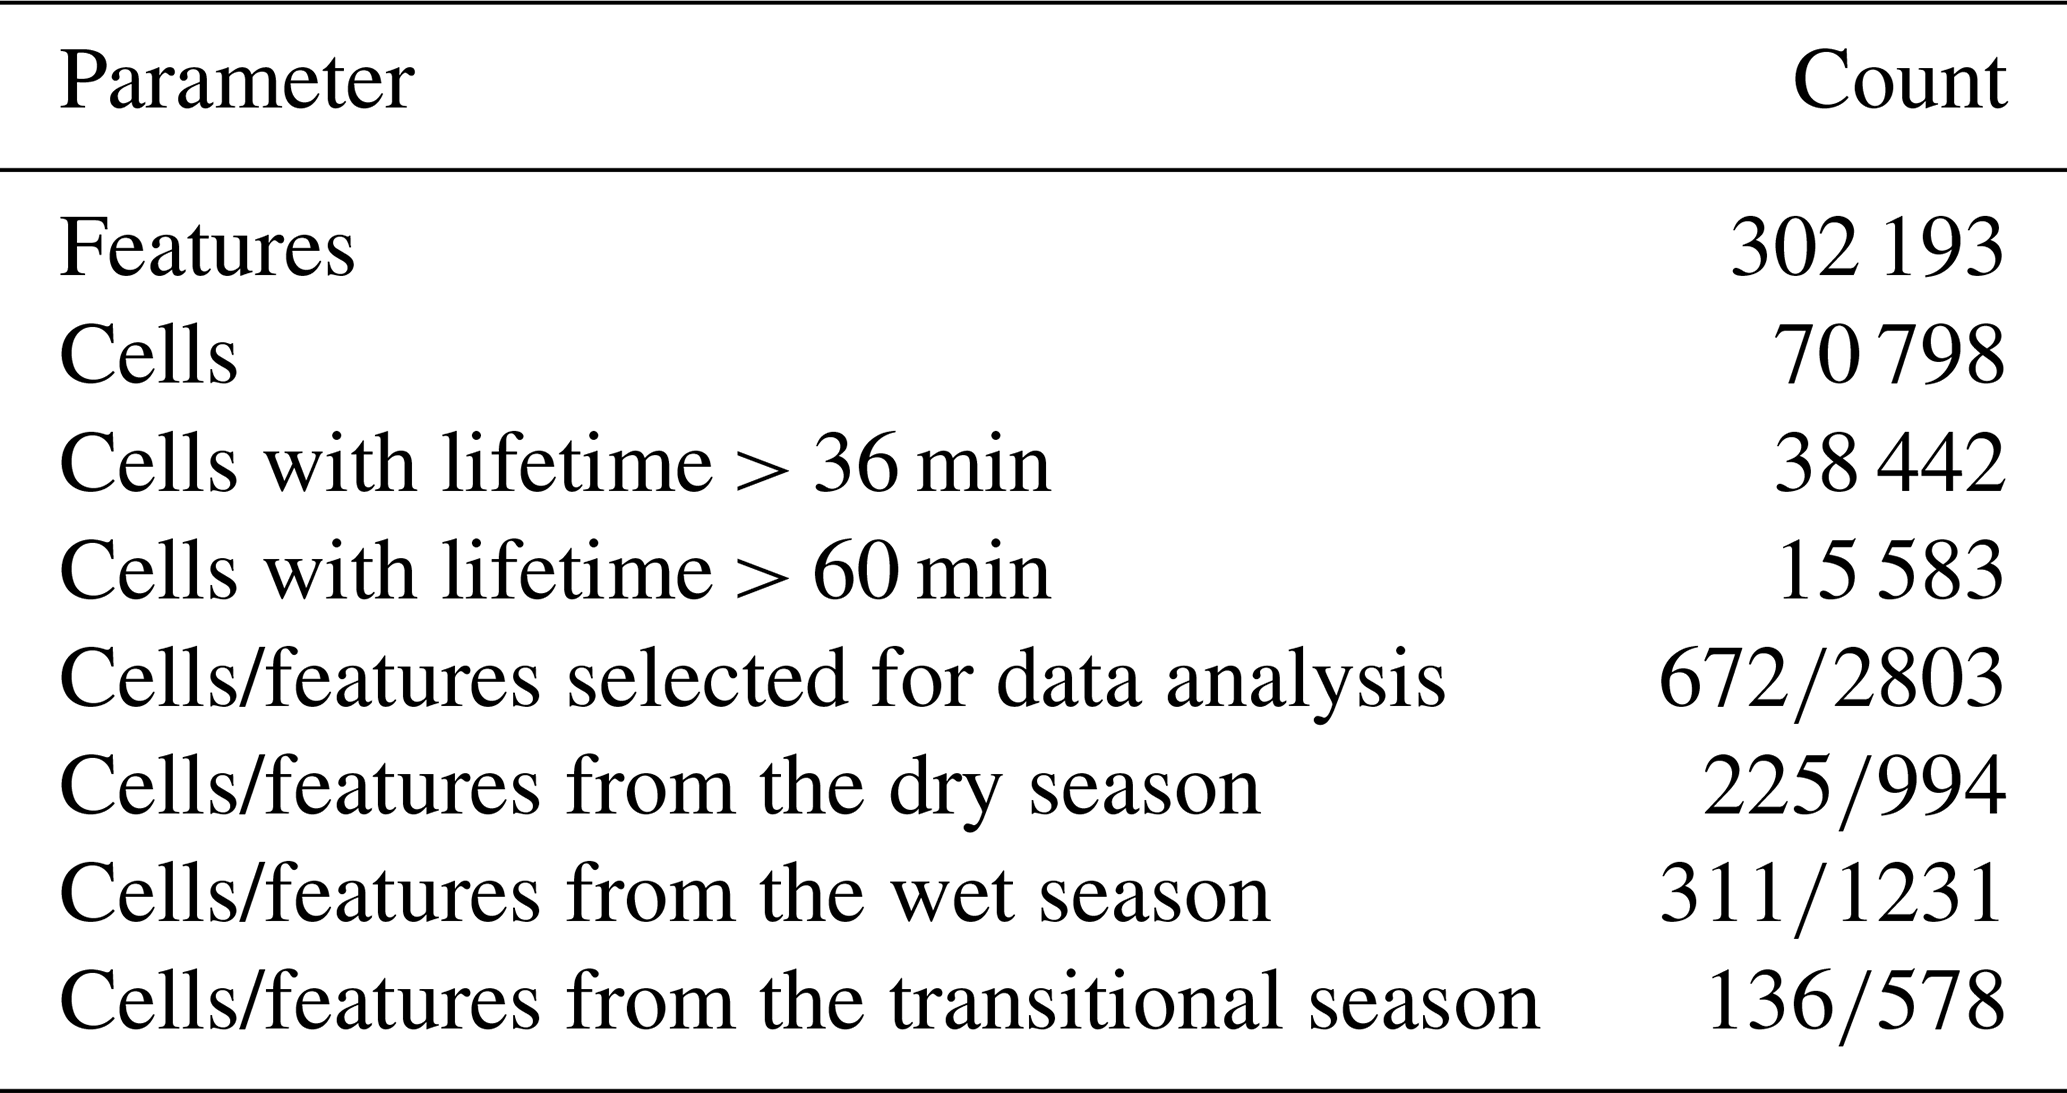
The SIPAM radar data were preferred for cell tracking in this study over data from GOES-13, the satellite that sampled the study region during GoAmazon2014/5. This is because the radar resolution (12 min and 1 km) was finer than the GOES-13 infrared channel resolution (30 min and 4 km). The radar DCC tracking was conducted using an open-source Python-based tracking algorithm called tobac (Tracking and Object-Based Analysis of Clouds; Heikenfeld et al., 2019). The tobac algorithm identifies objects based on user-defined thresholds to determine their shape and size, as well as tracks their motion and temporal evolution. Given that less than 50 % of the cells sampled for more than 36 min were also sampled for more than 60 min (Table 1), the use of SIPAM radar data helped increase the study's sample size. Observations with better spatial resolution also improve the characterization of cloud processes as the profiles of vertical velocity and convective mass flux can vary within 5–10 min (Figs. S1 and S2 in the Supplement).
Table 1Number of features and cells identified by tobac over the entire radar domain.
The 2 km CAPPI data were used as input for tobac for tracking precipitating DCCs with SIPAM Z>30 dBZ. A minimum threshold of 30 dBZ and the altitude of 2 km for the CAPPI data were chosen following the visual inspection of the radar data which revealed ground clutter and artifacts at lower altitudes and with reflectivity values up to 20 dBZ. The selection of 30 dBZ as the minimum threshold also ensures the minimization of splits or mergers in our dataset (Leal et al., 2022). It is important to note that the cell tracking outputs heavily depend on the temporal resolution of the input data. Unfortunately, the SIPAM radar, being part of the Amazonian operational weather radar network, uses a fixed temporal resolution of 12 min that could not be changed (Saraiva et al., 2016a). Ideally, a smaller repetition time would result in a more accurate description of the convective processes. Nevertheless, this 12 min temporal resolution is better than the satellite alternative (30 min).
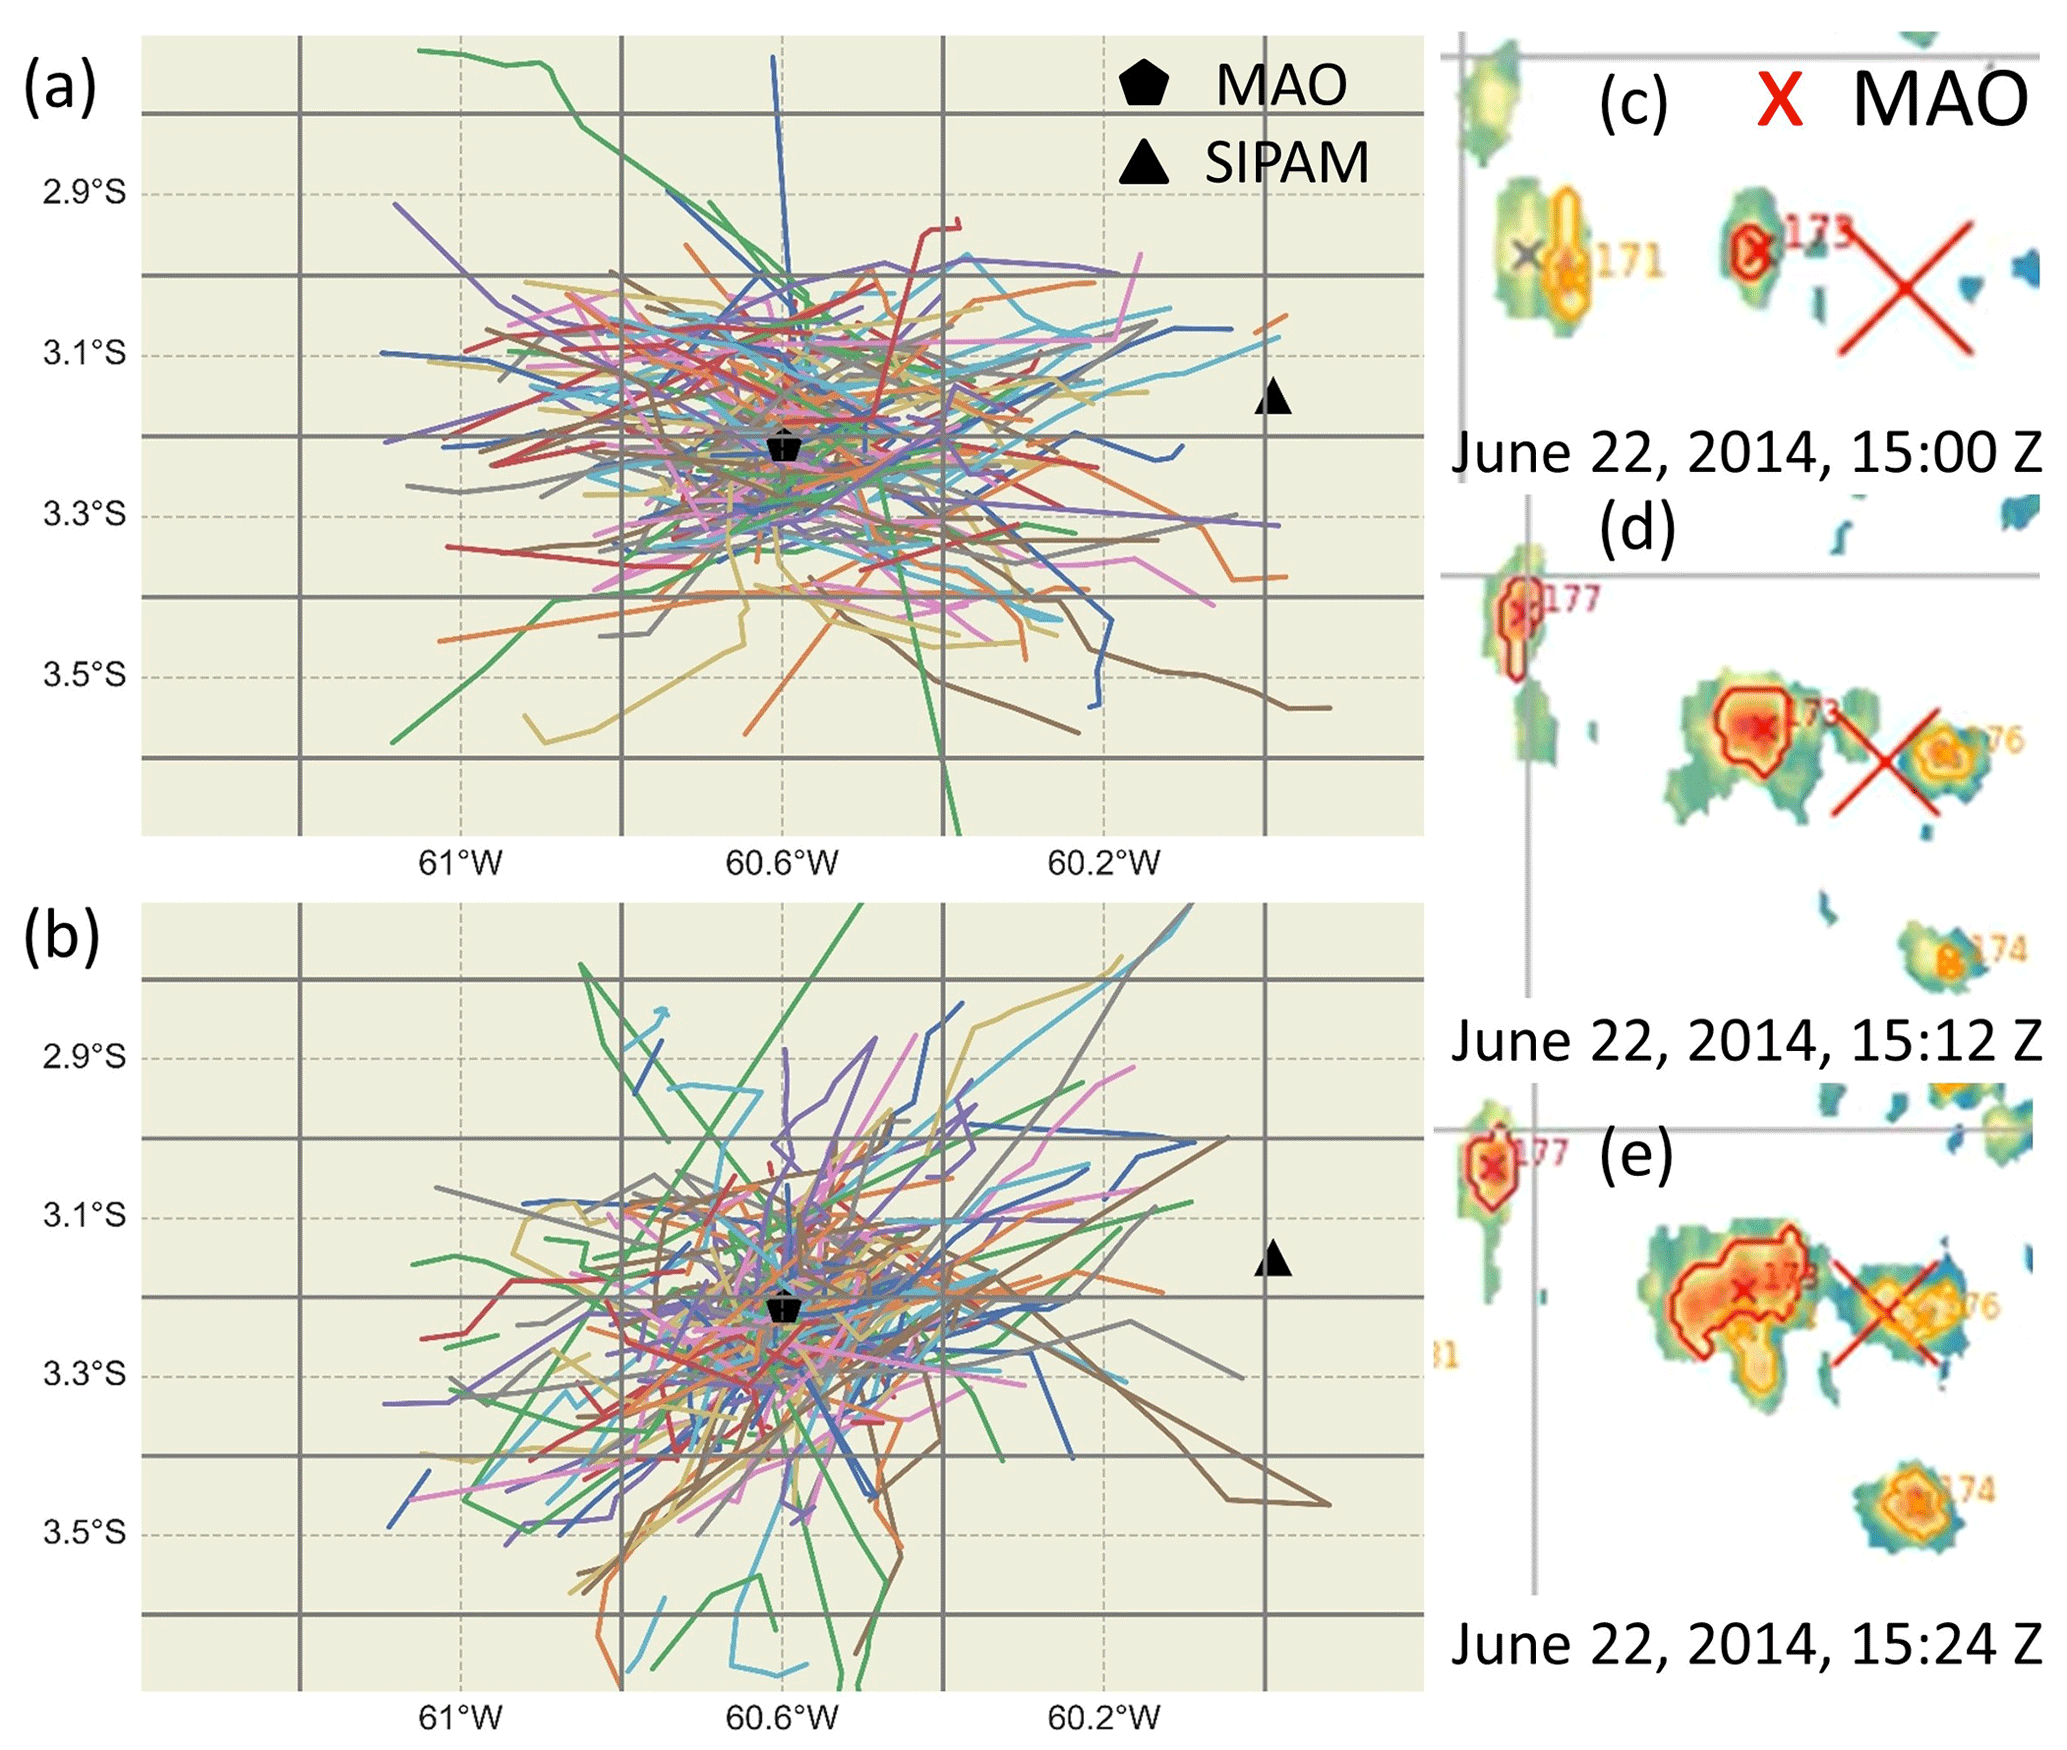
Figure 1Cell tracks for isolated DCCs tracked during the (a) dry season (June to September) and (b) wet season (December to April). Panels (c)–(e) show the gridded reflectivity field near MAO on 22 June 2014 from 15:00 to 15:24 UTC with tobac-identified features surrounded by polygons representing their areal extent.
As defined by tobac, an object identified at one time step is referred to as a “feature”, and a collection of features linked along a trajectory is what defines a “cell”. The tobac algorithm allows users to select multiple thresholds for feature identification. For this study, thresholds of 30, 40, 50, and 60 dBZ were chosen. In an iterative process, contiguous regions satisfying a threshold were identified as features, and existing features (satisfying a lower threshold) were replaced (Heikenfeld et al., 2019). By using multiple thresholds, tobac can preserve the variability in Z within the domain and convective systems, as a single threshold (e.g., 60 dBZ) may not be sufficient to identify convection in developing stages, or may lump together distinct drafts within a multicellular system (e.g., 30 dBZ). The minimum threshold of 30 dBZ is used to minimize the inclusion of congestus clouds observed by the RWP during GoAmazon2014/5 (Giangrande et al., 2017; Wang et al., 2018), or areas of stratiform precipitation surrounding the convective core (Houze, 2004; Giangrande et al., 2023; Leal et al., 2022). The minimum identification threshold of 30 dBZ was found to minimize the proportion of tracked systems with mergers or splits in the Amazon to under 20 % (Leal et al., 2022).
The position of the feature is determined by calculating the center of mass, with each point weighted by the difference between local reflectivity and the identification threshold. Figure 1c–e show an example of the gridded reflectivity field near MAO and reflectivity features identified by tobac between 15:00 and 15:24 UTC on 22 June 2014. Markers represent the position of each feature with SIPAM Z>30 dBZ and polygons surrounding these features represent their areal extent based on the segmentation process. The displacement of feature positions is used to calculate the propagation speed and direction, excluding the last time step as further displacement cannot be determined. The feature area is determined by a segmentation process that uses the water shedding tool from the scikit-image library (van der Walt et al., 2014). The input grid is treated like a topographic map and an area starting from the feature position is filled until a segmentation threshold of 30 dBZ is reached.
Feature tracking is performed by linking features to a connected trajectory using the trackpy library (Allan et al., 2023). In each time step, the feature's position in the previous radar scan is located and the feature is searched in the current scan within a range defined by the product of the temporal resolution (12 min) and maximum propagation speed (20 m s−1). The search range is centered at a position predicted by trackpy based on the past trajectory of the feature. For new features, the trajectory of the closest existing feature is used. Each cell is kept in memory for one radar scan in case the cell disappears and reappears over consecutive scans. For this study, cell tracking was conducted using tobac 1.3.3 following improvements in linking features along a cell trajectory (Sokolowsky et al., 2023). The time step when a cell is first detected with SIPAM Z>30 dBZ is defined as the time of deep convection or precipitation initiation. However, it is important to note that the initial detection of SIPAM Z>30 dBZ by the radar may not reflect the exact timing of precipitation initiation. For each cell, the nearest neighbor distance was determined by locating the closest feature and measuring its distance from the cell's position. With one value at every time step, each cell has a range of nearest neighbor distance values over its lifetime.
2.3 Selection of tracked DCCs
This study evaluates convection characteristics including the w and mass flux at different lifecycle stages of isolated DCCs. The DCC lifetime information from tobac is matched with RWP measurements. Days when isolated DCCs were observed over MAO were selected for detailed examination. Following Giangrande et al. (2023), data from 102 d within the SIPAM radar and RWP datasets when isolated DCCs were observed near MAO were examined. Their methodology required the SIPAM radar to sample a DCC for over 48 min in the radar domain without an obvious split or merger and without systems larger than 1000 km2 which could represent mesoscale convective systems (MCSs) or squall lines. Such days are defined as “ISO” days (Table S1 in the Supplement) and the subsequent analyses focus on isolated DCCs observed on ISO days within 20 km of MAO at least once over their lifetime. In Fig. 1a and b, we highlight the cell tracks for isolated DCCs from the wet (December to April) and dry (June to September) seasons. In Fig. 2, we show wind rose diagrams based on the propagation direction of these cells and heatmaps of the latitude and longitude of the detected cells. There were 498 GoAmazon2014/5 days with additional convection events (ACE) that were at least 20 km away from MAO or included larger mesoscale convective systems, neither of which represent the focus of this study. Such days are defined as “ACE” days.
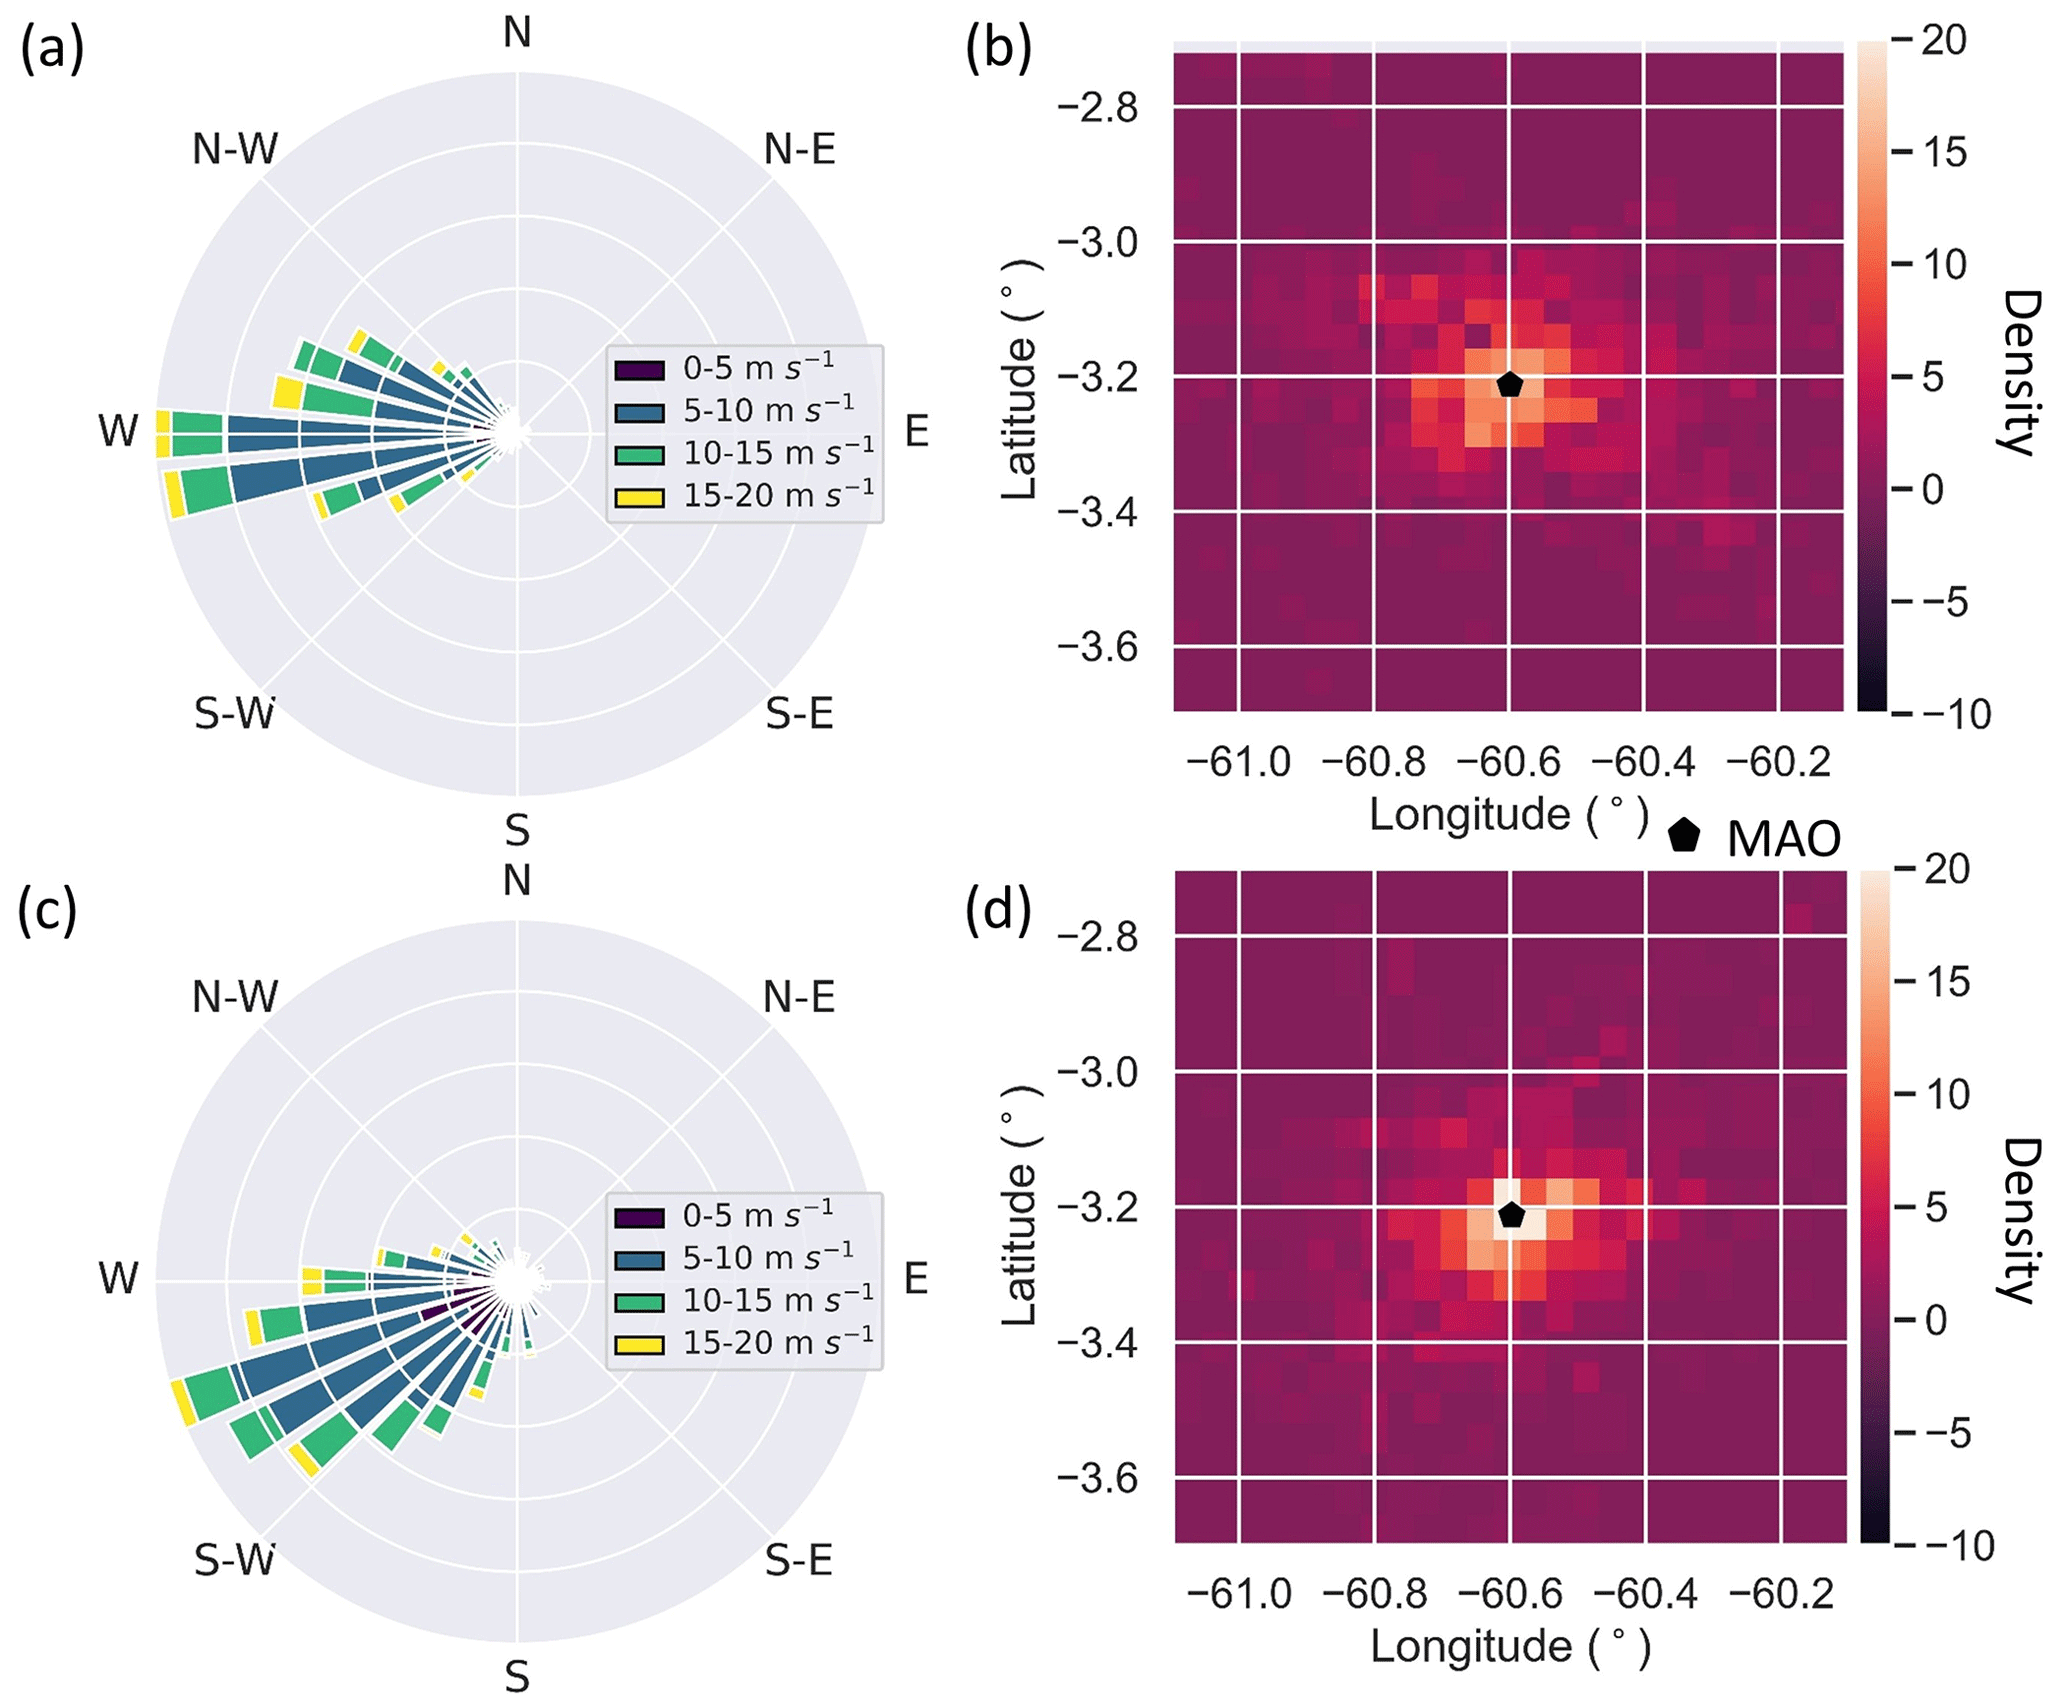
Figure 2Panels (a, c) show wind rose diagrams for propagation direction and (b, d) show heatmaps of cell tracks from the (a, b) dry season and (c, d) wet season corresponding to the cell tracks shown in Fig. 1a and b.
To identify any sampling biases associated with the selection of the ISO days, tracking statistics from ISO days are compared with ACE days. The median value of the average, maximum, and minimum nearest neighbor distance on ISO days was 10.5, 17.2, and 4.8 km, respectively. ISO days had little distinction from ACE days with minor differences between the distributions of DCC lifetime (Fig. 3a) and nearest neighbor distance (Fig. 3b). In addition, small variations were seen between cells near MAO (Fig. 3b and d) and cells across the entire radar domain (Fig. 3a and b). These results indicate that in terms of the spatial distribution and temporal longevity of convection, DCCs sampled near MAO on ISO days did not have a bias relative to DCCs tracked over the entire SIPAM radar domain or on ACE days.
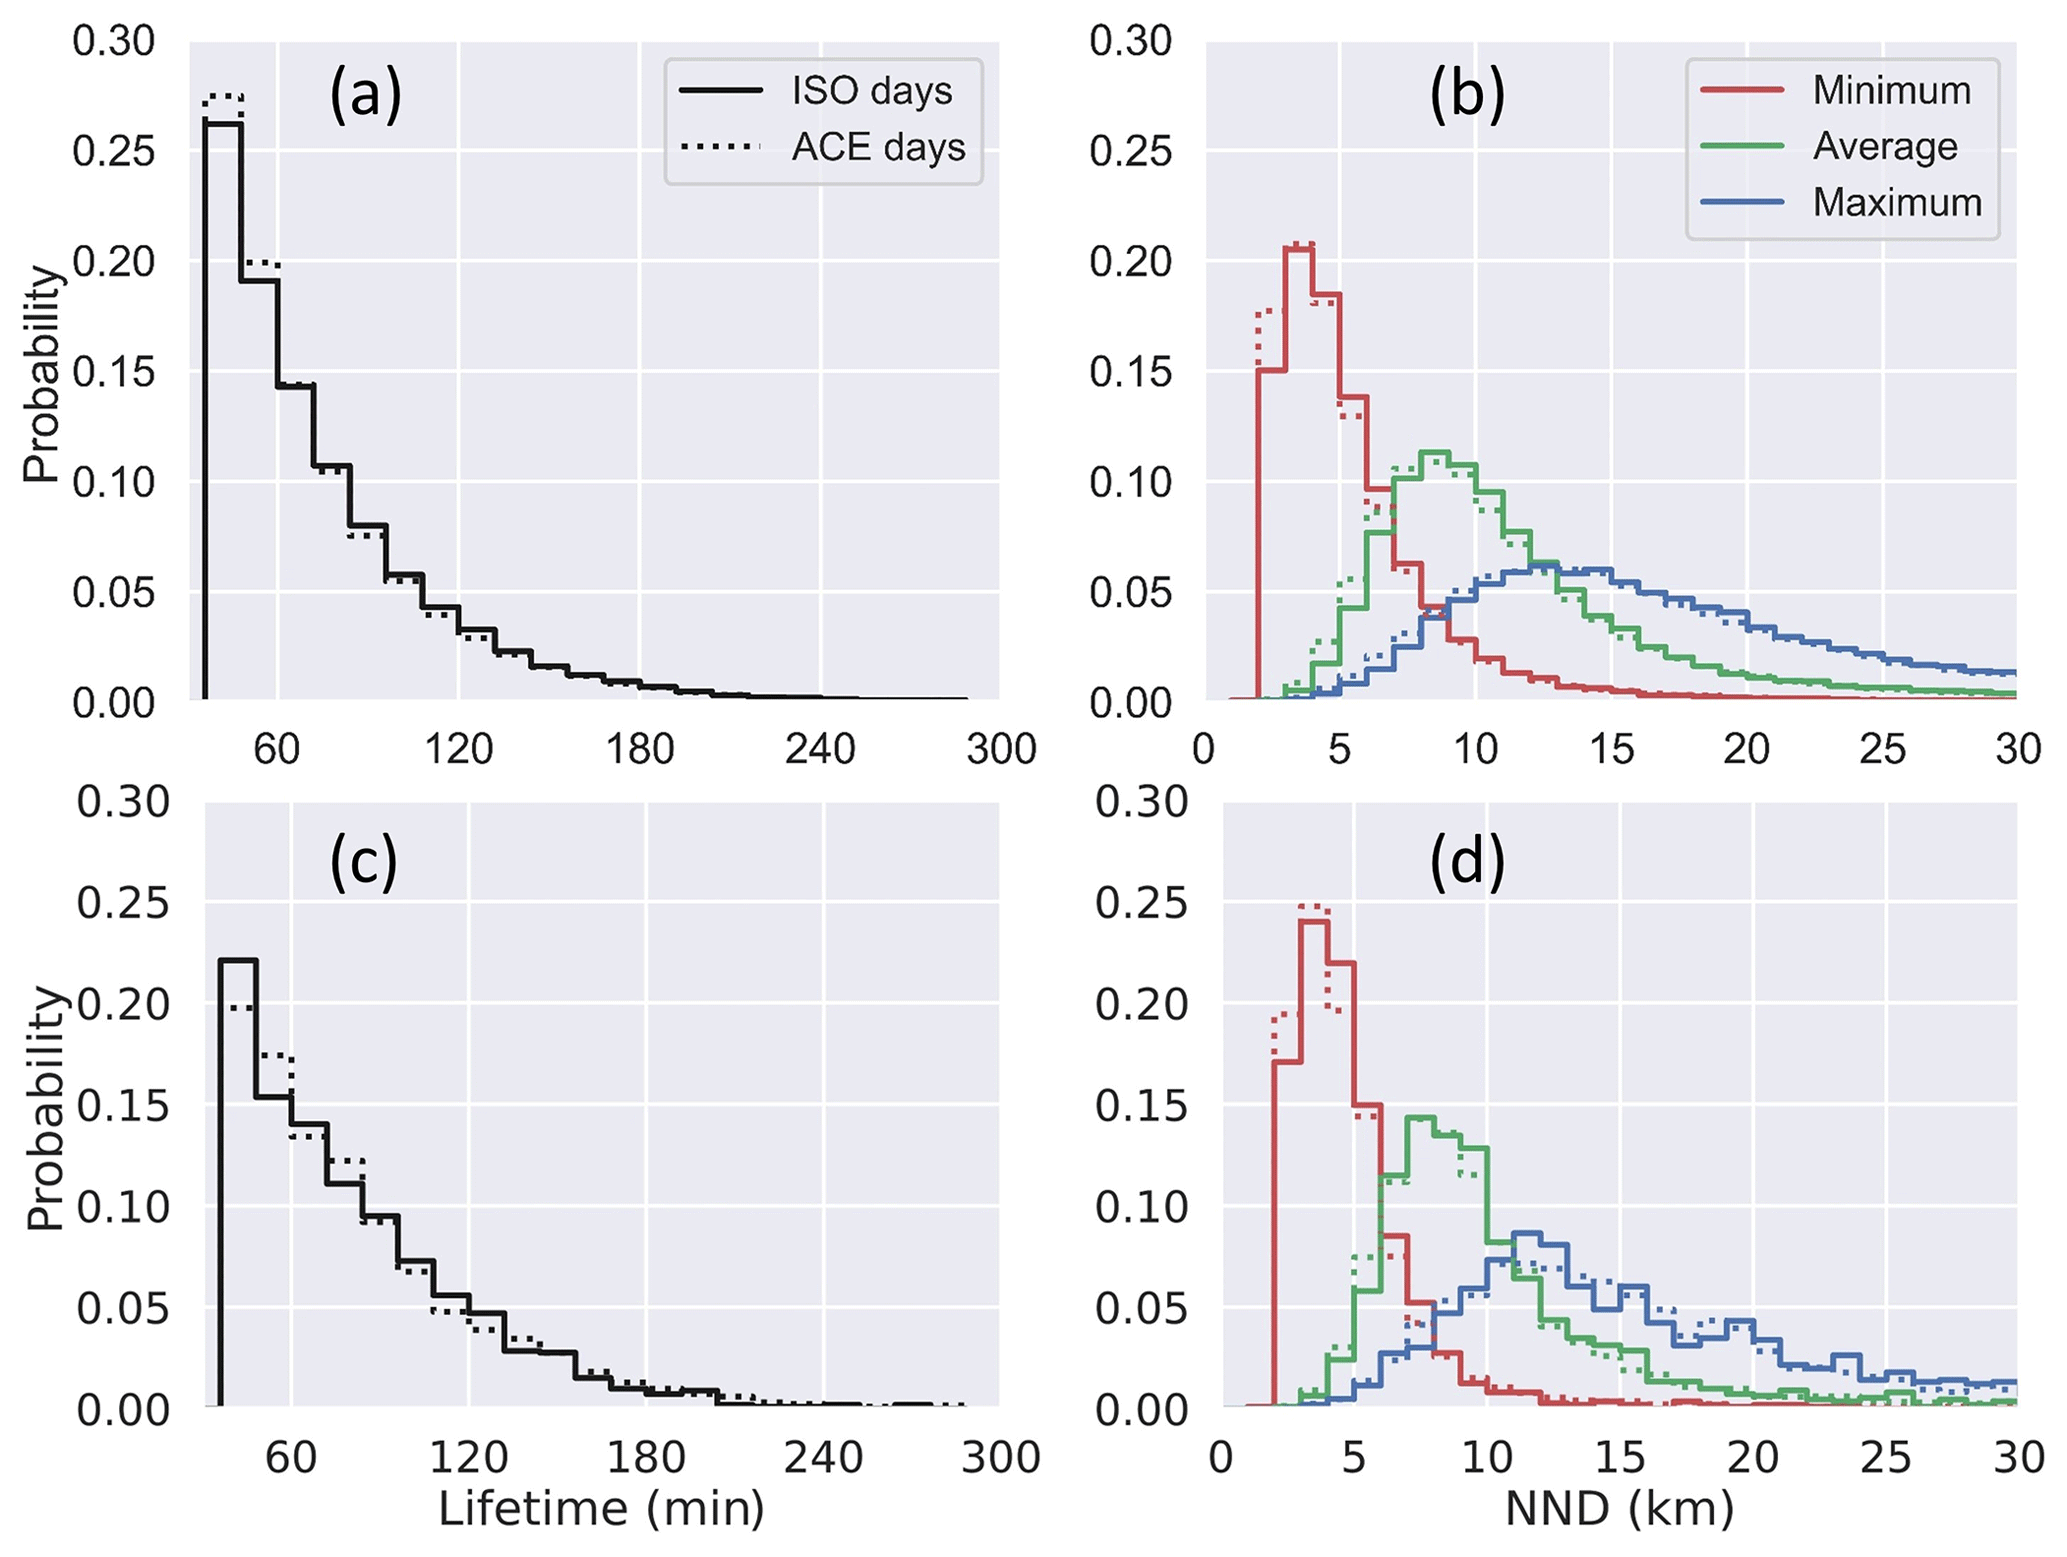
Figure 3Probability distributions of (a, c) DCC lifetime and (b, d) nearest neighbor distance (NND) for cells with lifetime > 36 min for (a, b) all cells within radar domain and (c, d) cells within 20 km of MAO with propagation speed > 0.5 m s−1.
On average, 694 cells were tracked per day on ISO days with an average of 4.3 features per cell. Over 50 % of the cells were observed for more than 36 min, while 20 % of the cells were observed for more than 60 min (Table 1). Cells with a lifetime less than 36 min corresponded to three or fewer radar scans or feature designations. These short-lived cells were removed from the analysis due to insufficient data to study temporal trends in convection properties. The average DCC lifetime was approximately 70 min, which implies six to seven radar volume scans having SIPAM Z>30 dBZ for the same cell. The radar-tracked DCCs were collocated with RWP data to classify the RWP observations into different stages of convection lifecycle. The cells selected for data analysis were allowed a maximum distance of 100 km from MAO to capture their evolution before or after they were sampled near MAO. As a final check, we removed any cells with propagation speed below 0.5 m s−1 to avoid the inclusion of ground clutter or radar artifacts.
Based on these criteria, 1130 cells were identified. The bulk statistics and trends in convection properties were examined for these cells. In certain instances, a radar scan had more than one feature satisfying every criterion. For such cases, the feature closest to MAO was selected to assign a lifecycle stage to the RWP data without ambiguity. This resulted in the selection of 2803 features (from 672 cells) with 1 feature representing each radar scan to assign a lifecycle stage to the RWP data from the radar scan time step. The RWP data were further screened, as described in Sect. 2.5, to avoid the inclusion of congestus clouds or incompletely sampled updraft cores above the MAO site. This screening meant that only 31 % of the DCCs and 12 % of the features initially selected were used for the analysis of RWP data in Sect. 3. Table 1 lists the number of cells and features selected for data analysis along with their seasonal distribution.
Interestingly, the area distributions of the tracked cells were skewed toward higher values by a small number of large cells with an area exceeding 500 km2 for at least one feature during their lifetime. When these outlier cell events were excluded, the skewness of the distributions decreased from 11.4 to 3.1 (not shown). Cells with an area exceeding 500 km2 may represent convective systems with multiple updrafts or cores (i.e., Houze et al., 2015; Giangrande et al., 2020). Previous studies have used the RWP measurements to evaluate the organized convective systems over the Amazon rainforest (e.g., Wang et al., 2018, 2019). To complement these efforts, this study focuses on cells with an area < 500 km2 while evaluating the profiles of kinematic properties across different convection lifecycle stages. This does not affect the sample size as cells with an area > 500 km2 constitute less than 5 % of the tracking dataset during the ISO days.
2.4 Lifecycle stages of DCCs
The trends in cell Z from the SIPAM radar for the tracked DCCs (Fig. 4a) are consistent with established conceptual models for the lifecycle stages of deep convection (e.g., Byers and Braham, 1949). For satellite-based tracking of convection, Futyan and Del Genio (2007) characterized the lifecycle stages of convection based on the strength and size of deep convection. Once convection initiates, it expands vertically, and the system is considered to be “developing”. This is followed by a period when the system reaches its maximum vertical extent and peak rainfall rates while expanding horizontally, and the system is considered to be “mature”. Finally, the system shows a decline in its horizontal and vertical extent, and is considered to be “dissipating”. These definitions, based on convection intensity or size, are useful when the complete DCC lifetime may not necessarily be detected (Futyan and Del Genio, 2007). Other studies have used these trends in convection properties to inform their definitions for the lifecycle stages of convection (e.g., Tadesse and Anagnostou, 2009; Mattos and Machado, 2011; Feng et al., 2012; Kumar et al., 2020). Following these studies, the bulk statistical trends in convection size and intensity are used in this study to define the lifecycle stages as outlined below.
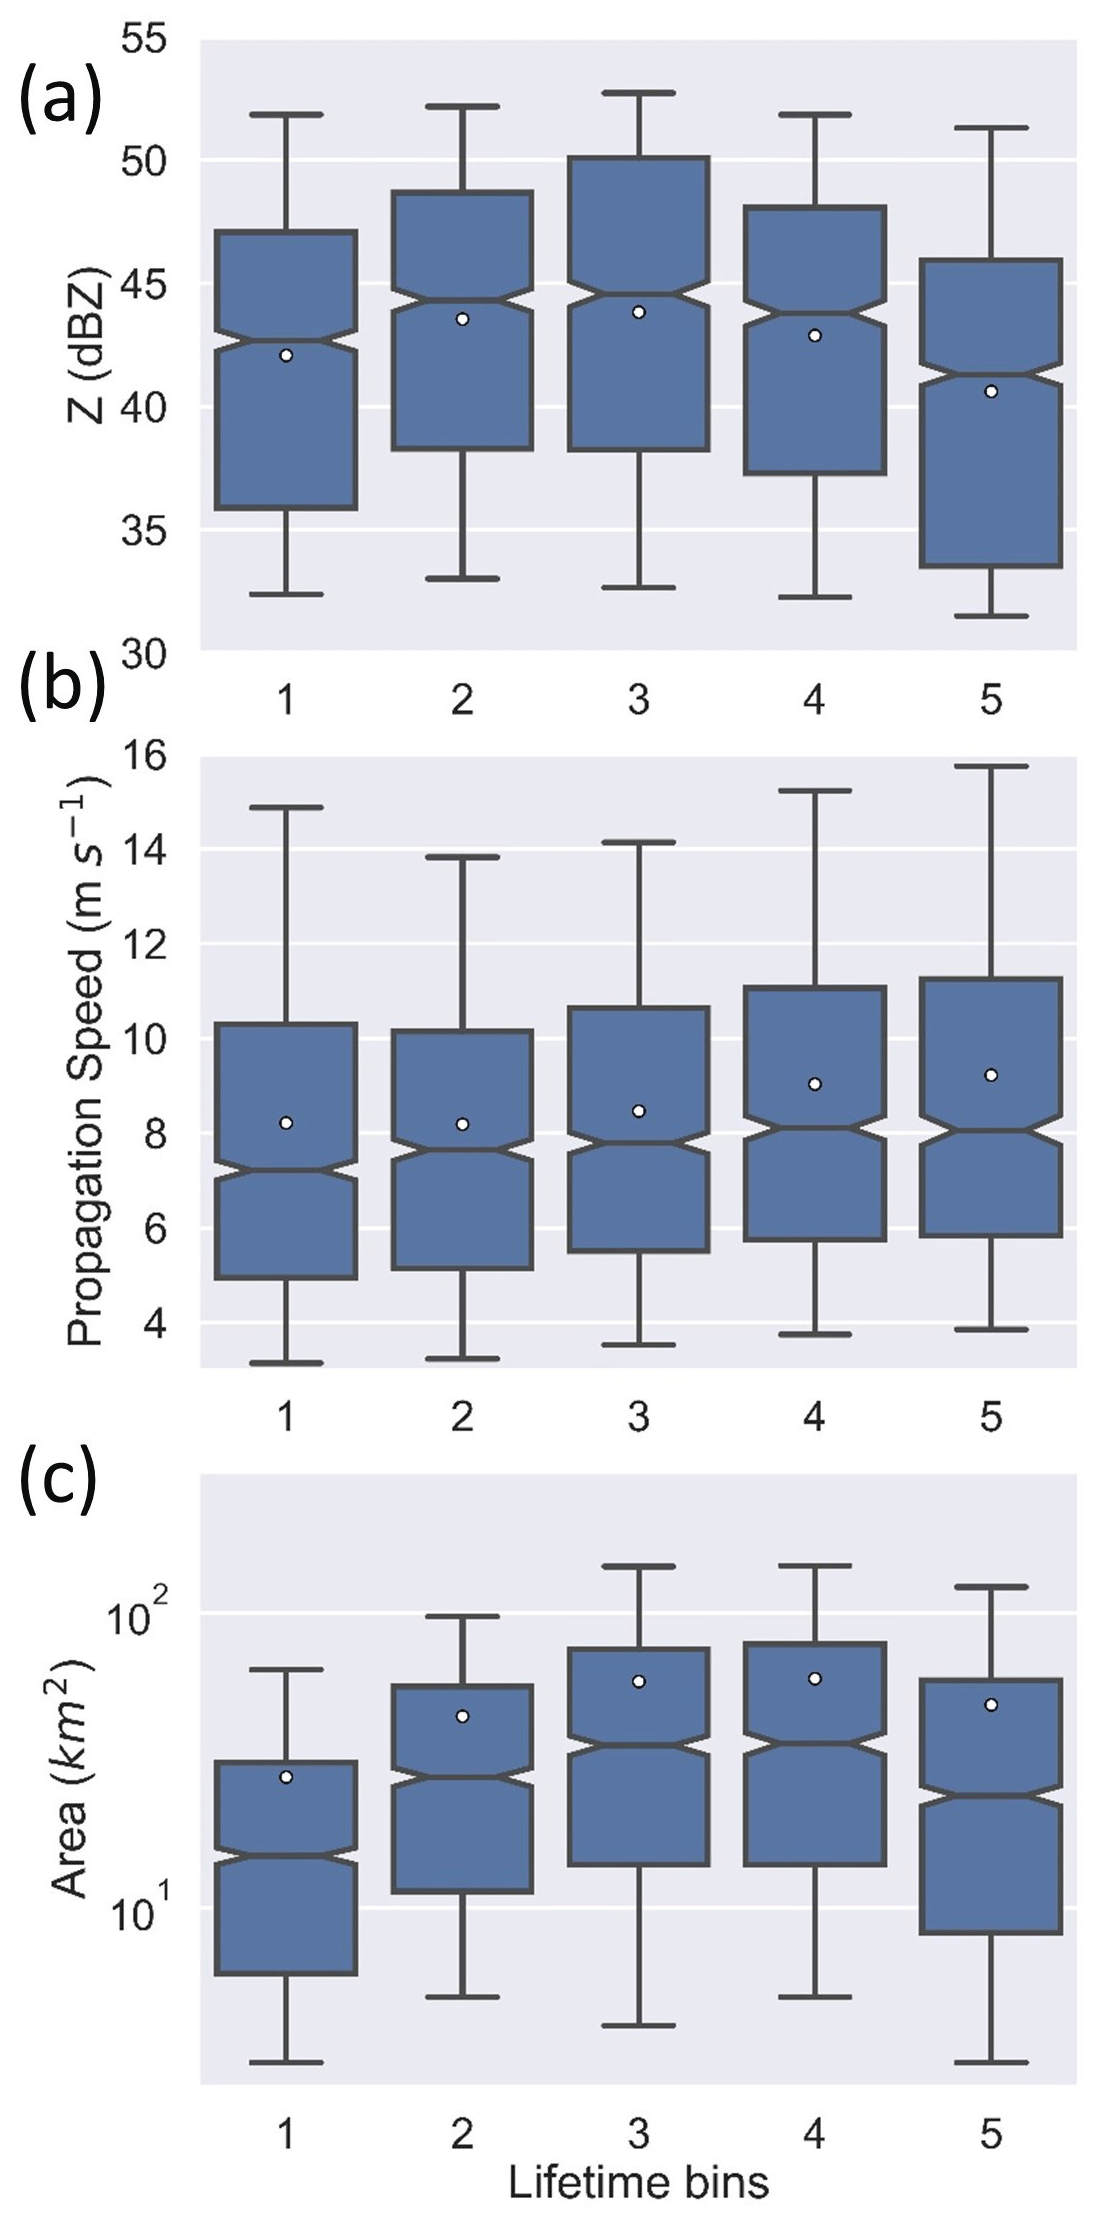
Figure 4Boxplots of (a) reflectivity (Z) at feature position, (b) propagation speed, and (c) area as a function of lifetime bins for cells within 20 km of MAO (lifetime > 30 min, propagation speed > 0.5 m s−1, and maximum area < 500 km2) on ISO days. Box lengths represent the interquartile range and whiskers extend to the 5th and 95th percentiles. White circles indicate average values and notches extend to the 95 % confidence intervals for the median value.
Since the observed cells carry a wide range of DCC lifetimes (Fig. 3), the lifetime values were first normalized by the total lifetime. The data for each tracked cell were then classified into one of five bins based on the normalized lifetime value. Based on this classification, the first bin refers to observations from the first 20 % of the cell's lifetime duration. Finally, we examine the bulk statistical trends in the estimates for the maximum SIPAM Z and area as a function of DCC lifetime to analyze the changes in DCC strength and size over time (Fig. 4). These statistical trends are used to associate each normalized lifetime bin with a lifecycle stage consistent with Futyan and Del Genio (2007). The third lifetime bin, when DCCs reach their peak SIPAM Z and A, is therefore defined as the mature stage (Fig. 4). Data for “mature DCCs” hereafter correspond to data from the third lifetime bin. Subsequently, the first, second, fourth, and fifth bins are defined as “developing”, “early mature”, “late mature”, and “dissipating” stages, respectively. The mature stage was the second most frequently observed stage after the dissipating stage (Table 2).
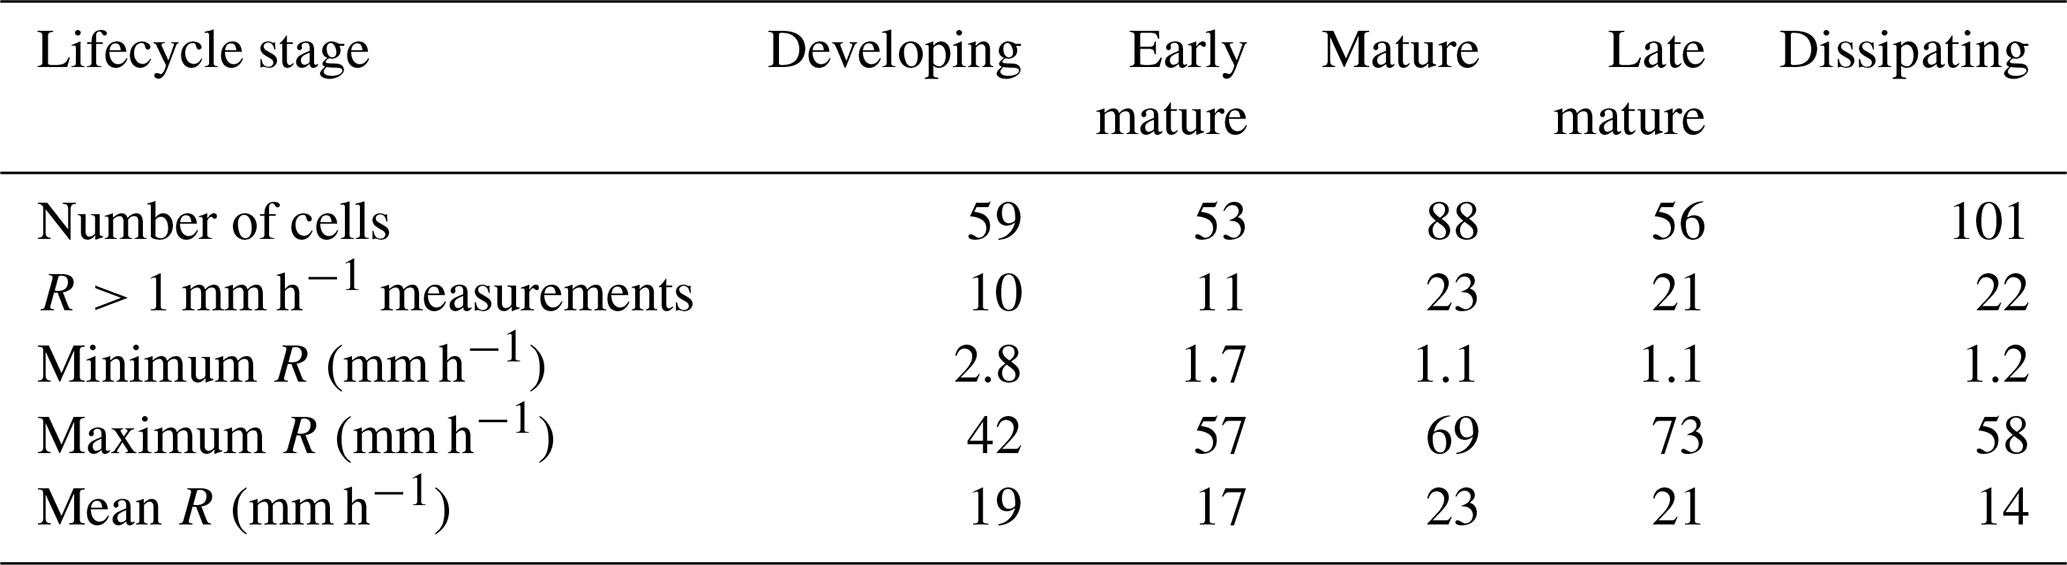
Table 2Lifecycle stages for radar-tracked DCCs at the time of passing over the RWP with rainfall rate (R) statistics.
The proportional contribution of cells with different cell lifetime values to the five lifecycle stages or bins is provided in Table S2. The lifecycle classification described above meant that cells with a lifetime of 36 min do not contribute data to the third lifetime bin. This is because there are five lifetime bins while these shorter-lived cells consist of four radar scans without a normalized lifetime value corresponding to the third lifetime bin. However, this does not affect our analysis or the bulk statistics of the convection properties. This is because the average lifetime of cells contributing data to each bin is within 10 min regardless of whether these shorter-lived cells are included. The similarity in the average cell lifetime across the bins was due to the similar proportional distribution of cells lasting for 36 min or more into the five lifetime bins (Table S2). Consequently, the average SIPAM Z for each lifetime bin changes by less than 0.2 dBZ depending on whether the shorter-lived cells were included. To preserve our sample size, we include these shorter-lived cells in the subsequent analyses. The choice of these lifecycle definitions and the data classification is justified by results presented in the following sections.
As a sensitivity test, the trend in SIPAM Z for individual DCCs was used to define the lifecycle stage for each DCC. Under this definition, the lifetime bin during which a DCC reached its maximum SIPAM Z would be defined as the mature stage rather than using the bulk statistics from Fig. 4. Figure 5a shows the distribution of the normalized lifetime when DCCs were sampled by the RWP and when the DCCs had maximum SIPAM Z during their lifetime. The lifetime bins of maximum Z were distributed across the entire range of normalized lifetime, which suggests that this definition could misattribute some of the developing or dissipating DCCs as mature DCCs. This is because the SIPAM Z at 2 km can evolve non-linearly and have peaks that may not correlate with convection intensity throughout the column. Giangrande et al. (2023) showed similar findings that DCCs could have multiple peaks with Z>35 dBZ during their evolution. As a result, the third lifetime bin was defined as the mature stage.
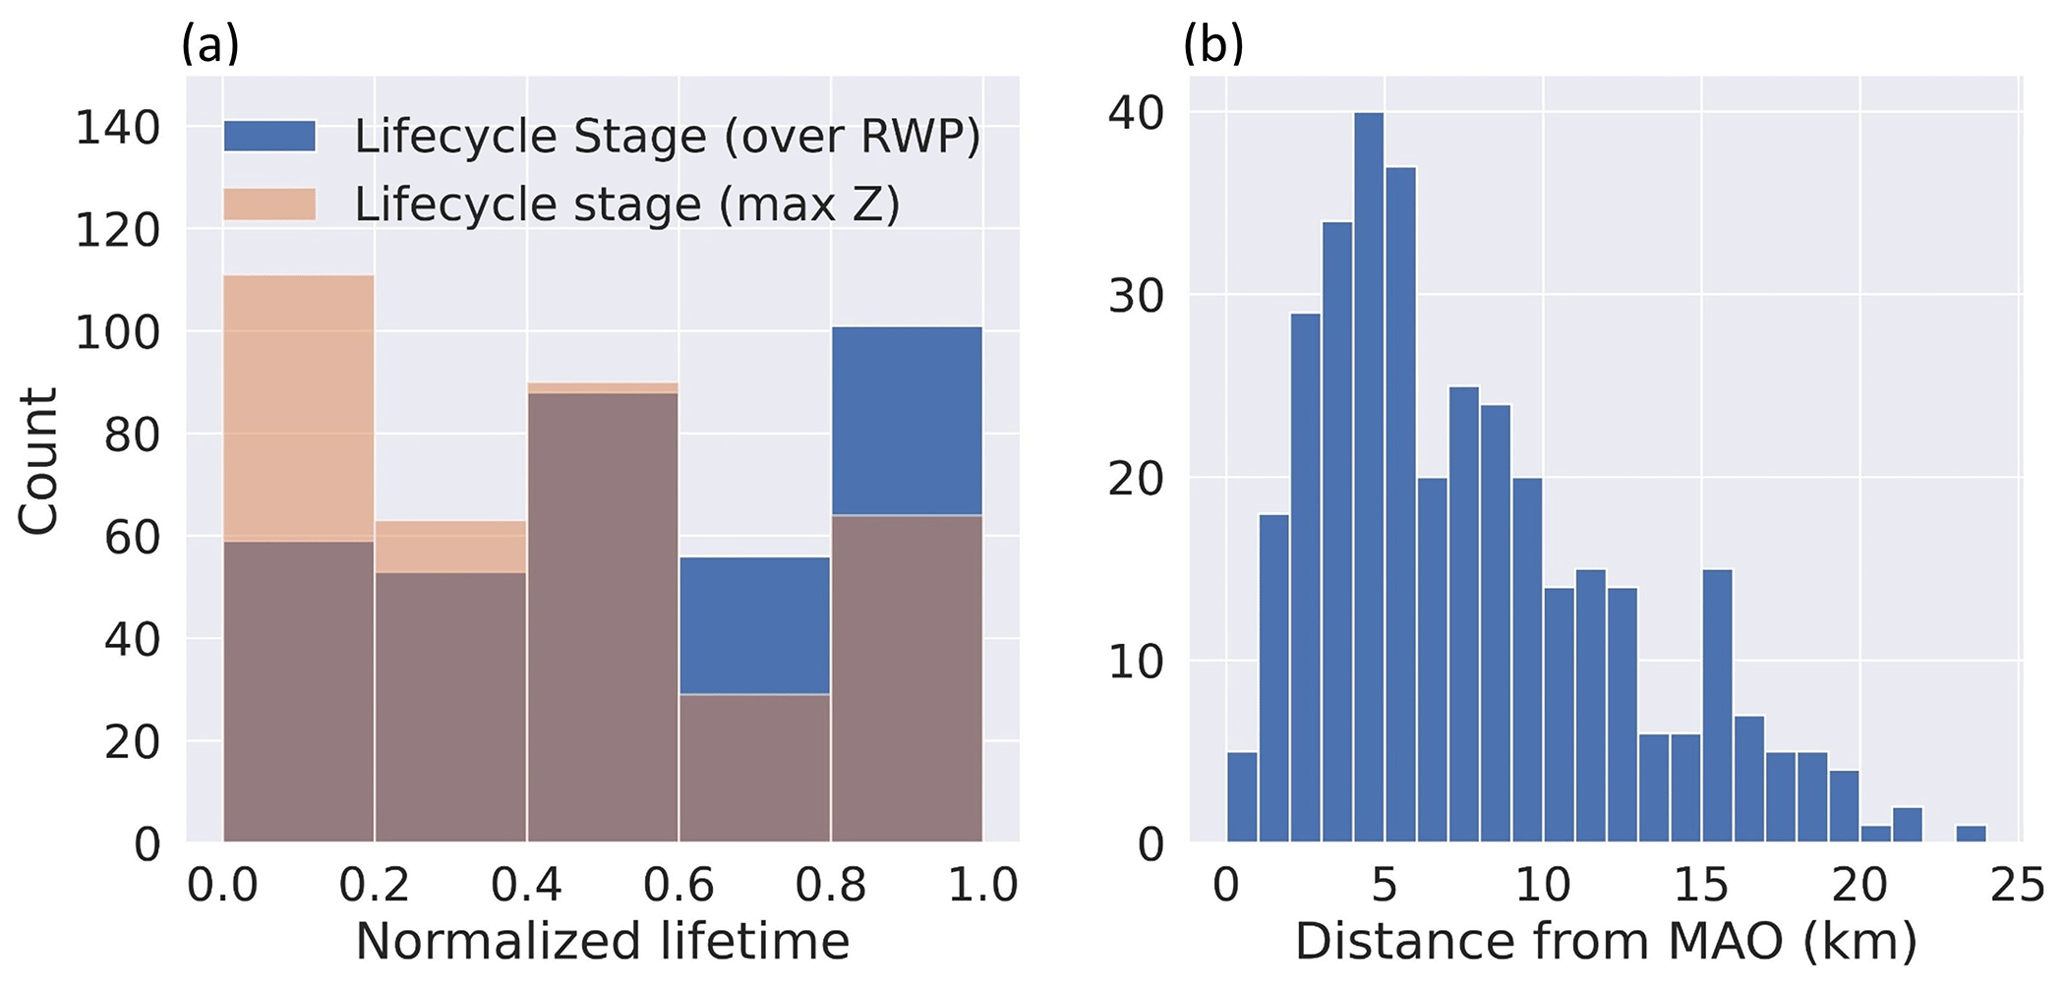
Figure 5Histograms of (a) the lifecycle stage of radar-tracked DCC when located near MAO and when having max Z, and (b) the distance of radar-tracked DCC from MAO.
2.5 Selection of RWP data
The average and maximum distance (90th percentile) between MAO and the feature position was 19.6 and 40.8 km, respectively. Given these distances between the RWP at MAO and the feature positions, the RWP profile of Z for each radar-tracked DCC core was inspected to confirm that the RWP sufficiently sampled the DCC core (e.g., Öktem et al., 2023). The following criteria were established for the selection of RWP data:
-
Only profiles with echoes from at least 10 consecutive cloud echoes (in height) and maximum Z>10 dBZ were considered.
-
Profiles with the maximum height of 10 dBZ echo (echo top height, ETH) less than 8 km were removed to avoid the potential sampling of congestus clouds reflected in the bimodal ETH distribution from the RWP (Wang et al., 2018). Profiles with more than 10 instances of ETH > 8 km within 12 min were selected to include developing or dissipating deep convection.
-
The selected profiles had to satisfy at least one of the following conditions to avoid the selection of upper-level clouds or multiple cloud layers that may have passed the previous criteria:
- a.
contained at least one echo classified as “convection” (according to the classification described by Giangrande et al., 2013);
- b.
at a minimum, one echo of Z>20 dBZ was observed from 2 to 4 km, 4 to 6 km, and 6 to 8 km; or
- c.
at a minimum 60 instantaneous values of Z>20 dBZ were observed within 12 min of column observations.
- a.
A total of 357 time steps were identified when DCCs tracked by tobac were sufficiently sampled by the RWP. These cells represent 31 % of the DCCs and 12 % of the features initially selected based on tobac tracking and distance from the MAO site. The average distance between the selected features and MAO was 8.5 km, with over 70 % of the feature positions from tobac being within 10 km of MAO (Fig. 5b).
3.1 Seasonal and temporal evolution of convection
3.1.1 Temporal evolution of convection
Figure 4 shows boxplots for cell properties of Z, propagation speed, and area within each lifetime bin. The boxplots are notched, and the notches extend to the 95 % confidence intervals of the median value. The average cell Z initially increases with lifetime, reaches a peak at the third bin, and decreases thereafter (Fig. 4). Consistent with the established models of deep convection lifecycle (e.g., Byers and Braham, 1949), lower Z values were observed as precipitation echoes were first observed within initiating DCCs, followed by a peak as the DCCs matured and a decrease as the DCCs eventually dissipated. The cells tracked for this study had an average propagation speed of about 9 m s−1. The average propagation speed increased with DCC lifetime by about 1 m s−1 from the first to the fifth lifetime bin. The median cell areas for the first, third, and fifth bins were significantly different, as shown by the spread of the notches. The median cell area increased with lifetime with an average value of 46.4 km2, yet decreased by the final bin. This trend in the evolution of the DCC horizontal size is consistent with previous estimates based on Tb from satellites (e.g., Machado et al., 1998; Machado and Laurent, 2004; Inoue et al., 2009). Machado and Laurent (2004) showed that the rate of horizontal expansion of the DCC cores can be linked to the DCC lifetime duration. Similarity between the lifetime trends for cell Z and area (Fig. 4) suggest that the increase in Z within DCC cores coincides with their horizontal expansion.
3.1.2 Seasonal evolution of convection
Large-scale circulations drive seasonal variability in Amazon precipitation, with a dry season that is typically identified as June to September, a wet season from December to April, and transitional seasons in the adjacent months of May, October, and November (Marengo et al., 2017; Giangrande et al., 2020). During GoAmazon2014/5, the wet season experienced the highest number of days with convection near MAO and the highest proportion of the total cells designated across the seasons (Fig. 6). Figure 7 shows the average cell Z, propagation speed, and area across the DCC lifetime bins for the wet, dry, and transitional seasons. The temporal evolution of average SIPAM Z did not differ across seasons, with average cell Z values from the SIPAM radar increasing until the third bin and decreasing thereafter (Fig. 7a and b). The average cell area peaked at the third bin for the dry and transitional seasons with a later peak at the fourth bin for the wet season (Fig. 7c).
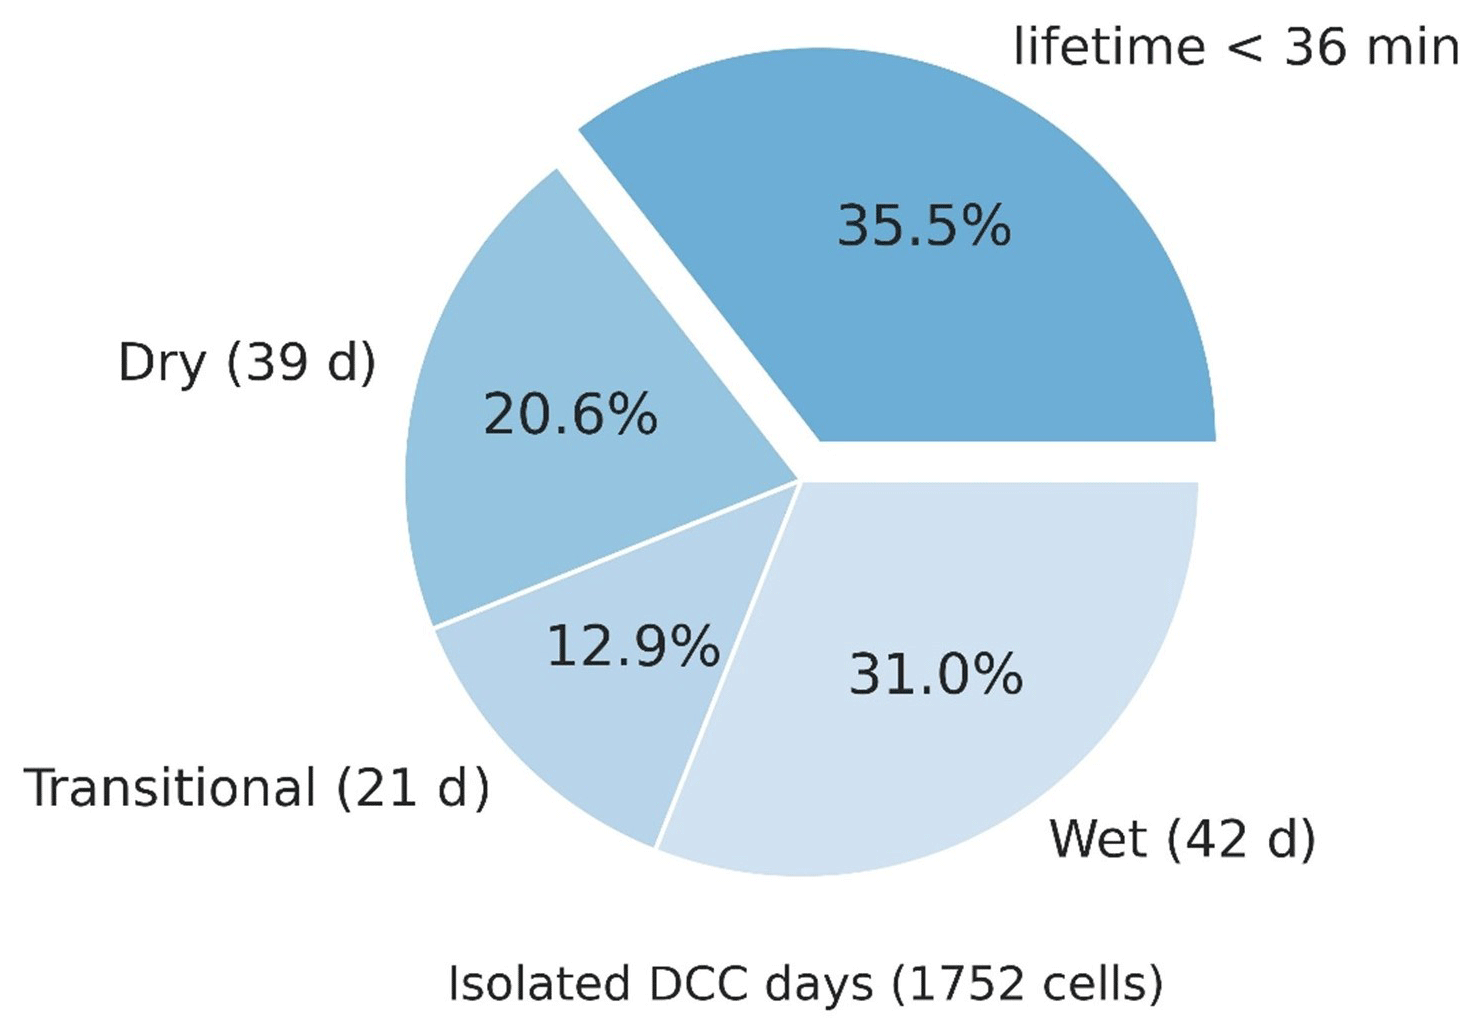
Figure 6The relative proportion of rejected cells (lifetime < 36 min) and the seasonal distribution of selected cells (observed within 20 km of the MAO site, lifetime > 36 min, and propagation speed > 0.5 m s−1).
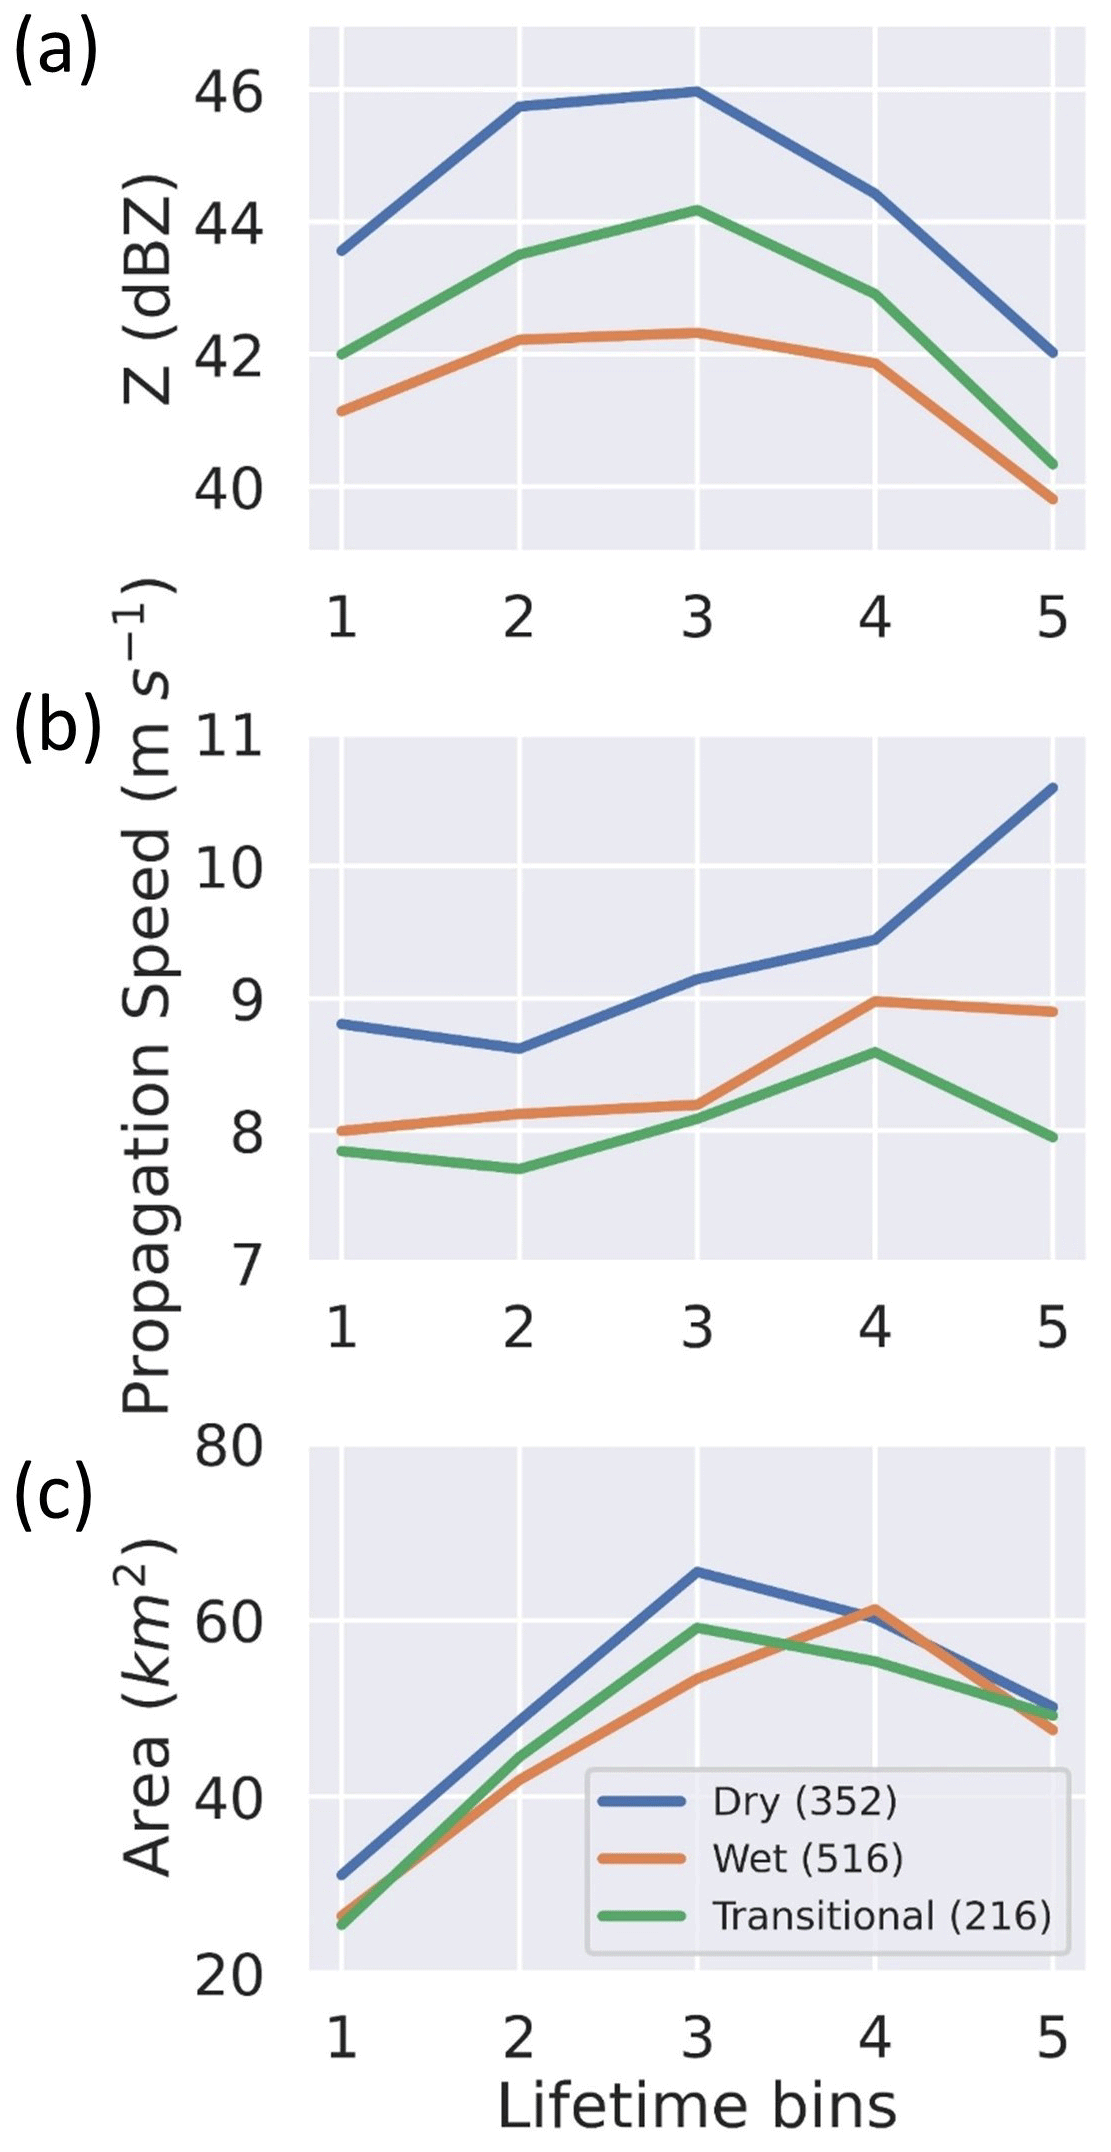
Figure 7Trends in average Z, propagation speed, and area over the DCC lifetime for cells classified by seasons and observed within 20 km of MAO with lifetime > 36 min, propagation speed > 0.5 m s−1, and A<500 km2. The number of cells is listed in the legend.
Consistent with previous studies (e.g., Wang et al., 2018), the strongest DCCs were observed during the dry season (as defined by the higher values of average Z). The average SIPAM Z during the dry season (44.1 dBZ) was greater than the average SIPAM Z during the transitional (42.4 dBZ) and wet seasons (41.3 dBZ). Based on Welch's t test (Welch, 1947), these differences were statistically significant with a p value less than 0.01. These findings are similar to those of Machado et al. (2018), who reported higher hourly rainfall rates during the dry season. However, the daily cumulative rainfall observed during the wet season was four times larger than that of the dry season owing to the longer duration of rainfall during the wet season (cf. Giangrande et al., 2016). According to Fig. S3, the average dry season DCCs examined in this study had shorter lifetimes (73 min) and larger nearest neighbor distances (12.6 km) when compared with the wet (76 in and 10.0 km) and transitional (78 min and 10.5 km) season DCCs. The differences in DCC lifetimes were statistically insignificant while the differences in nearest neighbor distances were statistically significant. The dry season had the largest cells with an average cell area of 49.5 km2, which was 11 % higher than that of the wet season.
The average propagation speed for all seasons increased with DCC lifetime (Fig. 7b). The fastest-moving DCCs were observed during the dry season, followed by the wet and transitional seasons. This seasonal difference in the propagation speed is attributed to the observation of stronger downdrafts during the dry season, consistent with the findings of Giangrande et al. (2023) and discussed further in Sect. 3.2. Stronger downdrafts result in cold pools that trigger secondary convection (e.g., Torri et al., 2015), transport free tropospheric air with low θe toward the surface (discussed further in Sect. 3.3), and drive the propagation of surrounding DCCs. The average propagation speed during the dry season (9.2 m s−1) was greater than the average values for the wet (8.4 m s−1) and transitional (8.0 m s−1) seasons, with the differences being statistically significant. During the dry season, the GoAmazon2014/5 DCCs were most frequently propagating toward the west (Figs. 1 and 2). The most frequently observed direction of cell propagation was toward the west during the dry season and toward the southwest during the wet season (Figs. 1 and 2). This is consistent with seasonal trends in vertically integrated moisture transport (Marengo et al., 2017) and previous estimates of propagation direction, which point to the influence of the Bolivia high during the wet season (e.g., Horel et al., 1989; Machado et al., 1998). There were minor differences across seasons in terms of the distance of the tracked cell from the MAO site. About 39 % and 33 % of the tracks were within 0.1° latitude and longitude of the MAO site, and about 80 % and 77 % of the tracks were within 0.2° latitude and longitude of the MAO site for the dry and wet seasons, respectively (Fig. 2b and d).
3.1.3 Diurnal cycle of deep convection initiation
The sunrise and sunset times near Manaus are typically within 30 min of 06:00 and 18:00 local time (LT), respectively. Cells that initiated between 0:00 and 06:00 LT are referred to as pre-sunrise cells, while cells that initiated from 06:00 to 12:00 LT and 12:00 to 18:00 LT are classified as morning and afternoon cells, respectively. Cells that initiated after 18:00 LT are excluded due to small sample sizes (Fig. S4). Afternoon cells were the most frequent (Fig. S4) type observed in terms of the initiation time of deep convection. The afternoon cells also had the highest cell Z values from the SIPAM radar and the largest cell area. The differences between afternoon and other cell types were statistically significant (p<0.01). The observation of stronger cells in the afternoon hours is consistent with an afternoon peak in the frequency of satellite Tb<240 K in a 15-year climatology (Burleyson et al., 2016), higher peaks in vertical motion from reanalysis (Tang et al., 2016), higher rates of horizontal areal expansion from 12:00 to 16:00 LT (Machado and Laurent, 2004), and a midday peak in convective available potential energy (CAPE) (Giangrande et al., 2017).
Pre-sunrise cells were the weakest yet fastest-moving cell type, with the differences between the average SIPAM Z and the propagation speed between the cell types being statistically significant (p<0.01). The lower SIPAM Z for pre-sunrise cells (Fig. 8a) may be attributed to the lack of solar insolation, weaker surface fluxes, or similar environmental controls that may contrast with the environments found with convective cells observed later in the day. Morning and afternoon cells exhibited a slight increase in their propagation speed with the DCC lifetime. The average cell lifetime decreased with time of day with values of 103, 95, and 91 min for pre-sunrise, morning, and afternoon cells, respectively. This is likely due to the stronger precipitation in proportion to higher average Z leading to hydrometeor unloading and cloud depletion. It is hypothesized that an increase in the frequency and strength of DCCs after sunrise enables more numerous and stronger cold pools and outflows driven by convective downdrafts. The outflows can trigger secondary convection through low-level convergence or mechanical lifting and enhance the propagation speed of nearby convection (Del Genio et al., 2012).
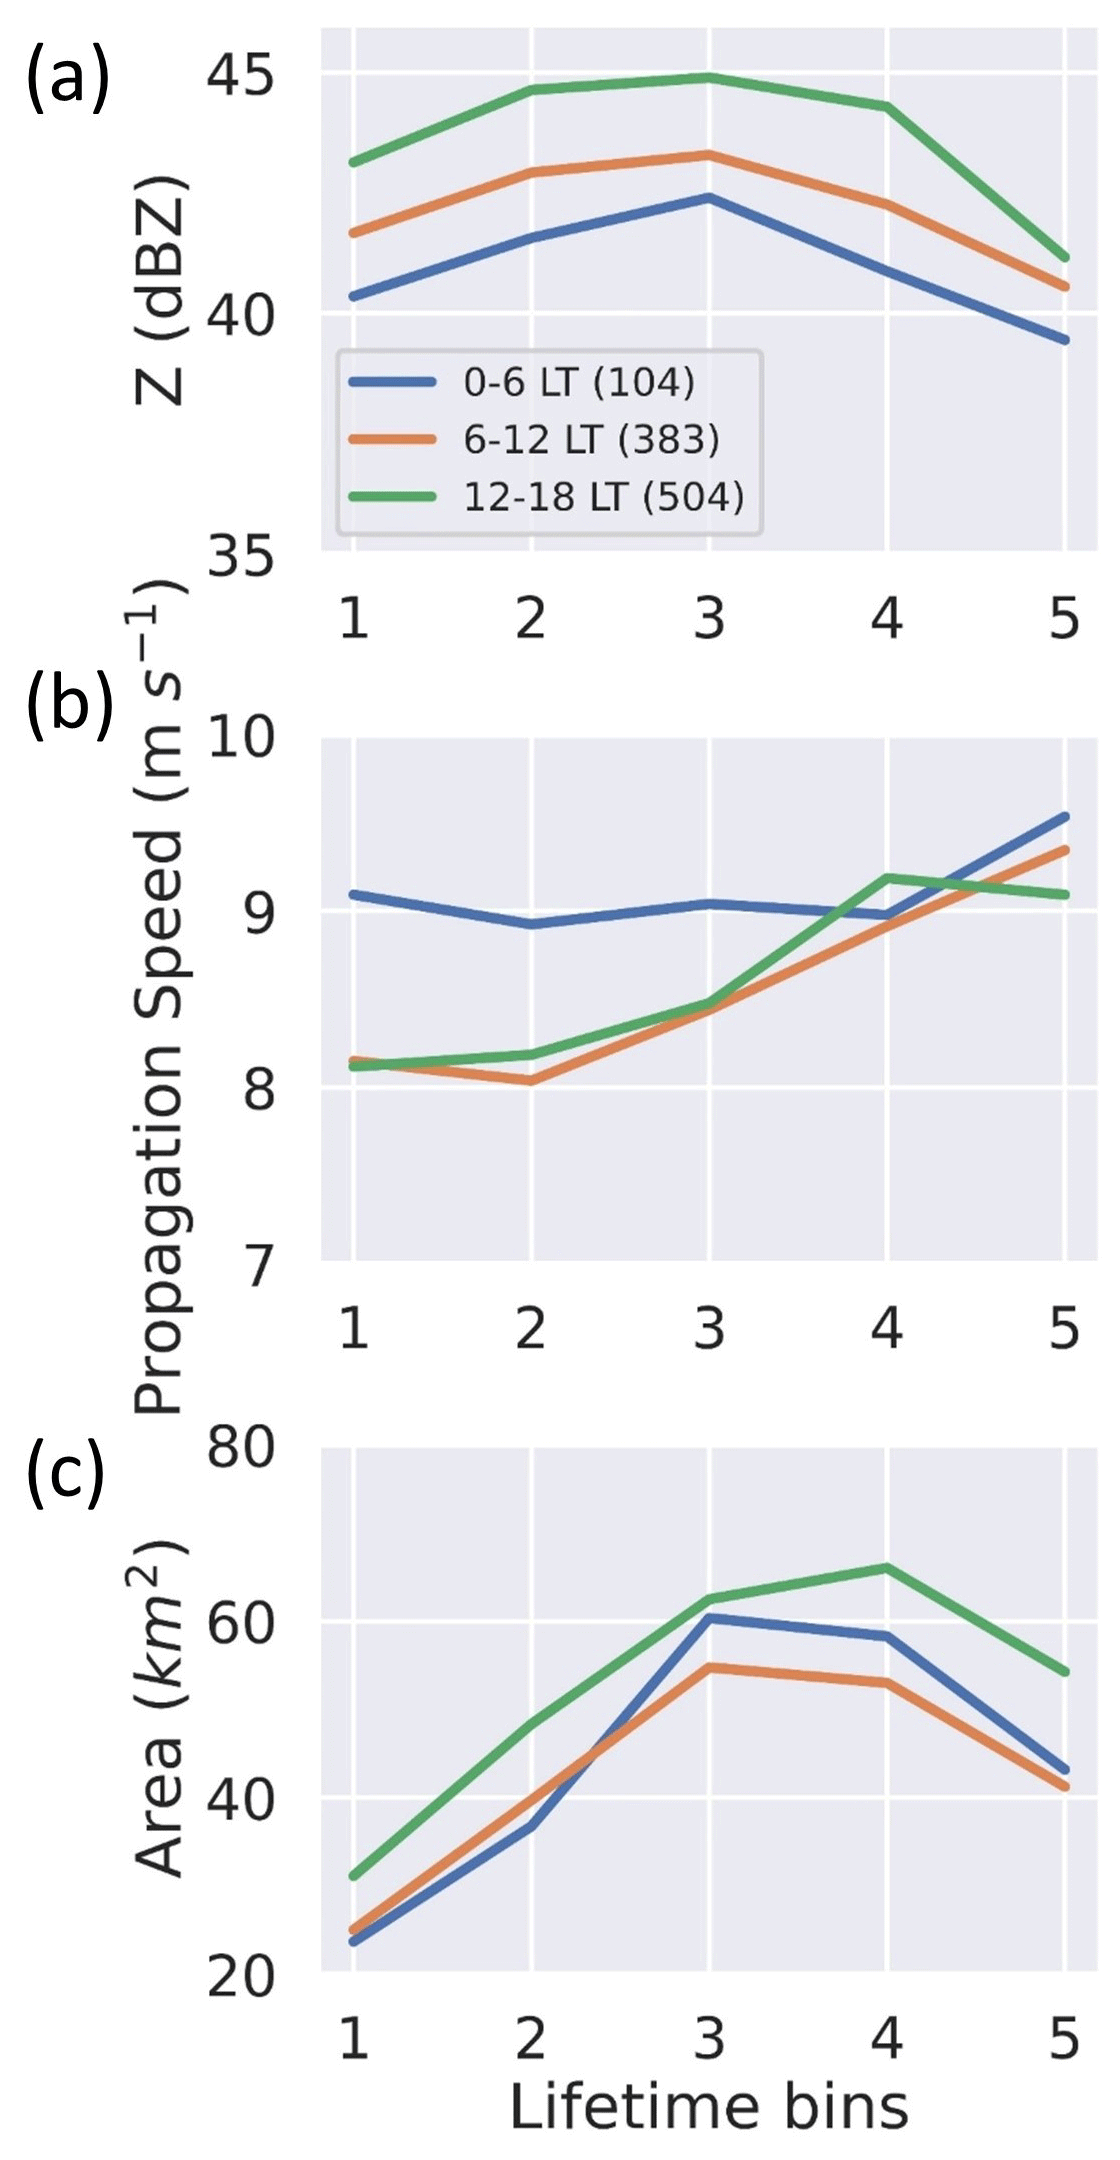
Figure 8Same as Fig. 7 but with cells classified by the time of deep convection initiation. The 18:00–00:00 LT bin is not shown due to the small number of samples.
3.2 Profiles of DCC kinematic properties
3.2.1 Updraft and downdraft strength
In Fig. 9a, we provide RWP profiles of the average Z and maximum Z (95th percentile) for DCCs in the developing, mature, and dissipating stages at the time of overpass. The RWP data below 2 km were masked to avoid low Z bias offsets in those measurements owing to potential RWP receiver saturation (e.g., Tridon et al., 2013; Wang et al., 2020). The data were smoothed using a rolling average every three vertical levels (about 360 m). In Fig. 9b, we include profiles of the strongest estimated updraft (95th percentile of measurements with w>1 m s−1) and downdraft (5th percentile of measurements with w<1 m s−1) to represent updraft and downdraft strength. RWP retrievals of w at 3.5–5 km were masked due to retrieval uncertainties in the vicinity of the melting layer (Giangrande et al., 2016; Wang et al., 2019). These data were smoothed using a rolling average every five vertical levels (about 600 m). Seasonal variability was examined by comparing these profiles for the dry and wet seasons (Figs. 10 and 11) with DCCs from the transitional (May, October, and November) season excluded due to small sample sizes. Surface precipitation was quantified based on the rainfall rate retrieved using drop size distributions sampled by the disdrometer (Table 2).
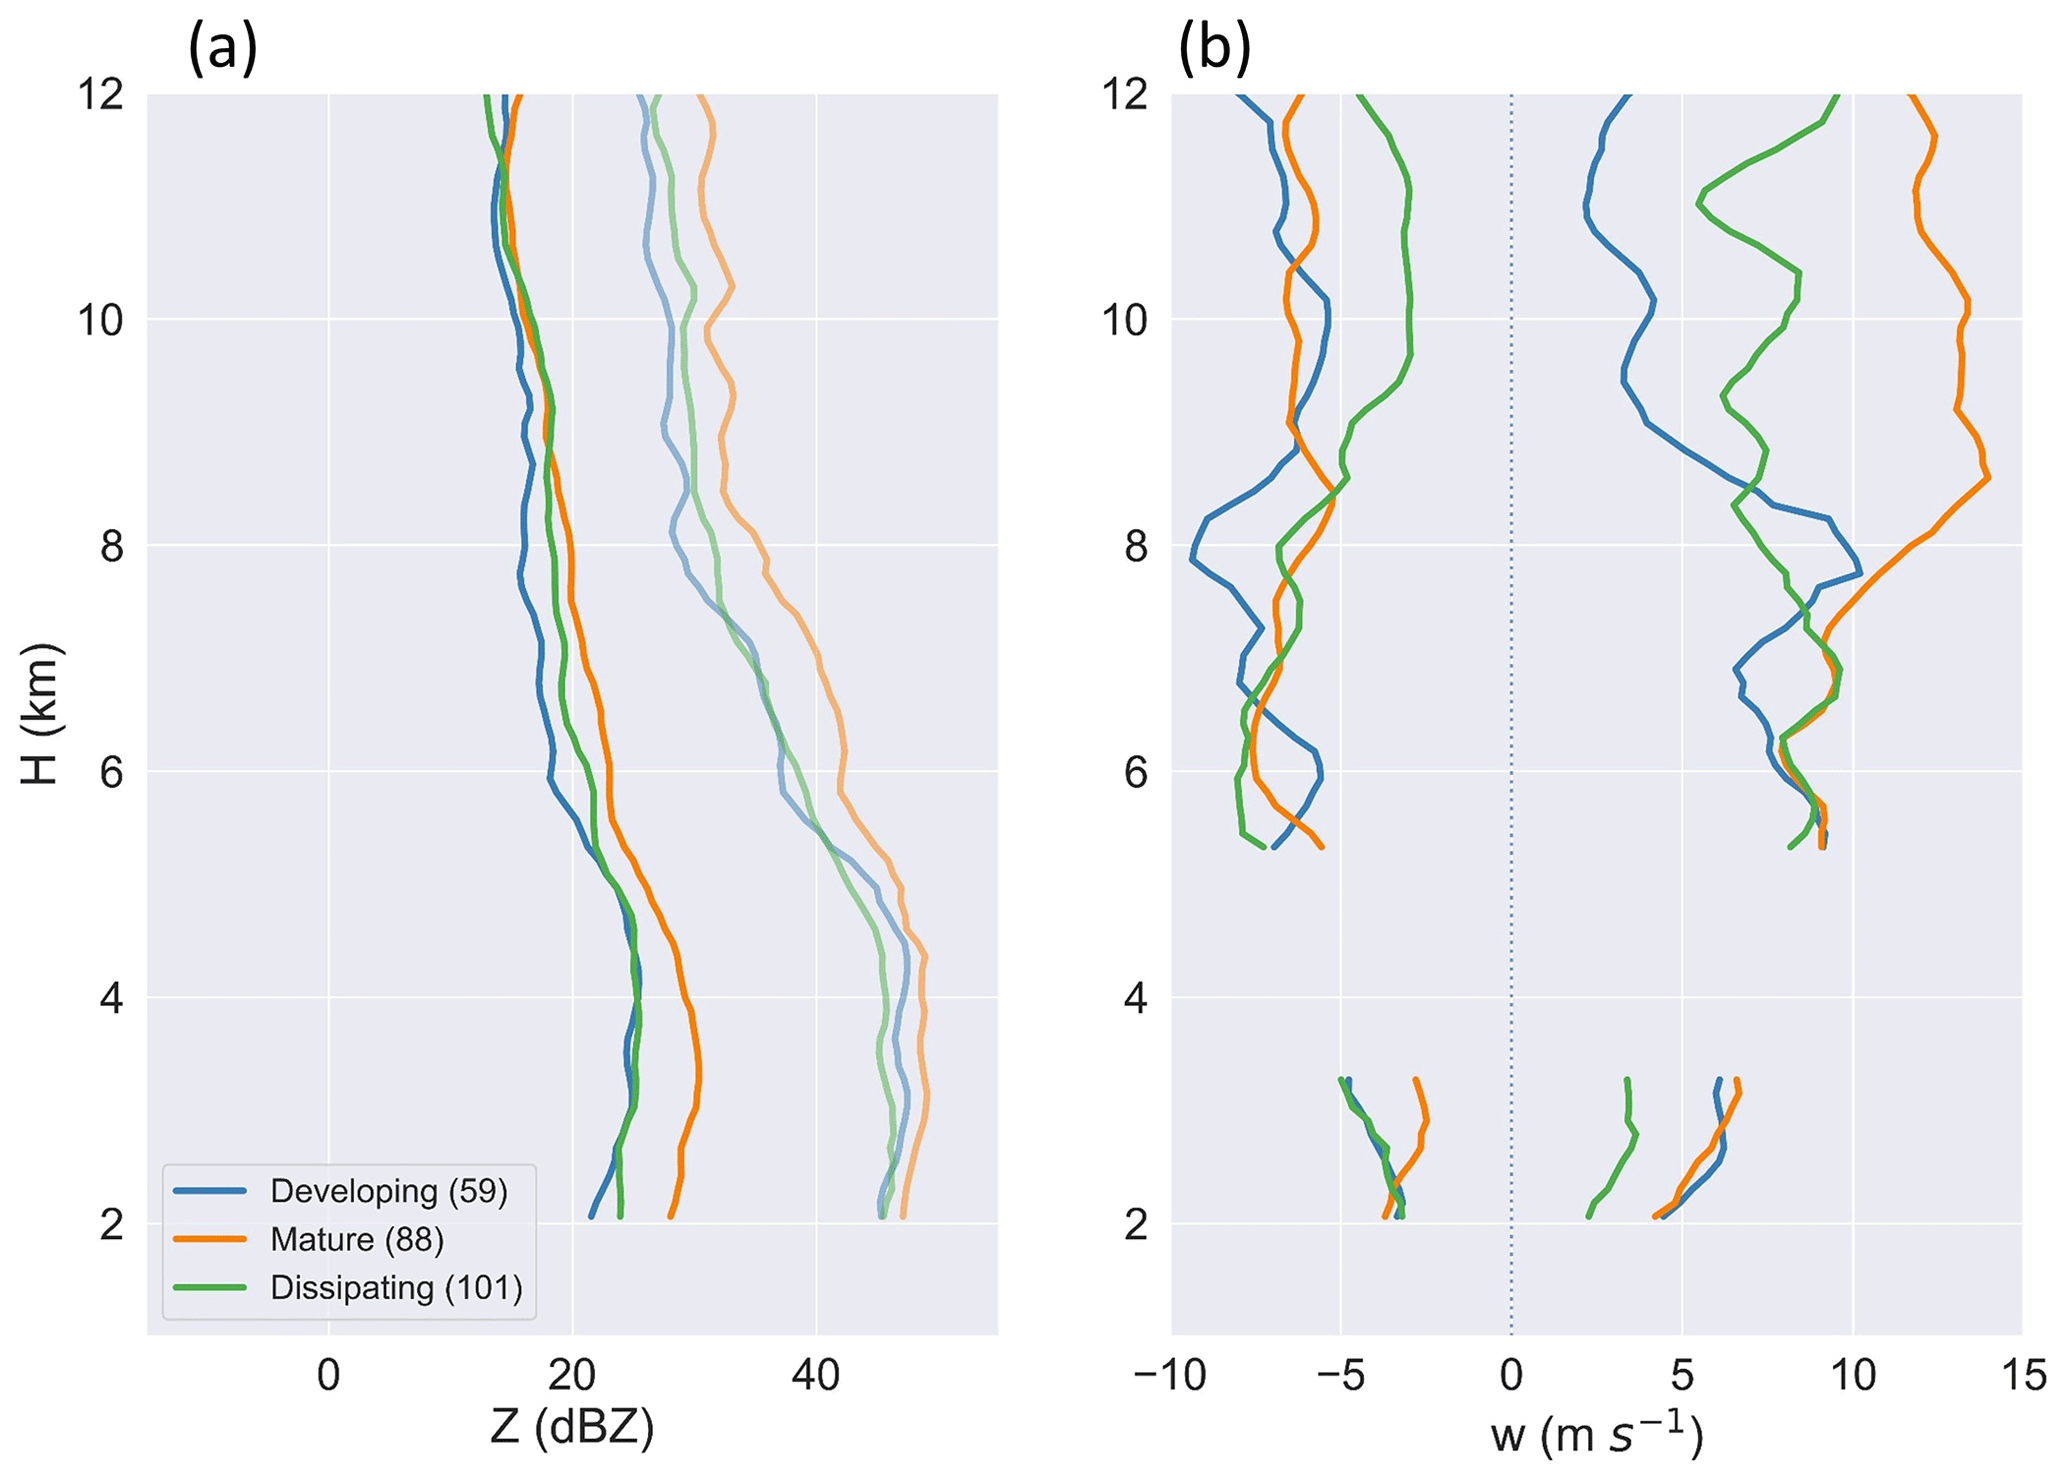
Figure 9Profiles of (a) the average (darker lines) and maximum reflectivity (Z) and (b) 95th percentiles of updrafts with w>1 m s−1 and downdrafts with m s−1 for developing, mature, and dissipating DCCs.
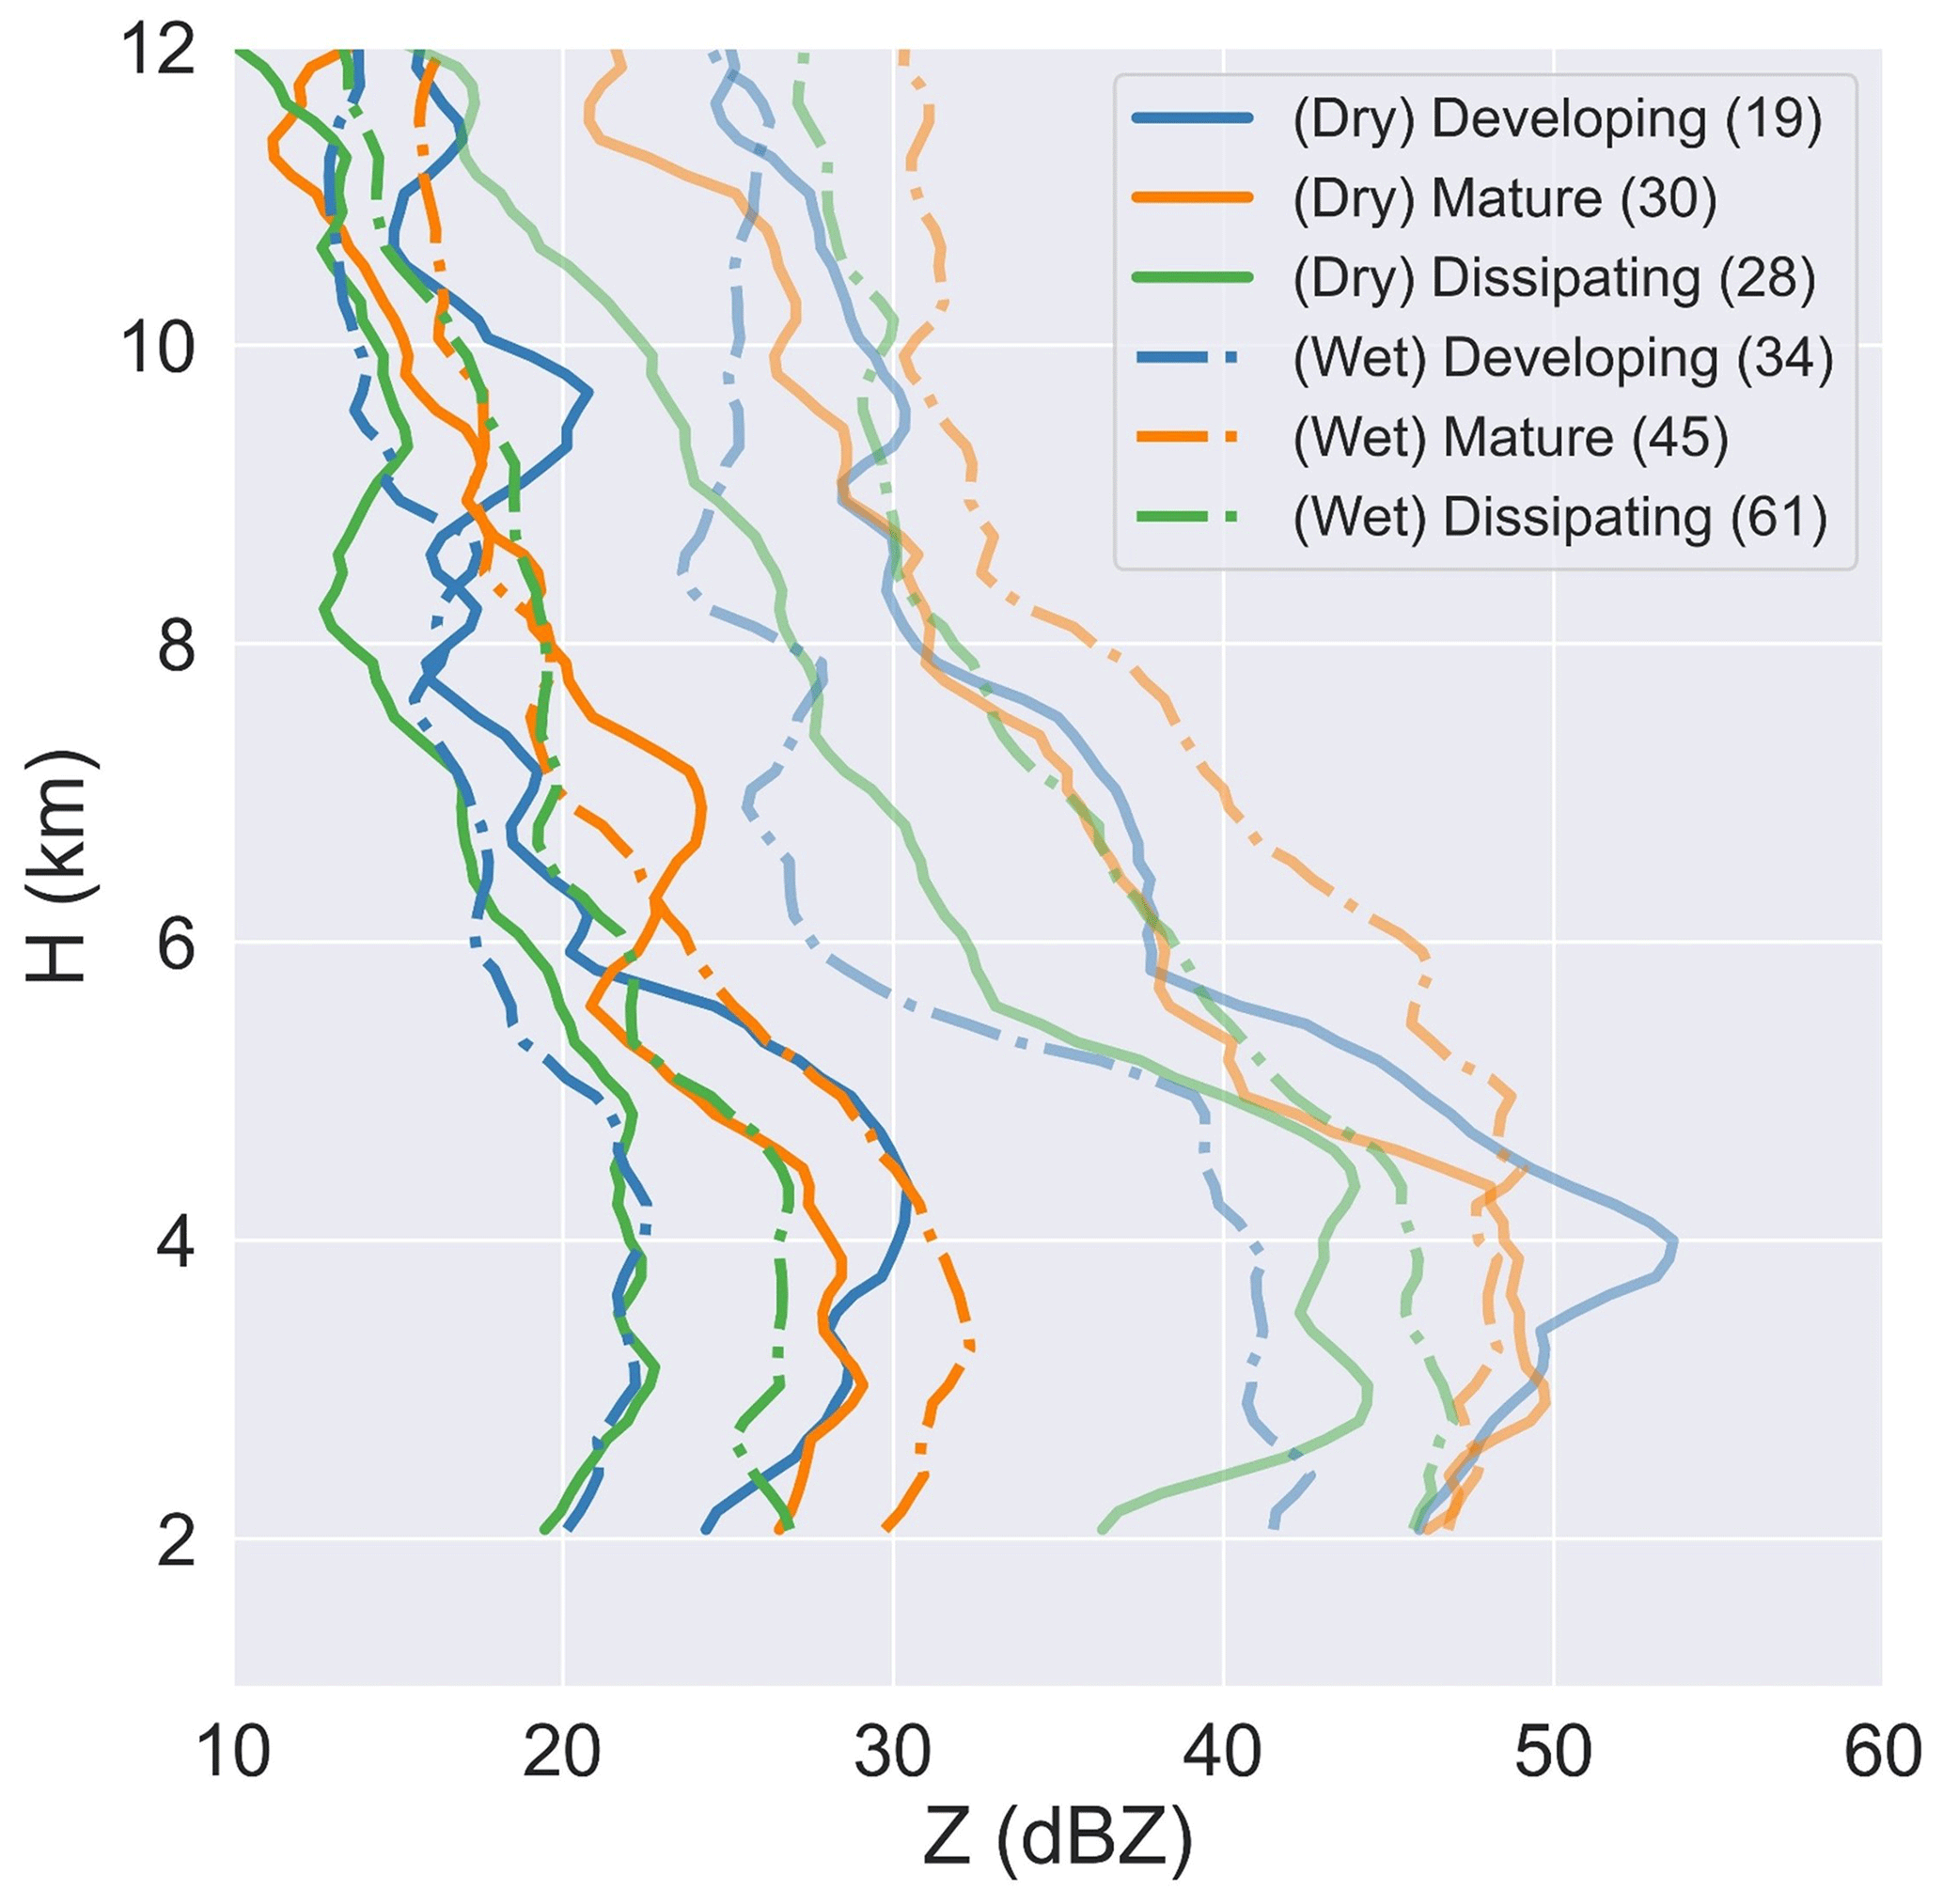
Figure 10Profiles of the average Z (darker lines) and maximum Z (95th percentile) for developing, mature, and dissipating DCCs from the dry season (solid lines) and wet season (dotted–dashed lines).
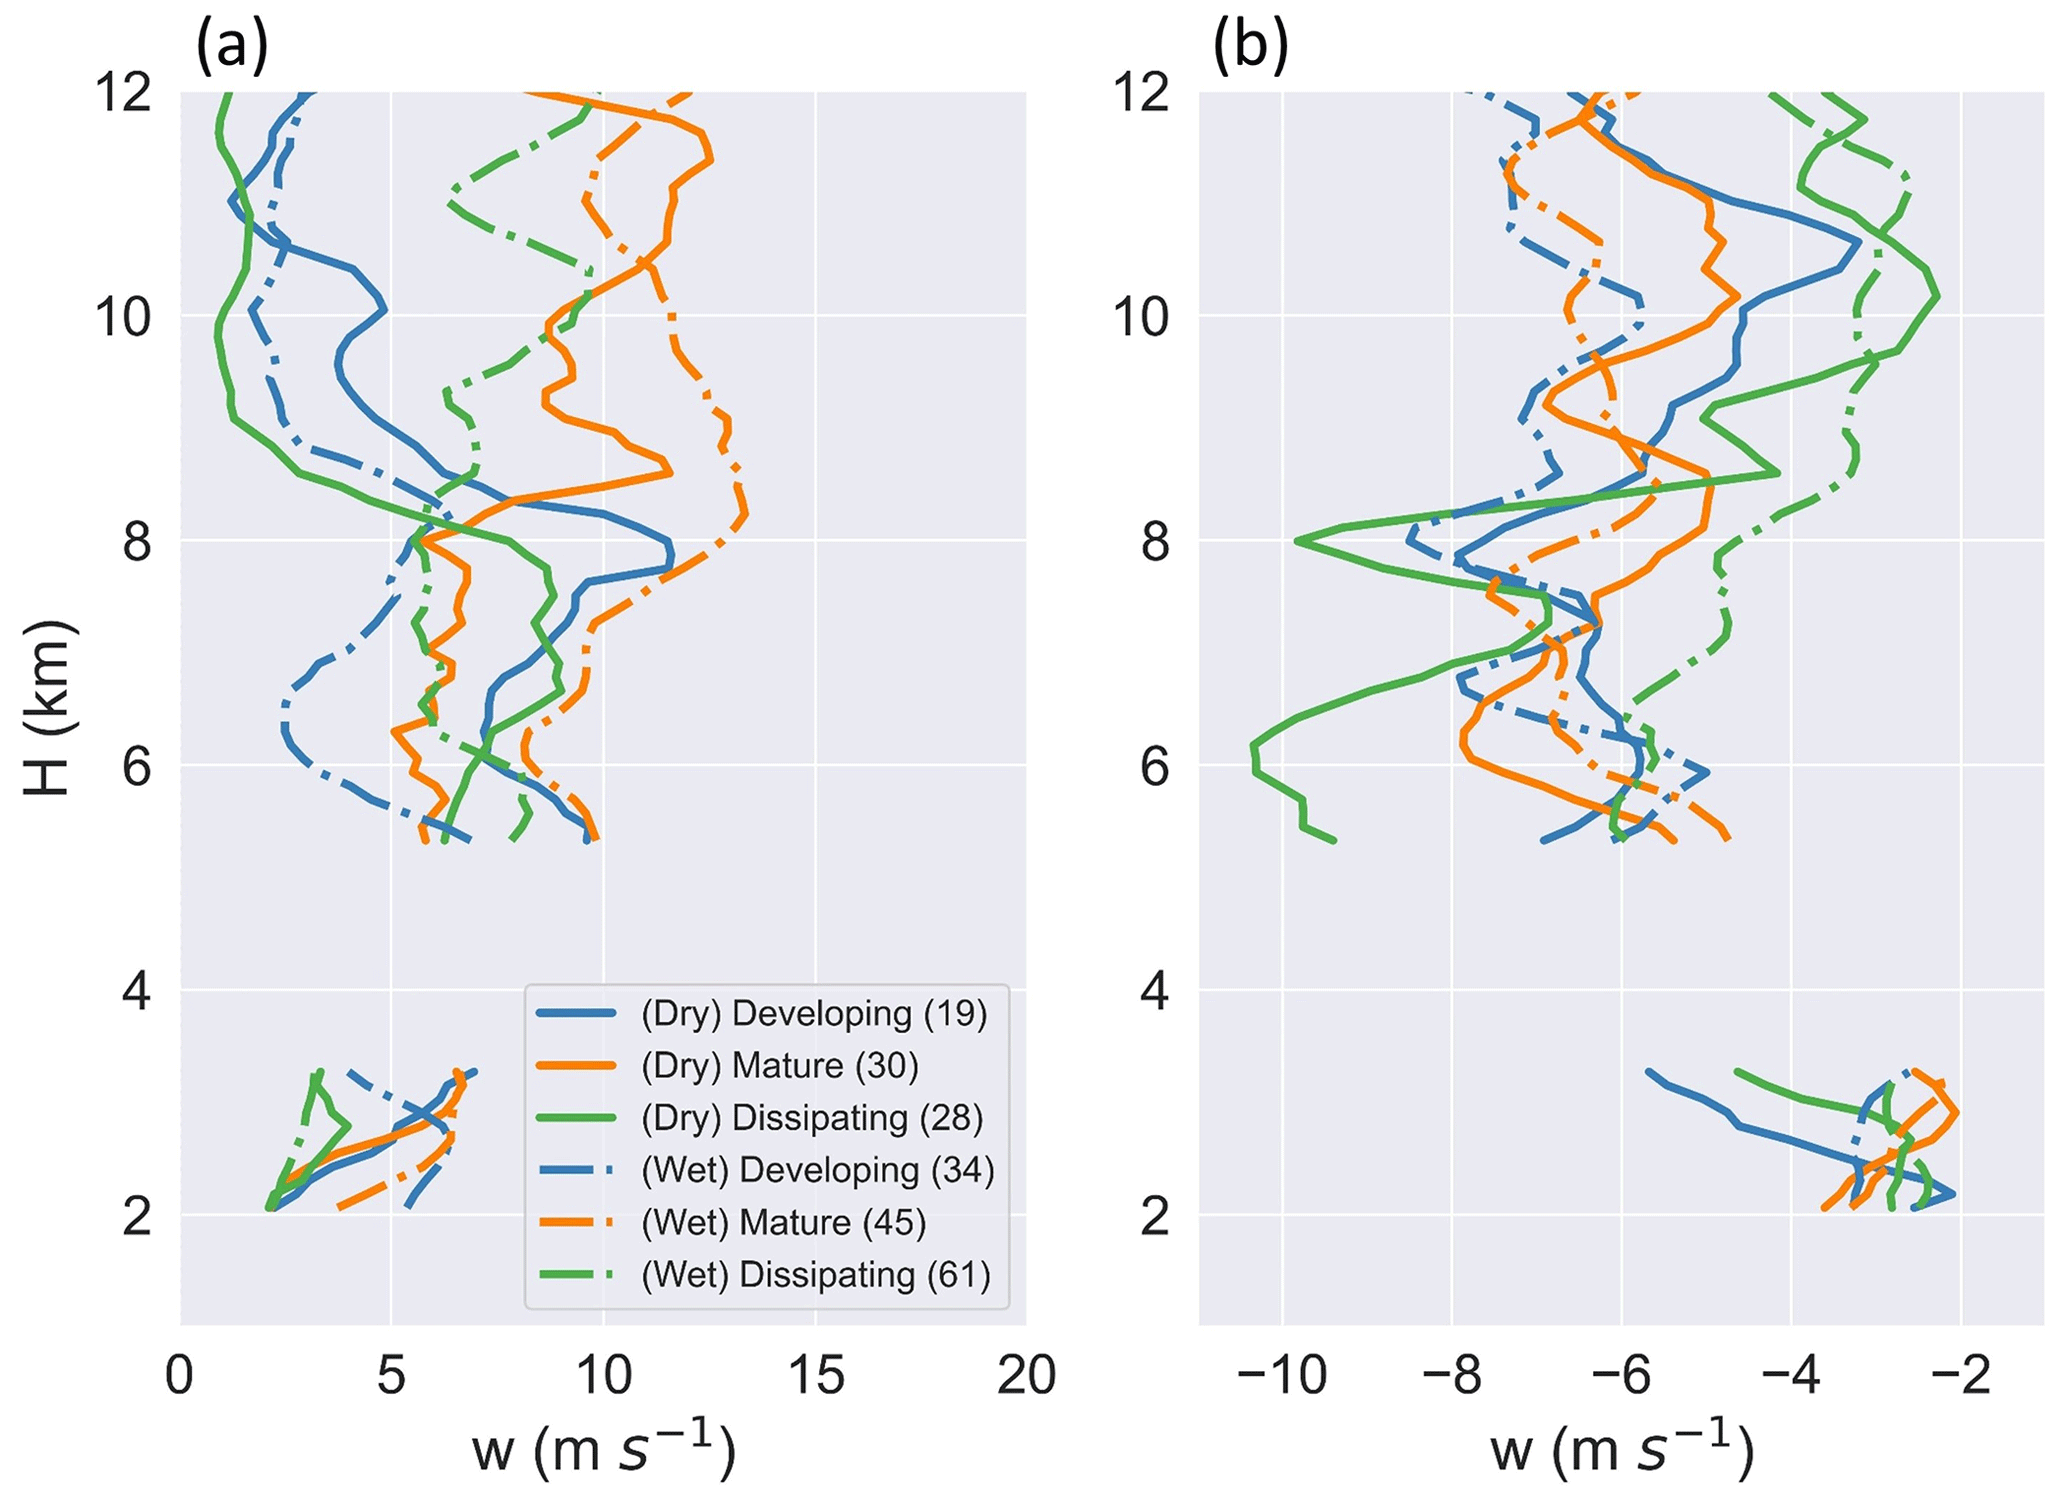
Figure 11Profiles of (a) strongest updrafts (95th percentile of w>1 m s−1) and (b) strongest downdrafts (5th percentile of m s−1) for developing, mature, and dissipating DCCs from the dry season (solid lines) and wet season (dotted–dashed lines).
Mature DCCs exhibited the strongest convection defined in terms of the associated Z values observed over the vertical extent of these profiles (Fig. 9a). Mature DCCs also indicated the strongest estimated updrafts (Fig. 9b), as well as the highest frequency of surface rainfall rate measurements > 1 mm h−1 (Table 2), and the highest overall rainfall rates among developing, mature, and dissipating DCCs. These results support our initial designation of the third lifetime bin as the conceptual “mature” stage of the convection lifecycle. From 6 to 9 km above ground level, developing DCCs displayed the lowest Z values and the weakest updrafts (Fig. 9). Updraft strength above 8 km represented a key discriminating characteristic between lifecycle stages. At upper levels (above 9 km), mature DCCs exhibit the highest maximum Z values, as anticipated, due to their stronger updrafts that may loft rain or promote media such as frozen drops and graupel to higher altitudes (Fig. 9a). Conversely, developing DCCs demonstrated the weakest convective signatures, while exhibiting the lowest values of average Z over most of the profile, and were associated with the fewest measurements of rainfall rate > 1 mm h−1 (Table 2). As height increased, updraft strength typically increased for mature DCCs higher aloft (i.e., above 8 km), while remaining relatively flat for dissipating DCCs, and decreased with altitude for developing DCCs (Fig. 9b). For this study, mature DCCs exhibited the strongest updrafts between 9 and 12 km with a magnitude of 12.6 m s−1, followed by dissipating DCCs (7.4 m s−1) and developing DCCs (3.2 m s−1).
Seasonal variability in the lifecycle of Z and w profiles was reflected in terms of the contrast in the temporal evolution of Z and w between the dry and wet seasons (Figs. 10 and 11). During the dry season, developing DCCs had stronger updrafts below the freezing level (typically 5 km for most events) and into the mid-levels (altitudes to 8 km) when compared with the wet season cells. Developing and mature DCCs often displayed similar profiles of Z during the dry season (Fig. 10). This finding is consistent with that of Giangrande et al. (2023), who attributed the stronger intensity found in their developing DCCs during the dry season to higher low-level CAPE, lower convection inhibition, and higher pre-convective daytime instability (i.e., reduced shallow clouds resulting in more incoming solar radiation) when compared with their wet season events. In contrast, for the wet season cells, developing DCCs exhibited weaker updrafts above the freezing level in addition to lower Z values compared with mature and dissipating stage DCC observations (Fig. 11). A delayed peak in convection intensity during the DCC lifetime may help explain the later peak observed for the average cell area during the wet season compared with the dry season (Fig. 7). Giangrande et al. (2023) found a similar pattern and, using stochastic parcel modeling, suggested that free-tropospheric relative humidity and entrainment-driven dilution above the melting layer (5–8 km) and at upper levels (above 8 km), respectively, may also influence the different behaviors for developing DCCs during the wet and dry seasons.
Precipitation-driven downdrafts below the melting layer were summarized for each lifecycle stage (Fig. 9b). During the wet season, downdrafts below the freezing level had a similar magnitude (about 3 m s−1) across the lifecycle stages (Fig. 11b). In comparison, consistent with the results of Wang et al. (2019), stronger downdrafts (up to 5 m s−1) were sampled below the freezing level during the dry season (Fig. 11b). Mature DCCs exhibited the weakest downdrafts, which we suggest may be attributed to the low probability of sampling downdrafts below the melting layer during the passage of mature DCCs for this study (Fig. 13). The most frequent and intense downdrafts were observed below an altitude of 10 km (Figs. 9b and 13), while stronger downdrafts were sampled between 6 and 10 km during the dry season compared with the wet season. The latter results are consistent with the seasonal behaviors of Amazon downdrafts presented by Giangrande et al. (2023). Those authors attributed enhanced dry season downdrafts aloft to the higher propensity for graupel loading in the dry season, as well as increased evaporation and entrainment mixing adjacent to DCC cores. During the convection lifecycle, composite downdraft strength typically increased with DCC lifetime during the dry season, as dissipating DCCs often suggested the strongest downdrafts (Fig. 11b). Giangrande et al. (2023) used the ETHs from the RWP as a proxy for convective cloud maturity and found that stronger downdrafts aloft were associated with the later stages of convection. As a supplement to their updraft studies, their use of a stochastic parcel model also suggested that mixing between updraft and environmental air may lead to negative buoyancy. The magnitude of the resulting downward acceleration was suggested to be greater during the dry season due to the lower relative humidity aloft compared with the wet season (Wang et al., 2018, 2019).
Overall, our cumulative classification of updraft and downdraft intensity contingent on the lifecycle stage highlights key patterns in the evolution of isolated DCCs. The mature stage exhibits the strongest convection across lifecycle stages, with the most intense Z values and strongest updrafts. In turn, stronger precipitation events were observed when mature DCCs overpass the ground site, with the potential to exert a greater influence on local hydrology and surface thermodynamics compared with other lifecycle stages. Subsequent classifications based on bulk seasonal Amazon environmental controls reveal variability in the timing and nature of convective cloud intensity. Seasonal changes in updraft strength above the freezing level for developing DCCs imply that stronger convection is observed during the second (first) half of the DCC lifetime during the wet (dry) season. Evaluation of these patterns is crucial because, consistent with previous studies (e.g., Wang et al., 2019), trends in profiles of updraft and downdraft strength are closely linked to trends in profiles of upward and downward mass flux.
3.2.2 Vertical mass flux and transport rate
While previous studies have attempted to estimate mass flux within Amazonian DCCs (e.g., Giangrande et al., 2016; Wang et al., 2020), the assumptions and summary nature of these previous efforts intrinsically implied that the mass transport rate or the variability in mass flux over the DCC lifetime could not be examined. For instance, Giangrande et al. (2016) adopted a methodology developed by Kumar et al. (2015) to define mass flux as the rate of mass transport per unit area within a fixed domain and assumed cell motion, independent of individual core sizes. In contrast, following previous aircraft and profiler studies (e.g., LeMone and Zipser, 1980; May and Rajopadhyaya, 1999; Giangrande et al., 2013), Wang et al. (2020) calculated mass flux over a core width that was determined in a time–height configuration based on coherent RWP observations meeting an updraft “core” threshold of w>1.5 m s−1. This methodology assumes that core width remains constant during the period of time the updraft is sampled.
The RWP data are used to characterize the properties of the DCC cores. Time–height profiles of the composite w and Z for DCCs classified as mature DCCs are shown in Fig. 12 with composites for other lifecycle stages in Fig. S1. These composites represent the median values of w and Z across all DCCs classified within the lifecycle stage. The profiles are centered at time 0 which represents the time of simultaneous sampling by the SIPAM radar and the RWP during the DCC overpass at MAO. This is the time step for which we have the DCC lifecycle classification from the cell tracking. Given an average propagation speed of 9 m s−1 (Fig. 4), a 2 min period of RWP observations corresponds to sampling a core that is 1.08 km wide. Based on previous observations of a median updraft width of 1 km for MAO (Wang et al., 2020), we use a 2 min period of RWP observations centered at time 0 to represent each DCC core. The use of an average value for updraft or downdraft speed over the 2 min period also reduces the influence of a single profile of RWP measurements from time 0.
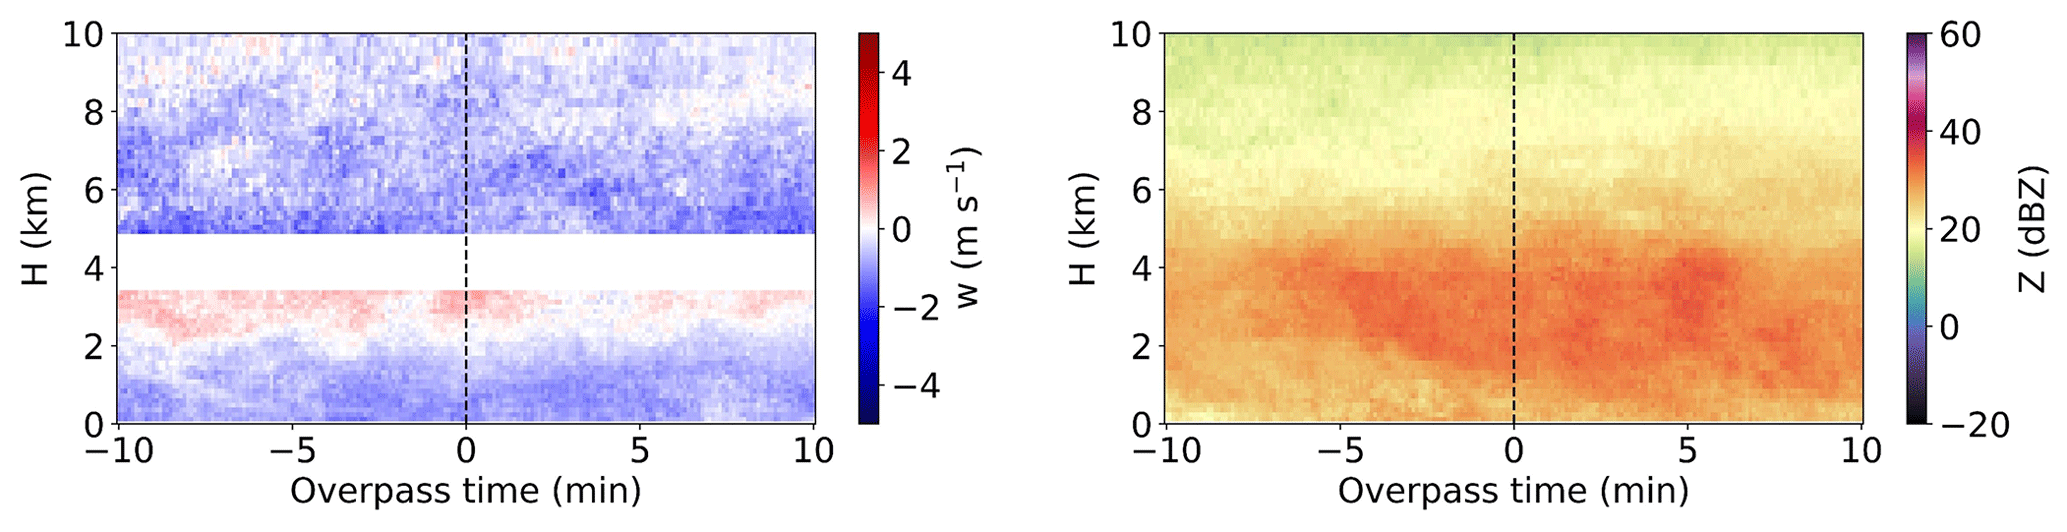
Figure 12Time–height composites of vertical velocity (w) and reflectivity (Z) from the RWP for DCCs in the “mature” lifecycle stage. (For each pixel, the composites represent the median value across all DCCs classified as “mature”.)
Natural variability in the shape of updraft or downdraft regions within the DCC core can lead to variability in the vertical velocity profiles over the 2 min period. To account for these natural variations, the time series of vertical velocity used to represent the DCC core is weighted by the probability, p(w), of sampling an updraft or a downdraft during the 2 min period. For each height level, the value of p(w) for updrafts (or downdrafts) is determined as the ratio of the number of observations with w>1 m s−1 (or m s−1) and the total number of observations over the 2 min period (20 observations given the RWP resolution of 6 s). Figure 13 shows vertical profiles of p(w) for updrafts and downdrafts averaged across all DCCs classified as developing, mature, and dissipating. The values of p(w) represent a proxy for estimating the updraft or downdraft core width within the averaging time interval. For example, developing and mature DCCs had the highest p(w) for updrafts immediately below the freezing level, with the widest updrafts also observed at these levels.
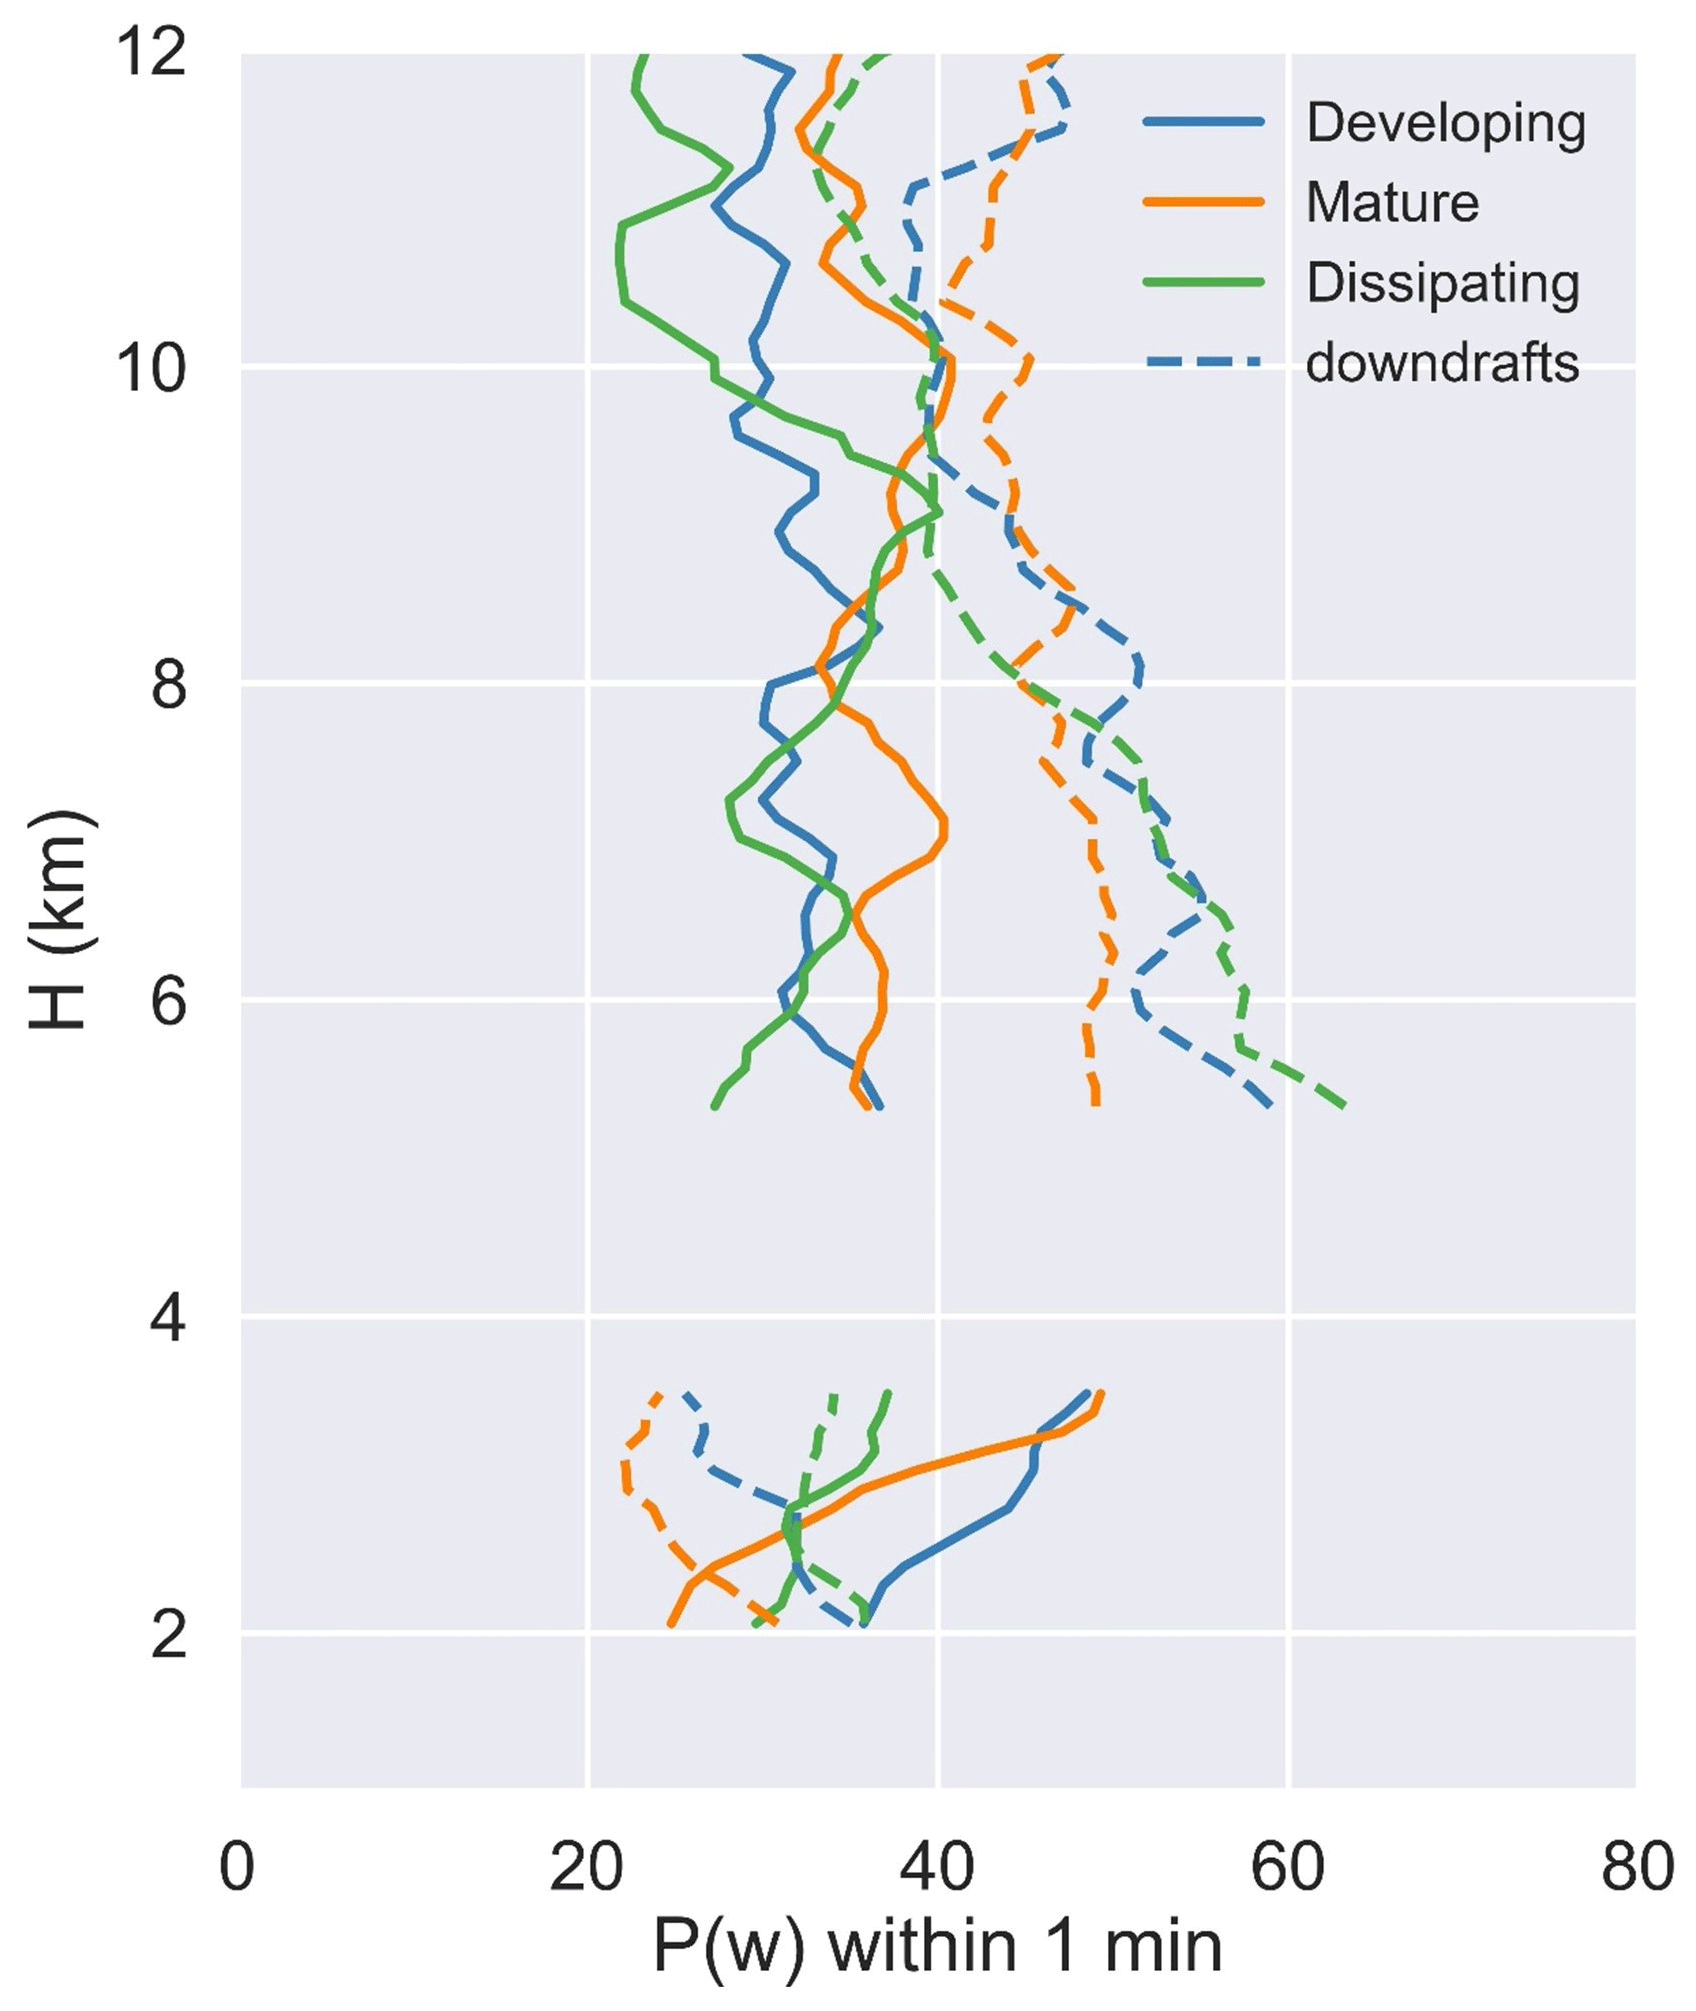
Figure 13Vertical profiles of the average probability of sampling an updraft with w>1 m s−1 (solid lines) or a downdraft with m s−1 (dotted–dashed lines) within 1 min of the DCC overpass time.
For most of the vertical profile, p(w) for updrafts followed the opposite trends compared with p(w) for downdrafts. In cases of updrafts, developing DCCs had the highest p(w) below the freezing level, while mature DCCs had the highest p(w) above that level across all lifecycle stages. In cases of downdrafts, dissipating DCCs had the highest p(w) up to 8 km, while mature DCCs had the highest p(w) above 8 km across all lifecycle stages. To examine the sensitivity of p(w) and mass flux to the averaging time interval of 2 min, similar mass flux calculations were also performed using p(w) and w up to 5 or 10 min before and after the passage of the DCCs. Results from these sensitivity tests indicate that mass flux decreases when the sampling time interval is increased (Fig. S2). This is consistent with the hypothesis that mass flux should decrease due to a decrease in both p(w) and w as the distance from the region of strongest convection within the DCCs increases (e.g., Houze, 2004).
For this study, we have adopted a modified definition wherein mass flux is calculated for individual cells using additional properties from tobac-based cell tracking. Here, mass flux is defined as the rate of mass transport per unit area for each cell. Mass flux [kg m−2 s−1] is calculated as the product of air density r(H) [kg m−3] and the probability-weighted average of w [m s−1] over the 2 min interval. The mass transport rate in [kg s−1] is obtained by multiplying mass flux and cell area from the tracking output. Since area was estimated at the 2 km CAPPI level, mass transport rate was calculated assuming this area remained constant with height. The use of a probability-weighted estimate of w limits the bias in mass transport rate associated with assuming constant cell area with height. Figure 14 shows profiles of the average mass flux (net, upward, and downward) for each lifecycle stage. Overall, these profiles highlight the variability in mass flux as a function of height relative to the melting layer, the cloud lifecycle stage, and the direction of vertical air motion.
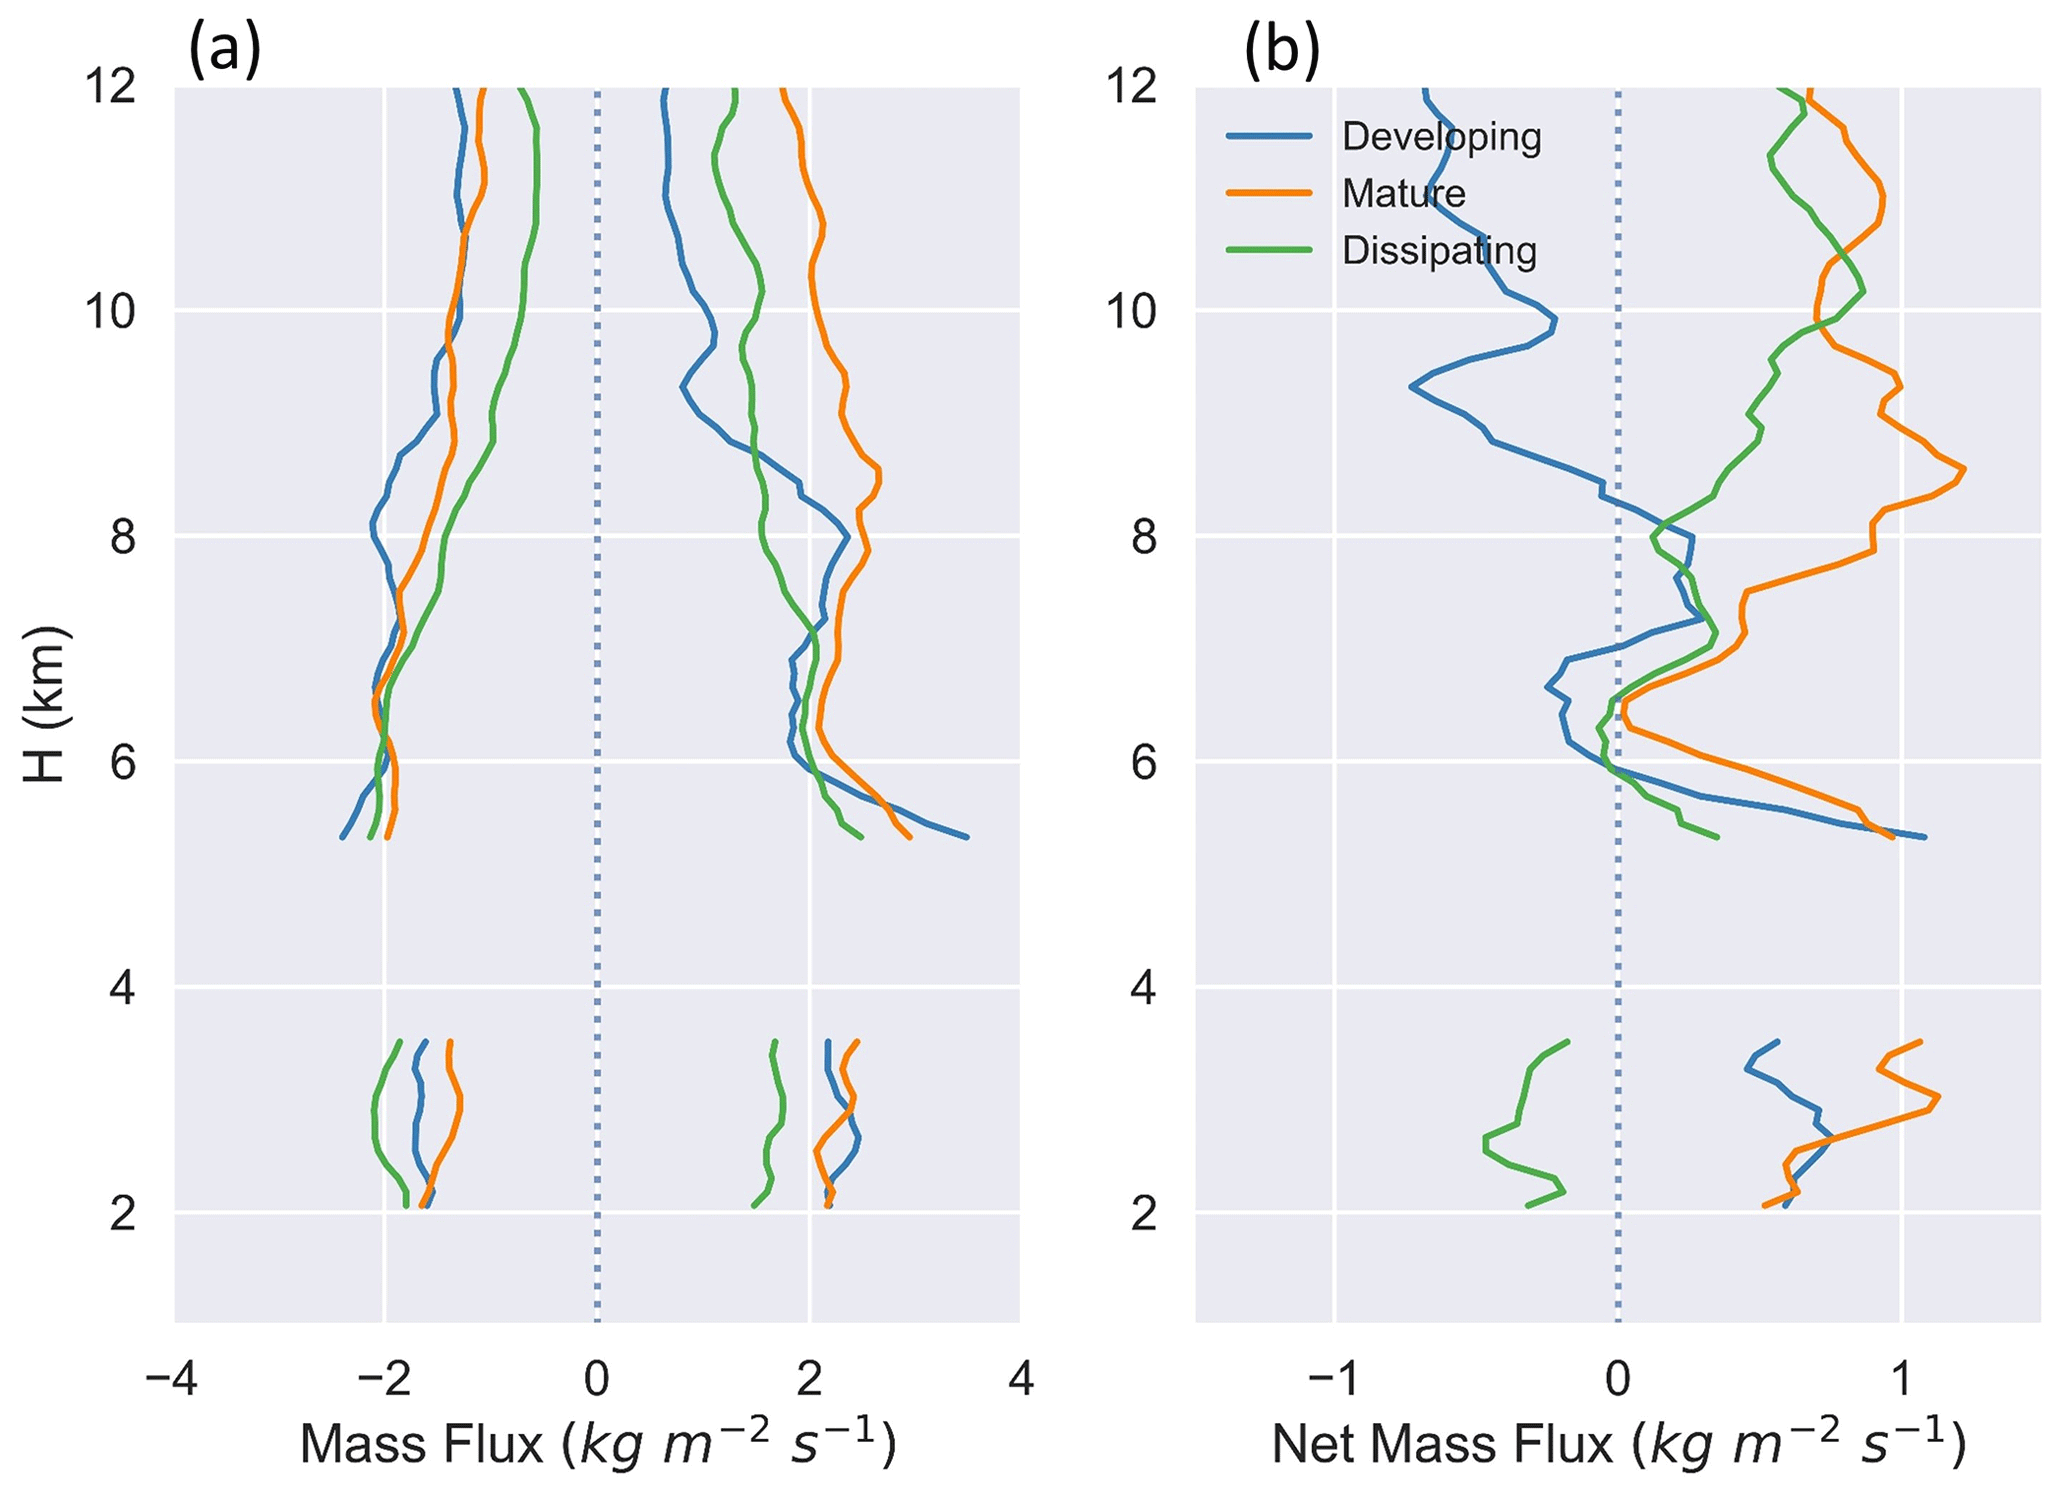
Figure 14Profiles of (a) upward (positive) and downward (negative) mass flux, and (b) net mass flux for developing, mature, and dissipating DCCs.
Mature DCCs exhibited the highest upward mass flux across lifecycle stages. These values corresponded to the strong updrafts for mature DCCs (Fig. 9b), along with higher p(w) for updrafts above the freezing level (Fig. 13). Dissipating DCCs had strong downdrafts and higher p(w) for downdrafts, leading to the highest downward mass flux we observed for this study, while weak updrafts at these times led to the lowest upward mass flux across all lifecycle stages (Fig. 14a). Consequently, dissipating DCCs displayed a negative net mass flux below the freezing level, whereas developing and mature DCCs displayed positive net mass flux (Fig. 14b). Just above the freezing level, the net mass flux was positive, with values decreasing with height up to about 6 km. High values of upward mass flux for developing DCCs were associated with higher p(w) for updrafts between 5 and 6 km, and strong updrafts (Fig. 9b). Above 6 km, our mature DCCs showed the highest upward mass flux, followed by dissipating and developing DCCs, respectively. This finding is consistent with the relative trends in the updraft strength for each stage (Fig. 9b) and their p(w) values with height (Fig. 13). Developing DCCs indicated the weakest updrafts between 6 and 9 km, leading to negative net mass flux at these levels. Above 10 km, mature and dissipating DCCs exhibited similar values of net mass flux due to weaker downdrafts, with lower p(w) for the latter. Developing DCCs displayed negative net mass flux above 9 km with the lowest upward mass flux (weak updrafts) and high downward mass flux (strong downdrafts).
In Fig. 15, we show profiles of the average upward, downward, and net mass transport rate contingent on lifecycle stage. Developing, mature, and dissipating DCCs had an average cell area of 46.7, 115.6, and 79.4 km2, respectively. Compared with mass flux, differences in the mass transport rate across lifecycle stages were enhanced by the influence of cell area. For example, the average upward mass flux for mature DCCs above 6 km was 1.6 times higher than for developing DCCs, while the upward mass transport rate was 6.4 times higher (Fig. 15), with the differences being statistically significant. Below the freezing level, dissipating DCCs had the lowest and also negative net mass transport rate ( kg s−1), while other stages had a positive net mass transport rate (6×10⁷ kg s−1). Above the freezing level, the net mass transport rate decreased with height for developing DCCs, with negative values above 7 km. Dissipating DCCs had low values up to 9 km (average of 2×10⁷ kg s−1) before the net mass transport rate increased at upper levels. Mature DCCs had the highest net mass transport rate above the freezing level (up to 30×107 kg s−1), while the other stages did not exceed 20×107 kg s−1. This disparity in the values was due to the mature DCCs having the highest upward and downward mass transport rates, with higher values for the former (Fig. 15).
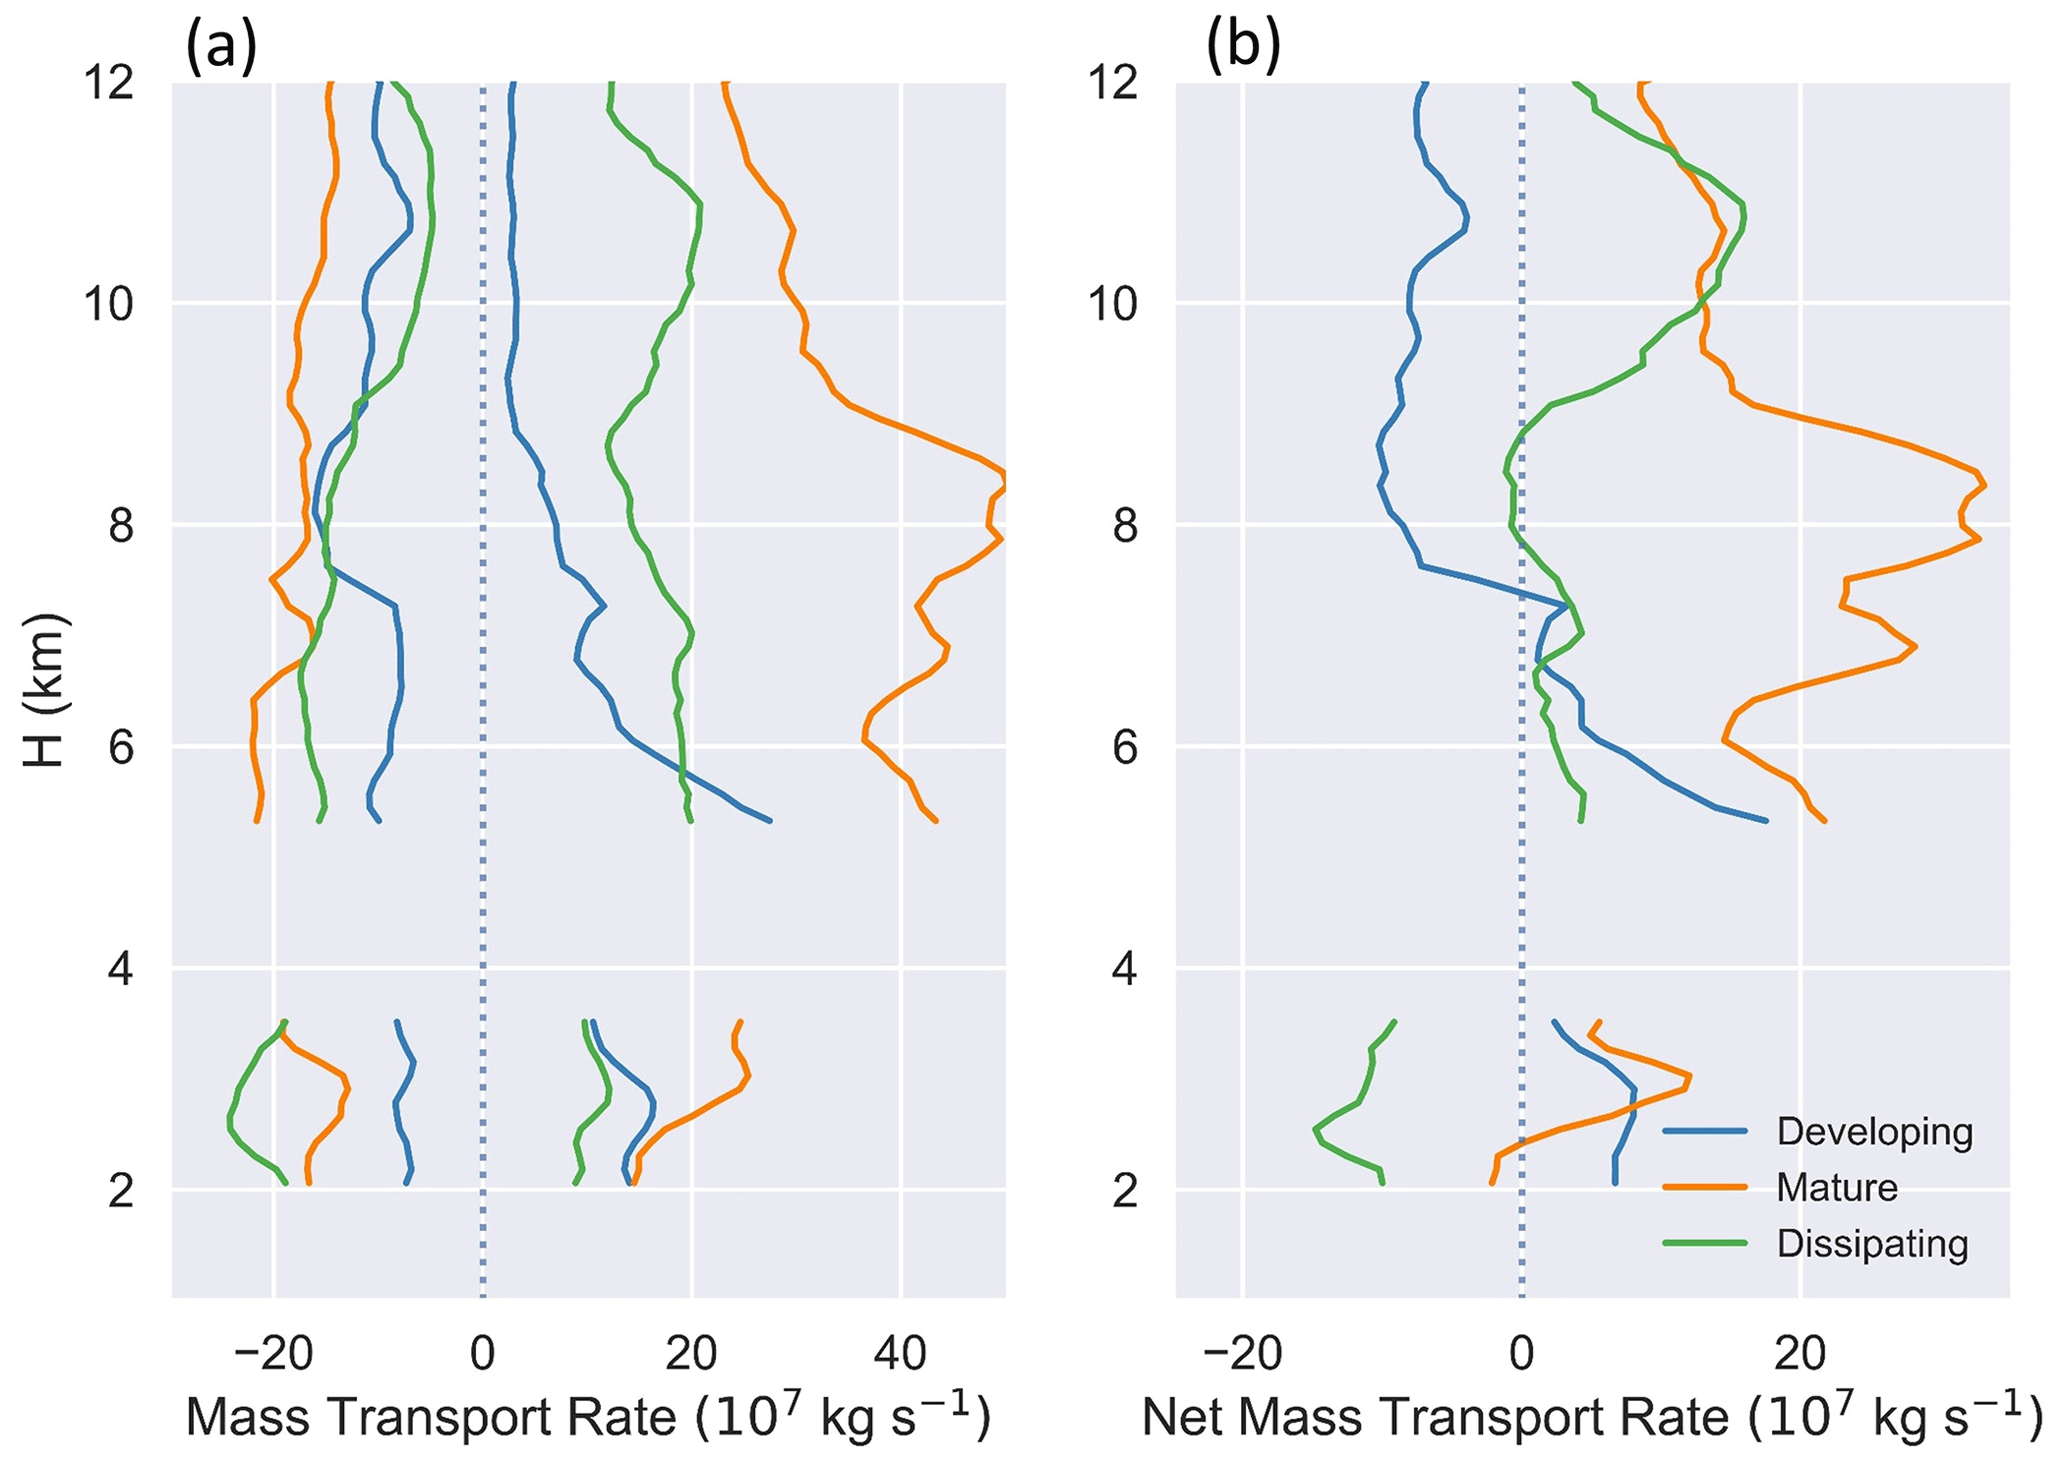
Figure 15Profiles of (a) upward (positive) and downward (negative) mass transport rate, and (b) net mass transport rate for developing, mature, and dissipating DCCs.
Figure 16 presents profiles of upward and downward mass transport rate for the dry and wet seasons. The seasonal variations in updraft and downdraft strength (Fig. 11) result in seasonal variability in the lifecycle trends of the mass transport rate. Below the freezing level, each lifecycle stage exhibited higher values of net mass transport rate during the dry season. Above the freezing level, developing DCCs demonstrated stronger updrafts during the dry season, which was reflected in the higher upward mass transport rate (the highest among the lifecycle stages) and positive mass transport rate up to 7 km (Fig. 16). Figure 17 presents profiles of net mass transport rate for the dry and wet seasons. In comparison, both dissipating and mature DCCs had stronger updrafts and a positive net mass transport rate during the wet season, while developing DCCs had a negative net mass transport rate (Fig. 17). This seasonal change in net mass transport rate for developing DCCs, driven by stronger updrafts during the dry season, meant that the temporal evolution of upward mass transport rate was consistent with convection intensity. Similar to the findings by Giangrande et al. (2023), a greater upward mass transport rate was observed during the first half of the DCC lifetime in the dry season and during the second half of the DCC lifetime in the wet season.
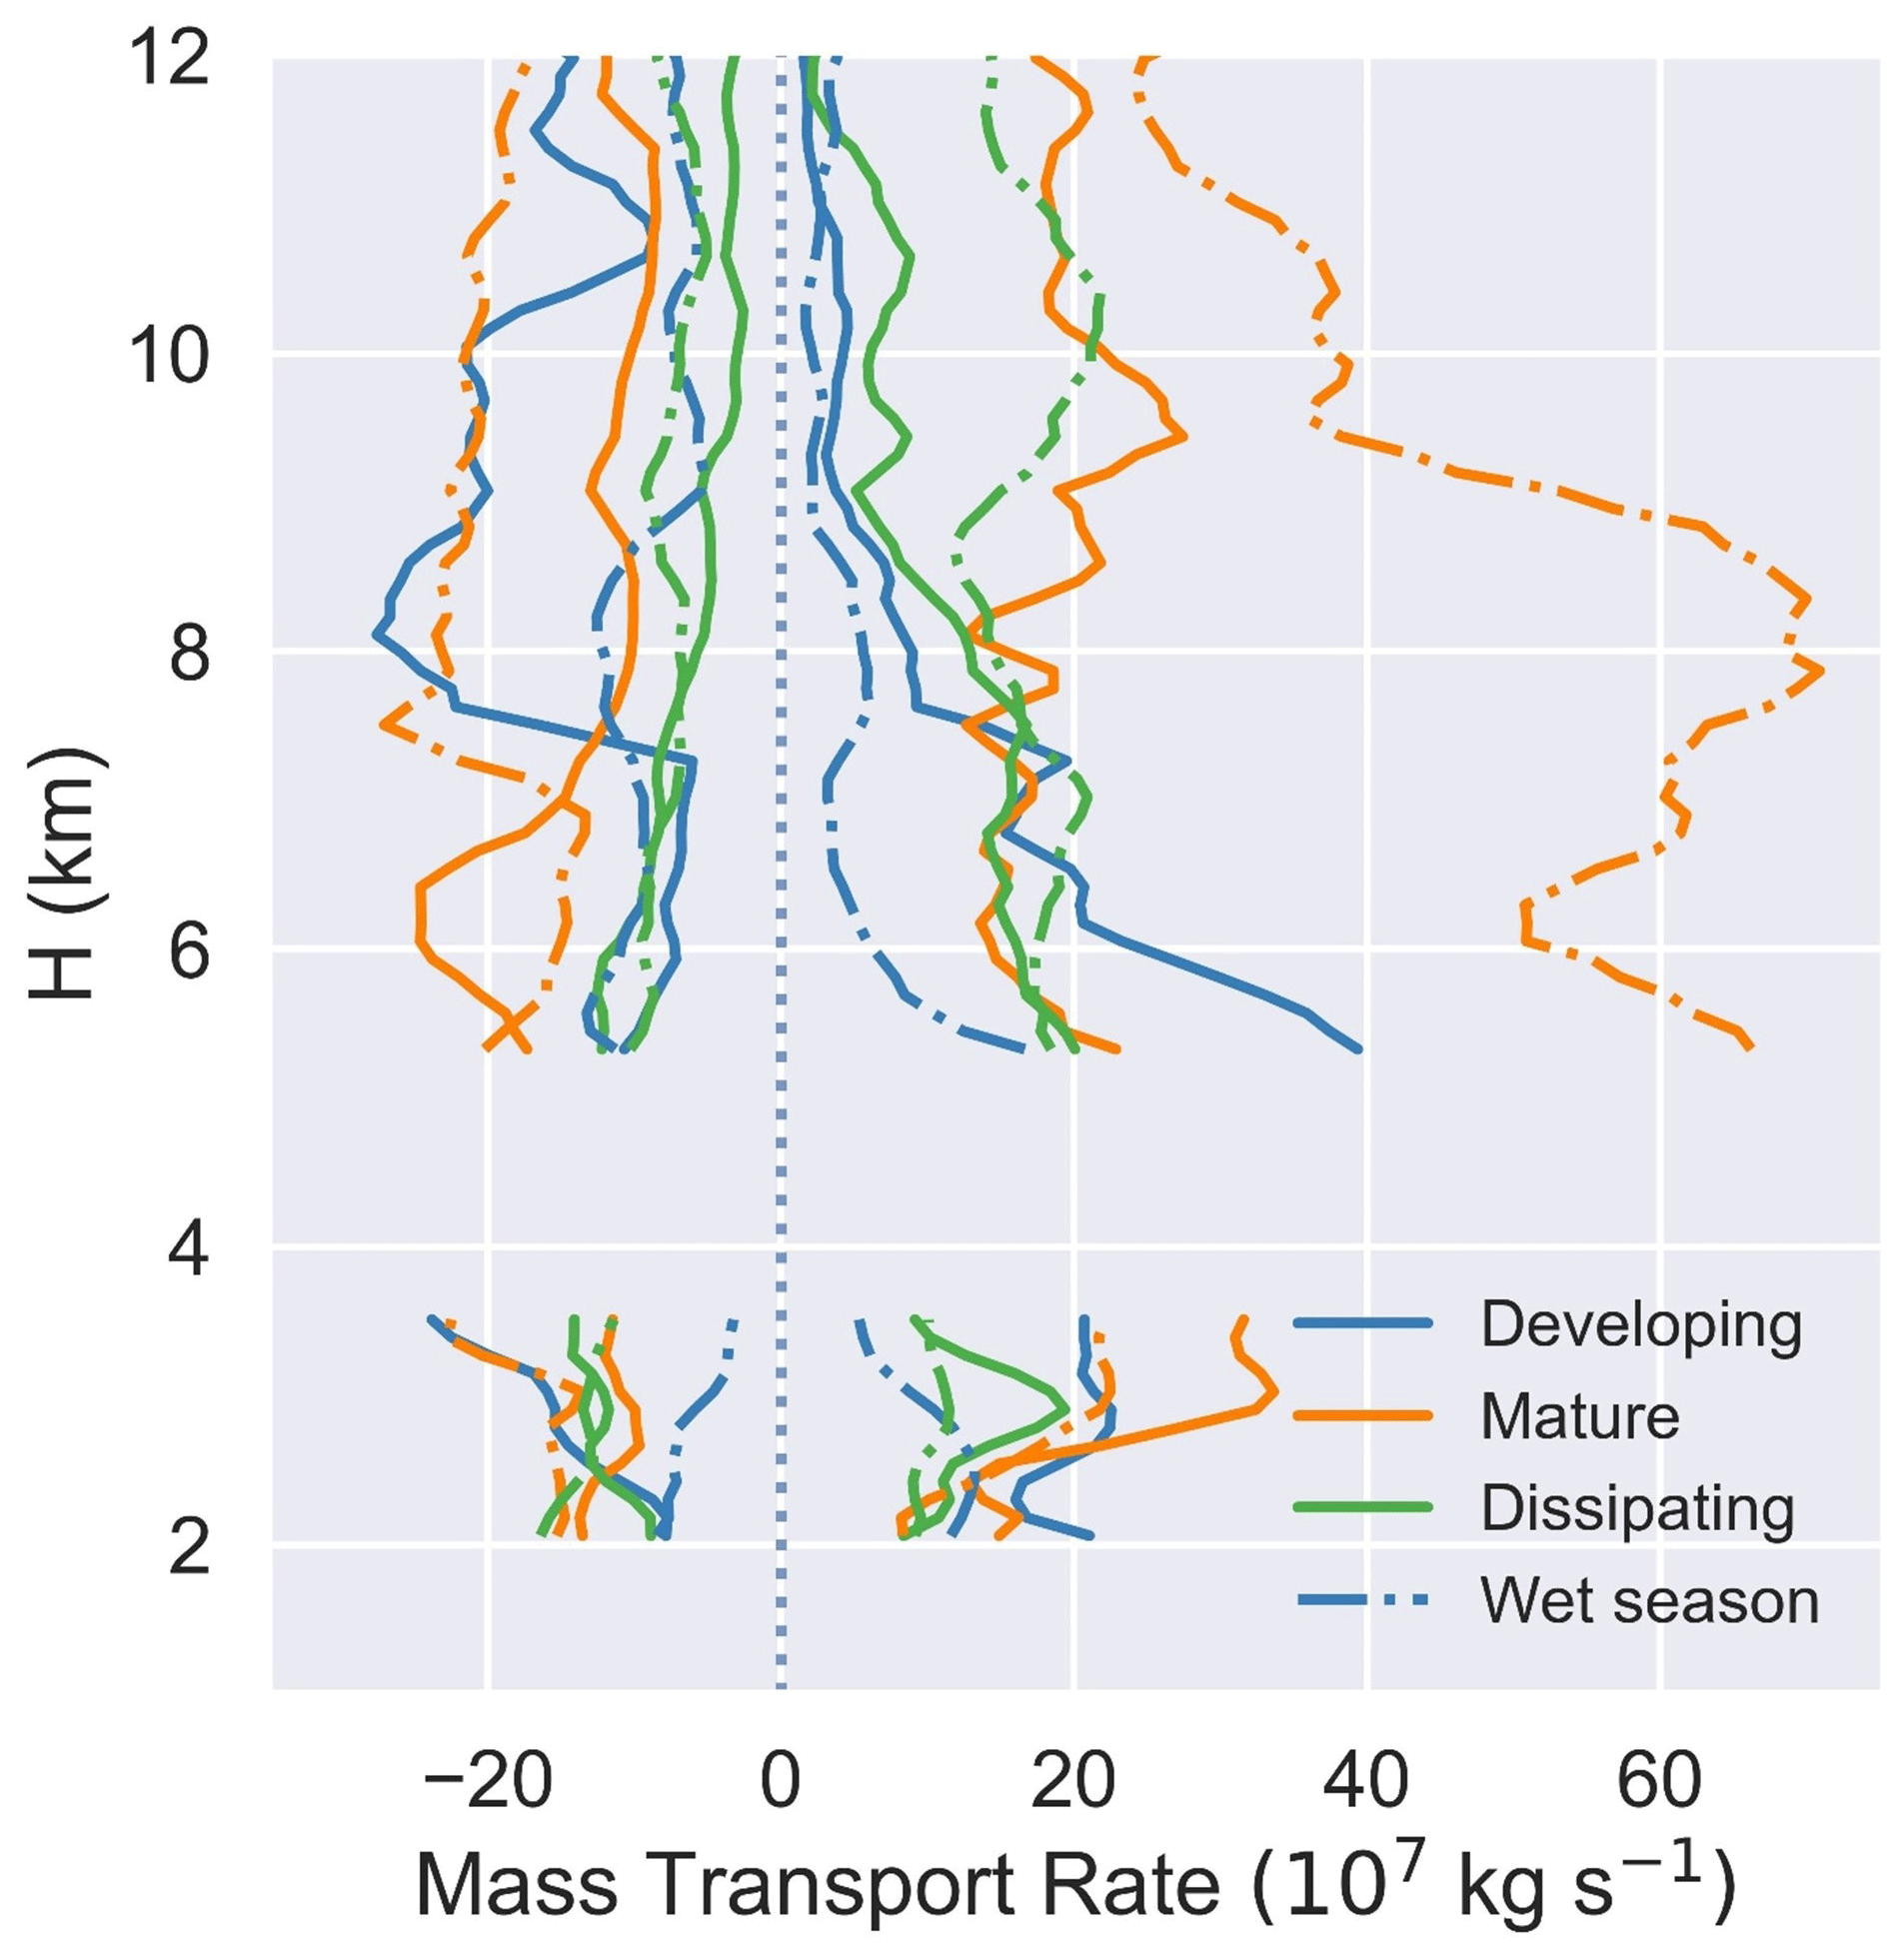
Figure 16Profiles of upward (positive) and downward (negative) mass transport rate for developing, mature, and dissipating DCCs from the dry season (solid lines) and wet season (dotted–dashed lines).
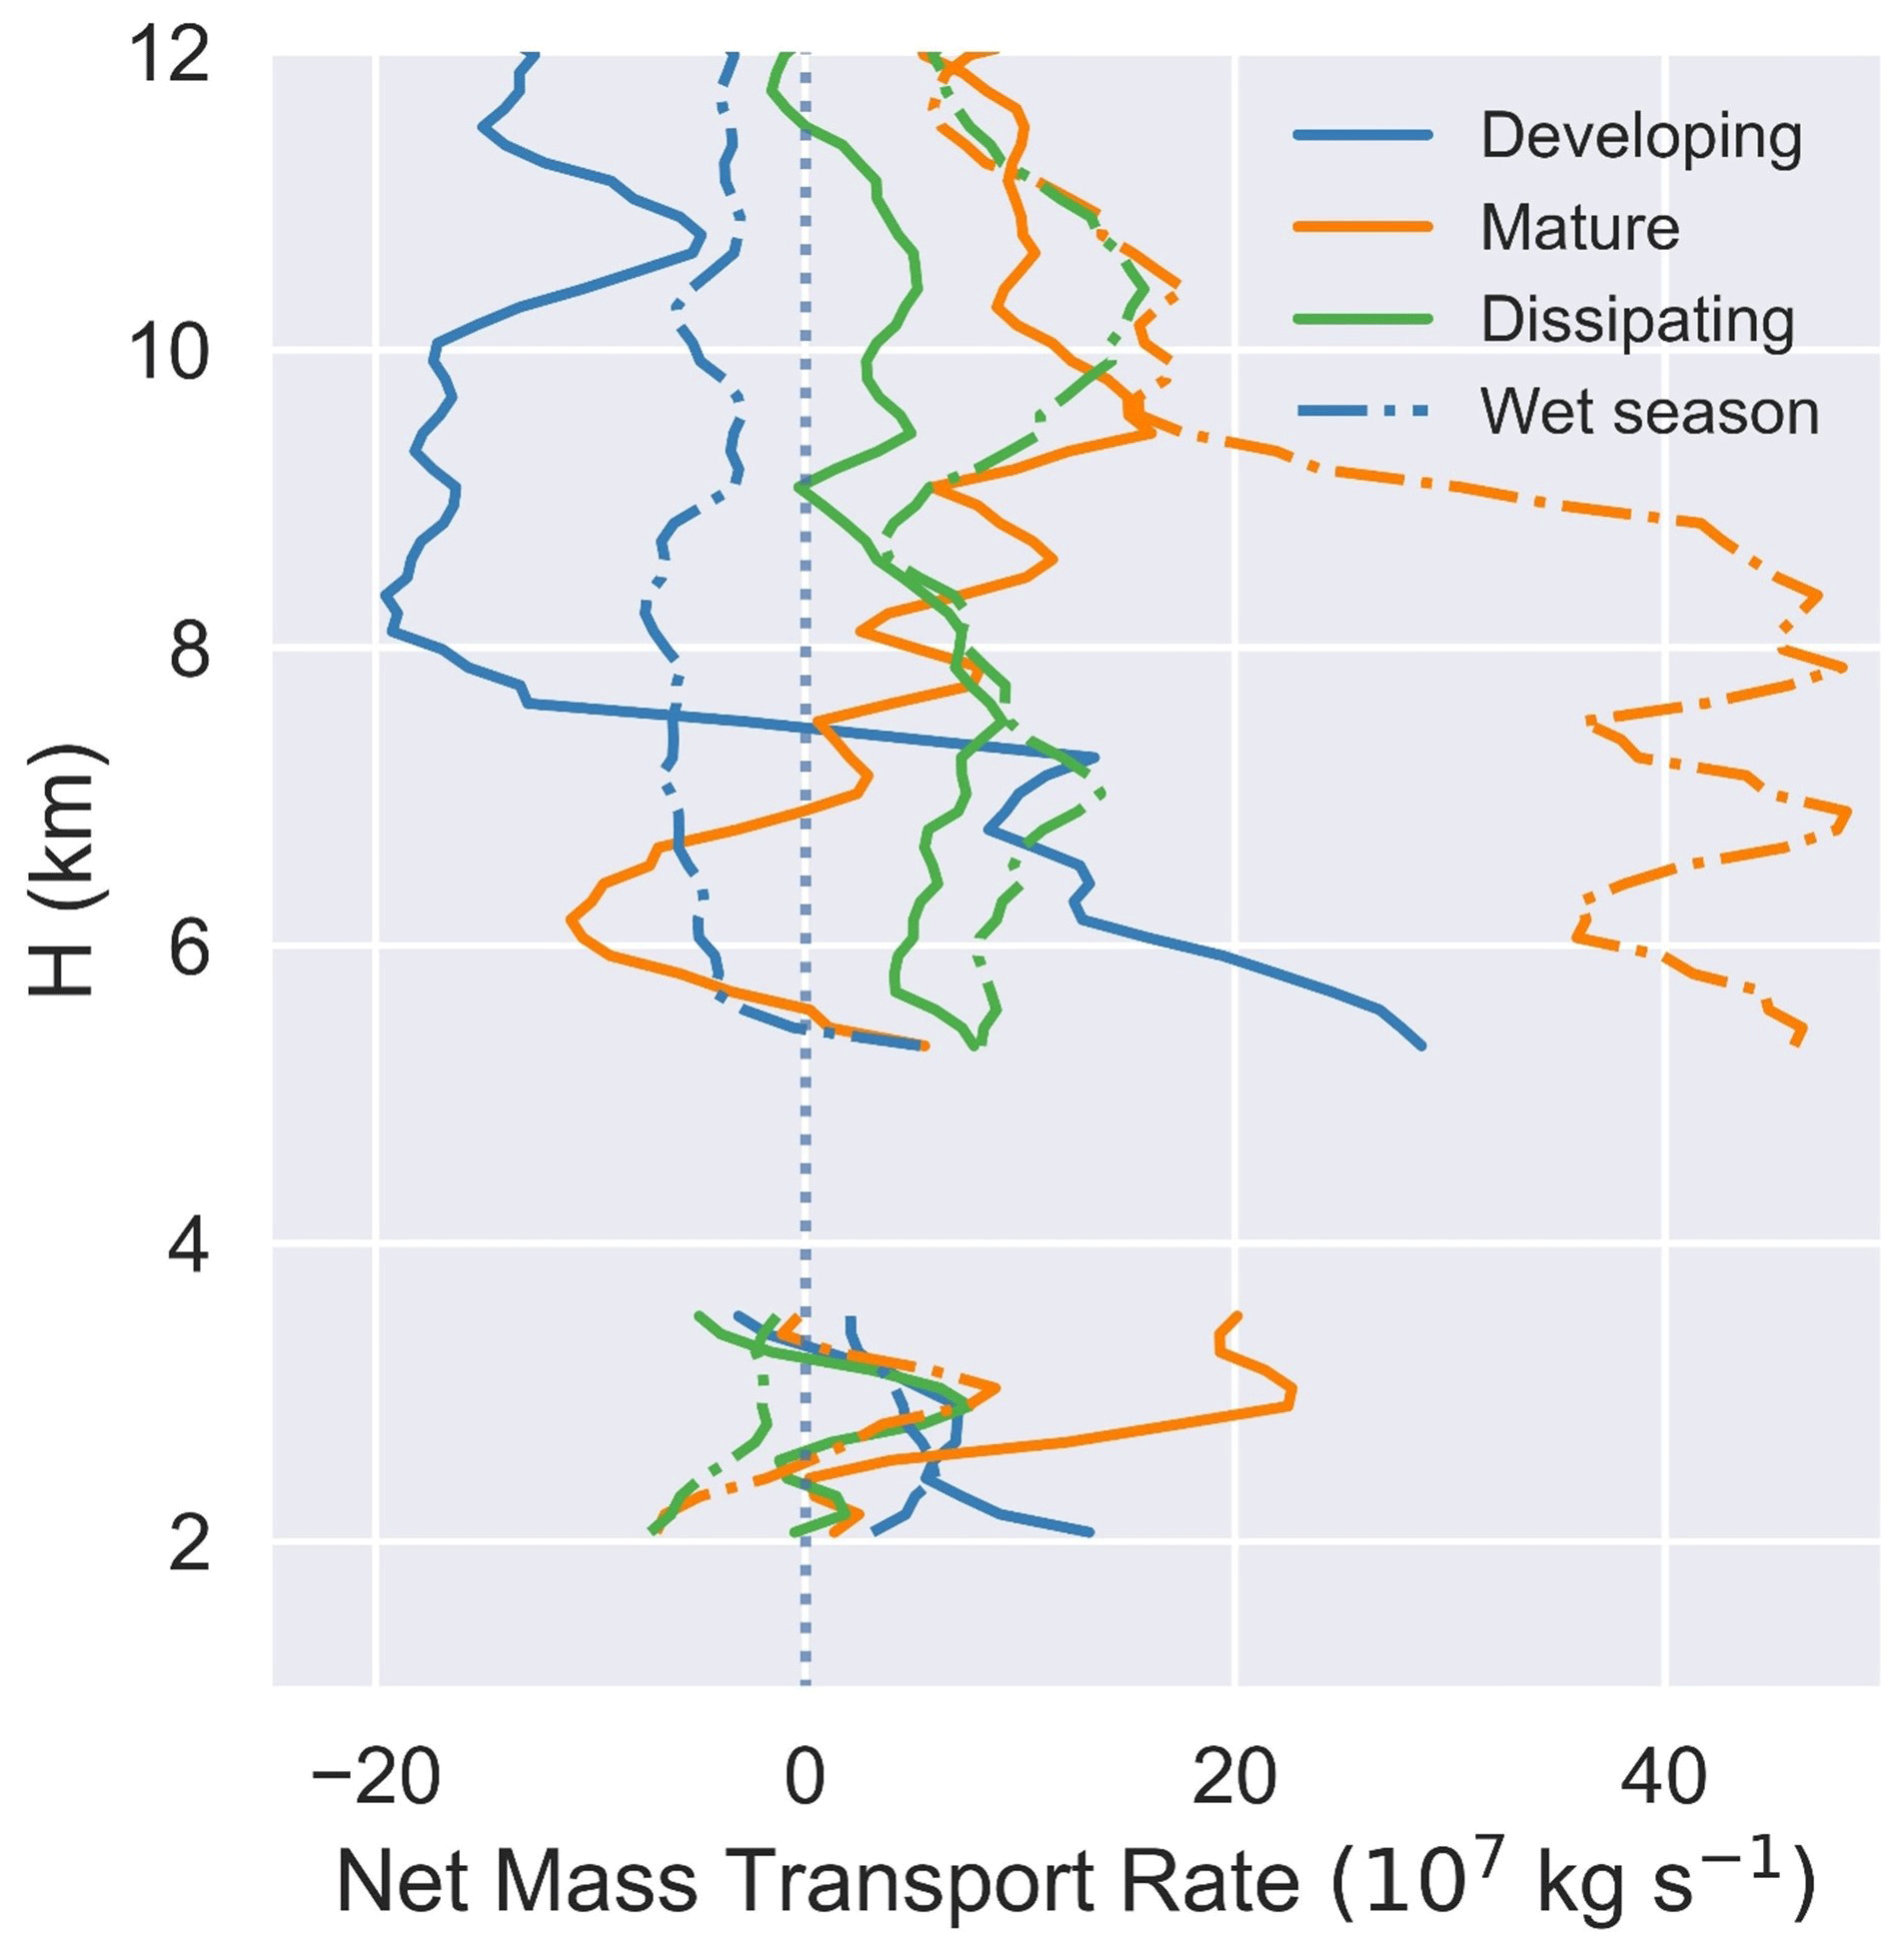
Figure 17Profiles of net mass transport rate for developing, mature, and dissipating DCCs from the dry season (solid lines) and wet season (dotted–dashed lines).
These results highlight the dependence of mass flux and transport rate profiles on the lifecycle trends in profiles of updraft and downdraft strength. The height of the maximum downward mass flux decreases over the DCC lifetime, whereas the height of the maximum net mass flux increases over the DCC lifetime. Lifecycle trends for net mass flux and transport rate below the freezing level are consistent with trends in convection strength and size at the 2 km altitude identified using cell tracking. Vertical variability in updraft strength contributes to an increase in the level of maximum net mass transport rate over the DCC lifetime, whereas the magnitude of the net mass transport rate is dependent on convection intensity in terms of Z and size in terms of cell area. Seasonality in updraft strength above the freezing level leads to the considerably higher net mass transport rate for developing DCCs during the dry season compared with the wet season. It is suggestive that a higher mass transport rate during the developing stage would lead to the observations of other stronger, instantaneous convective cloud behaviors (i.e., rainfall rates and maximum Z values) during the dry season events. During the wet season, a higher mass transport rate is observed once convection has matured, which likely affects the vertical extent more than the intensity of the convection.
3.3 Impact of DCCs on surface thermodynamics and rainfall
Amazonian DCCs can produce intense bursts of rainfall (dos Santos et al., 2014; Burleyson et al., 2016; Giangrande et al., 2017; Machado et al., 2018). The rainfall is associated with downward mass flux in convective downdrafts that may drive secondary convection triggered by cold pools through mechanical lifting or thermodynamic forcing (Khairoutdinov and Randall, 2006; Torri et al., 2015). Estimating the variability in rainfall rate over the DCC lifetime and its impact on surface fluxes is crucial for addressing model biases in convection initiation and development (Del Genio et al., 2012; Hagos et al., 2013). Instances with measurable precipitation, i.e., rainfall rate > 1 mm h−1, as defined by Giangrande et al. (2017), are considered in this study. The disdrometer had limited data availability before 24 September 2014, and the rainfall rate was not retrieved for 143 out of the 357 time steps. Two outliers with rainfall rate > 100 mm h−1 were filtered out. Table 2 provides a statistical summary of rainfall rates retrieved during the lifecycle stages. In line with lifecycle trends in convection size and intensity (Fig. 4), the number of samples with measurable precipitation and the average rainfall rate at the surface increased from the developing stage to the mature stage, and then decreased into the dissipating stage (Table 2).
To examine the impact of rainfall rate on surface thermodynamics, θe at the surface was calculated up to 1 h before or after DCC passage (Fig. 18). In Fig. 18, time 0 represents the time step when the DCC was simultaneously sampled by the SIPAM radar and the RWP at the MAO site. This is the time step for which we have the DCC lifecycle stage determined from the cell tracking. It is assumed that the RWP sufficiently sampled the updraft core of the DCC at this time step, as the RWP sampling for the DCC passed our selection criteria in Sect. 2.5. The temporal evolution of surface θe follows a pattern outlined by Barnes and Sieckman (1984). The surface θe exhibited an “environmental” phase characterized by fair-weather values for θe with a slightly negative or negligible temporal gradient (). This was followed by a “convectively active” phase where rapid cooling at the surface occurred, associated with a negative with a higher magnitude that eventually approached zero. The high magnitude of during this phase represents the injection of ambient low θe air from the free troposphere into the boundary layer by the convective downdraft (Houze, 2004). Finally, the “wake” phase was observed when became positive as θe started recovering toward fair-weather values, indicating the dissipation of convection. The phases of θe varied in their timing across lifecycle stages, and showed temporal variations associated with Z and rainfall rate (Fig. 18).
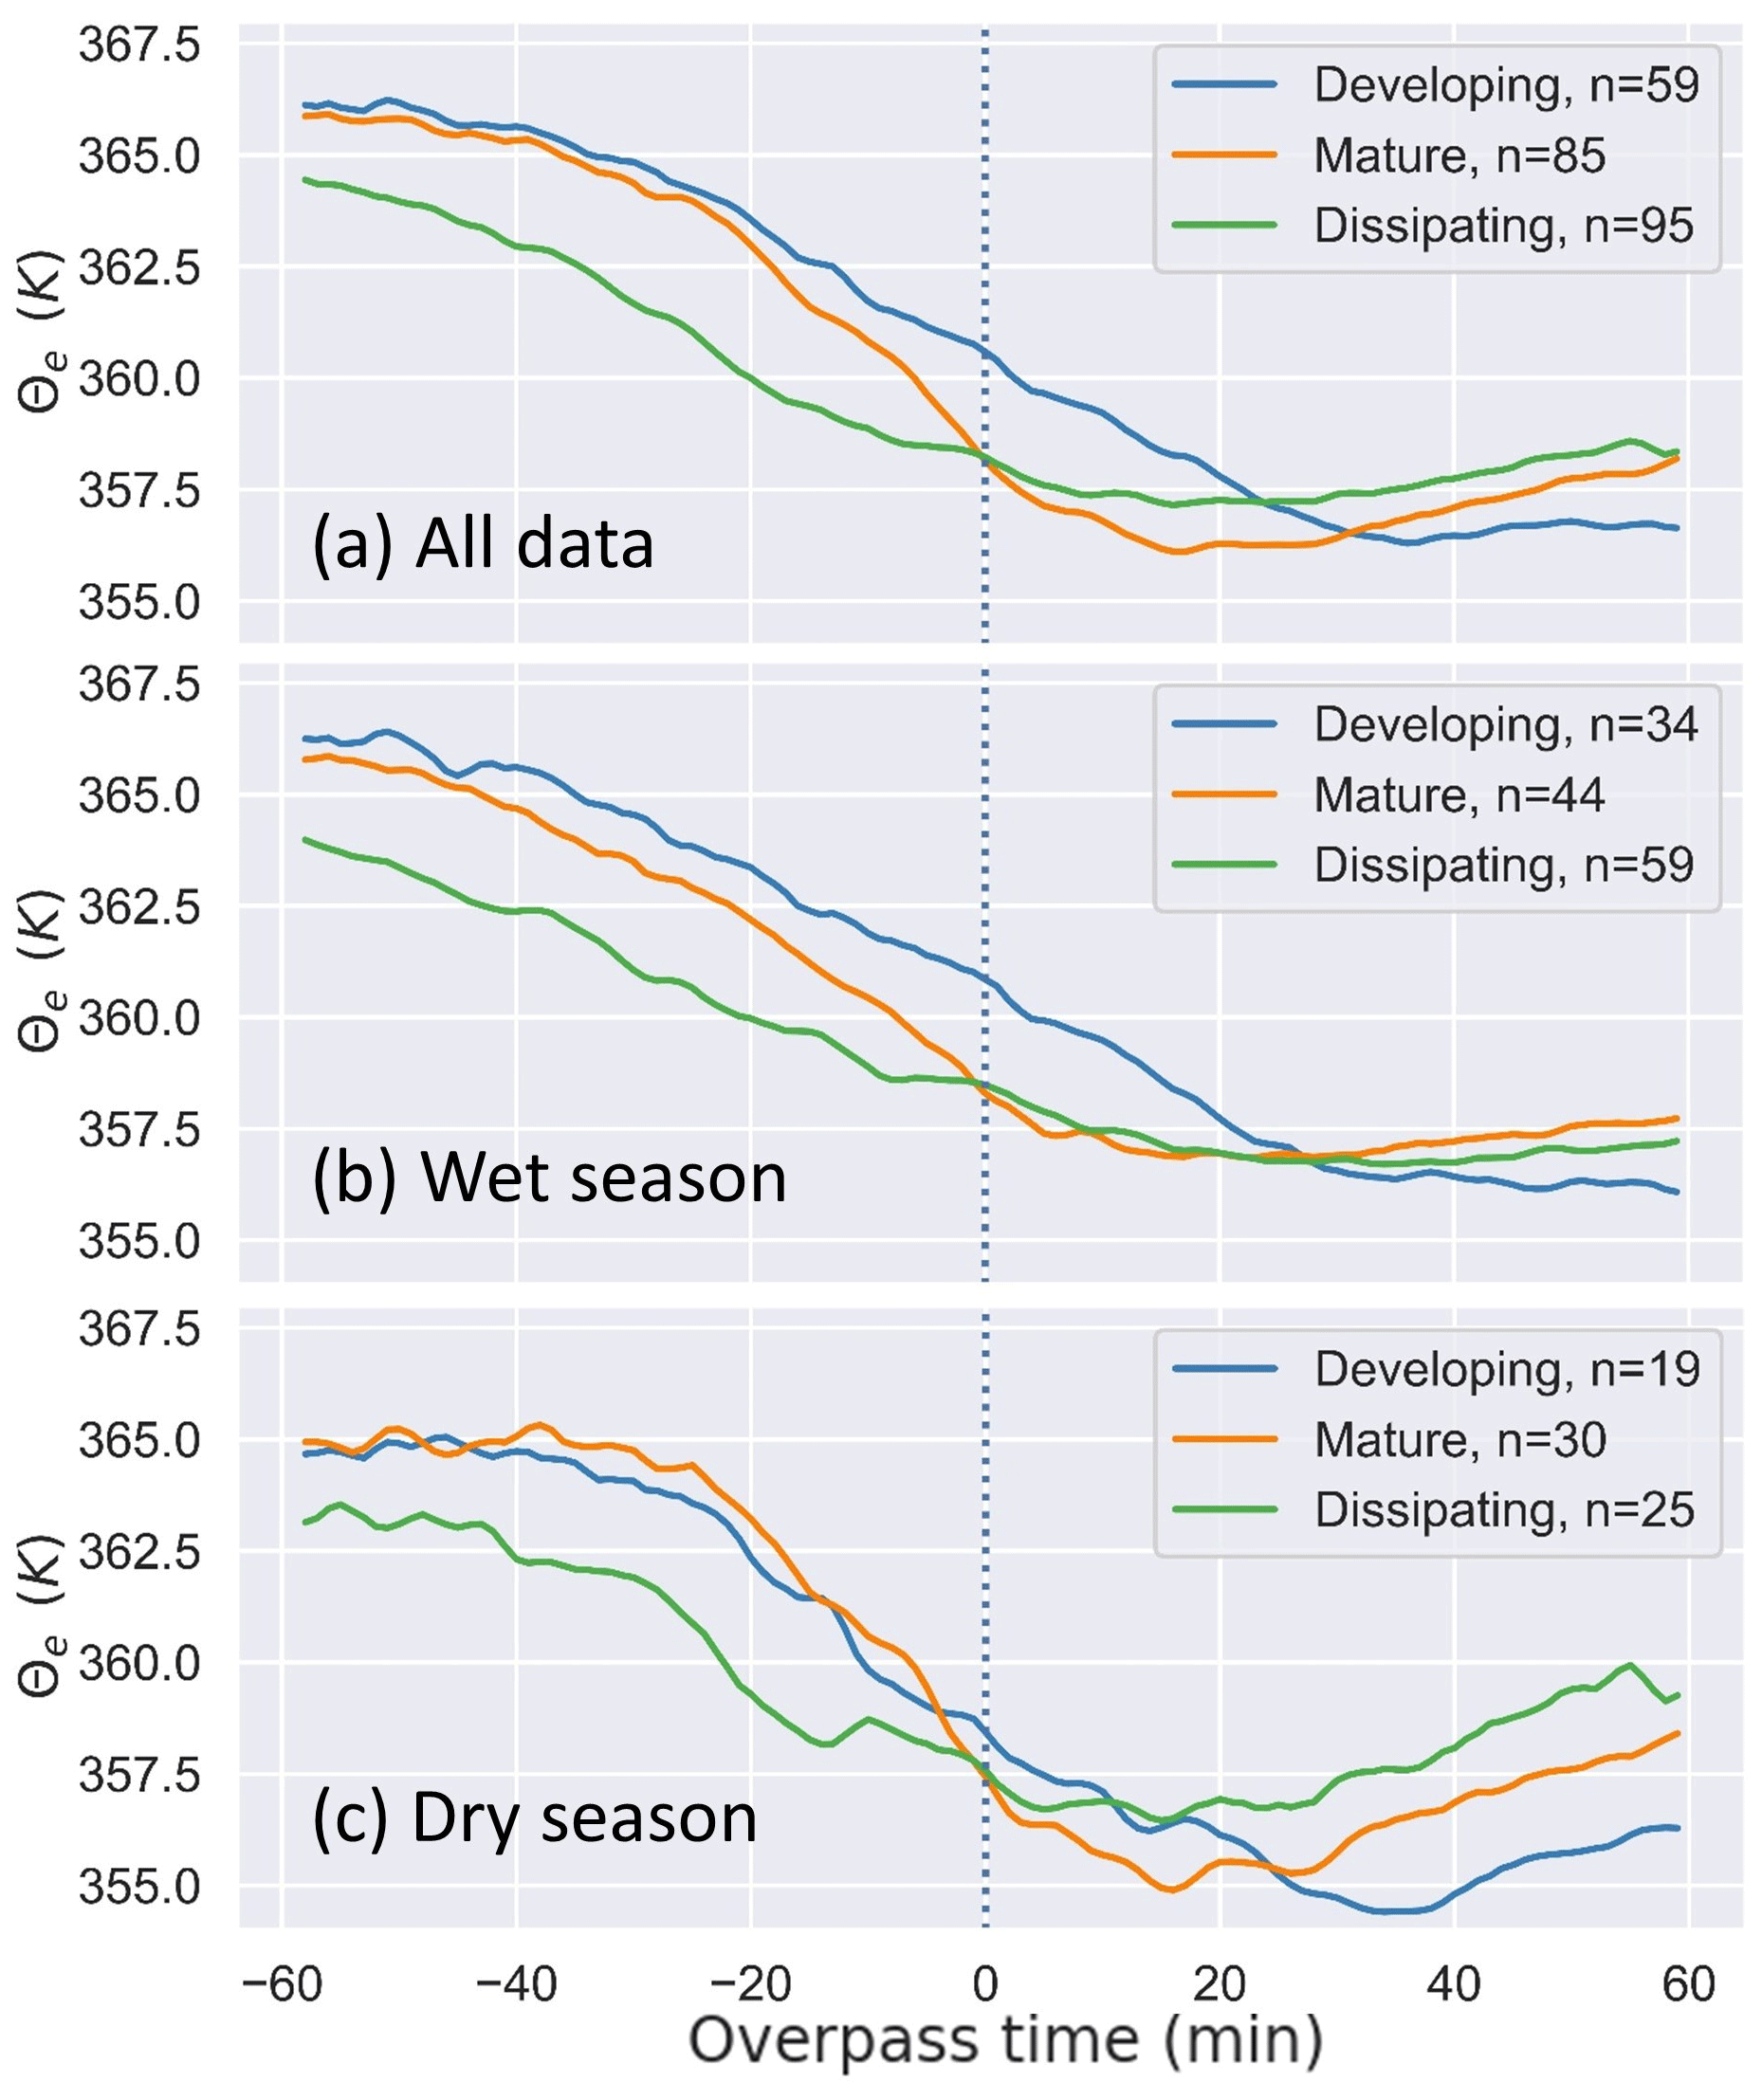
Figure 18Time series of surface equivalent potential temperature (Θe) up to 1 h before and after DCC passage over the RWP.
Developing and mature DCCs had similar θe (366 K) 1 h before the DCC overpass (Fig. 18a). For developing DCCs, there was a gradual transition to the “convectively active” phase that started 30 min before the DCC overpass, ended 35 min after, and θe decreased by 8.6 K during this phase. Afterwards, θe remained nearly constant and the “wake” phase was not observed up to 1 h after the overpass time. On the other hand, mature DCCs had a shorter “convectively active” phase, which started 20 min before and ended 15 min after the DCC overpass, with θe decreasing by 6.7 K. As a reference, during the passage of mature Amazon MCSs, stronger drops in θe of around 10 K have been observed (Wang et al., 2019). Nevertheless, the observed magnitudes of for mature, isolated DCCs were 50 % higher than those for developing isolated DCCs, consistent with stronger precipitation and downward mass transport rate associated with downdrafts in mature DCC phases (Fig. 15; Table 2). For mature isolated DCCs, the “wake” phase was observed as θe and started to increase about 30 min after the DCC overpass. For dissipating cells, θe was 1.5 K lower initially, the minimum θe was 1 K higher, and the “convectively active” and “wake” phases started earlier than other lifecycle stages. Dissipating DCCs exhibited the lowest , indicating weak precipitation, and had the highest θe at the end of the time series. This suggests that there was a faster recovery of θe as convection dissipated.
The observation of stronger deep convection during the dry season (Fig. 7) was reflected in the surface θe values. During the dry season, each lifecycle stage exhibited a longer “environmental” phase, with low up to (at minimum) 25 min before the DCC overpass, and a shorter “convectively active” phase associated with higher magnitudes of compared with the wet season (Fig. 18b and c). The higher magnitudes of during the dry season are indicative of stronger outflows associated with downdrafts within the stronger convection. The shorter duration of the active phase is likely associated with a shorter duration of more intense surface rainfall rates. The impact of deep convection at the surface was thus proportional to convection intensity and updraft strength. The earlier peak in convection intensity (Fig. 11) and mass transport rate (Fig. 16) during the dry season, with stronger developing DCCs compared with the wet season, was reflected in the evolution of surface θe. Developing DCCs showed the strongest seasonality in terms of θe, with a lower minima and higher during the dry season. The minima for developing and mature DCCs during the dry season (354.4 and 354.9 K observed 15 and 33 min after the DCC overpass, respectively) was 2 K lower than the corresponding wet season values at the same time. During the wet season, was lower due to weaker convection, and the minimum θe was higher due to higher rainfall rates with more intense rainfall periods (e.g., Machado et al., 2018), while the recovery of θe was weaker (less than 1 K compared with over 3 K during the dry season).
This study examined the seasonal and temporal evolution of isolated deep convection in the Amazon rainforest during GoAmazon2014/5 near Manacapuru, Brazil. The focus was on isolated DCCs with Z exceeding 30 dBZ which were tracked using the tobac algorithm. Tracking-based insights into the DCC lifecycle were used to evaluate RWP measurements of DCC kinematic properties. The analysis examined the lifecycle stages of convection on days when isolated DCCs were present. DCCs within a 20 km radius, with lifetime exceeding 36 min, were tracked. The kinematic properties of tracked DCCs were examined as a function of DCC lifetime, convection initiation time, height, and local seasons. The key findings are listed below.
-
The propagation speed of isolated DCCs increased slightly as the DCC lifetime progressed. Regarding Z, area, and rainfall rate, they increased from the developing stage to the mature stage of convection before decreasing during the dissipating stage. Afternoon DCCs were more frequent, stronger, and larger compared with morning or pre-sunrise DCCs.
-
Based on observations from MAO, mature DCCs exhibited the strongest updrafts and the highest Z, rainfall rates, mass flux, and mass transport rates, and most frequently had rainfall rates exceeding 1 mm h−1. Developing DCCs had the weakest convection with weak updrafts above the melting layer as well as negative mass flux and mass transport rates at upper levels.
-
The variations in DCC strength and size over the lifecycle stages were associated with updraft strength above the melting layer. Above 8 km, mature DCCs had the strongest updrafts (12.6 m s−1) and highest mass flux and mass transport rates, followed by dissipating DCCs (7.4 m s−1) with positive mass flux and mass transport rates, and developing DCCs (3.2 m s−1) with negative mass transport rates and mass flux.
-
The height of the maximum downward mass flux decreases over the DCC lifetime, whereas the height of the maximum net mass flux increases over the DCC lifetime. Vertical variability in updraft strength contributes to an increase in the level of maximum net mass transport rate over the DCC lifetime.
-
Developing and mature DCCs had similar θe values before the DCC overpass. For mature DCCs, was 50 % higher over a shorter convectively active phase compared with developing DCCs. Dissipating DCCs had lower θe values before the DCC overpass, lower associated with lower R, and higher θe values as the convection dissipated.
-
The dry season exhibited stronger, faster, more isolated, and larger DCCs than the wet season. During the dry season, developing DCCs were stronger than mature and dissipating DCCs with the strongest updrafts and highest upward mass transport rates. During the wet season, developing DCCs had the weakest updrafts and negative mass transport rates. Mature and dissipating DCCs, on the other hand, were stronger during the wet season, with positive mass transport rates and stronger updrafts above the melting layer.
-
Stronger convection was observed with greater upward mass transport rates during the first (second) half of the DCC lifetime during the dry (wet) season.
Previous studies used GoAmazon2014/5 data to examine the shallow to deep convection transition (Ghate and Kollias, 2016; Biscaro et al., 2021; Tian et al., 2021; Barber et al., 2022) and the diurnal cycle of precipitation (Giangrande et al., 2017; Tai et al., 2021; Tian et al., 2022). The vertical extent and maintenance of Amazonian DCCs are linked to surface fluxes, vertical wind shear, free tropospheric humidity, low-level cloudiness, and cold pools (Tai et al., 2021; Tian et al., 2021, 2022; Barber et al., 2022). Giangrande et al. (2023) tracked a subset of the DCCs examined in this study to employ the unique vertical velocity dataset from GoAmazon2014/5 for days when radiosondes were launched ahead of the DCC overpass. Their study attributed differences in convection draft strength during different seasons and lifecycle stages to low-level atmospheric stability, graupel formation/loading, and seasonal differences in the humidity profile. This study complements their conclusions and expands upon these insights by analyzing profiles of vertical mass flux and transport rate. The results presented in Sect. 3 can help guide model parameterization development (Del Genio et al., 2012) by analyzing a larger set of cells with the results being applicable over a wider range of convection events.
Model estimates of the strength, longevity, and radiative impacts of DCCs depend on the vertical transport of mass and momentum within DCC cores. However, few datasets are available to examine DCC kinematics and vertical air motion throughout the DCC lifetime as deep convection initiates, matures, and dissipates. This study presents the lifecycle trends of mass flux and transport rate profiles at finer resolution compared with current climate models. For example, Khairoutdinov and Randall (2006) used a vertical resolution of 50–250 m. Incorporating the variations in the level of maximum downward or net mass transport rate as a function of DCC lifetime can help address model biases like premature triggering of deep convection (Del Genio et al., 2012) and its anomalously fast dissipation (Khairoutdinov and Randall, 2006). Future work will examine profiles of mass flux and updraft strength across aerosol and thermodynamic conditions to test aerosol invigoration hypotheses. This will form a critical step toward addressing aerosol effects on convection vigor and the variability of the aerosol effects over the DCC lifetime (Igel and van den Heever, 2021). With updates to open-source tracking algorithms, three-dimensional cell tracking will help estimate cell volume and cell area at different vertical levels. Uncertainties associated with calculating mass transport rates with the assumption of the cell area being constant with height can then be evaluated.
The tobac algorithm is available at https://doi.org/10.5281/zenodo.10863405 (tobac Community, 2024; Heikenfeld et al., 2019). MetPy is available at https://github.com/Unidata/MetPy/ (Unidata, 2024; May et al., 2022).
The SIPAM S-band radar data are available at http://ftp.cptec.inpe.br/chuva/goamazon/experimental/level_2/eq_radar/esp_band_s/st_sipam/ (CENSIPAM, 2024) with information on the calibration offsets and data availability. The calibrated RWP data are available at https://doi.org/10.5439/1440997 (Giangrande, 2018). The merged RWP and W-band radar cloud mask and type are available at https://doi.org/10.5439/1462693 (Feng and Giangrande, 2018). The laser disdrometer data are available at https://doi.org/10.5439/1432694 (Hardin et al., 2019).
The supplement related to this article is available online at: https://doi.org/10.5194/acp-24-4487-2024-supplement.
DW and SG designed the study. SG conducted the analysis and wrote the manuscript with input from DW. TSB provided the gridded SIPAM radar dataset. SEG, TSB, and MPJ provided guidance during data analysis and reviewed the manuscript.
The contact author has declared that none of the authors has any competing interests.
Publisher's note: Copernicus Publications remains neutral with regard to jurisdictional claims made in the text, published maps, institutional affiliations, or any other geographical representation in this paper. While Copernicus Publications makes every effort to include appropriate place names, the final responsibility lies with the authors.
This paper has been authored by employees of Brookhaven Science Associates, LLC, under contract DESC0012704 with the US Department of Energy (DOE). This project was supported by the US DOE Atmospheric System Research (ASR) program. We also acknowledge the Atmospheric Radiation Measurement (ARM) program, a user facility of the US DOE, Office of Science, sponsored by the Office of Biological and Environmental Research. We would like to acknowledge the DOE Early Career Research Program and the ARM GoAmazon2014/5 operations and science teams. We would like to thank CENSIPAM (Centro Gestor e Operacional do Sistema de Proteção da Amazônia) for providing the Manaus SIPAM radar data.
This research has been supported by the US Department of Energy (grant no. DESC0012704).
This paper was edited by Johannes Quaas and reviewed by two anonymous referees.
Allan, D. B., Caswell, T., Keim, N. C., van der Wel, C. M., and Verweij, R. W.: soft-matter/trackpy: v0.6.1 (v0.6.1), Zenodo [code], https://doi.org/10.5281/zenodo.7670439, 2023.
Andreae, M. O., Rosenfeld, D., Artaxo, P., Costa, A. A., Frank, G. P., Longo, K. M., and Silva-Dias, M. D.: Smoking rain clouds over the Amazon, Science, 303, 1337–1342, https://doi.org/10.1126/science.1092779, 2004.
Barber, K. A., Burleyson, C. D., Feng, Z., and Hagos, S. M.: The Influence of Shallow Cloud Populations on Transitions to Deep Convection in the Amazon, J. Atmos. Sci., 79, 723–743, 2022.
Barichivich, J., Gloor, E., Peylin, P., Brienen, R. J. W., Schöngart, J., Espinoza, J. C., and Pattnayak, K. C.: Recent intensification of Amazon flooding extremes driven by strengthened Walker circulation, Sci. Adv., 4, eaat8785, https://doi.org/10.1126/sciadv.aat8785, 2018.
Barnes, G. M. and Sieckman, K.: The Environment of Fast- and Slow-Moving Tropical Mesoscale Convective Cloud Lines, Mon. Weather Rev., 112, 1782–1794, https://doi.org/10.1175/1520-0493(1984)112<1782:TEOFAS>2.0.CO;2, 1984.
Betts, A., Fisch, G., Von Randow, C., Silva Dias, M., Cohen, J., Da Silva, R., and Fitzjarrald, D.: The Amazonian boundary layer and mesoscale circulations, Amazonia and Global Change, Geophysical Monograph Series, AGU – American Geophysical Union, 163–181, https://doi.org/10.1029/2008GM000720, 2009.
Biscaro, T. S., Machado, L. A. T., Giangrande, S. E., and Jensen, M. P.: What drives daily precipitation over the central Amazon? Differences observed between wet and dry seasons, Atmos. Chem. Phys., 21, 6735–6754, https://doi.org/10.5194/acp-21-6735-2021, 2021.
Bolton, D.: The computation of equivalent potential temperature, Mon. Weather Rev., 108, 1046–1053, 1980.
Bony, S., Stevens, B., Frierson, D. M. W., Jakob, C., Kageyama, M., Pincus, R., Shepherd, T. G., Sherwood, S. C., Siebesma, A. P., Sobel, A. H., Watanabe, M., and Webb, M. J.: Clouds, circulation and climate sensitivity, Nat. Geosci., 8, 261–268, 2015.
Burleyson, C. D., Feng, Z., Hagos, S. M., Fast, J., Machado, L. A. T., and Martin, S. T.: Spatial Variability of the Background Diurnal Cycle of Deep Convection around the GoAmazon2014/5 Field Campaign Sites, J. Appl. Meteorol. Clim., 55, 1579–1598, https://doi.org/10.1175/JAMC-D-15-0229.1, 2016.
Byers, H. R. and Braham Jr,, R. R.: The Thunderstorm, Report of the Thunderstorm Project, 1946 and 1947, Government Printing Office, Washington, DC, https://books.google.com/books/about/The_Thunderstorm.html?id=D8sJAQAAIAAJ (last access: 11 April 2024), 1949.
Caldwell, P. M., Terai, C. R., Hillman, B., Keen, N. D., Bogenschutz, P., Lin, W., Beydoun, H., Taylor, M., Bertagna, L., Bradley, A. M., Clevenger, T. C., Donahue, A. S., Eldred, C., Foucar, J., Golaz, J.-C., Guba, O., Jacob, R., Johnson, J., Krishna, J., Liu, W., Pressel, K., Salinger, A. G., Singh, B., Steyer, A., Ullrich, P., Wu, D., Yuan, X., Shpund, J., Ma, H.-Y., and Zender, C. S.: Convection permitting simulations with the E3SM global atmosphere model, J. Adv. Model. Earth Syst., 13, e2021MS002544, https://doi.org/10.1029/2021MS002544, 2021.
Cecchini, M. A., Machado, L. A. T., Comstock, J. M., Mei, F., Wang, J., Fan, J., Tomlinson, J. M., Schmid, B., Albrecht, R., Martin, S. T., and Artaxo, P.: Impacts of the Manaus pollution plume on the microphysical properties of Amazonian warm phase clouds in the wet season, Atmos. Chem. Phys., 16, 7029–7041, https://doi.org/10.5194/acp-16-7029-2016, 2016.
CENSIPAM: Index of /chuva/goamazon/experimental/level_2/eq_radar/esp_band_s/st_sipam, Amazon Protection System Operational Center [Centro Gestor e Operacional do Sistema de Proteção da Amazônia (CENSIPAM)] [data set], http://ftp.cptec.inpe.br/chuva/goamazon/experimental/level_2/eq_radar/esp_band_s/st_sipam/ (last access: 12 April 2024), 2024.
Chen, D., Rojas, M., Samset, B. H., Cobb, K., Diongue Niang, A., Edwards, P., Emori, S., Faria, S. H., Hawkins, E., Hope, P., Huybrechts, P., Meinshausen, M., Mustafa, S. K., Plattner, G.-K., and Tréguier, A.-M.: Framing, Context, and Methods, in Climate Change 2021: The Physical Science Basis, Contribution of Working Group I to the Sixth Assessment Report of the Intergovernmental Panel on Climate Change, edited by: Masson-Delmotte, V., Zhai, P., Pirani, A., Connors, S. L., Péan, C., Berger, S., Caud, N., Chen, Y., Goldfarb, L., Gomis, M. I., Huang, M., Leitzell, K., Lonnoy, E., Matthews, J. B. R., Maycock, T. K., Waterfield, T., Yelekçi, O., Yu, R., and Zhou, B., Cambridge University Press, Cambridge, UKand New York, NY, USA, 147–286, https://doi.org/10.1017/9781009157896.003, 2021.
Del Genio, A. D., Wu, J., and Chen, Y.: Characteristics of Mesoscale Organization in WRF Simulations of Convection during TWP-ICE, J. Climate, 25, 5666–5688, https://doi.org/10.1175/JCLI-D-11-00422.1 2012.
dos Santos, M. J., Silva Dias, M. A. F., and Freitas, E. D.: Influence of local circulations on wind, moisture, and precipitation close to Manaus City, Amazon Region, Brazil, J. Geophys. Res.-Atmos., 119, 13233–13249, https://doi.org/10.1002/2014JD021969, 2014.
Douville, H., Raghavan, K., Renwick, J., Allan, R. P., Arias, P. A., Barlow, M., Cerezo-Mota, R., Cherchi, A., Gan, T. Y., Gergis, J., Jiang, D., Khan, A., Pokam Mba, W., Rosenfeld, D., Tierney, J., and Zolina, O.: Water Cycle Changes, in: Climate Change 2021: The Physical Science Basis, Contribution of Working Group I to the Sixth Assessment Report of the Intergovernmental Panel on Climate Change, edited by: Masson-Delmotte, V., Zhai, P., Pirani, A., Connors, S. L., Péan, C., Berger, S., Caud, N., Chen, Y., Goldfarb, L., Gomis, M. I., Huang, M., Leitzell, K., Lonnoy, E., Matthews, J. B. R., Maycock, T. K., Waterfield, T., Yelekçi, O., Yu, R., and Zhou, B., Cambridge University Press, Cambridge, UK and New York, NY, USA, 1055–1210, https://doi.org/10.1017/9781009157896.010, 2021.
Fan, J., Rosenfeld, D., Zhang, Y., Giangrande, S. E., Li, Z., Machado, L. A. T., Martin, S. T., Yang, Y., Wang, J., Artaxo, P., Barbosa, H. M. J., Braga, R. C., Comstock, J. M., Feng, Z., Gao, W., Gomes, H. B., Mei, F., Pöhlker, C., Pöhlker, M. L., Pöschl, U., and Souza, R. A. F.: Substantial convection and precipitation enhancements by ultrafine aerosol particles, Science, 359, 411–418, https://doi.org/10.1126/science.aan8461, 2018.
Feng, Z., and Giangrande, S.: Merged RWP-WACR-ARSCL Cloud Mask and Cloud Type, United States, ARM [data set], https://doi.org/10.5439/1462693, 2018.
Feng, Z., Dong, X., Xi, B., McFarlane, S. A., Kennedy, A., Lin, B., and Minnis, P.: Life cycle of midlatitude deep convective systems in a Lagrangian framework, J. Geophys. Res.-Atmos., 117, D23201, https://doi.org/10.1029/2012JD018362, 2012.
Feng, Z., Hardin, J., Barnes, H. C., Li, J., Leung, L. R., Varble, A., and Zhang, Z.: PyFLEXTRKR: a flexible feature tracking Python software for convective cloud analysis, Geosci. Model Dev., 16, 2753–2776, https://doi.org/10.5194/gmd-16-2753-2023, 2023.
Fiolleau, T. and Roca, R.: An Algorithm for the Detection and Tracking of Tropical Mesoscale Convective Systems Using Infrared Images From Geostationary Satellite, IEEE T. Geosci. Remote, 51, 4302–4315, 2013.
Futyan, J. M. and Del Genio, A. D.: Deep Convective System Evolution over Africa and the Tropical Atlantic, J. Climate, 20, 5041–5060, https://doi.org/10.1175/JCLI4297.1, 2007.
Ghate, V. P. and Kollias, P.: On the controls of daytime precipitation in the Amazonian dry season, J. Hydrometeorol., 17, 3079–3097, https://doi.org/10.1175/JHM-D-16-0101.1, 2016.
Giangrande, S.: Calibrated Radar Wind Profiler Precipitation Observations and Vertical Velocity Retrievals, United States, ARM [data set], https://doi.org/10.5439/1440997, 2018.
Giangrande, S. E., Collis, S., Straka, J., Protat, A., Williams, C., and Krueger, S.: A summary of convective-core vertical velocity properties using ARM UHF wind profilers in Oklahoma, J. Appl. Meteorol. Clim., 52, 2278–2295, https://doi.org/10.1175/JAMC-D-12-0185.1, 2013.
Giangrande, S. E., Toto, T., Jensen, M. P., Bartholomew, M. J., Feng, Z., Protat, A., and Machado, L. A. T.: Convective cloud vertical velocity and mass-flux characteristics from radar wind profiler observations during GoAmazon2014/5, J. Geophys. Res.-Atmos., 121, 891–913, https://doi.org/10.1002/2016JD025303, 2016.
Giangrande, S. E., Feng, Z., Jensen, M. P., Comstock, J. M., Johnson, K. L., Toto, T., Wang, M., Burleyson, C., Bharadwaj, N., Mei, F., Machado, L. A. T., Manzi, A. O., Xie, S., Tang, S., Silva Dias, M. A. F., de Souza, R. A. F., Schumacher, C., and Martin, S. T.: Cloud characteristics, thermodynamic controls and radiative impacts during the Observations and Modeling of the Green Ocean Amazon (GoAmazon2014/5) experiment, Atmos. Chem. Phys., 17, 14519–14541, https://doi.org/10.5194/acp-17-14519-2017, 2017.
Giangrande, S. E., Wang, D., and Mechem, D. B.: Cloud regimes over the Amazon Basin: perspectives from the GoAmazon2014/5 campaign, Atmos. Chem. Phys., 20, 7489–7507, https://doi.org/10.5194/acp-20-7489-2020, 2020.
Giangrande, S. E., Biscaro, T., and Peters, J. M.: Seasonal Controls on Isolated Convective Storm Drafts, Precipitation Intensity, and Life Cycle As Observed During GoAmazon2014/5, Atmos. Chem. Phys., 23, 5297–5316, https://doi.org/10.5194/acp-23-5297-2023, 2023.
Grabowski, W. W. and Morrison, H.: Do Ultrafine Cloud Condensation Nuclei Invigorate Deep Convection?, J. Atmos. Sci., 77, 2567–2583, https://doi.org/10.1175/JAS-D-20-0012.1, 2020.
Hagos, S., Feng, Z., McFarlane, S., and Leung, L. R.: Environment and the Lifetime of Tropical Deep Convection in a CloudPermitting Regional Model Simulation, J. Atmos. Sci., 70, 2409–2425, https://doi.org/10.1175/JAS-D-12-0260.1, 2013.
Hardin, J.: PyDisdrometer v1.0 (v1.0), Zenodo [code], https://doi.org/10.5281/zenodo.9991, 2014.
Hardin, J., Giangrande, S., and Zhou, A.: Laser Disdrometer Quantities (LDQUANTS), Atmospheric Radiation Measurement (ARM) User Facility [data set], https://doi.org/10.5439/1432694, 2019.
Heymsfield, G. M., Tian, L., Heymsfield, A. J., Li, L., and Guimond, S.: Characteristics of Deep Tropical and Subtropical Convection from Nadir-Viewing High-Altitude Airborne Doppler Radar, J. Atmos. Sci., 67, 285–308, https://doi.org/10.1175/2009JAS3132.1, 2010.
Heikenfeld, M., Marinescu, P. J., Christensen, M., Watson-Parris, D., Senf, F., van den Heever, S. C., and Stier, P.: tobac 1.2: towards a flexible framework for tracking and analysis of clouds in diverse datasets, Geosci. Model Dev., 12, 4551–4570, https://doi.org/10.5194/gmd-12-4551-2019, 2019.
Hillger, T. J. and Donald, W. S.: The goes-13 science test imager and sounder radiance and product validations, Tech. Rep. No. 125, NOAA technical report NESDIS, NOAA, https://rammb.cira.colostate.edu/projects/goes-n/NOAA_Tech_Report_NESDIS_125_GOES-13_Science_Test.pdf (last access: 11 April 2024), 2007.
Horel, J., Hahmann, A., and Geisler, J.: An investigation of the annual cycle of the convective activity over the tropical Americas, J. Climate, 2, 1388–1403, 1989.
Houze Jr., R. A.: Mesoscale convective systems, Rev. Geophys., 42, RG4003, https://doi.org/10.1029/2004RG000150, 2004.
Houze Jr., R. A., Rasmussen, K. L. Zuluaga, M. D., and Brodzik, S. R.: The variable nature of convection in the tropics and subtropics: A legacy of 16 years of the Tropical Rainfall Measuring Mission satellite, Rev. Geophys., 53, 994–1021, https://doi.org/10.1002/2015RG000488, 2015.
Igel, A. L. and van den Heever, S. C.: Invigoration or Enervation of Convective Clouds by Aerosols?, Geophys. Res. Lett., 48, e2021GL093804, https://doi.org/10.1029/2021GL093804, 2021.
Inoue, T., Vila, D., Rajendran, K., Hamada, A., Wu, X., and Machado, L. A. T.: Life Cycle of Deep Convective Systems over the Eastern Tropical Pacific Observed by TRMM and GOES-W, J. Meteorol. So. Jpn. A, 87, 381–391, https://doi.org/10.2151/jmsj.87A.381, 2009.
Jeyaratnam, J., Luo, Z. J., Giangrande, S. E., Wang, D., and Masunaga, H.: A satellite-based estimate of convective vertical velocity and convective mass flux: Global survey and comparison with radar wind profiler observations, Geophys. Res. Lett., 48, e2020GL090675, https://doi.org/10.1029/2020GL090675, 2021.
Jones, W. K., Christensen, M. W., and Stier, P.: A semi-Lagrangian method for detecting and tracking deep convective clouds in geostationary satellite observations, Atmos. Meas. Tech., 16, 1043–1059, https://doi.org/10.5194/amt-16-1043-2023, 2023.
Keenan, T., Joe, P., Wilson, J. W., Collier, C., Golding, B., Burgess, D., May, P., Pierce, C., Bally, J., Crook, A., Seed, A., Sills, D., Berry, L., Potts, R., Bell, I., Fox, N., Ebert, E., Ehlts, M., O'Loughlin, K., Webb, R., Carbone, R., Browning, K., Roberts, R., and Mueller, C.: The Sydney 2000 World Weather Research Programme Forecast Demonstration Project: Overview and Current Status, B. Am. Meteorol. Soc., 84, 1041–1054, https://doi.org/10.1175/BAMS-84-8-1041, 2003.
Khairoutdinov, M. and Randall, D.: High-resolution simulation of shallow-to-deep convection transition over land, J. Atmos. Sci., 63, 3421–3436, 2006.
Kumar, S., Castillo-Velarde, C. D., Flores Rojas, J. L., Moya-Álvarez, A., Martínez Castro, D., Srivastava, S., and Silva, Y.: Precipitation structure during various phases the life cycle of precipitating cloud systems using geostationary satellite and space-based precipitation radar over Peru, GISci, Remote Sens., 57, 1057–1082, https://doi.org/10.1080/15481603.2020.1843846, 2020.
Kumar, V. V., Jakob, C., Protat, A., Williams, C. R., and May, P. T.: Mass-flux characteristics of tropical cumulus clouds from wind profiler observations at Darwin, Australia, J. Atmos. Sci., 72, 1837–1855, 2015.
Leal, H. B., Calheiros, A. J. P., Barbosa, H. M. J., Almeida, A. P., Sanchez, A., Vila, D. A., Garcia, S. R., and Macau, E. E. N.: Impact of Multi-Thresholds and Vector Correction for Tracking Precipitating Systems over the Amazon Basin, Remote Sens., 14, 5408, https://doi.org/10.3390/rs14215408, 2022.
Leite-Filho, A. T., de Sousa Pontes, V. Y., and Costa, M. H.: Effects of deforestation on the onset of the rainy season and the duration of dry spells in Southern Amazonia, J. Geophys. Res.-Atmos., 124, 5268–5281, 2019.
LeMone, M. A. and Zipser, E. J.: Cumulonimbus vertical velocity events in GATE. Part I: Diameter, intensity and mass flux, J. Atmos. Sci., 37, 2444–2457, https://doi.org/10.1175/1520-0469(1980)037<2444:CVVEIG>2.0.CO;2, 1980.
Machado, L. A. T. and Laurent, H.: The convective system area expansion over amazonia and its relationships with convective system life duration and high-level wind divergence, Mon. Weather Rev., 132, 714–725, https://doi.org/10.1175/1520-0493(2004)132<0714:TCSAEO>2.0.CO;2, 2004.
Machado, L. A. T., Rossow, W. B., Guedes, R. L., and Walker, A. W.: Life cycle variations of mesoscale convective systems over the Americas, Mon. Weather Rev., 126, 1630–1654, https://doi.org/10.1175/1520-0493(1998)126<1630:Lcvomc>2.0.Co;2, 1998.
Machado, L. A. T., Calheiros, A. J. P., Biscaro, T., Giangrande, S., Silva Dias, M. A. F., Cecchini, M. A., Albrecht, R., Andreae, M. O., Araujo, W. F., Artaxo, P., Borrmann, S., Braga, R., Burleyson, C., Eichholz, C. W., Fan, J., Feng, Z., Fisch, G. F., Jensen, M. P., Martin, S. T., Pöschl, U., Pöhlker, C., Pöhlker, M. L., Ribaud, J.-F., Rosenfeld, D., Saraiva, J. M. B., Schumacher, C., Thalman, R., Walter, D., and Wendisch, M.: Overview: Precipitation characteristics and sensitivities to environmental conditions during GoAmazon2014/5 and ACRIDICON-CHUVA, Atmos. Chem. Phys., 18, 6461–6482, https://doi.org/10.5194/acp-18-6461-2018, 2018.
Marengo, J. A. and Espinoza, J. C.: Extreme seasonal droughts and floods in Amazonia: causes, trends and impacts, Int. J. Climatol., 36, 1033–1050, https://doi.org/10.1002/joc.4420, 2015.
Marengo, J. A., Fisch, G. F., Alves, L. M., Sousa, N. V., Fu, R., and Zhuang, Y.: Meteorological context of the onset and end of the rainy season in Central Amazonia during the GoAmazon2014/5, Atmos. Chem. Phys., 17, 7671–7681, https://doi.org/10.5194/acp-17-7671-2017, 2017.
Marengo, J. A., Souza, C. A., Thonicke, K., Burton, C., Halladay, K., Betts, R. A., and Soares, W. R.: Changes in climate and land use over the Amazon Region: current and future variability and trends, Front Earth Sci. Chin., 6, 228, https://doi.org/10.3389/feart.2018.00228, 2018.
Marinescu, P. J., van den Heever, S. C., Heikenfeld, M., Barrett, A. I., Barthlott, C., Hoose, C., Fan, J., Fridlind, A. M., Matsui, T., Miltenberger, A. K., Stier, P., Vie, B., White, B. A., and Zhang, Y.: Impacts of Varying Concentrations of Cloud Condensation Nuclei On Deep Convective Cloud Updrafts – A Multimodel Assessment, J. Atmos. Sci., 78, 1147–1172, https://doi.org/10.1175/JAS-D-20-0200.1, 2021.
Martin, S. T., Artaxo, P., Machado, L. A. T., Manzi, A. O., Souza, R. A. F., Schumacher, C., Wang, J., Andreae, M. O., Barbosa, H. M. J., Fan, J., Fisch, G., Goldstein, A. H., Guenther, A., Jimenez, J. L., Pöschl, U., Silva Dias, M. A., Smith, J. N., and Wendisch, M.: Introduction: Observations and Modeling of the Green Ocean Amazon (GoAmazon2014/5), Atmos. Chem. Phys., 16, 4785–4797, https://doi.org/10.5194/acp-16-4785-2016, 2016.
Martin, S. T., Artaxo, P., Machado, L., Manzi, A. O., Souza, R. A. F., Schumacher, C., Wang, J., Biscaro, T., Brito, J., Calheiros, A., Jardine, K., Medeiros, A., Portela, B., Sá, S. S. D., Adachi, K., Aiken, A. C., Albrecht, R., Alexander, L., Andreae, M. O., Barbosa, H. M. J., Buseck, P., Chand, D., Comstock, J. M., Day, D. A., Dubey, M., Fan, J., Fast, J., Fisch, G., Fortner, E., Giangrande, S., Gilles, M., Goldstein, A. H., Guenther, A., Hubbe, J., Jensen, M., Jimenez, J. L., Keutsch, F. N., Kim, S., Kuang, C., Laskin, A., McKinney, K., Mei, F., Miller, M., Nascimento, R., Pauliquevis, T., Pekour, M., Peres, J., Petäjä, T., Pöhlker, C., Pöschl, U., Rizzo, L., Schmid, B., Shilling, J. E., Dias, M. A. S., Smith, J. N., Tomlinson, J. M., Tóta, J., and Wendisch, M.: The Green Ocean Amazon Experiment (GoAmazon2014/5) Observes Pollution Affecting Gases, Aerosols, Clouds, and Rainfall over the Rain Forest, B. Am. Meteorol. Soc., 98, 981–997, https://doi.org/10.1175/bams-d-15-00221.1, 2017.
Mather, J. H. and Voyles, J. W.: The Arm Climate Research Facility: A Review of Structure and Capabilities, B. Am. Meteorol. Soc., 94, 377–392, 2013.
Mattos, E. V. and Machado, L. A.: Cloud-to-ground lightning and mesoscale convective systems, Atmos. Res., 99, 377–390, https://doi.org/10.1016/j.atmosres.2010.11.007, 2011.
May, P. T. and Rajopadhyaya, D. K.: Vertical Velocity Characteristics of Deep Convection over Darwin, Australia, Mon. Weather Rev., 127, 1056–1071, 1999.
May, R. M., Goebbert, K. H., Thielen, J. E., Leeman, J. R., Camron, M. D., Bruick, Z., Bruning, E. C., Manser, R. P., Arms, S. C., and Marsh, P. T.: MetPy: A Meteorological Python Library for Data Analysis and Visualization, B. Am. Meteorol. Soc., 103, E2273–E2284, 2022.
Meehl, G. A., Senior, C. A., Eyring, V., Flato, G., Lamarque, J.-F., Stouffer, R. J., Taylor, K. E., and Schlund, M.: Context for interpreting equilibrium climate sensitivity and transient climate response from the CMIP6 earth system models, Sci. Adv., 6, 26, https://doi.org/10.1126/sciadv.aba1981, 2020.
Miller, M., Nitschke, K., Ackerman, T., Ferrell, W., Hickmon, N., Ivey, M., Turner, D., and Ellingson, R.: The ARM Mobile Facilities, Atmospheric Radiation Measurement (Arm) Program: the First 20 Years, Meteorol. Monogr., 57, 9.1–9.15, https://doi.org/10.1175/AMSMONOGRAPHS-D-15-0051.1, 2016.
Nobre, P., Malagutti, M., Urbano, D. F., De Almeida, R. A. F., and Giarolla, E.: Amazon deforestation and climate change in a coupled model simulation, J. Climate, 22, 5686–5697, 2009.
Öktem, R., Romps, D. M., and Varble, A. C.: No warm-phase invigoration of convection detected during GoAmazon, J. Atmos. Sci., 80, 2345–2364, https://doi.org/10.1175/JAS-D-22-0241.1, 2023.
Prasanth, S., Haddad, Z. S., Sawaya, R. C., Sy, O. O., van den Heever, M., Narayana Rao, T., and Hristova-Veleva, S.: Quantifying the vertical transport in convective storms using time sequences of radar reflectivity observations, J. Geophys. Res.-Atmos., 128, e2022JD037701, https://doi.org/10.1029/2022JD037701, 2023.
Prein, A. F., Rasmussen, R. M., Wang, D., and Giangrande, S. E.: Sensitivity of organized convective storms to model grid spacing in current and future climates, Philos. T. Roy. Soc A, 379, 20190546, https://doi.org/10.1098/rsta.2019.0546, 2021.
Prein, A. F., Ge, M., Valle, A. R., Wang, D., and Giangrande, S. E.: Towards a unified setup to simulate mid-latitude and tropical mesoscale convective systems at kilometer-scales, Earth Space Sci., 9, e2022EA002295, https://doi.org/10.1029/2022EA002295, 2022.
Protat, A. and Williams, C. R.: The accuracy of radar estimates of ice terminal fall speed from vertically pointing Doppler radar measurements, J. Appl. Meteorol. Clim., 50, 2120–2138, https://doi.org/10.1175/JAMC-D-10-05031.1, 2011.
Ramos-Valle, A. N., Prein, A. F., Ge, M., Wang, D., and Giangrande, S. E.: Grid spacing sensitivities of simulated mid-latitude and tropical mesoscale convective systems in the convective gray zone, J. Geophys. Res.-Atmos., 128, e2022JD037043, https://doi.org/10.1029/2022JD037043, 2023.
Ritsche, M. T.: ARM Surface Meteorology Systems Handbook, DOE/SC-ARM/TR-086, US Department of Energy, https://doi.org/10.2172/1007926, 2011.
Rosenfeld, D.: Objective Method for Analysis and Tracking of Convective Cells as Seen by Radar, J. Atmos. Ocean. Tech., 4, 422–434, https://doi.org/10.1175/1520-0426(1987)004<0422:OMFAAT>2.0.CO;2, 1987.
Rosenfeld, D., Lohmann, U., Raga, G. B., O'Dowd, C. D., Kulmala, M., Fuzzi, S., Reissell, A., and Andreae, M. O.: Flood or drought: How do aerosols affect precipitation?, Science, 321, 1309–1313, https://doi.org/10.1126/science.1160606, 2008.
Saraiva, I., Silva Dias, M. A. F., Morales, C. A. R., and Saraiva, J. M. B.: Regional variability of rainclouds in the Amazon basin seen by a network of weather radars, J. Appl. Meteorol. Clim., 55, 2657–2675, https://doi.org/10.1175/JAMC-D-15-0183.1, 2016a.
Sokolowsky, G. A., Freeman, S. W., Jones, W. K., Kukulies, J., Senf, F., Marinescu, P. J., Heikenfeld, M., Brunner, K. N., Bruning, E. C., Collis, S. M., Jackson, R. C., Leung, G. R., Pfeifer, N., Raut, B. A., Saleeby, S. M., Stier, P., and van den Heever, S. C.: tobac v1.5: Introducing Fast 3D Tracking, Splits and Mergers, and Other Enhancements for Identifying and Analysing Meteorological Phenomena, EGUsphere [preprint], https://doi.org/10.5194/egusphere-2023-1722, 2023.
Stephens, G. L., van den Heever, S. C., Haddad, Z. S., Posselt, D. J., Storer, R. L., Grant, L. D., Sy, O. O., Rao, T. N., Tanelli, S., and Peral, E.: A distributed small satellite approach for measuring convective transports in the Earth's atmosphere, IEEE T. Geosci. Remote, 58, 4–13, https://doi.org/10.1109/TGRS.2019.2918090, 2020.
Tadesse, A. and Anagnostou, E. N.: Characterization of warm season convective systems over US in terms of cloud to ground lightning, cloud kinematics, and precipitation, Atmos. Res., 91, 36–46, https://doi.org/10.1016/j.atmosres.2008.05.009, 2009
Tai, S.-L., Feng, Z., Ma, P.-L., Schumacher C., and Fast, J. D.: Representations of precipitation diurnal cycle in the Amazon as simulated by observationally constrained cloud-system resolving and global climate models, J. Adv. Model. Earth Syst., 13, e2021MS002586, https://doi.org/10.1029/2021MS002586, 2021.
Tang, S., Xie, S., Zhang, Y., Zhang, M., Schumacher, C., Upton, H., Jensen, M. P., Johnson, K. L., Wang, M., Ahlgrimm, M., Feng, Z., Minnis, P., and Thieman, M.: Large-scale vertical velocity, diabatic heating and drying profiles associated with seasonal and diurnal variations of convective systems observed in the GoAmazon2014/5 experiment, Atmos. Chem. Phys., 16, 14249–14264, https://doi.org/10.5194/acp-16-14249-2016, 2016.
Tao, W.-K. and Moncrieff, M. W.: Multiscale cloud system modeling, Rev. Geophys., 47, RG4002, https://doi.org/10.1029/2008RG000276, 2009.
Tian, Y., Zhang Y., Klein, S. A., and Schumacher, C.: Interpreting the diurnal cycle of clouds and precipitation in the ARM GoAmazon observations: Shallow to deep convection transition, J. Geophys. Res.-Atmos., 126, e2020JD033766, https://doi.org/10.1029/2020JD033766, 2021.
Tian, Y., Zhang, Y., and Klein, S. A.: What determines the number and the timing of pulses in afternoon precipitation in the Green Ocean Amazon (GoAmazon) observations?, Geophys. Res. Lett., 49, e2021GL096075, https://doi.org/10.1029/2021GL096075, 2022.
tobac Community, Brunner, K., Freeman, S. W., Jones, W. K., Kukulies, J., Senf, F., Bruning, E., Stier, P., van den Heever, S. C., Heikenfeld, M., Marinescu, P. J., Collis, S. M., Lettl, K., Pfeifer, N., Raut, B. A., and Zhang, X.: tobac – Tracking and Object-based Analysis of Clouds (v1.5.3), Zenodo [code], https://doi.org/10.5281/zenodo.10863405, 2024.
Torri, G., Kuang, Z., and Tian, Y.: Mechanisms for convection triggering by cold pools, Geophys. Res. Lett., 42, 1943–1950, https://doi.org/10.1002/2015GL063227, 2015.
Tridon, F., Battaglia, A., Kollias, P., Luke, E., and Williams, C. R.: Signal Postprocessing and Reflectivity Calibration of the Atmospheric Radiation Measurement Program 915-MHz Wind Profilers, J. Atmos. Ocean. Tech., 30, 1038–1054, https://doi.org/10.1175/JTECH-D-12-00146.1, 2013.
Unidata: MetPy, GitHub [code], https://github.com/Unidata/MetPy (last access: 12 April 2024), 2024.
van den Heever, S., Haddad, Z., Tanelli, S., Stephens, G., Posselt, D., Kim, Y., Brown, S., Braun, S., Grant, L., Kollias, P., Luo, Z. J., Mace, G., Marinescu, P., Padmanabhan, S., Partain, P., Petersent, W., Prasanth, S., Rasmussen, K., Reising, S., and Schumacher, C. and the INCUS Mission team: The INCUS Mission, EGU General Assembly 2022, 23–27 May 2022, Vienna, Austria, EGU22-9021, https://doi.org/10.5194/egusphere-egu22-9021, 2022.
van der Walt, S., Schönberger, J. L., Nunez-Iglesias, J., Boulogne, F., Warner, J. D., Yager, N., Gouillart, E., and Yu, T.: Scikit-Image: Image Processing in Python, Peer J., 2, e453, https://doi.org/10.7717/peerj.453, 2014.
Varble, A.: Erroneous attribution of deep convective invigoration to aerosol concentration, J. Atmos. Sci., 75, 1351–1368, 2018.
Veals, P. G., Varble, A. C., Russell, J. O. H., Hardin, J., and Zipser, E.: Indications of a Decrease in the Depth of Deep Convective Cores with Increasing Aerosol Concentration during the CACTI Campaign, J. Atmos. Sci., 79, 705–722, https://doi.org/10.1175/JAS-D-21-0119.1, 2022.
Wang, D., Giangrande, S. E., Bartholomew, M. J., Hardin, J., Feng, Z., Thalman, R., and Machado, L. A. T.: The Green Ocean: precipitation insights from the GoAmazon2014/5 experiment, Atmos. Chem. Phys., 18, 9121–9145, https://doi.org/10.5194/acp-18-9121-2018, 2018.
Wang, D., Giangrande, S. E., Schiro, K., Jensen, M. P., and Houze, R. A.: The characteristics of tropical and midlatitude mesoscale convective systems as revealed by radar wind profilers, J. Geophys. Res.-Atmos., 124, 4601–4619, https://doi.org/10.1029/2018JD030087, 2019.
Wang, D., Giangrande, S. E., Feng, Z., Hardin, J. C., and Prein, A. F.: Updraft and Downdraft Core Size and Intensity as Revealed by Radar Wind Profilers: MCS Observations and Idealized Model Comparisons, J. Geophys. Res.-Atmos., 125, e2019JD031774, https://doi.org/10.1029/2019JD031774, 2020.
Wang, D., Prein, A. F., Giangrande, S. E., Ramos-Valle, A., Ge, M., and Jensen, M. P.: Convective updraft and downdraft characteristics of continental mesoscale convective systems in the model gray zone, J. Geophys. Res.-Atmos., 127, e2022JD036746, https://doi.org/10.1029/2022JD036746, 2022.
Wapler, K.: The life-cycle of hailstorms: Lightning, radar reflectivity and rotation characteristics, Atmos. Res., 193, 60–72, 2017.
Welch, B. L.: The generalization of “Student's” problem when several different population variances are involved, Biometrika, 34, 28–35, https://doi.org/10.1093/biomet/34.1-2.28, 1947.
Wilhelm, J., Wapler, K., Blahak, U., Potthast, R., and Kunz, M.: Statistical relevance of meteorological ambient conditions and cell attributes for nowcasting the life cycle of convective storms, Q. J. Roy. Meteorol. Soc., 149, 2252–2280, https://doi.org/10.1002/qj.4505, 2023.
Wilson, J. W., Crook, N. A., Mueller, C. K., Sun, J., and Dixon, M.: Nowcasting Thunderstorms: A Status Report, B. Am. Meteorol. Soc., 79, 2079–2099, https://doi.org/10.1175/1520-0477(1998)079<2079:NTASR>2.0.CO;2, 1998.
Wu, M., Lee, J.-E., Wang, D., and Salameh, M.: Suppressed daytime convection over the Amazon River, J. Geophys. Res.-Atmos., 126, e2020JD033627, https://doi.org/10.1029/2020JD033627, 2021.