the Creative Commons Attribution 4.0 License.
the Creative Commons Attribution 4.0 License.
 | 16 Apr 2024
Technical Note: A technique to convert NO2 to NO2− with S(IV) and its application to measuring nitrate photolysis
Aaron Lieberman
Julietta Picco
Murat Onder
Nitrate photolysis is a potentially significant mechanism for “renoxifying” the atmosphere, i.e., converting nitrate into nitrogen oxides – nitrogen dioxide (NO2) and nitric oxide (NO) – and nitrous acid (HONO). Nitrate photolysis in the environment occurs through two channels which produce (1) NO2 and hydroxyl radical (•OH) and (2) nitrite (NO) and an oxygen atom (O(3P)). Although the aqueous quantum yields and photolysis rate constants of both channels have been established, field observations suggest that nitrate photolysis is enhanced in the environment. Laboratory studies investigating these enhancements typically only measure one of the two photo-channels, since measuring both channels generally requires separate analytical methods and instrumentation. However, measuring only one channel makes it difficult to assess whether secondary chemistry is enhancing one channel at the expense of the other or if there is an overall enhancement of nitrate photochemistry. Here, we show that the addition of S(IV), i.e., bisulfite and sulfite, can convert NO2 to NO, allowing for measurement of both nitrate photolysis channels with the same equipment. By varying the concentration of S(IV) and exploring method parameters, we determine the experimental conditions that quantitatively convert NO2 and accurately quantify the resulting NO. We then apply the method to a test case, showing how an •OH scavenger in solution prevents the oxidation of NO to NO2 but does not enhance the overall photolysis efficiency of nitrate.
- Article
(638 KB) - Full-text XML
-
Supplement
(580 KB) - BibTeX
- EndNote


Nitrogen oxides – i.e., nitrogen dioxide (NO2) and nitric oxide (NO) – and nitrous acid (HONO) are reactive species that play key roles in the formation of tropospheric ozone and hydroxyl radicals (•OH) (Acker et al., 2006; Seinfeld and Pandis, 2006). The fast oxidation of NO2 to HNO3 is an important sink of gas-phase NOx, while the resulting gas-phase nitric acid and aqueous nitrate are traditionally considered relatively stable reservoir species (Stavrakou et al., 2013; Ye et al., 2017). Although nitrate can photolyze to re-form NOx, the lifetime of nitrate is long enough that the small production rates of NOx and HONO from nitrate photolysis have been considered important only in remote areas (Romer et al., 2018). However, field studies over the past several decades have often shown that atmospheric measurements of HONO and NOx are higher than modeled values (Li et al., 2014; Zhou et al., 2002; Romer et al., 2018). This suggests that nitrate photolysis in the atmosphere is faster than originally considered and, therefore, might be a more significant source of HONO and NOx (Kasibhatla et al., 2018; Andersen et al., 2023; Zhou et al., 2003).
In sunlight (i.e., for wavelengths above 280 nm), aqueous NO photolysis proceeds through two channels:
The first channel (Reaction R1) produces NO2 and •O− (which is rapidly protonated to •OH), and the second produces nitrite (NO and an oxygen atom O(3P). Channel 1 has an average quantum yield of (1.19±0.29) % at 293 K for illumination wavelengths above 300 nm (Chu and Anastasio, 2003; Zellner et al., 1990; Warneck and Wurzinger, 1988; Zepp et al., 1987), as shown in Table S1 in the Supplement. The quantum yield for channel 2 (Reaction R2) is sometimes erroneously reported to be an order of magnitude smaller than that of channel 1, but in fact the values are comparable: channel 2 has an average quantum yield of (0.98±0.11) % at 293 K for wavelengths above 300 nm (Benedict et al., 2017; McFall et al., 2018; Warneck and Wurzinger, 1988; Goldstein and Rabani, 2007) (Table S1).
These two quantum yields have been determined using different analytical methods. Generally, researchers either monitor the production of hydroxyl radical (•OH) from channel 1 or the production of nitrite (NO) from channel 2. •OH is typically quantified using a chemical probe (e.g., benzoic acid) that reacts to form a stable product (e.g., p-hydroxybenzoic acid) that is monitored by high-performance liquid chromatography (HPLC) (Chu and Anastasio, 2003). In contrast, NO is typically measured via ion chromatography or the more sensitive long-path Griess method that derivatizes nitrite and measures the highly colored azo product (Benedict et al., 2017; Ridnour et al., 2000).
Other studies have measured the gas-phase production of NO2 and/or HONO, which is formed from the protonation of NO. However, these gas-phase studies are limited to a specific pH range in order to measure HONO production (Scharko et al., 2014), employ separate instruments to measure HONO and NO2, and focus on how the production rates of NO2 and HONO depend on experimental conditions (Frey et al., 2013; Ma et al., 2021; Liang et al., 2021). Although it is possible to measure both NOx and HONO with commercially available instruments, researchers often engineer their own instrument to measure HONO and operate a second analyzer for the NO2 channel (Shi et al., 2021; X. Wang et al., 2021; Ma et al., 2021). Furthermore, gas-phase studies do not measure quantum yields but instead examine how the production rates of NO2 and/or HONO are altered by factors such as the presence of other chemical species.
Typically researchers define an enhancement in nitrate photolysis as an experimentally measured production rate or quantum yield divided by the value under a standard condition (Liang et al., 2021; Y. Wang et al., 2021; Shi et al., 2021; Zhou et al., 2003). For example, a measured apparent nitrite quantum yield of 8 % in the presence of light-absorbing vanillic acid (Y. Wang et al., 2021) represents an 8-fold enhancement. If we want to fully understand the impact of an enhancement, the quantum yields for both channels must be measured. For instance, if one measures only the NO2 channel and discovers an enhanced formation rate, it would be unclear whether NO production also increased or if NO is being converted to NO2. Therefore, it would be useful to be able to measure both channels of nitrate photolysis using a single analytical method.
One possible method to measure both channels is by reducing NO2 to NO after photolysis, such that the total measured NO is the combination of NO2 from channel 1 and NO from channel 2. S(IV) – i.e., sulfite (SO) and bisulfite (HSO) – can reduce NO2 to NO through the following overall reaction (Lee and Schwartz, 1982; Clifton et al., 1988; Wang et al., 2020; Song et al., 2021):
Although industrial processes have used this reaction to convert NO2 to NO, they often operate at very high temperatures or include additives to enhance the diffusion of NO2 into the aqueous phase (Shen and Rochelle, 1998; Lian et al., 2022).
Our goal is to use S(IV) chemistry to determine both channels of nitrate photolysis by performing two experiments using the same analytical method. In the first run, we measure NO production directly to quantify channel 2. In the second experiment, we use S(IV) to convert photoproduced NO2 to NO so that the measured nitrite represents the sum of both NO2 and NO. Then we quantify channel 1 by subtracting the NO experiment result from the combined (NO2 + NO) experiment result. If this approach is successful, it would simplify and expand our ability to analyze NO2 and NO.
2.1 Materials
Information about materials and chemicals is in Sect. S1 of the Supplement.
2.2 Sample illumination
Illumination solutions were prepared daily; were air saturated; and contained 50 µM NaNO3, either 0 or 50 µM 2-propanol, and varying concentrations of S(IV). The pH of the solution was either controlled by a 0.010 M phosphate buffer (pH 5 or 8) or the added S(IV) (pH 8). Samples were illuminated with 313 nm light from a 1000 W mercury–xenon arc lamp with a downstream monochromator (Spectral Energy) and a 310 nm long-pass filter upstream of the sample. A volume of 800 µL of aqueous sample in an upright 2 mL HPLC vial (low impurity type-I class-A borosilicate glass, 12 mm o.d. × 32 mm height, Shimadzu) sealed with a septum cap was illuminated from its side. Samples were illuminated with constant stirring in a custom-built, Peltier-cooled aluminum housing (Paige Instruments) that was held at 20 °C by a recirculating water bath. Samples were kept sealed throughout the illumination. Dark controls containing the same solution as the illuminated sample but not exposed to light were analyzed periodically throughout each experiment. Nitrite production was never detected in the dark controls. Under our conditions, experiments without S(IV) produced no more than 180 nM NO, and experiments with S(IV) produced no more than 180 nM NO2 + NO.
2.3 Measurement of nitrite
After illuminating all the samples for a given experiment, we determined nitrite concentrations using the Griess method, a spectrophotometric technique that forms an azo-dye complex (Doane and Horwath, 2003; Benedict et al., 2017; McFall et al., 2018). Our experiments had three different sample treatments: (1) no S(IV) in solution, (2) S(IV) in solution during illumination, and (3) S(IV) added to the solution after illumination. Each treatment required a slightly different method to efficiently form the azo dye. The stabilities of the samples are discussed in Section S3 of the Supplement.
For samples without S(IV), the Griess method (Pratt et al., 1995; Moorcroft et al., 2001; Ridnour et al., 2000; Benedict et al., 2017) could be used without adaptation. Within 10 min of stopping illumination, we added 25 µL of a 1% sulfanilamide in 10 % HCl () solution, and we let it react for 10 min in the dark. We then added 25 µL of 0.1 % N-(1-naphthyl)ethylenediamine dihydrochloride (NED) solution and allowed it to react for 10 min to form the azo dye.
Treatment 2, where S(IV) was present in solution during illumination, required an additional step because S(IV) interferes with the Griess reagents (Sect. S2). After illumination, we first added hydrogen peroxide (H2O2) to the 800 µL sample to obtain a 2:1 molar ratio of H2O2:S(IV). This was done to oxidize S(IV) to sulfate, which does not interfere with nitrite determination. Within 1 min of adding H2O2, we added 50 µL of 1 % sulfanilamide in 30 % () HCl solution and allowed the solution to react for 10 min in the dark. Then we added 50 µL of 0.1 % NED solution to the sample and allowed it to react for another 10 min in the dark.
Treatment 3 is similar to treatment 2 with one key difference: S(IV) was added to the solution after illumination. Because NO2 is volatile and would escape the illumination container if opened, we developed a method to add the S(IV) without opening the vial. This was done by using a syringe with a hypodermic needle to directly inject 37.5 µL of a 33.3 mM sulfite solution at pH 9 through the septum into the HPLC vial immediately after the illumination was stopped. The vial was then left to react while stirring for 30 min in the dark at room temperature to completely convert NO2 to NO. The samples were then treated exactly as in treatment 2, i.e., adding H2O2, then 50 µL of sulfanilamide in 30 % HCl, and then 50 µL of NED.
Once the azo dye was formed, we measured light absorption at ∼540 nm in the developed solutions using a TIDAS II spectrophotometer (World Precision Instruments) with a liquid waveguide capillary cell (LWCC; nominal length of 100 cm, effective path length of 94 cm, 250 µL volume) and a tungsten lamp. The TIDAS contains two lamps, but the deuterium lamp (200–350 nm) caused an artifact in previous experiments (Benedict et al., 2017), so it was kept off during our measurements. The absorption spectrum was measured from 350 to 700 nm so that we could correct for any baseline shifts. The peak height between 530 and 550 nm was determined as the difference between the maximum absorbance in this range relative to a baseline drawn from the local absorption minima between 400 and 500 nm and between 550 and 700 nm. The limits of detection for nitrite were 7 nM for sample treatment 1 and 11 nM for sample treatments 2 and 3, as determined using the method of Armbruster and Pry (2008). Fresh standards of sodium nitrite (0 to 200 nM) were prepared daily and used to calibrate the spectrophotometer. As S(IV) and H2O2 decrease the absorbance, S(IV) and H2O2, respectively, used in the samples were also added to the standards to correct for this matrix effect. Samples and other solutions were manually injected into the LWCC with a syringe, and 4 mL of Milli-Q water was injected between samples to eliminate carry over. We cleaned the LWCC both before and after each experiment with 1 mL injections of three separate cleaning solutions: 1 M NaOH, 1 M HCl, and 50 % methanol with 50 % Milli-Q (MQ) water, with pure MQ injected between each cleaning solution.
Daily controls included a replicate standard, MQ injection as a check for carry over, and a secondary check standard (Dionex). Analyses were deemed acceptable if the MQ check was below the lowest non-zero standard (10 nM NO) and if both the replicate standard and secondary check standard concentrations were within 15 % of known values.
2.4 Chemical actinometry and calculation of quantum yield
The photon flux was measured daily using 2-nitrobenzaldehyde (2NB) as a chemical actinometer (Galbavy et al., 2010). Actinometry was performed under the same conditions (container, volume of sample, temperature) as nitrate photolysis. Under low-light-absorbing conditions, the measured rate constant for 2NB loss during 313 nm irradiation (j2NB,313) is calculated using
where I313l is the surface-area-normalized photon flux (mol-photon cm−2 s−1), M−1 cm−1 is the product of the base-10 molar absorption coefficient and quantum yield for 2NB at 313 nm (Anastasio et al., 1994), 2.303 converts ε to base-e, and 103 cm3 L−1 is for units conversion. Similarly, the formation rate constant for nitrite from nitrate photolysis is
where is the quantum yield of nitrite formation from nitrate photolysis at 313 nm, and is the base-10 molar absorption coefficient of nitrate at 313 nm, i.e., 5.29 M−1 cm−1 (Chu and Anastasio, 2003).
The rate of nitrite formation from nitrate photolysis, , is a first-order process:
Since the experiments were at short timescales where nitrate loss was negligible, the increase of nitrite was linear, and the nitrite formation rate could be determined with simple linear regression. Combining Eqs. (1)–(3) allows us to solve for the quantum yield of nitrite:
For simplicity, and because all our experiments were performed with 313 nm illumination, we omit the “313” subscript throughout the rest of this article.
2.5 Combined quantum yield and ϕ(NO2) calculations
For experiments with added S(IV), the measured concentration of nitrite represents both the primary nitrite from nitrate photolysis as well as secondary nitrite formed by conversion of NO2. Thus, the calculated quantum yield in experiments with S(IV), i.e., , is a combination of the quantum yields for both channels 1 and 2:
Here f is the fraction of NO2 that reacts with S(IV) to make NO, as opposed to going down other pathways:
where is the reaction rate constant of S(IV) and NO2, i.e., 1.2×10⁷ M−1 s−1 and 1.7×10⁷ M−1 s−1 for bisulfite and sulfite, respectively (Clifton et al., 1988), and kother is the pseudo-first-order rate constant for all other pathways that consume NO2. The concentrations of bisulfite and sulfite are determined based on the total S(IV) in solution, [S(IV)], and their mole fractions, which depend on the two pKa values for S(IV) (, ; Seinfeld and Pandis, 2006). As described below, at pH ≈8, a S(IV) concentration of 1.5 mM and higher is sufficient to make f equal 1; that is, S(IV) is essentially the only fate for NO2, so it is quantitatively converted to NO. Under this condition, we calculate the quantum yield for NO2 formation, ϕ(NO2), as the difference between the measured nitrite quantum yields in the presence and absence of S(IV):
3.1 Modification of the Griess method for solutions containing S(IV)
As described in Sect. S2, we found that the addition of micromolar levels of S(IV) interferes with the determination of nitrite because of two issues: (1) it prevents the formation of the azo-dye derivative, and (2) it moves the solution acidity out of the required range. The first issue was solved by oxidizing the S(IV) to S(VI) with H2O2 prior to the addition of the Griess reagents (Fig. S1 in the Supplement). We added H2O2 to the samples such that there was a 2:1 molar ratio of H2O2:S(IV); then within 1 min of the addition of H2O2, we added the sulfanilamide solution and, 10 min later, the NED reagent. After waiting another 10 min, we measured the UV–VIS spectra for the entire batch of samples within 20 min of capturing the spectrum of the first sample. We also doubled the standard volumes of both Griess reagents added to the sample solutions to ensure that there were enough reactants to form the azo dye.
The second issue caused by S(IV) was that it pushed the solutions to pH 7. This basicity prevented the conversion of nitrite to the azo dye because this reaction requires a pH below 2. The standard 10 % HCl () in the sulfanilamide solution only lowered the sample pH to ∼4 for solutions containing 1.5 mM of sulfite. As per the recommendation by Doane and Horwath (2003), we increased the HCl concentration in the sulfanilamide solution to 30 % (), which lowered the pH of the sample–sulfanilamide mixture to less than 2, overcoming the pH issue caused by S(IV).
3.2 Addition of S(IV) to solution prior to illumination
Our goals in this initial set of experiments were to examine whether S(IV) in solution can convert photoproduced NO2 to NO and, if so, to determine the concentration of aqueous S(IV) required to make this conversion quantitative, i.e., close to 100 %. If S(IV) can quantitatively convert NO2 to NO, then the measured nitrite quantum yield at this S(IV) concentration should equal the sum of the quantum yields from both channels of nitrate photolysis.
We started experiments by running a test without S(IV) (50 µM NaNO3, 50 µM 2-propanol, and 293 K) to confirm that our result matches the literature. The average ϕ(NO) from our four replicate experiments without S(IV) is (1.05±0.06) %, which is statistically no different (p=0.36) from the average of the literature values shown in Table S1, (0.98±0.11) %. Then we began performing experiments with increasing concentrations of S(IV). As [S(IV)] increases, the apparent nitrite quantum yield increases until it reaches a plateau for S(IV) concentrations at roughly 500 µM and above (Fig. 1). The measured quantum yield at the plateau, determined as the average (±1σ) of the individual experiments from 500 to 2000 µM S(IV), is (2.01±0.05) %. This is slightly lower than but statistically indistinguishable (p=0.14) from the sum of the average literature quantum yields for both channels, (2.17±0.52) %, which is shown as the upper horizontal line in Fig. 1. We then calculate ϕ(NO2) by taking the difference between the quantum yield determined with S(IV), which measures the sum of the two channels, and the quantum yield for the nitrite channel (Eq. 7). This results in a value for ϕ(NO2) of (0.96±0.12) %, which is slightly lower than the average of previous experiments (1.19±0.29) % but statistically no different (p=0.10). These results confirm that S(IV) in the reaction solution during illumination can quantitatively convert photochemically produced NO2 to NO, allowing the Griess spectrophotometric technique to quantify both channels of nitrate photolysis.
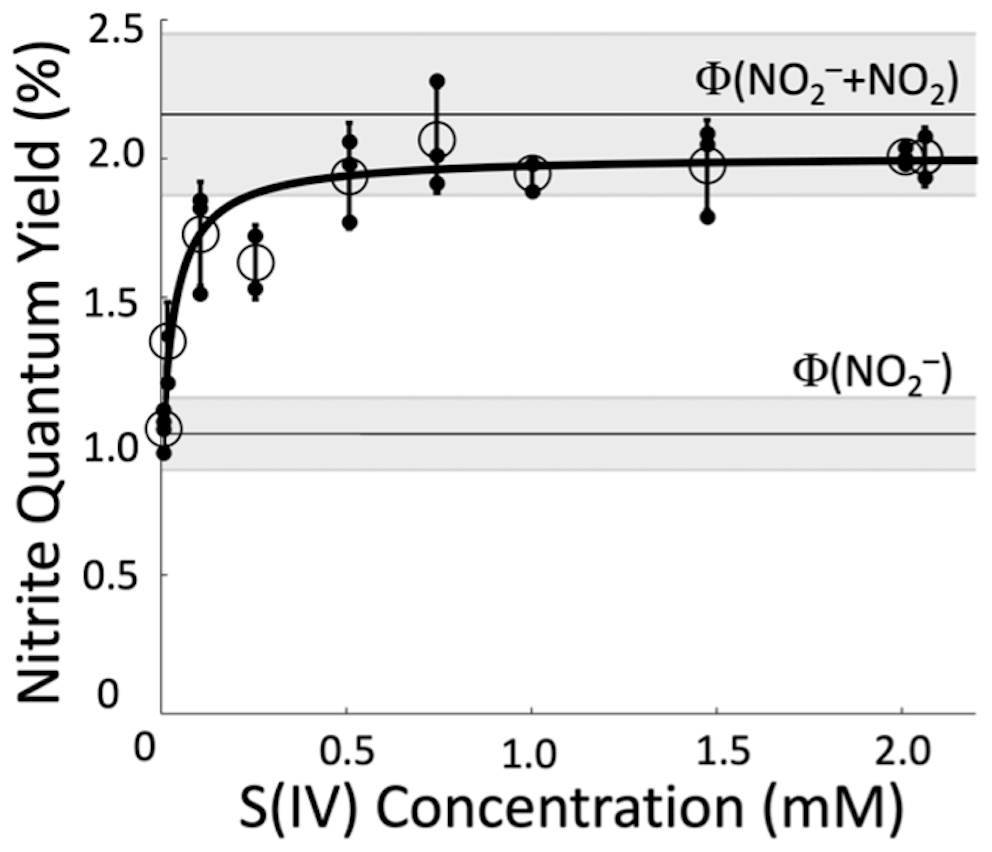
Figure 1Measured apparent nitrite quantum yields for the photolysis of 50 µM nitrate solutions (293 K, pH 8) in the presence of different concentrations of S(IV). Unfilled circles represent the average (±1σ) of individual experiments, which are shown as filled black points. The line through the data is a fit to Eq. (8). The lower grey area centered at 1.1 % is the average of previously determined values of , and the upper grey area centered at 2.2 % is the sum of the quantum yields from both channels, , from the literature. Literature values used to calculate these averages are in Table S1.
We can also use our Fig. 1 data to estimate the value for kother, the pseudo-first-order rate constant for NO2 loss due to other pathways, i.e., not reacting with S(IV). Combining Eqs. (5) and (6) yields
Fitting this equation to our data using Python (Van Rossum and Drake, 1995) yields the solid line in Fig. 1 and parameter values of s−1, %, and %. We can use the value of kother in Eq. (6) to calculate the percent of NO2 that is converted to NO in solutions at a given S(IV) concentration and pH value: values are 96 %, 98 %, and 99 % at 500, 1000, and 1500 µM S(IV), respectively, at pH 8.
3.3 Addition of S(IV) after illumination
Our experiments above used S(IV) in the illumination solution to convert NO2 to NO. While this method works, it has the disadvantage that S(IV) might interfere with other reactive species or reaction pathways during illumination. To avoid this problem, in this section we examine whether we can prevent NO2 from escaping the sample container and convert it to nitrite by adding S(IV) to the solution after illumination.
We made several changes to the procedure in Sect. 3.2 to ensure full conversion of NO2 to NO when adding S(IV) after illumination. We examined the effectiveness of the potential changes based on a single trial where we tested three different treatments of the samples post-illumination: (1) adding 1.5 mM S(IV) to the samples and allowing them to stir for 30 min in the dark, (2) adding 1.0 mM S(IV) and stirring for 30 min, and (3) adding 1.5 mM S(IV) and stirring for 10 min. In each case, we added the S(IV) immediately after the end of sample illumination by injecting a small volume, 25 or 38 µL, of a 33 mM sodium sulfite stock solution through the septum of the HPLC cap with a syringe and hypodermic needle. The goal with this technique is to keep the illumination container sealed so that NO2 could not escape. Measured values of were (1.97±0.24) %, (1.53±0.19) %, and (1.60±0.45) % for treatments 1, 2, and 3, respectively. The only trial that seemed to completely convert all the NO2 to NO was the first treatment, i.e., 1.5 mM S(IV) with 30 min of stirring. As such, we used this treatment method going forward.
We also estimated the timescale of NO2 conversion to nitrite to compare with our experimental results. Based on the volumes in the reaction vial (800 µL of solution and ∼1.3 mL of headspace), Henry's law predicts (at 293 K) that 10 % of NO2 should be in the aqueous phase and 90 % in the headspace. Based on the kinetic data from Clifton et al. (1988), the lifetime of total NO2 in the vial is approximately 1 ms. This means that there should have been no difference between the results of treatments 1 and 3, which is not the case. It is unclear why there is a discrepancy between the theoretical and experimental timescales for the conversion of NO2 to NO.
Next, we examined whether the addition of S(IV) after illumination produced results that were the same as those for experiments where S(IV) was in the solution during illumination. We performed triplicate experiments measuring the combined NO2 + NO quantum yield in pH 5 solution containing 50 µM NaNO3 and 50 µM 2-propanol, as well as 1.5 mM S(IV) added to the solution after illumination. As shown in Fig. S4, the average ±1σ combined quantum yield from this set of experiments is (2.10±0.08) %. This is statistically no different from the result we obtained above when S(IV) was present in the solution during illumination, (2.00±0.14) % (p=0.32), and no different from the literature value, (2.17±0.52) % (p=0.74; Table S1). This indicates that we can add S(IV) after the photoproduction of nitrogen dioxide has stopped and still convert all the NO2 to NO.
3.4 Applying the S(IV) method: impact of an •OH scavenger
Our final step is to show the utility of determining both NO2 and NO in a chemical system, by using the example of quantifying the impact of an •OH scavenger on the two channels from nitrate photolysis. Based on past work (Benedict et al., 2017; Roca et al., 2008; McFall et al., 2018), •OH can react with NO to form NO2 in the absence of a hydroxyl radical scavenger:
Because of this reaction, in the absence of an •OH scavenger, the NO quantum yield should be underestimated, and the NO2 quantum yield should be overestimated by an equal amount. In contrast, adding a scavenger suppresses the hydroxyl radical concentration and its impact on both photoproducts, giving the true quantum yield for each channel. However, we expect that the combined quantum yield, i.e., the sum of values for both channels, will be the same regardless of the presence of •OH scavengers. That is, we expect that an •OH scavenger will prevent the conversion of NO to NO2 but will not alter the overall photochemical efficiency of nitrate photolysis. While the impact of •OH scavengers on the nitrite channel has been examined previously, we are unaware of any past attempts to measure both channels in the presence and absence of scavengers.
As shown by the blue arrow in Fig. 2, the addition of an •OH scavenger increases the NO quantum yield (by 0.14 %), as expected since it impedes the oxidation of nitrite by the hydroxyl radical (Reaction R4). Also consistent with our model above, the red arrow shows that the •OH scavenger decreases the quantum yield of the NO2 channel (by 0.14 %), a result of the suppression of nitrite oxidation by •OH to make NO2. The NO quantum yields without S(IV), with and without 2-propanol, are statistically different (p=0.04). However, when S(IV) is added to the solution, the presence or absence of an •OH scavenger has no impact (p=0.95) on the sum of the quantum yields for the two channels. This is what we expect, because the NO2 that was formed from the reaction of •OH and NO is converted back to NO by S(IV), resulting in the same total amount of NO + NO2 in the two sets of experiments. This shows that the addition of a •OH scavenger does not impact the overall efficiency of nitrate photolysis (i.e., the sum of the quantum yields of the two channels) but prevents the oxidation of NO to NO2.
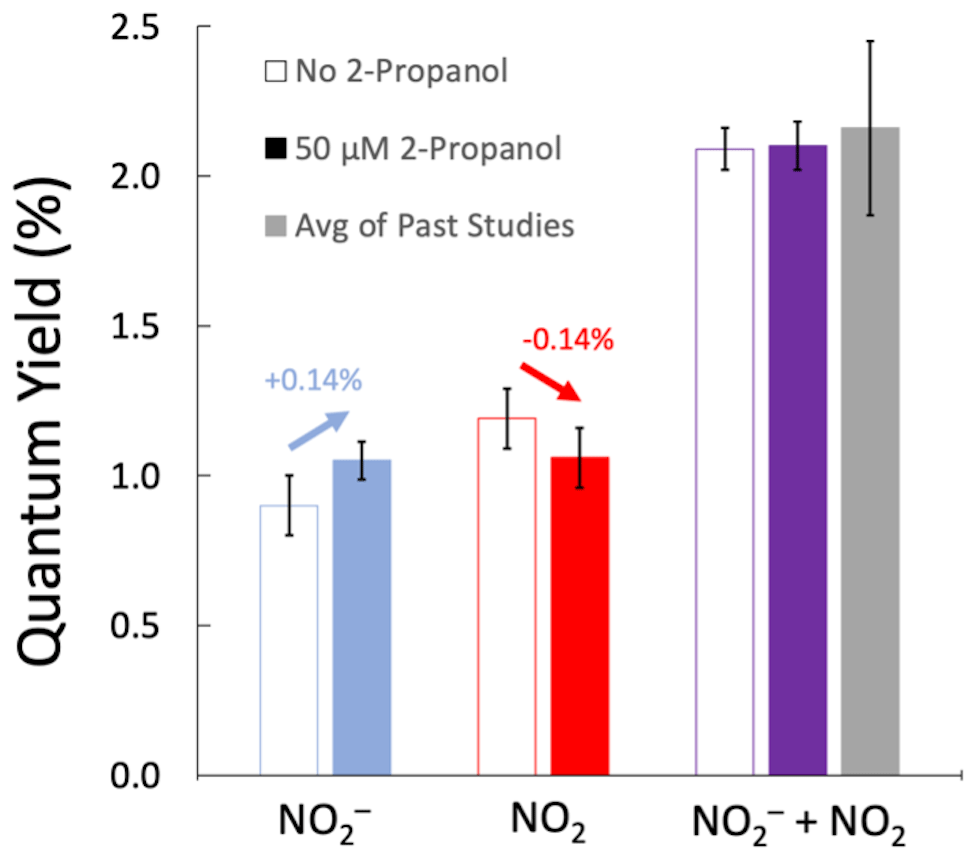
Figure 2Measured quantum yields of nitrite (blue bars), nitrogen dioxide (red bars), and both products (purple bars) from the photolysis of 50 µM NO at 293 K and pH 5. The unfilled bars are experiments without 2-propanol (an •OH scavenger), while filled bars represent experiments with 50 µM 2-propanol. The grey bar is the sum of the average quantum yields for the two channels from past studies (Table S1). Arrows above the NO and NO2 channels indicate the impact of the •OH scavenger. Error bars are ±1σ. Errors for the NO and (NO + NO2) quantum yields were calculated from replicate experiments; these errors were propagated to determine the error for the NO2 channel result.
Our quantum yields in this set of experiments are in good agreement with previously determined values. As mentioned in Sect. 3.2, our nitrite quantum yield without S(IV) agrees with previously reported values. Our combined quantum yield values, , are (2.10±0.08) % and (2.09±0.16) % with and without an •OH scavenger, respectively (Fig. 2). Our values here agree with the Table S1 average of previously determined combination of both channels, (2.17±0.52) % (p>0.70). The NO2 channel was calculated, using Eq. (7), as the difference in the quantum yield between experiments with S(IV) added after illumination and experiments without S(IV). In this set of experiments, our measured ϕ(NO2), (1.05±0.10) %, is similar to the average of the literature values, (1.19±0.29) % (p=0.47), as shown in Table S1.
We have demonstrated that S(IV) can convert aqueous NO2 to NO, which allows the production of both the gas- and aqueous-phase products of nitrate photolysis to be quantified in the aqueous phase in a sealed container using the same analytical method. Although nitrate photolysis is traditionally considered a minor source of NOx, recent research has shown that the efficiency of nitrate photolysis can be enhanced by other light-absorbing compounds or its physical environment (Y. Wang et al., 2021; Mora Garcia et al., 2021; McFall et al., 2018). It is important to understand whether an apparent enhancement impacts only one channel, both channels, or is due simply to a conversion of one product to another. As many field studies have noted that the measured enhancement impacts the NO channel more than the NO2 channel, it is likely that different chemicals impact nitrate photolysis in a variety of ways (Andersen et al., 2023; Kasibhatla et al., 2018; Ye et al., 2016). Understanding how different variables impact nitrate photolysis will allow a more comprehensive understanding of nitrogen cycling and should improve model predictions of ambient NOx and HONO concentrations. Performing experiments with and without S(IV) for a given experimental condition will allow laboratory experiments to determine both channels of nitrate photolysis, which will reveal whether one or both channels are enhanced or if secondary chemistry is converting one product to the other.
This new S(IV) method also has applications beyond nitrate photolysis, as it can be used for any system where NO2 needs to be quantified. This could include studies where NO2 production occurs in the aqueous phase, such as the decomposition of metallic nitrate compounds (Gallagher et al., 1971; Yuvaraj et al., 2003) or in studies where the production of NO2 is small enough that it cannot be quantified by commercially available analyzers.
All data and code can be obtained by emailing the corresponding author at canastasio@ucdavis.edu.
The supplement related to this article is available online at: https://doi.org/10.5194/acp-24-4411-2024-supplement.
AL and CA conceptualized the study, while AL, JP, and MO performed the experiments. AL performed the coding and data analysis. AL wrote the paper with input from CA.
The contact author has declared that none of the authors has any competing interests.
Publisher's note: Copernicus Publications remains neutral with regard to jurisdictional claims made in the text, published maps, institutional affiliations, or any other geographical representation in this paper. While Copernicus Publications makes every effort to include appropriate place names, the final responsibility lies with the authors.
We appreciate the helpful comments of the anonymous reviewers.
This research was supported by the National Science Foundation (grant no. CHE-2305164) and the California Agricultural Experiment Station (Project CA-D-LAW-6403-RR).
This paper was edited by Sergey A. Nizkorodov and reviewed by two anonymous referees.
Acker, K., Möller, D., Wieprecht, W., Meixner, F. X., Bohn, B., Gilge, S., Plass-Dülmer, C., and Berresheim, H.: Strong daytime production of OH from HNO2 at a rural mountain site, Geophys. Res. Lett., 33, L02809, https://doi.org/10.1029/2005GL024643, 2006.
Anastasio, C., Faust, B., and Allen, J.: Aqueous phase photochemical formation of hydrogen peroxide in authentic cloud waters, J. Geophys. Res.-Atmos., 99, 8231–8248, https://doi.org/10.1029/94JD00085, 1994.
Andersen, S. T., Carpenter, L. J., Reed, C., Lee, J. D., Chance, R., Sherwen, T., Vaughan, A. R., Stewart, J., Edwards, P. M., Bloss, W. J., Sommariva, R., Crilley, L. R., Nott, G. J., Neves, L., Read, K., Heard, D. E., Seakins, P. W., Whalley, L. K., Boustead, G. A., Fleming, L. T., Stone, D., and Fomba, K. W.: Extensive field evidence for the release of HONO from the photolysis of nitrate aerosols, Sci. Adv., 9, eadd6266, https://doi.org/10.1126/sciadv.add6266, 2023.
Armbruster, D. A. and Pry, T.: Limit of Blank, Limit of Detection and Limit of Quantitation, Clin. Biochem. Rev., 29, S49–S52, 2008.
Benedict, K. B., McFall, A. S., and Anastasio, C.: Quantum Yield of Nitrite from the Photolysis of Aqueous Nitrate above 300 nm, Environ. Sci. Technol., 51, 4387–4395, https://doi.org/10.1021/acs.est.6b06370, 2017.
Chu, L. and Anastasio, C.: Quantum Yields of Hydroxyl Radical and Nitrogen Dioxide from the Photolysis of Nitrate on Ice, J. Phys. Chem. A, 107, 9594–9602, https://doi.org/10.1021/jp0349132, 2003.
Clifton, C. L., Altstein, N., and Huie, R. E.: Rate constant for the reaction of nitrogen dioxide with sulfur(IV) over the pH range 5.3–13, Environ. Sci. Technol., 22, 586–589, https://doi.org/10.1021/es00170a018, 1988.
Doane, T. A. and Horwath, W. R.: Spectrophotometric Determination of Nitrate with a Single Reagent, Analyt. Lett., 36, 2713–2722, https://doi.org/10.1081/AL-120024647, 2003.
Frey, M. M., Brough, N., France, J. L., Anderson, P. S., Traulle, O., King, M. D., Jones, A. E., Wolff, E. W., and Savarino, J.: The diurnal variability of atmospheric nitrogen oxides (NO and NO2) above the Antarctic Plateau driven by atmospheric stability and snow emissions, Atmos. Chem. Phys., 13, 3045–3062, https://doi.org/10.5194/acp-13-3045-2013, 2013.
Galbavy, E. S., Ram, K., and Anastasio, C.: 2-Nitrobenzaldehyde as a chemical actinometer for solution and ice photochemistry, J. Photochem. Photobiol. A, 209, 186–192, https://doi.org/10.1016/j.jphotochem.2009.11.013, 2010.
Gallagher, P. K., Schrey, F., and Prescott, B.: The thermal decomposition of aqueous manganese (II) nitrate solution, Thermochim. Acta, 2, 405–412, https://doi.org/10.1016/0040-6031(71)85016-5, 1971.
Goldstein, S. and Rabani, J.: Mechanism of Nitrite Formation by Nitrate Photolysis in Aqueous Solutions: The Role of Peroxynitrite, Nitrogen Dioxide, and Hydroxyl Radical, J. Am. Chem. Soc., 129, 10597–10601, https://doi.org/10.1021/ja073609+, 2007.
Kasibhatla, P., Sherwen, T., Evans, M. J., Carpenter, L. J., Reed, C., Alexander, B., Chen, Q., Sulprizio, M. P., Lee, J. D., Read, K. A., Bloss, W., Crilley, L. R., Keene, W. C., Pszenny, A. A. P., and Hodzic, A.: Global impact of nitrate photolysis in sea-salt aerosol on NOx, OH, and O3 in the marine boundary layer, Atmos. Chem. Phys., 18, 11185–11203, https://doi.org/10.5194/acp-18-11185-2018, 2018.
Lee, Y. N. and Schwartz, S. E.: Kinetics of oxidation of aqueous sulfur(IV) by nitrogen dioxide, Brookhaven National Lab., Upton, NY, USA, https://wpw.bnl.gov/schwartz/wp-content/uploads/sites/11/2022/04/lee83no2sivc.pdf (last access: 12 April 2024), 1982.
Li, X., Rohrer, F., Hofzumahaus, A., Brauers, T., Häseler, R., Bohn, B., Broch, S., Fuchs, H., Gomm, S., Holland, F., Jäger, J., Kaiser, J., Keutsch, F. N., Lohse, I., Lu, K., Tillmann, R., Wegener, R., Wolfe, G. M., Mentel, T. F., Kiendler-Scharr, A., and Wahner, A.: Missing Gas-Phase Source of HONO Inferred from Zeppelin Measurements in the Troposphere, Science, 344, 292–296, https://doi.org/10.1126/science.1248999, 2014.
Lian, Z., Li, G., Zhang, S., Ma, W., and Zhong, Q.: Mechanism and Kinetic Study of Cyclodextrin Use to Facilitate NO2 Absorption in Sulfite Solutions, Environ. Sci. Technol., 56, 7696–7706, https://doi.org/10.1021/acs.est.2c00838, 2022.
Liang, Z., Zhang, R., Gen, M., Chu, Y., and Chan, C. K.: Nitrate Photolysis in Mixed Sucrose–Nitrate–Sulfate Particles at Different Relative Humidities, J. Phys. Chem. A, 125, 3739–3747, https://doi.org/10.1021/acs.jpca.1c00669, 2021.
Ma, Q., Zhong, C., Ma, J., Ye, C., Zhao, Y., Liu, Y., Zhang, P., Chen, T., Liu, C., Chu, B., and He, H.: Comprehensive Study about the Photolysis of Nitrates on Mineral Oxides, Environ. Sci. Technol., 55, 8604–8612, https://doi.org/10.1021/acs.est.1c02182, 2021.
McFall, A. S., Edwards, K. C., and Anastasio, C.: Nitrate Photochemistry at the Air–Ice Interface and in Other Ice Reservoirs, Environ. Sci. Technol., 52, 5710–5717, https://doi.org/10.1021/acs.est.8b00095, 2018.
Moorcroft, M. J., Davis, J., and Compton, R. G.: Detection and determination of nitrate and nitrite: a review, Talanta, 54, 785–803, https://doi.org/10.1016/S0039-9140(01)00323-X, 2001.
Mora Garcia, S. L., Pandit, S., Navea, J. G., and Grassian, V. H.: Nitrous Acid (HONO) Formation from the Irradiation of Aqueous Nitrate Solutions in the Presence of Marine Chromophoric Dissolved Organic Matter: Comparison to Other Organic Photosensitizers, ACS Earth Space Chem., 5, 3056–3064, https://doi.org/10.1021/acsearthspacechem.1c00292, 2021.
Pratt, P. F., Nithipatikom, K., and Campbell, W. B.: Simultaneous Determination of Nitrate and Nitrite in Biological Samples by Multichannel Flow Injection Analysis, Analyt. Biochem., 231, 383–386, https://doi.org/10.1006/abio.1995.0067, 1995.
Ridnour, L. A., Sim, J. E., Hayward, M. A., Wink, D. A., Martin, S. M., Buettner, G. R., and Spitz, D. R.: A Spectrophotometric Method for the Direct Detection and Quantitation of Nitric Oxide, Nitrite, and Nitrate in Cell Culture Media, Analyt. Biochem., 281, 223–229, https://doi.org/10.1006/abio.2000.4583, 2000.
Roca, M., Zahardis, J., Bone, J., El-Maazawi, M., and Grassian, V. H.: 310 nm Irradiation of Atmospherically Relevant Concentrated Aqueous Nitrate Solutions: Nitrite Production and Quantum Yields, J. Phys. Chem. A, 112, 13275–13281, https://doi.org/10.1021/jp809017b, 2008.
Romer, P. S., Wooldridge, P. J., Crounse, J. D., Kim, M. J., Wennberg, P. O., Dibb, J. E., Scheuer, E., Blake, D. R., Meinardi, S., Brosius, A. L., Thames, A. B., Miller, D. O., Brune, W. H., Hall, S. R., Ryerson, T. B., and Cohen, R. C.: Constraints on Aerosol Nitrate Photolysis as a Potential Source of HONO and NOx, Environ. Sci. Technol., 52, 13738–13746, https://doi.org/10.1021/acs.est.8b03861, 2018.
Scharko, N. K., Berke, A. E., and Raff, J. D.: Release of Nitrous Acid and Nitrogen Dioxide from Nitrate Photolysis in Acidic Aqueous Solutions, Environ. Sci. Technol., 48, 11991–12001, https://doi.org/10.1021/es503088x, 2014.
Seinfeld, J. H. and Pandis, S. N.: Atmospheric Chemistry and Physics: From Air Pollution to Climate Change, 2nd Edn., John Wiley & Sons, Inc., Hoboken, NJ, 1203 pp., ISBN 13:978-0-471-72018-8, ISBN 10:0-471-72018-6, 2006.
Shen, C. H. and Rochelle, G. T.: Nitrogen Dioxide Absorption and Sulfite Oxidation in Aqueous Sulfite, Environ. Sci. Technol., 32, 1994–2003, https://doi.org/10.1021/es970466q, 1998.
Shi, Q., Tao, Y., Krechmer, J. E., Heald, C. L., Murphy, J. G., Kroll, J. H., and Ye, Q.: Laboratory Investigation of Renoxification from the Photolysis of Inorganic Particulate Nitrate, Environ. Sci. Technol., 55, 854–861, https://doi.org/10.1021/acs.est.0c06049, 2021.
Song, H., Lu, K., Ye, C., Dong, H., Li, S., Chen, S., Wu, Z., Zheng, M., Zeng, L., Hu, M., and Zhang, Y.: A comprehensive observation-based multiphase chemical model analysis of sulfur dioxide oxidations in both summer and winter, Atmos. Chem. Phys., 21, 13713–13727, https://doi.org/10.5194/acp-21-13713-2021, 2021.
Stavrakou, T., Müller, J.-F., Boersma, K. F., van der A, R. J., Kurokawa, J., Ohara, T., and Zhang, Q.: Key chemical NOx sink uncertainties and how they influence top-down emissions of nitrogen oxides, Atmos. Chem. Phys., 13, 9057–9082, https://doi.org/10.5194/acp-13-9057-2013, 2013.
Van Rossum, G. and Drake Jr., F. L.: Python reference manual, Centrum voor Wiskunde en Informatica, Amsterdam, https://ir.cwi.nl/pub/5007/05007D.pdf (last access: 12 April 2024), 1995.
Wang, J., Li, J., Ye, J., Zhao, J., Wu, Y., Hu, J., Liu, D., Nie, D., Shen, F., Huang, X., Huang, D. D., Ji, D., Sun, X., Xu, W., Guo, J., Song, S., Qin, Y., Liu, P., Turner, J. R., Lee, H. C., Hwang, S., Liao, H., Martin, S. T., Zhang, Q., Chen, M., Sun, Y., Ge, X., and Jacob, D. J.: Fast sulfate formation from oxidation of SO2 by NO2 and HONO observed in Beijing haze, Nat. Commun., 11, 2844, https://doi.org/10.1038/s41467-020-16683-x, 2020.
Wang, X., Dalton, E. Z., Payne, Z. C., Perrier, S., Riva, M., Raff, J. D., and George, C.: Superoxide and Nitrous Acid Production from Nitrate Photolysis Is Enhanced by Dissolved Aliphatic Organic Matter, Environ. Sci. Technol. Lett., 8, 53–58, https://doi.org/10.1021/acs.estlett.0c00806, 2021.
Wang, Y., Huang, D. D., Huang, W., Liu, B., Chen, Q., Huang, R., Gen, M., Mabato, B. R. G., Chan, C. K., Li, X., Hao, T., Tan, Y., Hoi, K. I., Mok, K. M., and Li, Y. J.: Enhanced Nitrite Production from the Aqueous Photolysis of Nitrate in the Presence of Vanillic Acid and Implications for the Roles of Light-Absorbing Organics, Environ. Sci. Technol., 55, 15694–15704, https://doi.org/10.1021/acs.est.1c04642, 2021.
Warneck, P. and Wurzinger, C.: Product quantum yields for the 305-nm photodecomposition of nitrate in aqueous solution, J. Phys. Chem., 92, 6278–6283, https://doi.org/10.1021/j100333a022, 1988.
Ye, C., Gao, H., Zhang, N., and Zhou, X.: Photolysis of Nitric Acid and Nitrate on Natural and Artificial Surfaces, Environ. Sci. Technol., 50, 3530–3536, https://doi.org/10.1021/acs.est.5b05032, 2016.
Ye, C., Zhang, N., Gao, H., and Zhou, X.: Photolysis of Particulate Nitrate as a Source of HONO and NOx, Environ. Sci. Technol., 51, 6849–6856, https://doi.org/10.1021/acs.est.7b00387, 2017.
Yuvaraj, S., Fan-Yuan, L., Tsong-Huei, C., and Chuin-Tih, Y.: Thermal Decomposition of Metal Nitrates in Air and Hydrogen Environments, J. Phys. Chem. B, 107, 1044–1047, https://doi.org/10.1021/jp026961c, 2003. '
Zellner, R., Exner, M., and Herrmann, H.: Absolute OH quantum yields in the laser photolysis of nitrate, nitrite and dissolved H2O2 at 308 and 351 nm in the temperature range 278–353 K, J. Atmos. Chem., 10, 411–425, https://doi.org/10.1007/BF00115783, 1990.
Zepp, R. G., Hoigné, J., and Bader, H.: Nitrate-induced photooxidation of trace organic chemicals in water, Environ. Sci. Technol., 21, 443–450, https://doi.org/10.1021/es00159a004, 1987.
Zhou, X., Civerolo, K., Dai, H., Huang, G., Schwab, J., and Demerjian, K.: Summertime nitrous acid chemistry in the atmospheric boundary layer at a rural site in New York State, J. Geophys. Res.-Atmos., 107, ACH 13-1–ACH 13-11, https://doi.org/10.1029/2001JD001539, 2002.
Zhou, X., Gao, H., He, Y., Huang, G., Bertman, S. B., Civerolo, K., and Schwab, J.: Nitric acid photolysis on surfaces in low-NOx environments: Significant atmospheric implications, Geophys. Res. Lett., 30, 2217, https://doi.org/10.1029/2003GL018620, 2003.