the Creative Commons Attribution 4.0 License.
the Creative Commons Attribution 4.0 License.
 | 08 Apr 2024
Temporal and spatial variations in dust activity in Australia based on remote sensing and reanalysis datasets
Yahui Che
Bofu Yu
Katherine Bracco
Spatial and temporal variations in the level of dust activity can provide valuable information for policymaking and climate research. Recently, Moderate Resolution Imaging Spectroradiometer (MODIS) aerosol products have been successfully used for retrieving dust aerosol optical depth (DAOD), especially over bright dust source areas, and Modern-Era Retrospective analysis for Research and Applications, Version 2 (MERRA-2) aerosol reanalysis provides DAOD and additionally other dust-aerosol-related parameters. In this study, spatial and temporal variations in dust activity in Australia were analyzed using MODIS and MERRA-2 combined (M&M) DAOD and MERRA-2 near-surface dust concentrations and estimated PM10 for the period 1980–2020. Validation results show that M&M DAOD has an expected error of compared to the ground observations at the AErosol RObotic NETwork (AERONET) dust storms on populated areas sites. MERRA-2 near-surface dust concentrations show a power-law relationship with visibility data collected at meteorological stations with an r2 value from 0.18 to 0.44, and the estimated MERRA-2 PM10 shows similar temporal variations and correlates with ground-based PM10 data with an r2 value from 0.14 to 0.44 at six selected stations in Australia. Moreover, MERRA-2 horizontal dust flux shows the same major dust pathways as those in previous studies and similar dust emissions and deposition areas identified using ground-based observations. Dust events based on DAOD over eastern Australia are concentrated in the north in December, are concentrated in the south in February, and can occur anywhere in January. Near-surface dust concentration was found to be the highest (over 200 µg m−3) over the center of Lake Eyre basin in central Australia and radially decreased toward the coast to below 20 µg m−3 via the two main pathways in the southwest and northeast. The ratio of near-surface dust concentration to PM10 shows a similar spatial pattern. Total dust emission was estimated to be 40 Mt (megatonnes) per year over the period 1980–2020, of which nearly 50 % was deposited on land and the rest exported away from the Australian continent.
- Article
(13032 KB) - Full-text XML
- BibTeX
- EndNote


Dust storms, as a natural hazard, occur frequently in Australia, especially in the central inland area, which is identified as the largest dust source in the Southern Hemisphere (Shao, 2009; McTainsh et al., 2011a, b; Ekström et al., 2004), contributing to approximately 5 % of the global total dust emissions (Shao, 2009; Wu et al., 2020; Chen et al., 2022). Dust sourced from the Lake Eyre basin is not only deposited on the Australian continent but also transported to the Tasman Sea in the southeast and the Indian Ocean in the northwest (Strong et al., 2011; Bowler, 1976; Sprigg, 1982; Speer, 2013; Ekström et al., 2004; Shao et al., 2007). The adverse impacts of dust storms on populated areas include incalculable economic loss in agriculture (Stefanski and Sivakumar, 2009) and household cleaning and associated activities (Tozer and Leys, 2013), human health issues such as respiratory problems (Roberts, 2013; Chen et al., 2007; Cowie et al., 2010; Goudie, 2014; Middleton, 2017) and cardiovascular disease (Domínguez-Rodríguez et al., 2021; Zhang et al., 2016), and contamination of water sources (Middleton, 2017). Moreover, the Australian dust over the southwest Pacific Ocean strengthens the relationship between rainfall and the El Niño–Southern Oscillation (ENSO) by driving ENSO-related anomalies in radiative forcing (Rotstayn et al., 2011), which is the direct dust feedback to climate (Shao et al., 2013).
The severity of dust activities can be indicated by a range of different approaches, including visibility-based dust event days and the dust storm index (DSI) (Yu et al., 1992, 1993; McTainsh et al., 2011b; O'Loingsigh et al., 2017) and total suspended dust concentration (Shao et al., 2013; McTainsh et al., 2005; Tews, 1996; Baddock et al., 2014), aerosol optical depth (AOD) and DAOD (dust AOD) (Ginoux et al., 2010; Pu and Ginoux, 2018; Yu and Ginoux, 2021; Ginoux et al., 2012; She et al., 2018) and the dust indices (Di et al., 2016; Yang et al., 2023; Bullard et al., 2008), simulated near-surface dust concentration (Prospero et al., 2020; Buchard et al., 2017), and PM10 (particles with a diameter of 10 µm or less) (Leys et al., 2011; de Jesus et al., 2020). The Dust Event Database (DEDB) and DSI has been widely used in dust and wind erosion research in Australia, benefiting from the long-term temporal data gathered at widely distributed Bureau of Meteorology (BoM) sites (McTainsh and Pitblado, 1987; McTainsh et al., 2011a; O'Loingsigh et al., 2014). Horizontal visibility has also been used for estimating the dust concentration and dust loading for large dust storms (McTainsh et al., 2005), and visibility-based dust concentration has even been used for exploring the climate forcing of dust at the global scale (Shao et al., 2013).
With the development of satellite remote sensing and numerical dust models, remote sensing and general circulation model (GCM) products have been increasingly applied to dust research with regard to spatial extent detection, columnar optical properties, and near-surface concentrations. Dust indices based on satellite images can be traced back to the detection of dust storms using Advanced Very High Resolution Radiometer (AVHRR) data (Ackerman, 1989), taking advantage of the AVHRR large spatial coverage. So far, several different dust indices have been developed for regional or global dust detection and for different sensors (Yang et al., 2023). Satellite-data-retrieved AOD and DAOD have been more frequently applied to quantitative dust research, since AOD can be successfully retrieved over bright dust source areas (Hsu et al., 2004; Ginoux et al., 2010; Baddock et al., 2009). Benefiting from satellites providing dust source schemes (Ginoux et al., 2001), near-surface dust concentrations have been simulated for specific regions or on a global scale (Gelaro et al., 2017; Buchard et al., 2017; Shao et al., 2007; Wu et al., 2020).
Analyses of long-term AOD and DAOD data have rarely been attempted for Australia. AOD and DAOD was mostly used for identifying the spatial extent of single dust events or as reference data for evaluating dust detection algorithms in Australia. For example, Baddock et al. (2009) assessed the performance of four detection algorithms based on Moderate Resolution Imaging Spectroradiometer (MODIS) Level 1B (L1B) data and MODIS Deep Blue (DB) AOD for central Australia (i.e., the Lake Eyre basin) in identifying airborne dust and mineral aerosols. There are a few dust studies on analyzing seasonal spatial variations in dust using a multi-year AOD and DAOD dataset. Ginoux et al. (2012) retrieved global DAOD using the MODIS DB aerosol dataset from 2003 to 2009 and analyzed major anthropogenic and natural dust emissions in Australia. Their results show that the contribution to total emissions by anthropogenic activities can be as high as 75 % in Australia. Yu and Ginoux (2021) showed the monthly MODIS DB DAOD and Multi-angle Imaging SpectroRadiometer (MISR) coarse-mode AOD at 15 AERONET (AErosol RObotic NETwork) sites and the annual DAOD and coarse-mode AOD in Australia from 2000 to 2019. A comparison with DSI shows that satellite AOD and DAOD presents the same dusty month and season as that by DSI at three AERONET sites in the main Australian dust source area. Yang et al. (2021) showed similar AERONET coarse-mode AOD variations and seasonal contributions of dust to total aerosols at nine AERONET sites and analyzed seasonal DAOD from the Modern-Era Retrospective analysis for Research and Applications, Version 2 (MERRA-2) aerosol reanalysis from the early 2000s to 2020. There are limitations to this type of investigation using MODIS and MERRA-2 data. Firstly, MODIS DB-retrieved DAOD shows much smaller coverage than the original DB AOD due to the exclusion of low background DAOD, possibly resulting in an overestimation of dust activity severity. Secondly, MERRA-2 is very likely to have underestimated DAOD over 0.2, especially for severe dust storms such as those on 23 October 2002 and 23 September 2009 (Che et al., 2022).
PM10 is often taken as an effective indicator of dust severity for single dust storms (Leys et al., 2011; McGowan and Clark, 2008); however, long-term analysis of dust severity for Australia is very difficult using PM10 data. First, PM10 observations in each state mostly began after 2000 in populated urban areas, while the dust source area in central Australia lacks PM10 observations. This spatial distribution of PM10 sites also causes difficulties in retrieving PM10 in Australia using satellite AOD. Second, little progress has been made in retrieving PM10 for large regions based on remote sensing products in Australia because (1) a reliable estimate of PM10 is difficult to obtain due to the relatively low dust concentrations approaching its retrieval uncertainty and (2) the inclusion of AOD and related predictors cannot improve the accuracy of simulated PM10 (Pereira et al., 2017). Therefore, trend analyses of PM10 concentrations in Australia have predominantly focused on site-based observations. For example, de Jesus et al. (2020) analyzed PM10 trends in major cities of Australia over the past 2 decades using site PM10 observations; however, they did not conduct a trend analysis specifically for dust concentrations because the dust component could not be accurately obtained from PM10, which consists of both dust and non-dust particles from multiple sources. In contrast to PM10, total near-surface suspended dust concentration is capable of indicating the severity of dust events with all ranges of particle sizes, while PM10 observations only include particles smaller than 10 µm. For example, Love et al. (2019) analyzed 17-year (1990–2007) near-surface dust concentration data collected by a high-volume air sampler (HVS) in Mildura. To provide a more specific analysis of dust particle concentrations, Prospero et al. (2020) removed soluble sea salt particles from HVS samples collected. Long-term dust analysis studies such as these are relatively few compared to those based on visibility-transferred dust concentrations. Nevertheless, the relationship between horizontal visibility and total suspended dust concentration varies among different studies. As noted by McTainsh et al. (2005), the relationships between visibility and dust concentration obtained in the United States (Chepil and Woodruff, 1957) and in Australia in the 1990s (Tews, 1996) have been inappropriate for estimating dust concentration over different areas of Australia, since visibility-based dust concentrations are strongly influenced by dust particle size. Considering that WMO weather stations are often not located in dust sources where previous visibility–dust concentration relationships were established, Baddock et al. (2014) developed an empirical model for calculating total dust concentration (in Mildura) 10–100 m from the dust source (in Buronga).
The development of numerical dust models and GCMs provides dust cycle simulations for understanding the impacts of dust on the earth systems. Models such as Georgia Tech/Goddard Global Ozone Chemistry Aerosol Radiation and Transport (GOCART) (Ginoux et al., 2001), Mineral Dust Entrainment and Deposition (DEAD) (Zender, 2003), and the Model of Aerosol Species IN the Global AtmospheRe (MASINGAR) coupled with MRI/JMA98 GCM (Tanaka and Chiba, 2006) have all proved capable of simulating the dust cycle for different regions around the world. However, dust emissions and depositions vary substantially among models (Chen et al., 2022; Wu et al., 2020). This would directly lead to a large discrepancy in conclusions based on different models. For example, the contribution of Australian dust to global dust emissions is estimated to vary from 0.02 % to 27.8 % using simulation outputs from 15 CMIP5 (Coupled Model Intercomparison Project Phase 5) models (Wu et al., 2020). Therefore, long-term analysis of the dust cycle in Australia needs a dataset with high accuracy and the capability to quantify long-term trends and variabilities, such as the MERRA-2 aerosol product.
Numerous validation studies have shown that MERRA-2 optical depth and near-surface concentrations could be used for temporal and spatial analysis and even long-term analysis of aerosols regionally or globally due to its high quality and long temporal coverage from 1980 to the present. This kind of study primarily focuses on the validation of MERRA-2 AOD with ground-based AOD from AERONET (Buchard et al., 2017; Sun et al., 2019a; Che et al., 2022; Randles et al., 2017), SONET (Sun–Sky Radiometer Observation Network) (Ou et al., 2022), and SKYNET (Sun et al., 2019b). For dust research in Australia, MERRA-2 AOD has been validated and evaluated with AERONET (Che et al., 2022; Mukkavilli et al., 2019) and MODIS DB datasets (Che et al., 2022), and the DAOD has been evaluated with the MACC (Monitoring Atmospheric Composition and Climate) simulation (Mukkavilli et al., 2019) and MODIS DB-retrieved DAOD (Che et al., 2022). However, few studies have been carried out to validate MERRA-2 near-surface dust concentrations.
MODIS DB and MERRA-2 data products, dust aerosols, and near-surface dust concentration and PM10 observations were analyzed in this study for a better understanding of long-term dust entrainment and transport over Australia. The objectives of this study were
-
to develop a DAOD dataset using MERRA-2 aerosol reanalysis and MODIS DB aerosol datasets;
-
to validate MERRA-2 near-surface dust concentrations using ground-based visibility datasets and MERRA-2-estimated PM10 with ground-based PM10 observations sourced from the New South Wales Air Quality Monitoring Network (NSW AQMN);
-
to corroborate MERRA-2 horizontal dust flux with major dust pathways identified in previous studies;
-
to map the seasonal MODIS and MERRA-2 (M&M) DAOD from 2002 to 2020 and the seasonal MERRA-2 near-surface dust concentrations and PM10 over the period 1980–2020;
-
to quantify the annual dust cycle for Australia over the period 1980–2020, including dust emission in Australia using MERRA-2 emission data, dust import and export using MERRA-2 flux data, and dust deposition using MERRA-2 emission and flux data.
2.1 Ground-based PM10 and AERONET data
AOD at 440 nm and the Ångström exponent (AE) at 440–675 nm from AERONET V3 solar products were used to calculate AOD at 550 nm, and the Level 1.5 (L1.5) single-scattering albedo (SSA) at 440 nm from the V3 inversion product was used to retrieve DAOD. The latest AERONET V3 solar product includes data at Level 1.0 (L1.0) (without data screening), L1.5 (cloud-screened and quality-controlled), and Level 2.0 (L2.0, quality assured) (https://aeronet.gsfc.nasa.gov/, last access: 3 April 2024). Giles et al. (2019) reported that AOD from the AERONET V3 product had a low uncertainty, suggested by a bias of +0.02 and 1σ uncertainty of 0.02. Since satellite AOD normally refers to that at 550 nm, AE is necessarily used for spectrally interpolating AOD to this wavelength according to the dependence of AOD on wavelength (Ångström, 1924). The Version 3 (V3) inversion product also includes data at three levels, L1.0, L1.5, and L2.0. The main difference between L1.5 and L2.0 is that the L2.0 inversion product is only made when the corresponding AOD is higher than 0.4 (Dubovik and King, 2000). This leads to the data volume of L2.0 SSA being far smaller than that of L1.5, especially over Australia which is predominated by low-AOD conditions. L1.5 SSA data with a much larger data volume, therefore, were used to identify dust-contaminated AOD. In this study, all L2.0 AOD and AE, L1.5 SSA, and the fine-mode fraction (FMF) in the spectral deconvolution algorithm (SDA) database in Australia from 1997 to 2020 were used to retrieve DAOD at 550 nm (yellow stars in Fig. 1).
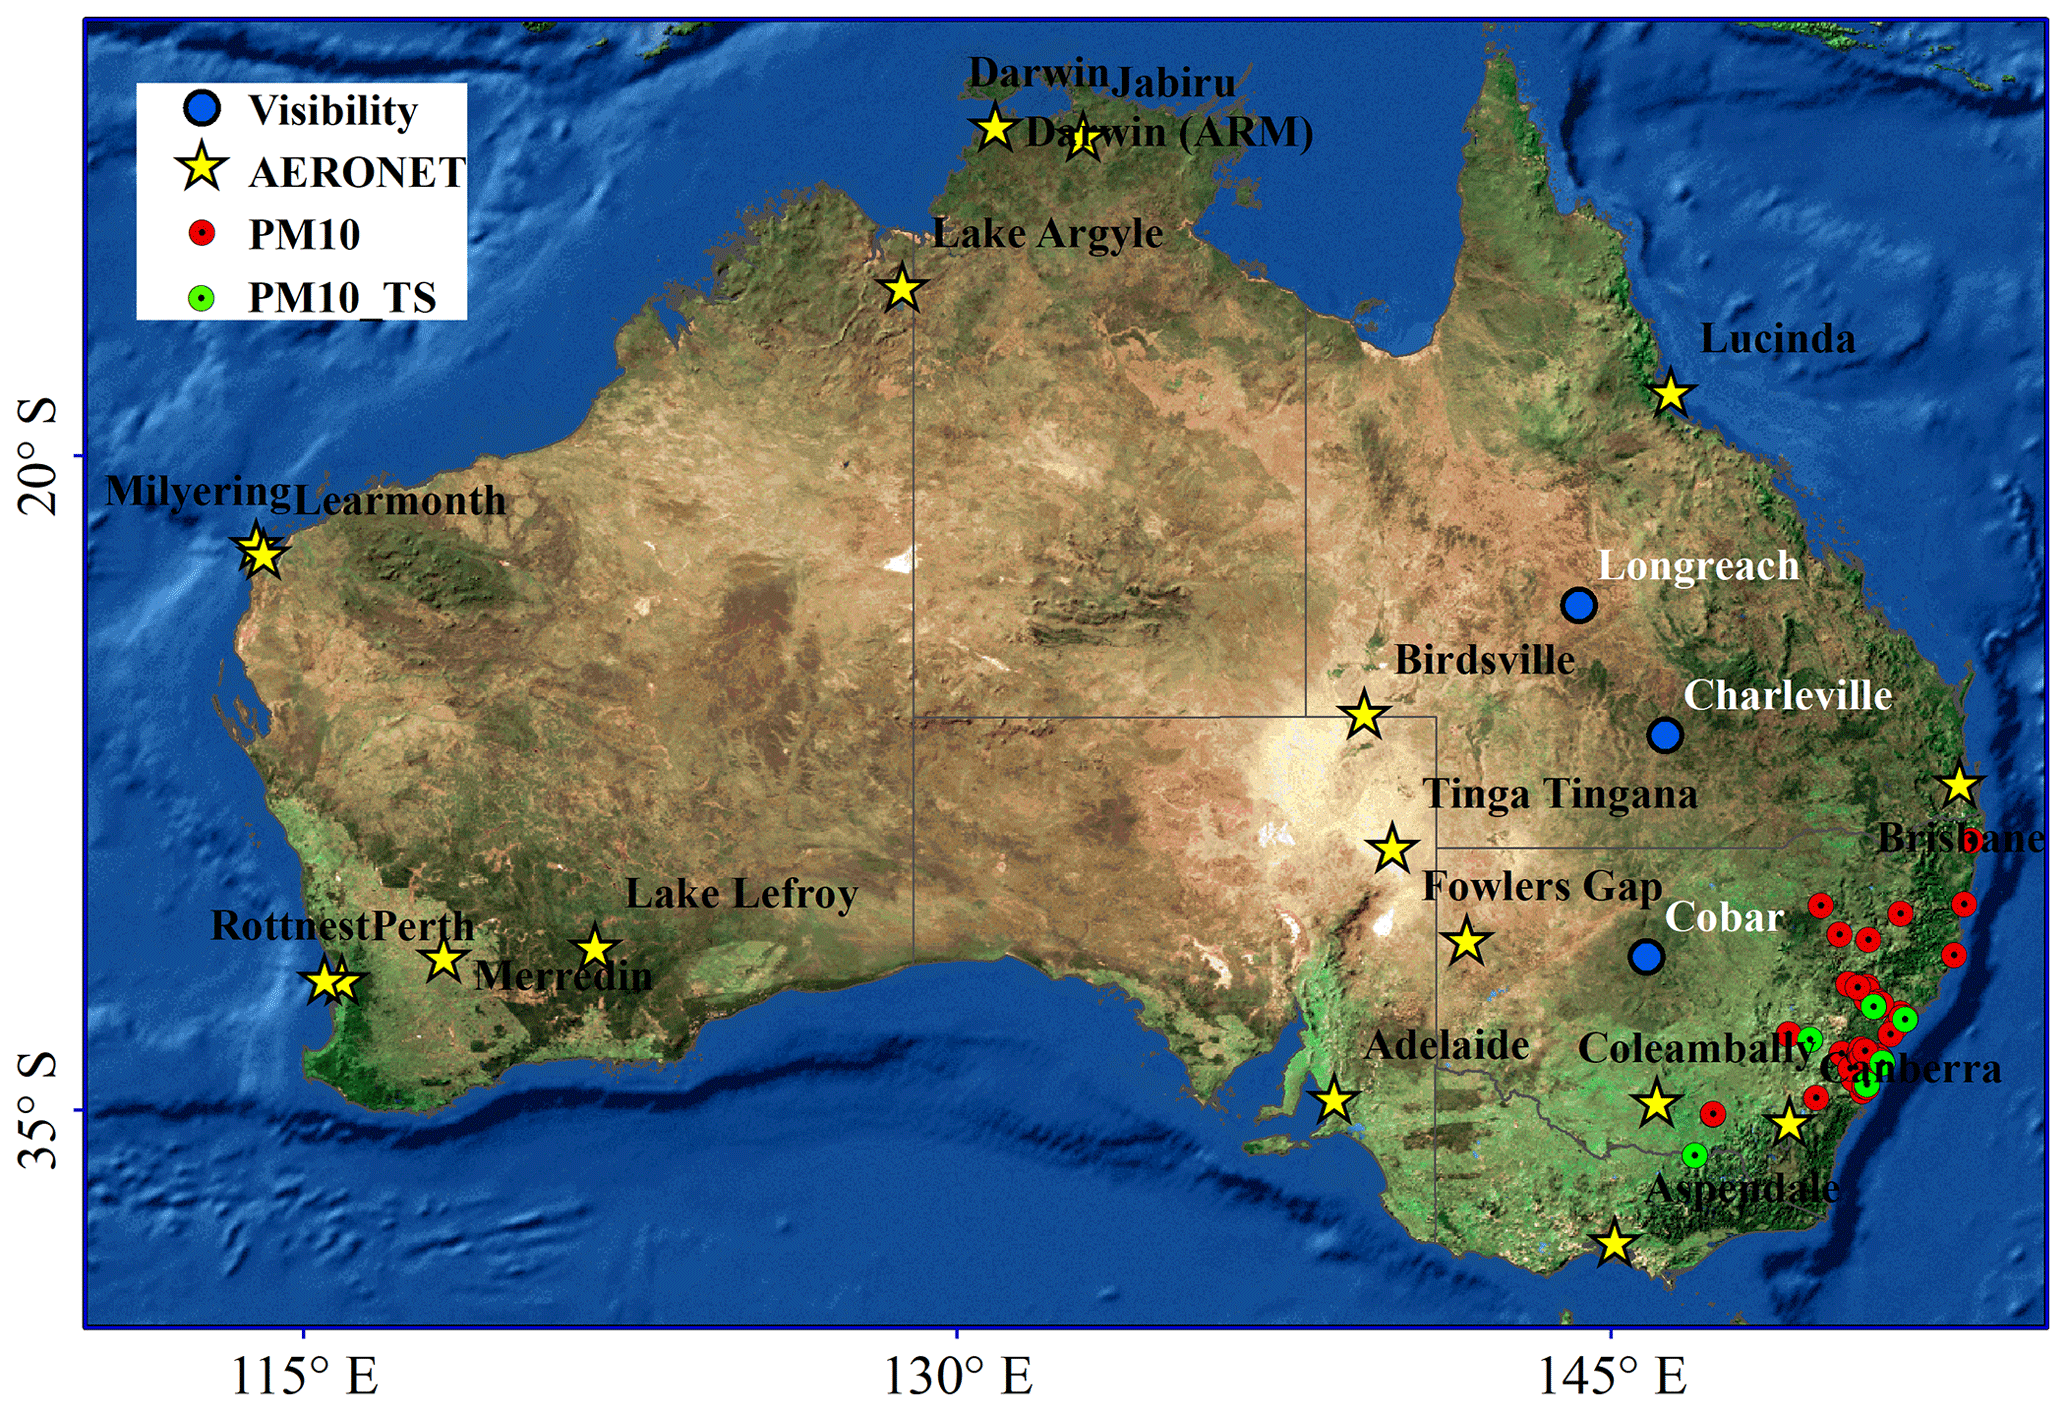
Figure 1Distribution of ground-based sites. Yellow stars are inland AERONET sites in Australia. Green and red circles indicate PM10 observation sites for validating MERRA-2 products; among them time series analysis was conducted at green sites. Blue circles are visibility observation sites.
Horizontal visibility records from the BoM are manually estimated and noted by a weather observer, and visibility is also measured in an automated way with a visibility meter at automatic weather stations (AWSs) from the early 2000s to the present. All manual and AWS visibility records have an upper limit of 10 km, which means that if the record shows a visibility of 10 km, the actual visibility could be 10 km or greater. In addition to visibility, a synoptic code is recorded during notable weather events such as dust storms (Baddock et al., 2014) and a weather type for the weather observation immediately prior to the current observation (O'Loingsigh et al., 2010). There are 11 SYNOP (surface synoptic observations) codes for dust weather, including dust haze, raised dust or sand, dust whirls, thunderstorms with sand or dust storms, and dust storms. Because the visibility record only allocated one SYNOP code, the most important weather code (the higher the code number, the more important the code) was retained, although it may have included several weather types (O'Loingsigh et al., 2010). The long-term visibility records with SYNOP codes have been widely used for wind erosion research (McTainsh et al., 1989, 1990, 2011a), dust event climatologies including the DEDB and DSI developed at Griffith University (McTainsh et al., 2011b; O'Loingsigh et al., 2010, 2014), and single dust events (Shao et al., 2007; McTainsh et al., 2005; Leys et al., 2011). Manual observations of dust activities (using horizontal visibility as a measure) span from the early 19th century to the present (O'Loingsigh et al., 2017). In this study, to ensure the consistency of data points for dust storm research, hourly BoM visibility observations of less than 10 km with a dust SYNOP code (excluding thunderstorms with raised dust) were used. These observations were used to validate MERRA-2 near-surface dust mass concentration at three sites – Charleville, Cobar, and Longreach (Fig. 1) – from 1980 to 2020.
PM10 concentrations are publicly downloadable from the NSW AQMN website (https://www.dpie.nsw.gov.au/, last access: 3 April 2024). AQMN used a tapered element oscillating microbalance (TEOM) instrument, measuring atmospheric particles < 10 µm. The filter in the TEOM weighs collected samples every 2 s, and the average value is reported hourly. Data quality control is applied to all PM10 databases according to Australian Standard 3580.9.8 (Leys et al., 2011). All PM10, gases, and climate observation data can be accessed using the AQMN web data download facility (https://www.dpie.nsw.gov.au/air-quality/air-quality-data-services/data-download-facility, last access: 3 April 2024). In this study, monthly PM data from 62 AQMN urban sites (circles in green and red in Fig. 1) were used for validating MERRA-2 near-surface dust concentrations from 2001 to 2020.
2.2 MERRA-2 aerosol reanalysis
The MERRA-2 aerosol reanalysis provides long-term global aerosol parameter datasets from 1980 to the present (Randles et al., 2017; Gelaro et al., 2017; Buchard et al., 2017). MERRA-2 includes optical depth, near-surface mass concentrations, column mass concentrations, and horizontal mass flux in u- and v-wind direction flux for each aerosol component, including sea salt, sulfate (SO4 and SO2), organic carbon, dust, and black carbon. Due to the inclusion of the Goddard Earth Observing System (GEOS) and the Gridpoint Statistical Interpolation (GSI) assimilation system, MERRA-2 aerosol simulations perform comparably to high-quality satellite-based datasets and are fairly close to aerosol observations. Benefiting from the incorporation of space-based and ground-based observations, the accuracy for the total AOD is guaranteed with physical model outputs constrained by the assimilation system (https://gmao.gsfc.nasa.gov/research/science_snapshots/2015/MERRA2_global_aerosol_dist.php, last access: 3 April 2024). In this study, MERRA-2 dust (DAOD) and total AOD were used to provide the ratio of dust aerosols to total particulate matter, all near-surface aerosol mass concentrations were used to estimate PM10, and horizontal and vertical dust flux was used to estimate dust loading import and export and dust emission and deposition for Australia.
In MERRA-2, the horizontal dust flux (mg m−1 s−1) is divided into northward and eastern components, which are represented by u- and v-wind dust flux, respectively. Similarly to the determination of wind speed and wind direction, the horizontal dust flux (Fd,h; see Eq. 1) and its direction (σd,h; see Eq. 2) can be calculated using MERRA-2 u- and v-wind dust flux data. The angle between the direction of a dust flux pixel crossing the land borders and the land borders was used to determine whether the dust flux was imported or exported:
where Fd,u and Fd,v represent dust flux in the u and v directions, respectively.
The total dust emission (E) and deposition (both in units of Mt, megatonnes) in Australia were calculated using MERRA-2 vertical dust flux, including emission and dry and wet deposition flux. Equations (3) and (4) were used to calculate E and to estimate dust deposition:
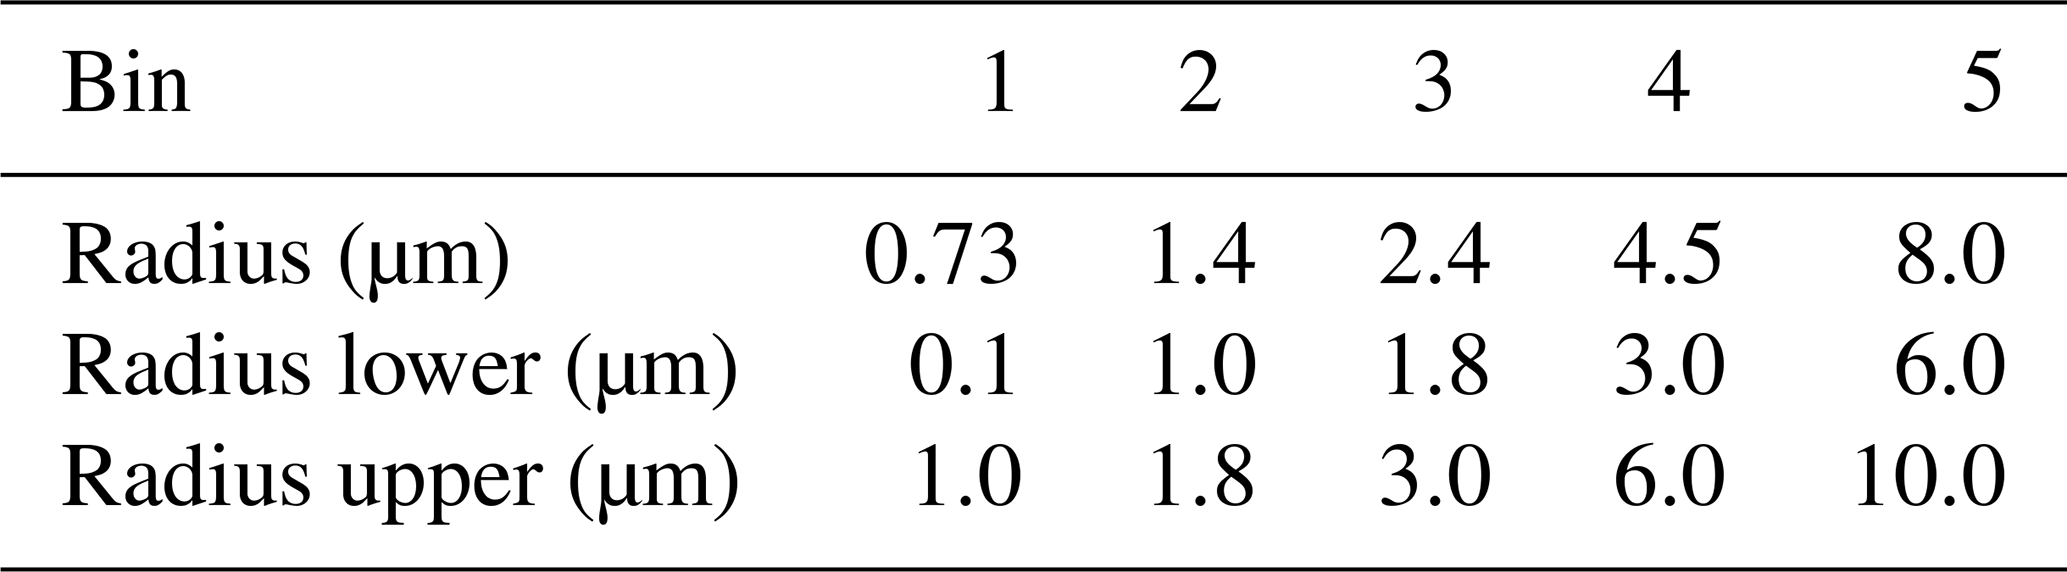
where Em and Tm represent the total dust emission in mass (Mt) and total seconds for the month m, respectively; Fm,n is the total flux of MERRA-2 dust emission flux (kg m−2 s−1) for all five bins (Table 1) for the MERRA-2 pixel n in Australia during the month m; A equals 7.62×10¹² m2, standing for the total land area of Australia excluding Tasmania.
Table 1Dry size range (µm) for dust aerosol simulation with five bins in MERRA-2.
https://gmao.gsfc.nasa.gov/reanalysis/MERRA-2/FAQ/Dust.pdf (last access: 3 April 2024).
Most validation studies of MERRA-2 component concentrations focus on a single site or a few sites, especially the dust component, since they are limited by a lack of ground-based near-surface observations. For example, MERRA-2 organic carbon (OC), black carbon (BC), and sulfate concentration datasets have been validated against ground-based observations in China in Nanjing (Zhao et al., 2021), in Jingsha and Lin'an (Ma et al., 2021), in Beijing (only BC) (Qin et al., 2019; Ou et al., 2022), and over northern India (OC and BC) (Soni et al., 2021). As for the dust component, daily MERRA-2 dust concentrations have been validated in Barbados (daily product) (Buchard et al., 2017) and Cayenne, northern South America (Prospero et al., 2020).
Although there are relatively few ground-based observations, validation results still show daily and monthly MERRA-2 surface mass concentrations in the forms of PM or single components with relatively high accuracy. MERRA-2 near-surface component concentrations can be used for conversion to PM10 using the following equation (Provençal et al., 2017; Ma et al., 2021):
where [SO], [OC], [BC], [DU10], and [SS10] are concentrations of each aerosol component, namely, sulfate, organic carbon, black carbon, dust, and sea salt aerosol, and the subscript 10 indicates particle diameters less than 10 µm. [SO] is multiplied by 1.375 under the assumption that SO4 is fully neutralized by ammonium in the form of (NH4)2SO4 (ammonium sulfate), and a scale factor of 1.8 for OC is included to take into consideration the organic compounds in the particulate organic matter. Equation (5) was developed for estimating MERRA PM10 over Europe (Provençal et al., 2017), which may be inappropriate for PM10 estimation over other regions. For example, Ma et al. (2021) considered the increasing trend of nitrate, which was a large proportion of aerosols in China, and revised Eq. (5) as
where [NO] is the concentration of nitrate. Considering that coarse-mode aerosols take up 57 %–71 % of total aerosols over major cities (Chan et al., 2008) and nitrate emissions contribute much less than other aerosol species to the atmosphere (Bauer et al., 2007), especially during smoke events in the northern savanna (Desservettaz et al., 2017), in this study the method developed by the Global Modeling and Assimilation Office (GMAO) (Eq. 7) using MERRA-2 3-D aerosol mass mixing ratios was used for PM10 estimation over Australia. Nitrate is missing due to its minor contribution to PM10 concentrations:
where the subscripts philic and phobic for [BC] and [OC] represent hydrophilic and hydrophobic BC and OC aerosols, respectively; the numbers after [DU] and [SS] indicate the four sizes of bins, i.e., 001 to 004 represent the bins with a radius of 001 for 0.1–1.0 µm, 002 for 1.0–1.8 µm, 003 for 1.8–3.0 µm, and 004 for 3.0–6.0 µm for dust and similarly for 0.03–0.1 µm, 0.1–0.5 µm, 0.5–1.5 µm, and 1.5–5.0 µm for sea salt; and AIRDENS represents air density (https://gmao.gsfc.nasa.gov/reanalysis/MERRA-2/FAQ/#Q5, last access: 3 April 2024).
2.3 MODIS Deep Blue AOD dataset
The MODIS DB aerosol product provides nearly full global coverage of AOD, AE, and SSA datasets over EOS (Earth Observing System) years (from 2000 to the present) (Sayer et al., 2017). MODIS DB has been widely used for dust research over arid and semi-arid regions, i.e., bright surfaces where the traditional Dark Target (DT) algorithm is not applicable. For example, Ginoux et al. (2012) analyzed the global distribution of dust sources and emissions using the MODIS DB aerosol product, taking advantage of its coverage over bright surfaces and its successful retrieval of AE and SSA together with AOD. Similarly to other aerosol products released by NASA such as DT (Levy et al., 2013) and aerosol climate change initiatives (aerosol_CCI) such as AATSR (Advanced Along-Track Scanning Radiometer) aerosol products (de Leeuw et al., 2015; Sundström et al., 2012; Kolmonen et al., 2016; Thomas et al., 2009), all L2 MODIS DB aerosol datasets in the latest C61 product were produced with a spatial resolution of 10 km with all MODIS radiance data. In this study, the MODIS DB aerosol product for Aqua from 2002 to 2020 was selected.
MODIS DB key parameters have been validated over Australia and globally, especially AOD. The MODIS DB AOD dataset has been validated against AERONET data (Che et al., 2022; Sayer et al., 2019; Wei et al., 2019); inter-compared with other AOD products for MODIS, such as MAIAC and DT (Shaylor et al., 2022); and even evaluated with MERRA-2 AOD (Che et al., 2022) over Australia. These studies show that there is a high probability of data points (MODIS DB and AERONET) within the expected envelope (EE) lines, which are defined with two lines () containing approximately 68 % of data points (Che et al., 2022). The latest MODIS DB aerosol product limits AE values from 0 to 1.8, and in low-AOD conditions the AE is set to <1.0 over bright surfaces and is fixed to 1.5 over vegetated surfaces (Sayer et al., 2013; Hsu et al., 2013). Sayer et al. (2019) tested the performance of MODIS AE in different conditions, including dust cases and fine-mode cases. Over vegetated surfaces, MODIS DB AE was overestimated systematically with a broad range of error from 0.5 to 1 for dusty conditions, while over dry surfaces the performances of MODIS DB AE have improved in systematic overestimation but still have a broad error range (Sayer et al., 2019). Therefore, dust detection by MODIS DB could be uncertain to some extent.
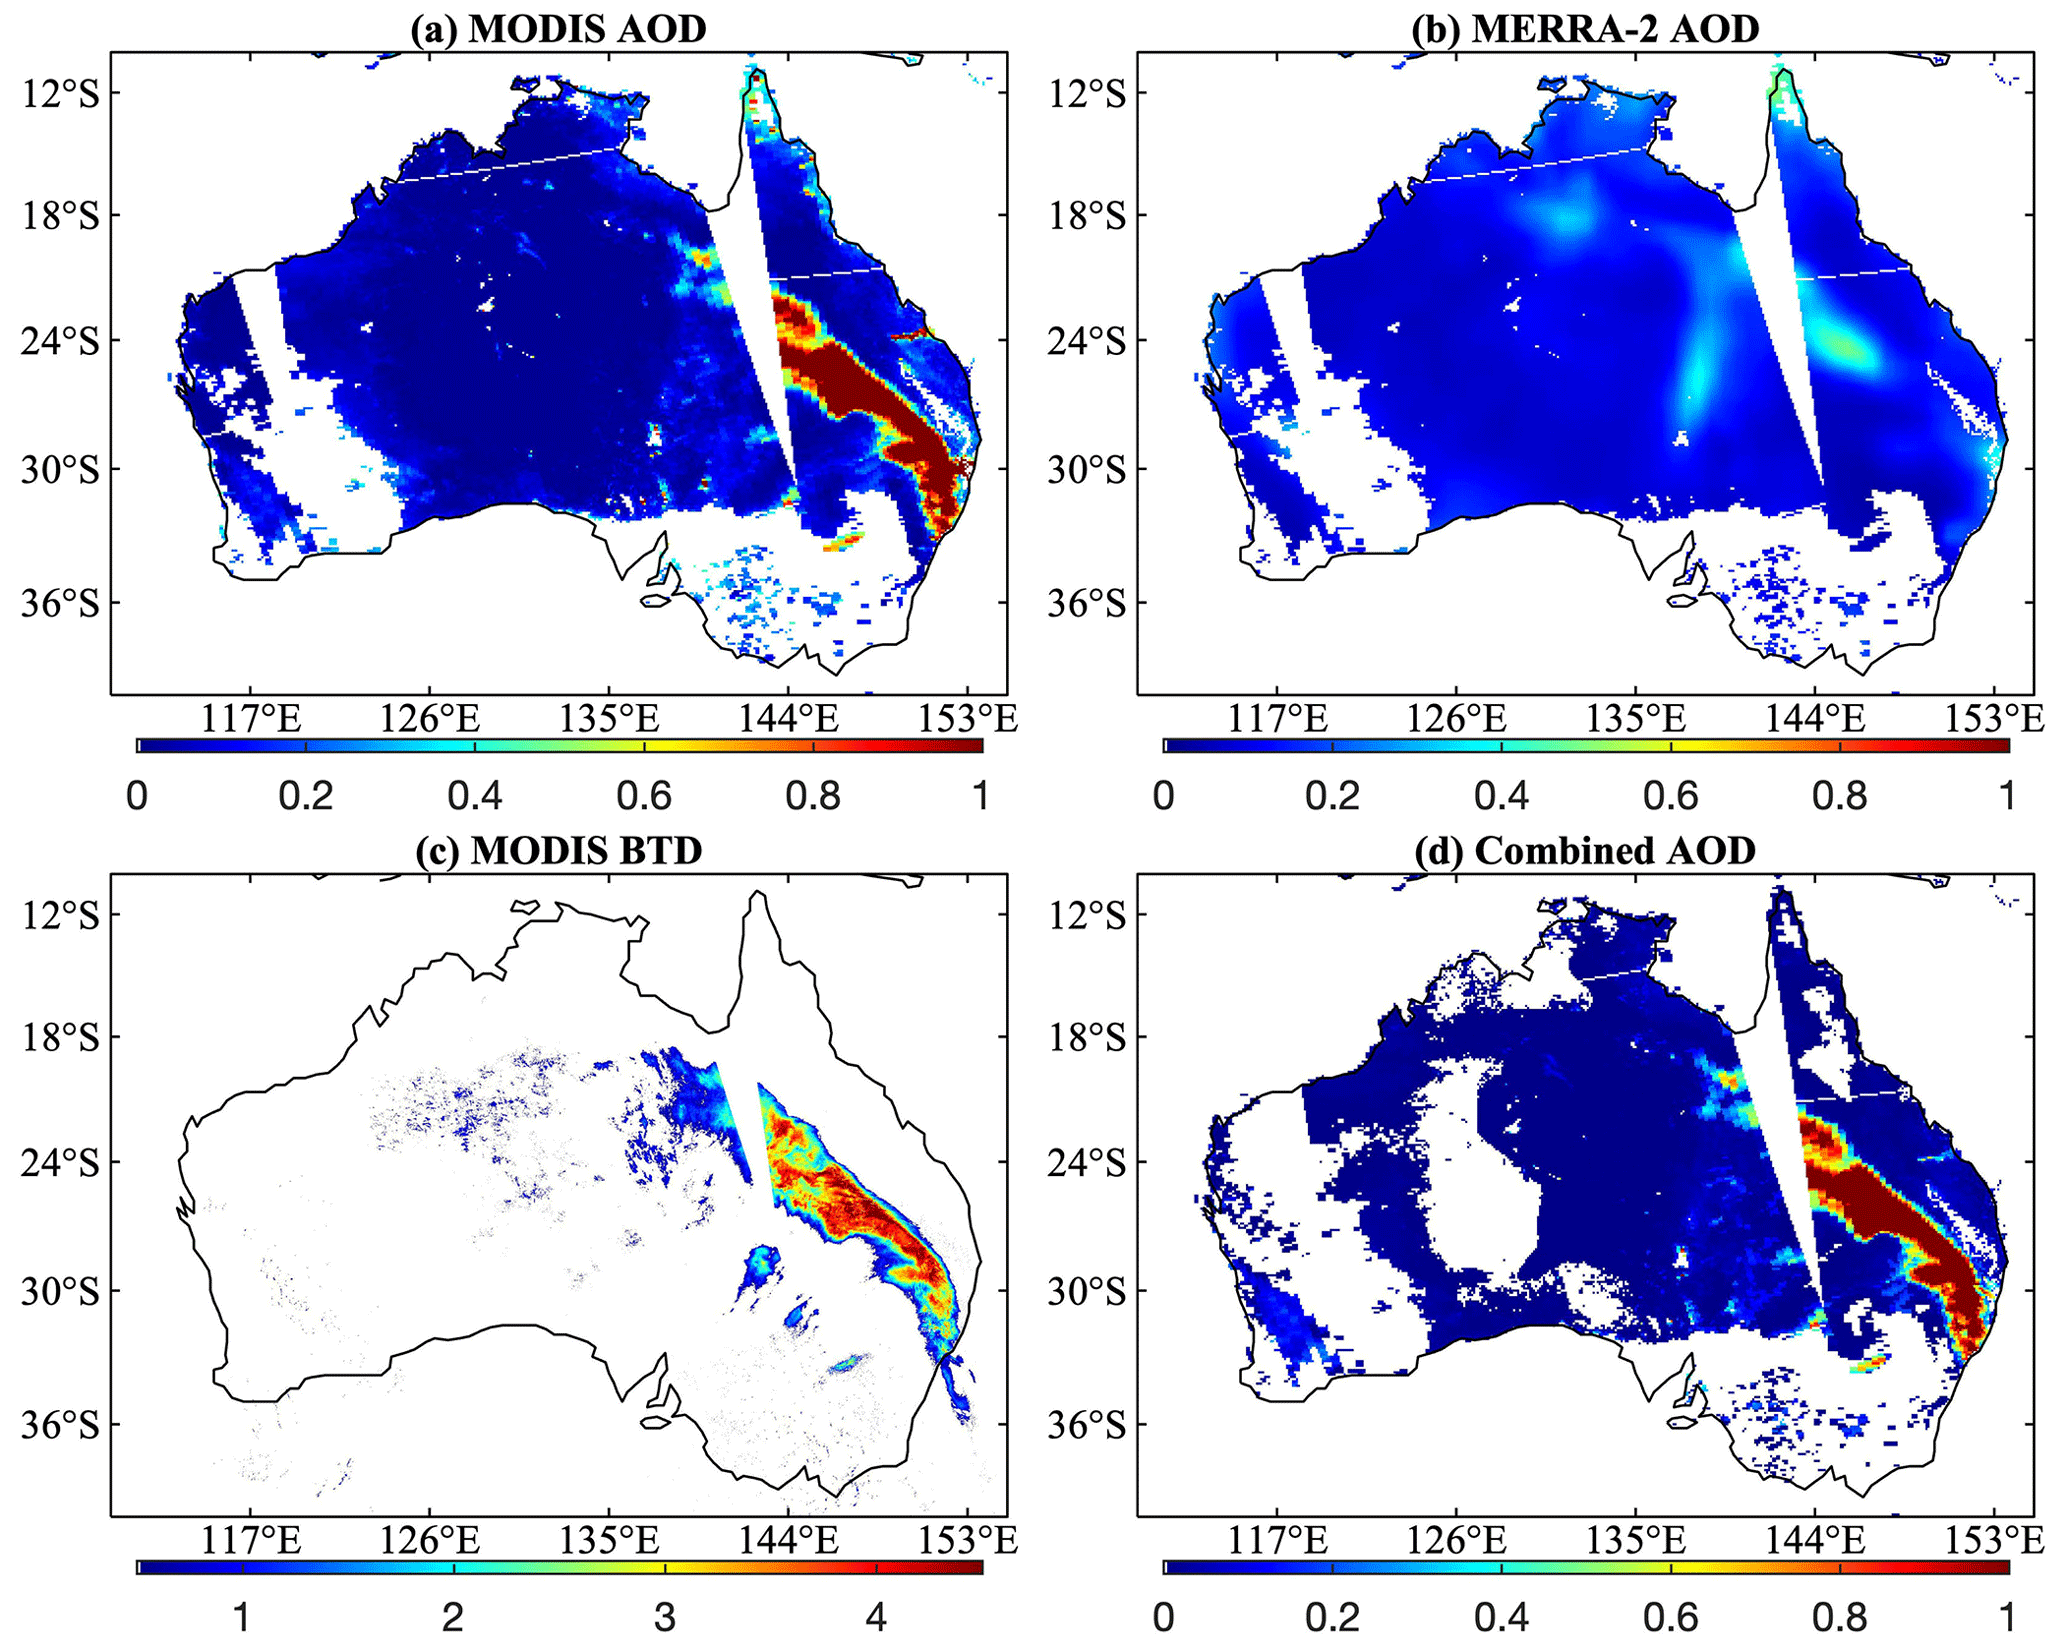
Figure 2Development of DAOD using MERRA-2 and MODIS DB datasets: (a) MODIS DB AOD, (b) MERRA-2 AOD, (c) MODIS brightness temperature difference (BTD), and (d) MODIS–MERRA combined DAOD (M&M).
2.4 MODIS–MERRA (M&M) combined DAOD
DAOD has been successfully retrieved based on the MODIS DB product by a coarse-mode fraction (CMF) in Eq. (8) (Ginoux et al., 2010, 2012; Pu and Ginoux, 2017):
The early version of the MODIS B DAOD dataset has been used for analyzing the global distribution of dust sources (Ginoux et al., 2012) and constructing a global DAOD climatology (Voss and Evan, 2020). The new version of the MODIS DB DAOD dataset has been used for evaluating DAOD satellite remote sensing from GCMs and CALIOP, such as CMIP5 (Pu and Ginoux, 2018), MERRA-2 (Che et al., 2022), and CALIOP (Song et al., 2021). In Australia, the MODIS DB DAOD dataset was validated against AERONET data, and the results show that 88 % and 71 % of data points for MODIS/Terra and MODIS/Aqua, respectively, fall within an EE of () (Che et al., 2022). Although studies have shown that the MODIS DB DAOD dataset is of high quality, there are still several factors limiting its application to dust research in Australia. First, the data coverage of the MODIS DB DAOD dataset only includes obvious dust plumes. Second, MODIS DB AE retrievals have a broad range of errors over both bright and vegetated surfaces, especially systematic overestimations over vegetated surfaces (Sayer et al., 2019), causing non-negligible uncertainty in the MODIS DB DAOD dataset. Third, AE was fixed in low-AOD conditions (Sayer et al., 2013; Hsu et al., 2013). The MERRA-2 aerosol reanalysis is expected to make up for these deficiencies.
A new DAOD dataset has been developed for Australia in this study using the MODIS DB aerosol product and MERRA-2 aerosol reanalysis. Figure 2a shows MODIS DB AOD on 23 October 2002 with hundreds of kilometers of dust plume in eastern Australia, while the dust plume is seriously underestimated by MERRA-2 (Fig. 2b) compared with MODIS BTD in Fig. 2c. In order to take advantage of MODIS DB in catching dust plumes and MERRA-2 in spatial coverage, DAOD is equal to MODIS DB DAOD when it is available; otherwise, DAOD is equal to MODIS DB AOD multiplied by the ratio of MERRA-2 DAOD to total AOD. This is based on the assumption that the dust fraction in MERRA-2 has a high accuracy with LIVAS (Gkikas et al., 2021) and AERONET (Che et al., 2022). Figure 2d shows that the final DAOD is capable of screening sea salt AOD over the Cape York Peninsula and has the same spatial coverage as MODIS DB AOD. Although Sayer et al. (2019) suggest that AE should be only used for discriminating coarse-mode-dominated AOD from fine-mode-dominated AOD qualitatively, a smoke plume (Fig. 2d) over the Australian east coast was effectively removed from MODIS DB AOD.
2.5 Gridded SILO monthly rainfall data
The SILO datasets developed by the Queensland government are aimed at providing long-term continuous point-level and full-coverage gridded climate datasets for land areas of Australia from 1989 to the present (https://www.longpaddock.qld.gov.au/silo/, last access: 3 April 2024). The full-coverage gridded rainfall dataset at a temporal resolution of a day and a month was produced by interpolating BoM daily and monthly rainfall observations with a kriging method (Jeffrey et al., 2001). Validation results show that the accuracy of SILO data is typically higher around areas with densely distributed BoM rainfall gauge sites (Jeffrey et al., 2001). Overall, except for parts of Western Australia with few BoM rainfall sites, SILO rainfall shows a high accuracy with an R2>0.8 over most of the Australian land (Jeffrey et al., 2001).
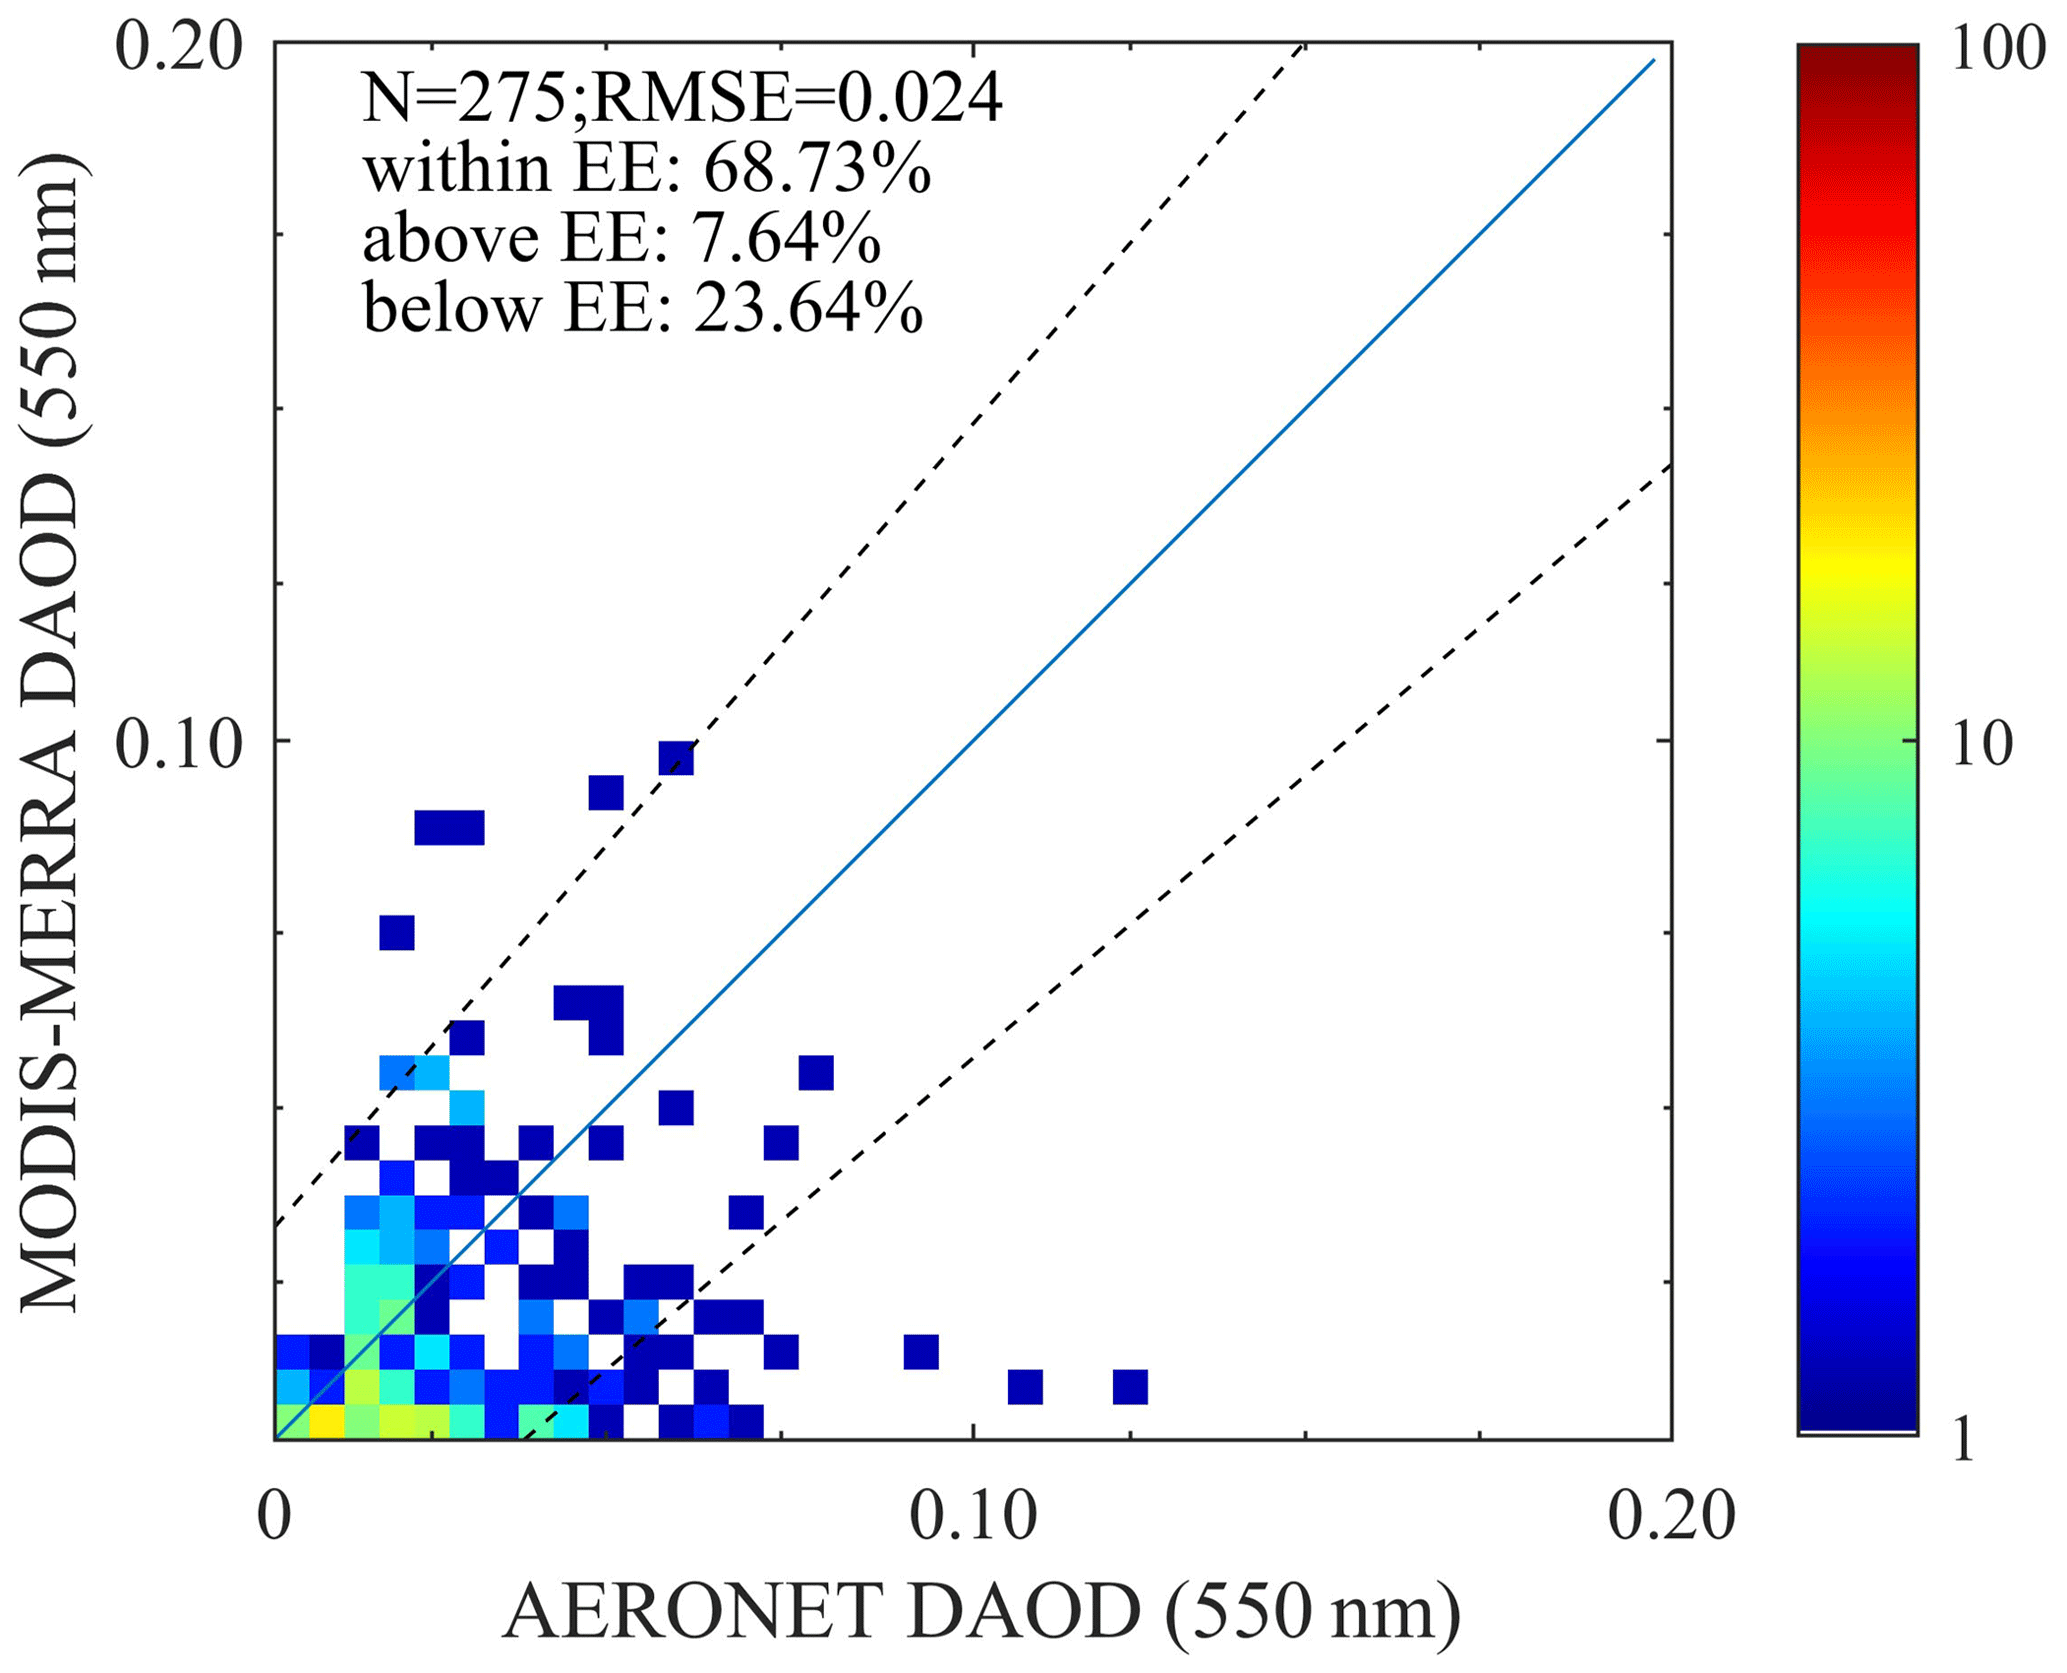
Figure 3Comparison of MODIS-MERRA DAOD with AERONET DAOD. The dashed lines denote an EE of , which contains 68 % of the data points. τAero represents AERONET AOD.
3.1 Validation of MERRA-2 surface mass concentration and DAOD
Figure 3 shows the validation result of MODIS (Aqua)–MERRA (M&M) combined DAOD over Australia from 2002 to 2020. The average AERONET DAOD for all collocated data points is only 0.03 for Australia. When AOD is low, remote sensing AOD retrievals are likely to be close to the margin of uncertainty and hence subject to large relative bias, especially over the Arctic region (Mei et al., 2013a, b), the Qinghai–Tibet Plateau (Che et al., 2016, 2018), and Australia (Che et al., 2022; Sayer et al., 2019). The ratio of RMSE (root mean square error) to the mean AERONET DAOD for MODIS–MERRA DAOD was 0.8, indicating that the uncertainty is close to that of MODIS–MERRA DAOD. The EE that contains 68 % of the data points is for MODIS–MERRA DAOD compared to AERONET DAOD over Australia. The intercept in EE of 0.016 is much smaller than for the MODIS DB AOD over Australia (0.03) (Che et al., 2022), suggesting a high level of accuracy of this MODIS–MERRA DAOD dataset with a smaller absolute error.
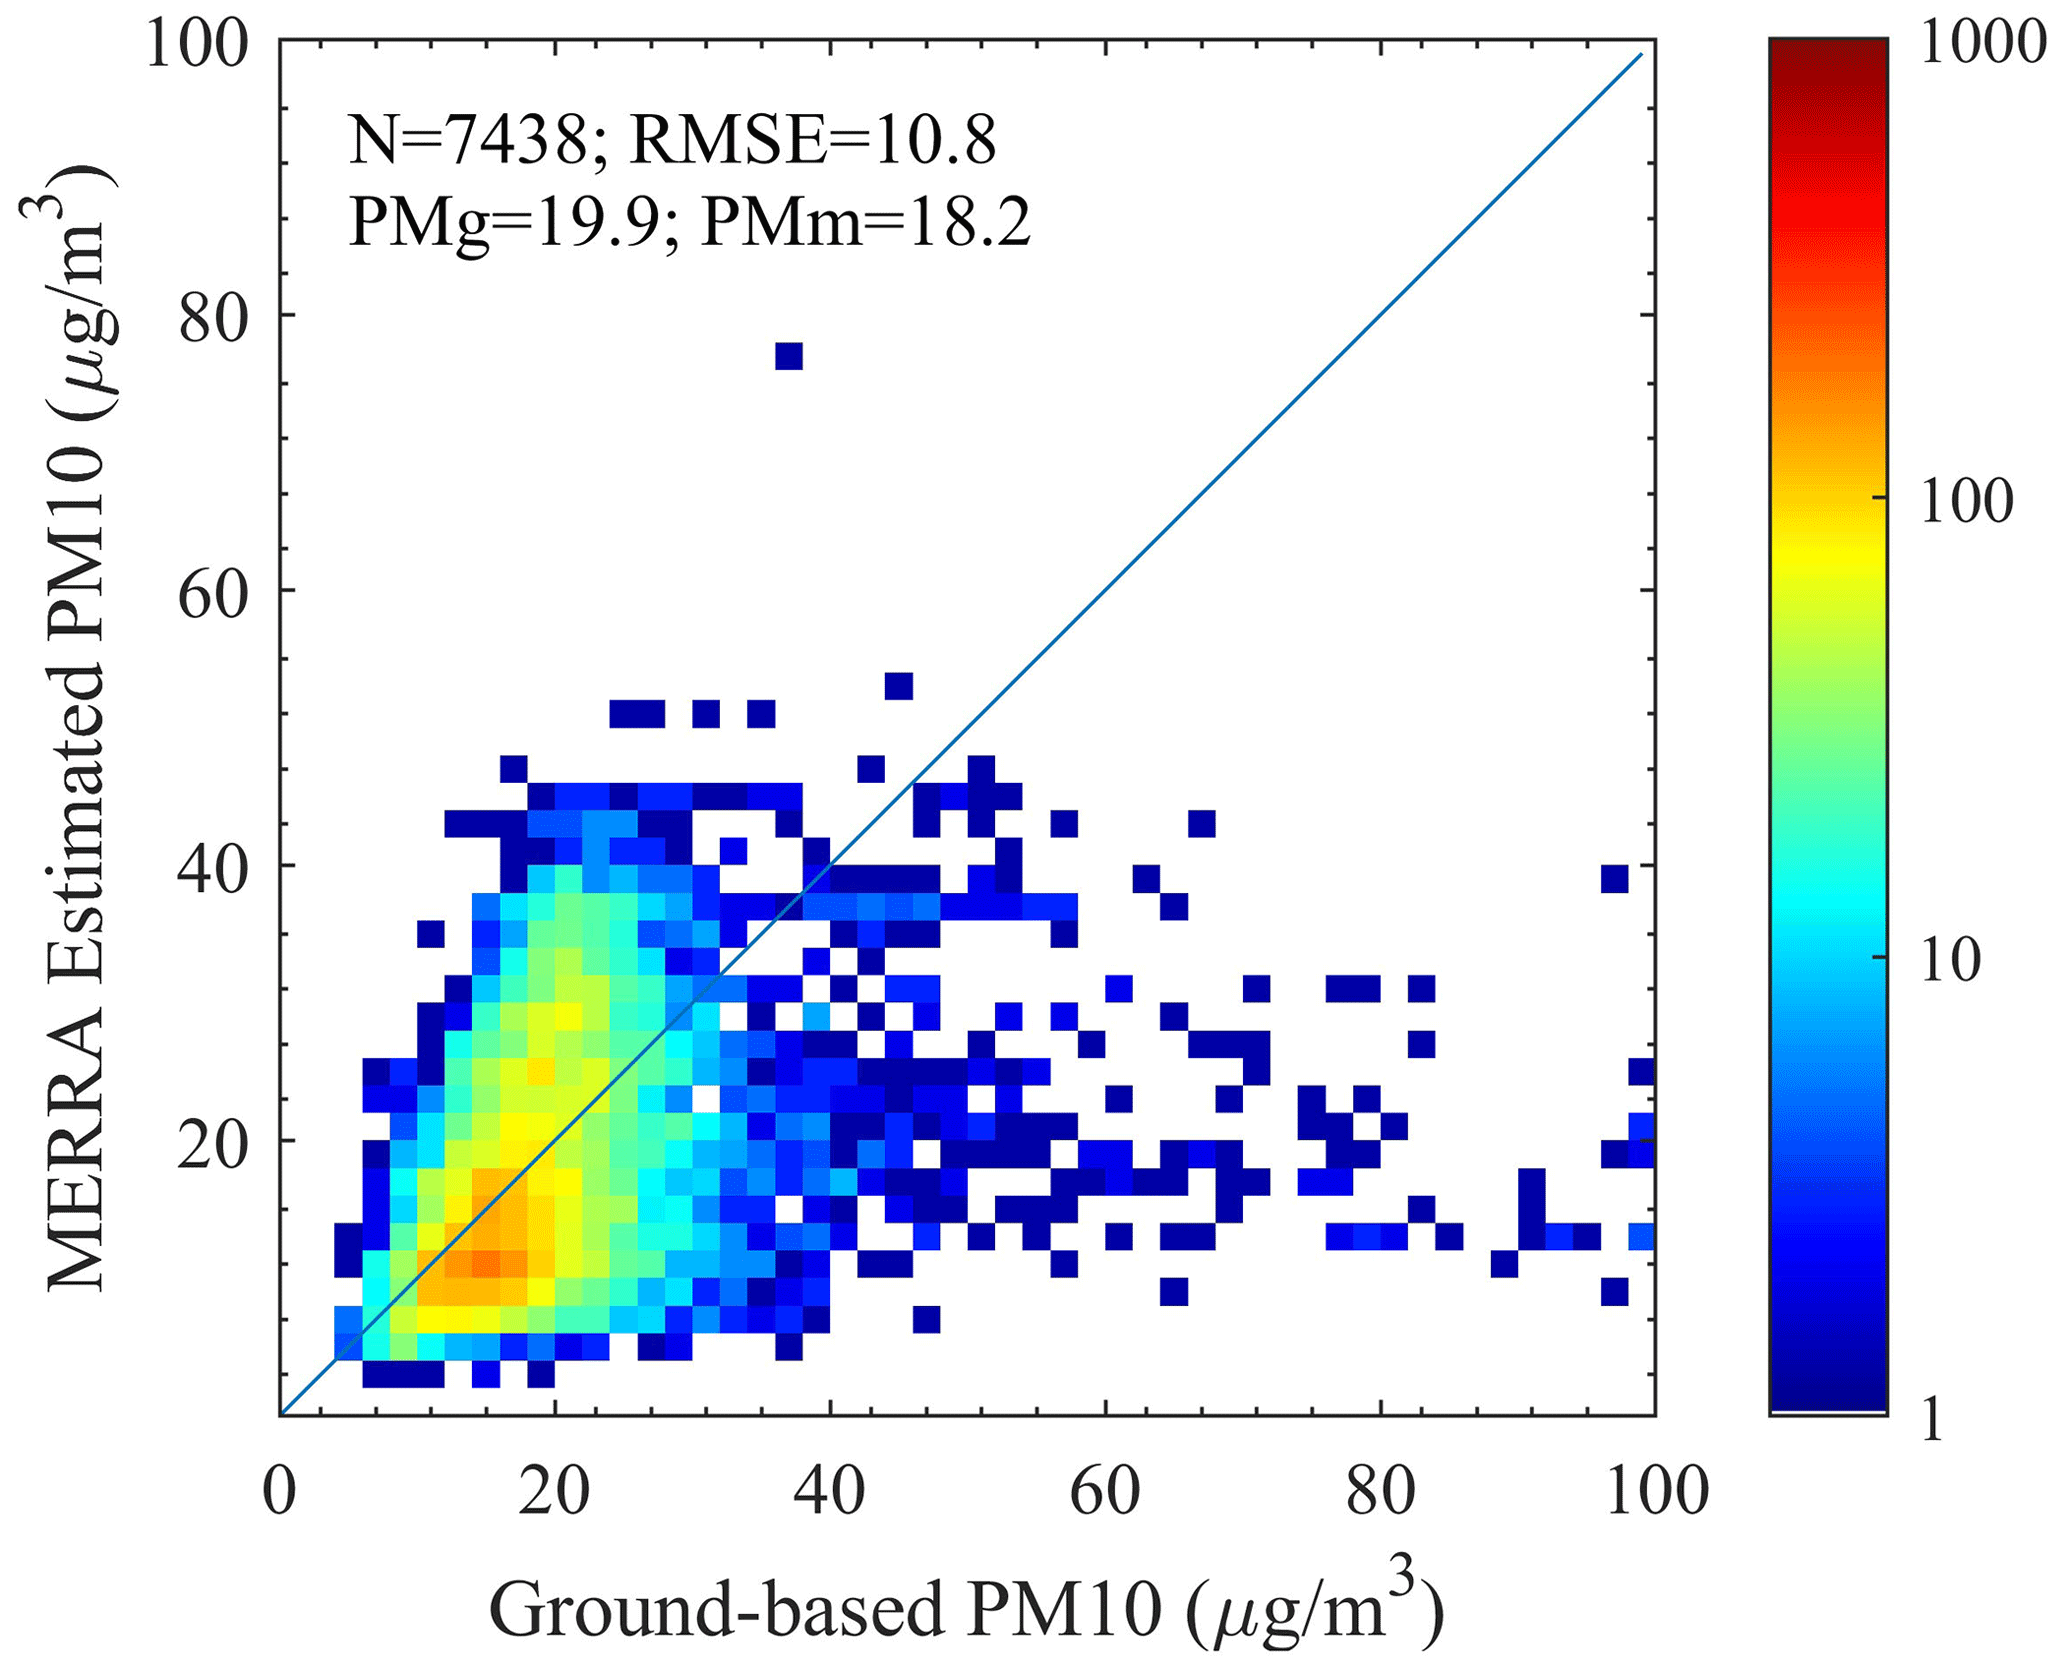
Figure 4Comparison of monthly MERRA-2-estimated PM10 with ground-based PM10 observations at 62 AQMN stations.
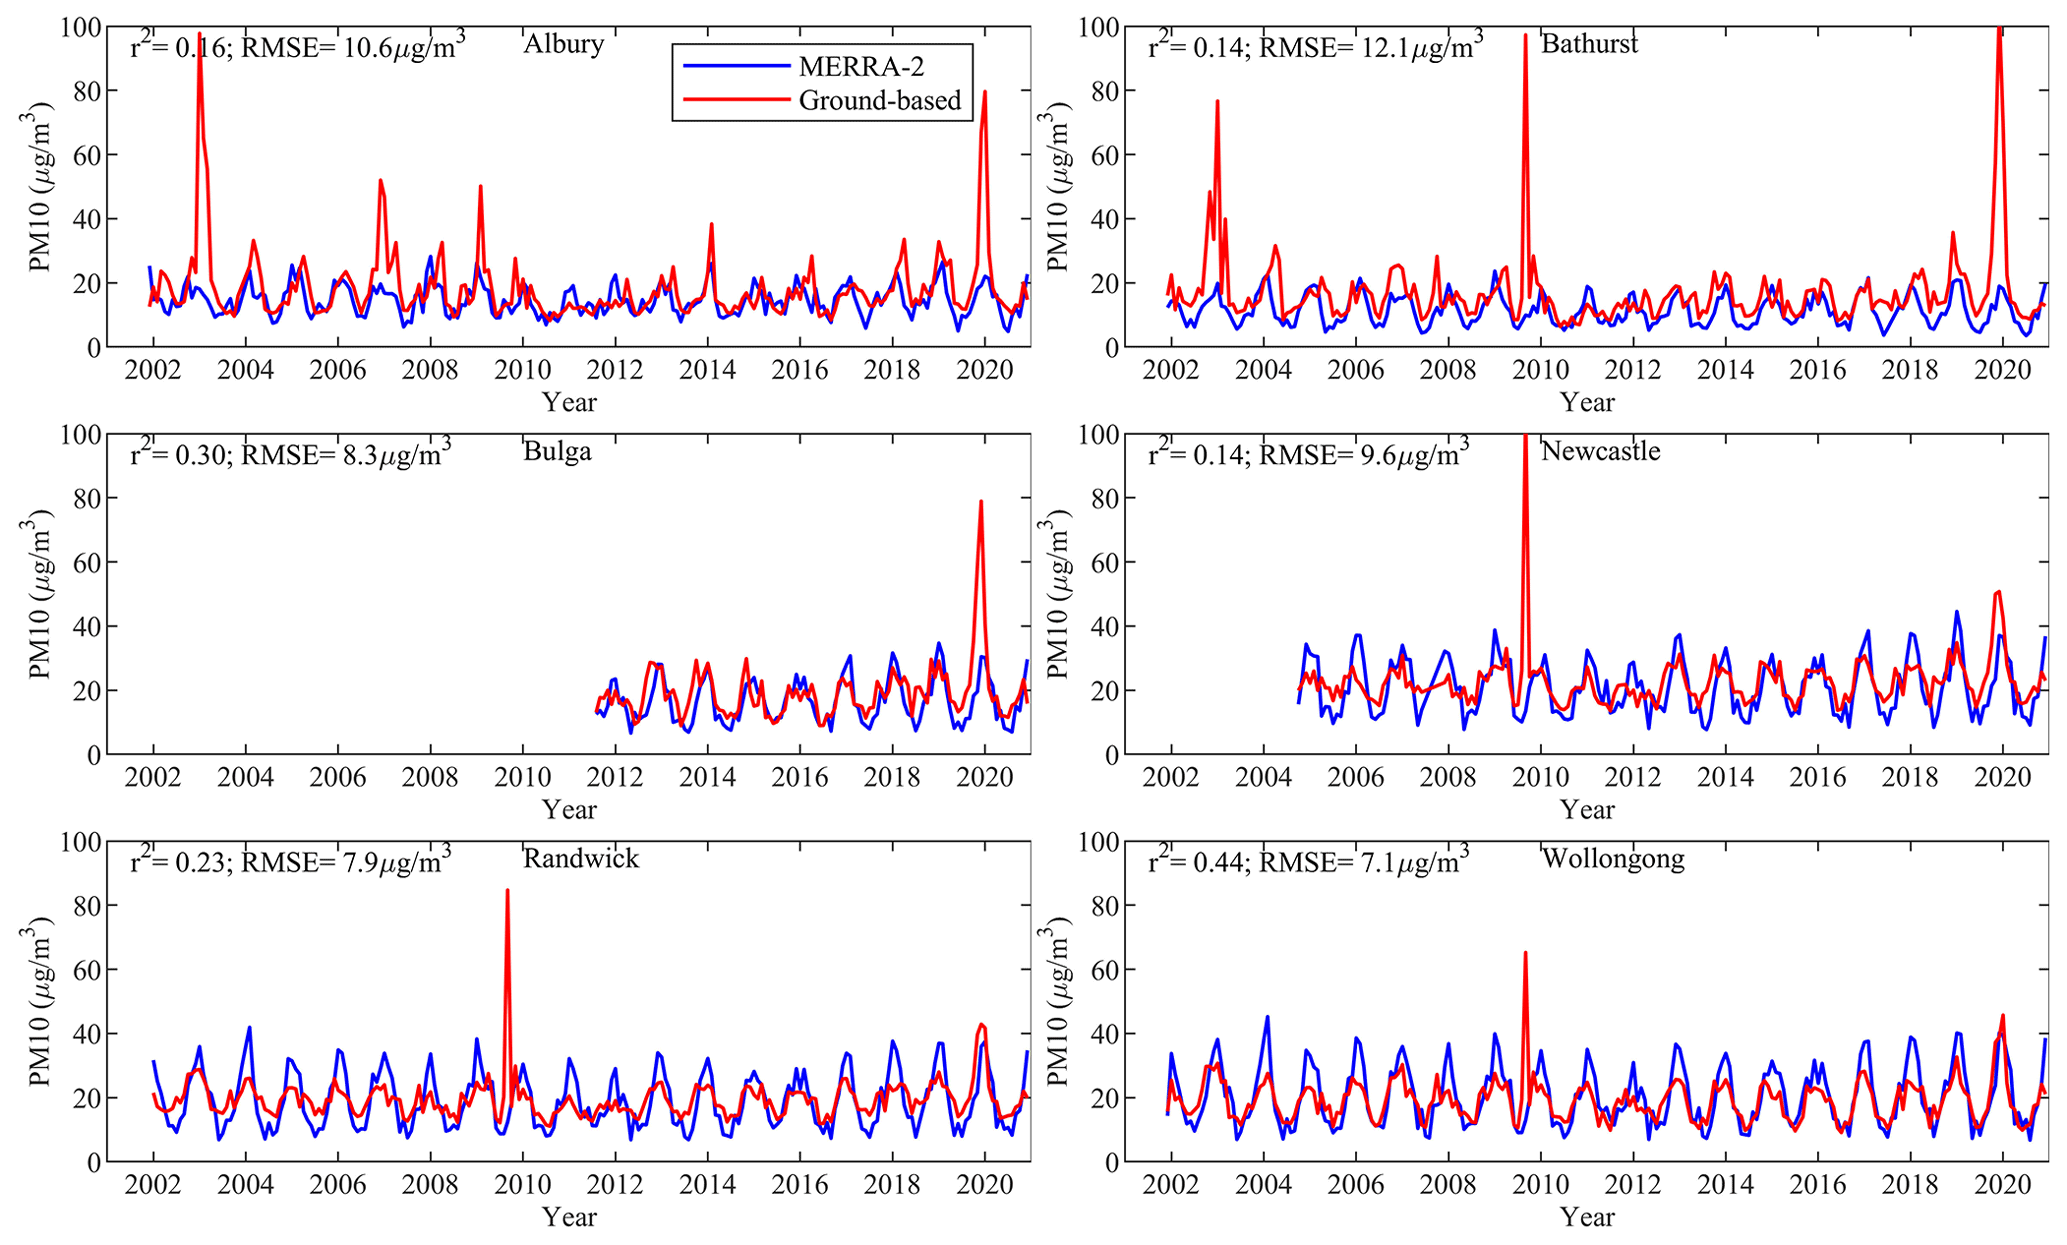
Figure 5Time series for MERRA-2-estimated PM10 with ground-based PM observations at six sites in NSW.
Figure 4 shows the validation results of MERRA-2-estimated monthly PM10 with ground-based observations at 62 AQMN stations for the period 2001–2020. There are 7438 data points in total for MERRA-2 PM10 validation over eastern New South Wales (NSW). These selected PM10 observations are located in downwind areas of inland dust sources such as Lake Eyre, the southern Simpson Desert lakes, and the Channel Country (O'Loingsigh et al., 2017). PM10 at these sites, therefore, could represent dust activities in southeast Australia during dust seasons. The mean monthly PM10 for all data points is 19.9 µg m−3, indicating a clear atmosphere over eastern NSW on average. When PM10 observations are greater than 40 µg m−3, almost all the data points are below the 1–1 line, suggesting that MERRA-2 is not able to catch high-PM10 events (dust or other pollution). Due to the relatively dense spatial distribution, AQMN sites are likely to observe the same dust events with similar PM10 observations and thus a similar extent of underestimation. Time series plots (Fig. 5) show similar severe underestimation in Newcastle (13.5 µg m−3 vs. 106.9 µg m−3), Randwick (12.4 µg m−3 vs. 84.7 µg m−3), and Wollongong (13.0 µg m−3 vs. 65.2 µg m−3) in September 2009 and Bathurst (18.9 µg m−3 vs. 104.8 µg m−3), Bulga (30.4 µg m−3 vs. 78.9 µg m−3), and Newcastle (37.1 µg m−3 vs. 50.8 µg m−3) in December 2019. In September 2009, a severe dust storm swept the Australian continent, causing a jump in PM10 for overpass areas (Leys et al., 2011). High PM10 (higher than 300 µg m−3) lasted for approximately 12 h and reached as high as 15 388 µg m−3 at Bathurst. Similarly, high PM10 concentrations were recorded at Bulga and Newcastle (Fig. 5). Due to rainfall deficiency and high temperatures in November and December 2019, NSW experienced the longest bushfire season when more than 5×10⁶ ha burned (BBC News, 2020). The NSW AQMN stations, therefore, had recorded high PM10 concentrations during the bushfire season. These underestimations by approximately 5 were also a major reason why the ground-based mean PM10 (19.9 µg m−3) was higher than that of MERRA-2 (18.2 µg m−3). When PM10 is less than 20 µg m−3, data points show a slight bias of MERRA-2, and when PM10 is between 20 and 40 µg m−3, the bias in MERRA-2 is reduced. This is shown by evenly distributed data points around the 1–1 line, but a smaller association occurs between the two. Severe underestimations of MERRA-2 PM10 (Fig. 5) show a strong seasonality at some sites such as Albury and Bathurst in summer when PM10 is greater than 40 µg m−3. This suggests that MERRA-2 is very likely to underestimate dust severity in summer because dust events mainly occur in summer throughout the year in NSW (Che et al., 2022). In spite of the underestimations, MERRA-2 is capable of tracing the seasonal variations in PM10 at six sites with an r2 value from 0.14 to 0.44. Overall, the RMSE is 10.8 µg m−3 for all monthly MERRA-2 and ground-based PM10 data.
Figure 6 shows the relationships between MERRA-2 near-surface dust concentrations with horizontal visibility with a dust type based on SYNOP code at Charleville, Cobar, and Longreach. The relationships are similar at Charleville and Cobar in that MERRA-2 near-surface dust concentrations follow a power-function relationship with horizontal visibility. The r2 values for two of the sites of 0.44 and 0.34, respectively, also suggest a relatively robust relationship between the two datasets. At Longreach, a low r2 value of 0.18 shows a weak relationship between MERRA-2 near-surface dust concentrations and visibilities. Longreach is known to be in a region of frequent local wind erosion activities with extensive tracts of clay soils in eastern Australia (McTainsh et al., 1990). Alluvial sediments and sandy clays, therefore, would be important sources of local dust events in Longreach (Rust and Nanson, 1989; McTainsh et al., 1990). These clay aggregates exhibit lower optical extinction compared to fine clay. However, due to their larger mass, they can still contribute to a high concentration of dust near the surface in high-visibility conditions. This most likely explains why the r2 in Fig. 6c differs from the other two. Previous studies showed that near-surface dust concentrations and total suspended particle concentrations agree well statistically with the visibility data (Baddock et al., 2014; Chepil and Woodruff, 1957; Shao et al., 2003; Tews, 1996) and visibility-defined DSI (O'Loingsigh et al., 2014), and horizontal visibility has often been used for calculating dust concentrations (Leys et al., 2011; McTainsh et al., 2005). Similar power-function relationships between the two suggest the acceptable accuracy of MERRA-2 near-surface dust concentrations to a certain extent.
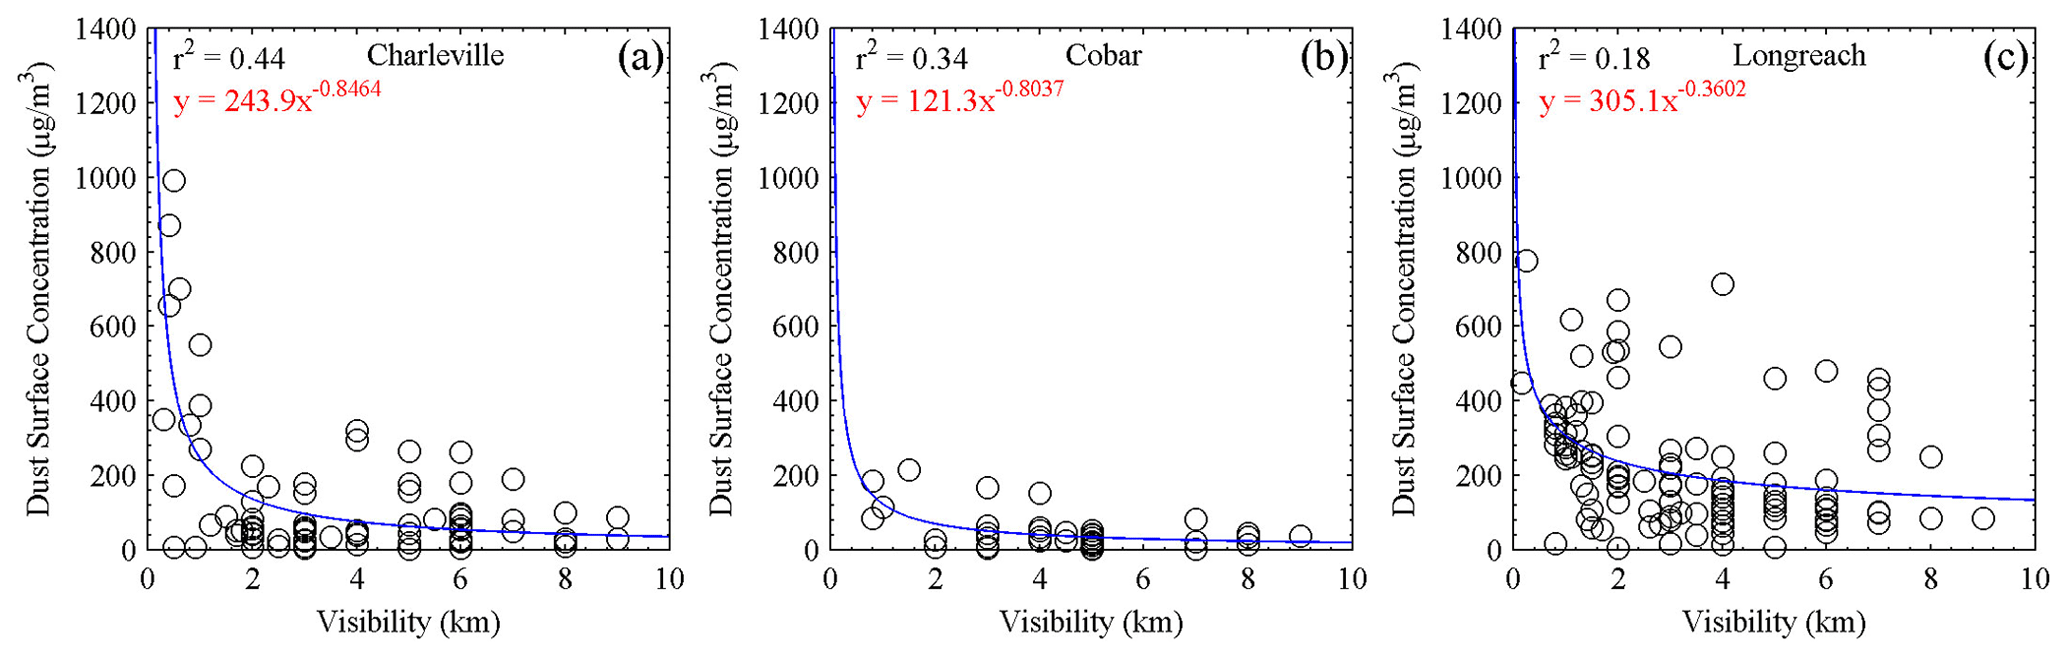
Figure 6Relationships between BoM horizontal visibility observations of MERRA-2 dust surface mass concentrations.
Figure 7 shows dust pathways and sink areas for Australia as identified in previous studies. Bowler (1976) established the first dust pathways (Fig. 7a) using trends of sand dune movement during the period of intense dune building phases. Major dust-fall areas lie mainly to the southeast and northwest of the Australian continent. Sprigg (1982) proposed a conceptual model (Fig. 7b) for describing how wind systems fed dust into the pathways identified by Bowler using measured wind run, wind direction, and wind speed in desert areas. Blewett (2012) adopted the dust pathways established by Bowler but provided a detailed classification of sand dunes and accurately confirmed dust fall in the southeast offshore area. Figure 7d shows MERRA-2 horizontal dust flux over Australia from 2002 to 2020. Compared to previous studies (i.e., Fig. 7a–c), MERRA-2 horizontal flux quantitatively shows the mean dust pathways and dust-fall areas for Australia, providing independent support to previous conceptual models.
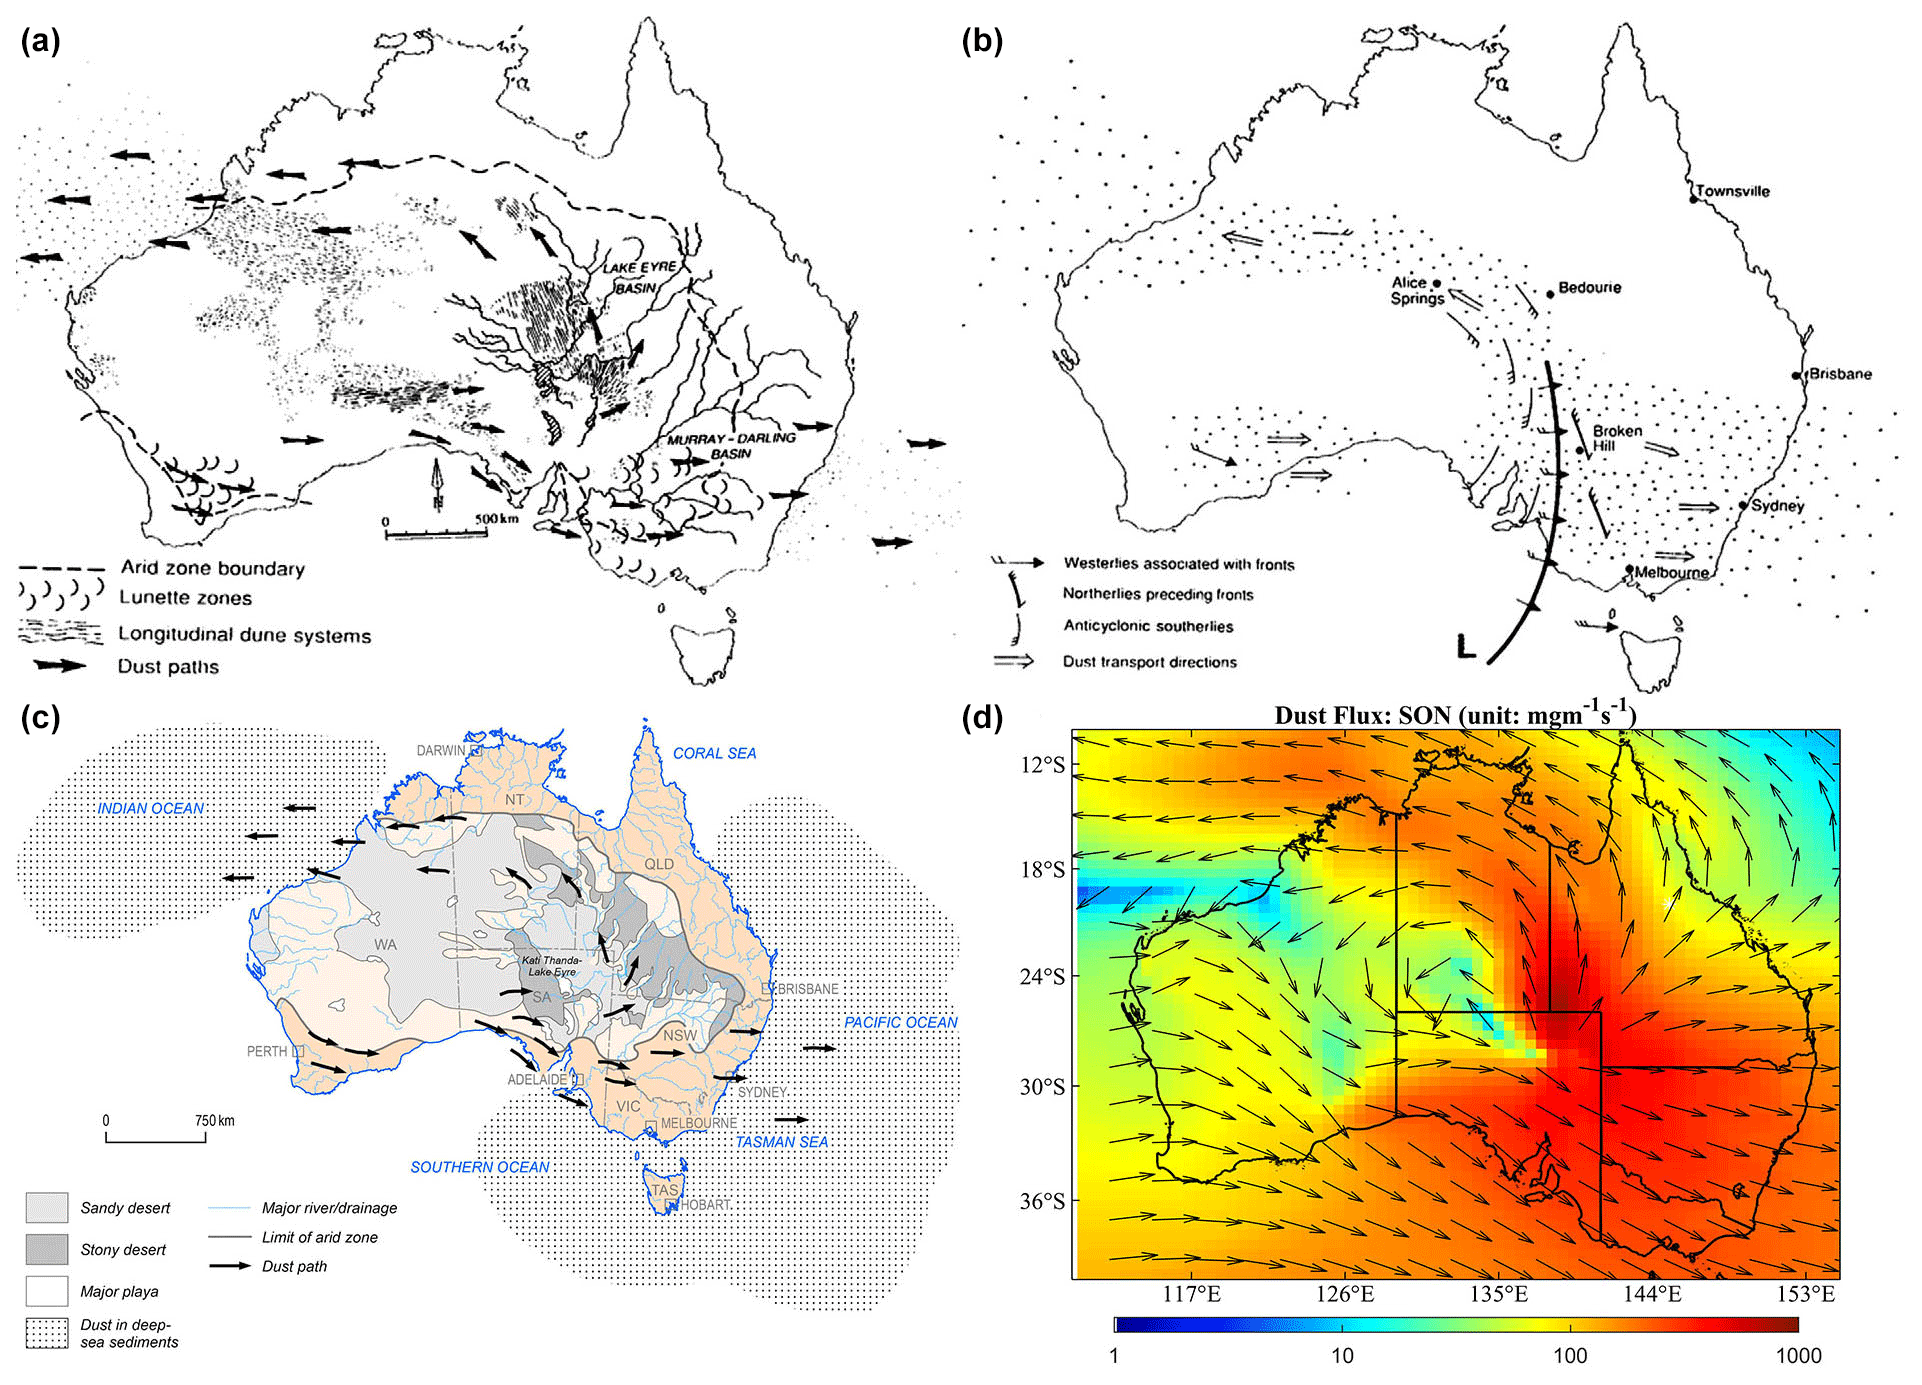
Figure 7Comparison of dust pathways over Australia delineated in previous studies: (a) Bowler (1976), (b) Sprigg (1982), (c) Blewett (2012), and (d) mean horizontal dust flux based on MERRA-2 from 2002 to 2020.
3.2 Seasonal DAOD based on MODIS–MERRA, dust concentration and PM10 based on MERRA-2
Figure 8 shows the mean seasonal MODIS–MERRA DAOD over Australia from 2002 to 2020. Spring (September–November) and summer (December–February) are typically dust seasons in Australia, when DAOD is much higher than that in autumn (March–May) and winter (June–August). This seasonal pattern is consistent with that shown by the monthly dust event frequency based on synoptic observations (McTainsh et al., 1998). As dust activities would normally last until March in southeastern Australia (McTainsh et al., 1998), DAOD in this area is relatively high compared to that in Western Australia (Fig. 8b). High rainfall may inhibit occurrences of dust events; therefore, Fig. 8c shows low DAOD for most of Australia in winter.
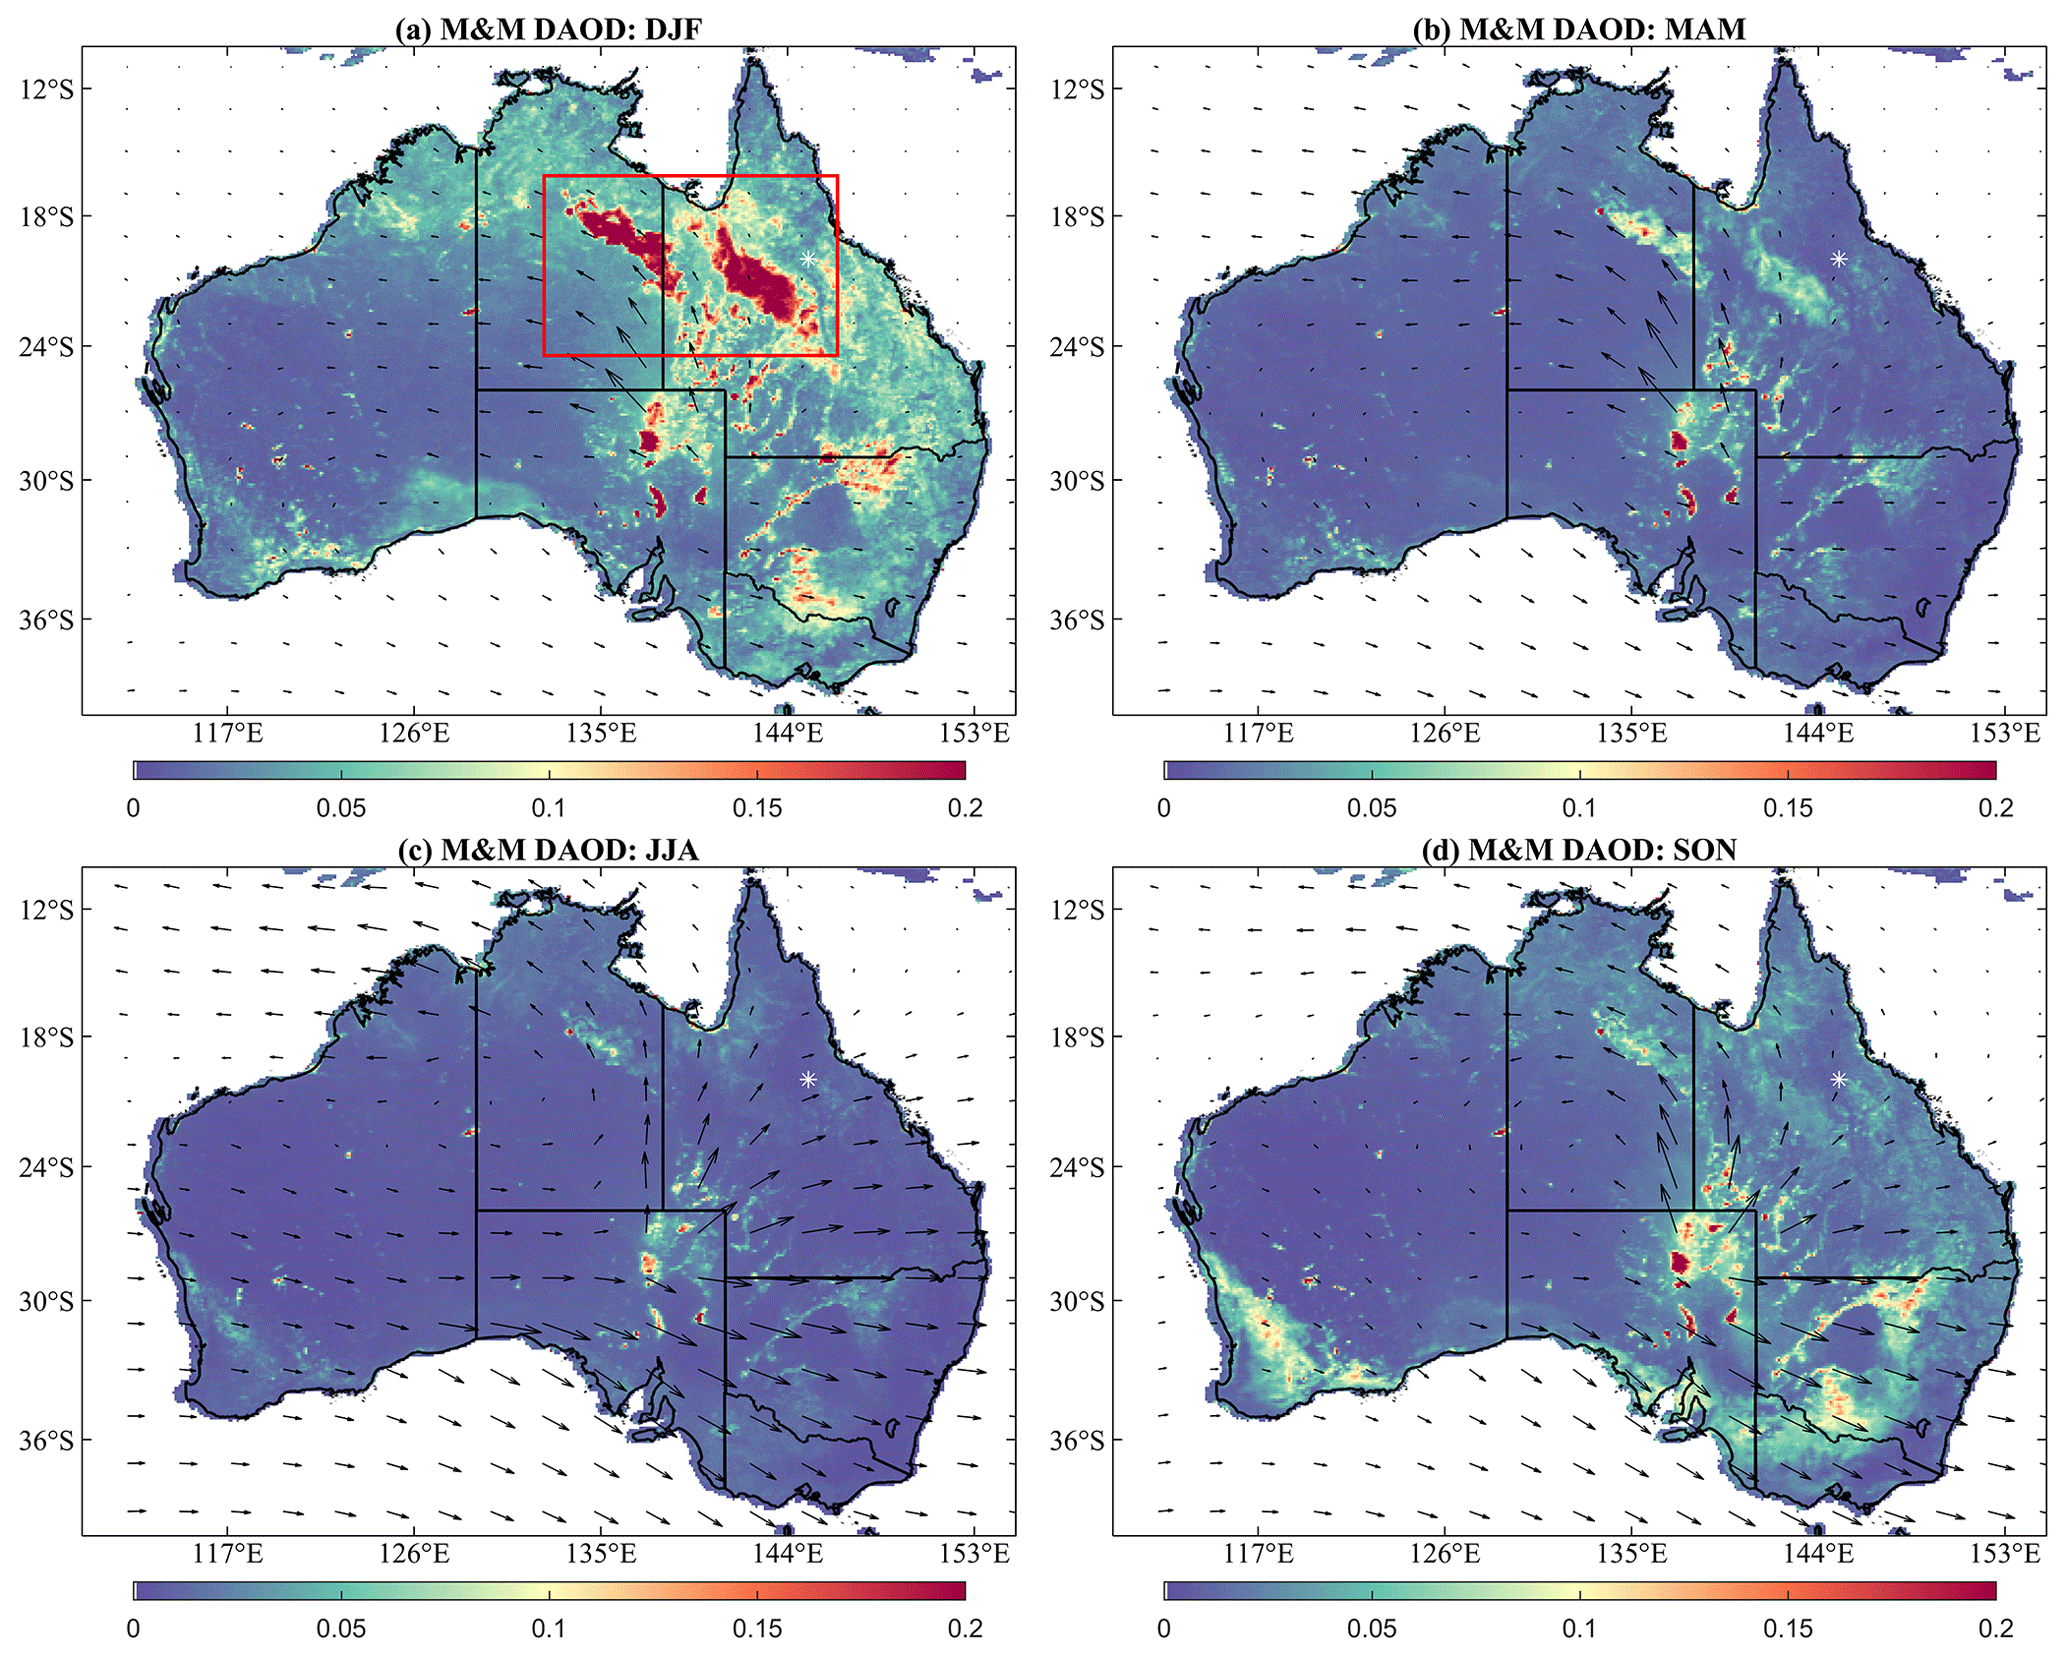
Figure 8Seasonal MODIS-MERRA DAOD from 2002 to 2020: (a) September–November, (b) December–February, (c) March–May, (d) June–July. Arrows represent horizontal dust flux (units: kg m−1 s−1) with the direction and magnitude. The red box outlines frequent-dust-event regions differing from those in previous studies based on the dust storm index.
High DAOD is shown over dust source areas and along main pathways. Dust and sand particles originated from the inland area (around the Lake Eyre basin) and were transported along two main dust transport pathways to the north and southeast (Bowler, 1976; De Deckker, 2019; McGowan et al., 2000; Sprigg, 1982; Strong et al., 2011). In spring (Fig. 8d), high-DAOD regions are mainly concentrated around the Lake Eyre basin in southeastern Australia and in the southwest of Western Australia. Figure 8d shows that the horizontal flux with dust entrained from the source region in central Australia to the southeast is so far the strongest over the Australian continent. DAOD and horizontal dust flux are consistent with each other, and both reflect the major dust pathway in southeastern Australia. High DAOD can be also found in the southwest of Western Australia, which has been identified as the starting point of the major pathway flow in the south in previous studies (Sprigg, 1982). Due to onshore winds, high DAOD around this region is very likely to be generated from local dust sources. Also, DAOD in spring is much higher than in other seasons in this region. In summer (Fig. 8a), the highest-DAOD regions were found in the main pathway to the north, as highlighted by the red box, and around the center of the Lake Eyre basin. The high-DAOD region in the north of the Northern Territory (NT) and Queensland (QLD) is in the main pathway, with a spatial pattern consistent with prevailing wind directions. Another region with high DAOD in the middle of QLD shows a different spatial pattern with MERRA-2 horizontal dust flux, which may be caused by differences in data coverage between the MODIS DB and MERRA-2 datasets. The second-highest-DAOD regions are concentrated around the southeast dust pathway in NSW. Meanwhile, the horizontal dust flux for these regions is much lower than that for northern regions. In autumn (Fig. 8b), DAOD is an extension of that in summer that DAOD shows a very similar spatial pattern to that in summer but is lower in value. In regions with high DAOD, the DAOD distribution is consistent with that of horizontal dust flux (i.e., high DAOD corresponds to large horizontal dust flux). In winter, dust emissions in the center of Lake Eyre basin are the smallest and DAOD is the lowest among the four seasons. Dust is mainly transported to the east coast of Australia and deposited in eastern Australia and the ocean areas to the southeast and northwest.
Figure 9 shows the mean seasonal near-surface dust concentrations and PM10 based on MERRA-2, as well as the ratio of the two for Australia. The highest near-surface dust concentrations are mainly distributed over the Lake Eyre basin, which is the largest natural dust source in Australia, while high concentrations from 50 to 100 µg m−3 are found around the Lake Eyre basin, Great Victoria Desert, and Nullarbor Plain in all four seasons (see Fig. 9a, d, g, and j). In other regions, near-surface dust concentrations typically are less than 50 µg m−3 and the concentration decreases toward the coastline. Low concentrations of less than 20 µg m−3 of dust can be found over the ocean, particularly the Indian Ocean in the northwest. MERRA-2 PM10 (see Fig. 9b, e, h, and k) shows that the spatial distribution is similar to that of the near-surface dust concentrations over the continent. Differences between the two mainly occur in the offshore areas due to the influence of sea salt aerosols and carbonaceous aerosols in the north in spring (Yang et al., 2021). Spatial distributions of dust concentration and PM10 are similar because PM10 accounts for the majority of dust particles in inland Australia (Fig. 9c, f, i, and l). A high ratio of dust concentration to PM10 of 0.7 is mainly found in inland areas, and the ratio decreases toward the coastline, which is consistent with coarse particles settling out of suspension more quickly compared to finer particles (Fryrear et al., 1991). It should be noted that four states in eastern Australia are affected less by dust than other regions from the perspective of the ratio of dust to PM10. The least affected states are Victoria (VIC; higher than 0.2), NSW (0.3), and QLD (higher than 0.3).

Figure 9Seasonal MERRA-2 near-surface dust concentration in (a) December–February, (d) March–May, (g) June–July, and (j) September–November from 2002 to 2020. Seasonal MERRA-2 PM10 in (b) December–February, (e) March–May, (h) June–July, and (k) September–November from 2002 to 2020. The ratio of MERRA-2 near-surface concentration to MERRA-2 PM10 in (c) December–February, (f) March–May, (i) June–July, and (l) September–November from 2002–2020.
Dust sources and pathways play an essential role in determining the spatial pattern of near-surface dust concentrations. Dust events occur frequently in central Australia (McTainsh et al., 2011a), resulting in extremely high near-surface dust concentrations throughout the year. In addition, the seasonal variation in the near-surface dust concentration in such regions is more significant than other dust sources, with a difference exceeding 100 µg m−3 between spring–summer and autumn–winter. The near-surface dust concentrations over two major dust pathways changed slightly with season compared to those over the main dust source areas in the center of the continent. Relatively high concentrations of near-surface dust are found to the north in all four seasons compared to those along the dust pathway to the southeast. The wind systems responsible for dust pathways as described by Sprigg (1982) explain that pre-frontal anti-cyclonic northerly winds are responsible for the main dust pathway in the south. High dust concentrations, however, are not found in the main dust deposition area in the southeast.
3.3 Dust loading budget in the Australian continent
Figure 10 shows the directions of horizontal dust flux using MERRA-2 u-wind dust flux datasets. The colors of the coastline indicate whether dust is transported from the land to the ocean (red) or from the ocean to the land (blue). As the “loneliest” inhabited continent, Australia is located far away from other continents, with the largest natural dust source in the Southern Hemisphere, the Lake Eyre basin, and is thus regarded as a main dust source exporting dust. However, the blue border shows that areas of import can occur along the west, north, and south coasts. Along the north coast, exported dust from QLD could be transported back to the Cape York Peninsula, and part of this dust would travel on to Arnhem Land and even travel back to the continent. This recirculated dust cannot be defined as “true imported dust” because it originated from the Australian continent and was transported over the sea and back onto the continent. A similar situation can be found on the coastline in South Australia where dust originated from the continent and was transported outward from the Nullarbor Plain, across the Spencer Gulf, and back to South Australia and VIC. Differently from these two situations, dust imported from the west coast is very likely to be from remote dust sources in southern Africa. Firstly, MERRA-2 horizontal dust flux does not show that a large amount of dust exported from the northwest coast are transported back to the continent. Secondly, dust originating from the Mallee region is unlikely to be transported to the west coast crossing the Pacific Ocean (Bhattachan and D'Odorico, 2014). Thirdly, forward trajectory analysis demonstrates dust originating in the Kalahari can be transported over long distances to Australia (Bhattachan et al., 2012). The southwesterly winds are key to transporting dust from southern Africa to Western Australia due to the similar latitudes of these regions (Torre et al., 2022). Therefore, the dust imported from 20 to 36° S is regarded as the only imported dust from an external source for Australia in this study.
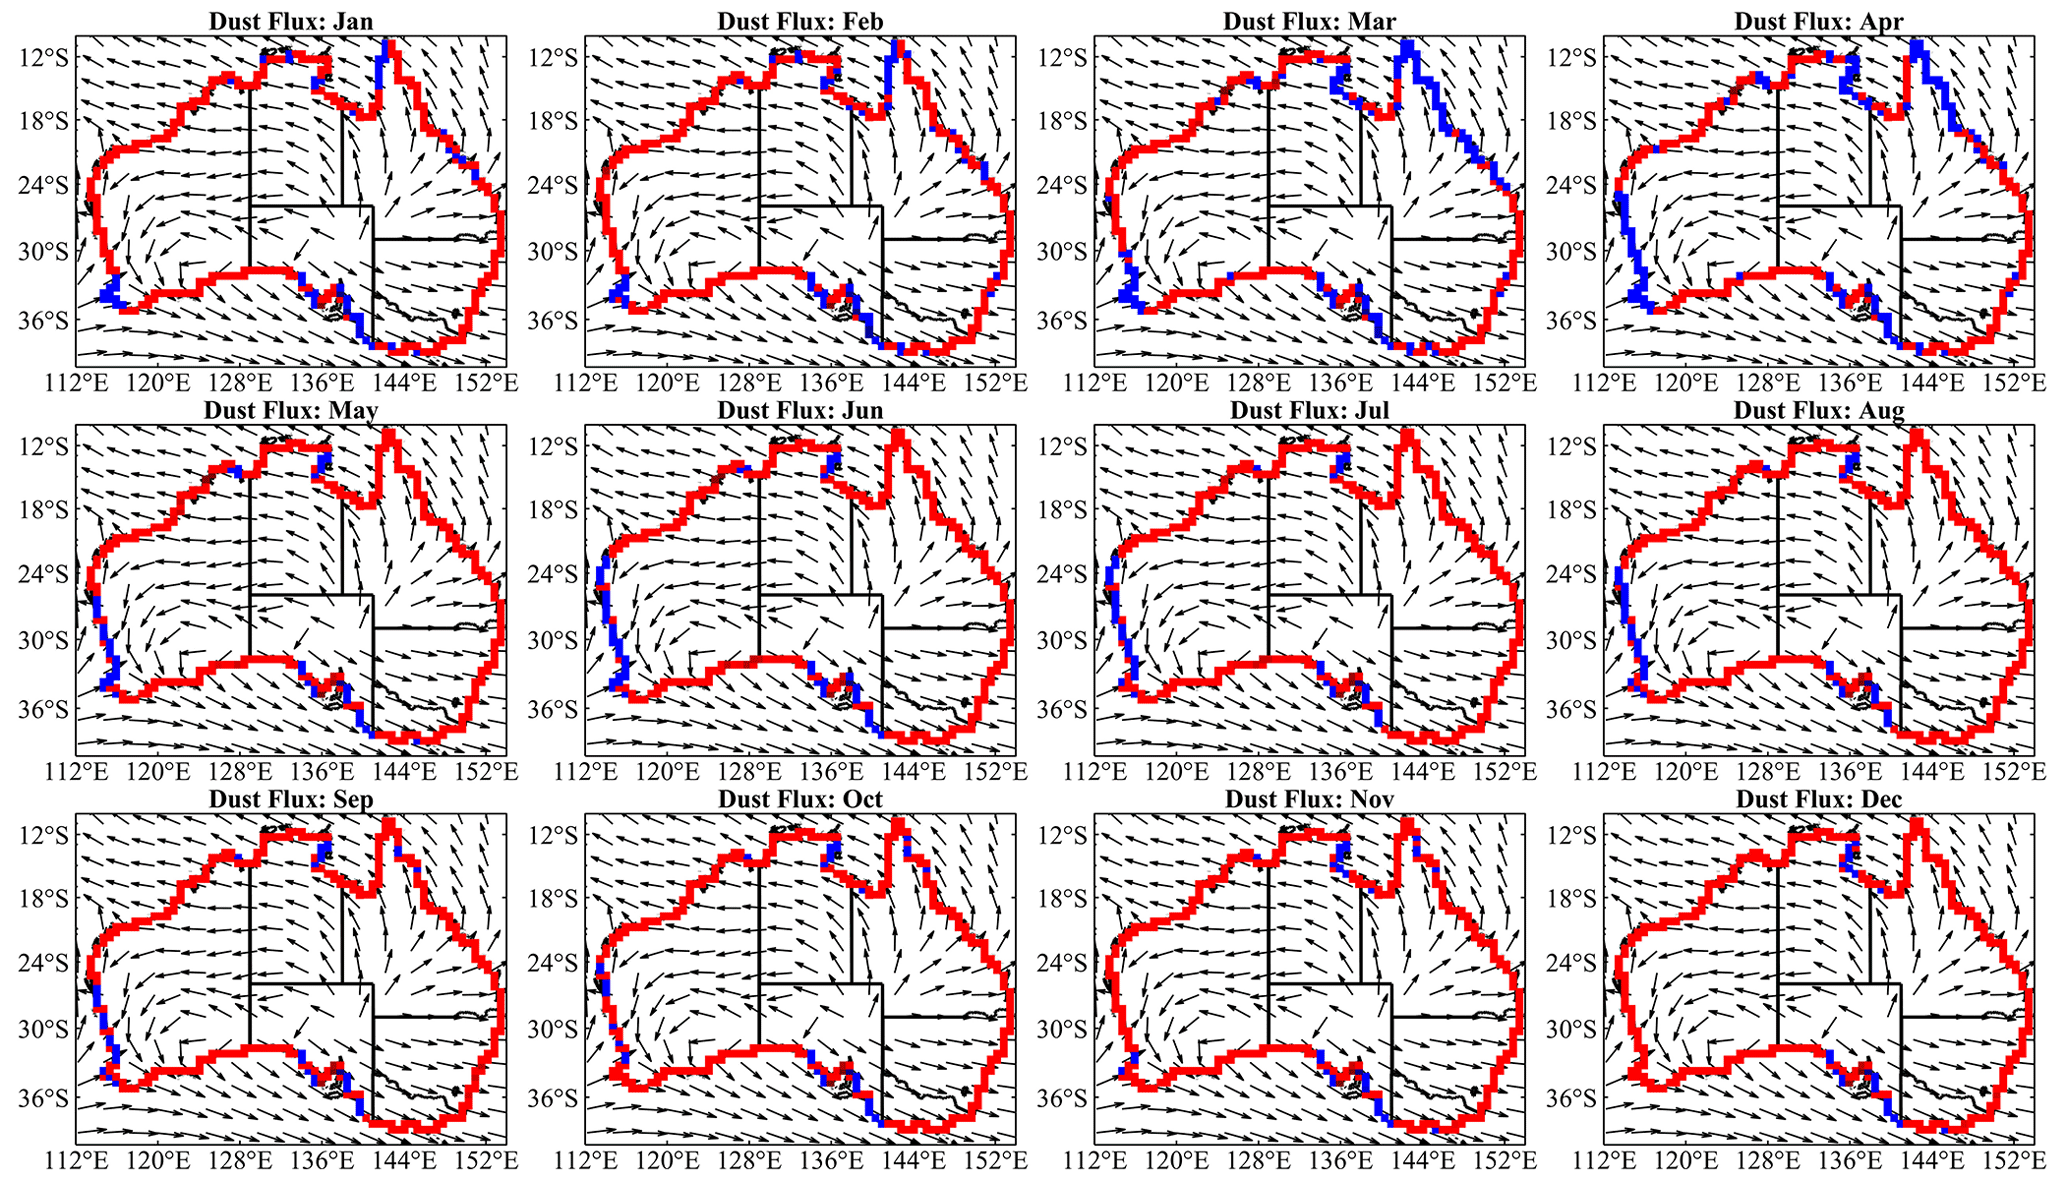
Figure 10Directions of dust flow in each month from 1980 to 2020. Blue and red borders indicate imported and exported dust, respectively.
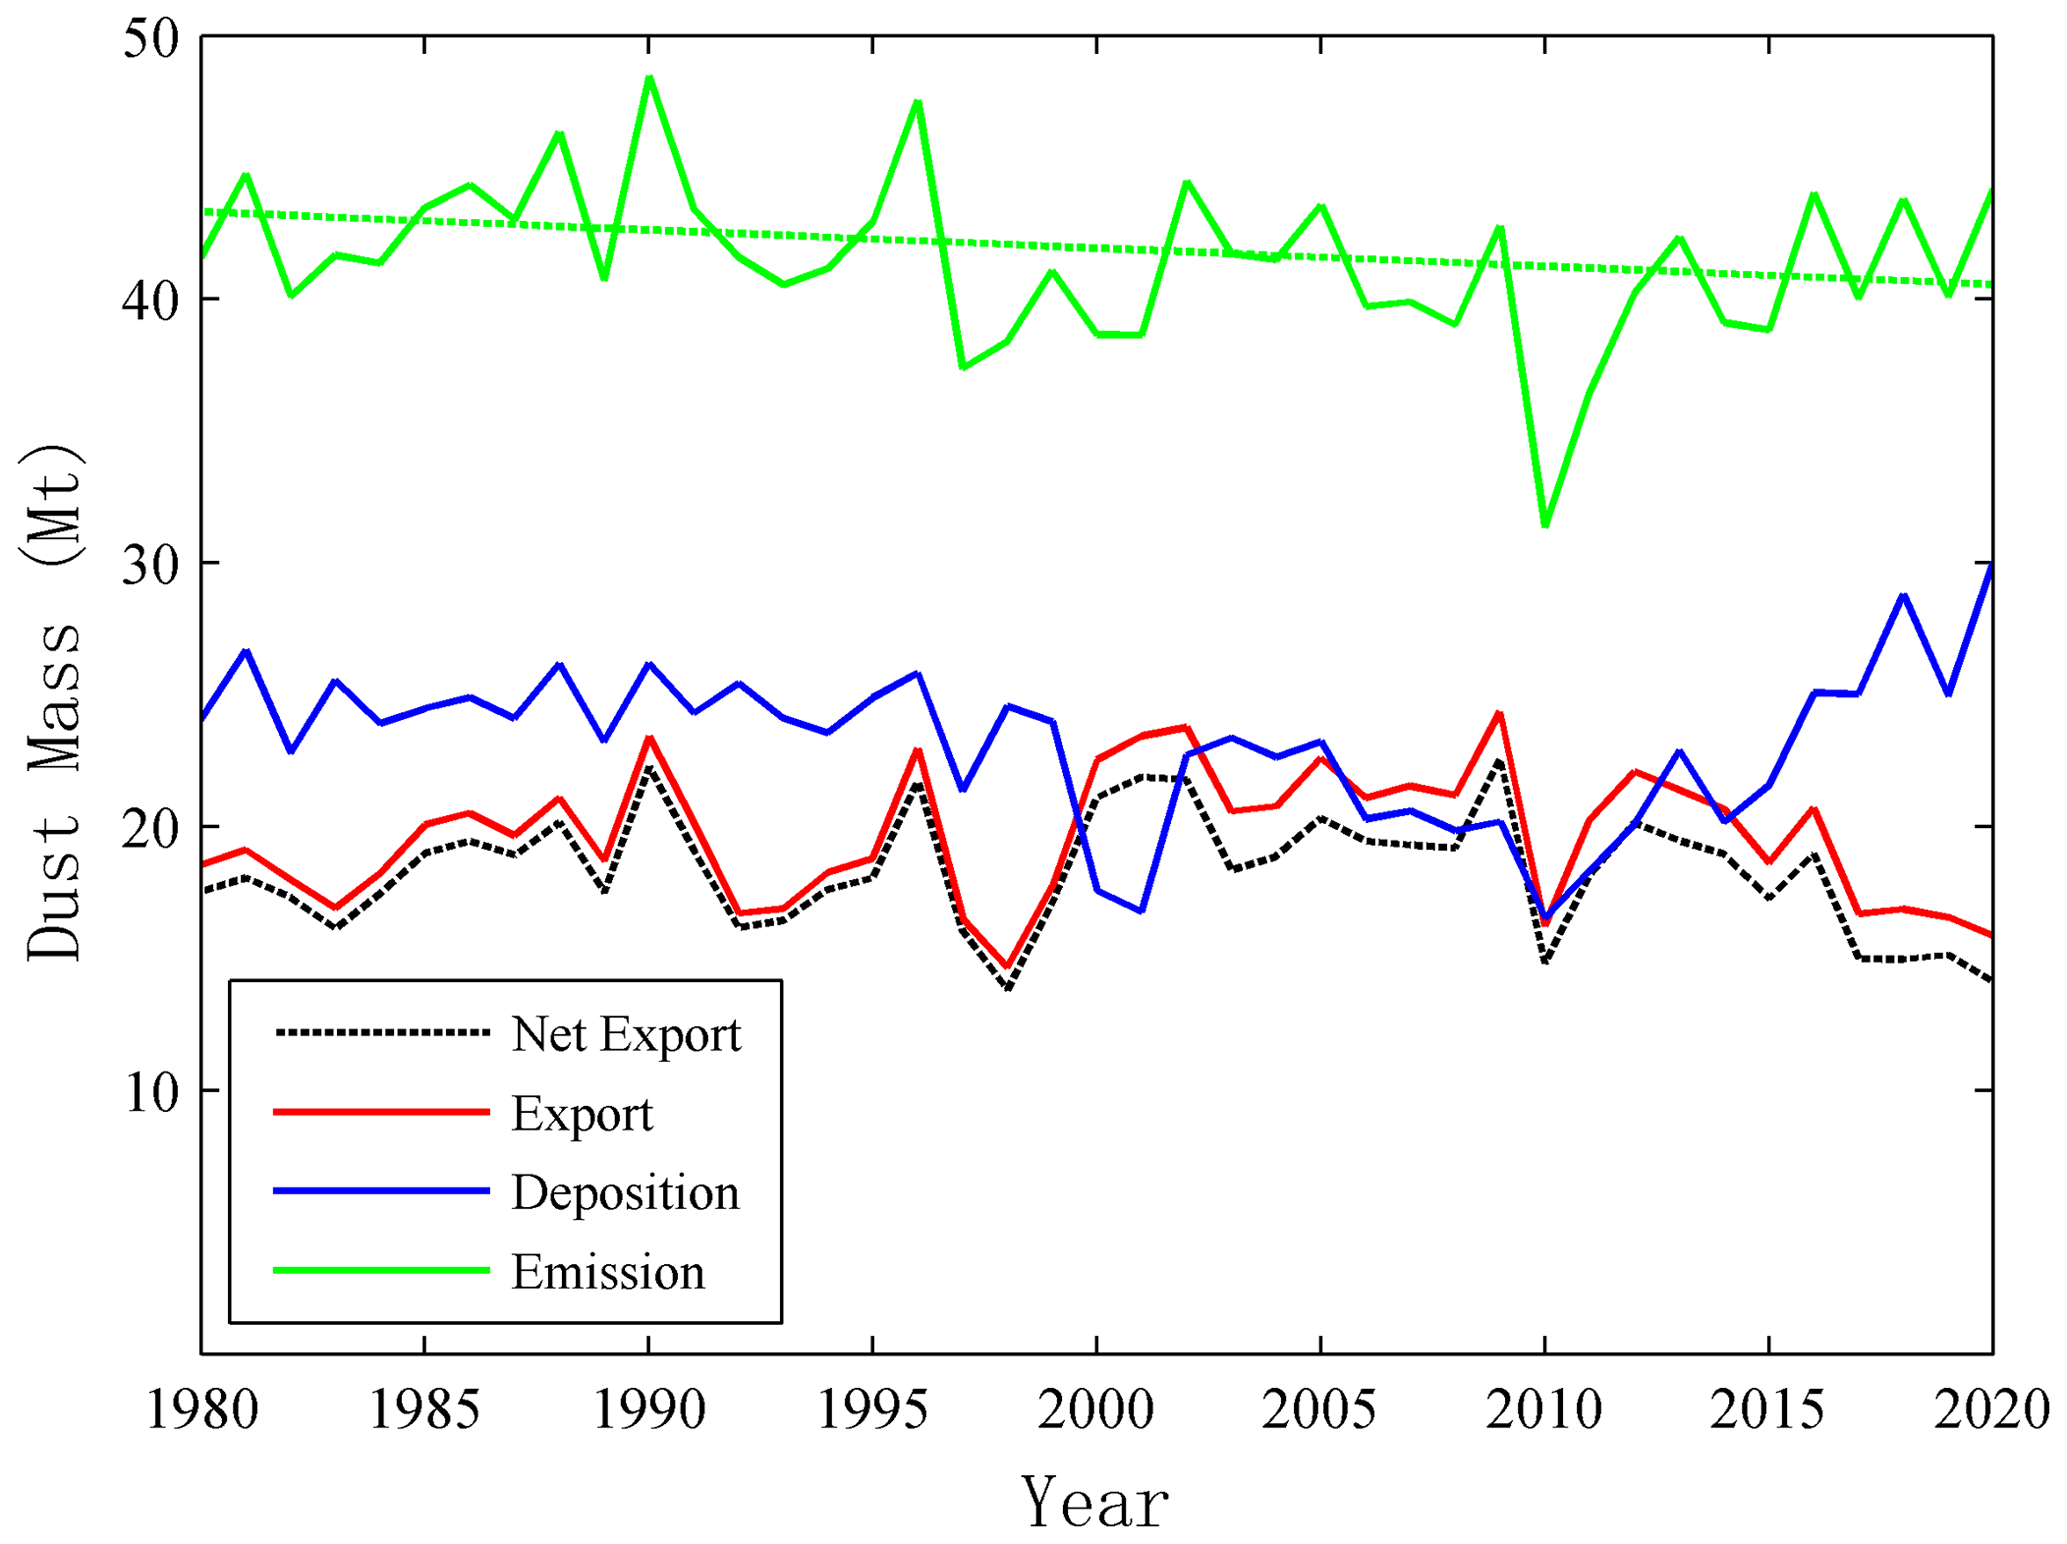
Figure 11Annual dust budget for Australia. Solid green line: annual dust emission; dashed green line: trend of annual dust emission; red: dust export; blue: dust deposition; and dashed black line: net dust export.
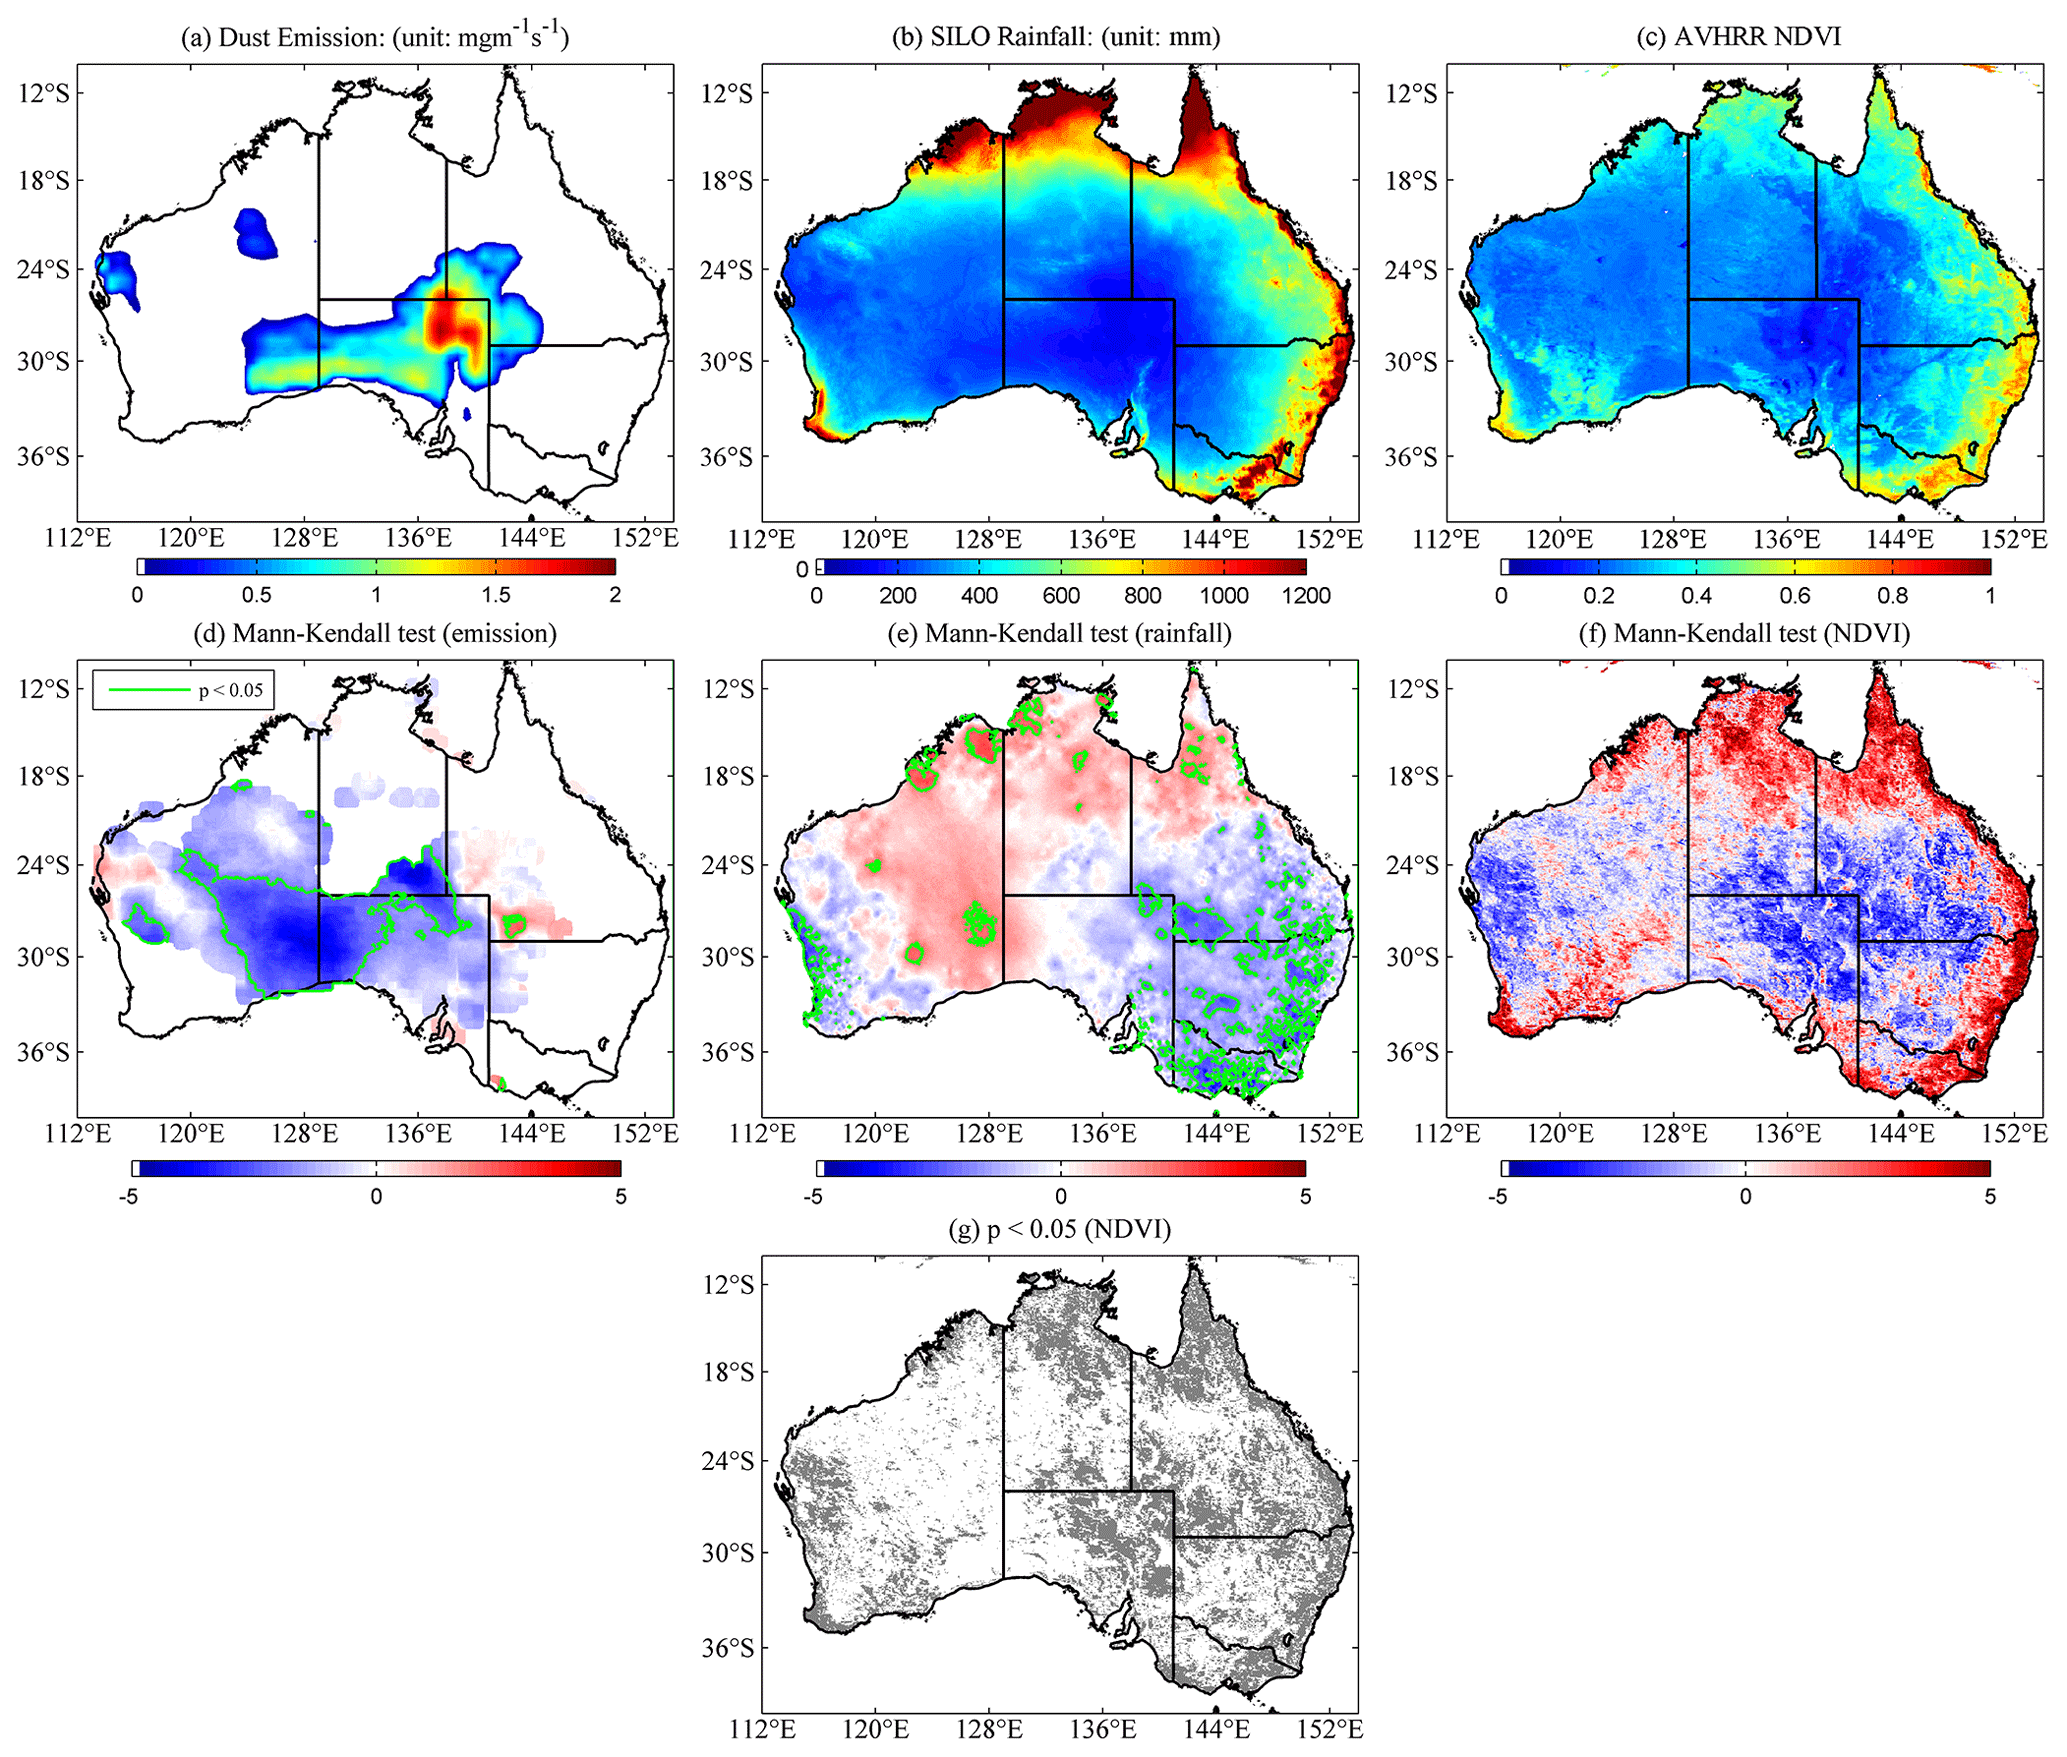
Figure 12Mean annual MERRA-2 dust emission (a); SILO mean annual rainfall (b); AVHRR normalized difference vegetation index (NDVI) (c); and Mann–Kendall (MK) test for annual dust emission (d), for annual rainfall (e), and for annual NDVI (f) from 1982 to 2019. Positives and negatives represent an increasing and decreasing trend, respectively. A p value < 0.05 for the MK test is shown with green lines for dust emission (d) and rainfall (e) and gray colors for NDVI (g).
Figure 11 shows the annual dust budget for Australia from 1980 to 2020 using the MERRA-2 aerosol reanalysis. The green line shows the annual total dust emission and suggests a slight decreasing trend over the past 42 years. Overall, the Australian continent emitted on average 41.47±3.07 Mt yr−1 into the atmosphere from 1980 to 2020, of which 19.63±2.48 Mt yr−1 is exported from Australia and 23.19±2.97 Mt yr−1 is deposited over the land area. Additionally, 1.34±0.55 Mt of dust is imported from non-Australia dust sources annually. The average annual dust emissions over each decade from the 1980s to the 2010s are 42.74, 42.25, 40.99, and 39.63 Mt yr−1, respectively, showing an overall decreasing trend on a decadal basis. The dust emission peaks were at 48.46 and 47.54 Mt yr−1 in 1990 and 1996, respectively. Although most of Australia was in drought during these 2 years, the DSI based on visibility data and weather codes for these 2 years is around the average from 1965 to 2009 at 180 long-term stations (O'Loingsigh et al., 2014). The number of dust storms for these 2 years was around the average from 1960 to 2000 at both inland and coastal stations (Ekström et al., 2004). The discrepancy between this and previous studies is caused by a lack of BoM weather observations in central Australia where dust emission is concentrated (Fig. 12). From 1996, a sharp reduction of 10.16 Mt yr−1 occurred in dust emissions in 1997, and the change from 1998 to 2020 is relatively small (with a standard deviation of 2.25 Mt yr−1 excluding 2010) compared to that for the period 1980–1997. Dust emissions reached a minimum at 31.6 Mt yr−1 in 2010. This may be strongly related to high rainfall in Australia in 2010 when the annual rainfall was 687.3 mm, which is only about 17 mm lower than the highest rainfall of 710.6 mm in 2000 during the period of 41 years (rainfall data can be found at http://www.bom.gov.au/web01/ncc/www/cli_chg/timeseries/rain/0112/aus/latest.txt, last access: 24 July 2023). The dashed black line in Fig. 11 represents the net dust export that is equal to the dust leaving the Australian coastline (total net export) minus that imported from the west coastal (total net import) line from 20 to 36° S on an annual basis. The blue line shows the total annual dust deposition over the continent and was calculated using the mass balance equation (Eq. 9). The annual dust deposition shows a similar general trend to dust emission, while showing an opposite trend to dust export from 1980 to 2020. As annual dust deposition decreases, the dust export increases (from 1980 to 2009). After a low value (16.24 and 16.53 Mt yr−1) for both dust deposition and export in 2010, the annual dust export began to decrease, while the annual dust deposition started to increase from 2010 to 2020. On a decadal basis, the annual dust export reached its maximum (22.18 Mt yr−1) in the 2000s, while the annual dust deposition reached the minimum of 20.72 Mt yr−1 over the same period. During this decade, dust exported from Australia was the closest to dust imported.
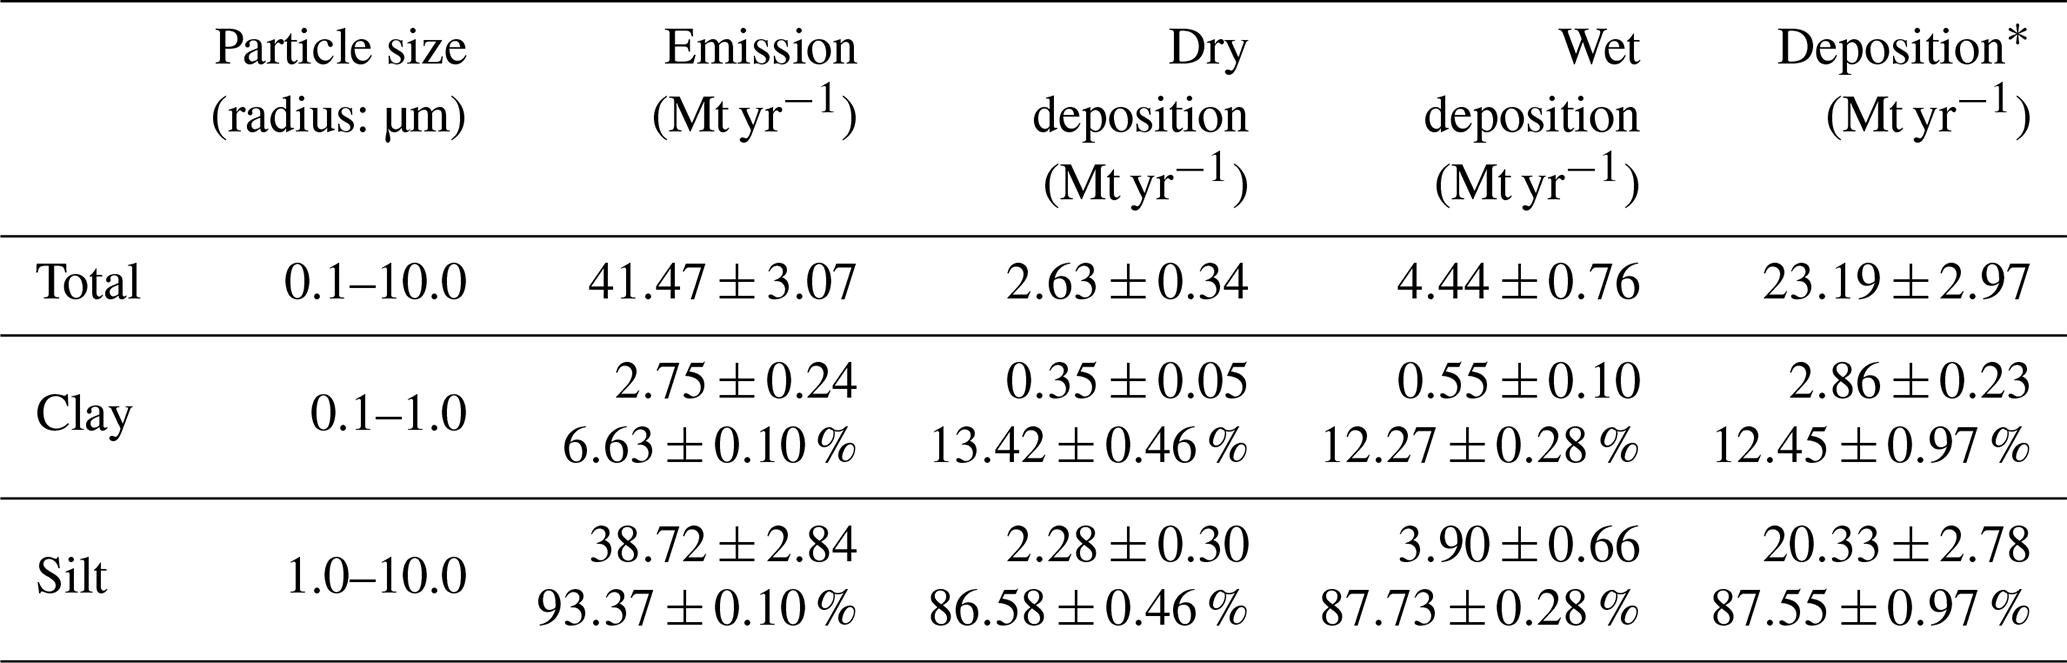
Table 2Annual dust budget for Australia in terms of clay and silt. * Deposition equals (Eq. 9).
where E, I, X, and D represent annual dust emission, dust import, dust export, and dust deposition, respectively. E was calculated using the MERRA-2 dust emission flux dataset for all particle bins, and I and X were calculated using MERRA-2 horizontal dust flux datasets. With Eq. (9), D can be evaluated.
Table 2 presents details of the annual dust loading for Australia in terms of clay and silt. Clay is a fine particle, traditionally ranging from 0.1 to 1.0 µm in radius, which corresponds to MERRA-2 dust bin 001. Silt is a much coarser particle with a broad size range of roughly 1.0–25.0 µm in radius. Although in the MERRA-2 dataset the sum of dust bin 002 to bin 005 only covers 1.0–10 µm, in this study the sum of dust bin 002 to bin 005 was regarded as silt particles. Generally, clay accounts for 6.63±0.58 % of the total dust emission in Australia and silt for 93.36±6.84 %. Ratios exceeding 86 % of silt particles in dust deposition suggest that fine particles are more likely to be transported and exported from the Australian continent.
There are differences in the spatial distribution of dust activity in Australia based on different indicators from multiple datasets. The meteorological visibility-based Dust Event Database (DEDB) and DSI have often been used to indicate the level of dust activity in Australia over the past several decades (Ekström et al., 2004; McTainsh et al., 1989, 1990, 1998, 2011a, b; McTainsh and Pitblado, 1987; McTainsh and Boughton, 1993; O'Loingsigh et al., 2014). Although these indicators are quite capable of identifying the type of dust event and the dust source areas, dust severity using meteorological observations is limited because (1) definitions of dust events change over time, (2) only the most important type was recorded, (3) there is inconsistency in records at different meteorological sites, (4) synoptic observations are subjective, and (5) BoM sites are sparse in remote areas (McTainsh et al., 2011a; McTainsh and Pitblado, 1987; O'Loingsigh et al., 2010; Strong et al., 2011). DEDB and DSI can be a valuable reference dataset for assessing remote sensing and reanalysis products due to the long-term coverage and distribution of BoM weather stations. The spatial distribution of dust activities identified with DEDB and DSI differs from that based on M&M and MERRA-2, including the following:
-
M&M DAOD shows that dust activities are most severe over the main dust source area, the Lake Eyre basin, and along major dust pathways over eastern Australia from 2002 to 2020, while the atmosphere is relatively clean over Western Australia. DEDB and DSI (McTainsh et al., 2011a) and MERRA-2 near-surface dust concentrations show not only high dust concentration over dust source areas in central Australia but also elevated dust concentration over downwind areas in the southeast and northwest of Australia. The main difference between the latter two is that MERRA-2 is able to quantify dust activity with near-surface dust concentrations and its variation over the Lake Eyre basin, Nullarbor Plain, and downwind areas; on the contrary, DEDB and DSI can only indicate dust activity at a few sites.
-
Although M&M DAOD shows high dust concentrations over eastern Australia in spring and summer, its spatial pattern is dissimilar to that of DEDB and DSI. The dusty season is spring for the northern part of Australia and summer for the southern part using DEDB (McTainsh et al., 1998), while two regions with high DAOD were found over northern Australia in summer (as shown by the red box in Fig. 8) with low photosynthetically active vegetation (Fig. 12c). In another study based on the MODIS DB aerosol product conducted by Ginoux et al. (2012), these two regions (the Barkly Tableland and the lee side of the Great Dividing Range) were found in spring, which differs from this study but coincides with the work of McTainsh et al. (1998). This is probably because (1) McTainsh et al. (1998) use meteorological data from 1960 to 1987 but the MODIS DB data are from 2003 to 2009 (Ginoux et al., 2012), while the MODIS DB data from Aqua from 2002 to 2020 have been used in this study, and (2) MODIS DB shows a much higher AOD over these two regions than MAIAC AOD (Shaylor et al., 2022), and MODIS DB retains a high AOD for thick dust plumes (Che et al., 2022). For example, for the two most severe dust storms over Australia in the past 20 years, MODIS DB shows high-AOD retrievals for the main dust plumes, which are even higher than 3.0, and the closest AERONET AOD to satellite Aqua overpass time is much less than MODIS DB (Che et al., 2022). This difference also indicates that more validation is still needed for MODIS DB aerosol products in Australia.
-
Another difference between the M&M dataset and DEDB and DSI and MERRA-2 is that the former shows a high level of dust activity over the southwest of Western Australia in spring and summer, while the latter two do not.
Although the MERRA-2 dust dataset is well constrained globally and even used as reference data to validate output from other models (Wu et al., 2020), the dust emission simulation for Australia in different studies varies considerably (Chen et al., 2022). MERRA-2 adopts the dust emission scheme proposed by Ginoux et al. (2001), which is based on soil wetness and surface wind speed. Discrepancies in the dust emission scheme may lead to different dust simulation outputs. Wu et al. (2020) compared MERRA-2 dust emission for different regions with 15 CMIP5 models and showed that the annual dust emission for Australia varies from 0.6 to 2278 Mt yr−1 and that only 3 out of 15 models (1 with the dust emission scheme of Ginoux et al., 2001) output similar dust emission to MERRA-2. Chen et al. (2022) compared annual dust emissions in nine studies and found that the annual dust emission for Australia in these studies varies within a relatively small range from 37 to 163 Mt yr−1. Moreover, estimates of dust loading using ground-based data for a single dust event reveal that MERRA-2 may underestimate dust emission in Australia. McTainsh et al. (2005) point out that published studies are very likely to overestimate dust loading under the assumption that dust concentration is uniform from the bottom to the top and recalculated dust loadings for dust storms on 8 February 1983 (Melbourne), 20–30 May 1994 (South Australia), 1 December 1987, and 23 October 2003, which were 1.23 Mt, 3.3–6.4 Mt, less than 3.35–4.85 Mt, and 3.35–4.85 Mt, respectively. These single dust events over a region produced similar dust emissions to or even more dust than MERRA-2 monthly total dust emission from the whole of Australia (3.58, 2.35, 4.76, and 5.49 Mt for corresponding months), indicating that MERRA-2 might underestimate dust emission in Australia. Additionally, AOD (Che et al., 2022) and PM10 observations (Fig. 5) during nationwide dust storms both provide evidence that MERRA-2-simulated dust concentrations are considerably lower than observations. As a negative result, the annual dust emission estimates for high-emission years, especially 2002, 2009, and 2019, were significantly underestimated, introducing uncertainty into dust emission analyses in Australia. For example, it is highly probable that the annual dust emission trend in the 2000s and 2010s is underestimated (Fig. 11).
As dust emissions are primarily determined by soil moisture content and surface wind speed (Ginoux et al., 2001), rainfall is strongly correlated with dust emissions (Fig. 12a and b). Areas of dust emission, such as the center of the Lake Eyre basin and the Nullarbor Plain, are typically associated with low rainfall, especially below 150 mm yr−1. The Mann–Kendall (MK) tests conducted on annual dust emission and rainfall data from 1980 to 2020 further highlight the substantial inhibitory impact of rainfall on dust emissions. A decreasing trend of dust emission occurred over the past 40 years with increased rainfall for almost all regions, especially in the southwest of WA (Fig. 12e). Northern Australia commonly shows an increasing trend of rainfall, while dust emissions remained essentially unchanged. This is because the highly vegetated surface in northern Australia rarely emits dust particles. Conversely, with significant decreasing rainfall (p<0.05), the southwest of QLD, as a part of the Lake Eyre basin, shows an increasing trend of dust emissions. Nevertheless, the impact of photosynthetically active vegetation on dust emissions was ignored in the dust emission scheme of Ginoux et al. (2001; Fig. 12f), potentially resulting in uncertainties in dust emission estimates. Despite sharing a similar spatial pattern with rainfall trends, NDVI trends show an opposite trend to dust emissions in most of the Lake Eyre basin. This indicates that the decreasing trend of photosynthetically active vegetation cover also contributes to the increasing trend of dust emissions in the southwest of QLD. It is essential to acknowledge and consider this factor in dust emission estimations.
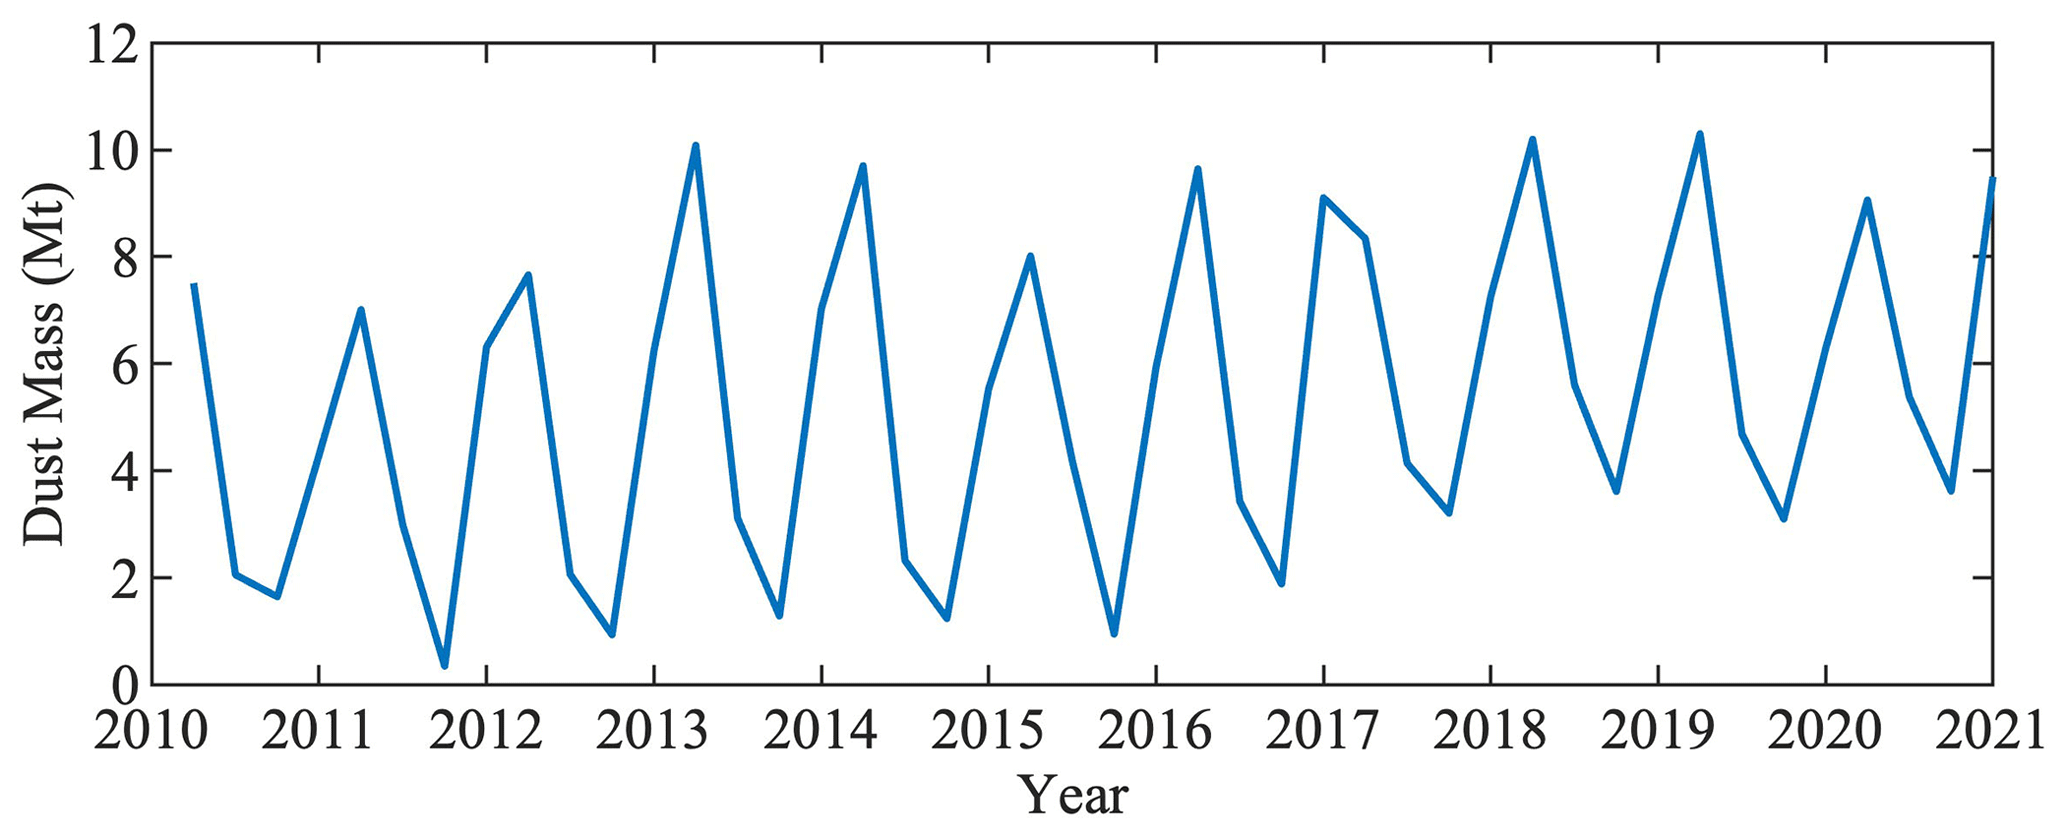
The post-2010 trend of dust deposition is likely caused by surface wind speed. Annual dust deposition shows a strong correlation with the silt particle fraction (Fig. 13a) for the period 1980–2010 (blue points) and post-2010 (red points). As large particles have a higher settling velocity, more than 86 % of dust was deposited on the land. A higher fraction of silt particles indicates that deposited materials are made up of more silt particles. Nevertheless, as surface wind speed is a key factor in dust emission estimation, an increasing surface wind speed would entrain more coarse dust particles, leading to more dust deposition on the land, as indicated by an r2 value of 0.44 between dust deposition and surface wind speed (Fig. 13b). Additionally, Fig. 14 shows seasonal variations in the amount of dust deposition in mainland Australia, with the maximum deposition occurring in summer (December–February) and the minimum in autumn (September–November). It is clear from Fig. 14 that the minimum deposition has increased from less than 1 Mt in 2011 to more than 3 Mt over the past several years (2017–2020), while the peak deposition has not changed significantly over the 11 years (Fig. 14).
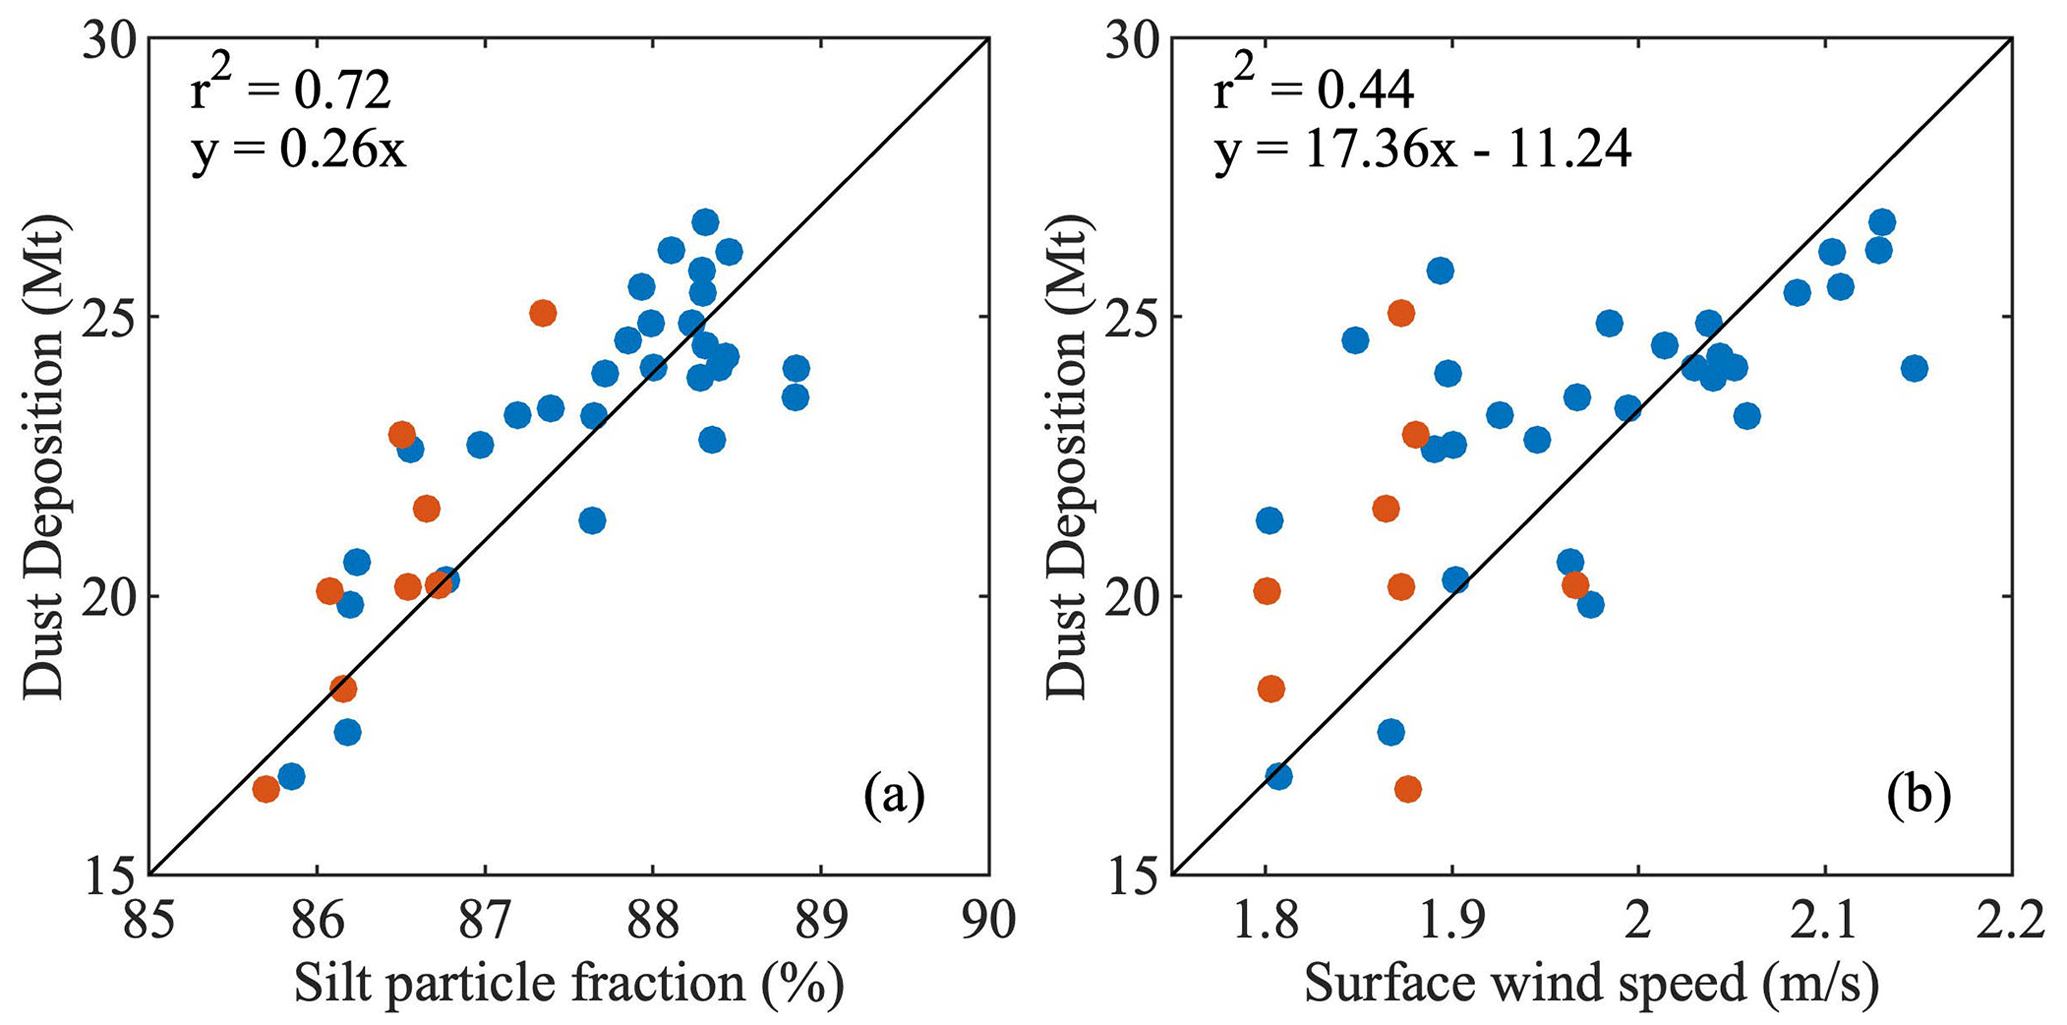
Figure 13Relationships between annual dust deposition and (a) silt particle fraction and (b) surface wind speed (McVicar, 2010) during 1980–2016. Red points represent data from 2010 onward. Indicators in each panel are calculated using all data points.
There is an inconsistency between dust emission and dust wet anddry deposition in Australia using the MERRA-2 product. The imbalance between MERRA-2 dust emission and deposition could be caused by the incremental update procedure in MERRA-2 and a lack of data assimilation for non-AOD parameters (Wu et al., 2020). Only AOD in MERRA-2 was constrained by AOD observations from multiple sources (Randles et al., 2017), leading to the bias in the dust component in the underlying aerosol model and in biased dust emission data that could not be corrected. The average dust emission (41.47 Mt yr−1) plus dust import (1.34 Mt yr−1) is much higher than the average dust dry and wet deposition (7.07 Mt yr−1) plus dust export (19.63 Mt yr−1) from 1980 to 2020. The difference of approximately 16.11 Mt yr−1 or 38 % suggests that the MERRA-2 dust deposition needs to be adjusted to balance with dust emission.
The long-term broad scale of dust activities in this study would provide useful information on dust activities in Australia. Most dust studies in Australia are based on ground-based observations. In the early 1990s, Yu et al. (1992, 1993) investigated the impact of rainfall in dust source areas in the previous autumn on dust event days in Mildura, Australia, in the following summer. At a much larger scale, McTainsh et al. (1998) find that climatic drivers, i.e., wind run and soil moisture, affect dust storm frequencies in the northern and southern parts of eastern Australia in different ways during the dust season based on BoM meteorological observations. On the basis of the study by McTainsh et al. (1998), Ekström et al. (2004) investigated the relationship between Australian dust storms and synoptic pressure distributions and found that spring–summer dust storms over central and southern Australia are most likely controlled by cold fronts with no precipitation and the summer–autumn dust storms are most likely controlled by the driest period of the year. Speer (2013) reported that westerly induced dust storms that transport dust to the east coast tend to occur during El Niño years and positive and negative phases of the southern annular mode (SAM). Compared to ground-based observations, satellite remote sensing data provide dust-related parameters at a broader scale. For example, with remote sensing products, Yu and Ginoux (2021) assess how ENSO and the Madden–Julian Oscillation (MJO) influence dust activities in Australia. They further show that during MJO phases, dust activities are impacted by anomalies in convection and wind due to the MJO and soil moisture and vegetation are impacted due to the ENSO. This study provides the spatial pattern of dust activities in Australia using MODIS–MERRA combined DAOD and MERRA-2 PM10 and near-surface dust concentration. The findings in this study serve as an extension of previous studies, deepen our understanding of the spatial pattern of dust activities in Australia, and provide useful information on dust activities for future dust research in Australia.
On the basis of work by Che et al. (2022), this paper built a DAOD dataset based on MODIS DB and MERRA-2 aerosol datasets. Additionally, it validated the MERRA-2 near-surface dust concentration, MERRA-2-estimated PM10, major dust pathways, and MERRA-2–MODIS combined DAOD (M&M) with collected ground-based data, and with these datasets it analyzed the spatial and temporal distribution of dust activity over Australia from 1980 to 2020. The M&M DAOD dataset was found to be of acceptable accuracy in Australia compared with AERONET data. M&M DAOD contributes to long-term dust research in Australia. A power-law relationship (similar to previous studies) has been found between MERRA-2 hourly near-surface dust concentration and BoM manual horizontal visibility at three sites in eastern Australia. Monthly MERRA-2-estimated PM10 shows similar variations to AQMN ground-based PM10 observations, with an r2 value from 0.14 to 0.44 at six selected sites; however, MERRA-2 PM10 is not sensitive to low PM10 in winter and to peaks in summer and is very likely to miss extremely high monthly PM10 values. MERRA-2 horizontal flux in the MERRA-2 aerosol reanalysis shows similar general dust pathways (Bowler, 1976; Sprigg, 1982), suggesting that both early simulations and MERRA-2 are reliable in identifying dust pathways. Moreover, MERRA-2 further provides quantitative details on dust concentration and fluxes in a spatially consistent manner, with a notable underestimation during high-concentration dust events.
Dust events over Australia are shown to be concentrated in the north and southeast in spring (September–November) and occur anywhere to the east in summer, with the dust season finishing in autumn (based on M&M DAOD). Four main dust regions have been identified. These include the southwest of Western Australia and the north and south of eastern Australia. The center of the Lake Eyre basin, which emits dust throughout the year, is identified as the dustiest region. Dust events over the southwest of Western Australia span only 2 months, starting in September and reaching their peak in October. Dust events to the north of eastern Australia start in October, gradually reaching a peak in December and January and ending in April.
Near-surface dust concentrations were found to be the highest (over 200 µg m−3) over the center of Lake Eyre basin and weakened radially according to distance from the center, decreasing to below 20 µg m−3 along the two main pathways to the southwest and northeast. The dust pathway in the southeast shows lower near-surface dust concentrations than the northeast, coinciding with the fact that dust entrained in central Australia is hardly transported to the east coast (Speer, 2013). This is also shown by the ratio of near-surface dust concentration to PM10, where high values are concentrated around central Australia and relatively low ratios (below 0.5) are found in eastern Australia.
Total dust emission was estimated to be 40 Mt (megatonnes) per year over the period 1980–2020, of which nearly 50 % was deposited on land; the rest was net export from the Australian continent. The average annual dust emissions over each decade from the 1980s to the 2010s are 42.74, 42.25, 40.99, and 39.63 Mt yr−1, respectively, showing an overall decreasing trend on a decadal basis, while uncertainties exist due to the underestimation of MERRA-2 during high-concentration dust events. In the 2000s, more dust was exported than over other periods, 22.18 Mt yr−1 vs. 18.80 Mt yr−1, and was the closest to dust deposition (20.72 Mt yr−1, the lowest); however, approximately 23.19 Mt yr−1 was deposited over the land area during other periods. Among these particles, 6.63±0.10 % (2.75±0.24 Mt yr−1) of emissions were clay particles and almost all dust deposition (87.55±0.87 %) consisted of silt. This indicates that exported dust from Australia is mainly composed of fine particles (clay). Additionally, dust import was identified from the north, south, and west coastlines using MERRA-2 flux data. Only dust across the coastline in the southwest of Western Australia was genuinely imported from other continents, while other imported dust is sourced and recycled from exported dust from Australia across the north and south coastlines.
The MERRA-2 and MODIS DB products are publicly available from https://www.earthdata.nasa.gov/ (NASA, 2024). The PM10 data can be downloaded from https://www.airquality.nsw.gov.au/air-quality-data-services/data-download-facility (NSW Government, 2024), and the hourly horizontal visibility is available from the Australian Bureau of Meteorology. The SILO rainfall data can be accessed from https://www.longpaddock.qld.gov.au/silo/gridded-data/ (Queensland Government, 2024).
YC: conceptualization, data curation, methodology, software, visualization, investigation, writing (original draft), preparation. BY: supervision, writing (review and editing). KP: writing (review and editing).
The contact author has declared that none of the authors has any competing interests.
Publisher's note: Copernicus Publications remains neutral with regard to jurisdictional claims made in the text, published maps, institutional affiliations, or any other geographical representation in this paper. While Copernicus Publications makes every effort to include appropriate place names, the final responsibility lies with the authors.
We are thankful to the Australian Bureau of Meteorology for observing and maintaining the horizontal data. The first author acknowledges Griffith University for the financial support provided through the Griffith University International Postgraduate Research Scholarship (GUIPRS) and the Griffith University Postgraduate Research Scholarship (GUPRS).
This research has been supported by Griffith University.
This paper was edited by Jianping Huang and reviewed by two anonymous referees.
Ackerman, S. A.: Using the radiative temperature difference at 3.7 and 11 µm to tract dust outbreaks, Remote Sens. Environ., 27, 129–133, https://doi.org/10.1016/0034-4257(89)90012-6, 1989.
Ångström, A.: Solar and terrestrial radiation. Report to the international commission for solar research on actinometric investigations of solar and atmospheric radiation, Q. J. Roy. Meteorol. Soc., 50, 121–126, https://doi.org/10.1002/qj.49705021008, 1924.
Baddock, M. C., Bullard, J. E., and Bryant, R. G.: Dust source identification using MODIS: A comparison of techniques applied to the Lake Eyre Basin, Australia, Remote Sens. Environ., 113, 1511–1528, https://doi.org/10.1016/j.rse.2009.03.002, 2009.
Baddock, M. C., Strong, C. L., Leys, J. F., Heidenreich, S. K., Tews, E. K., and McTainsh, G. H.: A visibility and total suspended dust relationship, Atmos. Environ., 89, 329–336, https://doi.org/10.1016/j.atmosenv.2014.02.038, 2014.
Bauer, S. E., Koch, D., Unger, N., Metzger, S. M., Shindell, D. T., and Streets, D. G.: Nitrate aerosols today and in 2030: a global simulation including aerosols and tropospheric ozone, Atmos. Chem. Phys., 7, 5043–5059, https://doi.org/10.5194/acp-7-5043-2007, 2007.
BBC News: Australia weather: How much rain did it take to put out NSW fires?, https://www.bbc.com/news/world-australia-51498193 (last access: 3 April 2024), 2020.
Bhattachan, A. and D'Odorico, P.: Can land use intensification in the Mallee, Australia increase the supply of soluble iron to the Southern Ocean?, Sci. Rep., 4, 6009, https://doi.org/10.1038/srep06009, 2014.
Bhattachan, A., D'Odorico, P., Baddock, M. C., Zobeck, T. M., Okin, G. S., and Cassar, N.: The Southern Kalahari: a potential new dust source in the Southern Hemisphere?, Environ. Res. Lett., 7, 024001, https://doi.org/10.1088/1748-9326/7/2/024001, 2012.
Blewett, R.: Shaping a Nation :A Geology of Australia, Commonwealth of Australia and ANU-E Press, Canberra, https://doi.org/10.22459/SN.08.2012, 2012.
Bowler, J. M.: Aridity in Australia: Age, origins and expression in aeolian landforms and sediments, Earth-Sci. Rev., 12, 279–310, https://doi.org/10.1016/0012-8252(76)90008-8, 1976.
Buchard, V., Randles, C. A., da Silva, A. M., Darmenov, A., Colarco, P. R., Govindaraju, R., Ferrare, R., Hair, J., Beyersdorf, A. J., Ziemba, L. D., and Yu, H.: The MERRA-2 aerosol reanalysis, 1980 onward. Part II: Evaluation and case studies, J. Climate, 30, 6851–6872, https://doi.org/10.1175/JCLI-D-16-0613.1, 2017.
Bullard, J., Baddock, M., McTainsh, G., and Leys, J.: Sub-basin scale dust source geomorphology detected using MODIS, Geophys. Res. Lett., 35, 15404, https://doi.org/10.1029/2008GL033928, 2008.
Chan, Y.-C., Cohen, D. D., Hawas, O., Stelcer, E., Simpson, R., Denison, L., Wong, N., Hodge, M., Comino, E., and Carswell, S.: Apportionment of sources of fine and coarse particles in four major Australian cities by positive matrix factorisation, Atmos. Environ., 42, 374–389, https://doi.org/10.1016/j.atmosenv.2007.09.030, 2008.
Che, Y., Xue, Y., Mei, L., Guang, J., She, L., Guo, J., Hu, Y., Xu, H., He, X., Di, A., and Fan, C.: Technical note: Intercomparison of three AATSR Level 2 (L2) AOD products over China, Atmos. Chem. Phys., 16, 9655–9674, https://doi.org/10.5194/acp-16-9655-2016, 2016.
Che, Y., Xue, Y., Guang, J., She, L., and Guo, J.: Evaluation of the AVHRR DeepBlue aerosol optical depth dataset over mainland China, ISPRS J. Photogram. Remote Sens., 146, 74–90, https://doi.org/10.1016/j.isprsjprs.2018.09.004, 2018.
Che, Y., Yu, B., Parsons, K., Desha, C., and Ramezani, M.: Evaluation and comparison of MERRA-2 AOD and DAOD with MODIS DeepBlue and AERONET data in Australia, Atmos. Environ., 277, 119054, https://doi.org/10.1016/j.atmosenv.2022.119054, 2022.
Chen, L., Mengersen, K., and Tong, S.: Spatiotemporal relationship between particle air pollution and respiratory emergency hospital admissions in Brisbane, Australia, Sci. Total Environ., 373, 57–67, https://doi.org/10.1016/j.scitotenv.2006.10.050, 2007.
Chen, W., Meng, H., Song, H., and Zheng, H.: Progress in Dust Modelling, Global Dust Budgets, and Soil Organic Carbon Dynamics, Land, 11, 176, https://doi.org/10.3390/land11020176, 2022.
Chepil, W. S. and Woodruff, N. P.: Sedimentary characteristics of dust storms; Part II, Visibility and dust concentration, Am. J. Sci., 255, 104–114, https://doi.org/10.2475/ajs.255.2.104, 1957.
Cowie, G., Lawson, W., and Kim, N.: Australian dust causing respiratory disease admissions in some North Island, New Zealand Hospitals, N. Z. Med. J., 123, 87–88, 2010.
De Deckker, P.: An evaluation of Australia as a major source of dust, Earth-Sci. Rev., 194, 536–567, https://doi.org/10.1016/j.earscirev.2019.01.008, 2019.
de Jesus, A. L., Thompson, H., Knibbs, L. D., Hanigan, I., De Torres, L., Fisher, G., Berko, H., and Morawska, L.: Two decades of trends in urban particulate matter concentrations across Australia, Environ. Res., 190, 110021, https://doi.org/10.1016/j.envres.2020.110021, 2020.
de Leeuw, G., Holzer-Popp, T., Bevan, S., Davies, W. H., Descloitres, J., Grainger, R. G., Griesfeller, J., Heckel, A., Kinne, S., Klüser, L., Kolmonen, P., Litvinov, P., Martynenko, D., North, P., Ovigneur, B., Pascal, N., Poulsen, C., Ramon, D., Schulz, M., Siddans, R., Sogacheva, L., Tanré, D., Thomas, G. E., Virtanen, T. H., von Hoyningen Huene, W., Vountas, M., and Pinnock, S.: Evaluation of seven European aerosol optical depth retrieval algorithms for climate analysis, Remote Sens. Environ., 162, 295–315, https://doi.org/10.1016/j.rse.2013.04.023, 2015.
Desservettaz, M., Paton-Walsh, C., Griffith, D. W. T., Kettlewell, G., Keywood, M. D., Vanderschoot, M. V., Ward, J., Mallet, M. D., Milic, A., Miljevic, B., Ristovski, Z. D., Howard, D., Edwards, G. C., and Atkinson, B.: Emission factors of trace gases and particles from tropical savanna fires in Australia, J. Geophys. Res., 122, 6059–6074, https://doi.org/10.1002/2016JD025925, 2017.
Di, A., Xue, Y., Yang, X., Leys, J., Guang, J., Mei, L., Wang, J., She, L., Hu, Y., He, X., Che, Y., and Fan, C.: Dust aerosol optical depth retrieval and dust storm detection for Xinjiang Region using Indian national satellite observations, Remote Sens., 8, 702, https://doi.org/10.3390/rs8090702, 2016.
Domínguez-Rodríguez, A., Báez-Ferrer, N., Abreu-González, P., Rodríguez, S., Díaz, R., Avanzas, P., and Hernández-Vaquero, D.: Impact of Desert Dust Events on the Cardiovascular Disease: A Systematic Review and Meta-Analysis, J. Clin. Med., 10, 727, https://doi.org/10.3390/jcm10040727, 2021.
Dubovik, O. and King, M. D.: A flexible inversion algorithm for retrieval of aerosol optical properties from Sun and sky radiance measurements, J. Geophys. Res.-Atmos., 105, 20673–20696, https://doi.org/10.1029/2000JD900282, 2000.
Ekström, M., McTainsh, G. H., and Chappell, A.: Australian dust storms: temporal trends and relationships with synoptic pressure distributions (1960–99), Int. J. Climatol., 24, 1581–1599, https://doi.org/10.1002/joc.1072, 2004.
Fryrear, D. W., Stout, J. E., Hagen, L. J., and Vories, E. D.: Wind erosion: field measurement and analysis, Trans. Am. Soc. Agric. Eng., 34, 155–160, https://doi.org/10.13031/2013.31638, 1991.
Gelaro, R., McCarty, W., Suárez, M. J., Todling, R., Molod, A., Takacs, L., Randles, C. A., Darmenov, A., Bosilovich, M. G., Reichle, R., Wargan, K., Coy, L., Cullather, R., Draper, C., Akella, S., Buchard, V., Conaty, A., da Silva, A. M., Gu, W., Kim, G. K., Koster, R., Lucchesi, R., Merkova, D., Nielsen, J. E., Partyka, G., Pawson, S., Putman, W., Rienecker, M., Schubert, S. D., Sienkiewicz, M., and Zhao, B.: The modern-era retrospective analysis for research and applications, version 2 (MERRA-2), J. Climate, 30, 5419–5454, https://doi.org/10.1175/JCLI-D-16-0758.1, 2017.
Giles, D. M., Sinyuk, A., Sorokin, M. G., Schafer, J. S., Smirnov, A., Slutsker, I., Eck, T. F., Holben, B. N., Lewis, J. R., Campbell, J. R., Welton, E. J., Korkin, S. V., and Lyapustin, A. I.: Advancements in the Aerosol Robotic Network (AERONET) Version 3 database – Automated near-real-time quality control algorithm with improved cloud screening for Sun photometer aerosol optical depth (AOD) measurements, Atmos. Meas. Tech., 12, 169–209, https://doi.org/10.5194/amt-12-169-2019, 2019.
Ginoux, P., Chin, M., Tegen, I., Prospero, J. M., Holben, B., Dubovik, O., and Lin, S.-J.: Sources and distributions of dust aerosols simulated with the GOCART model, J. Geophys. Res.-Atmos., 106, 20255–20273, https://doi.org/10.1029/2000JD000053, 2001.
Ginoux, P., Garbuzov, D., and Hsu, N. C.: Identification of anthropogenic and natural dust sources using moderate resolution imaging spectroradiometer (MODIS) deep blue level 2 data, J. Geophys. Res.-Atmos., 115, 1–10, https://doi.org/10.1029/2009JD012398, 2010.
Ginoux, P., Prospero, J. M., Gill, T. E., Hsu, N. C., and Zhao, M.: Global-scale attribution of anthropogenic and natural dust sources and their emission rates based on MODIS Deep Blue aerosol products, Rev. Geophys., 50, 1–36, https://doi.org/10.1029/2012RG000388, 2012.
Gkikas, A., Proestakis, E., Amiridis, V., Kazadzis, S., Di Tomaso, E., Tsekeri, A., Marinou, E., Hatzianastassiou, N., and Pérez Garciá-Pando, C.: ModIs Dust AeroSol (MIDAS): A global fine-resolution dust optical depth data set, Atmos. Meas. Tech., 14, 309–334, https://doi.org/10.5194/amt-14-309-2021, 2021.
Goudie, A. S.: Desert dust and human health disorders, Environ. Int., 63, 101–113, https://doi.org/10.1016/j.envint.2013.10.011, 2014.
Hsu, N. C., Tsay, S. C., King, M. D., and Herman, J. R.: Aerosol properties over bright-reflecting source regions, IEEE T. Geosci. Remote, 42, 557–569, https://doi.org/10.1109/TGRS.2004.824067, 2004.
Hsu, N. C., Jeong, M. J., Bettenhausen, C., Sayer, A. M., Hansell, R., Seftor, C. S., Huang, J., and Tsay, S. C.: Enhanced Deep Blue aerosol retrieval algorithm: The second generation, J. Geophys. Res.-Atmos., 118, 9296–9315, https://doi.org/10.1002/jgrd.50712, 2013.
Jeffrey, S. J., Carter, J. O., Moodie, K. B., and Beswick, A. R.: Using spatial interpolation to construct a comprehensive archive of Australian climate data, Environ. Model. Softw., 16, 309–330, https://doi.org/10.1016/S1364-8152(01)00008-1, 2001.
Kolmonen, P., Sogacheva, L., Virtanen, T. H., de Leeuw, G., and Kulmala, M.: The ADV/ASV AATSR aerosol retrieval algorithm: current status and presentation of a full-mission AOD dataset, Int. J. Digit. Earth, 9, 545–561, https://doi.org/10.1080/17538947.2015.1111450, 2016.
Levy, R. C., Mattoo, S., Munchak, L. A., Remer, L. A., Sayer, A. M., Patadia, F., and Hsu, N. C.: The Collection 6 MODIS aerosol products over land and ocean, Atmos. Meas. Tech., 6, 2989–3034, https://doi.org/10.5194/amt-6-2989-2013, 2013.
Leys, J. F., Heidenreich, S. K., Strong, C. L., McTainsh, G. H., and Quigley, S.: PM10 concentrations and mass transport during “Red Dawn” – Sydney 23 September 2009, Aeolian Res., 3, 327–342, https://doi.org/10.1016/j.aeolia.2011.06.003, 2011.
Love, B. M., Leys, J. F., Strong, C. L., and McTainsh, G. H.: Dust climatology of Mildura, Victoria, Australia: transport direction, Earth Surf. Proc. Land., 44, 1449–1459, https://doi.org/10.1002/esp.4587, 2019.
Ma, X., Yan, P., Zhao, T., Jia, X., Jiao, J., Ma, Q., Wu, D., Shu, Z., Sun, X., and Habtemicheal, B. A.: Evaluations of surface PM10 concentration and chemical compositions in merra-2 aerosol reanalysis over central and eastern china, Remote Sens., 13, 1317, https://doi.org/10.3390/rs13071317, 2021.
McGowan, H. A. and Clark, A.: A vertical profile of PM10 dust concentrations measured during a regional dust event identified by MODIS Terra, western Queensland, Australia, J. Geophys. Res.-Earth, 113, F02S03, https://doi.org/10.1029/2007JF000765, 2008.
McGowan, H. A., McTainsh, G. H., Zawar-Reza, P., and Sturman, A. P.: Identifying regional dust transport pathways: Application of kinematic trajectory modelling to a trans-Tasman case, Earth Surf. Proc. Land., 25, 633–647, https://doi.org/10.1002/1096-9837(200006)25:6<633::AID-ESP102>3.0.CO;2-J, 2000.
McTainsh, G. H. and Boughton, W. C.: Land Degradation Processes in Australia, Longman Cheshire, Melbourne, 389 pp., ISBN 0582870089, ISBN 9780582870086, 1993.
McTainsh, G. H. and Pitblado, J. R.: Dust storms and related phenomena measured from meteorological records in Australia, Earth Surf. Proc. Land., 12, 415–424, https://doi.org/10.1002/esp.3290120407, 1987.
McTainsh, G. H., Burgess, R., and Pitblado, J. R.: Aridity, drought and dust storms in Australia (1960–84), J. Arid Environ., 16, 11–22, https://doi.org/10.1016/s0140-1963(18)31042-5, 1989.
McTainsh, G. H., Lynch, A. W., and Burgess, R. C.: Wind erosion in eastern australia, Aust. J. Soil Res., 28, 323–339, https://doi.org/10.1071/SR9900323, 1990.
McTainsh, G. H., Lynch, A. W., and Tews, E. K.: Climatic controls upon dust storm occurrence in eastern Australia, J. Arid Environ., 39, 457–466, https://doi.org/10.1006/jare.1997.0373, 1998.
McTainsh, G. H., Chan, Y. C., McGowan, H., Leys, J., and Tews, K.: The 23rd October 2002 dust storm in eastern Australia: Characteristics and meteorological conditions, Atmos. Environ., 39, 1227–1236, https://doi.org/10.1016/j.atmosenv.2004.10.016, 2005.
McTainsh, G. H., Leys, J., O'Loingsigh, T., and Strong, C. L.: Update of Dust Storm Index (DSI) maps for 2005 to 2010 and re-analysis and mapping of DSI for for the Australian Collaborative Rangeland Information System (ACRIS), DSEWPaC, Canberra, 1992–2008, https://citeseerx.ist.psu.edu/document?repid=rep1&type=pdf&doi=596a03a7864abf000c60b9f2ecca75944d1547ae (last access: 3 April 2024), 2011a.
McTainsh, G. H., Leys, J. F., O'Loingsigh, T., and Strong, C. L.: Wind erosion and land management in Australia during 1940–1949 and 2000–2009, Canberra, https://citeseerx.ist.psu.edu/document?repid=rep1&type=pdf&doi=8eac73bf254bd3107cba7f6cb91eb1edfa51bf5a (last access: 3 April 2024), 2011b.
McVicar, T.: Near-Surface Wind Speed.v10., CSIRO, https://doi.org/10.25919/5c5106acbcb02, 2010.
Mei, L., Xue, Y., de Leeuw, G., von Hoyningen-Huene, W., Kokhanovsky, A. A., Istomina, L., Guang, J., and Burrows, J. P.: Aerosol optical depth retrieval in the Arctic region using MODIS data over snow, Remote Sens. Environ., 128, 234–245, https://doi.org/10.1016/j.rse.2012.10.009, 2013a.
Mei, L., Xue, Y., Kokhanovsky, A. A., von Hoyningen-Huene, W., Istomina, L., de Leeuw, G., Burrows, J. P., Guang, J., and Jing, Y.: Aerosol optical depth retrieval over snow using AATSR data, Int. J. Remote Sens., 34, 5030–5041, https://doi.org/10.1080/01431161.2013.786197, 2013b.
Middleton, N. J.: Desert dust hazards: A global review, Aeolian Res., 24, 53–63, https://doi.org/10.1016/j.aeolia.2016.12.001, 2017.
Mukkavilli, S. K., Prasad, A. A., Taylor, R. A., Huang, J., Mitchell, R. M., Troccoli, A., and Kay, M. J.: Assessment of atmospheric aerosols from two reanalysis products over Australia, Atmos. Res., 215, 149–164, https://doi.org/10.1016/j.atmosres.2018.08.026, 2019.
NASA: Earthdata, https://www.earthdata.nasa.gov/ (last access: 3 April 2024), 2024.
NSW Government: AQMN, https://www.airquality.nsw.gov.au/air-quality-data-services/data-download-facility (last access: 3 April 2024), 2024.
O'Loingsigh, T., McTainsh, G. H., Tapper, N. J., and Shinkfield, P.: Lost in code: A critical analysis of using meteorological data for wind erosion monitoring, Aeolian Res., 2, 49–57, https://doi.org/10.1016/j.aeolia.2010.03.002, 2010.
O'Loingsigh, T., McTainsh, G. H., Tews, E. K., Strong, C. L., Leys, J. F., Shinkfield, P., and Tapper, N. J.: The Dust Storm Index (DSI): A method for monitoring broadscale wind erosion using meteorological records, Aeolian Res., 12, 29–40, https://doi.org/10.1016/j.aeolia.2013.10.004, 2014.
O'Loingsigh, T., Chubb, T., Baddock, M., Kelly, T., Tapper, N. J., de Deckker, P., and McTainsh, G.: Sources and pathways of dust during the Australian “millennium drought” decade, J. Geophys. Res., 122, 1246–1260, https://doi.org/10.1002/2016JD025737, 2017.
Ou, Y., Li, Z., Chen, C., Zhang, Y., Li, K., Shi, Z., Dong, J., Xu, H., Peng, Z., Xie, Y., and Luo, J.: Evaluation of MERRA-2 Aerosol Optical and Component Properties over China Using SONET and PARASOL/GRASP Data, Remote Sens., 14, 821, https://doi.org/10.3390/rs14040821, 2022.
Pereira, G., Lee, H. J., Bell, M., Regan, A., Malacova, E., Mullins, B., and Knibbs, L. D.: Development of a model for particulate matter pollution in Australia with implications for other satellite-based models, Environ. Res., 159, 9–15, https://doi.org/10.1016/j.envres.2017.07.044, 2017.
Prospero, J. M., Barkley, A. E., Gaston, C. J., Gatineau, A., Campos y Sansano, A., and Panechou, K.: Characterizing and Quantifying African Dust Transport and Deposition to South America: Implications for the Phosphorus Budget in the Amazon Basin, Global Biogeochem. Cy., 34, e2020GB006536, https://doi.org/10.1029/2020GB006536, 2020.
Provençal, S., Buchard, V., da Silva, A. M., Leduc, R., and Barrette, N.: Evaluation of PM surface concentrations simulated by Version 1 of NASA's MERRA Aerosol Reanalysis over Europe, Atmos. Pollut. Res., 8, 374–382, https://doi.org/10.1016/j.apr.2016.10.009, 2017.
Pu, B. and Ginoux, P.: Projection of American dustiness in the late 21st century due to climate change, Sci. Rep., 7, 5553, https://doi.org/10.1038/s41598-017-05431-9, 2017.
Pu, B. and Ginoux, P.: How reliable are CMIP5 models in simulating dust optical depth?, Atmos. Chem. Phys., 18, 12491–12510, https://doi.org/10.5194/acp-18-12491-2018, 2018.
Qin, W., Zhang, Y., Chen, J., Yu, Q., Cheng, S., Li, W., Liu, X., and Tian, H.: Variation, sources and historical trend of black carbon in Beijing, China based on ground observation and MERRA-2 reanalysis data, Environ. Pollut., 245, 853–863, https://doi.org/10.1016/j.envpol.2018.11.063, 2019.
Queensland Government: SILO, https://www.longpaddock.qld.gov.au/silo/gridded-data/ (last access: 3 April 2024), 2024.
Randles, C. A., da Silva, A. M., Buchard, V., Colarco, P. R., Darmenov, A., Govindaraju, R., Smirnov, A., Holben, B., Ferrare, R., Hair, J., Shinozuka, Y., and Flynn, C. J.: The MERRA-2 aerosol reanalysis, 1980 onward. Part I: System description and data assimilation evaluation, J. Climate, 30, 6823–6850, https://doi.org/10.1175/JCLI-D-16-0609.1, 2017.
Roberts, S.: Have the short-term mortality effects of particulate matter air pollution changed in Australia over the period 1993–2007?, Environ. Pollut., 182, 9–14, https://doi.org/10.1016/j.envpol.2013.06.036, 2013.
Rotstayn, L. D., Collier, M. A., Mitchell, R. M., Qin, Y., Campbell, S. K., and Dravitzki, S. M.: Simulated enhancement of ENSO-related rainfall variability due to Australian dust, Atmos. Chem. Phys., 11, 6575–6592, https://doi.org/10.5194/acp-11-6575-2011, 2011.
Rust, B. R. and Nanson, G. C.: Bedload transport of mud as pedogenic aggregates in modern and ancient rivers, Sedimentology, 36, 291–306, https://doi.org/10.1111/j.1365-3091.1989.tb00608.x, 1989.
Sayer, A. M., Hsu, N. C., Bettenhausen, C., and Jeong, M. J.: Validation and uncertainty estimates for MODIS Collection 6 “deep Blue” aerosol data, J. Geophys. Res.-Atmos., 118, 7864–7872, https://doi.org/10.1002/jgrd.50600, 2013.
Sayer, A. M., Hsu, N. C., Lee, J., Carletta, N., Chen, S. H., and Smirnov, A.: Evaluation of NASA Deep Blue/SOAR aerosol retrieval algorithms applied to AVHRR measurements, J. Geophys. Res.-Atmos., 122, 9945–9967, https://doi.org/10.1002/2017JD026934, 2017.
Sayer, A. M., Hsu, N. C., Lee, J., Kim, W. V., and Dutcher, S. T.: Validation, Stability, and Consistency of MODIS Collection 6.1 and VIIRS Version 1 Deep Blue Aerosol Data Over Land, J. Geophys. Res.-Atmos., 124, 4658–4688, https://doi.org/10.1029/2018JD029598, 2019.
Shao, Y.: Physics and Modelling of Wind Erosion, Phys. Model. Wind Eros., 452, 1–10, https://doi.org/10.1007/978-1-4020-8895-7, 2009.
Shao, Y., Yang, Y., Wang, J., Song, Z., Leslie, L. M., Dong, C., Zhang, Z., Lin, Z., Kanai, Y., Yabuki, S., and Chun, Y.: Northeast Asian dust storms: Real-time numerical prediction and validation, J. Geophys. Res.-Atmos., 108, 2003JD003667, https://doi.org/10.1029/2003JD003667, 2003.
Shao, Y., Leys, J. F., McTainsh, G. H., and Tews, K.: Numerical simulation of the October 2002 dust event in Australia, J. Geophys. Res.-Atmos., 112, 8207, https://doi.org/10.1029/2006JD007767, 2007.
Shao, Y., Klose, M., and Wyrwoll, K.-H.: Recent global dust trend and connections to climate forcing, J. Geophys. Res.-Atmos., 118, 11107–11118, https://doi.org/10.1002/jgrd.50836, 2013.
Shaylor, M., Brindley, H., and Sellar, A.: An Evaluation of Two Decades of Aerosol Optical Depth Retrievals from MODIS over Australia, Remote Sens., 14, 2664, https://doi.org/10.3390/rs14112664, 2022.
She, L., Xue, Y., Guang, J., Che, Y., Fan, C., Li, Y., and Xie, Y.: Towards a comprehensive view of dust events from multiple satellite and ground measurements: Exemplified by the May 2017 East Asian dust storm, Nat. Hazards Earth Syst. Sci., 18, 3187–3201, https://doi.org/10.5194/nhess-18-3187-2018, 2018.
Song, Q., Zhang, Z., Yu, H., Ginoux, P., and Shen, J.: Global dust optical depth climatology derived from CALIOP and MODIS aerosol retrievals on decadal timescales: regional and interannual variability, Atmos. Chem. Phys., 21, 13369–13395, https://doi.org/10.5194/acp-21-13369-2021, 2021.
Soni, A., Mandariya, A. K., Rajeev, P., Izhar, S., Singh, G. K., Choudhary, V., Qadri, A. M., Gupta, A. D., Singh, A. K., and Gupta, T.: Multiple site ground-based evaluation of carbonaceous aerosol mass concentrations retrieved from CAMS and MERRA-2 over the Indo-Gangetic Plain, Environ. Sci. Atmos., 1, 577–590, https://doi.org/10.1039/d1ea00067e, 2021.
Speer, M. S.: Dust storm frequency and impact over Eastern Australia determined by state of Pacific climate system, Weather Clim. Extrem., 2, 16–21, https://doi.org/10.1016/j.wace.2013.10.004, 2013.
Sprigg, R. C.: Alternating wind cycles of the Quaternary era and their influences on aeolian sedimentation in and around the dune deserts of south-eastern Australia, in: Quaternary Dust Mantles of China, New Zealand and Australia, 1982.
Stefanski, R. and Sivakumar, M. V. K.: Impacts of sand and dust storms on agriculture and potential agricultural applications of a SDSWS, IOP Conf. Ser. Earth Environ. Sci., 7, 012016, https://doi.org/10.1088/1755-1307/7/1/012016, 2009.
Strong, C. L., Parsons, K., McTainsh, G. H., and Sheehan, A.: Dust transporting wind systems in the lower Lake Eyre Basin, Australia: A preliminary study, Aeolian Res., 2, 205–214, https://doi.org/10.1016/j.aeolia.2010.11.001, 2011.
Sun, E., Xu, X., Che, H., Tang, Z., Gui, K., An, L., Lu, C., and Shi, G.: Variation in MERRA-2 aerosol optical depth and absorption aerosol optical depth over China from 1980 to 2017, J. Atmos. Sol.-Terr. Phy., 186, 8–19, https://doi.org/10.1016/j.jastp.2019.01.019, 2019a.
Sun, E., Che, H., Xu, X., Wang, Z., Lu, C., Gui, K., Zhao, H., Zheng, Y., Wang, Y., Wang, H., Sun, T., Liang, Y., Li, X., Sheng, Z., An, L., Zhang, X., and Shi, G.: Variation in MERRA-2 aerosol optical depth over the Yangtze River Delta from 1980 to 2016, Theor. Appl. Climatol., 136, 363–375, https://doi.org/10.1007/s00704-018-2490-9, 2019b.
Sundström, A. M., Kolmonen, P., Sogacheva, L., and de Leeuw, G.: Aerosol retrievals over China with the AATSR dual view algorithm, Remote Sens. Environ., 116, 189–198, https://doi.org/10.1016/j.rse.2011.04.041, 2012.
Tanaka, T. Y. and Chiba, M.: A numerical study of the contributions of dust source regions to the global dust budget, Global Planet. Change, 52, 88–104, https://doi.org/10.1016/j.gloplacha.2006.02.002, 2006.
Tews, K.: Wind erosion rates from meteorological records in eastern Australia 1960–92, Griffith University, 1996.
Thomas, G. E., Carboni, E., Sayer, A. M., Poulsen, C. A., Siddans, R., and Grainger, R. G.: Oxford-RAL Aerosol and Cloud (ORAC): aerosol retrievals from satellite radiometers, in: Satellite Aerosol Remote Sensing over Land, Springer, 193–225, https://doi.org/10.1007/978-3-540-69397-0_7, 2009.
Torre, G., Gaiero, D., Coppo, R., Cosentino, N. J., Goldstein, S. L., De Vleeschouwer, F., Le Roux, G., Bolge, L., Kiro, Y., and Sawakuchi, A. O.: Unraveling late Quaternary atmospheric circulation in the Southern Hemisphere through the provenance of Pampean loess, Earth-Sci. Rev., 232, 104143, https://doi.org/10.1016/j.earscirev.2022.104143, 2022.
Tozer, P. and Leys, J.: Dust storms – What do they really cost?, Rangel. J., 35, 131–142, https://doi.org/10.1071/RJ12085, 2013.
Voss, K. K. and Evan, A. T.: A new satellite-based global climatology of dust aerosol optical depth, J. Appl. Meteorol. Clim., 59, 83–102, https://doi.org/10.1175/JAMC-D-19-0194.1, 2020.
Wei, J., Li, Z., Peng, Y., and Sun, L.: MODIS Collection 6.1 aerosol optical depth products over land and ocean: validation and comparison, Atmos. Environ., 201, 428–440, https://doi.org/10.1016/j.atmosenv.2018.12.004, 2019.
Wu, C., Lin, Z., and Liu, X.: The global dust cycle and uncertainty in CMIP5 (Coupled Model Intercomparison Project phase 5) models, Atmos. Chem. Phys., 20, 10401–10425, https://doi.org/10.5194/acp-20-10401-2020, 2020.
Yang, L., She, L., Che, Y., He, X., Yang, C., and Feng, Z.: Analysis of Dust Detection Algorithms Based on FY-4A Satellite Data, Appl. Sci., 13, 1365, https://doi.org/10.3390/app13031365, 2023.
Yang, X., Zhao, C., Yang, Y., and Fan, H.: Long-term multi-source data analysis about the characteristics of aerosol optical properties and types over Australia, Atmos. Chem. Phys., 21, 3803–3825, https://doi.org/10.5194/acp-21-3803-2021, 2021.
Yu, B., Neil, D. T., and Hesse, P. P.: Correlation between rainfall and dust occurrence at mildura, Australia: The difference between local and source area rainfalls, Earth Surf. Proc. Land., 17, 723–727, https://doi.org/10.1002/esp.3290170708, 1992.
Yu, B., Hesse, P. P., and Neil, D. T.: The relationship between antecedent regional rainfall conditions and the occurrence of dust events at Mildura, Australia, J. Arid Environ., 24, 109–124, https://doi.org/10.1006/jare.1993.1010, 1993.
Yu, Y. and Ginoux, P.: Assessing the contribution of the ENSO and MJO to Australian dust activity based on satellite- And ground-based observations, Atmos. Chem. Phys., 21, 8511–8530, https://doi.org/10.5194/acp-21-8511-2021, 2021.
Zender, C. S.: Mineral Dust Entrainment and Deposition (DEAD) model: Description and 1990s dust climatology, J. Geophys. Res., 108, 4416, https://doi.org/10.1029/2002JD002775, 2003.
Zhang, X., Zhao, L., Tong, D. Q., Wu, G., Dan, M., and Teng, B.: A systematic review of global desert dust and associated human health effects, Atmosphere, 7, 158, https://doi.org/10.3390/atmos7120158, 2016.
Zhao, Q., Zhao, W., Bi, J., and Ma, Z.: Climatology and calibration of MERRA-2 PM2.5 components over China, Atmos. Pollut. Res., 12, 357–366, https://doi.org/10.1016/j.apr.2020.11.016, 2021.