the Creative Commons Attribution 4.0 License.
the Creative Commons Attribution 4.0 License.
 | 03 Apr 2024
Weakened aerosol–radiation interaction exacerbating ozone pollution in eastern China since China's clean air actions
Hao Yang
Lei Chen
Hong Liao
Wenjie Wang
Since China's clean air action, PM2.5 (particulate matter with an aerodynamic equivalent diameter of 2.5 µm or less) air quality has improved, while ozone (O3) pollution has become more severe. Here we apply a coupled meteorology–chemistry model (WRF-Chem: Weather Research and Forecasting model coupled to Chemistry v3.7.1) to quantify the responses of aerosol–radiation interaction (ARI) to anthropogenic emission reductions from 2013 to 2017, including aerosol–photolysis interaction (API) related to photolysis rate change and aerosol–radiation feedback (ARF) related to meteorological field change and their contributions to O3 increases over eastern China in summer and winter. Sensitivity experiments show that the decreased anthropogenic emissions play a more prominent role in the increased daily maximum 8 h average (MDA8) O3 in both summer (+1.96 ppb vs. +0.07 ppb) and winter (+3.56 ppb vs. −1.08 ppb) than the impacts of changed meteorological conditions in urban areas. The decreased PM2.5 caused by emission reductions can result in a weaker impact of ARI on O3 concentrations, which superimposes its effect on the worsened O3 air quality. The weakened ARI due to decreased anthropogenic emissions aggravates the summer (winter) O3 pollution by +0.81 ppb (+0.63 ppb), averaged over eastern China, with weakened API contributing 55.6 % (61.9 %) and ARF contributing 44.4 % (38.1 %), respectively. This superimposed effect is more significant for urban areas during summer (+1.77 ppb). Process analysis indicates that the enhanced chemical production is the dominant process for the increased O3 concentrations caused by weakened ARI in both summer and winter. This study innovatively reveals the adverse effect of weakened aerosol–radiation interaction due to decreased anthropogenic emissions on O3 air quality, indicating that more stringent coordinated air pollution control strategies should be implemented for significant improvements in future air quality.
- Article
(8300 KB) - Full-text XML
-
Supplement
(5038 KB) - BibTeX
- EndNote


Since the implementation of clean air action in 2013, PM2.5 (particulate matter with an aerodynamic equivalent diameter of 2.5 µm or less) concentrations have decreased significantly in China (Zhai et al., 2019; Zhang et al., 2019). However, ozone (O3) pollution is becoming worse and poses a significant challenge over eastern China, especially in the developed city clusters including Beijing–Tianjin–Hebei (BTH), the Yangtze River Delta (YRD), the Pearl River Delta (PRD), and the Sichuan Basin (SCB) (Lu et al., 2018; Dang and Liao, 2019; Li et al., 2019, 2021). According to observation data, Li et al. (2020) found that the daily maximum 8 h average O3 concentrations (MDA8 O3) increased at a rate of 1.9 ppb a−1 from 2013 to 2019 over eastern China. Elevated O3 concentrations can not only decrease crop yield but also damage human health (Lelieveld et al., 2015; Yue et al., 2017; Mills et al., 2018). Therefore, it is essential to gain a comprehensive understanding of factors driving the increasing trend of O3 in China in order to formulate effective prevention strategies.
As a secondary air pollutant, troposphere O3 can be produced by nitrogen oxides (NOx= NO + NO2), carbon monoxide (CO), methane (CH4), and volatile organic compounds (VOCs) in the presence of solar radiation through photochemical reactions (Atkinson, 2000; Seinfeld and Pandis, 2006). The concentration of O3 in the troposphere is influenced by changes in meteorological conditions (e.g., high temperature and low relative humidity) and its precursors emissions (e.g., NOx and VOCs) (Wang et al., 2019; Liu and Wang, 2020a, b; Shu et al., 2020). Most precursors are from anthropogenic sources, but some precursors can come from natural sources such as biogenic VOCs and soil and lightning NOx. Moreover, particulates can also affect O3 concentrations through aerosol–radiation interaction (ARI), including aerosol–photolysis interaction (API) and aerosol–radiation feedback (ARF) (Liao et al., 1999; Wang et al., 2016; Zhu et al., 2021; Yang et al., 2022) as well as heterogeneous chemistry on the aerosol surface (Lou et al., 2014; Li et al., 2019; Liu and Wang, 2020b). Many studies have found that decreased PM2.5 can be one of the driving factors contributing to increased O3 concentrations (Li et al., 2019; Liu and Wang, 2020b; Shao et al., 2021). Li et al. (2019) analyzed GEOS-Chem simulation results and pointed out that the reductions in PM2.5 concentrations from 2013 to 2017 over the North China Plain (NCP) could have decreased the sink of HO2 on the aerosol surface, which would result in an increase in O3 concentrations. When heterogeneous reactions were considered in WRF-CMAQ, Liu and Wang (2020b) found that decreased PM2.5 concentrations weakened the uptake of reactive gases (mainly HO2 and O3), which led to the increase in O3 concentrations over China from 2013 to 2017. However, the contribution of weakened aerosol–radiation interaction to the increased O3 due to substantial decreases in PM2.5 under clean air action has not been systematically quantified. Furthermore, previous studies mainly focus on increased summer O3 (Li et al., 2019; Liu and Wang, 2020a, b; Shu et al., 2020; Shao et al., 2021), but underlying reasons driving the changes in winter O3 are unclear. Li et al. (2021) pointed out that O3 pollution has extended into cold seasons under the emission control measures. Therefore, this study aims to quantify the response of aerosol–radiation interaction to anthropogenic emission reduction from 2013 to 2017, with the main focus on the contribution to changed O3 concentrations over eastern China in both summer and winter.
Aerosol–radiation interaction (ARI) can alter photolysis rates through aerosol–photolysis interaction (API) and meteorological variables through aerosol–radiation feedback (ARF) to influence the formation of O3 (Yang et al., 2022). API can affect O3 directly by reducing the photochemical reactions that weaken the chemical contribution and reduce the surface O3 concentrations. ARF indirectly affects O3 concentrations by altering meteorological variables, e.g., by reducing the height of the planetary boundary layer. The suppressed planetary boundary layer can weaken the vertical mixing of O3 by turbulence and affect the concentration of O3 precursors. Hong et al. (2020) used WRF-CMAQ in conjunction with future emission scenarios to find that weakened ARF due to reduced aerosol concentration had either negative or positive impacts on the daily maximum 1 h average O3 concentration in eastern China from 2010 to 2050 due to the changed precursor level caused by the weakened ARF. Using WRF-CMAQ, Liu and Wang (2020b) reported that weakened API could increase the MDA8 O3 concentrations by 0.3 ppb in urban areas from 2013 to 2017. Zhu et al. (2021) used WRF-Chem to investigate the impact of weakened ARF on air pollutants over the NCP during COVID-19 lockdown and reported that the weakened ARF increased the O3 concentrations by 7.8 % due to the increased northwesterly and planetary boundary layer height caused by the weakened ARF. In general, previous studies mainly examined the impact of either weakened ARF or API; systematic analysis of the total and the respective impacts of changed API and/or ARF on O3 over eastern China in both summer and winter from 2013 to 2017 has not been conducted.
The objective of this paper is to examine the impacts of aerosol–radiation interaction (ARI), including the effects of aerosol–photolysis interaction (API) and aerosol–radiation feedback (ARF), on O3 concentrations over eastern China in both summer and winter using the online coupled WRF-Chem model, with the main focus on ARI, API, and ARF responses to clean air action. Process analysis is also applied to explore the prominent physical–chemical process responsible for the changed impacts of API and/or ARF on surface O3. This study is believed to provide insights into the role of weakened ARI in O3 levels over eastern China not only in summer but also in winter. In Sect. 2, we describe the model configuration, numerical experiments, observational data, and integrated process rate analysis. Model evaluation is presented in Sect. 3. Results and discussion are presented in Sect. 4. Conclusions are provided in Sect. 5.
2.1 Model configuration
The model used in this study is an online coupled meteorology–chemistry model, the Weather Research and Forecasting model coupled to Chemistry (WRF-Chem v3.7.1), which can simulate meteorological fields and concentrations of gases and aerosols simultaneously (Grell et al., 2005; Skamarock et al., 2008). Figure S1 in the Supplement shows the simulated domain that covers most regions of China with a horizontal resolution of 27 km and grid points of 167 (west–east) × 167 (south–north). The model contains 32 vertical levels extending from the surface to 50 hPa, with the first 16 layers located below 2 km to resolve fine boundary layer processes. The black line in Fig. S1 represents eastern China (22–41.5° N, 102–123° E), and four heavily polluted regions are also selected for analysis, including BTH (36.0–41.5° N, 113–119.5° E), YRD (29.5–32.5° N, 118–122° E), PRD (21–23.5° N, 112–116° E), and SCB (27.5–31.5° N, 102.5–107.5° E).
The National Center for Environmental Prediction (NCEP) Final (FNL) analysis dataset, with a spatial resolution of 1° × 1° and 6 h temporal resolution, is used to provide the meteorological initial and lateral boundary conditions. The chemical initial and boundary conditions for the WRF-Chem model are taken from the outputs of the Community Atmosphere Model with Chemistry (CAM-Chem).
The Carbon Bond Mechanism Z (CBM-Z) is applied as the gas-phase chemical mechanism (Zaveri and Peters, 1999), and the full eight-bin MOSAIC (Model for Simulating Aerosol Interactions and Chemistry) module with aqueous chemistry is used to simulate aerosol evolution (Zaveri et al., 2008). In the MOSAIC module, aerosols are assumed to be internally mixed into eight bins (0.039–0.078, 0.078–0.156, 0.156–0.312, 0.312–0.625, 0.625–1.25, 1.25–2.5, 2.5–5.0, and 5.0–10 µm), and each bin considers all major aerosol species, such as sulfate (SO), nitrate (NO), ammonium (NH), black carbon (BC), organic carbon (OC), and other inorganic mass. The impacts of aerosols on photolysis rates are calculated using the Fast-J scheme (Wild et al., 2000). The following physical parameterizations are used in WRF-Chem. The rapid radiative transfer model for general circulation models (RRTMG) is used to treat both shortwave and longwave radiation in the atmosphere (Iacono et al., 2008). The Purdue Lin microphysics scheme (Lin et al., 1983) and the Grell 3D ensemble scheme (Grell, 1993) are used to describe the cloud microphysical processes and cumulus convective processes. The Noah land surface scheme (Chen and Dudhia, 2001) and the Monin–Obukhov surface scheme (Foken, 2006) are used to simulate land–atmosphere interactions. The planetary boundary layer is characterized by the Yonsei University PBL scheme (Hong et al., 2006). The main physical and chemical schemes used in this study are summarized in Table S1 in the Supplement.
In this study, the Multi-resolution Emission Inventory model for Climate and air pollution research (MEIC; http://www.meicmodel.org/, last access: 21 March 2024) data from 2013 and 2017 are used as the anthropogenic emissions of particles and gases (Zheng et al., 2018). Biogenic emissions are calculated using the online Model of Emissions of Gases and Aerosols from Nature (MEGAN) developed by Guenther et al. (2006).
2.2 Numerical experiments
Seven sensitivity experiments were designed (Table 1). Here are the detailed descriptions.
- 1.
BASE_17E17M is the baseline experiment coupled with the interactions between aerosol and radiation, which include the impacts of API and ARF. Both the meteorological field and anthropogenic emissions are from 2017.
- 2.
BASE_13E13M is the same as BASE_17E17M, but the meteorological field and anthropogenic emissions are from 2013.
- 3.
NOAPI_17E17M is the same as BASE_17E17M, but the impact of API is not considered by turning off the aerosol effect in the photolysis module, following the method described in Yang et al. (2022).
- 4.
NOALL_17E17M is the same as BASE_17E17M, but neither the impact of API nor that of ARF is considered by setting the aerosol optical properties in the optical module to zero, following the method described in Yang et al. (2022).
- 5.
BASE_13E17M is the same as BASE_17E17M, but the anthropogenic emissions are from 2013.
- 6.
NOAPI_13E17M is the same as NOAPI_17E17M, but the anthropogenic emissions are from 2013.
- 7.
NOALL_13E17M is the same as NOALL_17E17M, but the anthropogenic emissions are from 2013.
Table 1Descriptions of model sensitivity experiments.
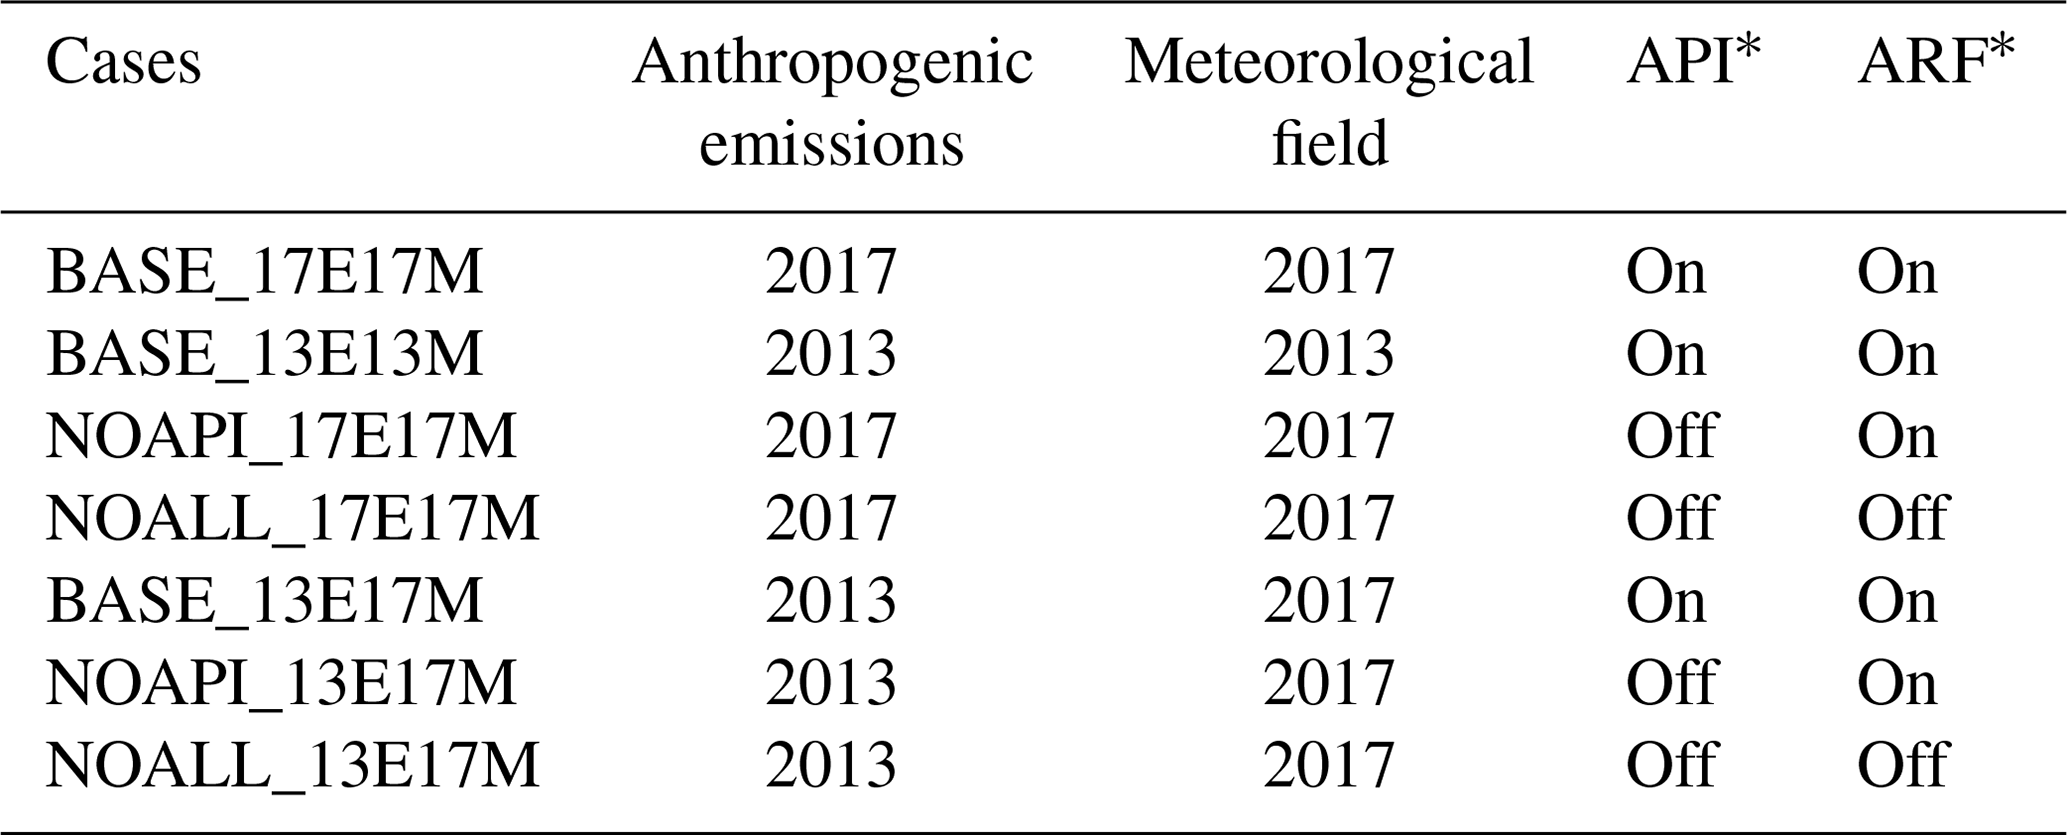
* API means aerosol–photolysis interaction; ARF means aerosol–radiation feedback.
Figure 1 presents the detailed schematic overview of designed numerical experiments. As shown in Fig. 1, the differences between BASE_17E17M and BASE_13E13M (BASE_17E17M minus BASE_13E13M) represent the changed O3 (ΔO3) due to variations in meteorology and anthropogenic emissions from 2013 to 2017. The differences between BASE_13E17M and BASE_13E13M (BASE_13E17M minus BASE_13E13M) show the impact of changed meteorological conditions on O3 (ΔO3_MET) from 2013 to 2017. The differences between BASE_17E17M and BASE_13E17M (BASE_17E17M minus BASE_13E17M) indicate the impact of anthropogenic emission reductions on O3 (ΔO3_EMI) from 2013 to 2017.
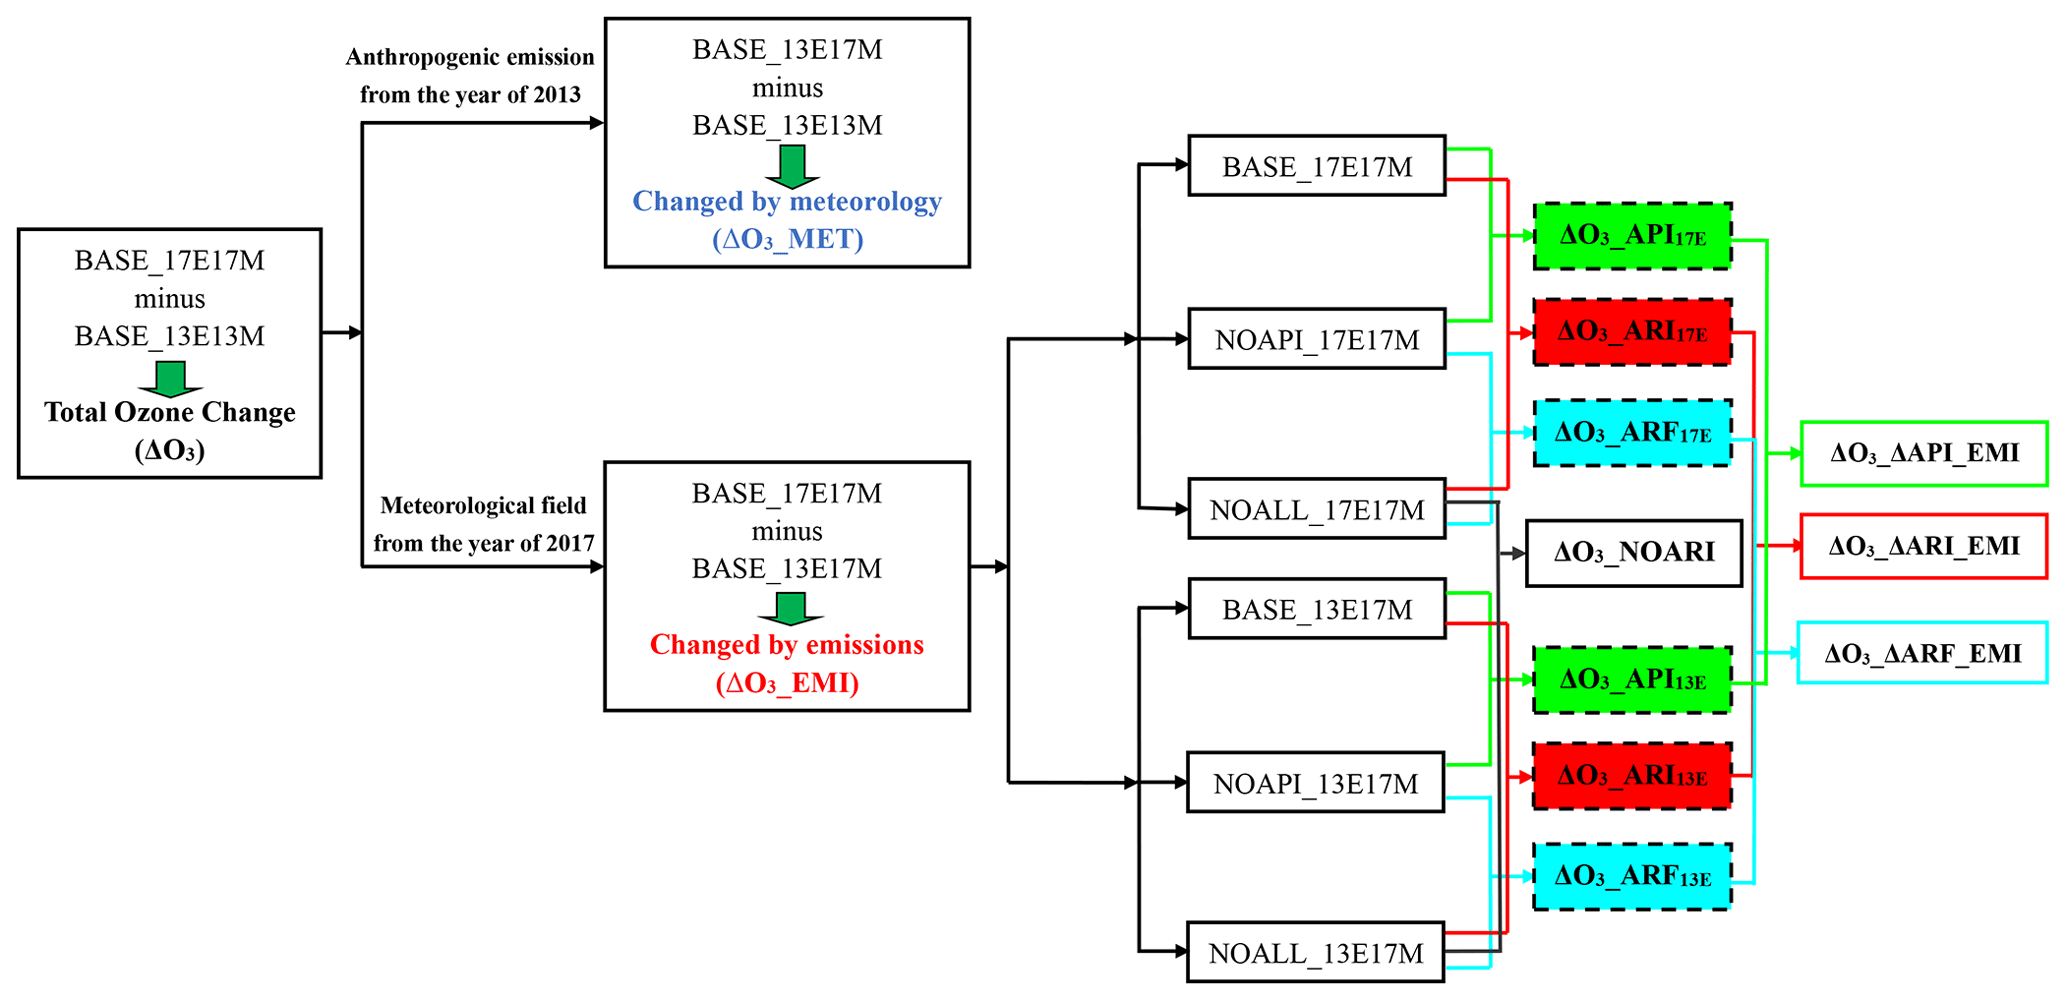
Figure 1Schematic overview of numerical experiments. The term 17E17M (13E13M) means that meteorological fields and anthropogenic emissions are from 2017 (2013). Similarly, 13E17M means anthropogenic emissions are from 2013 but meteorological fields are from 2017. ΔO3_MET, ΔO3_EMI, and ΔO3 mean the impacts of changed meteorological conditions, changed anthropogenic emissions, and their combined effects on O3, respectively. ΔO3_API17E(13E), ΔO3_ARF17E(13E), and ΔO3_ARI17E(13E) mean the impacts of aerosol–photolysis interaction, aerosol–radiation feedback, and aerosol–radiation interaction on O3 under the different emission conditions, respectively. ΔO3_NOARI means the changed O3 concentration due to reduced anthropogenic emissions without considering aerosol–radiation interaction. ΔO3_ΔAPI_EMI, ΔO3_ΔARF_EMI, and ΔO3_ΔARI_EMI represent the impacts of weakened aerosol–photolysis interaction, aerosol–radiation feedback, and aerosol–radiation interaction due to decreased anthropogenic emissions on O3 concentration, respectively.
The impacts of aerosol–radiation interaction (ARI) on O3 under different anthropogenic emission scenarios (i.e., strong anthropogenic emission levels in 2013 and weaker anthropogenic emission levels in 2017) can be analyzed as the differences between BASE_17E17M and NOALL_17E17M (BASE_17E17M minus NOALL_17E17M, denoted as ΔO3_ARI17E) and BASE_13E17M and NOALL_13E17M (BASE_13E17M minus NOALL_13E17M, denoted as ΔO3_ARI13E). The term ΔO3_ARI17E means that the impact of ARI on O3 under the conditions of both the meteorological field and anthropogenic emissions is from 2017, and ΔO3_ARI13E means the effect of ARI on O3 with the meteorological field used in 2017 and anthropogenic emissions applied in 2013. In order to quantify the impacts caused by the decreased anthropogenic emissions from 2013 to 2017, the impacts of changed meteorological variables should be removed by fixing the meteorological fields in 2017 using sensitivity experiments. Thus, the impact of weakened ARI due to decreased anthropogenic emissions from 2013 to 2017 on O3 (denoted as ΔO3_ΔARI_EMI) can be quantified using the differences between ΔO3_ARI17E and ΔO3_ARI13E. Similarly, the impacts of weakened API (denoted as ΔO3_ΔAPI_EMI) and ARF (denoted as ΔO3_ΔARF_EMI) due to decreased anthropogenic emissions on O3 can also be estimated using the differences between BASE_17E17M minus NOAPI_17E17M (denoted as ΔO3_API17E) and BASE_13E17M minus NOAPI_13E17M (denoted as ΔO3_API13E), as well as between NOAPI_17E17M minus NOALL_17E17M (denoted as ΔO3_ARF17E) and NOAPI_13E17M minus NOALL_13E17M (denoted as ΔO3_ARF13E). Detailed descriptions can be found in Fig. 1.
Simulation periods are integrated from 30 May to 30 June (denoted as summer) and 29 November to 31 December (denoted as winter) in both 2013 and 2017. To avoid potential deviations caused by long-term model integration, each simulation is re-initialized every 8 d, with the first 40 h as the model spin-up. The complete simulation includes five model cycles. Simulation results from the BASE_17E17M case during summer and winter are used to evaluate the model performance. If not otherwise specified, the time in this paper is the local time, and the synergetic impacts of ARF and API are equal to the impact of ARI (i.e., ARI = ARF + API).
2.3 Observational data
Meteorological observations of temperature (T2), relative humidity (RH2), wind speed (WS10), and wind direction (WD10) provided by the NOAA National Climatic Data Center (https://www.ncei.noaa.gov/, last access: 21 March 2024) were used to validate the meteorological performance of the model. In this study, 353 meteorological stations are selected, and the locations are shown as red dots in Fig. S1. Observed surface PM2.5, O3, and NO2 concentrations in eastern China are obtained from the China National Environmental Monitoring Centre, which can be downloaded from https://quotsoft.net/air/ (last access: 21 March 2024). To ensure the data quality, a single site with at least 500 actual observations during the simulated period was used for model evaluation. A total of 1296 sites, as shown in Fig. 2a, were obtained. Photolysis rates of nitrogen dioxide (NO2) (J[NO2]) measured at the Peking University site (39.99° N, 116.31° E) were also used to evaluate the model performance.
2.4 Integrated process rate analysis
Process analysis techniques, i.e., integrated process rate (IPR) analysis, can be used in grid-based Eulerian models (e.g., WRF-Chem) to obtain contributions of each physical–chemical process to variations in pollutant concentrations. Eulerian models utilize the numerical technique of operator splitting to resolve continuity equations for each species into several simple ordinary differential equations or partial differential equations that only contain the influence of one or two processes (Gipson, 1999).
In order to quantitatively elucidate individual contributions of physical and chemical processes to O3 concentration changes due to weakened ARI, the integrated process rate (IPR) methodology is applied in this study. IPR analysis is an advanced tool to evaluate the key process for O3 concentration variation (Shu et al., 2016; Zhu et al., 2021; Yang et al., 2022). In this study, the IPR analysis tracks the hourly (e.g., one time step) contribution to O3 concentration variation from four main processes: vertical mixing (VMIX), net chemical production (CHEM), horizontal advection (ADVH), and vertical advection (ADVZ). VMIX is initiated by a turbulent process and is closely related to PBL development, which influences O3 vertical gradients. CHEM represents the net O3 chemical production (chemical production minus chemical consumption). ADVH and ADVZ represent transport by wind. We define ADV as the sum of ADVH plus ADVZ.
Simulation results of BASE_17E17M are compared to the observations to evaluate the model performance before interpreting the impacts of aerosol–radiation interaction on surface-layer ozone concentration.
3.1 Evaluation for meteorology
Figure S2 shows the time series of observed and simulated T2, RH2, WS10, and WD10 averaged over the 353 meteorological stations in China during summer and winter in 2017. Statistical performance of simulated meteorological parameters compared to ground-based observations is shown in Table 2. Simulations track well with observed T2, with a correlation coefficient (R) of 0.99 and 0.92, but underestimate T2 with a mean bias (MB) of −1.0 and −2.0 K in summer and winter, respectively. Simulated RH2 agrees reasonably well with observations, with R of 0.97 and 0.87, and small normalized mean biases (NMBs) are found in summer and winter with values of 3.2 % and 3.5 %, respectively. WS10 is slightly overpredicted, with an MB of 1.6–2.1 m s−1. The R and root mean square error (RMSE) of WS10 are 0.77–0.82 and 1.6–2.1 m s−1. A large bias in wind speed could be partly caused by unresolved topographical features (Jimenez and Dudhia, 2012). The NMB of WD10 ranges from −3.9 % to −2.6 % and R ranges from 0.40 to 0.69. As shown in Fig. S3, the predicted J[NO2] matches the observations well, with R of 0.93–0.94 and NMB of 4.8 %–12.3 %. In general, the simulated meteorological variables agree fairly well with the observations.
Table 2Statistical parameters of the simulated 2 m temperature (T2, K), 2 m relative humidity (RH2, %), 10 m wind speed (WS10, m s−1), 10 m wind direction (WD10, °), photolysis rate of NO2 (J[NO2], 10−3 s−1), PM2.5 (µg m−3), O3 (ppb), and NO2 (ppb) versus observations during summer and winter in 2017. There are 1296 air pollutant monitoring stations and 353 meteorological stations.
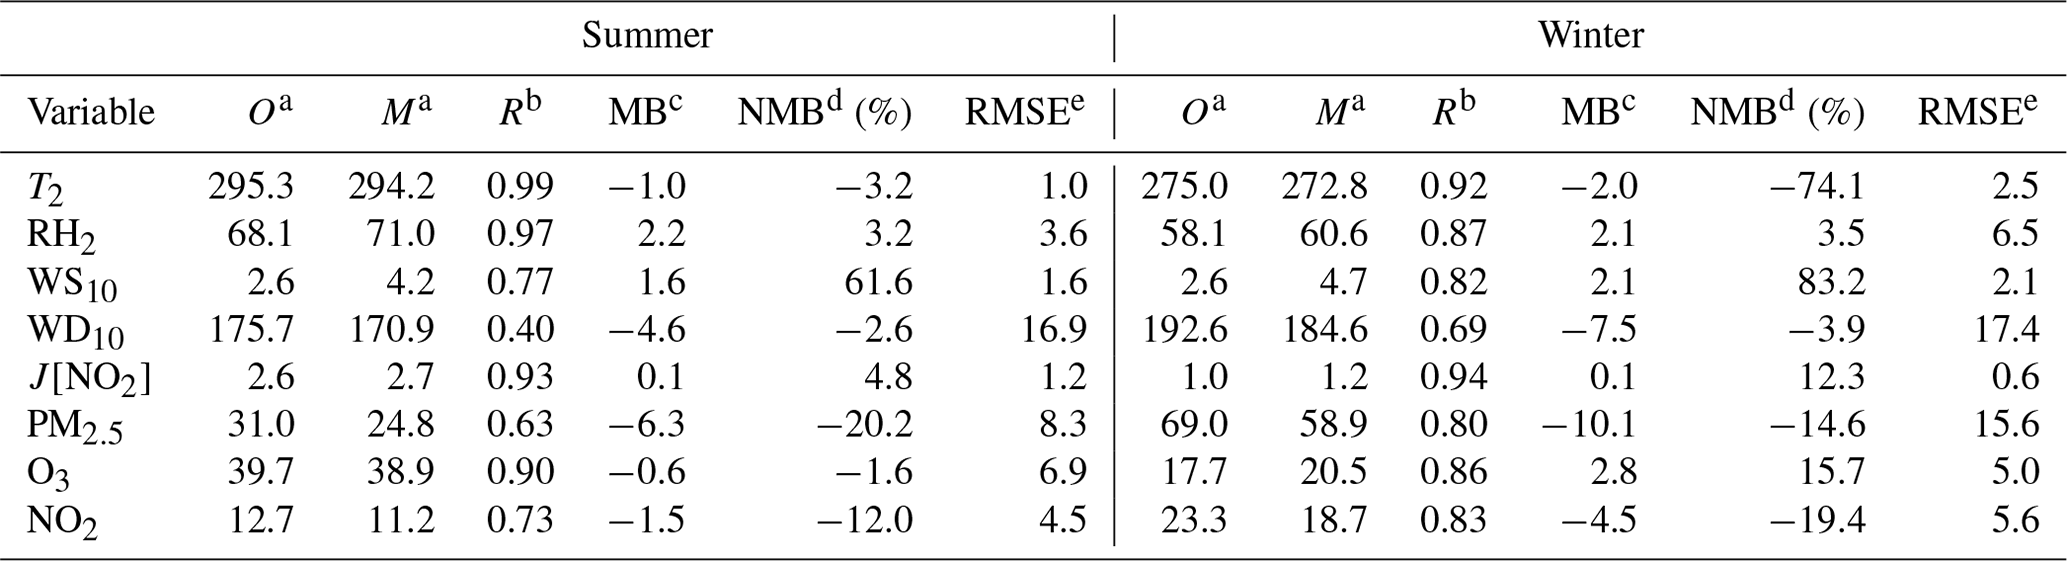
a O and M are the averages for observed and simulated results, respectively. , .
b R is the correlation coefficient between observations and model results. .
c MB is the mean bias between observations and model results. MB .
d NMB is the normalized mean bias between observations and model results. NMB .
e RMSE is the root mean square error in observations and model results. RMSE .
In the above Oi and Mi are the hourly observed data and simulated data, respectively, and n is the total number of hours.
3.2 Evaluation for air pollutants
Figure 2 shows the spatiotemporal variations in observed and simulated near-surface PM2.5, O3, and NO2 concentrations averaged over eastern China during summer and winter in 2017. As demonstrated in Fig. 2a1 and c1, the WRF-Chem model reproduces the spatial distribution of observed PM2.5 reasonably well, with high values over large city clusters. The predicted O3 concentrations can also reproduce the spatial variation in the observed concentrations (Fig. 2a2 and c2). NO2 is an important precursor of O3 and aerosol; thus a good performance for NO2 is necessary. From Fig. 2a3 and c3, the model can reproduce the spatial distribution of observed NO2 well. Although the distributions of simulated air pollutants are in good agreement with the observations, biases still exist, which may be due to the uncertainty in the emission inventories. Figure 2b1–b3 and d1–d3 show the temporal profiles of observed and simulated surface-layer air pollutants averaged over monitoring sites and the grid cell containing the monitoring site in eastern China. The statistical metrics are also shown in Table 2. As shown in Fig. 2b1 and d1, the model tracks well with the diurnal variation in PM2.5 over eastern China, with R of 0.63 and 0.80. However, the model slightly underestimates the concentrations of PM2.5, with MB of −6.3 and −10.1 µg m−3 in summer and winter, respectively. Simulated O3 agrees reasonably well with observations, with R of 0.90 and 0.86, and small MB is found in summer and winter with values of −0.6 and 2.8 ppb, respectively. The model tracks the daily variation in observed NO2 reasonably well, with R of 0.73 and 0.83. However, the model slightly underestimates the NO2 versus measurements, with MB of −1.5 and −4.5 ppb in summer and winter, respectively. In general, the WRF-Chem model can reproduce the features of observed meteorology and air pollutants well over eastern China.
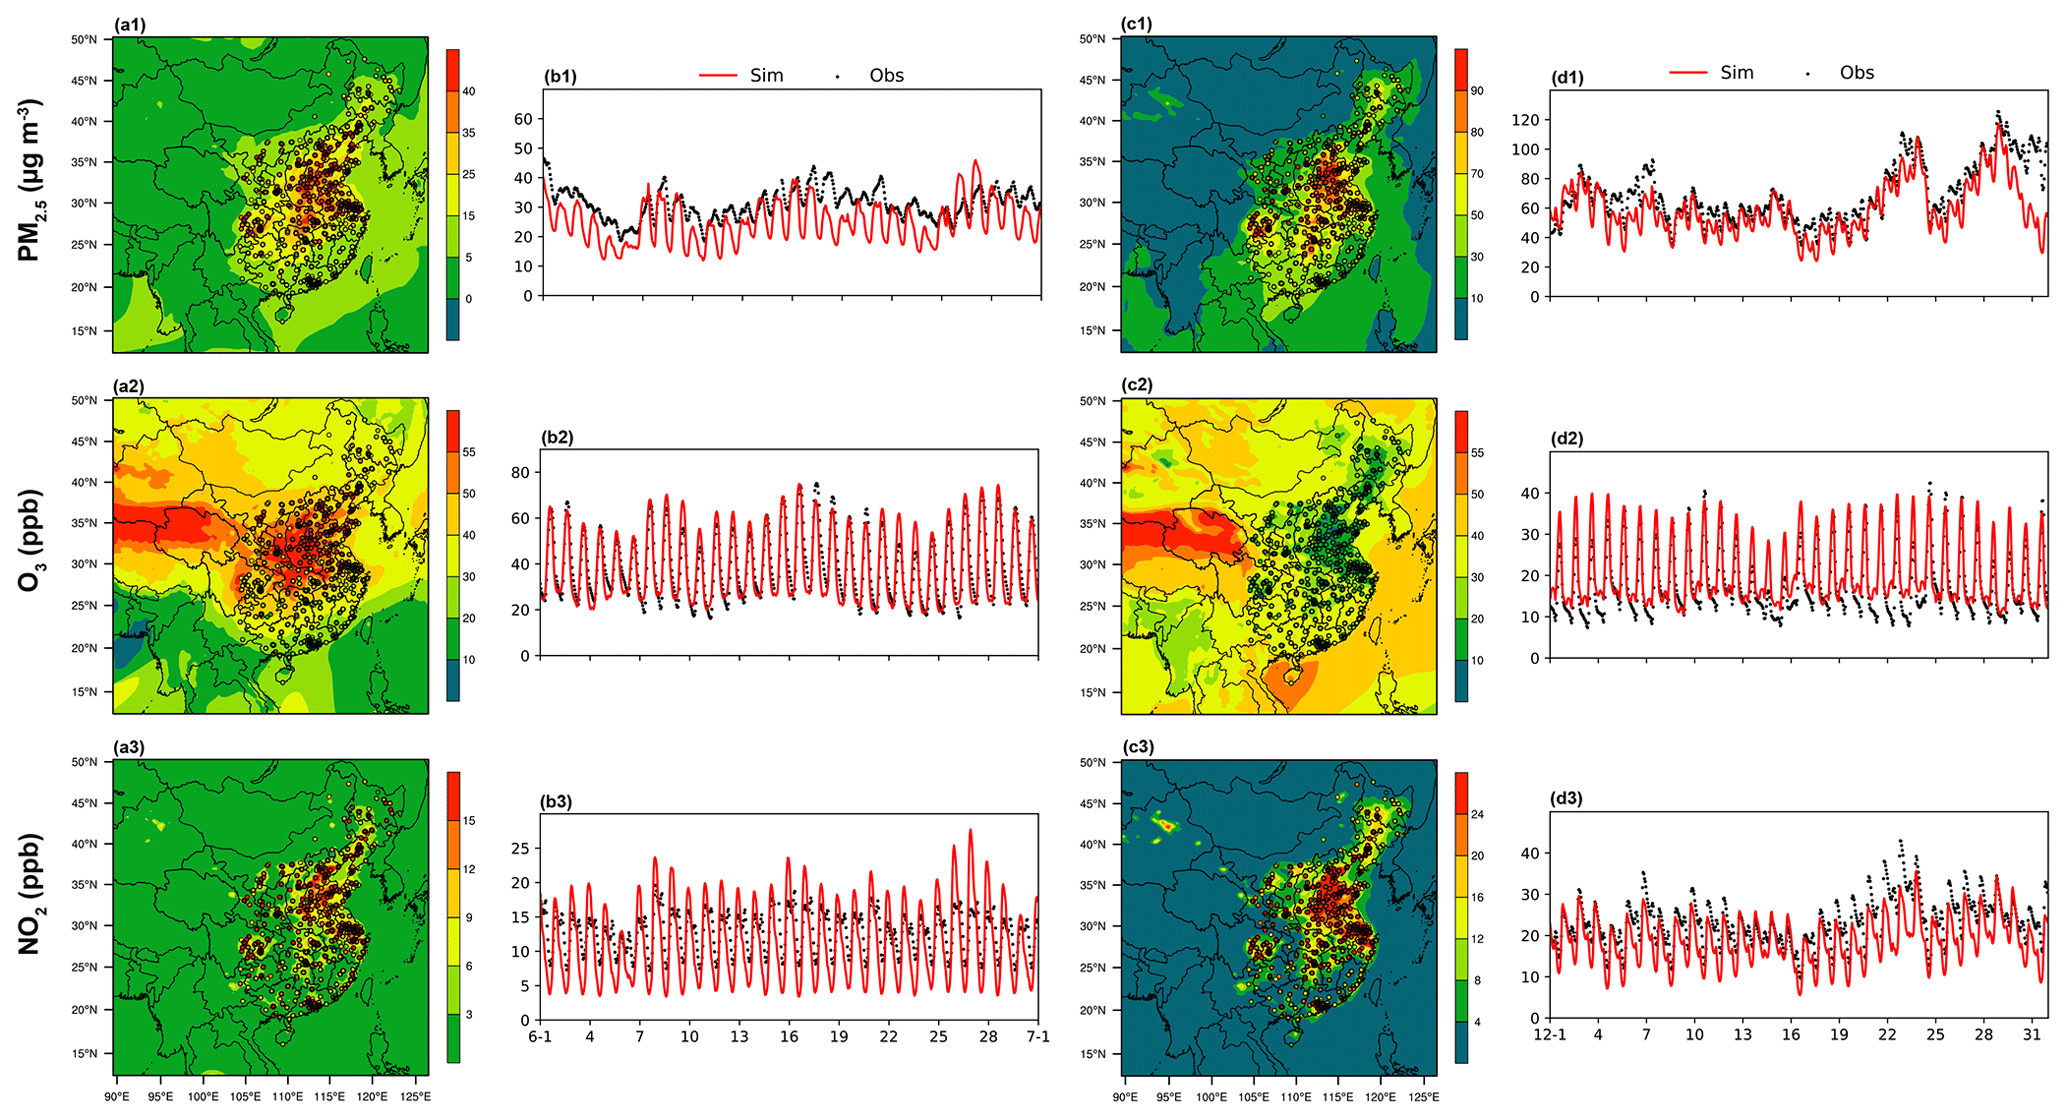
Figure 2Spatial distributions of observed (circle) and simulated (colored) PM2.5, O3, and NO2 concentrations averaged over (a1–a3) summer and (c1–c3) winter in 2017. Time series of observed (black dots) and simulated (red lines) hourly PM2.5, O3, and NO2 concentrations averaged over all the observation sites in eastern China during (b1–b3) summer and (d1–d3) winter in 2017.
3.3 Evaluation for changes in air pollutants from 2013 to 2017
Figure 3 demonstrates the spatial distribution of changed summer (left) and winter (right) surface PM2.5 (panels a, b) and MDA8 O3 (panels c, d) from 2013 to 2017. As shown in Fig. 3a and b, the observed concentrations of PM2.5 in eastern China are significantly reduced in both summer (−16.2 µg m−3) and winter (−56.0 µg m−3), and these changes can be captured by the model well (−14.3 µg m−3 for summer and −49.8 µg m−3 for winter). Therefore, the model can reproduce the observed decrease in PM2.5 levels from 2013 to 2017. As shown in Fig. 3c and d, the model reproduces the seasonal patterns of changed surface MDA8 O3 reasonably well over eastern China during summer and winter from 2013 to 2017. In summer, both the observations and simulations showed the increased (decreased) MDA8 O3 in YRD (PRD and SCB), while the model could not simulate the positive changes in MDA8 O3 over BTH; the potential reason may be that this study did not consider the effect of changes in heterogeneous aerosol reactions. Li et al. (2019) found that the weakened uptake of HO2 on aerosol surfaces was the main reason for the O3 increase over BTH. In contrast to the changes in summer, observed MDA8 O3 in winter generally increased over eastern China, which can be reproduced well by the model.
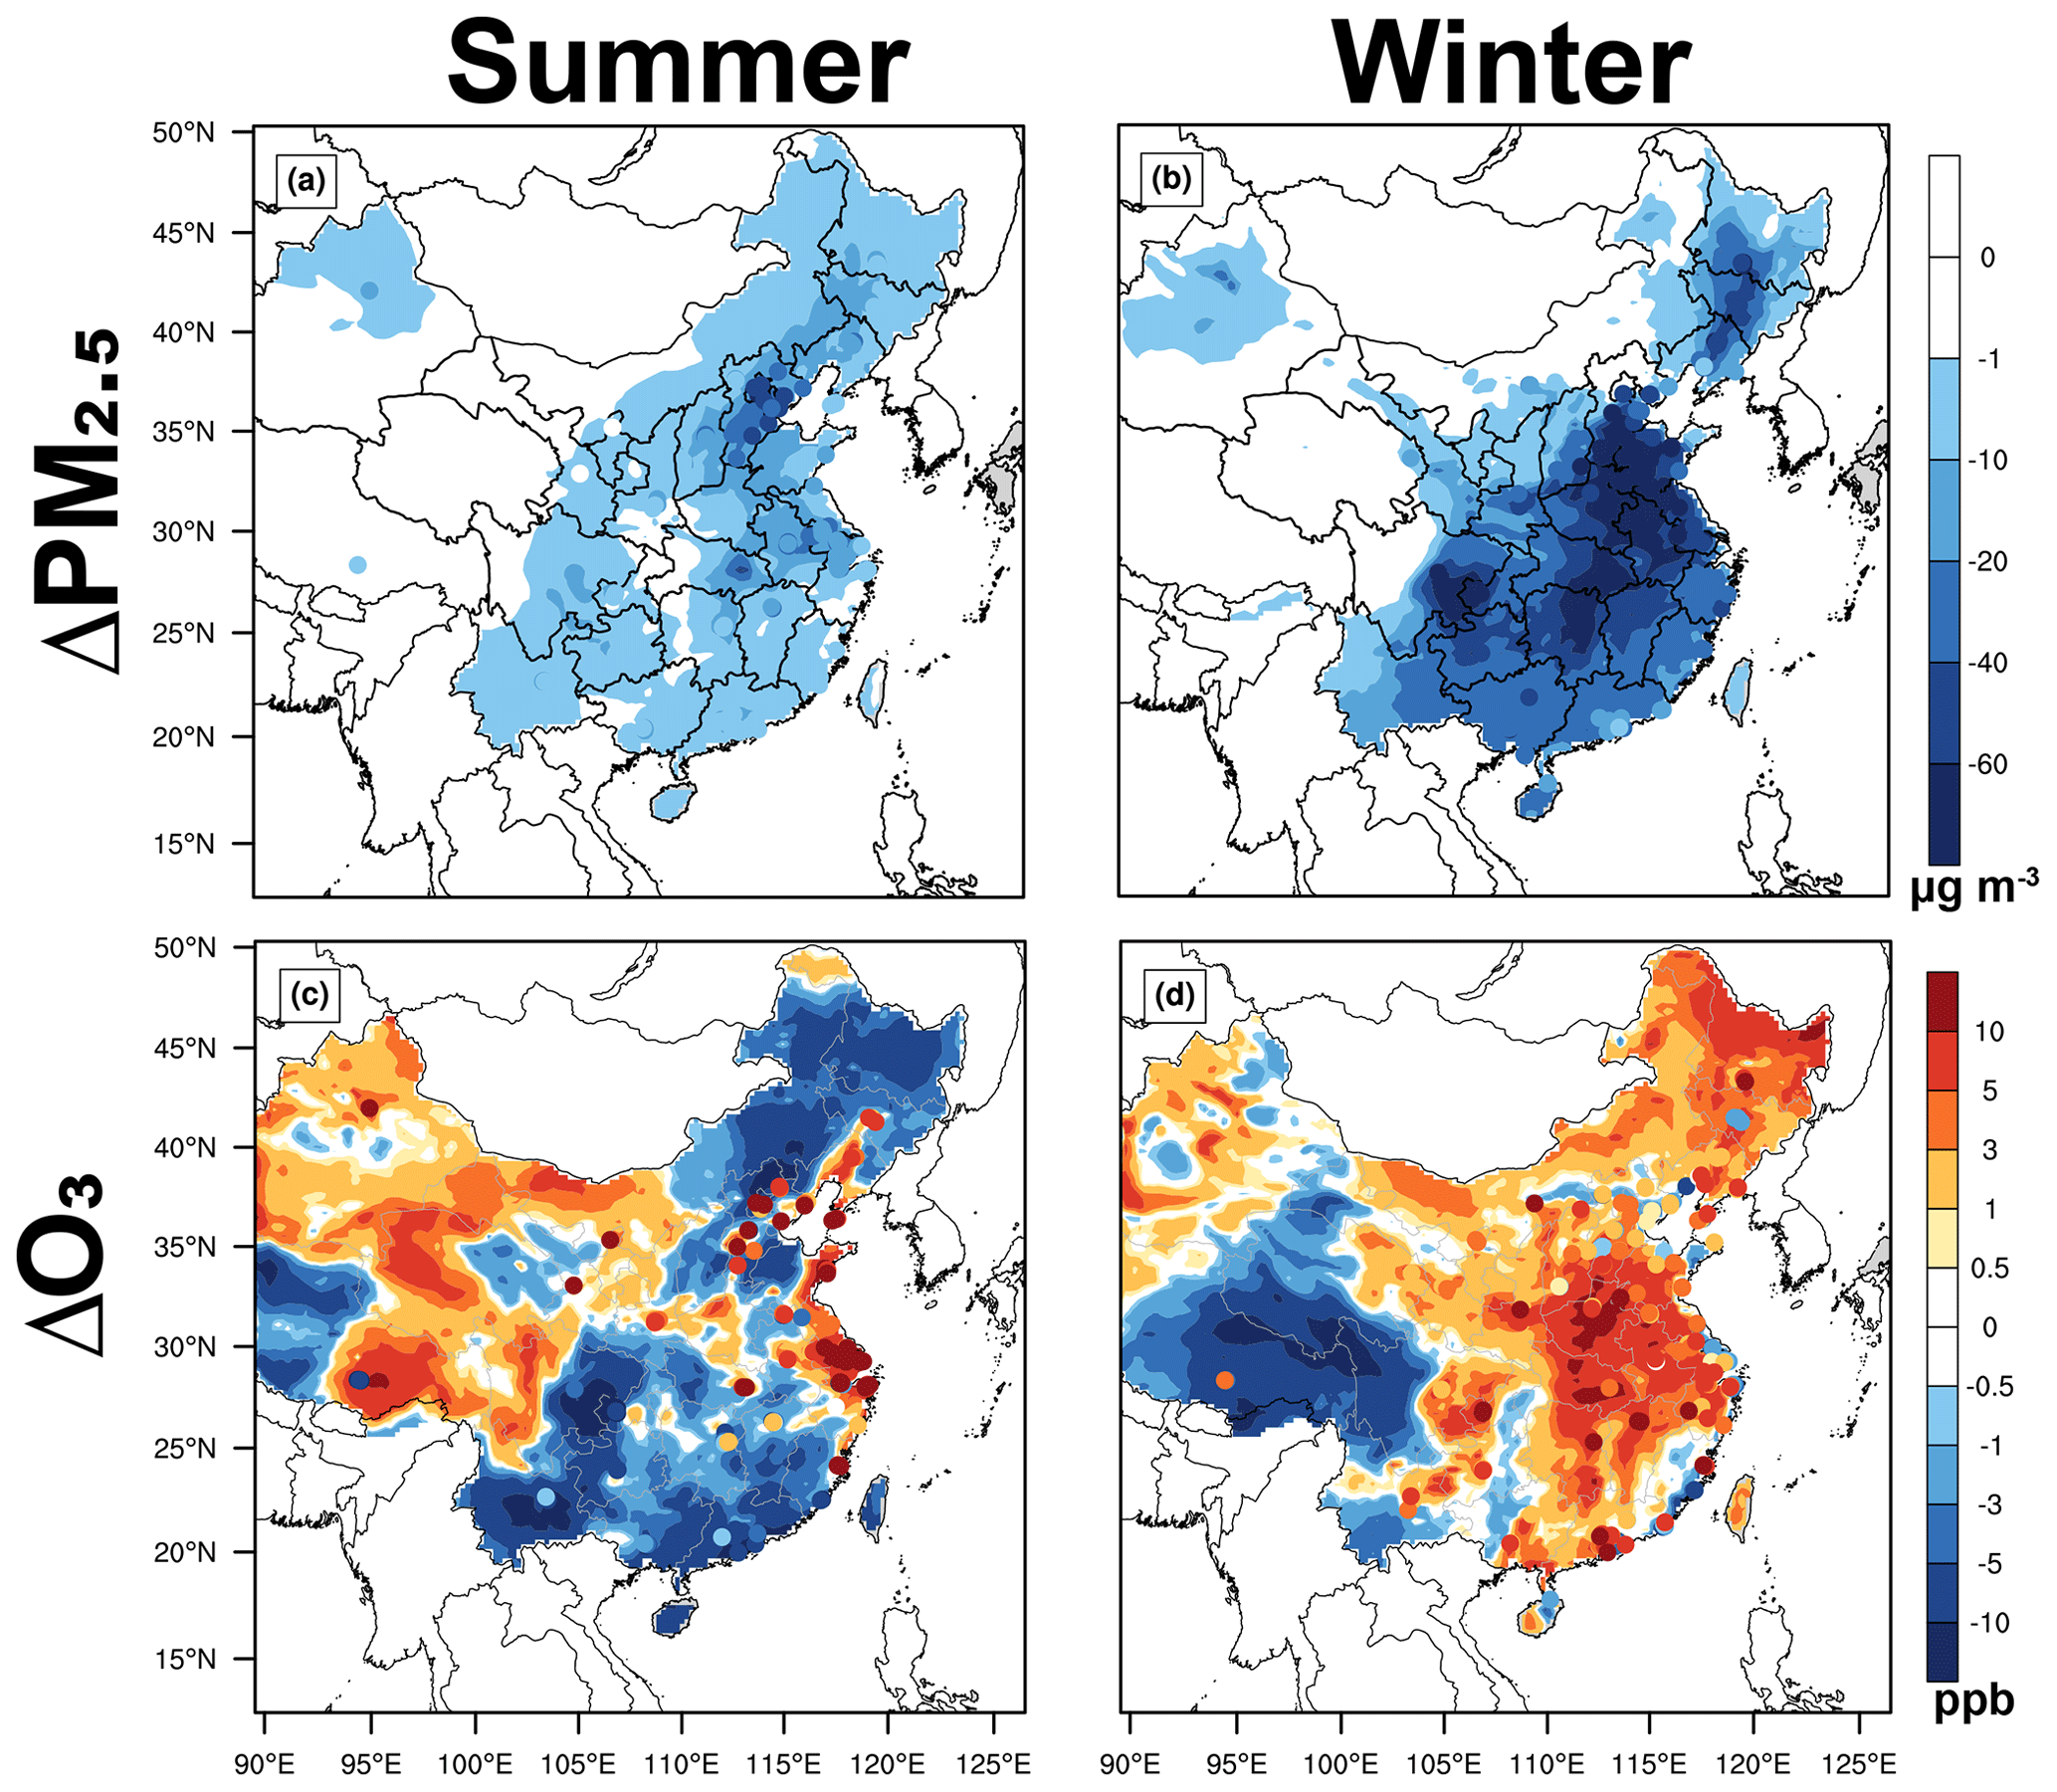
Figure 3Spatial distribution of changed summer (a, c) and winter (b, d) surface (a, b) PM2.5 and (c, d) MDA8 O3 from 2013 to 2017. Observed changes in surface PM2.5 MDA8 O3 are also marked with colored circles.
4.1 Impacts of changed meteorology and anthropogenic emissions on O3
The strategy of the clean air action decreased the anthropogenic emission of NOx, but the changes in anthropogenic VOC emissions were non-obvious (Fig. S4), which might influence the sensitive O3 formation regime and the O3 concentration. Figure 4 shows the spatial distributions of changed summer and winter MDA8 O3 concentrations from 2013 to 2017 due to changed anthropogenic emissions alone and due to changed meteorological conditions alone. As shown in Fig. 4a, the concentration of summer MDA8 O3 from 2013 to 2017 increased in city clusters but decreased in rural regions. This discrepancy might be explained by the ozone formation regimes in urban areas typically being VOC-limited, while rural areas are typically NOx-limited during summer (Li et al., 2019; Wang et al., 2019). Contrary to the phenomenon in summer, decreased anthropogenic emissions lead to a uniform increase in winter MDA8 O3 over the whole of eastern China (Fig. 4c). These different spatial variation characteristics in summer and winter may be explained by the different ozone formation regimes in winter (VOC-limited) and summer (NOx-limited) (Fig. S5; Jin and Holloway, 2015). From Fig. 4b and d, the impacts of changed meteorological conditions on MDA8 O3 varied by region, ranging from −24.9 (−14.0) to 17.0 (7.3) ppb in summer (winter). Focusing on the four developed city clusters, compared to 2013, the meteorological conditions in the summer of 2017 promoted the generation of O3 in the YRD region (Fig. 8a3) but suppressed the generation of O3 in the BTH (Fig. 8a2), PRD (Fig. 8a4), and SCB (Fig. 8a5) regions. In PRD and SCB, the changes in MDA8 O3 due to meteorology have an even greater impact than those due to emission changes, which highlights the significant role of meteorology in summer O3 variations.
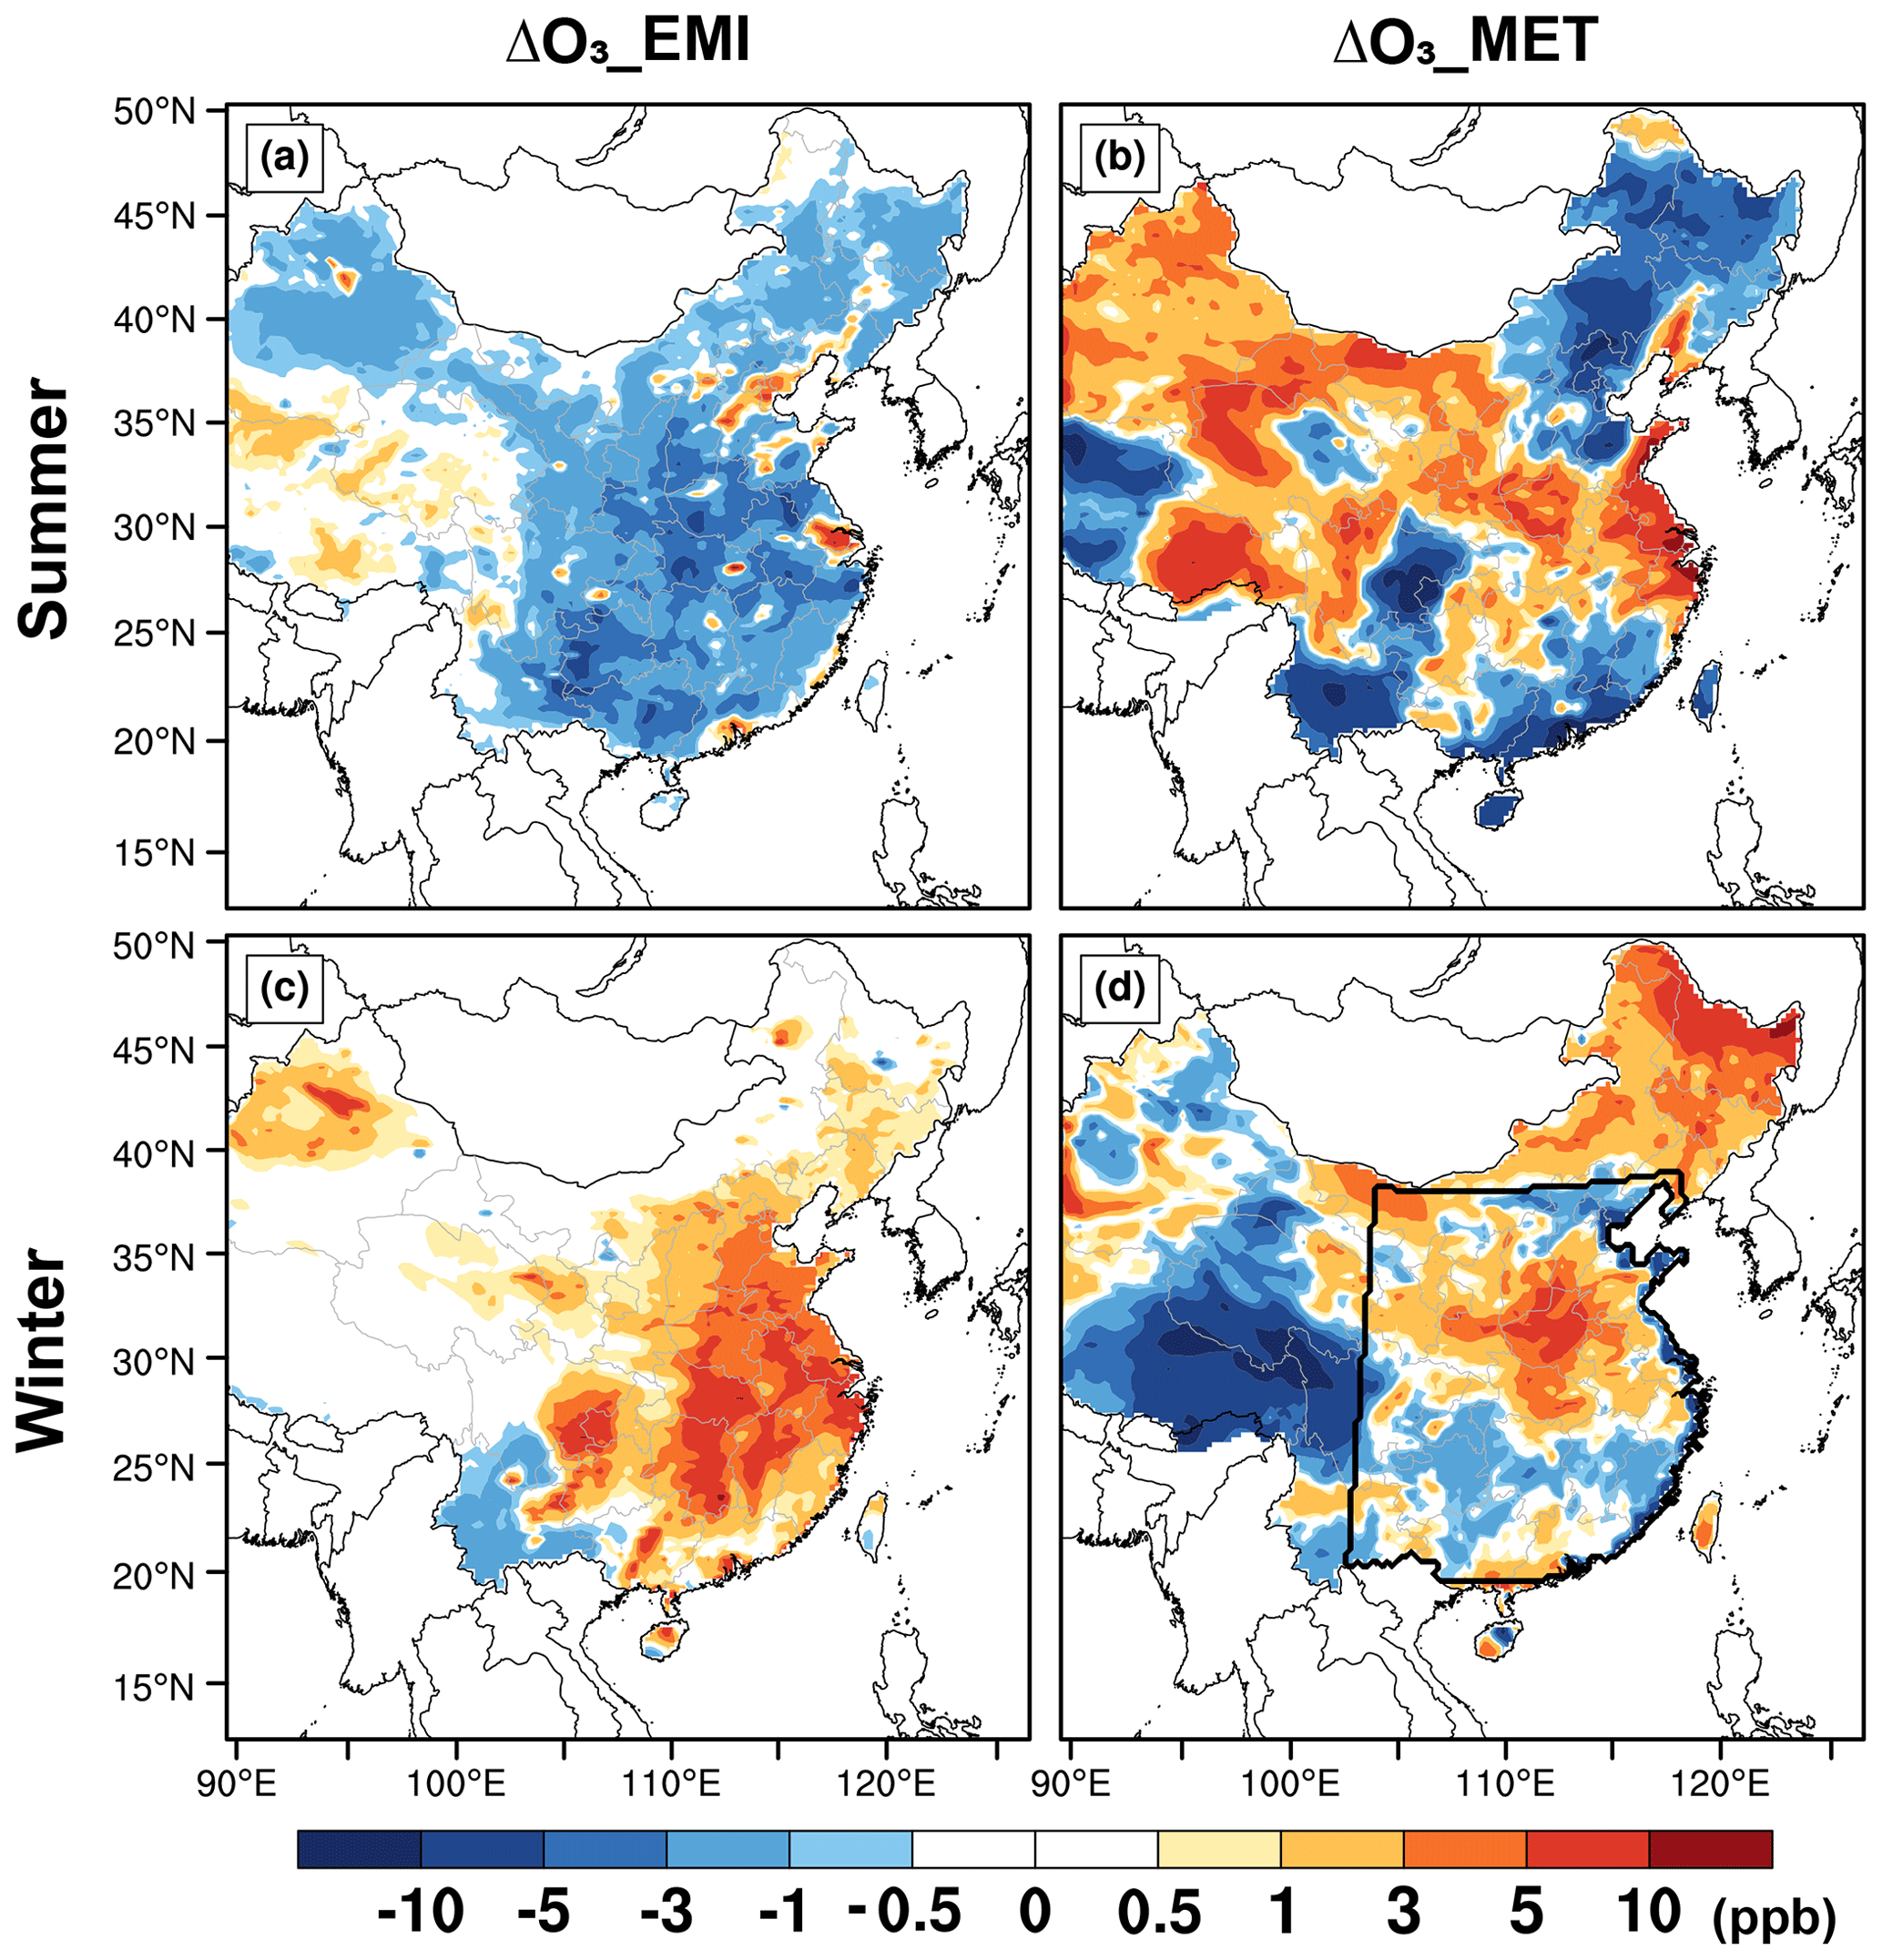
Figure 4Spatial distribution of changed summer (a, b) and winter (c, d) surface-layer MDA8 O3 from 2013 to 2017 due to (a, c) changed anthropogenic emissions alone and (b, d) changed meteorological fields alone. The thick black line in panel (d) represents eastern China.
4.2 Impacts of weakened aerosol–radiation interaction on O3
Figures S6a (S7a) and S6b (S7b) present the spatial distribution of the impacts of ARF, API, and ARI on surface MDA8 O3 concentrations in summer (winter) under different anthropogenic emission conditions in 2017 and 2013. As shown in Fig. S6, summer MDA8 O3 is significantly reduced over eastern China: ARF, API, and ARI decrease the surface MDA8 O3 concentrations by 0.23 (0.59), 1.09 (1.54), and 1.32 (2.13) ppb, respectively, under low (high) anthropogenic emission conditions in 2017 (2013). The changes in MDA8 O3 concentrations due to aerosol–radiation interaction under low emission conditions are weaker than those under high emission conditions. This is because the concentration of aerosols in 2013 was higher than that in 2017, and thus its impact on meteorological conditions and J[NO2] was greater (Fig. S8). As shown in Fig. S7a, 2017 winter MDA8 O3 concentrations were decreased by ARF, API, and ARI by 0.38 ppb (−0.9 %), 1.59 ppb (−4.1 %), and 1.96 ppb (−5.1 %), respectively. Compared to the impacts under relatively high anthropogenic emission conditions in 2013, the reduction in surface MDA8 O3 concentrations caused by ARF, API, and ARI is also greater, with values of 0.62 ppb (−1.6 %), 1.98 ppb (−5.4 %), and 2.59 ppb (−7.1 %), respectively. Both API and ARF reduce O3 concentrations, and the reduction in O3 caused by API is greater than that caused by ARF in both summer and winter.
Further, the significant reduction in PM2.5 due to the clean air action (Fig. S9) led to an increase in O3 concentrations as there were weakened effects of aerosols on O3. Therefore, this study further quantifies the effects of ΔO3_ΔARF_EMI, ΔO3_ΔAPI_EMI, and ΔO3_ΔARI_EMI (ΔO3_ΔARI_EMI =ΔO3_ΔARF_EMI + ΔO3_ΔAPI_EMI) on O3 air quality. As shown in Fig. 5a1–a3, the surface MDA8 O3 in summer increased over most of eastern China due to ΔO3_ΔARF_EMI, ΔO3_ΔAPI_EMI, and ΔO3_ΔARI_EMI. The largest increases in MDA8 O3 concentrations due to ΔO3_ΔARF_EMI and ΔO3_ΔAPI_EMI were found in the four developed city clusters, with increases larger than 4 ppb. Overall, ΔO3_ΔARF_EMI, ΔO3_ΔAPI_EMI, and ΔO3_ΔARI_EMI led to increases in surface MDA8 O3 by 0.36, 0.45, and 0.81 ppb, respectively, averaged over eastern China during summer. As shown in Fig. 5b1–b3, the ΔO3_ΔARF_EMI, ΔO3_ΔAPI_EMI, and ΔO3_ΔARI_EMI can also cause an increase of 0.24, 0.39, and 0.63 ppb, respectively, in winter MDA8 O3 concentrations. In general, weakened aerosol–radiation interaction due to reduced anthropogenic emissions from 2013 to 2017 can exacerbate ozone pollution in both summer and winter.
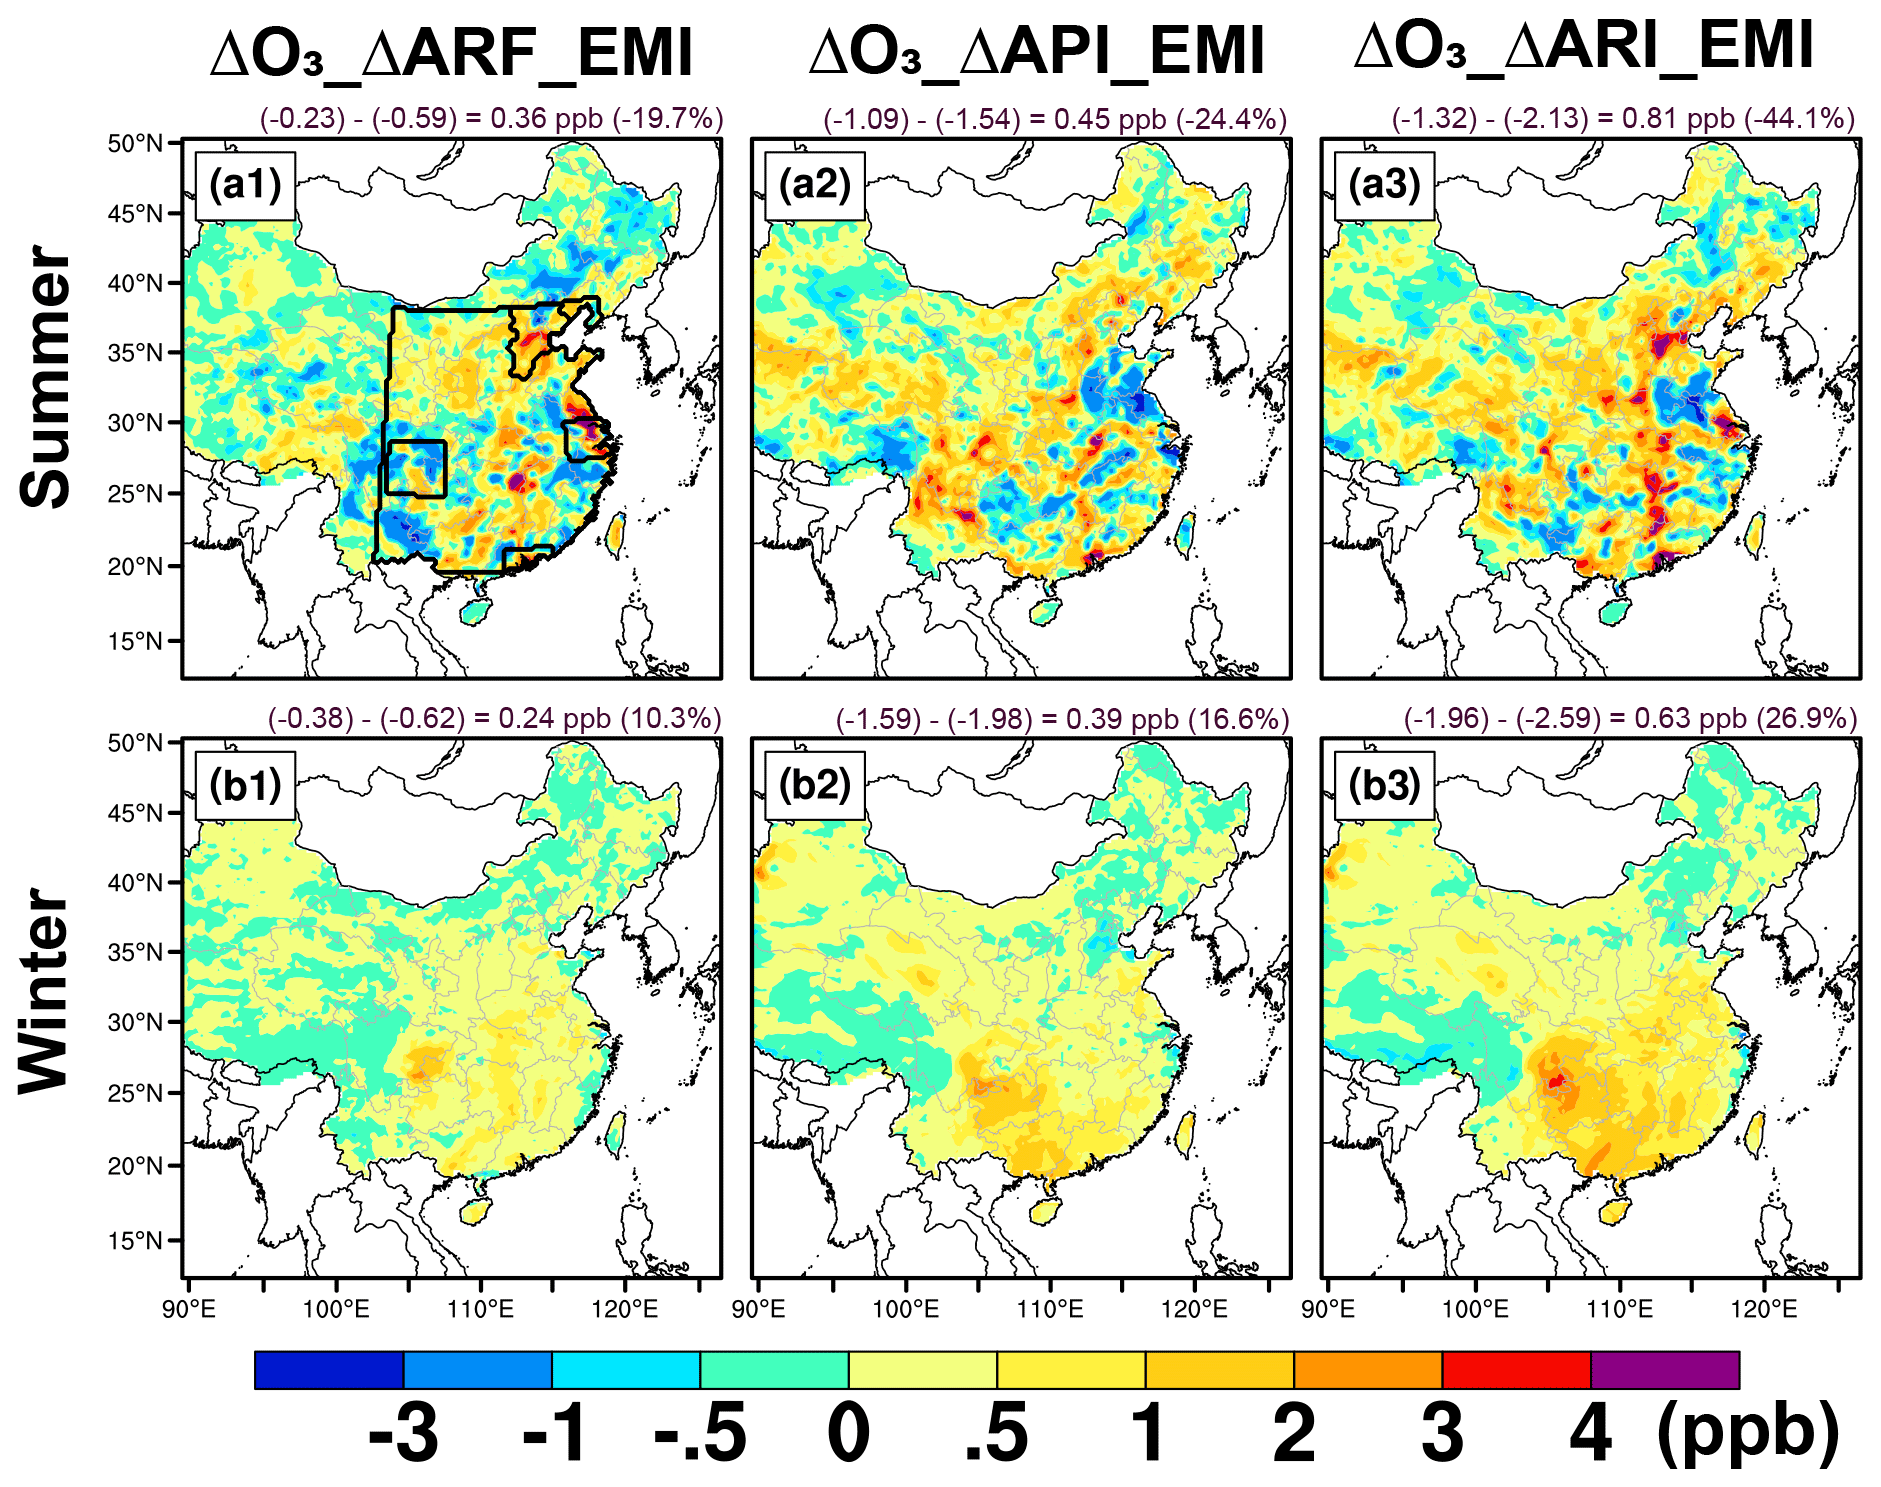
Figure 5Impacts of ΔO3_ΔARF_EMI, ΔO3_ΔAPI_EMI, and ΔO3_ΔARI_EMI on summer (a1, a2, a3) and winter (b1, b2, b3) surface-layer MDA8 O3 concentrations. The thick black lines in (a1) represent eastern China and the four developed city clusters. The mean changes over eastern China are also shown at the top of each panel. Detailed information about ΔO3_ΔARF_EMI, ΔO3_ΔAPI_EMI, and ΔO3_ΔARI_EMI can be found in Fig. 1.
In order to explore the mechanism of the impacts of ΔO3_ΔARI_EMI on MDA8 O3, we resolve the changed O3 into the contributions from chemical and physical processes. Figure 6 presents the accumulated changes in O3 and each process contribution by ΔO3_ΔAPI_EMI, ΔO3_ΔARF_EMI, and ΔO3_ΔARI_EMI from 09:00 to 16:00 LST during summer and winter. As shown in Fig. 6, enhanced chemical production is the dominant process leading to the increase in O3 concentrations over eastern China and the four city clusters in both summer and winter. The leading factor of enhancement in O3 over BTH is inconsistent with that over eastern China, and the enhancement of O3 concentration over BTH is mainly due to ΔO3_ΔARF_EMI. But the leading factor of enhancement in O3 over SCB is consistent with that over eastern China; the enhancement of O3 concentration is mainly due to ΔO3_ΔAPI_EMI in both summer and winter. Moreover, the enhancement of O3 concentration in BTH, YRD, and PRD is mainly due to ΔO3_ΔARF_EMI during winter, which is opposite to that of eastern China. The leading factors for the increase in O3 concentration in different city clusters are different. The enhancement of O3 concentration in most areas was caused by ΔO3_ΔAPI_EMI, whereas the increase in O3 concentration in the BTH, YRD, and PRD areas is dominated by ΔO3_ΔARF_EMI in winter. In general, the weakened aerosol–radiation interaction caused by emission reduction promotes the chemical production of O3 and increases the O3 concentrations over eastern China in summer and winter.
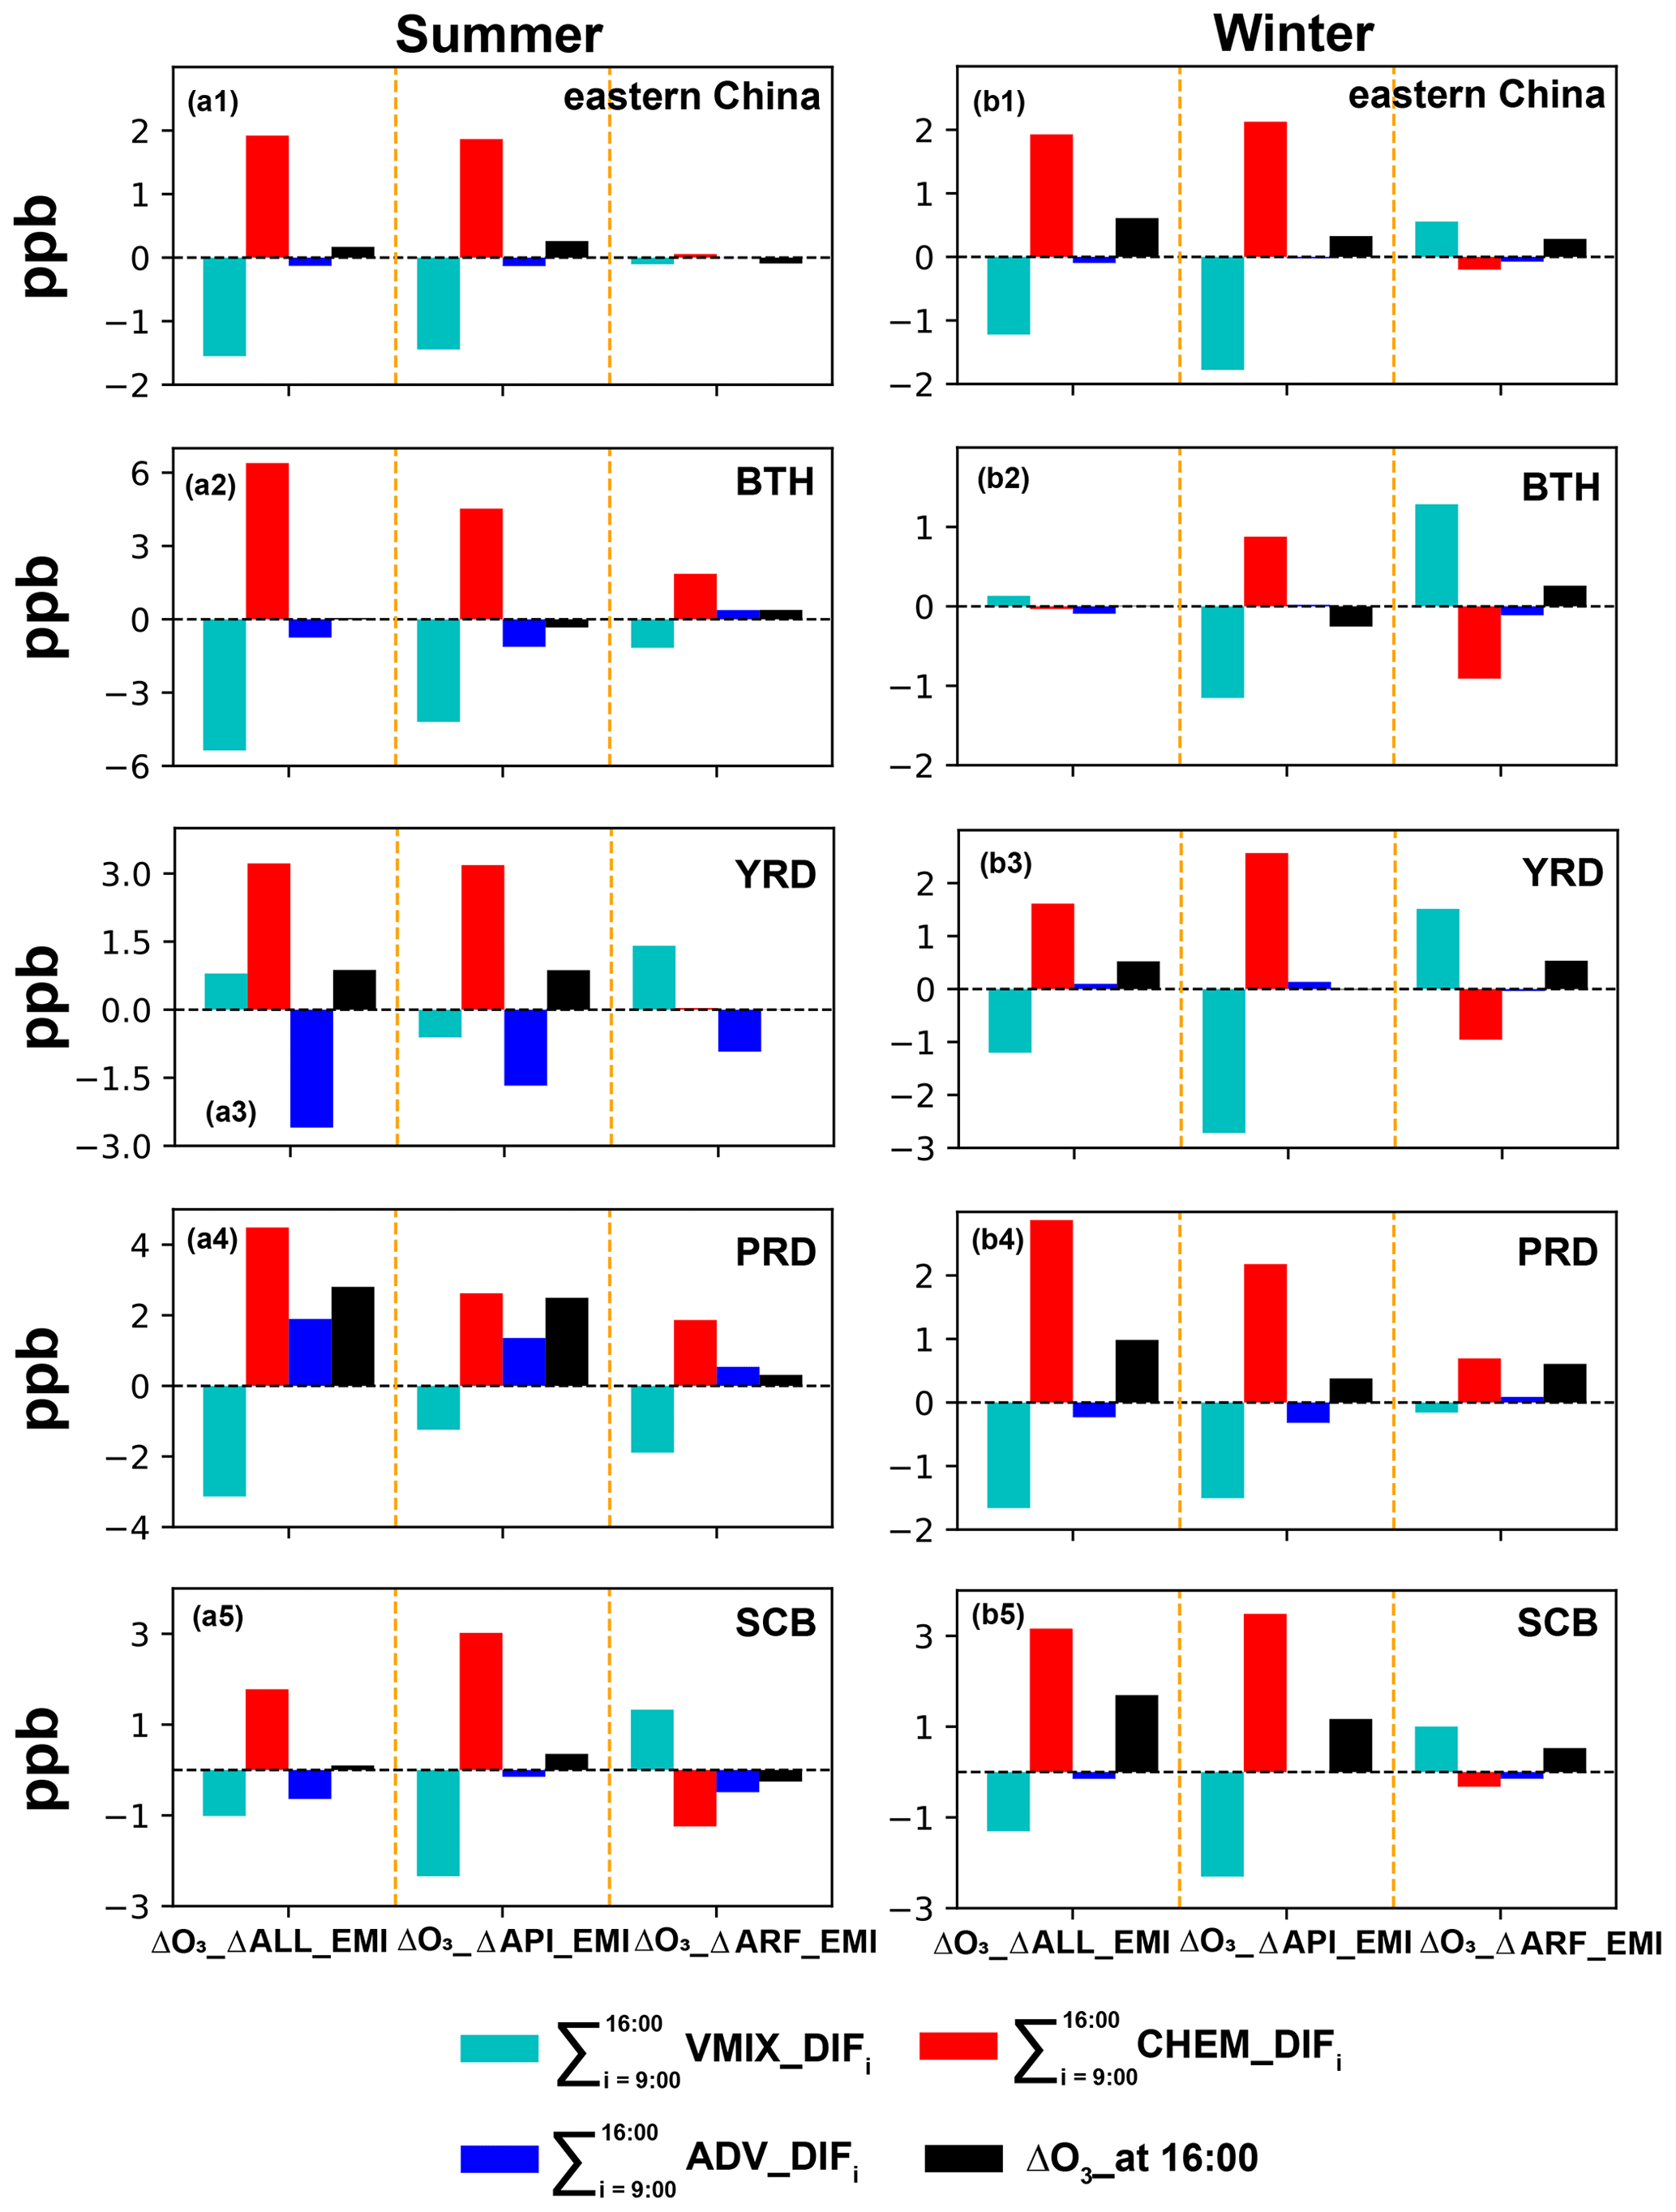
Figure 6Accumulated changes in each process from 09:00 to 16:00 LST and the changed O3 concentrations due to ΔO3_ΔARI_EMI in summer (a1–a5) and winter (b1–b5). The location, i.e., eastern China, Beijing–Tianjin–Hebei (BTH), the Yangtze River Delta (YRD), the Pearl River Delta (PRD), and the Sichuan Basin (SCB), is indicated on the upper right side of each panel.
In order to explore the reason for the increase in O3 chemical production, we further analyzed the variation in HOx (HO + HO2) concentration from 2013 to 2017. As the aerosol concentration decreases, its influence on solar radiation is weakened and photolysis is enhanced, leading to an increase in HOx levels. It can be seen from Fig. S10 that the concentration of HOx increases in both winter and summer. The increase in HOx promotes the conversion of NO to NO2, which leads to the accumulation of O3 concentration.
Figure 7 shows the changed summer and winter surface-layer MDA8 O3 concentrations caused by anthropogenic emission reduction from 2013 to 2017 with (ΔO3_EMI) and without (ΔO3_NOARI) ARI, including the effects of weakened ARI on the effectiveness of emission reduction for O3 air quality (ΔO3_ΔARI_EMI, which is also equal to ΔO3_EMI minus ΔO3_NOARI). As shown in Fig. 7a1 and b1, the surface-layer MDA8 O3 concentrations increased mainly in urban areas during summer and increased uniformly in winter due to anthropogenic emission reduction from 2013 to 2017 without the impact of ARI. When the effect of ARI is considered, the concentrations of MDA8 O3 increased more than when ARI was not taken into account (Fig. 7a2 and b2). The consequences of weakened ARI as a result of anthropogenic emission reduction on MDA8 O3 concentrations are shown in Fig. 7a3 and b3. From Fig. 7a3 and b3 we can see that the concentrations of MDA8 O3 increased in both summer and winter over eastern China. Therefore, ΔO3_ΔARI_EMI creates the superimposed impact on the effectiveness of anthropogenic emission reduction for the increased MDA8 O3 concentrations from 2013 to 2017 over eastern China. However, during summer, the worsened O3 air quality due to weakened ARI can only be found in scattered city clusters (e.g., BTH, YRD, and PRD in Fig. 7a3). During winter, it caused increased MDA8 O3 concentrations over nearly the whole of eastern China (Fig. 7b3).
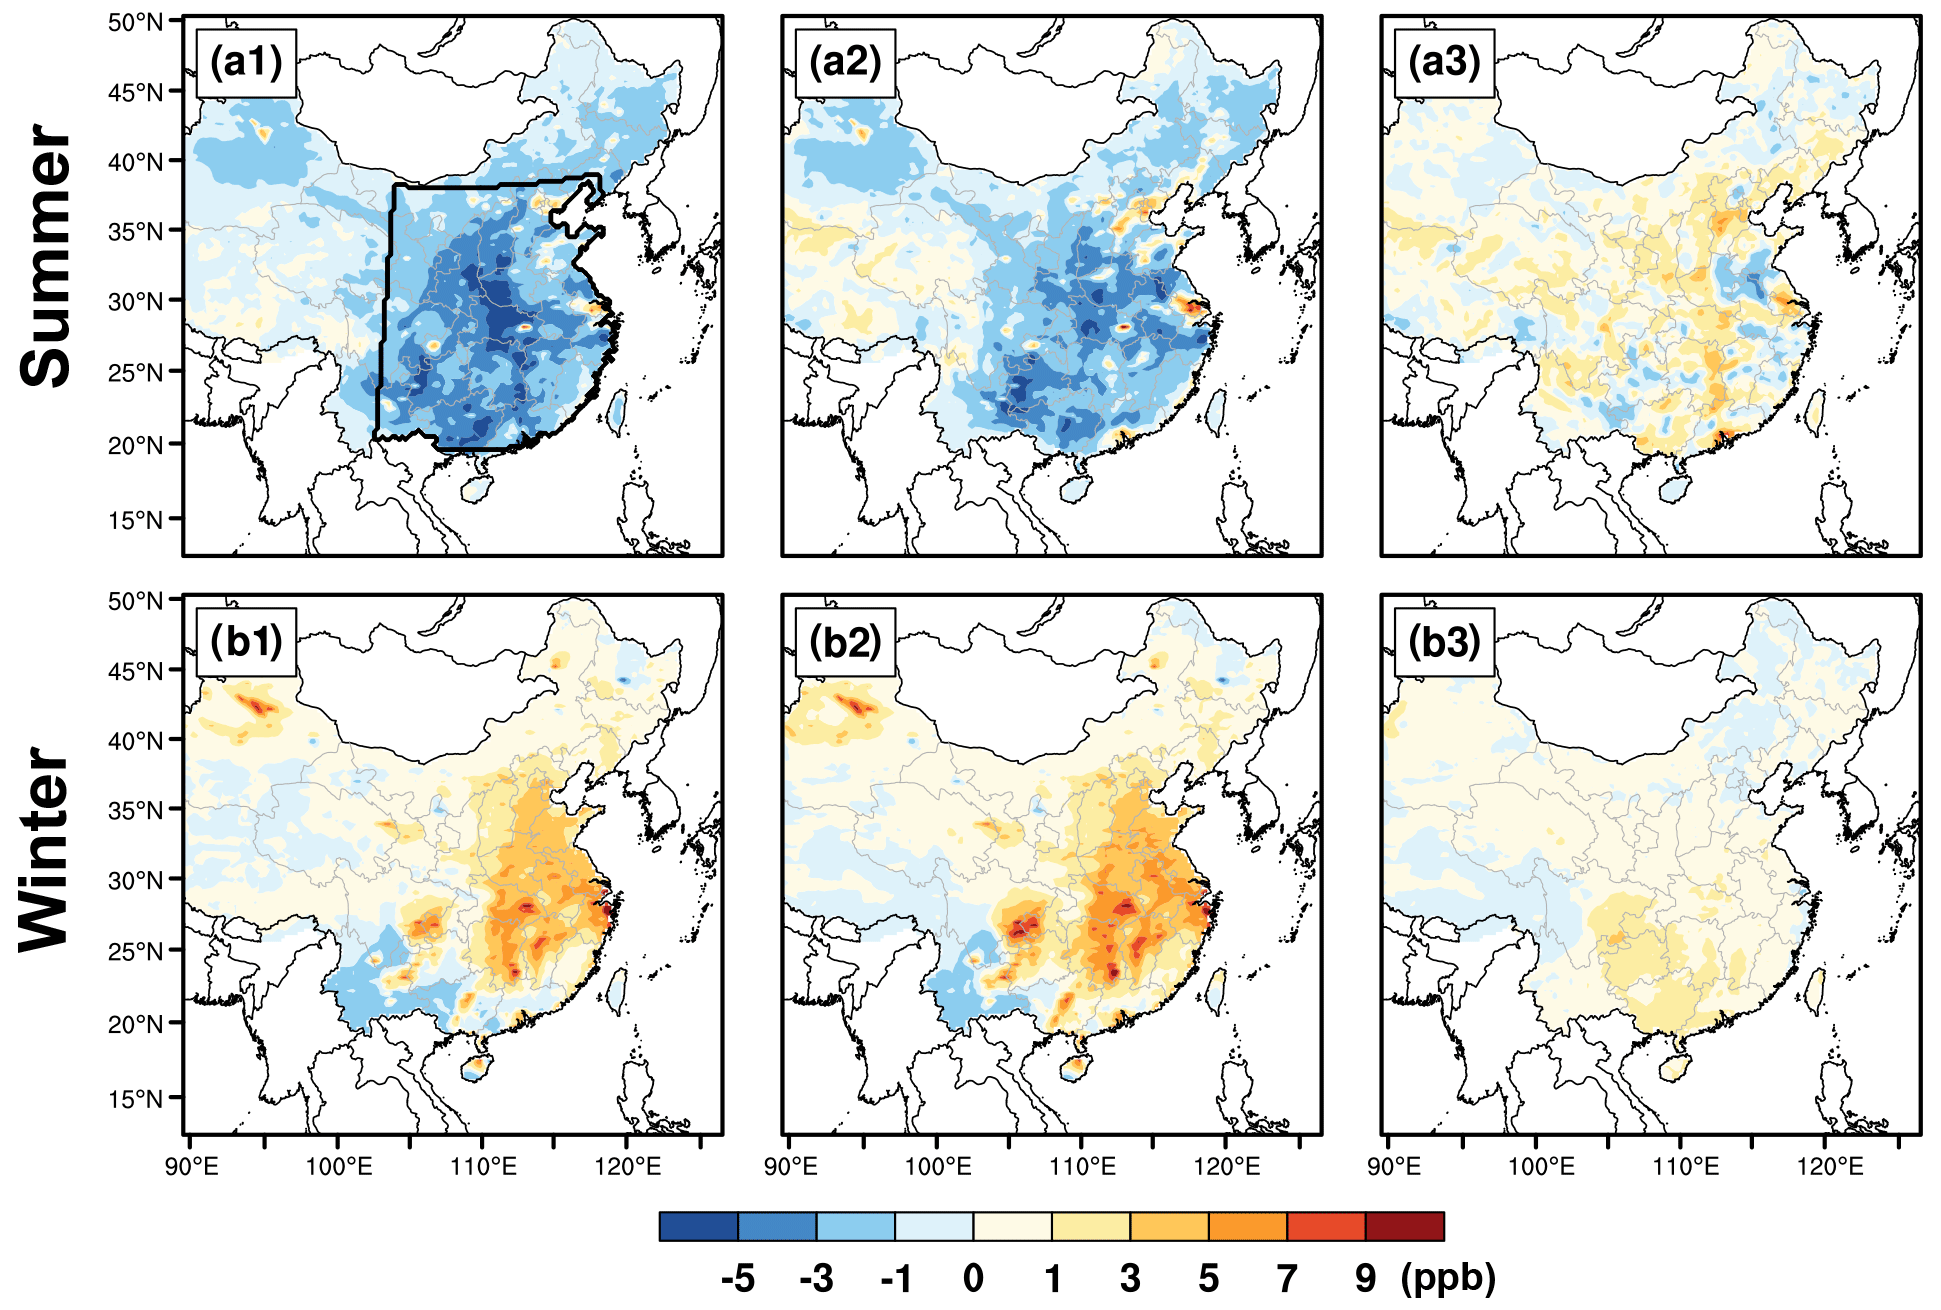
Figure 7Spatial distribution of changed summer (a1, a2, a3) and winter (b1, b2, b3) surface-layer MDA8 O3 concentrations from sensitivity simulations. (a1, b1) Effects of anthropogenic emission reduction on MDA8 O3 without ARI. (a2, b2) Effects of anthropogenic emission reduction on MDA8 O3 with ARI. (a3, b3) Effects of weakened ARI on the effectiveness of emission reduction for O3 air quality.
We also average the observed MDA8 O3 concentrations of monitoring sites in the urban areas and the simulation value for the grid cell containing the monitoring site to further examine the impacts of changed meteorological conditions, anthropogenic emissions, and ARI on O3 levels in densely populated urban areas (Fig. 8). Given that most of the monitoring stations with 5 years of continuous observations are located in urban areas, these monitoring stations and the grid cells containing the monitoring stations can be considered urban areas in this study (Liu and Wang, 2020b). As shown in Fig. 8a1 and b1, the changes in observed MDA8 O3 over urban areas in eastern China from 2013 to 2017 can be captured well by WRF-Chem in both summer and winter. In summer, changed meteorological conditions from 2013 to 2017 had little impact on the variations in MDA8 O3 over the urban areas, while the contribution of emission reductions to increased MDA8 O3 is significant. In winter, changed meteorological conditions were unfavorable for the increase in MDA8 O3 from 2013 to 2017, indicating that the worsened ozone pollution was driven by the changed anthropogenic emissions. What is more, ΔO3_ΔARI_EMI had a significant effect on the increased MDA8 O3 in summer from 2013 to 2017, with a value of +1.77 ppb (87.6 %), but its impacts in winter were smaller at only +0.42 ppb (11.8 %), which is consistent with the results in Li et al. (2021). The increased MDA8 O3 concentration over urban areas in summer caused by O3_ΔARI_EMI in this study was 1.77 ppb compared to the 2.12 ppb increase caused by weakened aerosol heterogeneous reactions quantified by Liu and Wang (2020b). Meanwhile, the contributions of ΔO3_ΔAPI_EMI and ΔO3_ΔARF_EMI to the increase in O3 concentration averaged over urban areas in eastern China were almost the same in summer (0.79 vs. 0.98) and winter (0.20 vs. 0.22). In general, we find that the enhancement of O3 concentrations in both summer and winter was mainly caused by reduced anthropogenic emissions. Furthermore, the contributions of ΔO3_ΔAPI_EMI and ΔO3_ΔARF_EMI to the increases in O3 concentrations from 2013 to 2017 over urban areas were almost the same during summer and winter.
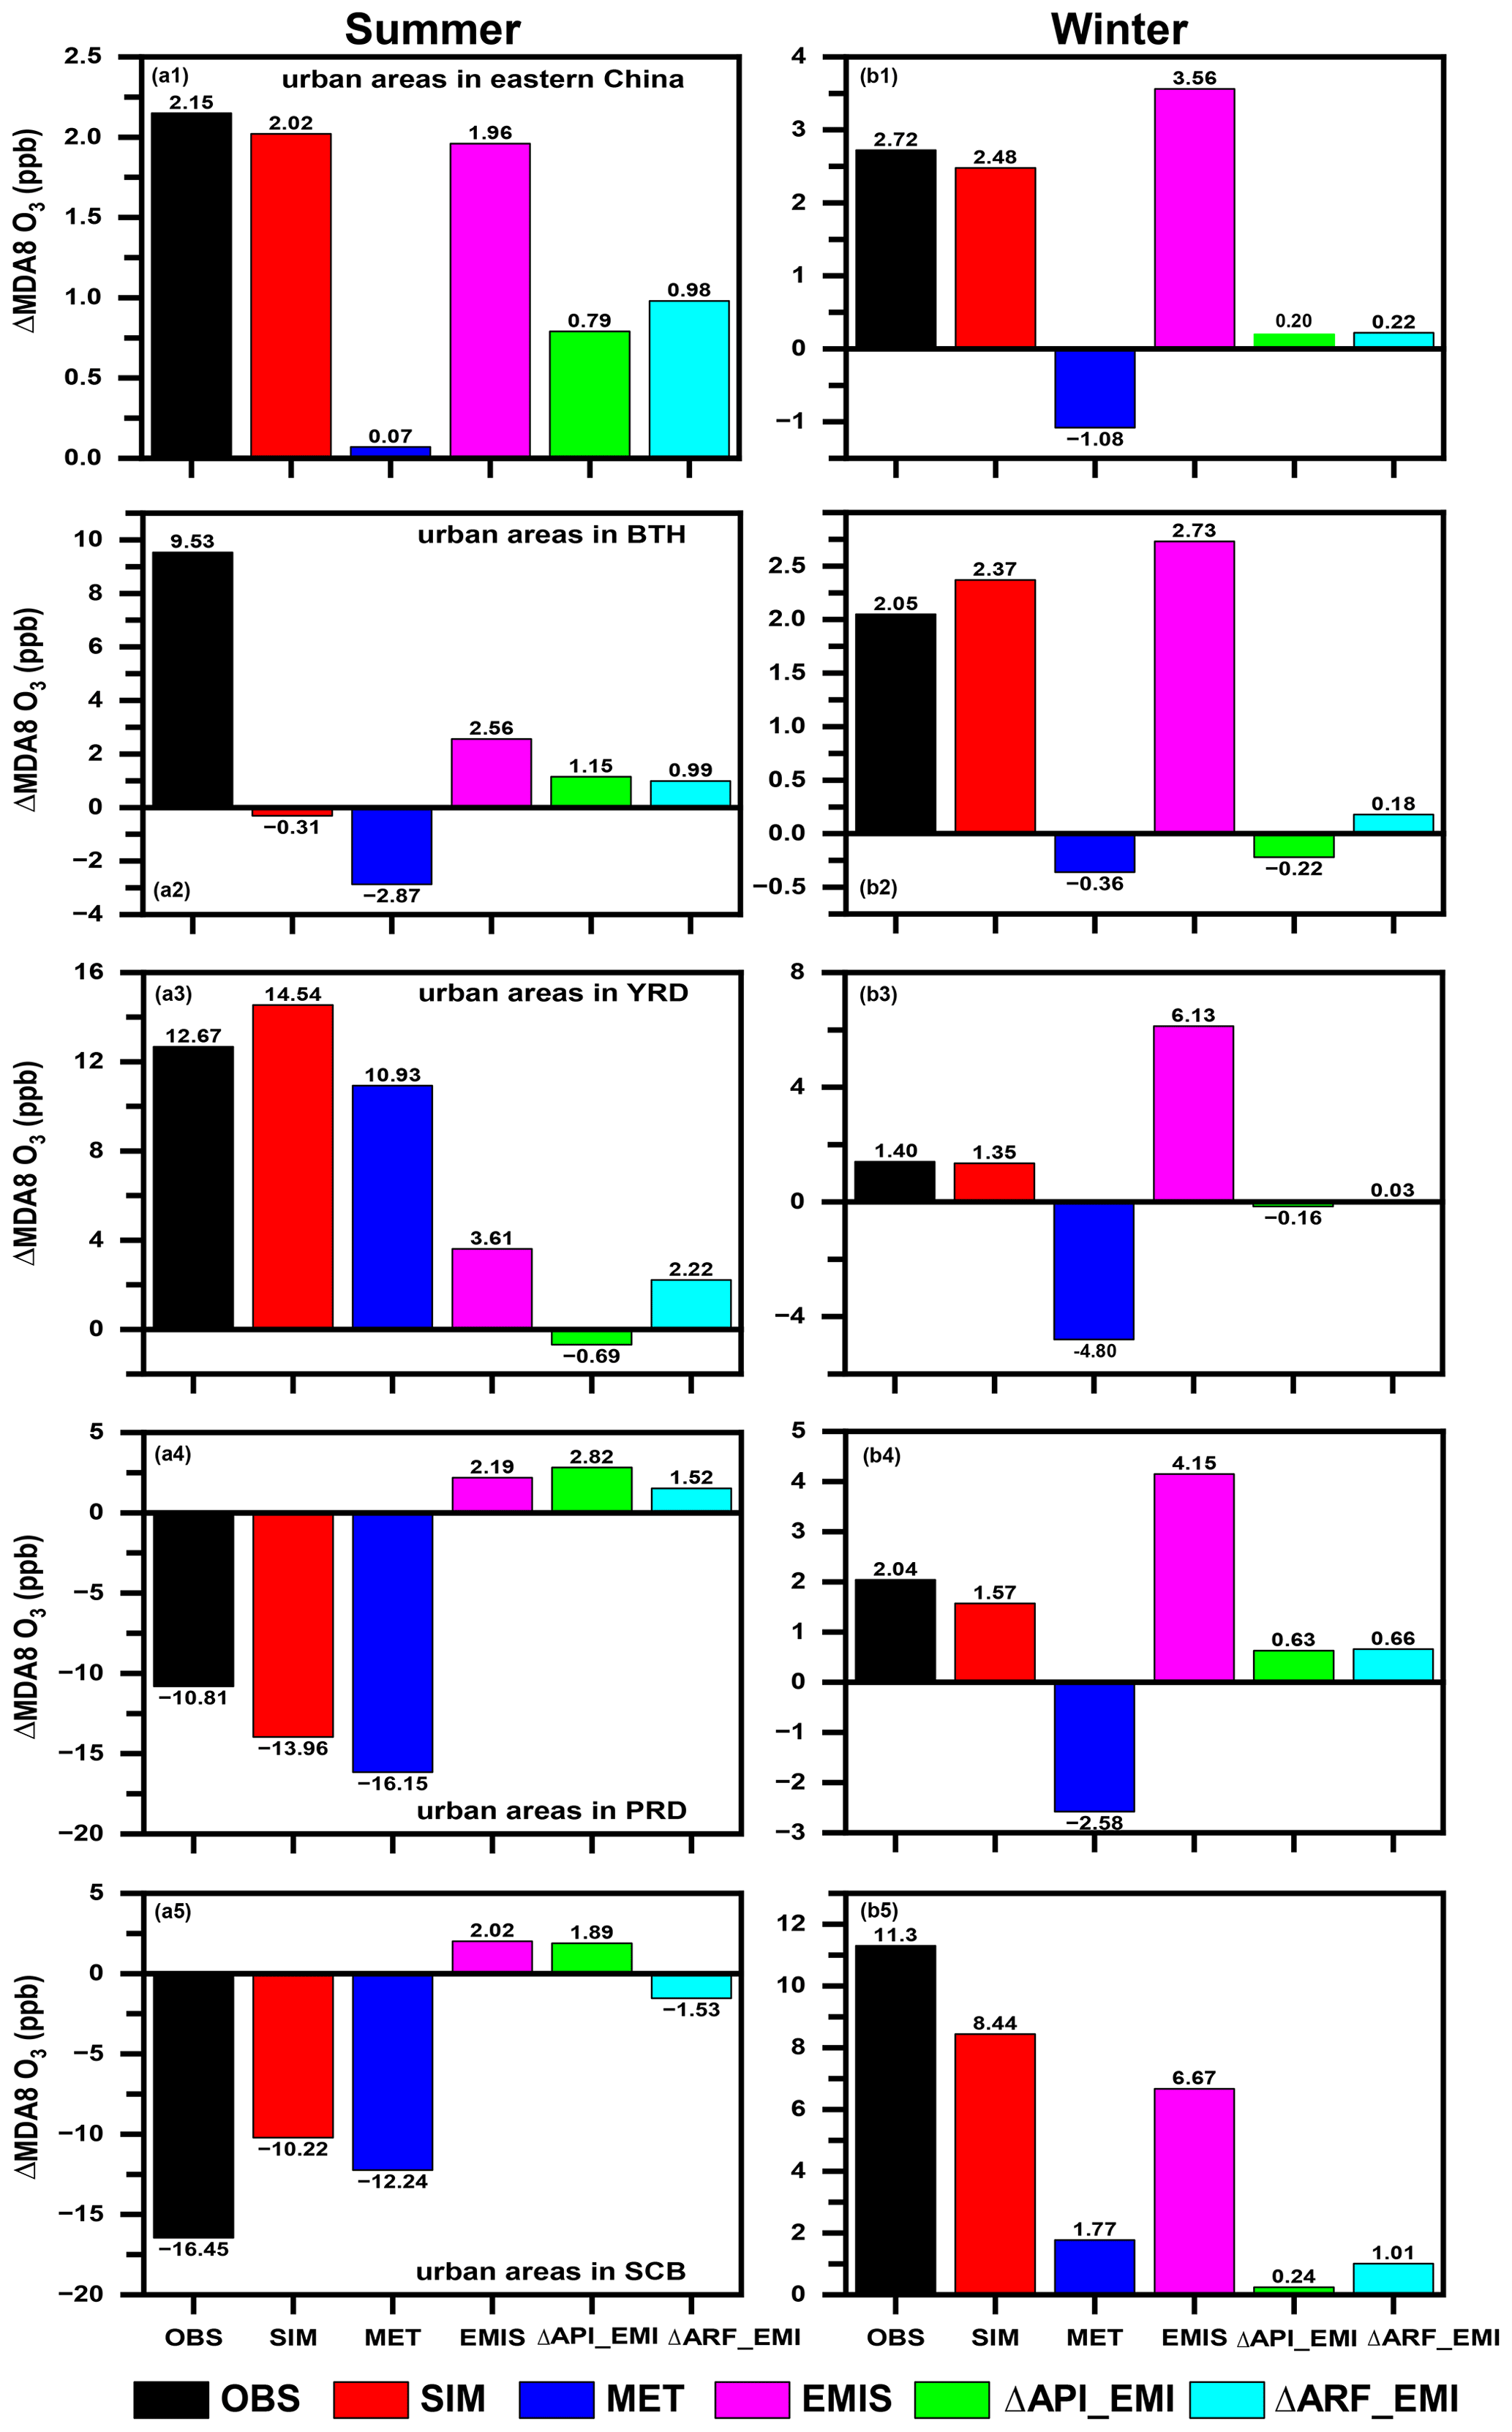
Figure 8The observed (OBS; black bars) and simulated (SIM; red bars) changes in (left) summer and (right) winter surface-layer MDA8 O3 from 2013 to 2017. Contributions of changed meteorological conditions alone (MET; blue bars), changed anthropogenic emissions alone (EMI; purple bars), changed aerosol–photolysis interaction alone (ΔAPI_EMI; green bars), and changed aerosol–radiation feedback alone (ΔARF_EMI; cyan bars) are also shown. Observations are calculated from the monitoring sites in the analyzed region, while the corresponding gridded simulations are averaged for SIM. Panels represent the urban areas in eastern China, Beijing–Tianjin–Hebei (BTH), the Yangtze River Delta (YRD), the Pearl River Delta (PRD), and the Sichuan Basin (SCB).
4.3 Discussion
- 1.
The CBMZ gas-phase chemistry coupled with MOSAIC aerosol module (CBMZ–MOSAIC for short) used in this study does not include secondary organic aerosol (SOA); thus, we applied three additional chemical mechanisms that consider SOA, namely RADM2 gas-phase chemistry coupled with the MADE/SORGAM aerosol module (RADM2–MADE/SORGAM for short), CBMZ gas-phase chemistry coupled with the MADE/SORGAM aerosol module (CBMZ–MADE/SORGAM for short), and MOZART gas-phase chemistry coupled with the MOSAIC aerosol module (MOZART–MOSAIC for short), to test the impact of ARI on O3 with and without SOA for the BASE_17E17M scenario.
Figure S11 shows the temporal variations in observed and simulated PM2.5 and O3 concentrations over eastern China for the three additional chemical mechanisms. Compared with the observed PM2.5 (O3) concentrations, MOZART–MOSAIC showed the best performance in December 2017, with R of 0.73 (0.79) and NMB of −18.7 % (−20.5 %). Therefore, we used this mechanism to further simulate the air pollutant concentrations during the period of June 2017. As shown in Fig. S11 (a4, b4), the temporal variations in observed PM2.5 (O3) can be captured by this mechanism well, with R of 0.56 (0.91) and NMB of −1.7 % (−20.3 %).
Finally, we investigated the effect of ARI on O3 from the results of CBMZ–MOSAIC (the mechanism applied in this paper, which does not include SOA) and MOZART–MOSAIC (this mechanism includes SOA and performs the best compared with RADM2–MADE/SORGAM and CBMZ–MADE/SORGAM). As shown in Fig. S12, summer (winter) MDA8 O3 is significantly reduced over eastern China. ARI reduces the surface MDA8 O3 concentrations by 1.32 (1.96) and 1.85 (1.60) ppb in CBMZ–MOSAIC and MOZART–MOSAIC, respectively. The O3 reductions are of comparable magnitude in these two schemes. Therefore, we can conclude that although the CBMZ–MOSAIC mechanism applied in this paper does not take into account the formation of SOA and its associated effects, the aerosol radiative effects on O3 concentrations, not only in the pattern of spatiotemporal distribution but also in the order of magnitude, are consistent with the results when the SOA simulation mechanism is considered.
As shown in Fig. S13, the mean SOAs simulated by RADM2–MADE/SORGAM, CBMZ–MADE/SORGAM, and MOZART–MOSAIC are 0.29, 0.45, and 0.94 µg m−3, accounting for 3.4 %, 3.8 %, and 4.4 % of PM2.5 concentrations in winter 2017, respectively. From Fig. S14, the mean SOA simulated in MOZART–MOSAIC is 0.90 µg m−3, accounting for 9.1 % of PM2.5 in summer 2017. Model-simulated SOA concentrations are generally underestimated by most current chemical transport models (Zhang et al., 2015; Zhao et al., 2015). The low SOA concentrations simulated by the model can be explained by low emission of biogenic and anthropogenic VOCs (key precursors of SOA), but a thorough investigation of this underestimation is outside the scope of this paper and will be discussed in our future work.
- 2.
The impacts of aerosol heterogeneous reactions (HET) on O3 have not been considered in this paper due to the uncertainty and inconsistency of the heterogeneous uptake shown in previous observation and simulation studies (Liu and Wang, 2020b; Tan et al., 2020; Shao et al., 2021). Liu and Wang (2020b) found that the rapid decrease in PM2.5 was the primary contributor to the summer O3 increase through weakening of the heterogeneous uptake of the hydroperoxyl radical (HO2). However, Tan et al. (2020) launched a field campaign in NCP and proposed a contradicting opinion about the importance of the impact of HET on O3. Shao et al. (2021) summarized the fact that different heterogeneous uptakes on the aerosol surface applied in the model simulation (e.g., 0.20 vs. 0.08) would cause significant deviations in simulated ozone concentrations (e.g., O3 increased by 6 %, while O3 increased by 2.5 %). Previous laboratory studies indicate that the dependence of the uptake coefficient on aerosol composition and RH means that a single assumed value for heterogeneous uptake used in numerical simulations can lead to large uncertainties (Lakey et al., 2015; Taketani et al., 2009; Zou et al., 2019). Therefore, the uncertainty in the heterogeneous uptake value used in the numerical simulation will ultimately amplify the deviation in model results. Meanwhile, our paper is devoted to quantifying the effects of ARI on O3 rather than the impacts of heterogeneous reactions on O3. The absence of heterogeneous chemistry on the aerosol surface may result in underestimation of the effect of aerosol on O3, which will be considered in our future work.
- 3.
There may be an interaction between API and ARF. However, in this study we discuss the roles of API and ARF separately, which may ignore the effects of interactions between API and ARF on O3. This may affect our results, and we will discuss their interaction in our future studies.
In this study, the impact of weakened aerosol–radiation interaction (ARI) due to decreased anthropogenic emissions on surface O3 (ΔO3_ΔARI_EMI) over eastern China is analyzed, mainly using the online coupled regional chemistry transport model WRF-Chem. Simulation results generally reproduce the spatiotemporal characteristics of observations with correlation coefficients of 0.63–0.90 for pollutant concentrations and 0.40–0.99 for meteorological parameters.
Sensitivity experiments show that the changes in MDA8 O3 from 2013 to 2017 over eastern China vary spatially and seasonally and that the decreased anthropogenic emissions play a more prominent role in the MDA8 O3 increase than the impact of changed meteorological conditions in both summer and winter. Furthermore, the decreased PM2.5 concentrations due to reduced anthropogenic emissions can result in a weaker impact of ARI on O3 concentrations, which then superimposes its effect on the worsened O3 air quality. For urban areas over eastern China, ΔO3_ΔARI_EMI has a significant effect on the increase in MDA8 O3 in summer with a value of +1.77 ppb, accounting for 87.6 % of the increased value caused by decreased anthropogenic emissions, but the impacts in winter are smaller (+0.42 ppb), accounting for 11.8 % of the increased value caused by decreased anthropogenic emissions. For the whole region over eastern China, the enhancement of MDA8 O3 by ΔO3_ΔARI_EMI is +0.81 (+0.63) ppb, with ΔO3_ΔAPI_EMI and ΔO3_ΔARF_EMI contributing 55.6 % (61.9 %) and 44.4 % (38.1 %) in summer (winter), respectively. Process analysis shows that the enhanced O3 chemical production is the dominant process for the increased O3 concentrations caused by ΔO3_ΔARI_EMI in both summer and winter.
Generally, since China's clean air action in 2013, the decreased PM2.5 concentrations due to reduced anthropogenic emissions have worsened O3 air quality through the weakened interactions between aerosol and radiation, which is a new and an important implication for understanding the causes driving the increases in the O3 level over eastern China. Therefore, our results highlight that more carefully designed multi-pollutant coordinated emission control strategies are needed to reduce the concentrations of PM2.5 and O3 simultaneously.
The observed hourly surface concentrations of air pollutants are derived from the China National Environmental Monitoring Center (https://air.cnemc.cn:18007/, CNEMC, 2024). The observed surface meteorological data are obtained from https://www.ncei.noaa.gov/maps/hourly/ (National Centers for Environmental Information, 2024). The photolysis rates of nitrogen dioxide in Beijing are provided by Xin Li (li_xin@pku.edu.cn). The simulation results can be accessed by contacting Lei Chen (chenlei@nuist.edu.cn) or Hong Liao (hongliao@nuist.edu.cn).
The supplement related to this article is available online at: https://doi.org/10.5194/acp-24-4001-2024-supplement.
HY, LC, and HL initiated the study and designed the experiments. HY and LC performed the simulations and carried out the data analysis. JZ, WW, and XL provided useful comments on the paper. HY prepared the paper, with contributions from all co-authors.
The contact author has declared that none of the authors has any competing interests.
Publisher's note: Copernicus Publications remains neutral with regard to jurisdictional claims made in the text, published maps, institutional affiliations, or any other geographical representation in this paper. While Copernicus Publications makes every effort to include appropriate place names, the final responsibility lies with the authors.
This research has been supported by the National Natural Science Foundation of China (grant nos. 42305121, 42007195, and 42293320), the National Key Research and Development Program of China (grant nos. 2019YFA0606804 and 2022YFE0136100), the Natural Science Foundation of Jiangsu Province (grant no. BK20220031), Guizhou Provincial Science and Technology Projects of China (CXTD [2022]001, GCC [2023]026), and the open fund of the Jiangsu Key Laboratory of Atmospheric Environment Monitoring and Pollution Control (KHK 2211).
This paper was edited by Graciela Raga and reviewed by three anonymous referees.
Atkinson, R.: Atmospheric chemistry of VOCs and NOx, Atmos Environ., 34, 2063–2101, https://doi.org/10.1016/S1352-2310(99)00460-4, 2000.
Chen, F. and Dudhia, J.: Coupling an Advanced Land Surface – Hydrology Model with the Penn State – NCAR MM5 Modeling System. Part I: Model Implementation and Sensitivity, Mon. Weather Rev., 129, 569–585, 2001.
China National Environmental Monitoring Centre (CNEMC): Air pollutants dataset in China, CNEMC [data set], https://air.cnemc.cn:18007/, last access: 21 March 2024.
Dang, R. and Liao, H.: Radiative Forcing and Health Impact of Aerosols and Ozone in China as the Consequence of Clean Air Actions over 2012–2017, Geophys. Res. Lett., 46, 12511–12519, https://doi.org/10.1029/2019GL084605, 2019.
Foken, T.: 50 years of the Monin-Obukhov similarity theory, Bound.-Lay. Meteorol., 119, 431–437, 2006.
Gipson, G. L.: Science algorithms of the EPA Models-3 community multiscale air quality (CMAQ) modeling system: Chapter 16, process analysis, edited by: Byun, D. W. and Ching, J. K. S., Reported No. EPA/600/R-99/030, U.S. Environmental Protection Agency, Office of Research and Development, Washington, D.C., https://www.cmascenter.org/cmaq/science_documentation/pdf/000_cover_exec.pdf (last access: 21 March 2024), 1999.
Grell, G. A.: Prognostic evaluation of assumptions used by cumulus parameterizations, Mon. Weather Rev., 121, 764–787, 1993.
Grell, G. A., Peckham, S. E., Schmitz, R., Mckeen, S. A., Frost, G., Skamarock, K., and Eder, B.: Fully coupled “online” chemistry within the WRF model, Atmos. Environ., 39, 6957–6975, 2005.
Guenther, A., Karl, T., Harley, P., Wiedinmyer, C., Palmer, P. I., and Geron, C.: Estimates of global terrestrial isoprene emissions using MEGAN (Model of Emissions of Gases and Aerosols from Nature), Atmos. Chem. Phys., 6, 3181–3210, https://doi.org/10.5194/acp-6-3181-2006, 2006.
Hong, C., Zhang, Q., Zhang, Y., Davis, S. J., Zhang, X., Tong, D., Guan, D., Liu, Z., and He, K.: Weakening aerosol direct radiative effects mitigate climate penalty on Chinese air quality, Nat. Clim. Change, 10, 845–850, https://doi.org/10.1038/s41558-020-0840-y, 2020.
Hong, S.-Y., Noh, Y., and Dudhia, J.: A New Vertical Diffusion Package with an Explicit Treatment of Entrainment Processes, Mon. Weather Rev., 134, 2318–2341, 2006.
Iacono, M. J., Delamere, J. S., Mlawer, E. J., Shephard, M. W., Clough, S. A., and Collins, W. D.: Radiative forcing by long-lived greenhouse gases: Calculations with the AER radiative transfer models, J. Geophys. Res., 113, D13103, https://doi.org/10.1029/2008JD009944, 2008.
Jimenez, P. A. and Dudhia, J.: Improving the representation of resolved and unresolved topographic effects on surface wind in the WRF model, J. Appl. Meteorol. Clim., 51, 300–316, 2012.
Jin, X. and Holloway, T.: Spatial and temporal variability of ozone sensitivity over China observed from the Ozone Monitoring Instrument, J. Geophys. Res.-Atmos., 120, 7229–7246, https://doi.org/10.1002/2015JD023250, 2015.
Lakey, P. S. J., George, I. J., Whalley, L. K., Baeza-Romero, M. T., and Heard, D. E.: Measurements of the HO2 Uptake Coefficients onto Single Component Organic Aerosols, Environ. Sci. Technol., 49, 4878–4885, https://doi.org/10.1021/acs.est.5b00948, 2015.
Lelieveld, J., Evans, J. S., Fnais, M., Giannadaki, D., and Pozzer, A.: The contribution of outdoor air pollution sources to premature mortality on a global scale, Nature, 525, 367–371, https://doi.org/10.1038/nature15371, 2015.
Li, K., Jacob, D. J., Liao, H., Shen, L., Zhang, Q., and Bates, K. H.: Anthropogenic Drivers of 2013–2017 Trends in Summer Surface Ozone in China, P. Natl. Acad. Sci. USA, 116, 422–427, https://doi.org/10.1073/pnas.1812168116, 2019.
Li, K., Jacob, D. J., Shen, L., Lu, X., De Smedt, I., and Liao, H.: Increases in surface ozone pollution in China from 2013 to 2019: anthropogenic and meteorological influences, Atmos. Chem. Phys., 20, 11423–11433, https://doi.org/10.5194/acp-20-11423-2020, 2020.
Li, K., Jacob, D. J., Liao, H., Qiu, Y. L., Shen, L., Zhai, S. X., Bates, K. H., Sulprizio, M. P., Song, S. J., Lu, X., Zhang, Q., Zheng, B., Zhang, Y. L., Zhang, J. Q., Lee, H. C., and Kuk, K. S.: Ozone pollution in the North China Plain spreading into the late-winter haze season, P. Natl. Acad. Sci. USA, 118, e2015797118, https://doi.org/10.1073/pnas.2015797118, 2021.
Liao, H., Yung, Y. L., and Seinfeld, J. H.: Effects of aerosols on tropospheric photolysis rates in clear and cloudy atmospheres, J. Geophys. Res., 104, 23697–23707, 1999.
Lin, Y.-L., Farley, R. D., and Orville, H. D.: Bulk parameterization of the snow field in a cloud model, J. Appl. Meteorol. Clim., 22, 1065–1092, 1983.
Liu, Y. and Wang, T.: Worsening urban ozone pollution in China from 2013 to 2017 – Part 1: The complex and varying roles of meteorology, Atmos. Chem. Phys., 20, 6305–6321, https://doi.org/10.5194/acp-20-6305-2020, 2020a.
Liu, Y. and Wang, T.: Worsening urban ozone pollution in China from 2013 to 2017 – Part 2: The effects of emission changes and implications for multi-pollutant control, Atmos. Chem. Phys., 20, 6323–6337, https://doi.org/10.5194/acp-20-6323-2020, 2020b.
Lou, S., Liao, H., and Zhu, B.: Impacts of aerosols on surface-layer ozone concentrations in China through heterogeneous reactions and changes in photolysis rates, Atmos. Environ., 85, 123–138, 2014.
Lu, X., Hong, J. Y., Zhang, L., Cooper, O. R., Schultz, M. G., Xu, X. B., Wang, T., Gao, M., Zhao, Y. H., and Zhang, Y. H.: Severe surface ozone pollution in China: A global perspective, Environ. Sci. Tech. Let., 5, 487–494, https://doi.org/10.1021/acs.estlett.8b00366, 2018.
Mills, G., Sharps, K., Simpson, D., Pleijel, H., Broberg, M., Uddling, J., Jaramillo, F., Davies, W. J., Dentener, F., Van den Berg, M., Agrawal, M., Agrawal, S. B., Ainsworth, E. A., Buker, P., Emberson, L., Feng, Z., Harmens, H., Hayes, F., Kobayashi, K., Paoletti, E., and Van Dingenen, R.: Ozone pollution will compromise efforts to increase global wheat production, Glob. Change Biol., 24, 3560–3574, https://doi.org/10.1111/gcb.14157, 2018.
National Centers for Environmental Information: Hourly/Sub-Hourly Observational Data, NCEI [data set], https://www.ncei.noaa.gov/maps/hourly/, last access: 21 March 2024.
Seinfeld, J. H. and Pandis, S. N.: Atmospheric Chemistry and Physics: from Air Pollution to Climate Change, 2nd edn., John Wiley and Sons, ISBN: 9781119221166, 2006.
Shao, M., Wang, W. J., Yuan, B., Parrish, D. D., Li, X., Lu, K. D., Wu, L. L., Wang, X. M., Mo, Z. W., Yang, S. X., Peng, Y. W., Kuang, Y., Chen, W. H., Hu, M., Zeng, L. M., Su, H., Cheng, Y. F., Zheng, J. Y., and Zhang, Y. H.: Quantifying the role of PM2.5 dropping in variations of ground-level ozone: Inter-comparison between Beijing and Los Angeles, Sci. Total Environ., 788, 147712, https://doi.org/10.1016/j.scitotenv.2021.147712, 2021.
Shu, L., Xie, M., Wang, T., Gao, D., Chen, P., Han, Y., Li, S., Zhuang, B., and Li, M.: Integrated studies of a regional ozone pollution synthetically affected by subtropical high and typhoon system in the Yangtze River Delta region, China, Atmos. Chem. Phys., 16, 15801–15819, https://doi.org/10.5194/acp-16-15801-2016, 2016.
Shu, L., Wang, T., Han, H., Xie, M., Chen, P., Li, M., and Wu, H.: Summertime ozone pollution in the Yangtze River Delta of eastern China during 2013–2017: Synoptic impacts and source apportionment, Environ. Pollut., 257, 113631, https://doi.org/10.1016/j.envpol.2019.113631, 2020.
Skamarock, W., Klemp, J. B., Dudhia, J., Gill, D. O., Barker, D. M., Duda, M., Huang, X. Y., Wang, W., and Powers, J. G.: A description of the advanced research WRF version 3, NCAR technical note NCAR/TN/u2013475, 2008.
Taketani, F., Kanaya, Y., and Akimoto, H.: Heterogeneous loss of HO2 by KCl, synthetic sea salt, and natural seawater aerosol particles, Atmos. Environ., 43, 1660–1665, 2009.
Tan, Z., Hofzumahaus, A., Lu, K., Brown, S. S., Holland, F., Huey, L. G., Kiendler-Scharr, A., Li, X., Liu, X., Ma, N., Min, K.-E., Rohrer, F., Shao, M., Wahner, A., Wang, Y., Wiedensohler, A., Wu, Y., Wu, Z., Zeng, L., Zhang, Y., and Fuchs, H.: No Evidence for a Significant Impact of Heterogeneous Chemistry on Radical Concentrations in the North China Plain in Summer 2014, Environ. Sci. Technol. 54, 5973–5979, 2020.
Wang, J., Allen, D. J., Pickering, K. E., Li, Z., and He, H.: Impact of aerosol direct effect on East Asian air quality during the EAST-AIRE campaign, J. Geophys. Res.-Atmos., 121, 6534–6554, https://doi.org/10.1002/2016JD025108, 2016.
Wang, N., Lyu, X., Deng, X., Huang, X., Jiang, F., and Ding, A.: Aggravating O3 pollution due to NOx emission control in eastern China, Sci. Total Environ., 677, 732–744, 2019.
Wild, O., Zhu, X., and Prather, M. J.: Fast-J: Accurate simulation of in- and below-cloud photolysis in tropospheric chemical models, J. Atmos. Chem., 37, 245–282, https://doi.org/10.1023/A:1006415919030, 2000.
Yang, H., Chen, L., Liao, H., Zhu, J., Wang, W., and Li, X.: Impacts of aerosol–photolysis interaction and aerosol–radiation feedback on surface-layer ozone in North China during multi-pollutant air pollution episodes, Atmos. Chem. Phys., 22, 4101–4116, https://doi.org/10.5194/acp-22-4101-2022, 2022.
Yue, X., Unger, N., Harper, K., Xia, X., Liao, H., Zhu, T., Xiao, J., Feng, Z., and Li, J.: Ozone and haze pollution weakens net primary productivity in China, Atmos. Chem. Phys., 17, 6073–6089, https://doi.org/10.5194/acp-17-6073-2017, 2017.
Zaveri, R. A. and Peters, L. K.: A new lumped structure photochemical mechanism for large-scale applications, J. Geophys. Res., 104, 30387–30415, https://doi.org/10.1029/1999JD900876, 1999.
Zaveri, R. A., Easter, R. C., Fast, J. D., and Peters, L. K.: Model for simulating aerosol interactions and chemistry (MOSAIC), J. Geophys. Res., 113, D13204, https://doi.org/10.1029/2007JD008782, 2008.
Zhai, S., Jacob, D. J., Wang, X., Shen, L., Li, K., Zhang, Y., Gui, K., Zhao, T., and Liao, H.: Fine particulate matter (PM2.5) trends in China, 2013–2018: separating contributions from anthropogenic emissions and meteorology, Atmos. Chem. Phys., 19, 11031–11041, https://doi.org/10.5194/acp-19-11031-2019, 2019.
Zhang, B., Wang, Y., and Hao, J.: Simulating aerosol–radiation–cloud feedbacks on meteorology and air quality over eastern China under severe haze conditionsin winter, Atmos. Chem. Phys., 15, 2387–2404, https://doi.org/10.5194/acp-15-2387-2015, 2015.
Zhang, Q., Zheng, Y., Tong, D., Shao, M., Wang, S., Zhang, Y., Xu, X., Wang, J., He, H., Liu, W., Ding, Y., Lei, Y., Li, J., Wang, Z., Zhang, X., Wang, Y., Cheng, J., Liu, Y., Shi, Q., Yan, L., Geng, G., Hong, C., Li, M., Liu, F., Zheng, B., Cao, J., Ding, A., Gao, J., Fu, Q., Huo, J., Liu, B., Liu, Z., Yang, F., He, K., and Hao, J.: Drivers of Improved PM2.5 Air Quality in China from 2013 to 2017, P. Natl. Acad. Sci. USA, 116, 24463–24469, https://doi.org/10.1073/pnas.1907956116, 2019.
Zhao, B., Wang, S., Donahue, N. M., Chuang, W., Ruiz, L. H., Ng, N. L., Wang, Y., and Hao, J.: Evaluation of One-Dimensional and Two-Dimensional Volatility Basis Sets in Simulating the Aging of Secondary Organic Aerosol with Smog-Chamber Experiments, Environ. Sci. Technol., 49, 2245–2254, https://doi.org/10.1021/es5048914, 2015.
Zheng, B., Tong, D., Li, M., Liu, F., Hong, C., Geng, G., Li, H., Li, X., Peng, L., Qi, J., Yan, L., Zhang, Y., Zhao, H., Zheng, Y., He, K., and Zhang, Q.: Trends in China's anthropogenic emissions since 2010 as the consequence of clean air actions, Atmos. Chem. Phys., 18, 14095–14111, https://doi.org/10.5194/acp-18-14095-2018, 2018.
Zhu, J., Chen, L., Liao, H., Yang, H., Yang, Y., and Yue, X.: Enhanced PM2.5 Decreases and O3 Increases in China During COVID-19 Lockdown by Aerosol-Radiation Feedback, Geophys. Res. Lett., 48, e2020GL090260, https://doi.org/10.1029/2020GL090260, 2021.
Zou, Q., Song, H., Tang, M., and Lu, K.: Measurements of HO2 uptake coefficient on aqueous (NH4)2SO4 aerosol using aerosol flow tube with LIF system, Chinese Chem. Lett., 30, 2236–2240, 2019.