the Creative Commons Attribution 4.0 License.
the Creative Commons Attribution 4.0 License.
 | 03 Apr 2024
MIXv2: a long-term mosaic emission inventory for Asia (2010–2017)
Junichi Kurokawa
Qiang Zhang
Jung-Hun Woo
Tazuko Morikawa
Satoru Chatani
Zifeng Lu
Yu Song
Guannan Geng
Hanwen Hu
Jinseok Kim
Owen R. Cooper
Brian C. McDonald
The MIXv2 Asian emission inventory is developed under the framework of the Model Inter-Comparison Study for Asia (MICS-Asia) Phase IV and produced from a mosaic of up-to-date regional emission inventories. We estimated the emissions for anthropogenic and biomass burning sources covering 23 countries and regions in East, Southeast and South Asia and aggregated emissions to a uniform spatial and temporal resolution for seven sectors: power, industry, residential, transportation, agriculture, open biomass burning and shipping. Compared to MIXv1, we extended the dataset to 2010–2017, included emissions of open biomass burning and shipping, and provided model-ready emissions of SAPRC99, SAPRC07, and CB05. A series of unit-based point source information was incorporated covering power plants in China and India. A consistent speciation framework for non-methane volatile organic compounds (NMVOCs) was applied to develop emissions by three chemical mechanisms. The total Asian emissions for anthropogenic/open biomass sectors in 2017 are estimated as follows: 41.6/1.1 Tg NOx, 33.2/0.1 Tg SO2, 258.2/20.6 Tg CO, 61.8/8.2 Tg NMVOC, 28.3/0.3 Tg NH3, 24.0/2.6 Tg PM10, 16.7/2.0 Tg PM2.5, 2.7/0.1 Tg BC (black carbon), 5.3/0.9 Tg OC (organic carbon), and 18.0/0.4 Pg CO2. The contributions of India and Southeast Asia were emerging in Asia during 2010–2017, especially for SO2, NH3 and particulate matter. Gridded emissions at a spatial resolution of 0.1° with monthly variations are now publicly available. This updated long-term emission mosaic inventory is ready to facilitate air quality and climate model simulations, as well as policymaking and associated analyses.
- Article
(10682 KB) - Full-text XML
-
Supplement
(860 KB) - BibTeX
- EndNote


Air pollutants emitted from both anthropogenic and natural activities have caused severe impacts on human health, ecosystems, and climate over Asia (Adam et al., 2021; Geng et al., 2021; Takahashi et al., 2020; Wong et al., 2008; Xie et al., 2018). Over the last 2 decades, the emerging ozone pollution and haze events across Asia have got extensive attention from the government (Anwar et al., 2021; Feng et al., 2022; Zheng et al., 2018). Tremendous efforts have been made since 2010 continuously to improve air quality and protect human health. The effects of these policies on emission abatement need to be updated in inventories to address the regional and global issues of air quality and climate change. Therefore, a long-term emission inventory plays key roles in historical policy assessment and future air quality and climate mitigation.
Consistent greenhouse gas emissions are crucial for climate–air quality nexus research and policymaking (Fiore et al., 2015). Carbon dioxide (CO2) is co-emitted with many air pollutants, which are contributors of ozone and particulate matter, further changing climate through forcings of Earth's radiation budget (Fiore et al., 2015). Previous studies have emphasized the importance of air pollution mitigation and climate change (Jacob and Winner, 2009; Saari et al., 2015), as recently summarized by the Synthesis Report of the IPCC Sixth Assessment Report (IPCC: Intergovernmental Panel on Climate Change, report available at https://www.ipcc.ch/report/sixth-assessment-report-cycle/, last access: 20 June 2023). Given the common sources of CO2 and air pollutants, it is important to quantify their emissions distribution in a self-consistent way to assess the co-benefits and pathways to cleaner air and carbon neutrality (Klausbruckner et al., 2016; Phillips, 2022; von Schneidemesser and Monks, 2013).
Emissions over Asia since 2010 are quantified in recent studies. Kurokawa and Ohara (2020) developed an anthropogenic emission inventory over Asia for 1950–2015, REAS (the Regional Emission inventory in ASia), covering power plants, industry, residential, transportation and agricultural sources. Emissions of both air pollutants and CO2 are estimated in REAS. Based on the Community Emissions Data System (CEDS), McDuffie et al. (2020) developed a global anthropogenic emission inventory covering major air pollutants over 1970–2017. Global emissions for air pollutants are estimated under the HTAPv3 (Task Force on Hemispheric Transport of Air Pollution) project for 2000–2018 for air pollutants by integrating official inventories over specific areas including Asia (Crippa et al., 2023). These regional and global emissions are estimated with limited updates of country-specific or even localized information. Following a mosaic approach, the first version of MIX Asian inventory (MIXv1) was developed to support the Model Inter-Comparison Study for Asia (MICS-Asia) Phase III projects, by incorporating five regional emission inventories for all major anthropogenic sources over Asia, providing a gridded emission dataset at a spatial resolution of 0.25° for 2008 and 2010. The mosaic approach has been proven to increase the emission accuracy and model performance significantly by including more local information (M. Li et al., 2017b). A profile-based speciation scheme for non-methane volatile organic compounds (NMVOCs) was applied to develop model-ready emissions by chemical mechanisms, which reduced the uncertainties arising from inaccurate mapping between inventory and model species (M. Li et al., 2014, 2019). Specifically, MIXv1 advances our understanding of emissions and spatial distributions from power plants through a mosaic of unit-based information, and agricultural activities based on a process-based model which parameterized the spatial and temporal variations of emission factors for NH3.
However, it is difficult to develop consistent emissions over Asia for a long period using the mosaic approach because of the lack of available regional inventory data. Within the MICS-Asia community, developers of regional inventories have been endeavoring to extend their emission inventories to the present day since Phase IV. Through intensive collaboration and community efforts, we now have a complete list of available regional emission inventories covering major parts of Asia and are able to combine them to produce a new version of MIX for 2010–2017. MICS-Asia is currently in its fourth phase, MICS-Asia IV, which aims to advance our understanding of the discrepancies and relative uncertainties present in the simulations of air quality and climate models (Chen et al., 2019; Gao et al., 2018; Itahashi et al., 2020; M. Li et al., 2017b). A critical component of the project is ensuring that emission inventories remain consistent across various atmospheric and climate models. In support of MICS-Asia IV research activities and related policymaking endeavors, we developed MIXv2, the second version of our mosaic Asian inventory. MIXv2 combines the best available state-of-the-art regional emission inventories from across Asia using a mosaic approach. This inventory is expected to enhance our capabilities to assess emission changes and their driving forces, and their impact on air quality and climate change, thus providing valuable insights for decision-makers and stakeholders. CO2 emissions are estimated based on the same emission inventory framework as the short-lived air pollutants and further integrated into MIXv2 following the mosaic methodology.
MIXv1 has been widely applied to support scientific research activities from regional to local scales (Geng et al., 2021; Hammer et al., 2020; K. Li et al., 2019; M. Li et al., 2017b). Compared to MIXv1, MIXv2 has the following updates to better feed the needs of atmospheric modeling activities:
-
it advances the horizontal resolution of the gridded maps from 0.25 to 0.1°;
-
it incorporates up-to-date regional inventories from 2010–2017;
-
it provides emissions of open biomass burning and shipping, in addition to anthropogenic sources;
-
it develops model-ready emissions of SAPRC99, SAPRC07, and CB05.
Methods and input data are described in Sect. 2. Emissions evolution and their driving forces, seasonality, spatial distribution, NMVOC speciation and inventory limitations are analyzed and discussed in Sect. 3. Section 4 compares the MIX data with other bottom-up and top-down emission estimates. Concluding remarks are provided in Sect. 5.
2.1 Overview of MIXv2
The key features of MIXv2 are summarized in Table 1. Anthropogenic sources, including power, industry, residential, transportation, and agriculture, along with open biomass burning and shipping, are included. Dust and aviation are not included in the current version of MIX. Monthly emissions between 2010–2017 are allocated to grids at 0.1 × 0.1°. Open biomass burning emissions are also available with daily resolution upon request. Emissions of 10 species, including CO2 and air pollutants of NOx, SO2, CO, NMVOC, NH3 (ammonia), PM10 (particulate matter with diameter less than or equal to 10 µm), PM2.5 (particulate matter with diameter less than or equal to 2.5 µm), BC (black carbon) and OC (organic carbon) are estimated. MIX can support most atmospheric models compatible with gas-phase chemical mechanisms of SAPRC99, SAPRC07 and CB05, and these can be mapped based on these three chemical mechanisms (e.g., GEOS-Chem, MOZART) (Li et al., 2014). MIXv2 stretches from Afghanistan in the west to Japan in the east and from Indonesia in the south to Mongolia in the north. The domain is consistent with the REASv3 gridded emissions product.
Table 1Key features of MIXv2 and the component emission inventories. Note that NA stands for not available.
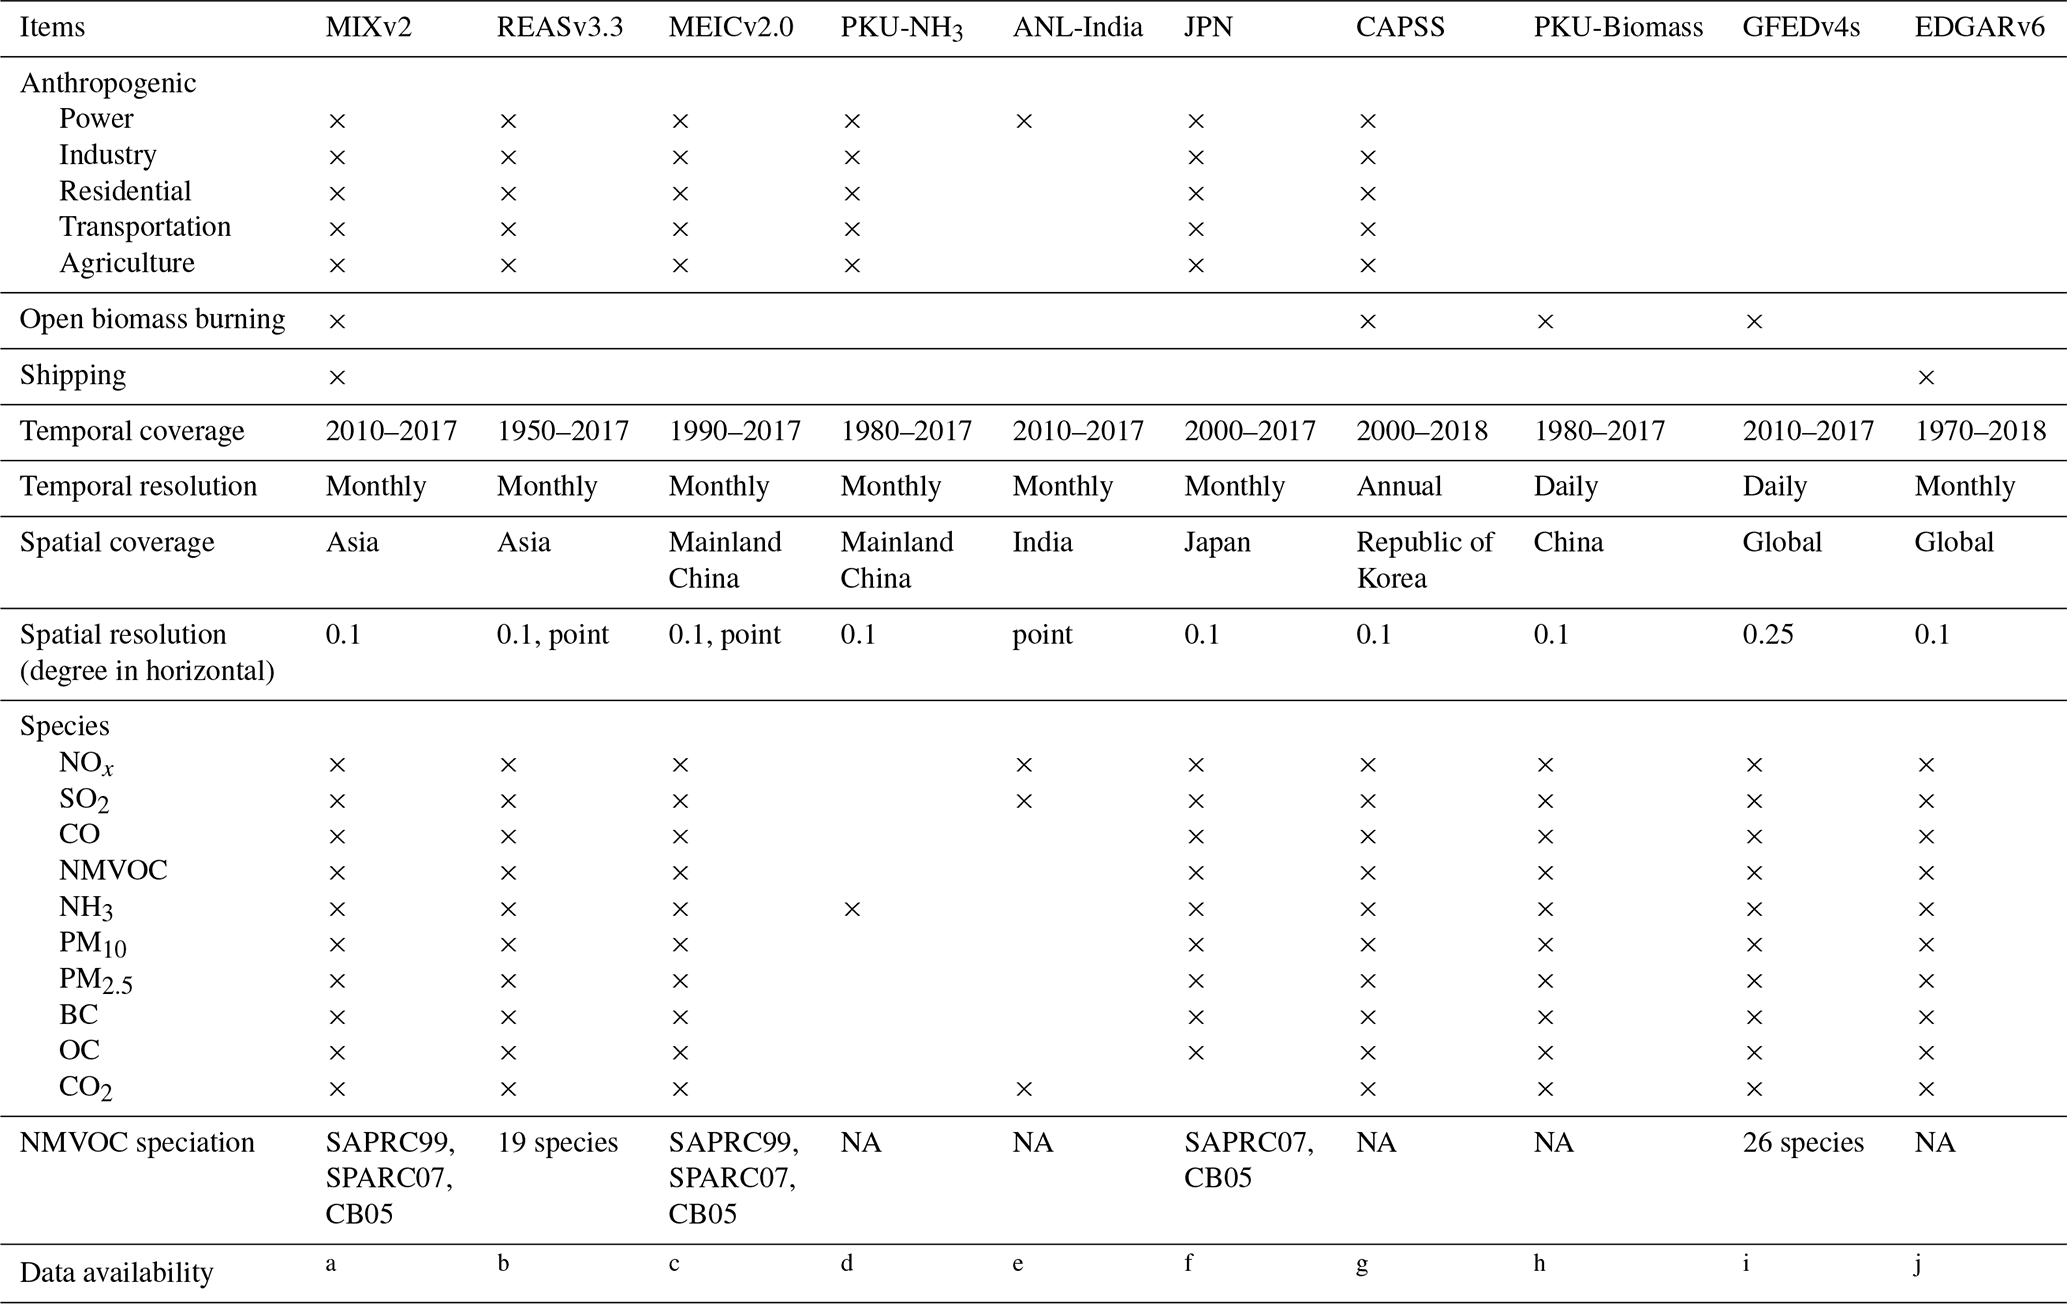
ahttps://csl.noaa.gov/groups/csl4/modeldata/data/Li2023/ (last access: October 2023). b https://www.nies.go.jp/REAS/index.html (for REASv3.2.1) (last access: April 2022). c http://meicmodel.org.cn/ (last access: June 2022). d http://meicmodel.org.cn/?page_id=1772&lang=en (last access: June 2022). e Lu et al. (2011). f Chatani et al. (2018), Shibata and Morikawa (2021). g National Institute of Environmental Research Center. h http://meicmodel.org.cn/?page_id=1772&lang=en. i https://www.globalfiredata.org/ (last access: October 2022). j https://edgar.jrc.ec.europa.eu/ (last access: October 2022).
Table 2Sector and subsectors included in MIXv2a.
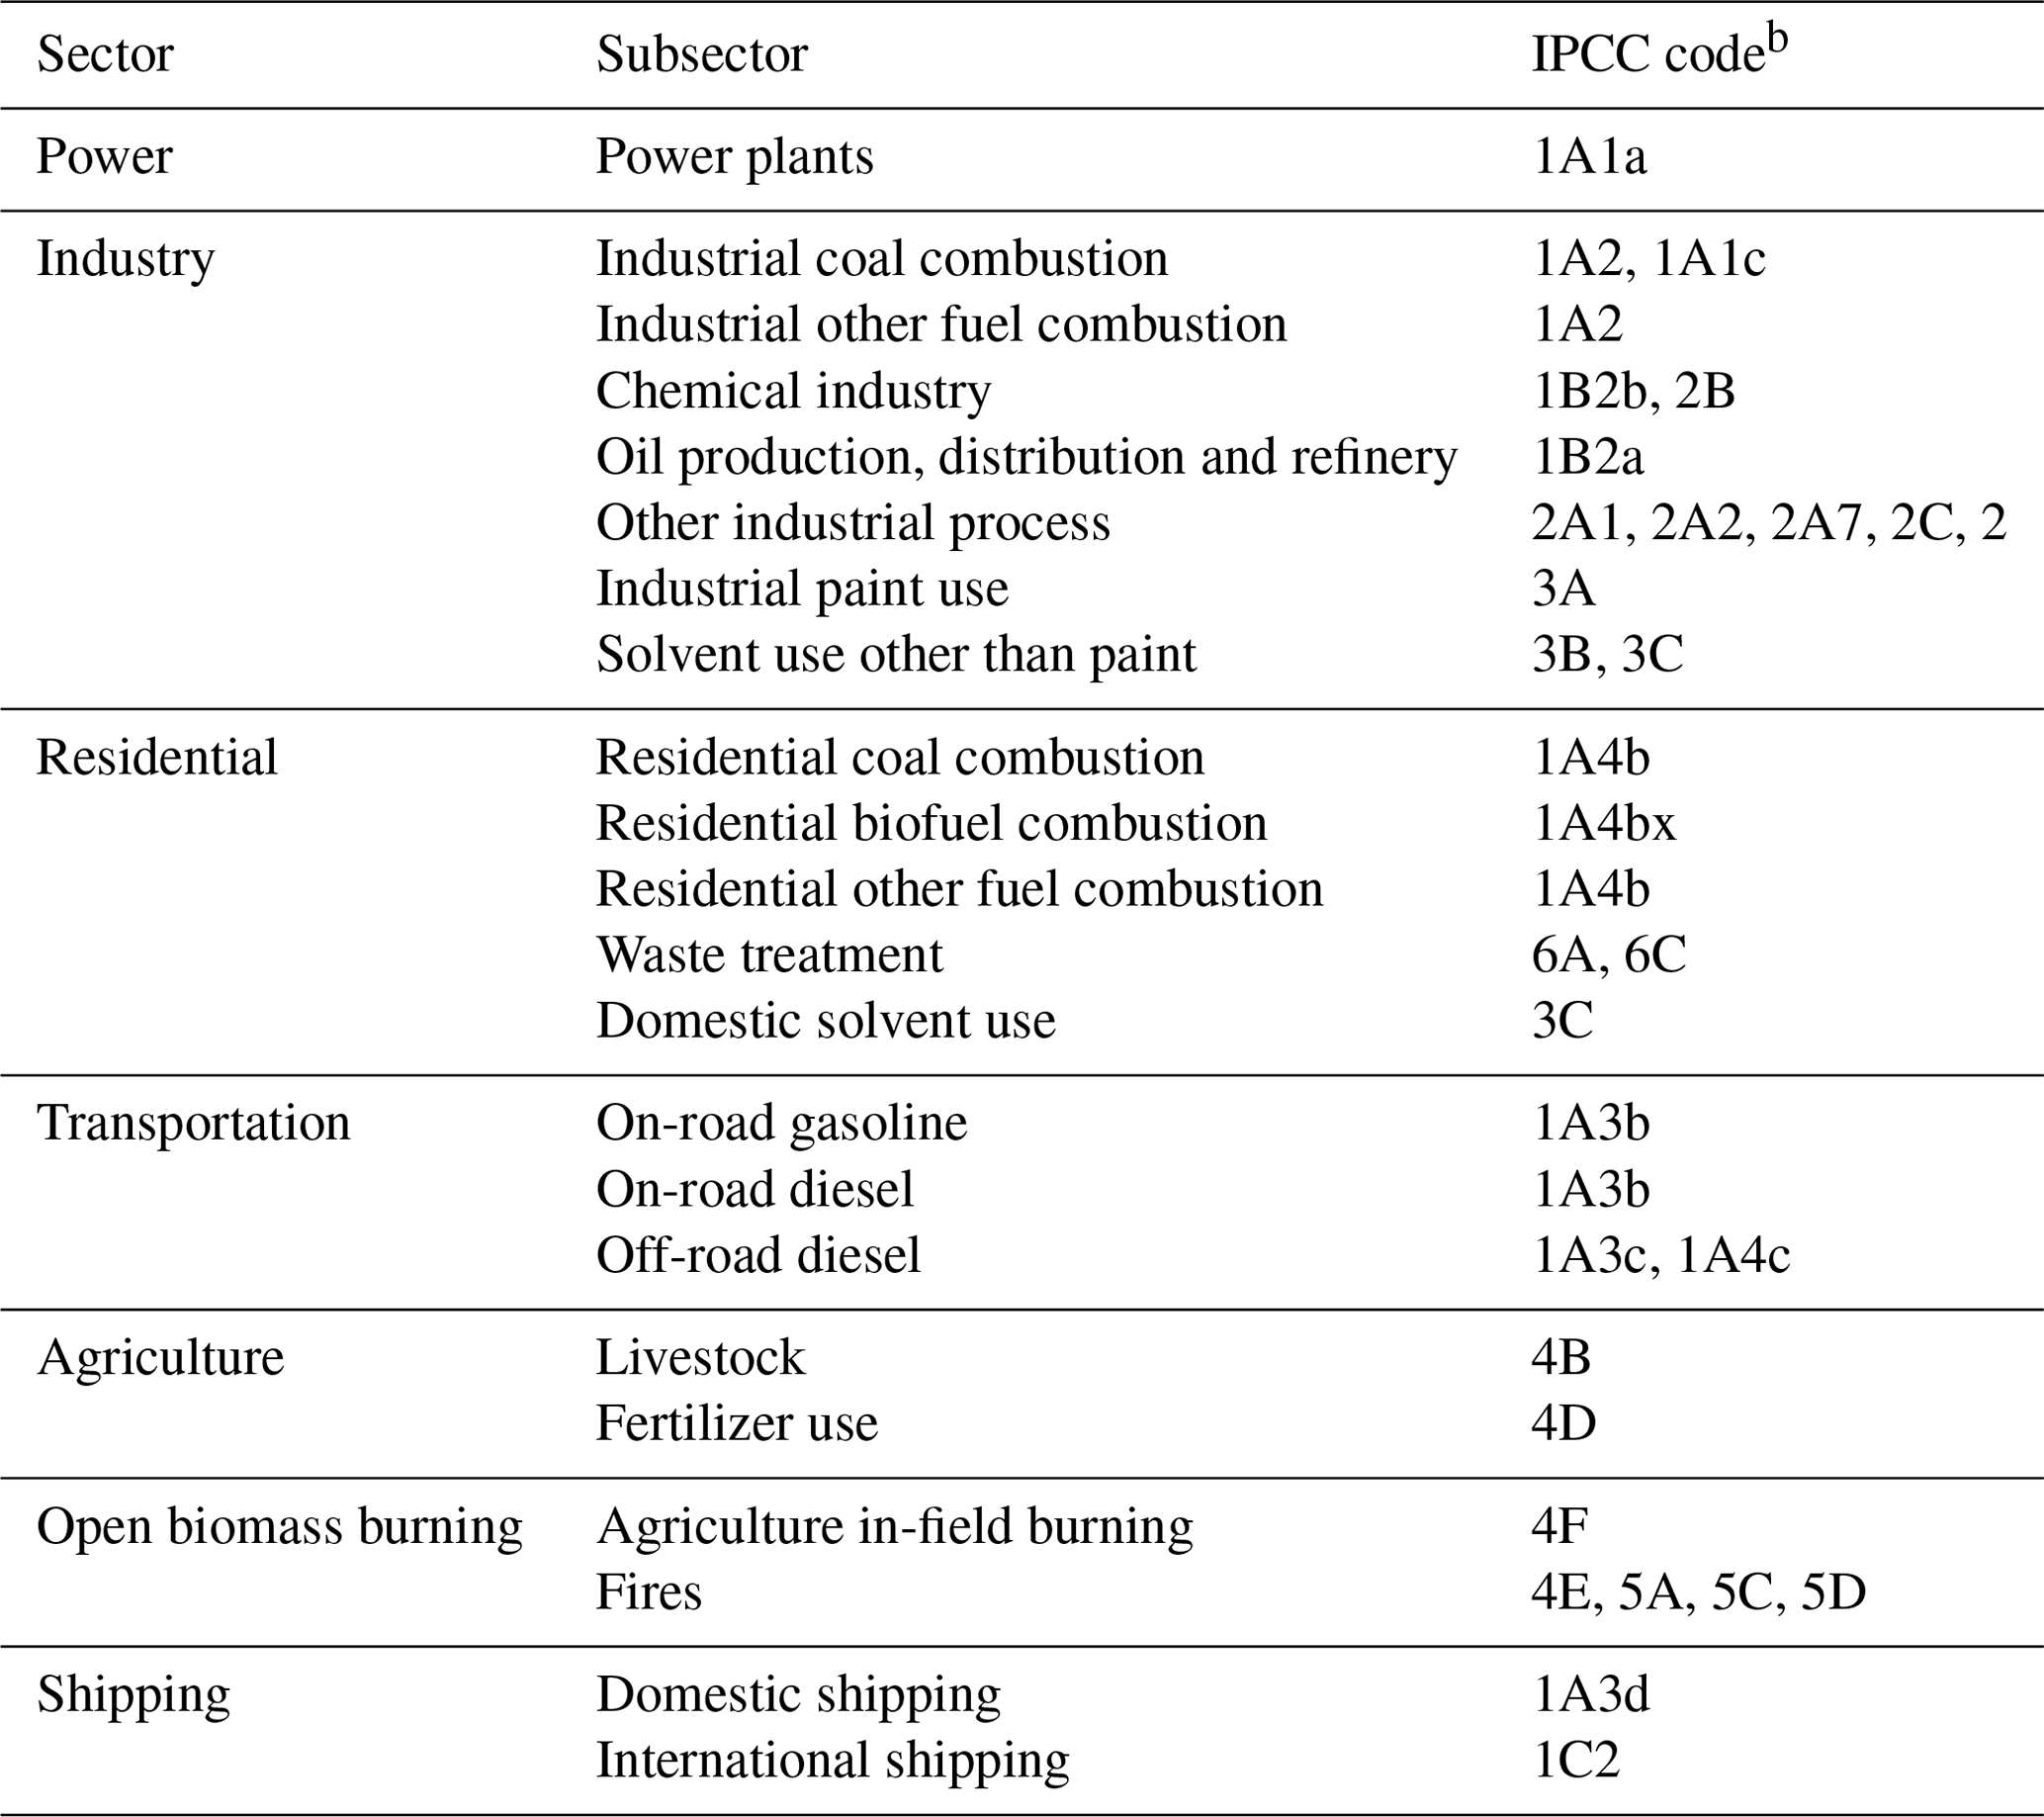
a Detailed source profiles assigned to sources within each subsector are summarized in Table S1. b Reference report: https://www.ipcc.ch/report/ar6/wg3/downloads/report/IPCC_AR6_WGIII_FOD_AnnexII.pdf (last access: May 2022).
Table 2 summarizes the subsectors for each sector in the development of MIX, along with the corresponding source codes used by IPCC.
2.2 Mosaic methodology
We follow a mosaic methodology similar to the development of MIXv1 (M. Li et al., 2017b), as shown in Fig. 1. In brief, nine regional and two global emission inventories were collected and integrated into a uniform format, including REAS version 3 for Asia (referred to as REASv3) (Kurokawa and Ohara, 2020); the Multi-resolution Emission Inventory for China version 2.0 (MEICv2, http://meicmodel.org.cn/, last access: June 2022) (M. Li et al., 2017a; Zheng et al., 2021, 2018); a process-based NH3 emission inventory developed by Peking University (referred to as PKU-NH3) (Kang et al., 2016); an official Japan emission inventory (referred to as JPN) (Chatani et al., 2018; Shibata and Morikawa, 2021); an Indian emission inventory for power plants from Argonne National Laboratory (referred to as ANL-India) (Lu and Streets, 2012; Lu et al., 2011); an open biomass burning emission inventory from Peking University (PKU-Biomass) (Yin et al., 2019); the official emissions from Clean Air Policy Support System (CAPSS) for the Republic of Korea (Lee et al., 2011); the fourth version of Global Fire Emissions Database with small fires (GFEDv4s) (van der Werf et al., 2017); and the Emissions Database for Global Atmospheric Research (EDGAR) version 6 for the shipping emissions (Janssens-Maenhout et al., 2019). Figure 1 shows the distribution of the components of emission inventories, which are mosaicked into the MIXv2.
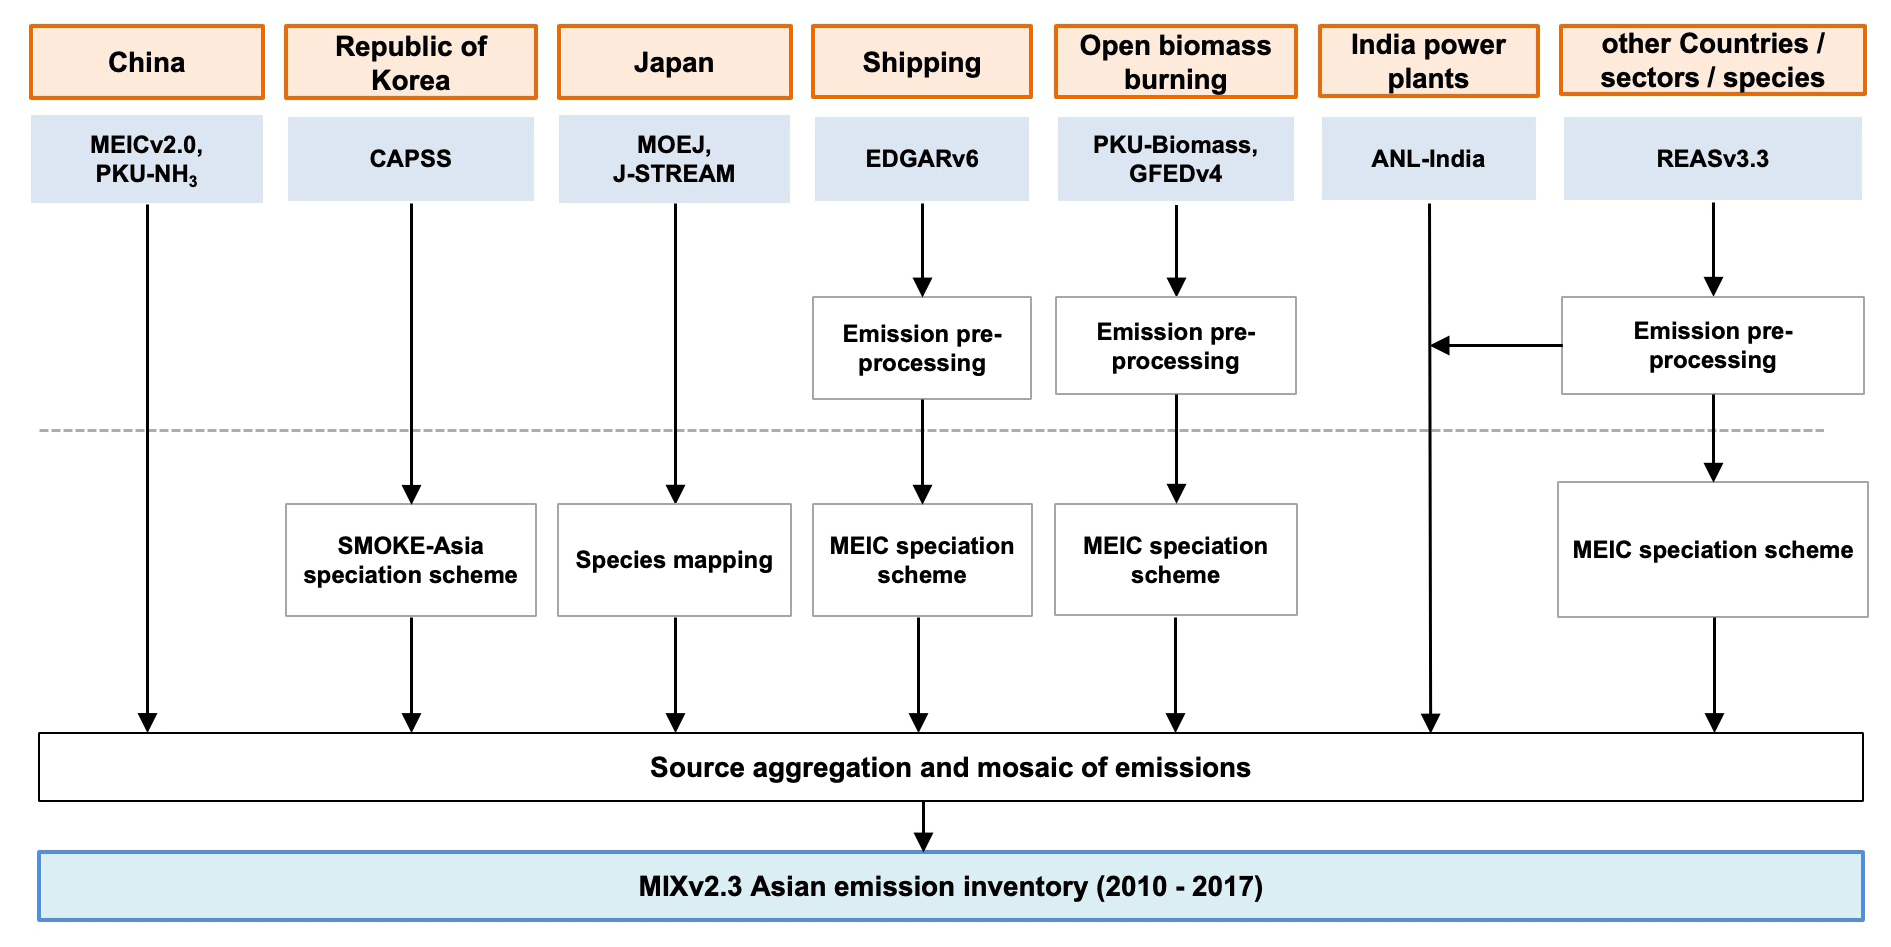
We follow a similar hierarchy in MIXv2 as the previous version in the mosaic process. We use REASv3 as the default inventory for anthropogenic sources, and then further replace it with official emission inventories at a finer scale. MEIC, PKU-NH3 and ANL-India are demonstrated as the best available inventories through inter-comparisons to represent local source distribution with advanced methodology and reliable data sources (M. Li et al., 2017b). Thus, MEIC overrides REAS for anthropogenic emissions over mainland China. PKU-NH3, which was developed with a process-based model was further applied to replace the NH3 emissions in MEIC. In Japan, JPN provides emissions for all air pollutants. The ratios of CO2 to NOx by sectors derived from REAS are combined with JPN to develop CO2 gridded emissions. In detail, we firstly calculated the total CO2 emissions of Japan by multiplying the CO2 to NOx ratios and JPN's NOx emission estimates by sectors, then we developed the spatial proxies based on the NOx gridded emissions of JPN. Lastly, the calculated CO2 emissions were allocated to each grid month by month. We use ANL-India for SO2, NOx and CO2 for power plants in India directly, and we complement emissions of other species and sectors with REASv3. Regarding Hong Kong, we use the updated REASv3 emissions.
The open biomass emissions of MIX are developed by combining GFEDv4s and PKU-Biomass inventories. GFED emissions over Asia are processed to the objective domain. We re-gridded the GFED emissions from 0.25 to 0.1° based on an area-weighted algorithm in a mass-balanced way. Wildfires of various vegetation types (including savanna, forest, peatland) and in-field agricultural waste burning are aggregated into the “open biomass burning” sector. PKU-Biomass overrides the emissions of GFED over China (including Hong Kong and Taiwan) on both a monthly and a daily basis.
The consistency of data is ensured in three aspects: source aggregation, spatial distribution and NMVOC speciation. Firstly, a consistent source definition system was applied in source aggregation from regional emission inventories to the final emission mosaic, as outlined in Table 2 and Table S1 in the Supplement. Secondly, the consistency of emissions spatial distribution during emissions mosaic between different inventories are ensured carefully. In India, we integrated the ANL-India emissions for NOx, SO2 and CO2 for pointed power plants and emissions from REAS for other species. To keep the consistency in spatial distribution, we developed spatial proxies based on the CO2 emissions from ANL-India and re-located REAS emissions for other species. Thirdly, a consistent NMVOC speciation framework was applied throughout all component emission inventories for both anthropogenic and open biomass burning sources, which is described in detail in Sect. 2.4.
2.3 Components of regional emission inventory
2.3.1 REASv3 for Asia
We used anthropogenic emissions from REASv3.3 developed by ACAP (Asia Center for Air Pollution Research) and NIES (National Institute for Environmental Studies) to fill the gaps where local inventories are not available. REASv3 was developed as a long historical emission inventory for Asia from 1950–2015 with monthly variations and relatively high spatial resolution (0.25°). Compared to previous versions, REASv3 updated the emission factors and information on control policies to reflect the effect of emission control measures, especially for East Asia. Large power plants are treated as point sources and assigned with coordinates of locations. In REASv3, power plants constructed after 2008 with generation capacity larger than 300 MW are added as point sources. Additionally, REASv3 updated the spatial and temporal allocation factors for the areal sources. Emissions of Japan, the Republic of Korea and Taiwan are originally estimated in the system. The REASv3 data were further developed to 2017 following the same methodology as Kurokawa and Ohara (2020) and updated to a finer spatial resolution of 0.1°, except for NH3 emissions from fertilizer application where a grid allocation factor for 0.1° was prepared from that of 0.25° for REASv3.2.1 assuming homogeneous distribution of emissions in each 0.25° grid cell. We used the REAS estimates for Taiwan directly and replaced REAS with local inventories as illustrated below.
2.3.2 MEICv2 for China
For China, we used the anthropogenic emissions from the MEIC model developed and maintained by Tsinghua University. MEIC uses a technology-based methodology to quantify air pollutants and CO2 from more than 700 emitting sources since 1990 (M. Li et al., 2017a). Specifically, MEIC has developed a unit-based power plant database, a comprehensive vehicle modeling approach and a profile-based NMVOC speciation framework. Detailed methodology and data sources can be found in previous MEIC studies (M. Li et al., 2017a; Liu et al., 2015; Zheng et al., 2014). In version 2.0, iron and steel plants and cement factories are also treated as point sources, which is important to improve industrial emissions estimation (Zheng et al., 2021). MEIC is an online data platform publicly available to the community for emissions calculation, data processing and data downloading. MEIC delivers monthly emissions at various spatial resolutions and chemical mechanisms as defined by the user. We downloaded the emissions at 0.1° generated from MEIC v2.0 and aggregated it to five anthropogenic sectors: power, industry, residential, transportation and agriculture. We followed the speciation framework in the MEIC model and applied it to other regions of Asia, as described in detail in Sect. 2.4. MEIC emissions of SAPRC99, SAPRC07 and CB05 were used directly in MIX.
2.3.3 PKU-NH3 for NH3 in China
We replaced MEIC with the high-resolution PKU-NH3 inventory for NH3 emissions in China developed by Peking University (Huang et al., 2012b; Kang et al., 2016). PKU-NH3 uses a process-based model to compile NH3 emissions with emission factors that vary with ambient temperature, soil property, and the method and rate of fertilizer application (Huang et al., 2012b). Compared to the previous version used in MIXv1, PKU-NH3 further refined emission factors by adding the effects of wind speed and in-field experimental data of NH3 flux in northern China cropland. Emissions are allocated to 1 km × 1 km grids using spatial proxies derived from a land cover dataset, rural population, etc. (Huang et al., 2012b). Monthly emissions over China, including Hong Kong, Macao, and Taiwan are available from 1980 to 2017. We aggregated the nine sub-sectors into five MIX anthropogenic sectors (power, industry, residential, transportation, agriculture) and excluded the agricultural in-field waste burning.
2.3.4 ANL-India for power plants in India
ANL-India is a continuously-updated long-term power plant emission inventory for India developed on a unit and monthly basis by Argonne National Laboratory (Lu and Streets, 2012; Lu et al., 2011). Emissions are calculated for more than 1300 units in over 300 thermal power plants based on the detailed information collected from various reports of the Central Electricity Authority (CEA) in India. As much as possible, the accurate and actual operational data of power units and plants are used in inventory development, including geographical locations, capacity, commissioning and retirement time, actual monthly power generation, emission control application, fuel type, source, specifications, and consumption, etc. The detailed method can be found in Lu et al. (2011) and Lu and Streets (2012). ANL-India is available for NOx, SO2 and CO2. In this work, the 2010–2017 period of ANL-India at the monthly level is used directly in MIX. We further merged ANL-India with REASv3 for other species to complete the emission estimation in India. CO2 emissions of ANL-India at 0.1° × 0.1° grids were used to develop spatial proxies by sectors, year and month. Following this, REASv3 emissions of all other species were reallocated to grids based on ANL-derived spatial proxies. Although ANL-India provides emissions by fuel type, the fuel heterogeneity of thermal power plants is not considered in the re-gridding process of MIX here because about 93 % of the thermal power generation in India during 2010–2017 was fueled with coal (Lu and Streets, 2012).
2.3.5 JPN (PM2.5EI and J-STREAM) for Japan
We used the JPN inventory to override the Japan emissions of REAS. JPN was jointly developed by the Ministry of Environment, Japan (MOE-J), for mobile source emissions (i.e., PM2.5EI) and by the National Institute of Environmental Studies (NIES) for stationary source emissions (J-STREAM). Major anthropogenic sources are included in PM2.5EI, with vehicle emissions explicitly estimated in detail (Shibata and Morikawa, 2021). Emission factors are assigned as a function of average vehicle velocity by 13 vehicle types and regulation years. The hourly average vehicle type of trunk roads and narrow roads are obtained from in situ measurements. In addition to the running emission exhaust, emissions from engine starting, evaporation, tire ware, road dust and off-road engines are also estimated. To keep consistency with the sector definition of MIX, we excluded the road dust aerosol emissions and mapped other sources to five anthropogenic sectors. For stationary sources, Japan emissions are derived from the Japan's Study for Reference Air Quality Modeling (J-STREAM) model intercomparison project (Chatani et al., 2020, 2018). Long-term emissions of over 100 000 large stationary sources are estimated based on energy consumption and emission factors derived from the emission reports submitted to the government every 3 years (Chatani et al., 2020). NMVOC emissions are speciated into SAPRC07 and CB05 using local source profiles. Emissions are distributed to 1 km × 1 km grids with monthly variations based on spatial and temporal proxies. We re-sampled the monthly JPN emissions to 0.1° × 0.1° grids and merged them into MIXv2.
2.3.6 CAPSS for the Republic of Korea
For the Republic of Korea, we use the official emissions from CAPSS developed by the National Institute of Environmental Research Center (Lee et al., 2011). CAPSS estimated the annual emissions of air pollutants of CO, NOx, SOx, PM10, PM2.5, BC, NMVOCs and NH3 based on the statistical data collected from 150 domestic institutions since the 1990s (Crippa et al., 2023). There are inconsistencies in the long-term emissions trend of CAPSS due to data and methodology changes over the time. We used the re-analyzed data of CAPSS during 2010–2017, which updated the emission factors and added the missing sources. Point sources, area sources and mobile sources were processed using source-based spatial allocation methods (Lee et al., 2011). Monthly variations by sectors are derived from REASv3 for the Republic of Korea and were further applied to CAPSS. In MIXv2, the monthly gridded emissions allocated at 0.1° grids for the anthropogenic sector (power, industry, residential, transportation, agriculture) of CAPSS are integrated.
2.3.7 GFEDv4s for open biomass burning for Asia
Emissions over Asia from the GFEDv4s database with small fires were used as the default inventory for open biomass burning sources. GFED quantified global fire emissions patterns based on the Carnegie–Ames–Stanford approach (CASA) biogeochemical model from 1997 onwards (van der Werf et al., 2017). Compared to previous versions, higher-quality input datasets from different satellite and in situ data streams are used, and better parameterizations of fuel consumption and burning processes are developed. We calculated emissions for trace gases, aerosol species and CO2 based on the burned biomass and updated emission factors by vegetation types provided by the GFED dataset (Akagi et al., 2011; Andreae and Merlet, 2001). Monthly and daily emissions were re-gridded from 0.25 to 0.1° and cropped to a unified domain as anthropogenic emissions. Open fires of grassland, shrubland, savanna, forest and agricultural waste burning are included. We assigned profiles for each source category as listed in Table S1. Model-ready emissions of SAPRC99, SAPRC07 and CB05 were lumped from individual species, as described in Sect. 2.4. GFED emissions are further replaced by PKU-Biomass over China.
2.3.8 PKU-Biomass for biomass burning for China
China's emissions estimated by the PKU-Biomass inventory were used to override GFED emissions for open biomass burning in MIXv2. PKU-Biomass is developed by Peking University based on the MODIS fire radiative energy data for China from 1980 to 2017 (Huang et al., 2012a; Song et al., 2009; Yin et al., 2019). Emission factors of both air pollutants and CO2 are assigned for four types of biomass burning types including forest, grassland, shrubland fires and agricultural waste burning. PKU-Biomass takes account of the farming system and crop types in different temperate zones. High-resolution emissions (1 km) with daily variations are available. We re-gridded emissions to 0.1° × 0.1° and aggregated the emissions to the “open biomass burning” sector. An explicit source profile assignment approach was assigned to each vegetation type. Emissions of three chemical mechanisms were further developed for PKU-Biomass and merged into the MIXv2 final dataset over Asia.
2.3.9 EDGARv6 for shipping for Asia
We used the shipping (domestic and international) emissions over Asia derived from EDGARv6 in MIXv2. EDGAR is a globally consistent emission inventory for anthropogenic sources developed by the Joint Research Centre of the European Commission (Crippa et al., 2018; Janssens-Maenhout et al., 2019). Emissions of both air pollutants and greenhouse gases are estimated. EDGAR uses international statistics as activity data and emission factors varying with pollutants, sector, technology, and abatement measures for emissions calculation for 1970–2018. Shipping route data are used as spatial proxies to distribute emission estimates to 0.1° grids. We downloaded the emissions data for both inland and international shipping from 2010 to 2017, processed the data to the MIX domain and aggregated them to the “Shipping” sector. Monthly emissions are only available for 2018. We applied the monthly variations of air pollutants in 2018 to emissions of 2010–2017 accordingly.
2.4 NMVOC speciation
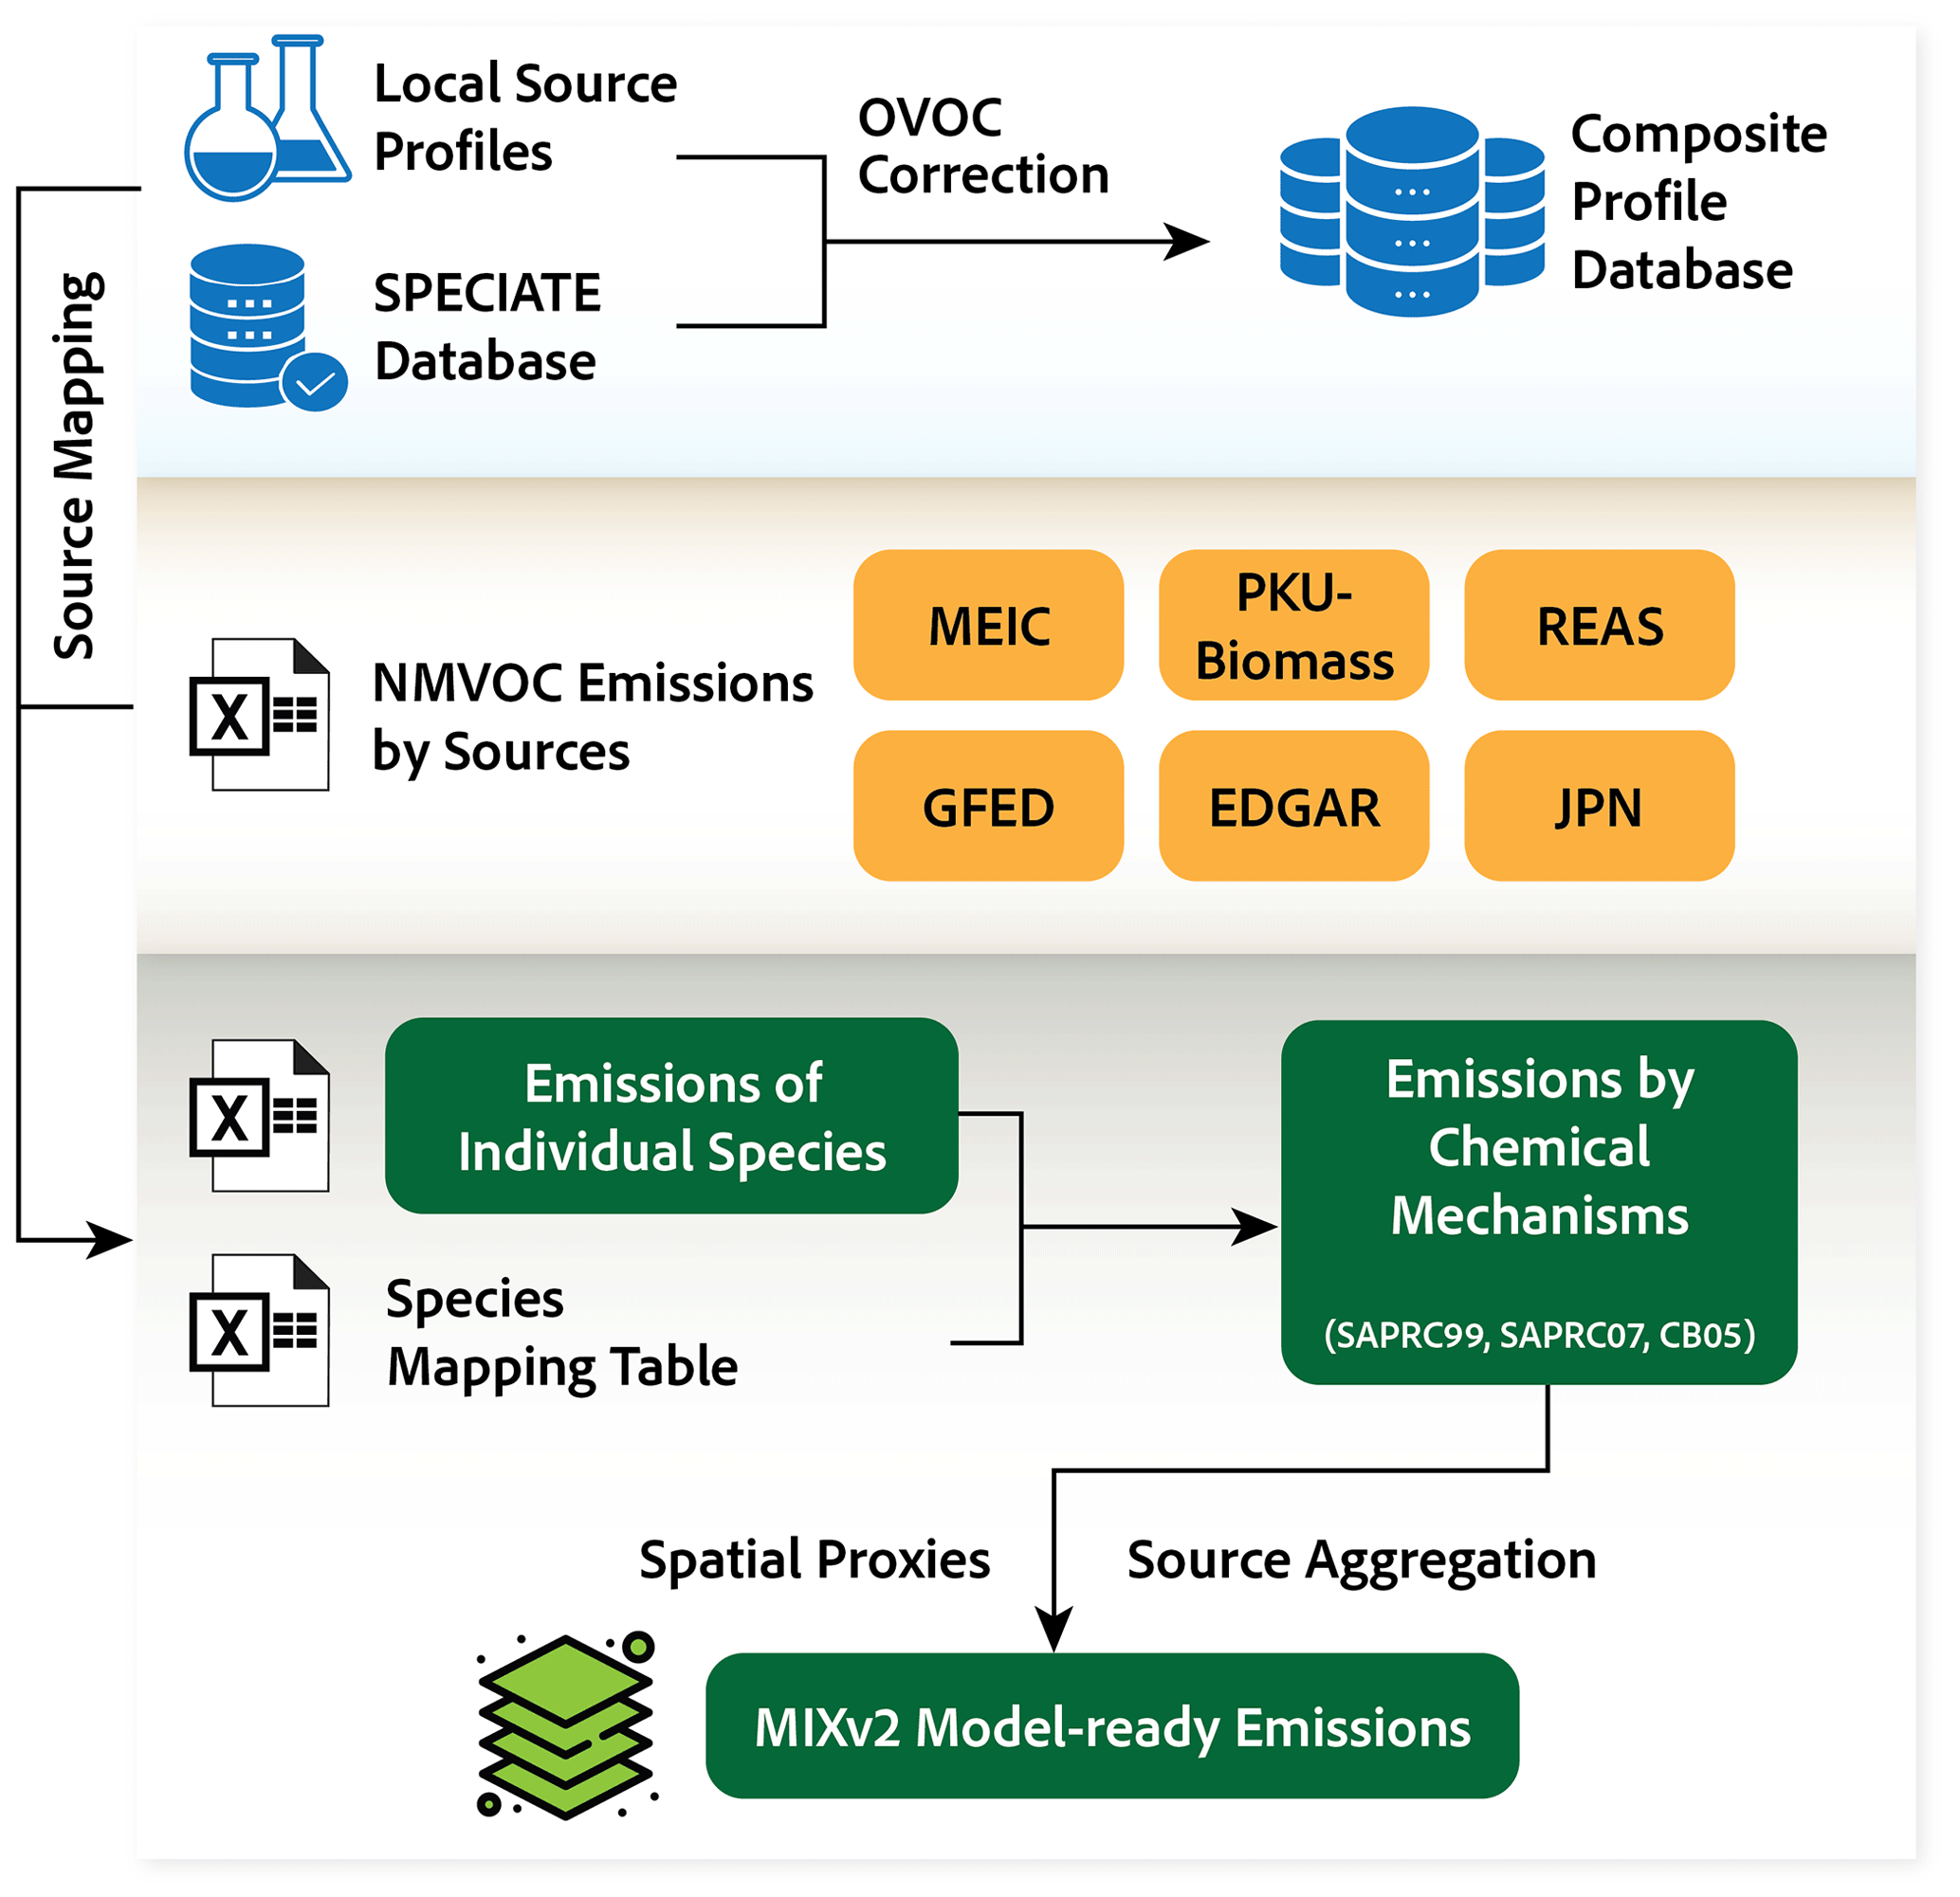
NMVOC speciation has substantial impacts on the model-ready emissions accuracy and performance of chemical transport models (Li et al., 2014). Selection of profiles turns out to be the most important contributor to uncertainties in emissions of individual species. To reduce the uncertainties due to the inaccurate species mapping, Li et al. (2014) developed an explicit assignment approach based on multiple profiles and mechanism-dependent mapping tables.
We processed the gas-phase speciation for NMVOCs following the profile-based mapping procedure, as shown in Fig. 2. The speciation was conducted at a detailed source basis. Firstly, we developed the composite source profile database by combining the US EPA's SPECIATE database v4.5 (https://www.epa.gov/air-emissions-modeling/speciate-2, last access: June 2019) (Simon et al., 2010) and available local measurements (e.g., Akagi et al., 2011; Mo et al., 2016; Xiao et al., 2018; Yuan et al., 2010). The complete list of source profiles used in this work is provided in Table S1. To diminish the uncertainties due to inappropriate sampling and analyses techniques regarding oxygenated volatile organic compounds (OVOCs), we applied the OVOC correction to those incomplete profiles. The detailed method can be found in previous studies (Li et al., 2014). The following sources in particular have significant OVOC emitted that should be addressed: coal combustion in residential stoves (31 %), residential wood and crop residue fuel use (23 %–33 %), and diesel engines (28 %–47 %). Secondly, we assigned the composite profile database to each component inventory to develop emissions of individual species. Lastly, individual species were lumped to three chemical mechanisms (SAPRC99, SAPRC07, CB05) based on the conversion factors derived from mechanism-dependent mapping tables (Carter, 2015).
For the Republic of Korea and Hong Kong, we applied the speciation factor for SAPRC99 and CB05 by sectors developed from the SMOKE-Asia model, which have been used for MIXv1 (Woo et al., 2012). Emissions of SAPRC07 were further developed from SAPRC99 based on Table S2, which applied MEIC speciated results.
2.5 Limitations and uncertainties
As a mosaic inventory, MIXv2 has several limitations when integrating various gridded products into a unified dataset. Firstly, inconsistencies could exist at country boundaries where different datasets were used for the adjacent countries (Janssens-Maenhout et al., 2015), for example, the border between China and India. But limited effects are anticipated here given the small area affected due to the high spatial resolution and the low population density at the border. Secondly, extracting emissions by country from gridded maps may introduce uncertainties, especially for power plants located near the coast. This issue is more important because gridded emissions are developed with higher spatial resolutions than earlier versions. Using an extended country map by assigning extra adjacent grids of “ocean” with the neighboring country can reduce this bias. We also acknowledge the general inconsistency of uncertainty levels between countries where different inventories are used following various data sources and approaches. For air quality simulation purposes, the lack of diurnal variations and vertical distribution is another limitation when applying MIXv2 data directly. Development of Asia-specific temporal and vertical profiles is important to improve the model simulation performance in the future.
Table 3Uncertainties in emission estimates for Asian regions (95 % confidence intervals if not noted; unit: %).
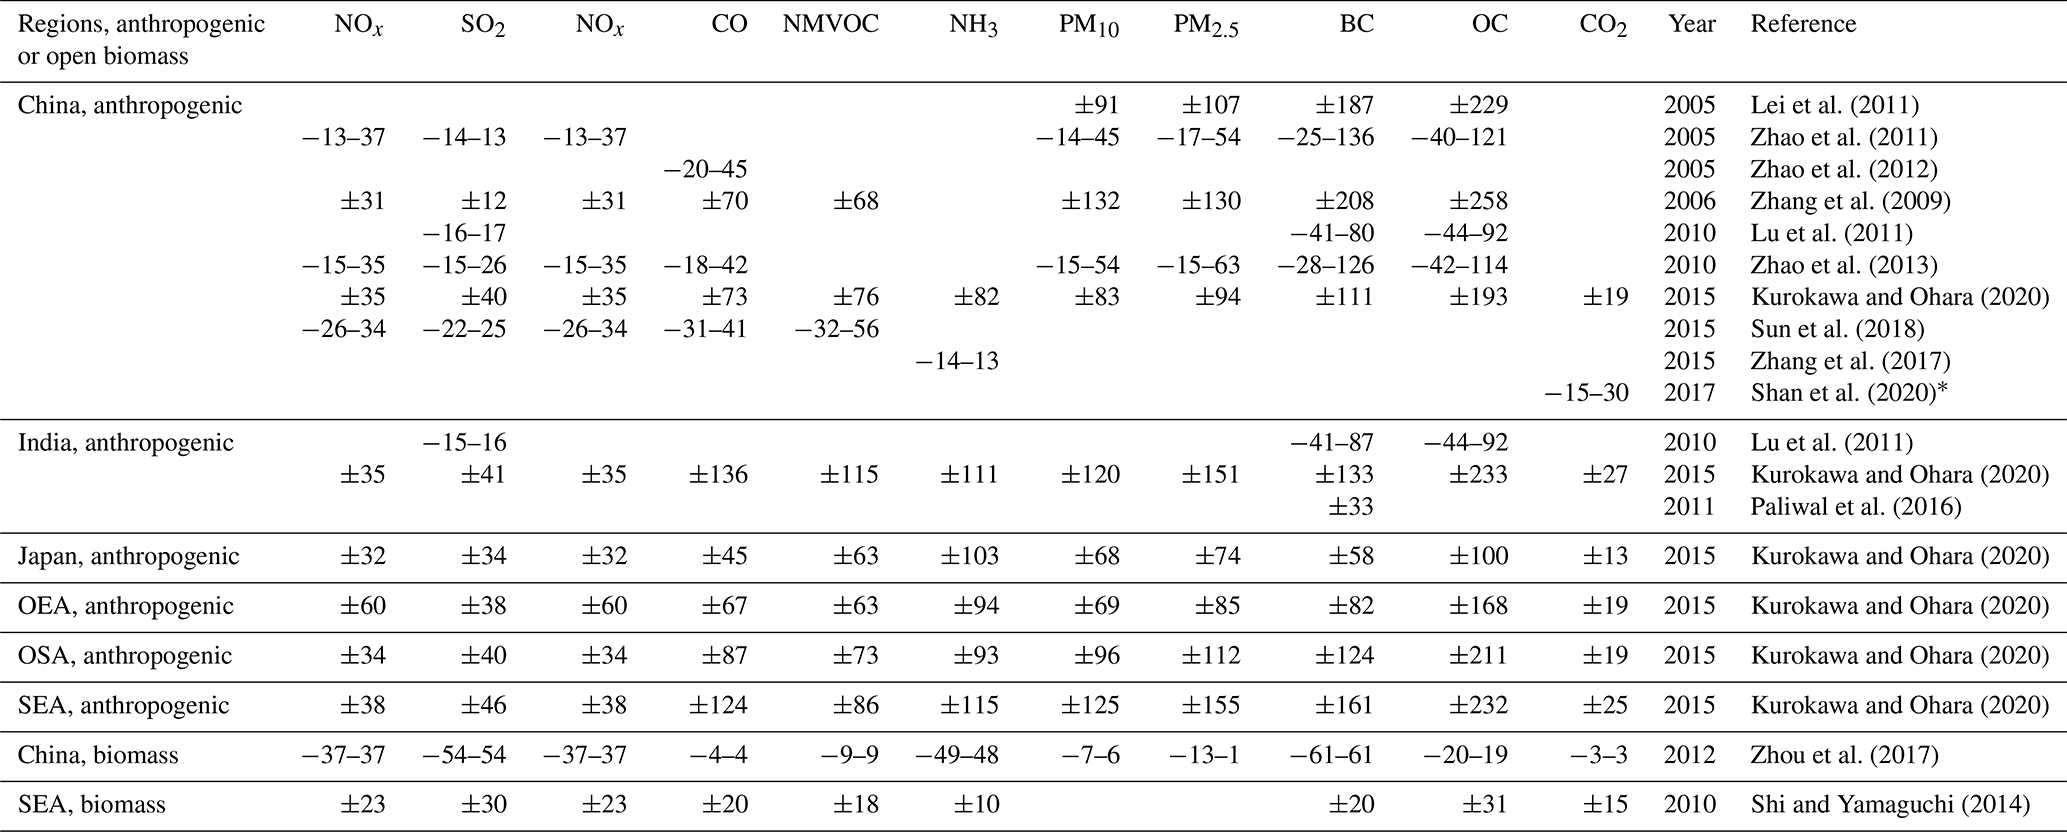
∗ The 97 % confidence interval.
It is always difficult to quantify the uncertainties for a mosaic emission inventory such as MIXv2. The uncertainties for each of the component inventories are discussed in detail in corresponding studies (Kang et al., 2016; Kurokawa and Ohara, 2020; Yin et al., 2019; Zheng et al., 2018). Here we summarized the uncertainty estimation by Asian regions in previous studies in Table 3. The uncertainty ranges are quantified based on propagation of uncertainty (Kurokawa and Ohara, 2020; Lei et al., 2011; Zhang et al., 2009) or thousands of Monte Carlo simulations (Lu et al., 2011; Paliwal et al., 2016; Shan et al., 2020; Shi and Yamaguchi, 2014; Sun et al., 2018; Zhao et al., 2011, 2012, 2013; Zhou et al., 2017).
In regard to anthropogenic sectors, the precision of emission estimates for SO2, NOx and CO2 is higher than that of other pollutants, owing to the minimal uncertainties associated with power plants and large industrial facilities. This is particularly notable in the case of MIXv2, where uncertainties are even lower due to the integration of unit-based power plant information for both China and India. While uncertainties for CO and NMVOC are comparable, they are higher than those for SO2, NOx and CO2 because of substantial emission contributions from biofuel combustion. Emissions for particulate matter (especially BC and OC) tend to be more uncertain compared to trace gases, primarily due to the low data availability of accurate activity rates and emission factors related to residential biofuel combustion. The need for more detailed information at the technology or facility level in regions such as India, OSA and SEA is crucial to narrow down the overall uncertainties in Asia in the future. For open biomass burning, previous investigations have estimated low uncertainty ranges for species like CO, NMVOC and OC, while further analyses are urgently needed. In this work, we conducted uncertainty analyses qualitatively by comparing the MIXv2 estimates with other bottom-up inventories and those derived from satellite retrievals in Sect. 4 (Li et al., 2018). In summary, generally consistent emission estimates and trends over Asia are found based on bottom-up and top-down comparisons in Sect. 4. Discrepancies persist, especially in regions like South Asia and Southeast Asia and among species like BC and NMVOC.
3.1 Asian emissions in 2017
In 2017, MIXv2 estimated emissions of Asia as follows: 41.6 Tg NOx, 33.2 Tg SO2, 258.2 Tg CO, 61.8 Tg NMVOC, 28.3 Tg NH3, 24.0 Tg PM10, 16.7 Tg PM2.5, 2.7 Tg BC, 5.3 Tg OC and 18.0 Pg CO2 for all anthropogenic sources including power, industry, residential, transportation and agriculture. Emissions are summarized by Asian regions, including China, East Asia other than China (OEA), India, South Asia other than India (OSA) and Southeast Asia (SEA), as shown in Tables 4 and S3. China, India and SEA together account for > 90 % of the total Asian emissions. China dominates the emissions (> 50 %) of CO2 (11.3 Pg, 63 %), NOx (22.4 Tg, 54 %), and CO (137.0 Tg, 53 %) and contributes more than 30 % to all other species. The contributions of India are larger than 30 % for SO2 (13.8 Tg, 42 %), NH3 (9.8 Tg, 35 %), BC (0.86 Tg, 32 %), OC (1.7 Tg, 33 %), PM10 (7.2 Tg, 30 %) and PM2.5 (5.0 Tg, 30 %). SEA ranks third for all species, including CO2 (1.8 Pg, 10 %), NOx (6.1 Tg, 15 %), SO2 (5.9 Tg, 18 %), NMVOC (11.9 Tg, 19 %), NH3 (4.8 Tg, 17 %) and ∼ 15 % of aerosol species. OEA's share varies from 1 % (aerosol species) to 8 % (CO2). Emission proportions of OSA are around 11 % for NH3, OC and PM10 and less than 10 % for others.
Table 4Anthropogenic/open biomassa emissions of MIXv2 for Asian countries and regions in 2017.
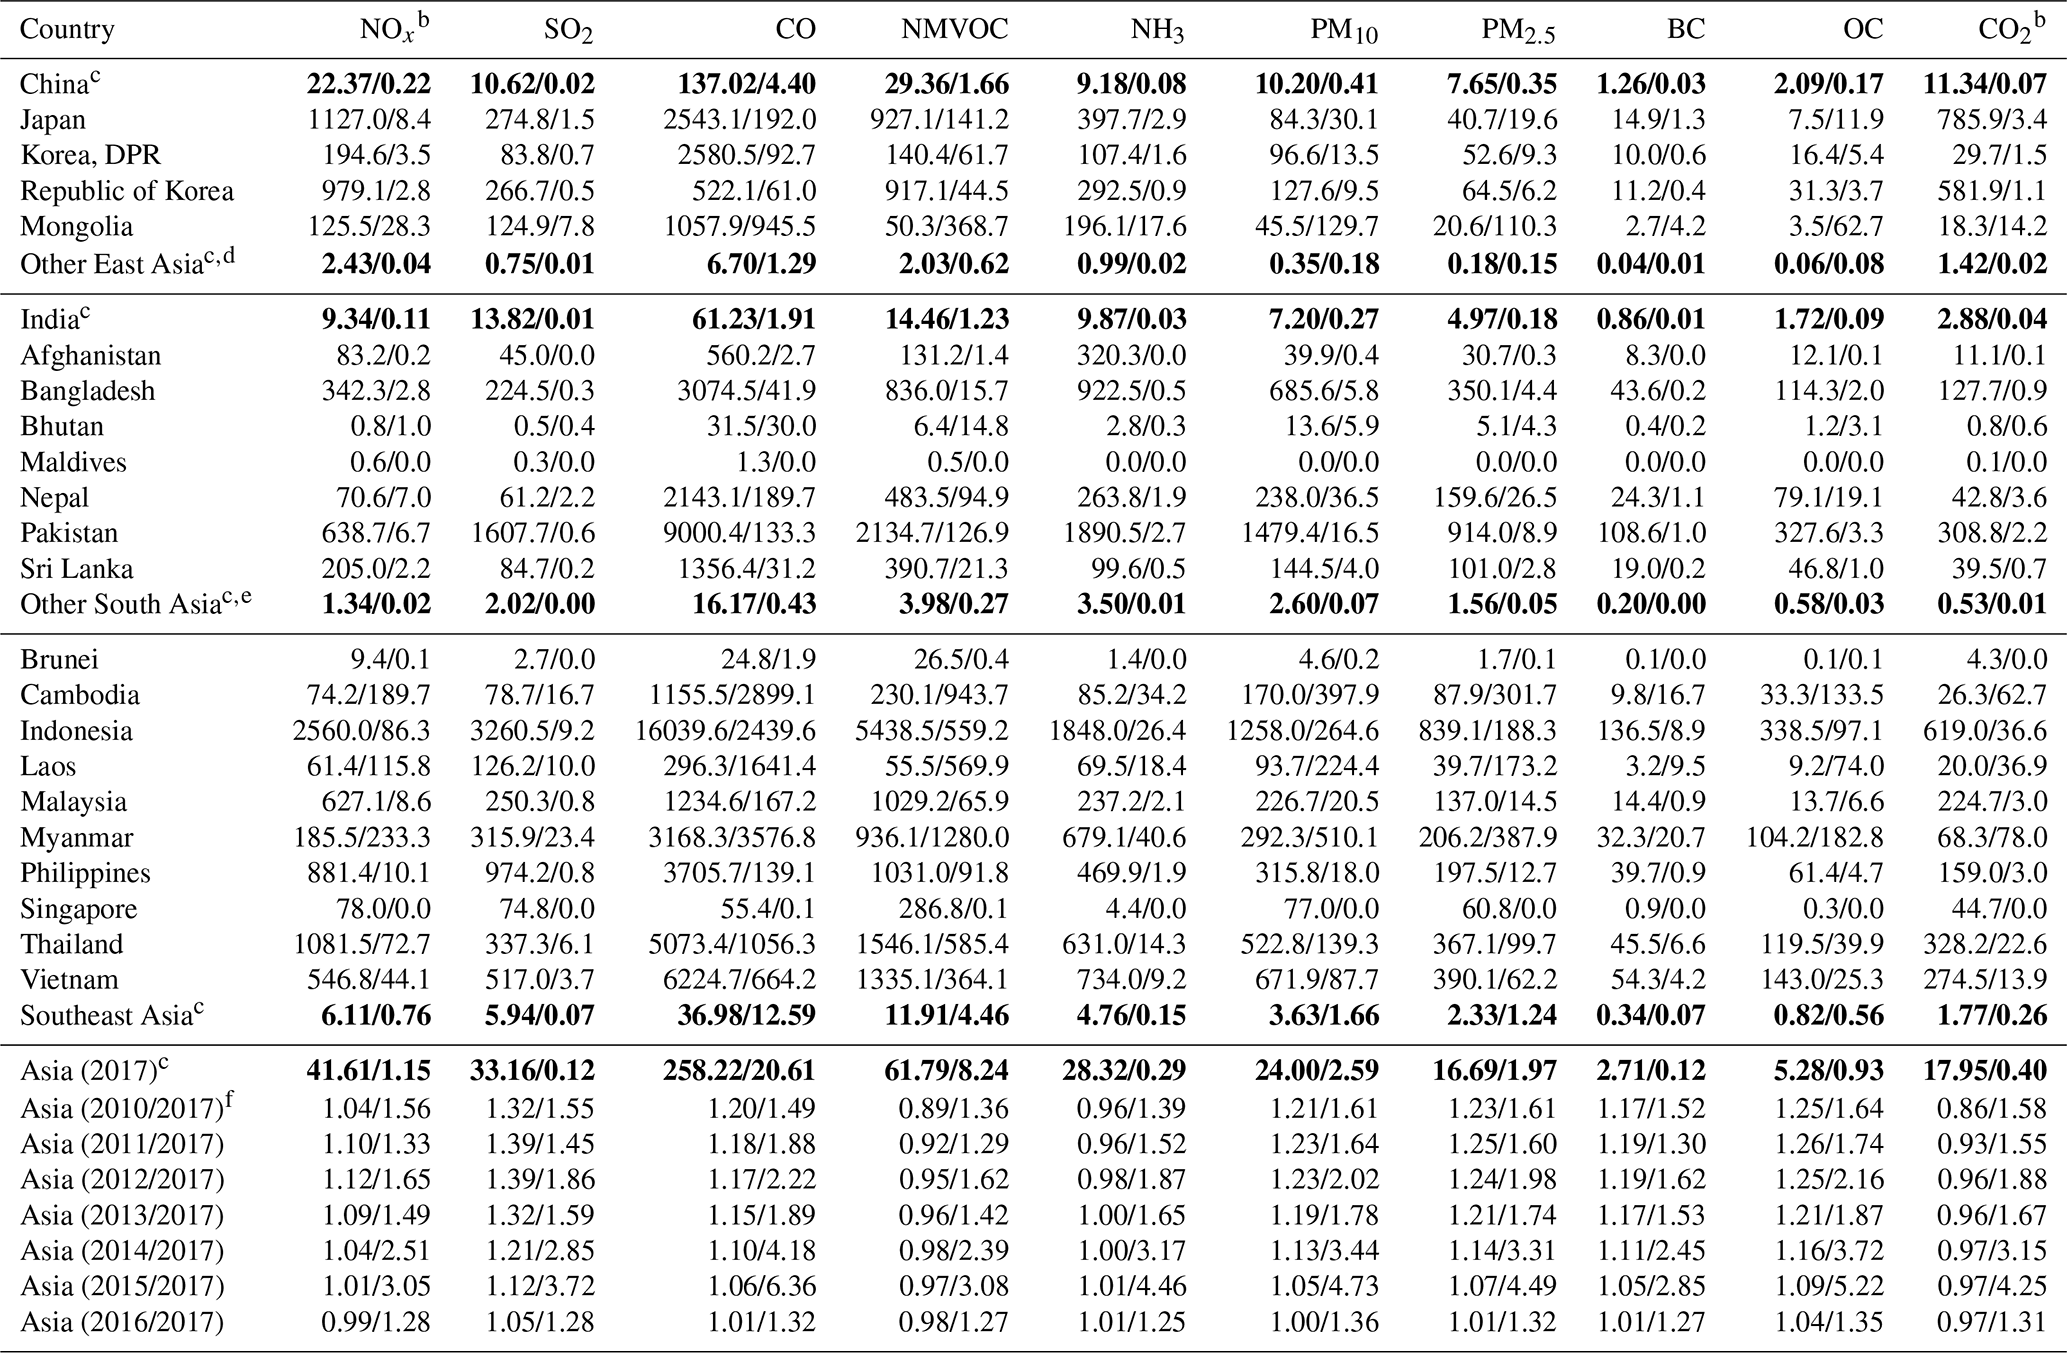
a Anthropogenic includes power, industry, residential, transportation and agriculture. Open biomass represents the “Open Biomass Burning” sector. b Tg yr−1for CO2; Gg yr−1 for other species. c Bold values are with the following units: Pg yr−1 for CO2; Tg yr−1 for other species. d Other East Asia represents East Asia other than China. e Other South Asia represents South Asia other than India. f Asia (year/2017) represents the ratio of emissions (year) to emissions (2017) for all of Asia within the MIXv2 domain. The detailed emissions for 2010–2017 by country and sector are summarized in Table S3.
Sectoral contribution varies among species in Asia according to our estimates. Power plants contribute significantly to SO2 (first contributor, 38 %) and CO2 (second contributor, 33 %). Industry dominates the emissions of CO2 (41 %), NMVOC (44 %), PM2.5 (39 %) and PM10 (47 %). For NOx, transportation accounts for 33 % of the total emissions, followed by industry (24 %) and inland and international shipping (18 %). The residential sector contributes > 38 % of emissions for PM2.5, BC, CO and OC. NH3 is dominated by agriculture (81 %), followed by 13 % from residential.
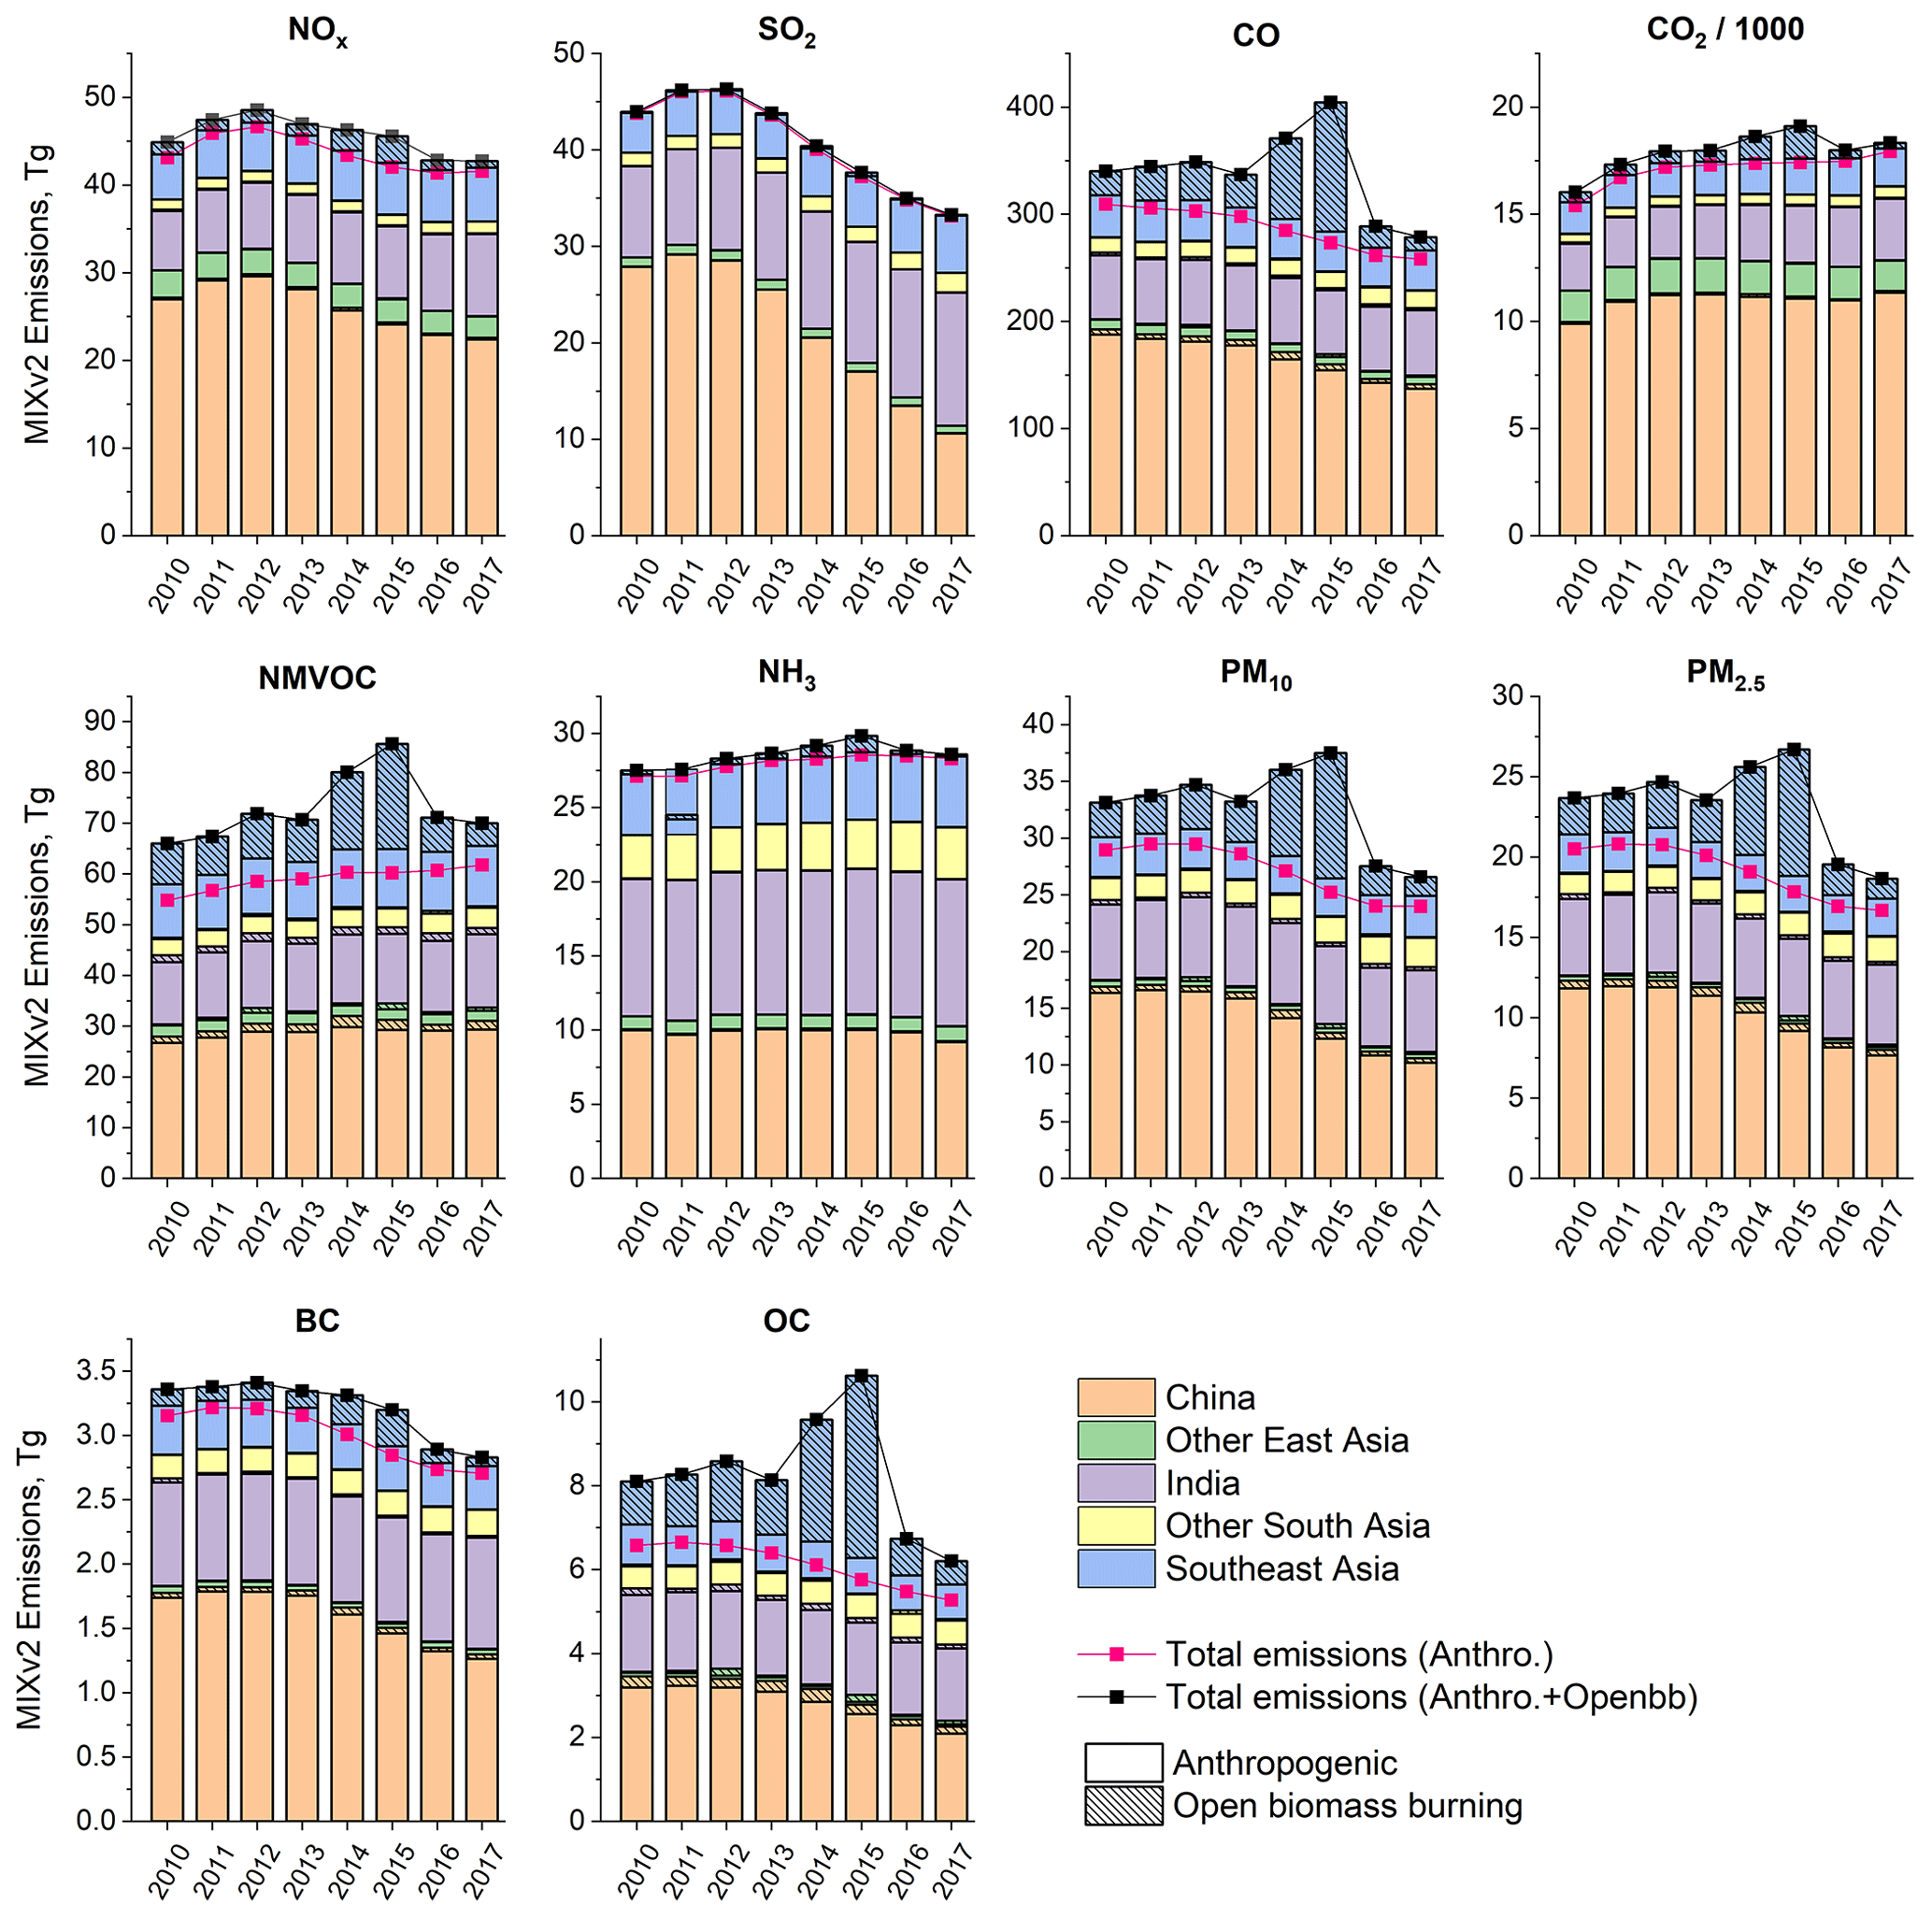
Figure 3Emission changes by countries/regions from 2010–2017. Shares of open biomass burning for each region are shown as shadowed blocks.
Open biomass burning plays a key role in the SEA and OEA emissions budgets, and is a minor contributor for other regions, as shown in Table 4 and Fig. 3. Including the open biomass burning sector increases the emissions of OC, PM2.5, PM10, NMVOC, CO and CO2, by 69 %, 53 %, 46 %, 37 %, 34 % and 15 %, respectively for SEA. Due to the active fire events, Southeast Asia is the largest emission contributor for OC, PM10, PM2.5 and NMVOC in 2014 and 2015. Additionally, OEA has a significant emission increment for NMVOC (30 %), OC (143 %), PM10 (52 %) and PM2.5 (81 %) when taking biomass burning into account. Given the large contributions to ozone and climate change from NMVOC, CO and aerosols, it is important to address the open biomass burning contributions in designing mitigation strategies for these areas.
In a global context, Asia shares out 43 %–56 % of the global anthropogenic emissions in 2017, including 44 % for NOx, 43 % for SO2, 49 % for CO2, 51 % for NH3, 55 % for CO, 50 % for NMVOC and over 50 % for all PM species. Emissions over Asia are derived from MIXv2, and emissions over the rest of the world are estimated by EDGARv6. Figure S1 depicts the emissions trend by Asian regions, the US and OECD-Europe from anthropogenic sources. Asia is playing a more and more important role in global climate change as its CO2 emission fraction has increased by 7 % during 2010–2017. Especially with the general emission reductions in the US and OECD-Europe, India and Southeast Asia are catching up with the emissions of these two developed regions for NOx, SO2 and CO2 and already surpassed their emissions for other species. As of now, the US and OECD-Europe emissions are in general comparable to those of OSA for most air pollutants.
3.2 Emissions evolution from 2010–2017
For anthropogenic sources, driven by stringent air pollution control measures implemented over China and OEA since 2010, Asian emissions have declined rapidly by 24.3 % for SO2, 16.6 % for CO, 17.2 % for PM10, 18.7 % for PM2.5, 14.2 % for BC and 19.8 % for OC according to our estimates. On the contrary, CO2, NMVOC and NH3 still show emissions increasing continuously, with growth rates of 16.5 %, 12.6 % and 4.4 % during 2010–2017, respectively. The emissions for 2010–2017 are summarized in Table S3 and shown in Figs. 3 and 4. As demonstrated in Fig. 4, power, industry, residential and transportation contribute to the rapid emission changes. In contrast to the smoothly changing patterns for anthropogenic, open biomass burning emissions vary from year to year, peaking in 2015 as a result of El Niño (Field et al., 2016). Open-fire activities dominate the SEA emission changes for CO, OC, NMVOC, PM10 and primary PM2.5 (see Fig. 3). Marked reductions are estimated for China, with a concurrent increase over India and Southeast Asia for all species except CO2, NMVOC and NH3 (see Fig. 5). Consequently, air pollutants, including ozone and secondary aerosol precursors of NOx, have shifted southward (Zhang et al., 2016). This changing spatial pattern has been confirmed from observations as described in previous studies (Samset et al., 2019). We illustrate the driving forces of emissions evolution for each species below. Shipping is not included in the following analyses.
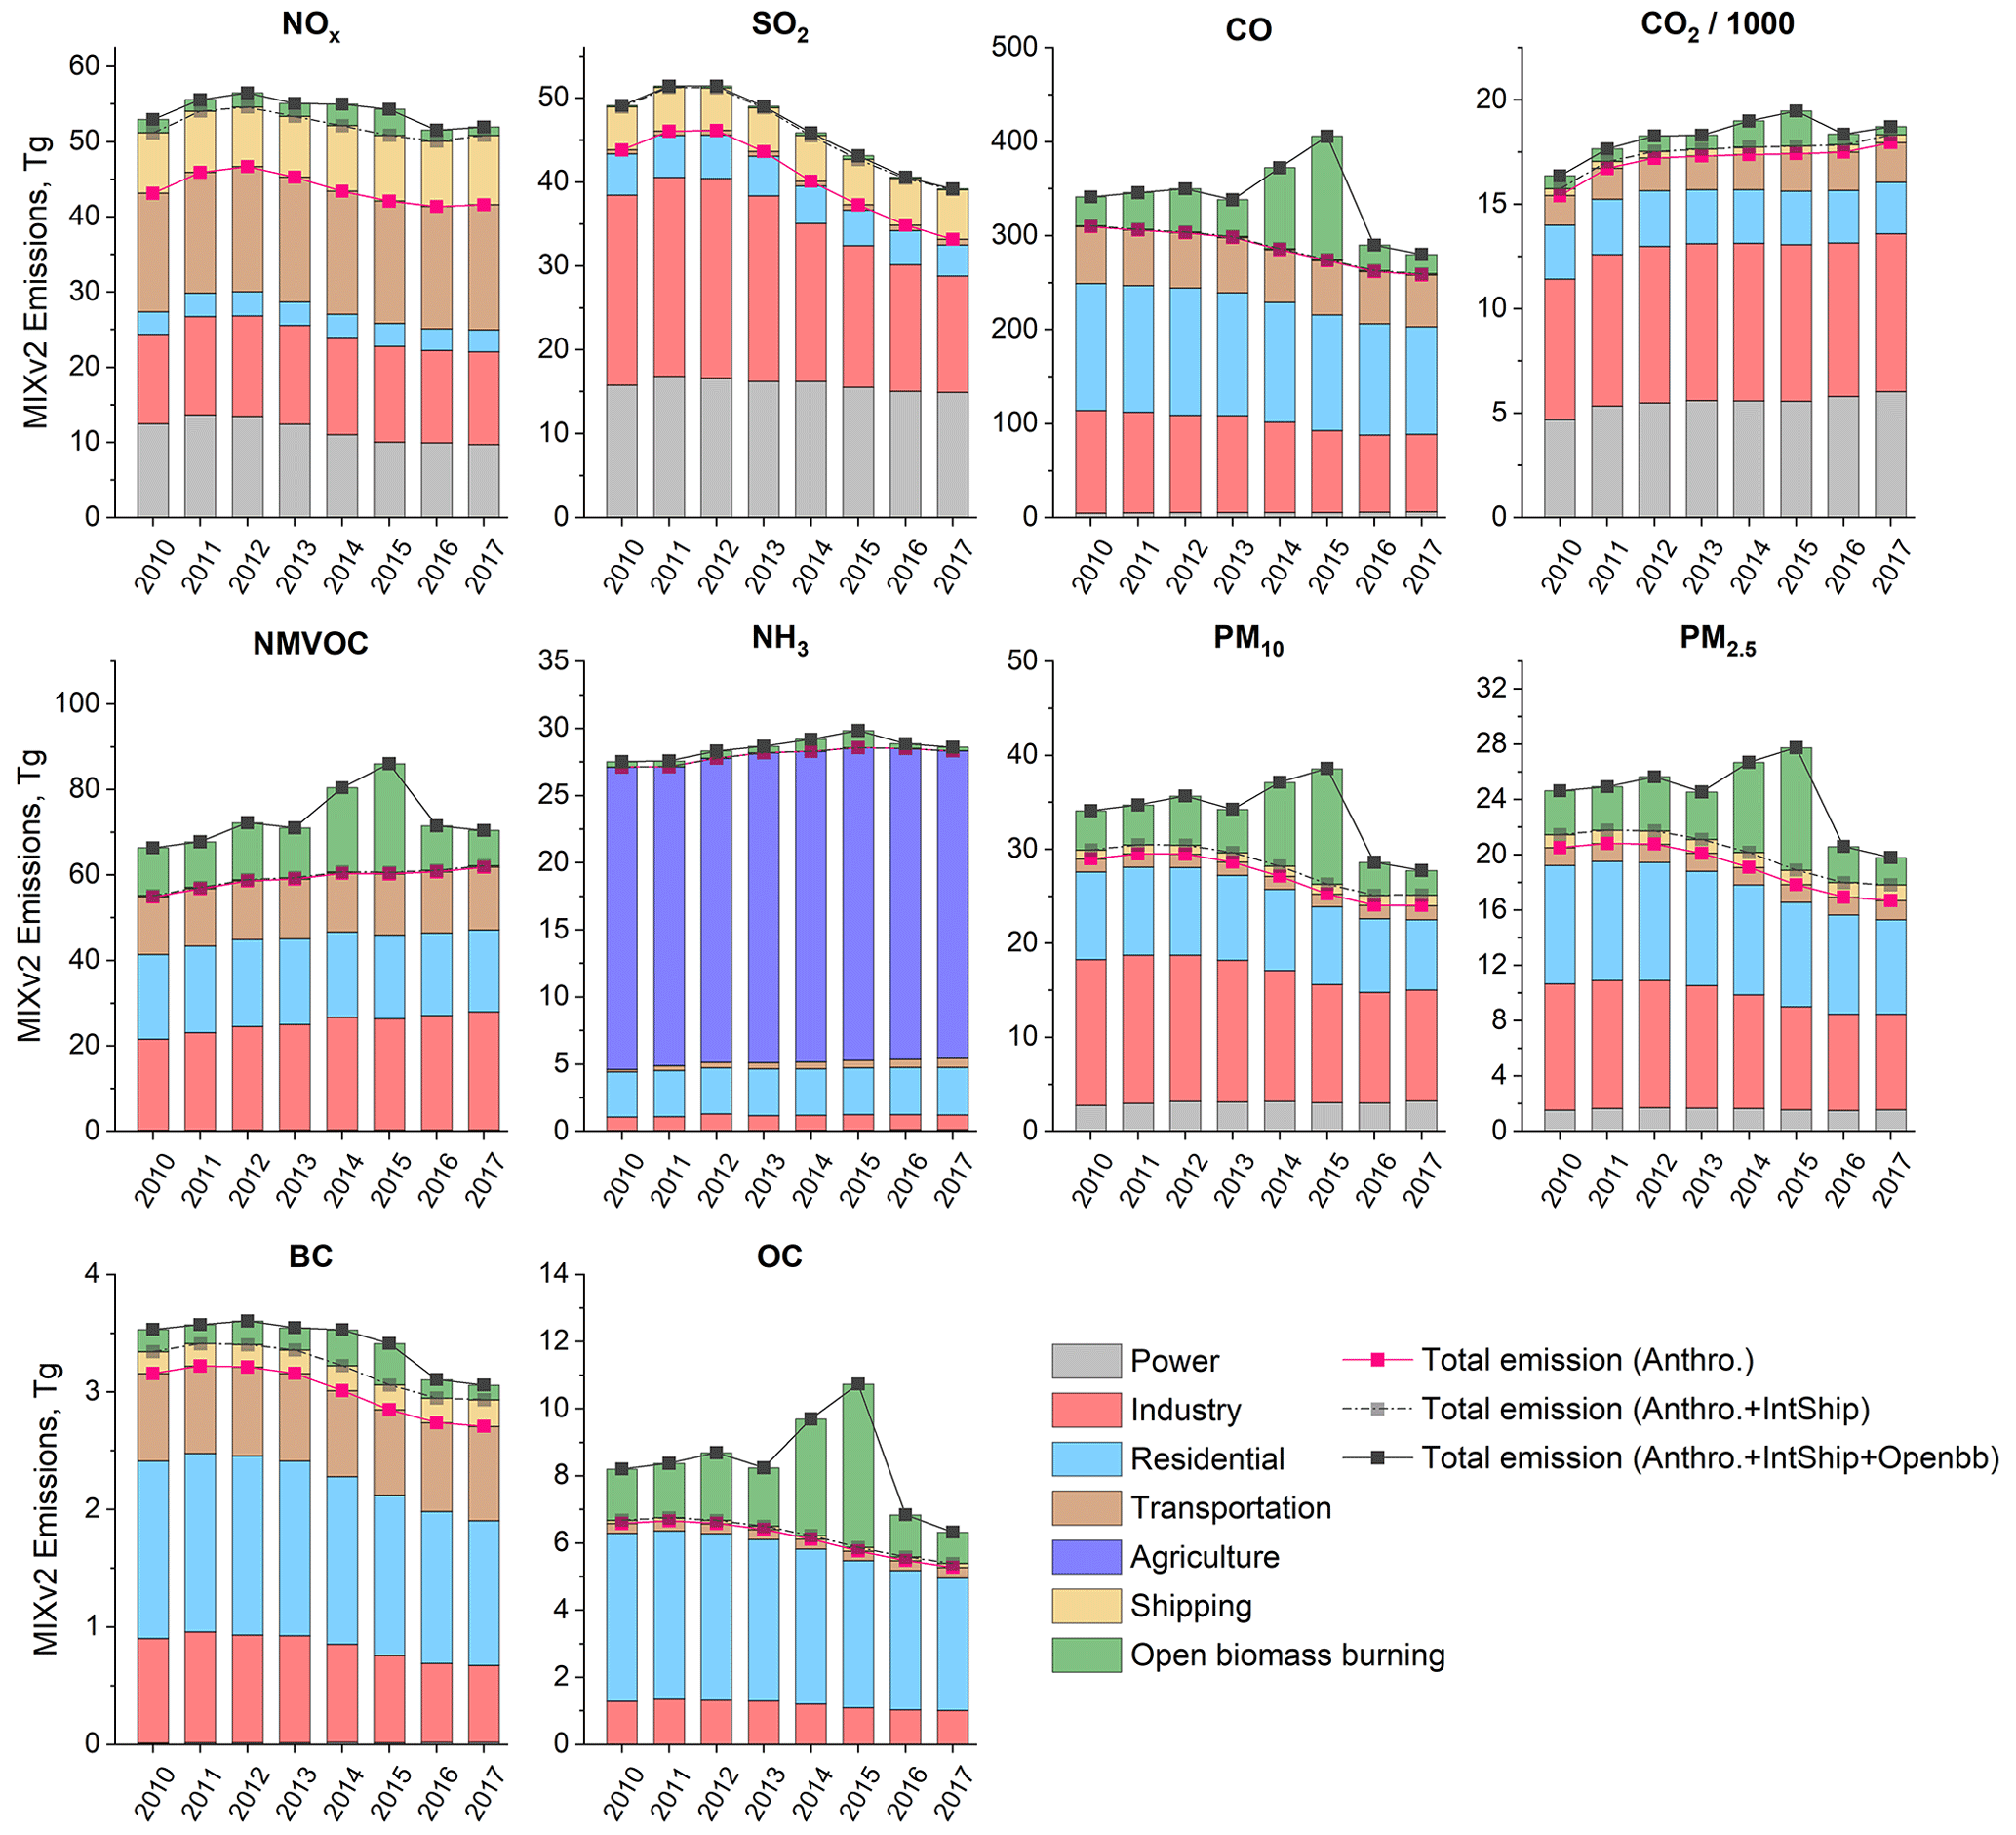
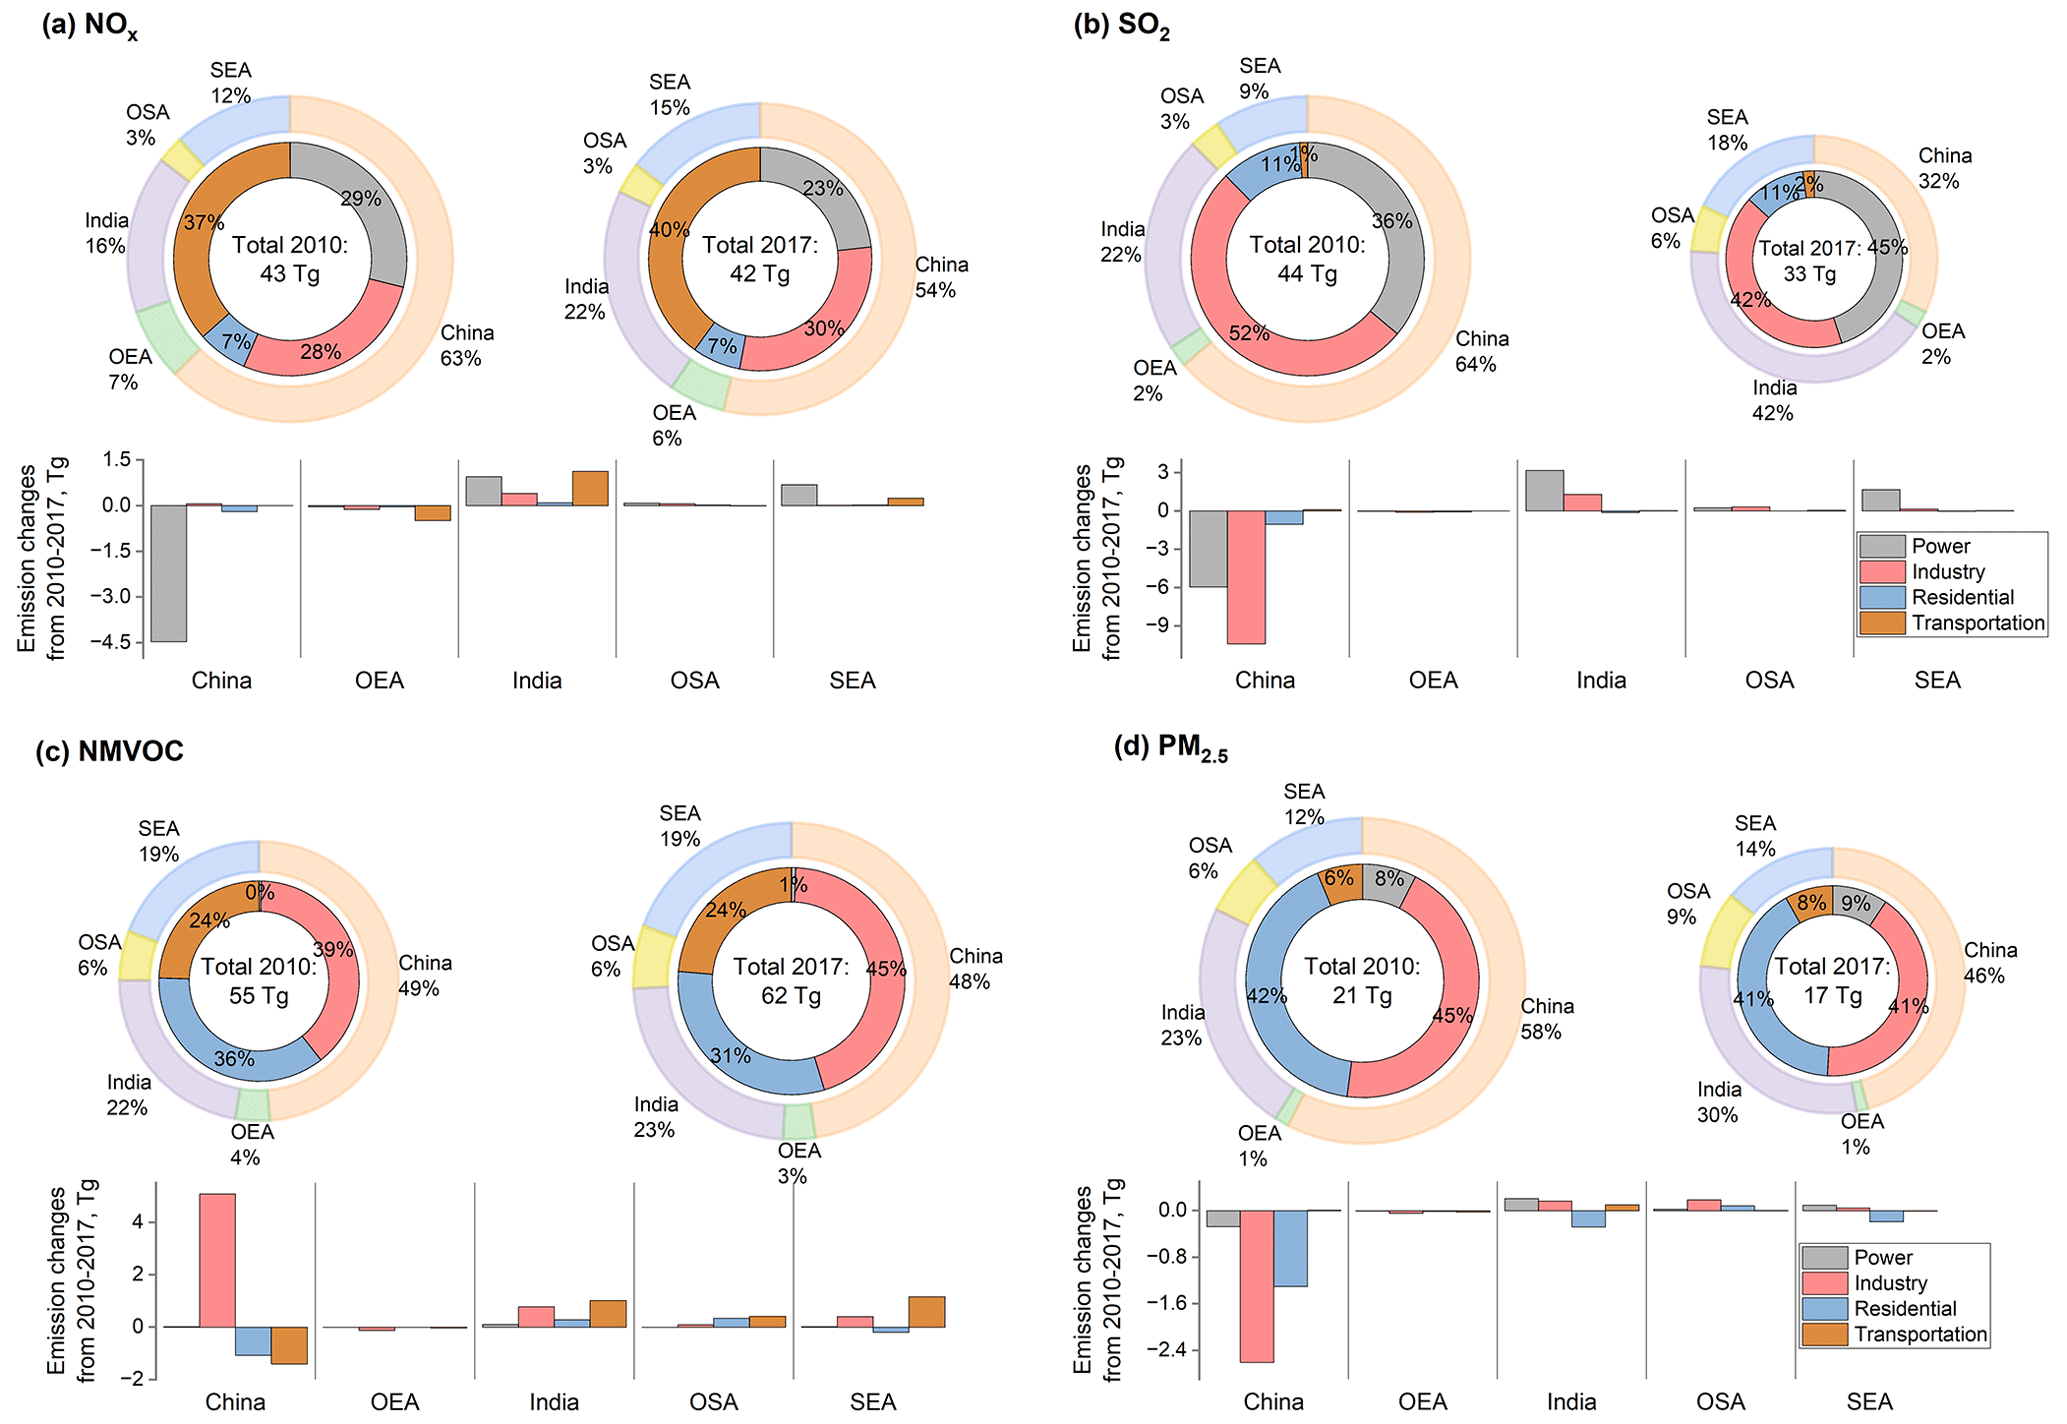
Figure 5Emission changes for anthropogenic sources (power, industry, residential and transportation) by regions and sectors from 2010–2017 for (a) NOx, (b) SO2, (c) NMVOC and (d) PM2.5. The pie sizes are scaled with the total anthropogenic emissions in Asia. The unit for the total emission values in the center is Tg per year. OEA denotes East Asia other than China, OSA represents South Asia other than India and SEA is Southeast Asia.
NOx. NOx emissions show a increasing–decreasing–increasing trend for 2010–2017, with a peak in 2012. This trend is a combination of significant power plant emissions reduction (−22 % from 2010–2017), and emissions increase from industry (+4 %) and transportation (+6 %). As estimated, China's emissions for all anthropogenic sectors dropped by 4.6 Tg (−17 %) from 2010–2017, along with 2.6 Tg (+38 %) emissions growth from India and 0.9 Tg (+19 %) from SEA. As a result, China's contribution decreased from 63 % to 54 %, and the Indian share grew from 16 % to 22 % (anthropogenic, Fig. 5a). In China, power plant emissions dropped by 4.5 Tg (−51 %) because very stringent emission standards are implemented for power plants since 2003, which has continuous substantial impacts on SO2, NOx and particulate matters (Chinese National Standards GB 13223-2003 and 3223-2011) (Zheng et al., 2018). Furthermore, “ultra-low” emission standards were set up by the Chinese government in 2015 to further reduce emissions from coal-fired power plants by 60 % by 2020. OEA shows 21 % emissions decrease because of continuous control measures over industry (−16 %) and transportation (−32 %). Due to insufficient control strategies in India, OSA and SEA, NOx anthropogenic emissions have grown by 38 %, 18 % and 19 %, respectively, mainly driven by power plants and vehicle growth (see Fig. 5a). Open biomass burning has limited effect (∼ 11 %) on NOx emissions over SEA and is neglectable for other regions (< 3 %).
SO2. SO2 emissions rapidly declined from 43.8 to 33.1 Tg during 2010–2017, peaking in 2012. Significant reductions in industrial SO2 emissions (−8.7 Tg, −39 %) lead to the marked total emissions decrease (see Fig. 4). China's emissions dropped by 62 %, partly offset by the concurrent emissions increase of India (+46 %) and Southeast Asia (+41 %). Stringent control measures shutting down small industrial boilers and cleaning larger ones in China are the primary driving forces (Zheng et al., 2018). New emissions standards were set up for coal-fired industrial boilers with tightened SO2 limit values (Zheng et al., 2018). In addition, nationwide phasing out of outdated industrial capacity and small, polluting units has been carried out in China since 2013. Consequently, China's emission fraction decreased from 64 % to 32 %, ranking second in 2017. India's proportion grew from 22 % to 41 %, and nowadays it is the largest SO2 emitter in Asia (anthropogenic; see Fig. 5b). Relatively small emission changes are estimated for OEA (−0.2 Tg) and OSA (+0.6 Tg). Significant emissions growth from power plants drives the total anthropogenic increase by 44 %, and a 41 % rise when considering additional open biomass burning for SEA.
CO. Anthropogenic CO shows moderate emissions reduction (−16 %) since 2010, driven by the clean-air actions implemented in China covering industry (−38 % changes), residential (−20 %) and transportation (−22 %) sources. Based on the index decomposition analysis, the improvements in combustion efficiency and oxygen blast furnace gas recycling in industrial boilers are the largest contributors to the emission reductions in China (Zheng et al., 2018). Replacing polluted fuel (biofuel, coal) with cleaner fuels (natural gas, electricity) is the primary driving force in the residential sector. Despite the rapid vehicle growth, which would typically yield a CO increase, pollution control measures reduced the net CO emission factors by fleet turnover with cleaner models replacing the older, more polluted vehicles in the market. OEA shows emission reductions in industry (−37 %), residential (−22 %) and transportation (−28 %) sources. Residential fuel combustion decreases by 20 % and 11 % for SEA and India, respectively, having a canceling effect on the total emissions growth for these two regions. Open biomass burning accounts for 25 %–77 % of CO emissions in SEA, which drives the total emissions reduction by 19 % in 2017 compared to 2010. Additionally, the climate anomaly due to El Niño in 2015 leads to the rapid CO emissions drop from 2015 to 2016 in SEA.
CO2. Driven by economic and population growth, anthropogenic CO2 emissions show a rapid increasing trend for China (15 %), India (32 %), OSA (32 %) and SEA (21 %). We found slight emission decreases for OEA (−2 %). Power, industry and transportation grew by 28 %, 12 % and 35 %, respectively, driving the total emissions increase continuously. In contrast, we estimate a 5 % CO2 emission reduction from the residential sector, attributed to reduced fuel combustion. Notable emissions have increased for sectors apart from residential for India (increasing rates varying between 39 %–57 %), OSA (43 %–56 %) and SEA (9 %–48 %). Fractions by region are stable during the studied period, with 62 % contribution from China, 8 % from OEA, 16 % from India, 3 % from OSA and 11 % from SEA (see Fig. 3). Open biomass burning curbs the total emission growth in SEA from +21 % to +5 %.
NMVOC. Differing from the decreasing emission trend for NOx, SO2 and CO, NMVOC increases by 13 % for anthropogenic sources and 6 % for all sources with open biomass burning. In China, the industrial sector (+5.1 Tg, +35 %) is the major reason for the emissions growth, and industrial solvent use (e.g., architecture paint use, wood paint use) is the largest contributor. The share of solvent use rapidly rises from 28 % in 2010 to 42 % in 2017. In addition, oil production, distribution and refineries, and chemical production lead to a corresponding emissions increase by 44 % (M. Li et al., 2019). Due to fuel transfer in residential stoves and the effective pollution control measures for on-road vehicles, China shows 18 % and 22 % emissions decreases, respectively, slowing down the increasing trend. Industry and transportation drive the anthropogenic emissions in India and SEA growing by 18 % and 13 %, respectively (see Fig. 5c). In SEA, 64 % of the total emissions are contributed by open biomass burning in 2015. Compared to 2010, 2017 total emissions decreased by 12 % in SEA, attributed to biomass burning. NMVOCs are speciated into three chemical mechanisms following the source-profile-based methodology (see Sect. 2.4). We analyzed the speciation results in Sect. 3.5.

Figure 6Monthly variations of emissions in Asia by sectors for 2017. For agriculture, only NH3 emissions are estimated.
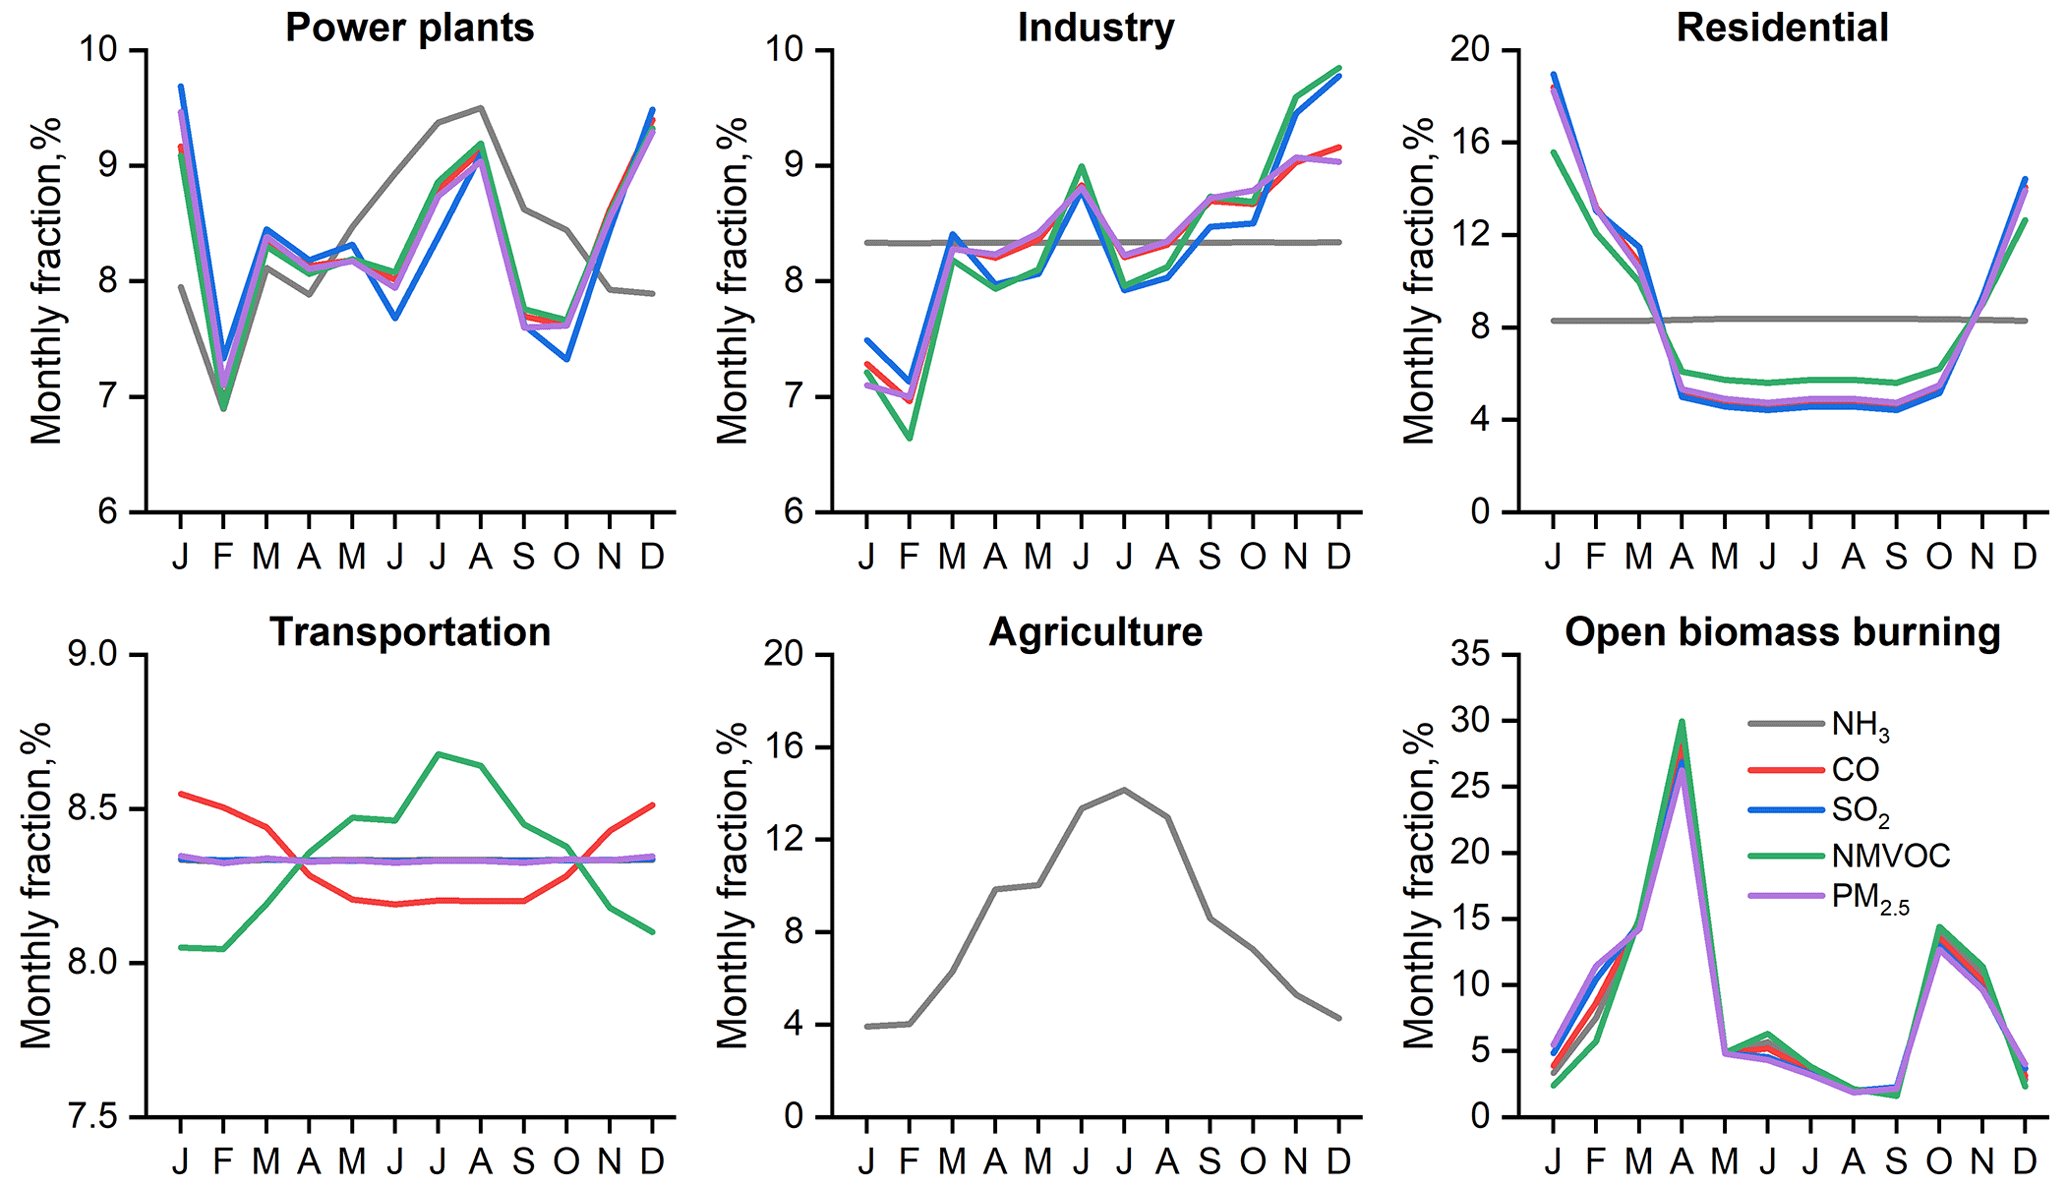
Figure 7Monthly variations in emissions in Asian regions in 2017 for (a) CO (solid lines) and SO2 (short, dashed lines) and (b) NMVOC (solid lines) and PM2.5 (short, dashed lines). For each month, the dominant sector is labeled by circle color. Circle area is scaled based on the emission fraction of the dominant sector for each month. Both anthropogenic and open biomass burning are included.
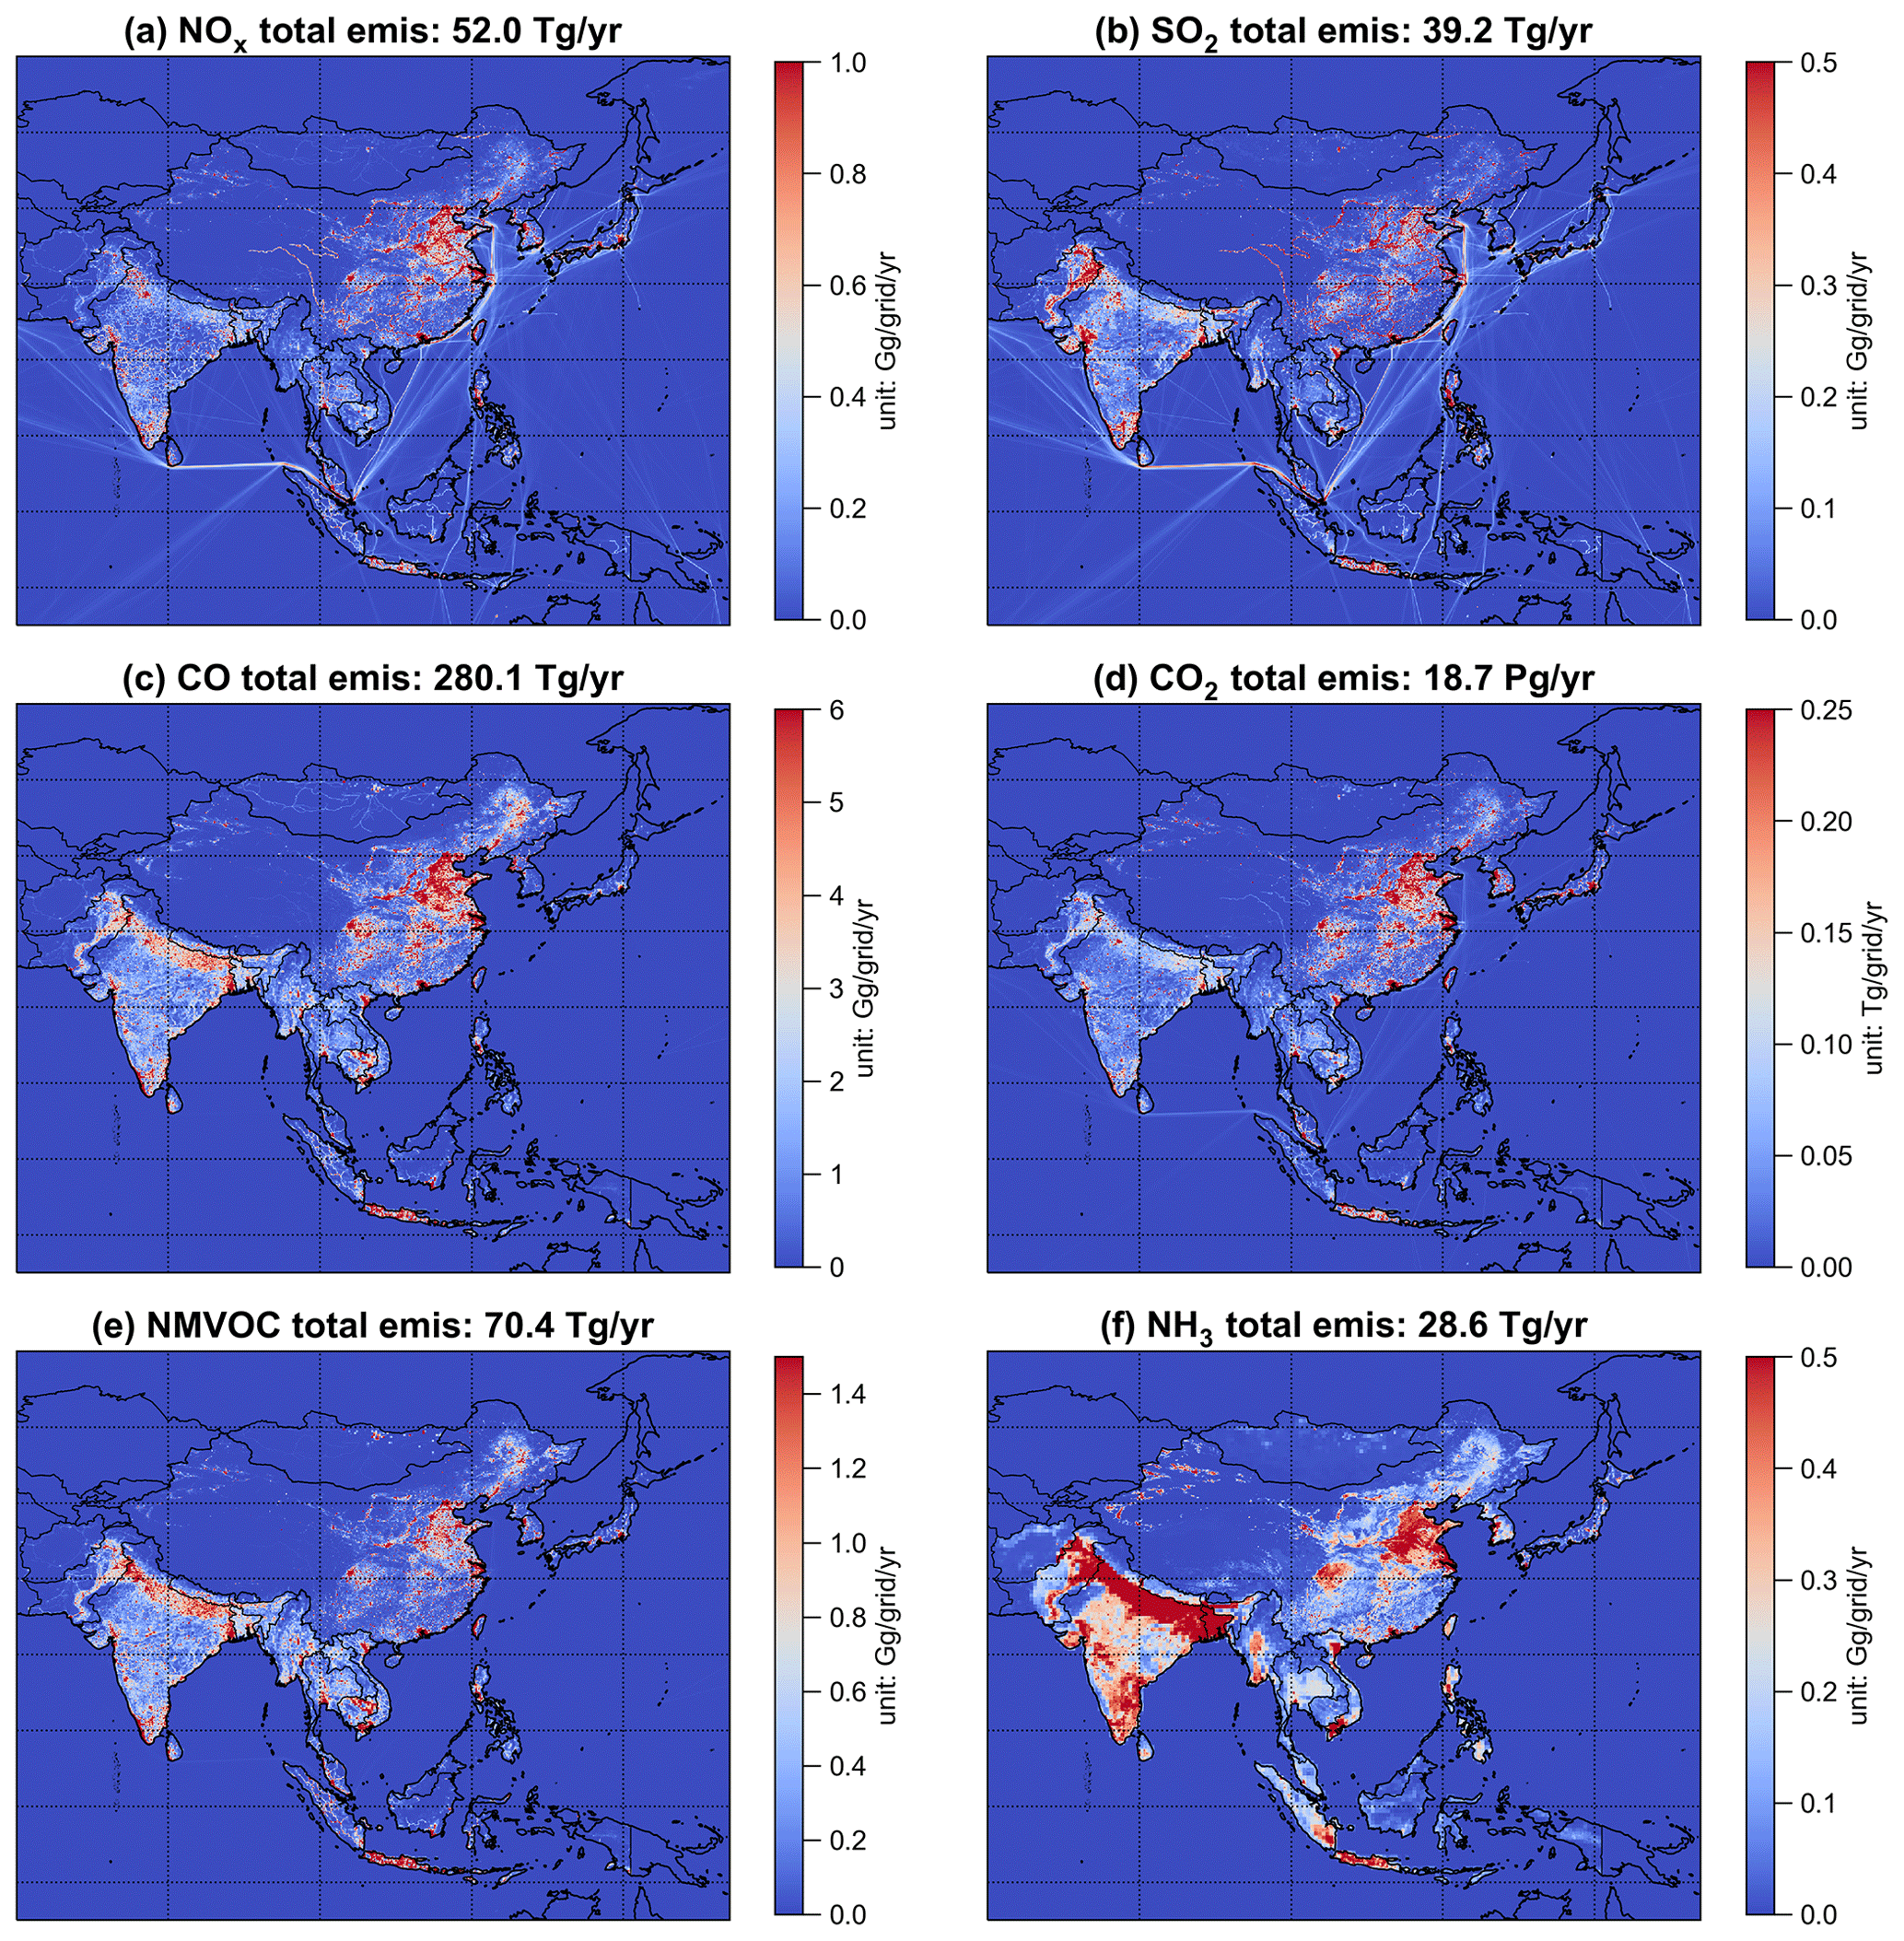
Figure 8Spatial distribution of emissions in MIXv2 in 2017 for gaseous species.
NH3. As estimated by MIXv2, NH3 emissions are generally flat, with slight increases (+4 %) over Asia due to the lack of targeted control measures. Over 80 % of the total emissions are contributed by fertilizer application and livestock manure. Transportation emissions in 2017 are 2.8 times greater than those in 2010 due to vehicle growth, which can play a key role for urban air quality. India is the largest contributor (35 %), followed by China (32 %) and SEA (17 %) (see Fig. 3). India and OSA emissions show monotonic 7 % and 20 % increases, respectively. According to our estimates, China decreases by 8 %, reflecting the agricultural activity rate changes. Limited effects are estimated from open fires over NH3 emissions budget, peaking at 19 % of the total in 2015 for SEA.
Particulate Matter (PM). PM emissions are estimated to have decreased in Asia: −4.9 Tg PM10 (−17 %), −3.8 Tg PM2.5 (−19 %), −0.45 Tg BC (−14 %) and −1.3 Tg OC (−20 %) for anthropogenic sources and −6.5 Tg PM10 (−20 %), −5.0 Tg PM2.5 (−21 %), −0.51 Tg BC (−15 %) and −1.9 Tg OC (−23 %) after including open biomass burning. Industrial and residential sectors are the primary driving forces of the emissions reduction. In China, the strengthened particulates standard for all emission-intensive industrial activities, including iron- and steel-making, cement, brick, coke, glass, chemicals, and coal boilers have driven the technology renewal and the phasing out of outdated, highly polluting small facilities (Zheng et al., 2018). Pollution control measures reduced power plant emissions by ∼ 30 % for PM10, PM2.5 and BC and counterbalanced the transportation emissions despite vehicle ownership increasing by 270 % in 7 years. Other East Asia shows significant anthropogenic emissions reduction for all PM species: −32 % for PM10, −33 % for PM2.5, −27 % for BC and −31 % for OC. Flat trends are estimated in India for all PM species (±8 %). Reduction in biofuel use led to the residential emission reduction of PM in India and SEA. Increasing industrial activities led to 24 %–35 % anthropogenic emissions growth for PM10 and PM2.5 in OSA. As a result, China's emission fractions are shrinking, with growing contributions from India and OSA (see Fig. 5d). Taking PM2.5 as an example, the emissions shares among Asian regions have changed significantly between 2010 and 2017: from 58 % to 46 % for China, 23 % to 30 % for India, and 12 % to 14 % for SEA (anthropogenic, Fig. 5d). Open biomass burning dominates the SEA emissions changes between 2010–2017: −19 % for PM10, −24 % for PM2.5, −20 % for BC and −30 % for OC.
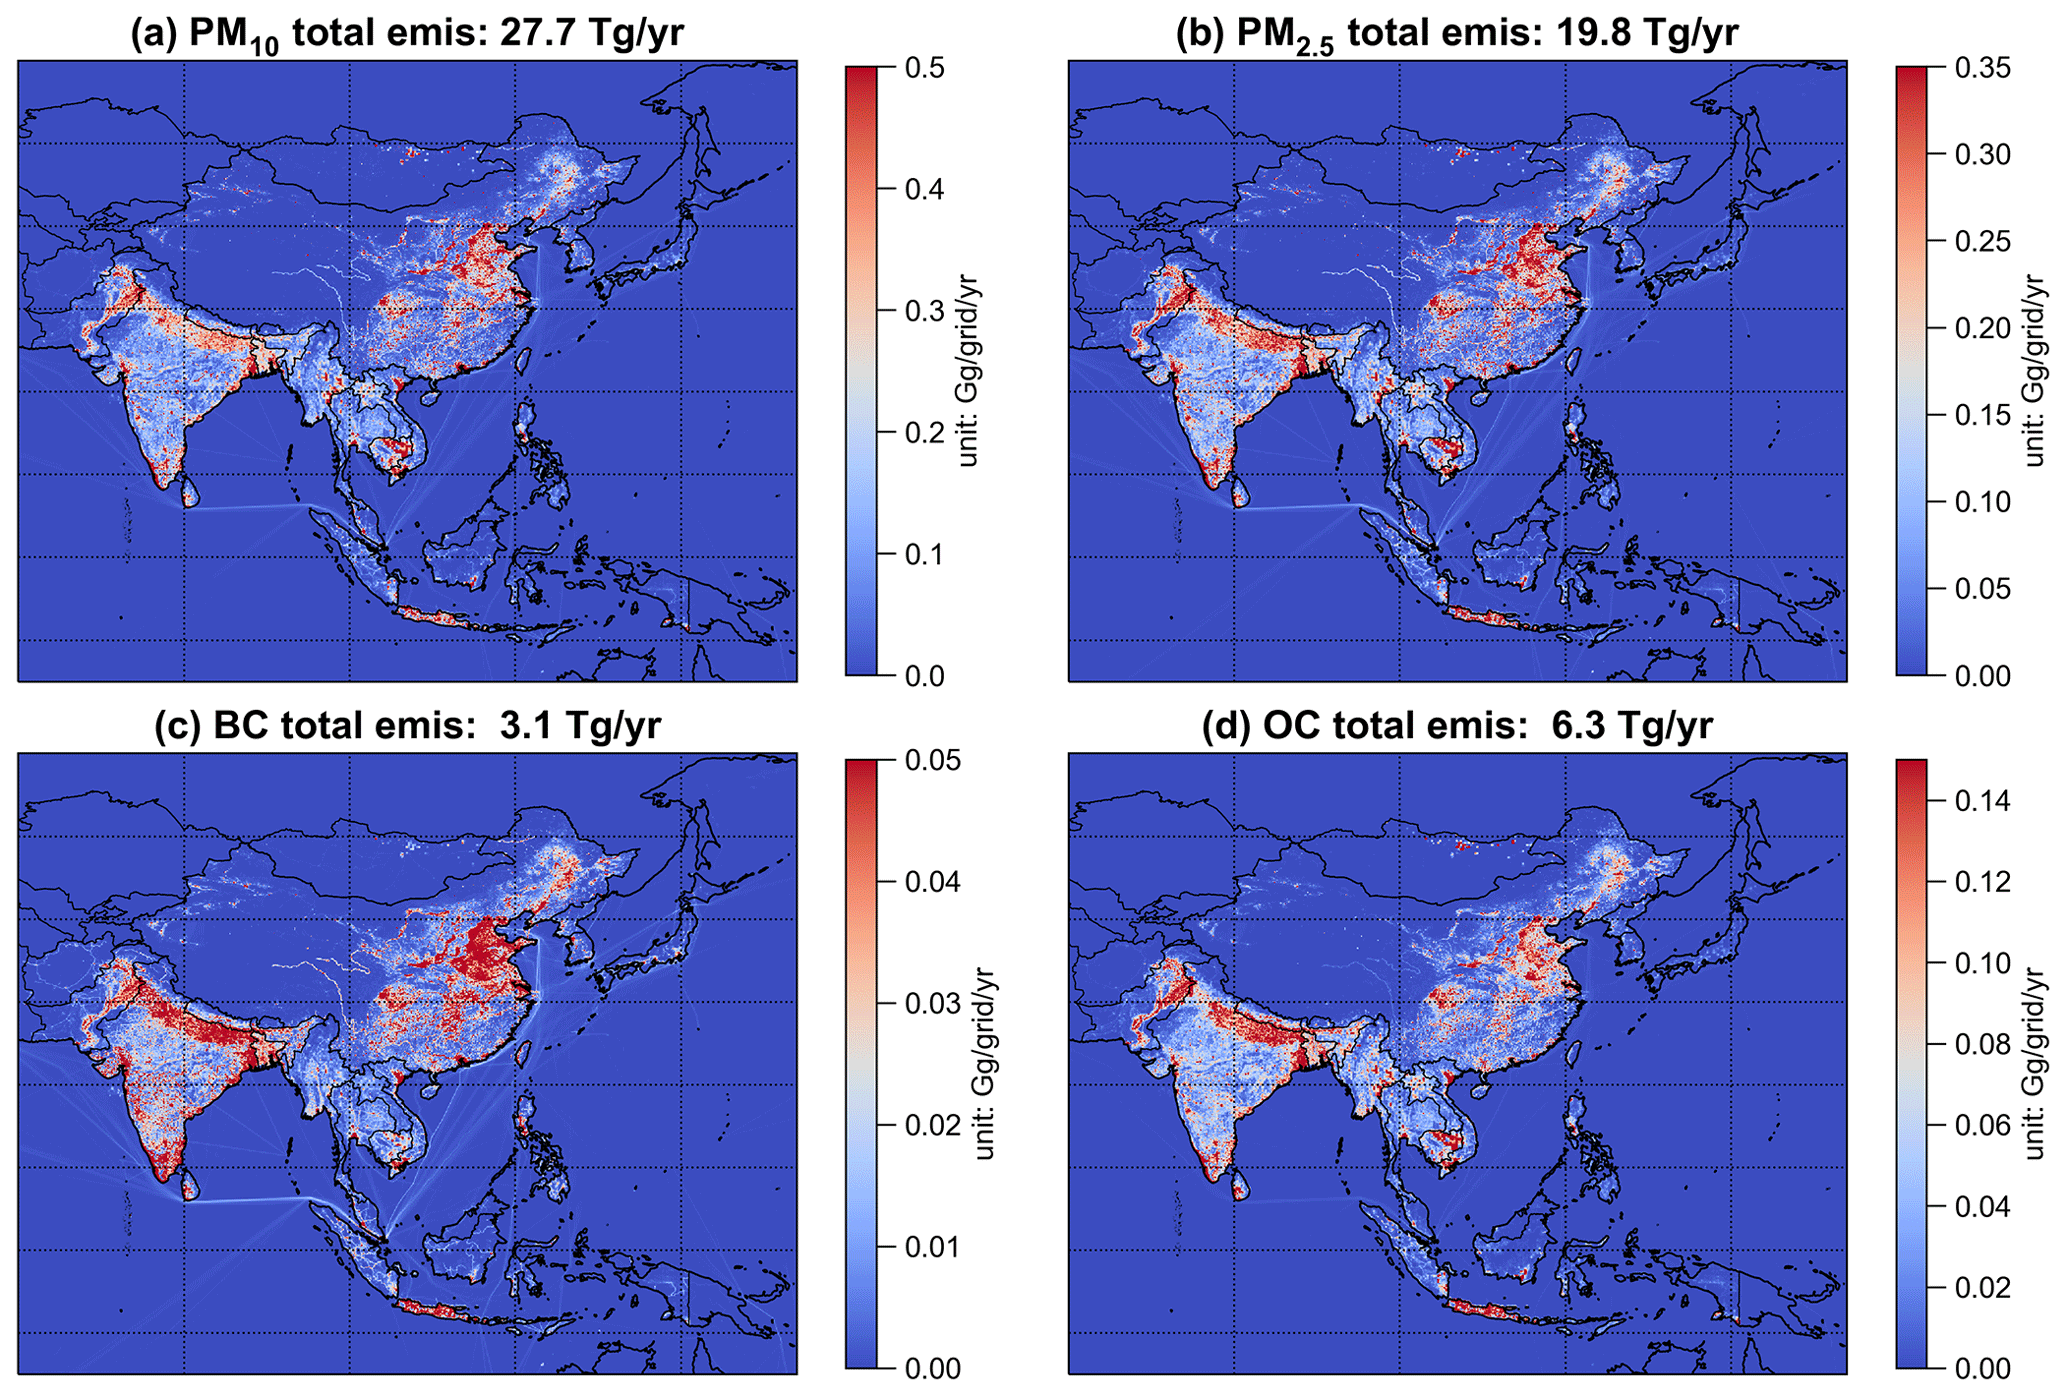
Figure 9Spatial distribution of emissions in MIXv2 in 2017 for PM species.
3.3 Seasonality
Monthly variations of emissions, which are highly sector dependent, are estimated in MIXv2. Within the same sector, similar monthly emission variations are found among different species as they are mainly driven by activity rates (see Fig. 6) (M. Li et al., 2017b). Figures 6 and 7 illustrate the emission fractions by sectors, and the dominant sector (classified by circle color) for each month for CO, SO2, NMVOC and PM2.5 by regions in 2017, including both anthropogenic and open biomass burning. Contribution of the “dominant sector” is scaled to the circle area. Large circles represent the significant role of the dominant sector and small ones (near 17 %) indicate the balanced contribution from six sectors. The monthly emissions patterns show large disparities varying with regions. Notable variations are estimated for emissions of China, OEA and SEA. The residential sector of China is the largest contributor in winter for CO and PM2.5, leading to the “valley” curves. Industrial emissions show relatively high fractions in the second half of the year aiming to achieve the annual production goal, which dominate the seasonal patterns of SO2, CO, NMVOC and PM2.5 for most of the months. The emissions peaks in summer for OEA and March for SEA are attributed to significant in-field biomass burning activities. Indian and OSA emissions show relatively small monthly variations, compared to other Asian regions. This pattern is attributed to the predominant role of the residential sector in the monthly emissions for the investigated species (as illustrated in Fig. 7). The minimal seasonal variations in surface temperature within the tropical climate of India and OSA contribute to the overall stability in monthly residential emission patterns. Thus, it is important to take both anthropogenic and open biomass sectors into account in seasonality analyses given their dominant roles varying by months, such as model evaluations based on ground, satellite, and aircraft measurements.
3.4 Spatial distribution
Gridded emissions at 0.1 × 0.1° were developed in our inventory. Power plant emissions in China and India are developed on a unit basis and assigned with exact geophysical locations. For other sources, emissions are allocated to grids based on spatial proxies, such as road map, population and gross domestic product (GDP). The gridded MODIS fire product with high spatial resolution (up to 1 km) is the essential dataset for open biomass burning emission estimation. Figures 8 and 9 depict the spatial distribution of both CO2 and air pollutants over Asia in 2017, showing the distinct patterns of point source, roads and city clusters. Emission intensities of hot spots over the Indo-Gangetic Plain, spanning northern Pakistan, northern India and Bangladesh are comparable to those of northern China and Indonesia, especially for NH3, NMVOC, BC and OC. Clear shipping routes can be seen for NOx, SO2, CO2 and PM species.
Emission reductions in East Asia highlight the importance of air pollution control in Southern Asia. We show the emission changes by latitude bands from 2010 to 2017 for ozone precursors (NOx, NMVOC, CO) and primary PM2.5 in Figs. 10 and S2 (featuring open biomass burning). Largest reductions are estimated between 35–40° N for NOx (−25 %), CO (−32 %) and PM2.5 (−35 %) because of China's effective emission control strategies. On the other hand, NOx anthropogenic emissions have increased by 15 % over 10–0° S (Southeast Asia) and +27 % over 10–20° N (driven by India). Open biomass burning enlarged the emission amplitude for 15–0° S (Southeast Asia), while it had limited effect on the trends over other latitude bands (see Fig. S2). To conclude, NOx has shifted southward in Asia. NMVOC emissions show a generally increasing trend over all latitude bands (+5 %–+38 %, anthropogenic). Differently, CO and primary PM2.5 show general emissions reduction since 2010 except over 15–10° S and 10–20° N. These latitudinal shifts are of particular importance for the global tropospheric ozone budget as ozone precursors emitted at low latitudes are more efficient at producing ozone than if the same quantity of emissions is released at high latitudes (Zhang et al., 2016, 2021).
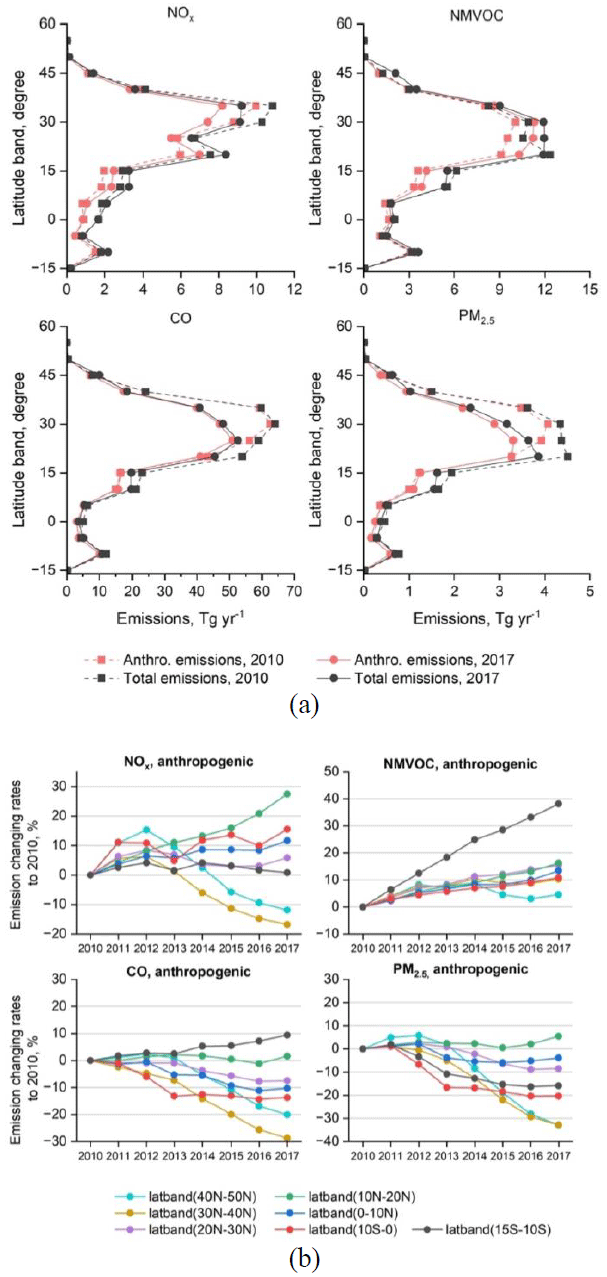
Figure 10Emissions in 2010 and 2017 (a) and anthropogenic emission changes from 2010 to 2017 (b) by latitude bands for NOx, NMVOC, CO and PM2.5. The changing patterns of total emissions by latitude (anthropogenic + open biomass burning) are shown in Fig. S2.
3.5 Speciated NMVOC emissions
As one of the key precursors of ozone and secondary organic aerosols (SOAs), NMVOCs gain more and more attention because of the emission increase due to relatively loose targeted control measures. As estimated in MIXv2, Asian emissions have increased by 13 % for anthropogenic sources and 6 % with additional open biomass burning. We speciated the total NMVOC to three chemical mechanisms, SARPC99, SAPRC07 and CB05, following the profile-based approach (Sect. 2.5). Emission changes during 2010–2017 by chemical groups are shown in Fig. 11. Alkanes, alkenes and aromatics comprise 78 % of the total emissions on a mole basis in 2017. Driven by the growing activities in industry, emissions of alkanes and aromatics increased by ∼ 20 % within 7 years, according to our estimates. Alkenes and alkynes show a stable trend, reflecting the combined results of emission reduction in residential and growth in the industry and transportation sectors. For OVOCs, especially aldehydes, emissions decreased by 10 % since 2010 due to reduced residential fuel combustion. Open biomass burning plays a role over other OVOC (OVOCs other than aldehydes and ketones) emission changes. India, Southeast Asia and China are the largest contributors to the total Asian budget, with varying sector distributions and driving forces by chemical groups.
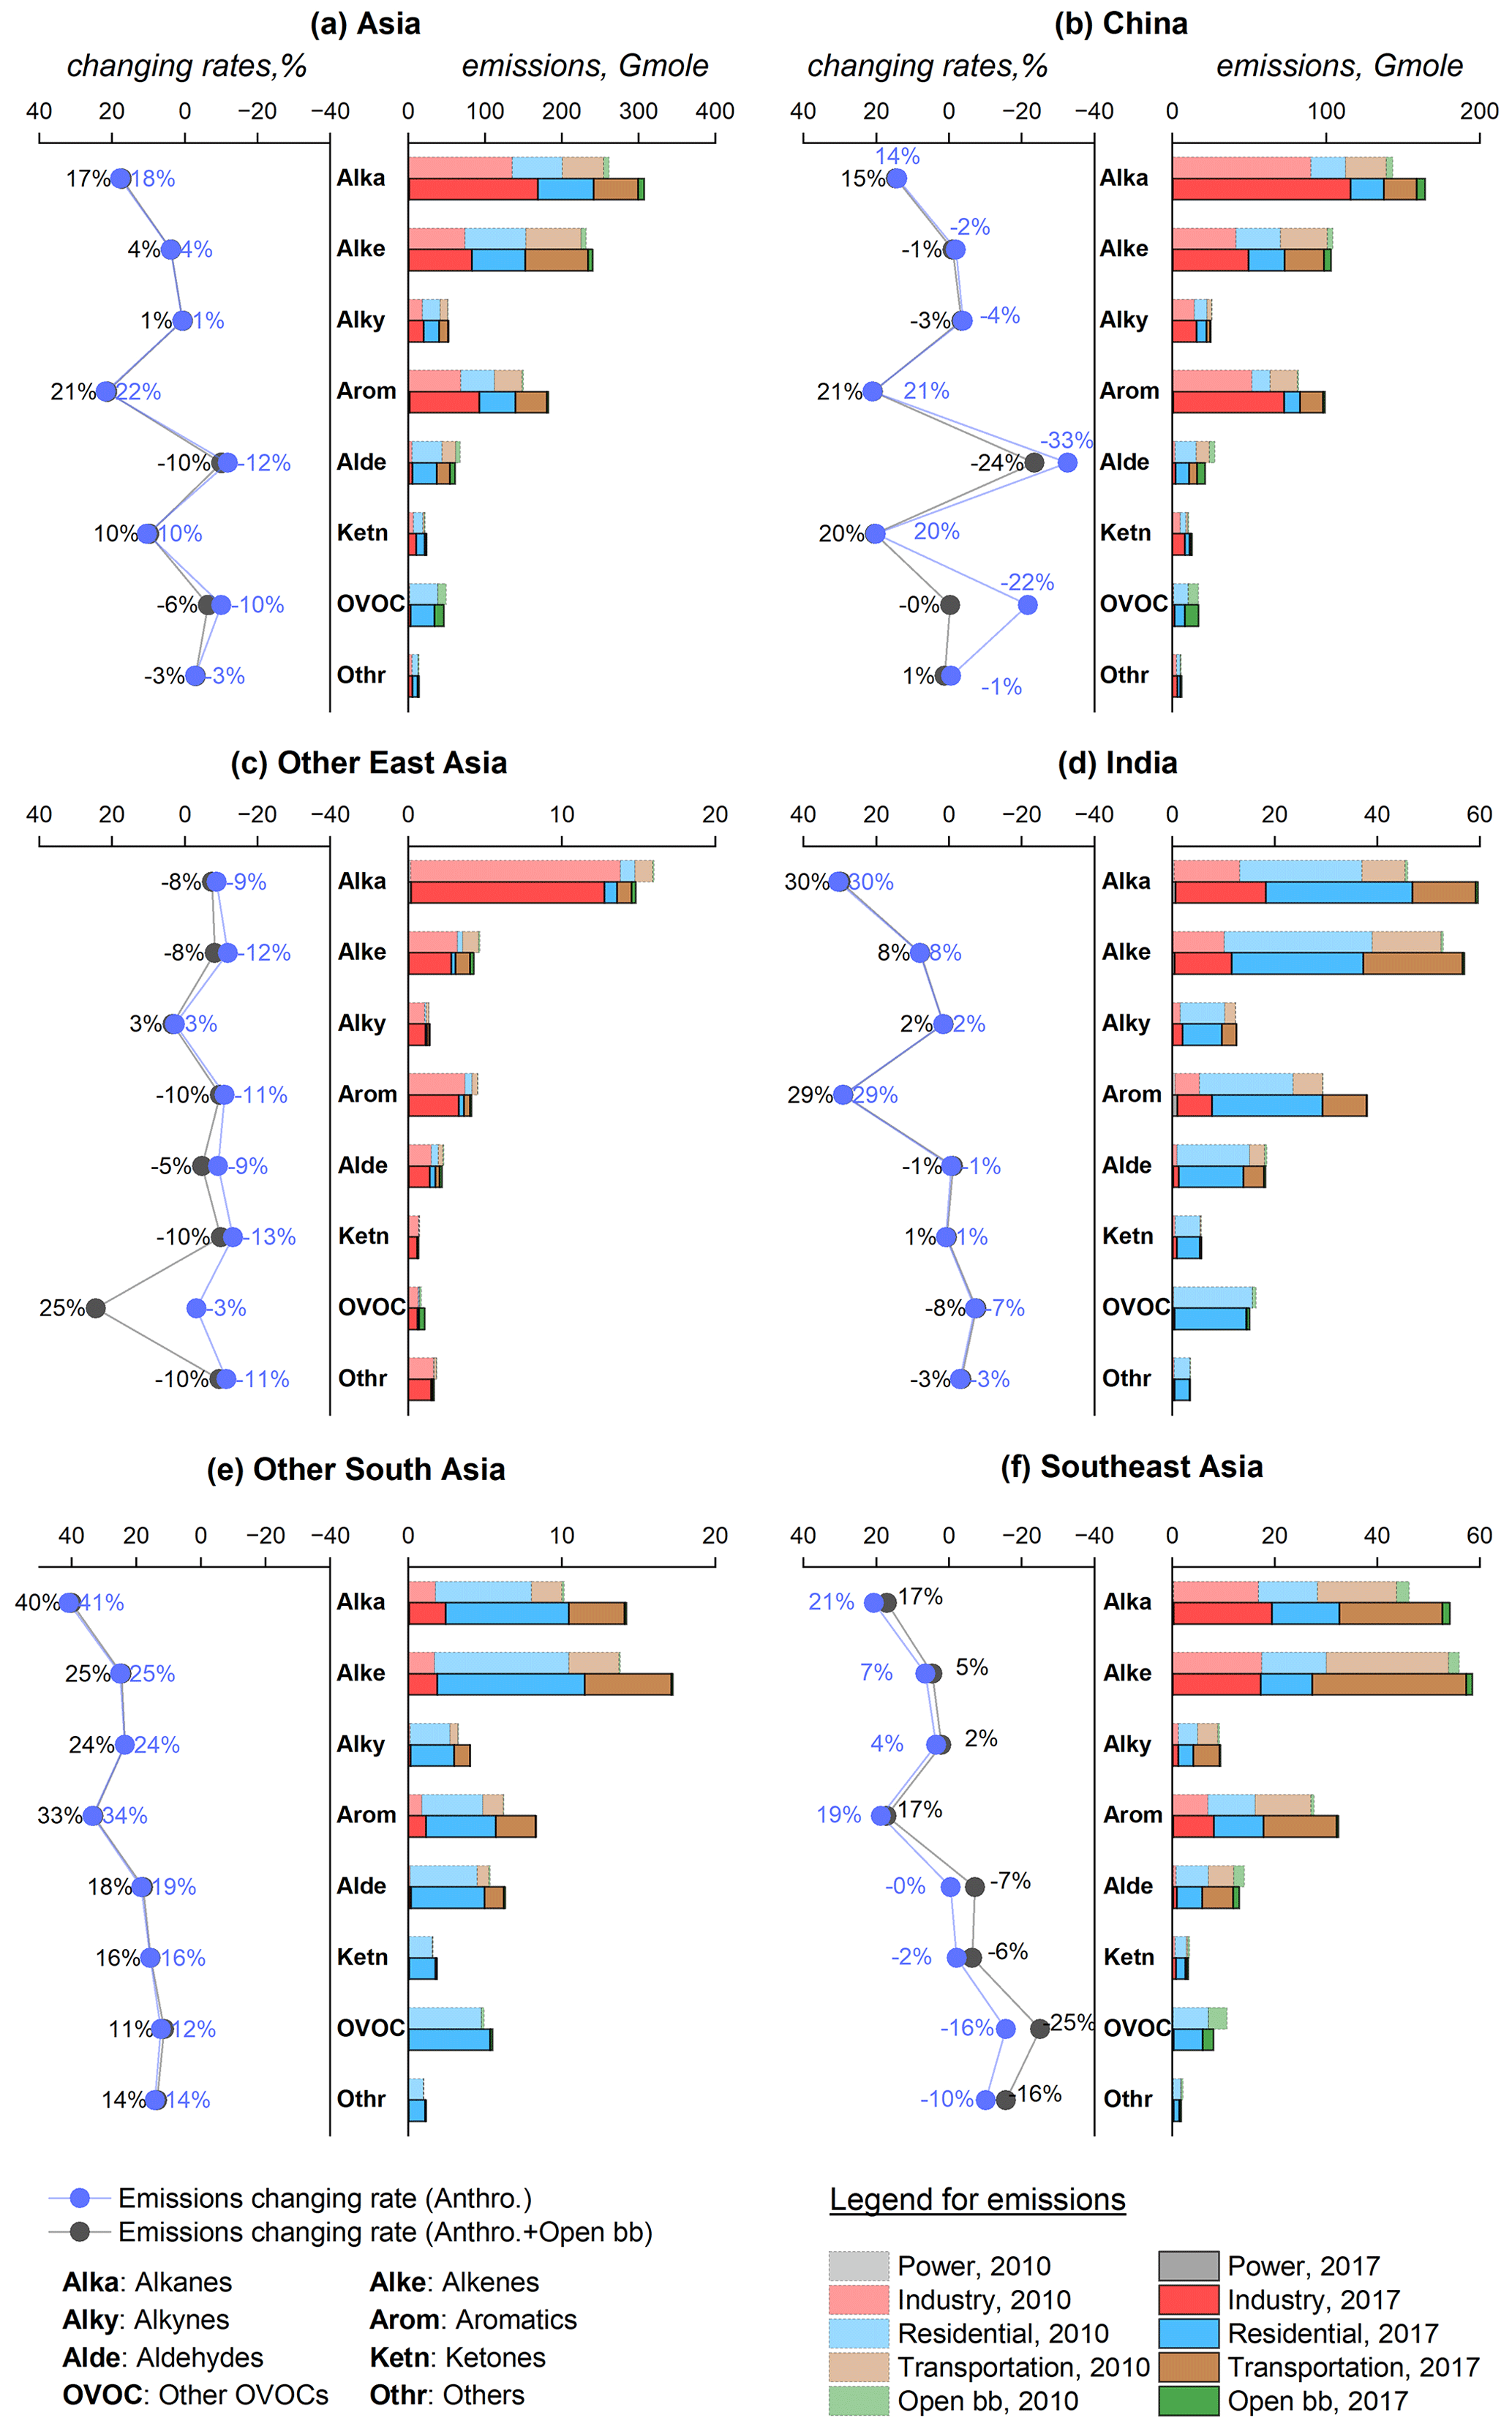
Figure 11Emissions in 2010 and 2017 (right columns) and the emission changing rates from 2010–2017 (left columns) of NMVOCs by chemical groups. For each country and region, the left column represents the emission changing rates (in %), while the right column shows the emissions by sector in 2010 and 2017. Chemical groups are lumped from the SAPRC07 species following Table S4. Open bb denotes open biomass burning.
Industry, mainly industrial solvent use, is the primary driving sector for emissions increase of alkanes (+15 %) and aromatics (+21 %) in China. Moderate reductions are estimated for anthropogenic OVOCs (−33 % aldehydes, +20 % ketones, −22 % other OVOCs) attributed to fuel transfer in the residential sector. OEA emissions show generally decreasing trends from −13 % (ketones, alkenes) to +3 % (alkynes) for anthropogenic sectors and −10 % (ketones, aromatics, others) to +25 % (Other OVOCs) with additional open biomass burning. Industrial emissions have decreased over all chemical groups for OEA. Similar sectoral distributions across chemical species are found for India and OSA, dominated by the residential and transportation sectors. More than 29 % emissions growth is estimated for alkanes and aromatics, driven by industry, residential and transportation sectors in India and OSA. In SEA, ∼ 20 % increases are estimated for emissions of alkanes and aromatics, and minor changes are estimated for alkenes, alkynes, aldehydes and ketones (within 10 %) during 2010–2017. OVOCs emissions in 2017 are 25 % lower than the values in 2010, contributed by residential sources and open biomass burning.
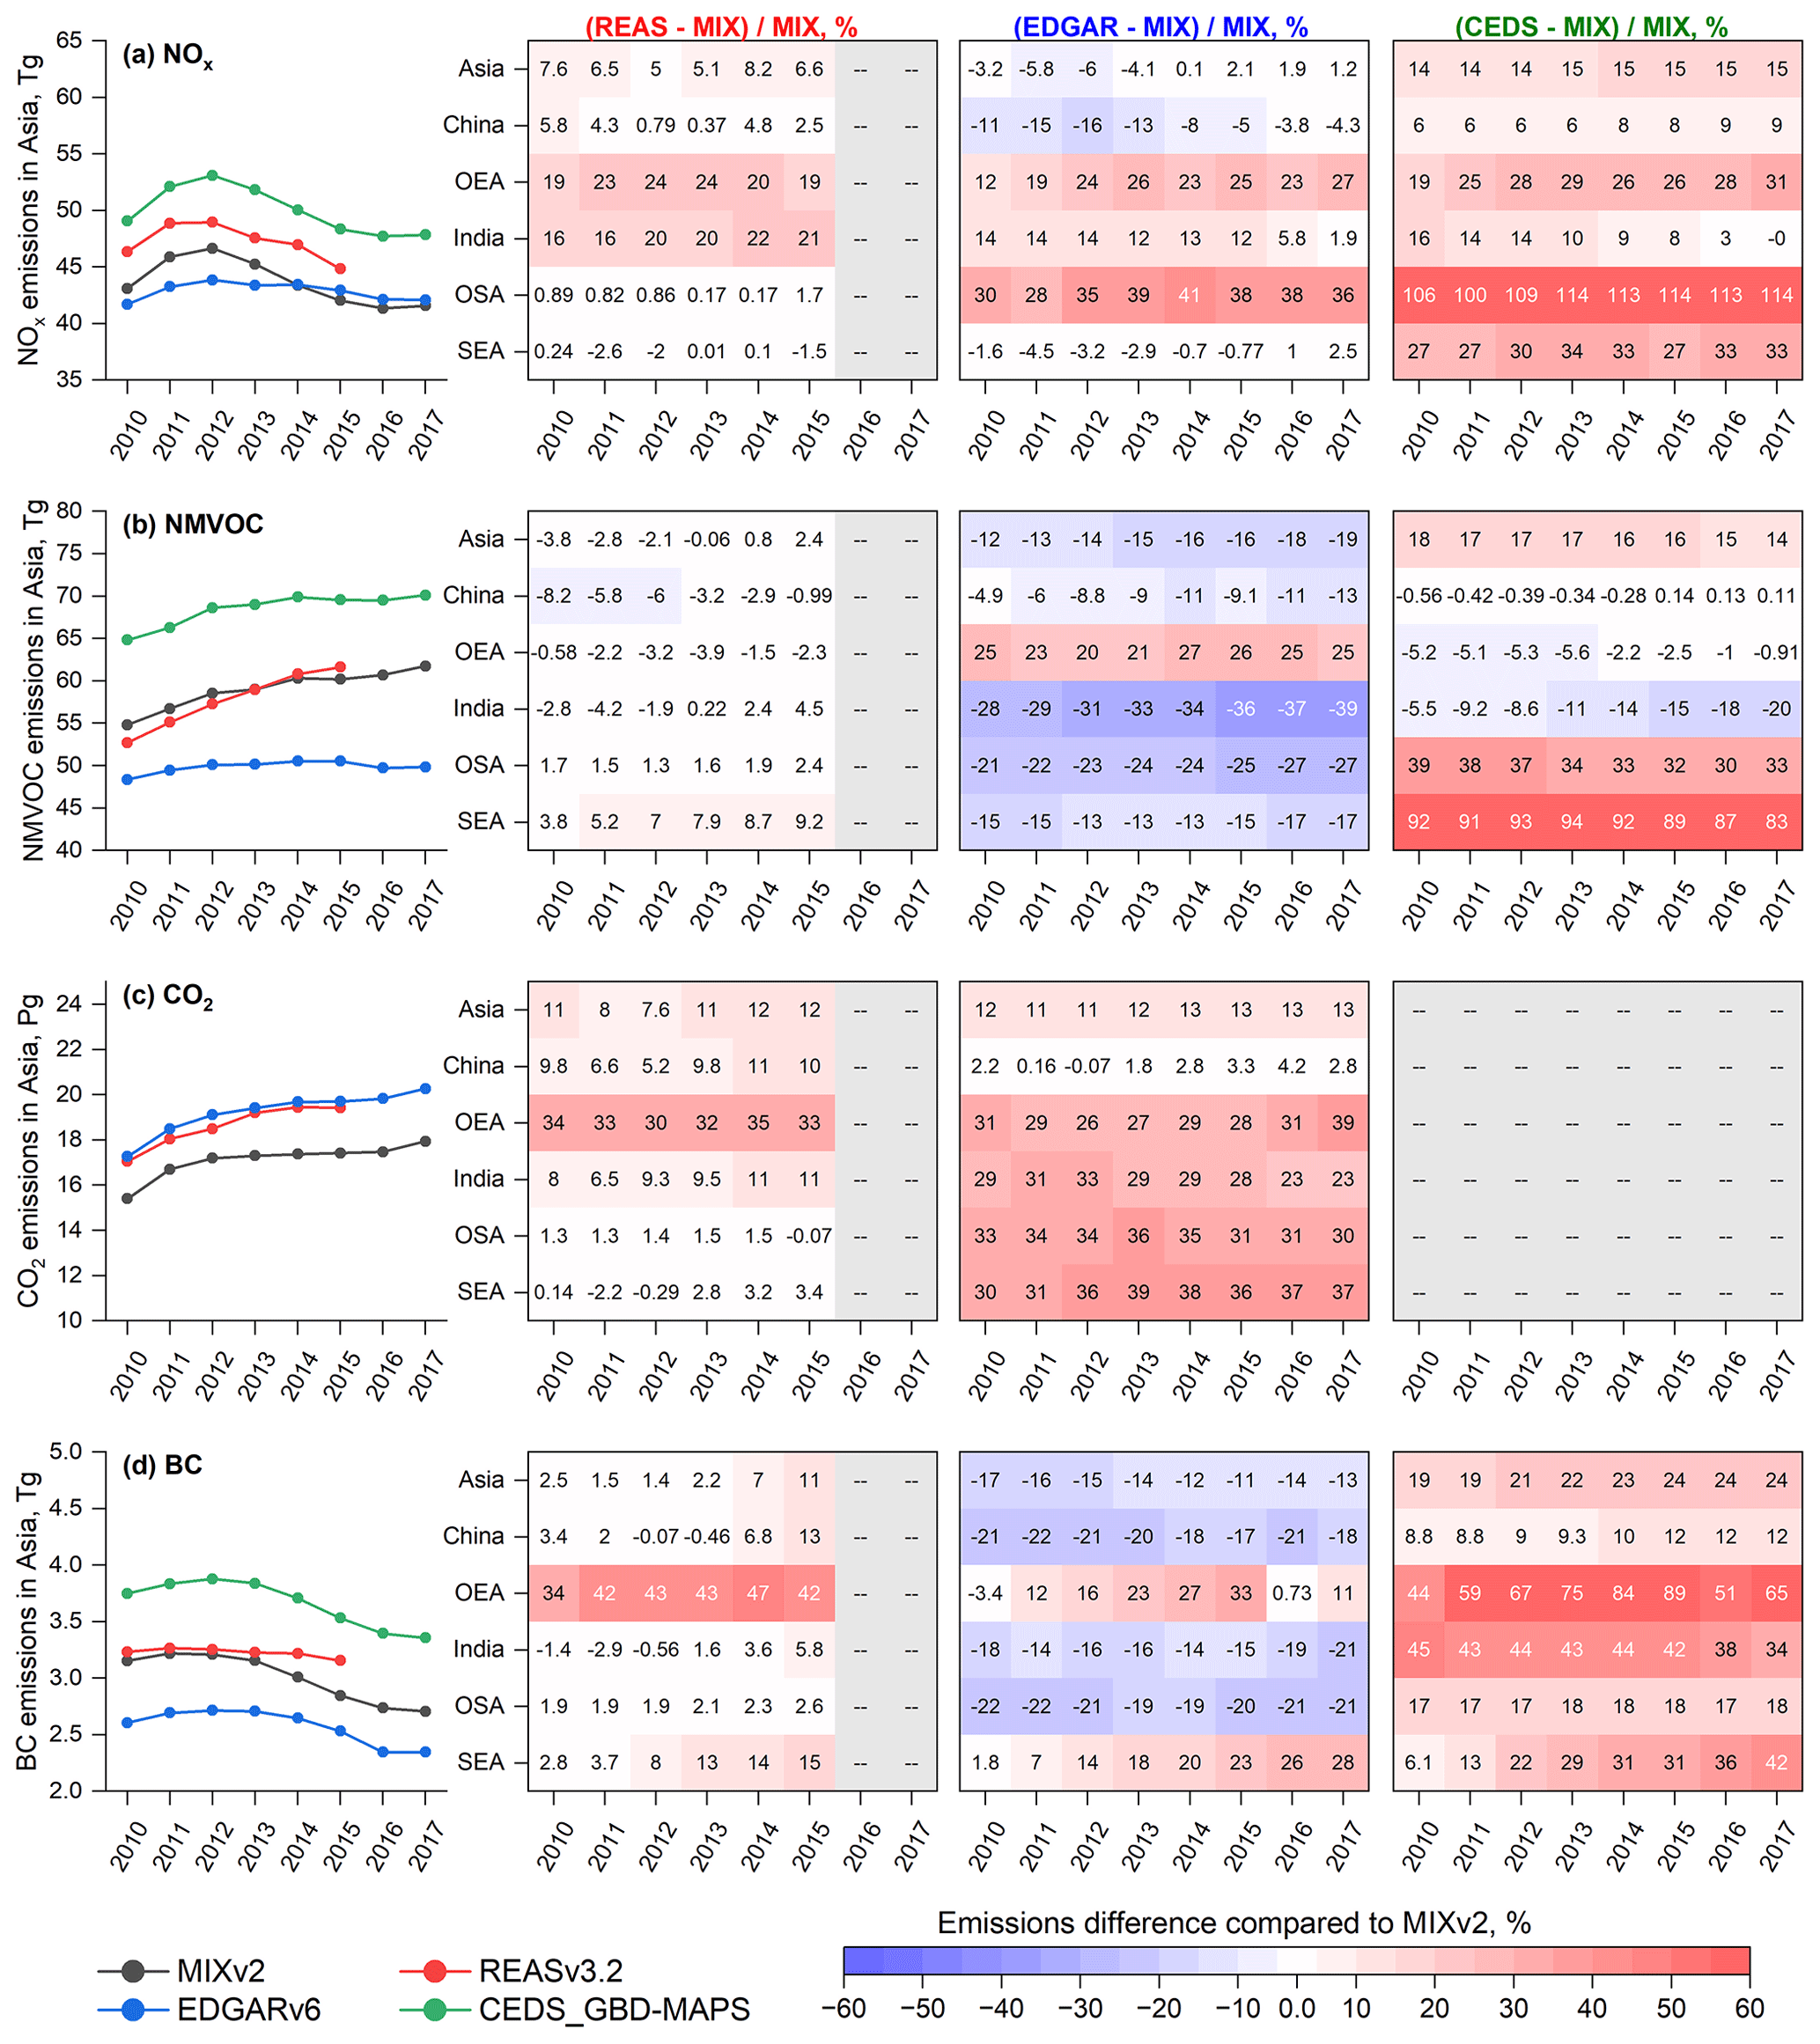
Figure 12Emission comparisons for anthropogenic sources between MIXv2, REASv3.2, EDGARv6 and CEDS_GBD-MAPs for (a) NOx, (b) NMVOC, (c) CO2 and (d) BC during 2010–2017 for Asian regions.
To provide a potential uncertainty range of MIXv2, we compared our estimates with both regional and global inventories, as well as top-down estimates from previous satellite-based and inverse modeling studies. Figure 12 shows the emission comparisons of MIXv2 with REASv3.2, EDGARv6 and CEDS_GBD-MAPS (referred to as CEDS) (McDuffie et al., 2020) for Asian regions during 2010–2017 for NOx, NMVOC, CO2 and BC. REAS and MIX show the best agreement (differing within 12 %) as expected because REAS was used as default estimates over Asia. Similar trends are found between REAS and MIX for all species except BC. The trends of NOx in EDGAR are different than the others, which peak in 2012, indicating the need for re-visiting the parameterization of control policies in East Asia in the global inventory system. EDGAR estimates are within a 20 % difference with MIXv2 for all of Asia, but they show higher discrepancies over OEA, OSA and SEA. NMVOCs are 12 %–19 % lower in EDGAR, mainly for India and OSA. Notably, the emission discrepancies have grown larger in recent years, attributed to the differences in emissions trends. EDGAR's NMVOC emissions show a relatively flat trend, in contrast to the continuously increasing pattern of MIX. Emissions of CO2 over OEA, OSA and SEA seem to be uncertain, with more than 30 % difference between EDGAR and MIX. Similarly, the emission differences of BC in SEA need to be considered when used in climate model simulations. The emission trends of CEDS are consistent with those of MIX because MEIC was applied to scale the emissions in the CEDS system (McDuffie et al., 2020). However, compared to MIX, CEDS emissions are generally higher across regions and species, with large discrepancies over OEA (+65 % for BC, +31 % for NOx in 2017), India (+34 % for BC), OSA (+114 % for NOx, +33 % for NMVOCs) and SEA (+33 % for NOx, +83 % for NMVOCs, +42 % for BC). These comparisons highlight the potential uncertainties of bottom-up emission inventories over South Asia and Southeast Asia where information is still limited compared to East Asia. More validations and revisions are needed to identify the reasons for the discrepancies and narrow down the gaps.
Table 5Top-down emission trends since 2010 over Asia.
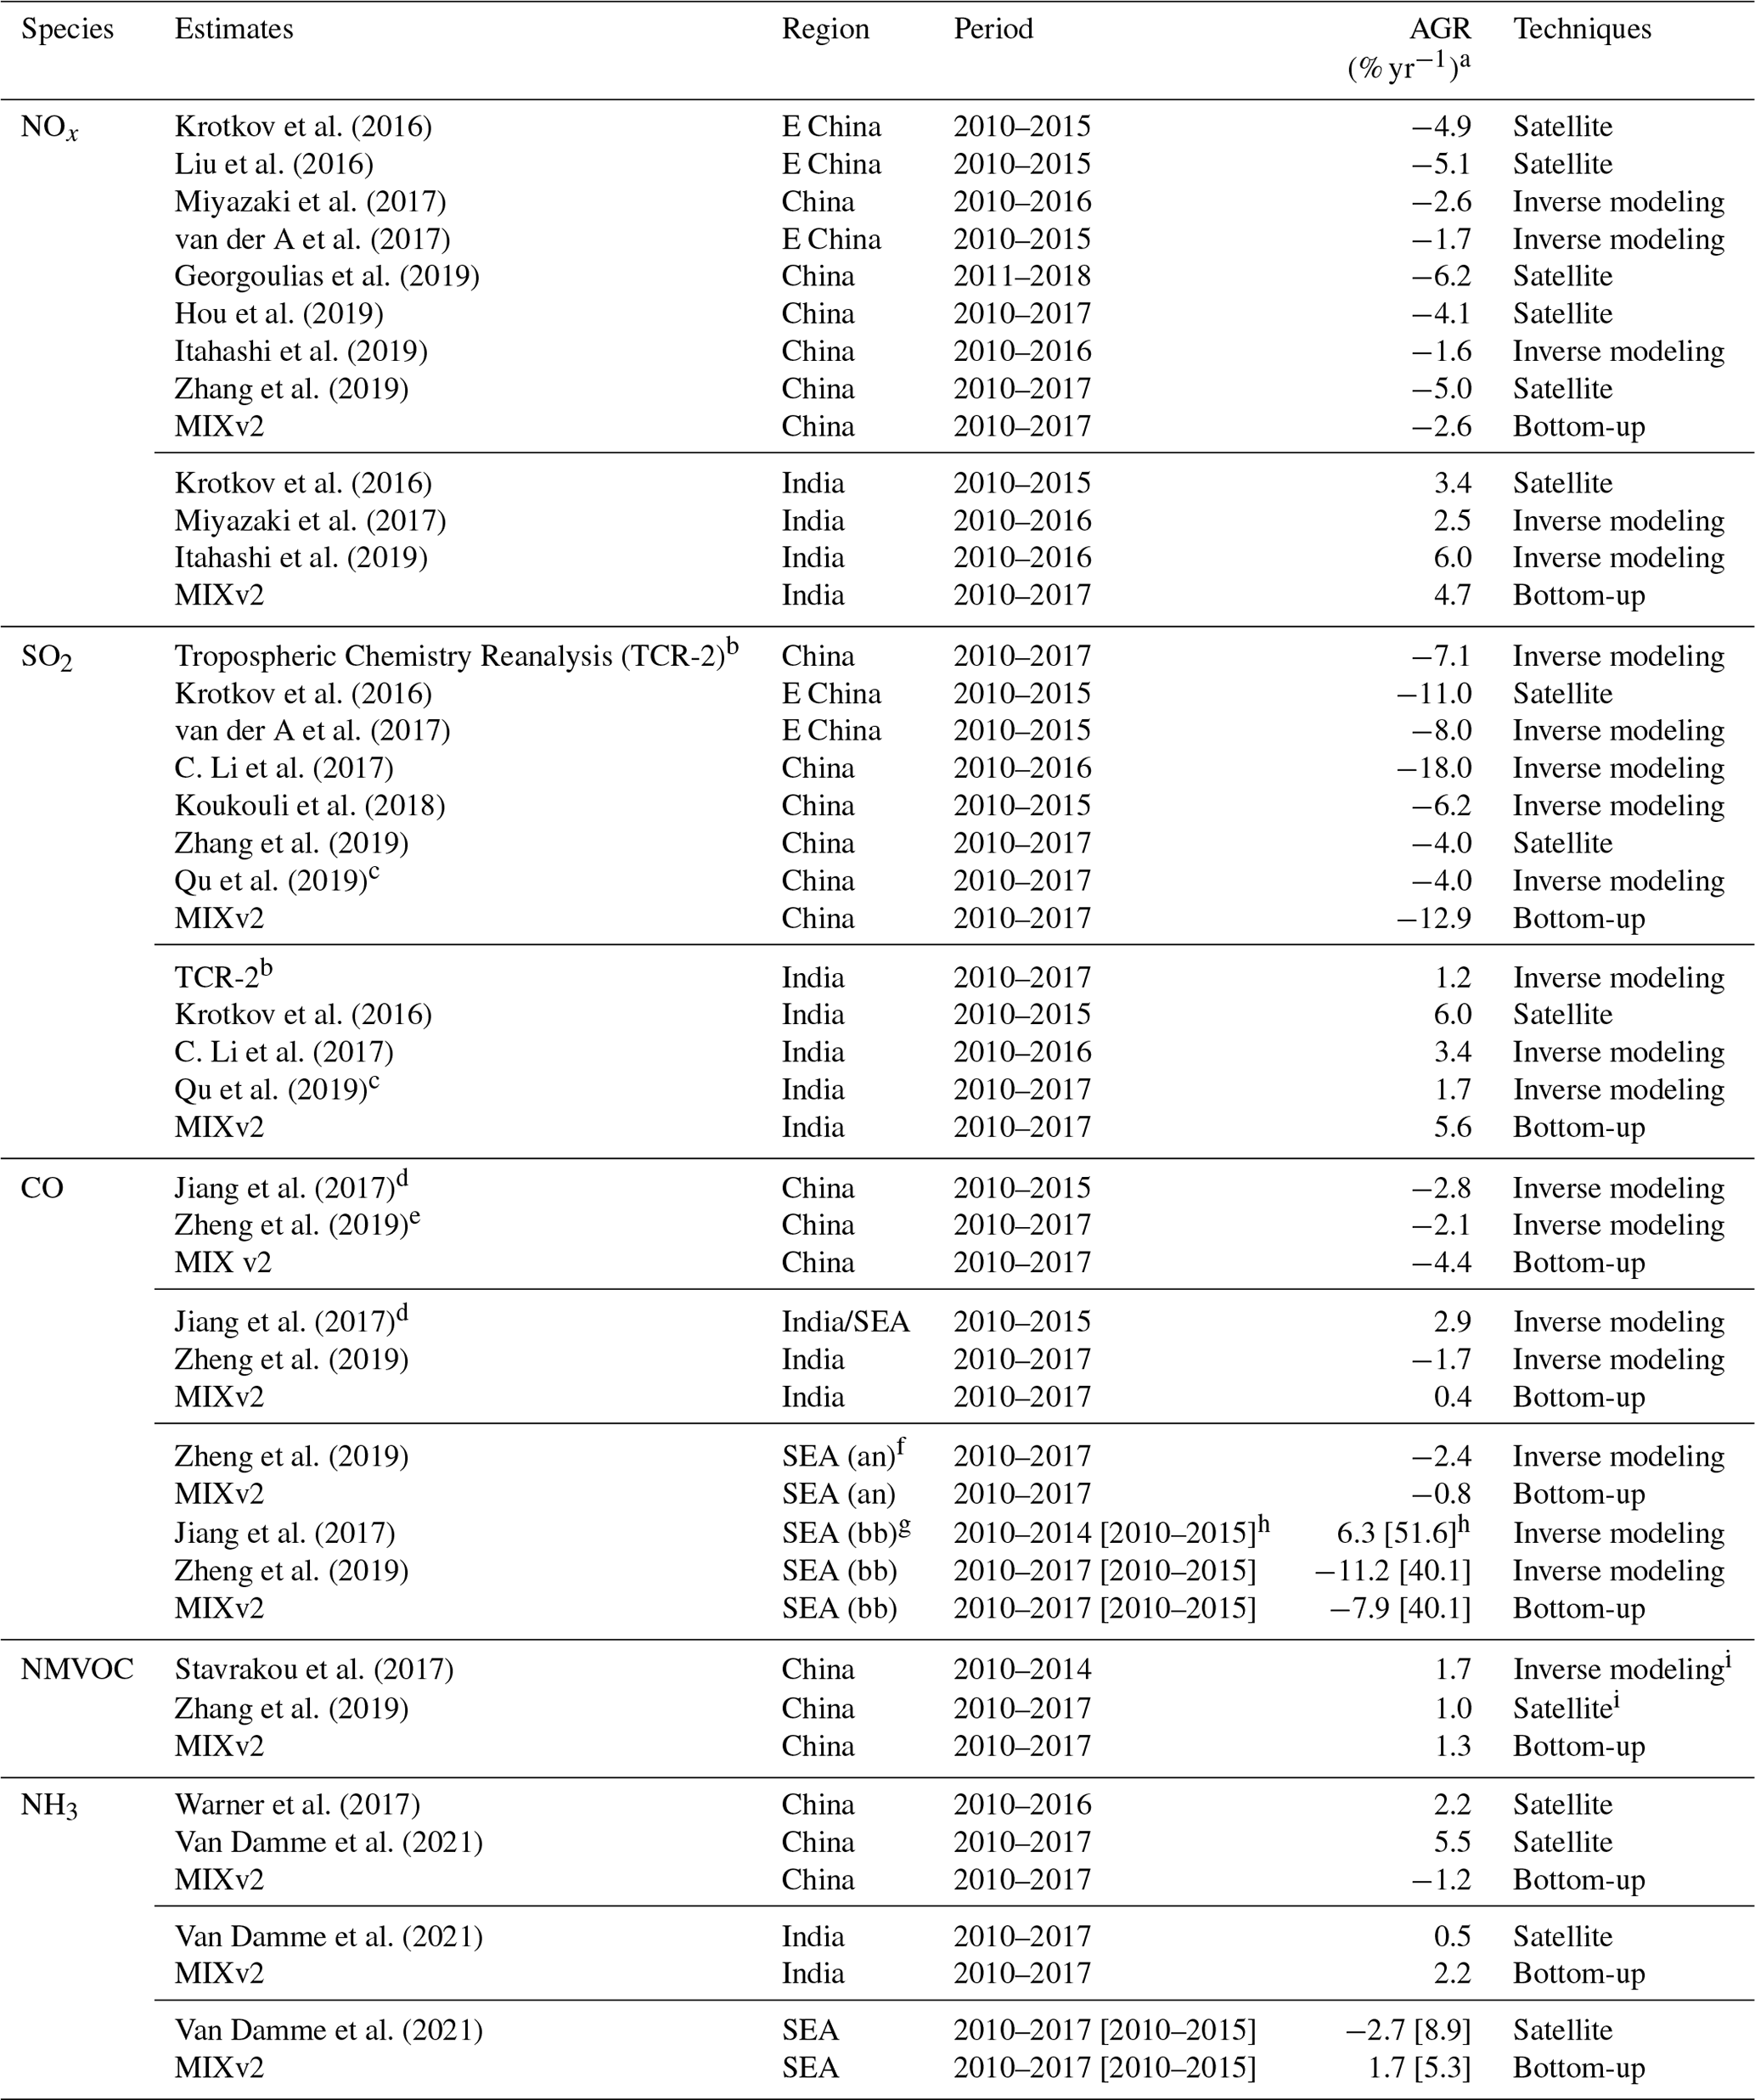
a AGR stands for annual growth rate. b Elguindi et al. (2020). c Top-down estimates based on NASA products. d Estimates derived from MOPITT profiles. e The results of full inversion no. 3 are summarized here. f Southeast Asia for anthropogenic sources. g Southeast Asia for open biomass burning. h The growth rates between 2010 and 2015 are listed in square brackets because 2015 is a El Niño year. i HCHO columns are used.
Table 5 summarizes the top-down emission annual growth rates since 2010 as derived from satellite retrievals and inverse modeling studies. MIX trends show high consistency with the top-down estimates, especially the inverse modeling results. Decreasing trends since the peak in 2012 for NOx emissions in China are validated from space (Georgoulias et al., 2019; Hou et al., 2019; Itahashi et al., 2019; Krotkov et al., 2016; Liu et al., 2016; Miyazaki et al., 2017; van der A et al., 2017; Zhang et al., 2019). The annual growth rates derived directly from satellite retrievals (−4.1 % yr−1 to −6.2 % yr−1) are in general larger than those from inverse modeling (−1.6 % yr−1 to −2.6 % yr−1) which jointly account for the air transport and chemical nonlinearity. Similar declining trends are found from top-down estimates of SO2 (Elguindi et al., 2020; Koukouli et al., 2018; Krotkov et al., 2016; C. Li et al., 2017; Qu et al., 2019; van der A et al., 2017; Zhang et al., 2019) and CO (Jiang et al., 2017; Zheng et al., 2019) over China. For India, emissions have been detected to grow continuously from space for NOx and SO2, with growth rates consistent with the inventory estimation. A slightly increasing trend is detected from space for HCHO in China, as an indicator of NMVOC emissions (Stavrakou et al., 2017; Zhang et al., 2019). In addition, 2015 is an El Niño year, and this climate anomaly turns out to significantly affect the emissions trends of CO and NH3 in SEA (Van Damme et al., 2021). More inverse modeling work by combining multiple species is needed for NH3 over Asia to shed light on the uncertainty range of inventory estimation.
In this work, we developed the MIXv2 emission inventory for Asia during 2010–2017 resolved with relatively high spatial resolution (0.1°) and temporal resolution (monthly) and detailed chemical speciation (SAPRC99, SAPRC07, CB05). MEICv2, PKU-NH3, PKU-Biomass, ANL-India, CAPSS and JPN are used to represent the best available emission inventories for China, India, the Republic of Korea and Japan, gap-filled with REASv3 and GFEDv4. Constructing a long-term mosaic emission inventory requires substantial international collaborations. MIXv2 was developed based on the state-of-the-art updated emission inputs under the framework of MICS-Asia Phase IV and is now ready to feed the atmospheric chemistry models and improve chemistry-climate models for long-term analyses. With high spatial resolution up to 0.1°, MIXv2 is capable of supporting model activities at regional and even local scales. As far as we know, MIXv2 is the first mosaic inventory with both anthropogenic and open biomass burning estimated by incorporating local emission inventories. Emissions are aggregated to seven sectors in MIX: power, industry, residential, transportation, agriculture as anthropogenic sources, and open biomass burning and shipping. With three chemical mechanisms developed using a consistent speciation framework, MIXv2 can be used in most of the atmospheric models even for those configured with updates on ozone and secondary organic aerosols formation. MIXv2 also has CO2 emissions based on the same emissions model for nine air pollutants (NOx, SO2, CO, NMVOC, NH3, PM10, PM2.5, BC, OC), providing a consistent dataset for climate–air quality nexus research. Gridded monthly emissions are publicly available at https://csl.noaa.gov/groups/csl4/modeldata/data/Li2023/.
Driving forces of the emission changes during 2010–2017 are investigated based on MIXv2. Significant emission reductions from anthropogenic sources are found for SO2, CO, PM10, PM2.5, BC and OC, driven by effective clean-air actions conducted over China and Other East Asia. India, Other South Asia, and Southeast Asia show continuously increasing emissions trends since 2010, limiting the emissions reduction for Asia as a whole. On the contrary, NMVOC and NH3 emissions increased or remained flat due to insufficient targeted control measures. Open biomass burning is the largest contributor to Southeast Asia for emissions of CO, NMVOC and OC. NOx emissions have shown clear latitudinal shifts southward in Asia, which is important for global tropospheric ozone budget. Our estimated trends are in general consistent with those derived from satellite retrievals, especially results from inverse modeling.
Further validation is needed for MIXv2 for better understanding of the data reliability. Inverse modeling studies on NMVOC and NH3 are still limited, partly attributed to the lack of available measurement data over Asia. With the launch of the Geostationary Environment Monitoring Spectrometer (GEMS) and the availability of hourly retrievals of atmospheric composition, top-down constraints on both emissions spatial distributions and temporal variations are now possible (Kim et al., 2020) at the continental scale for Asia. In-situ measurements aircraft and satellite data should be combined with inventory and model simulations to improve emission estimates in the future.
MIXv2 gridded monthly emissions data for both anthropogenic and open biomass burning for 2010–2017 by 10 species and 7 sectors are available at https://csl.noaa.gov/groups/csl4/modeldata/data/Li2023/ (Li et al., 2023), and the data are also shared at http://meicmodel.org/dataset-mixv2 (Li et al., 2024). Emission estimates by Asian countries and sectors are summarized in the Supplement. Daily open biomass burning emissions are available upon request. The availability of component regional emission inventories are summarized in Table 1. The following missions datasets are publicly available: the REASv3 emission inventory (https://www.nies.go.jp/REAS/index.html, Kurokawa and Ohara, 2022), the MEICv2.0 emission inventory (http://meicmodel.org.cn/?page_id=560, MEIC team, 2022), PKU-NH3 (http://meicmodel.org.cn/?page_id=1772&lang=en, Song et al., 2022a), PKU-Biomass (http://meicmodel.org.cn/?page_id=1772&lang=en, Song et al., 2022b), the GFEDv4s emission inventory (https://globalfiredata.org/, van der Werf et al., 2022), and the EDGARv6 emission inventory (https://edgar.jrc.ec.europa.eu/dataset_ap61, The Emissions Database for Global Atmospheric Research team, 2022).
The supplement related to this article is available online at: https://doi.org/10.5194/acp-24-3925-2024-supplement.
ML, QZ, JK and JHW initiated the research topic. ML developed the emissions model, conducted the analyses and prepared the paper. JK, QZ, JHW, TM, SC, ZL, YS, GG, HH and JK provided the regional emissions data. ORC and BCM contributed by providing the computing resources and data analyses. All co-authors have contributed with paper revision comments.
At least one of the (co-)authors is a member of the editorial board of Atmospheric Chemistry and Physics. The peer-review process was guided by an independent editor, and the authors also have no other competing interests to declare.
The scientific results and conclusions, as well as any views or opinions expressed herein, are those of the authors and do not necessarily reflect the views of NOAA or the Department of Commerce.
Publisher’s note: Copernicus Publications remains neutral with regard to jurisdictional claims made in the text, published maps, institutional affiliations, or any other geographical representation in this paper. While Copernicus Publications makes every effort to include appropriate place names, the final responsibility lies with the authors.
This article is part of the special issue “Tropospheric Ozone Assessment Report Phase II (TOAR-II) Community Special Issue (ACP/AMT/BG/GMD inter-journal SI)”. It is not associated with a conference.
MEIC has been developed and maintained by Tsinghua University, supported by the National Key R&D program of China (grant no. 2022YFC3700605). REASv3 has been supported by the Environmental Research and Technology Development Fund (grant nos. S-12, S-20, JPMEERF21S12012) of the Environmental Restoration and Conservation Agency of Japan and the Japan Society for the Promotion of Science, KAKENHI (grant no. 19K12303). The ANL-India emission inventory was partially funded by the National Aeronautics and Space Administration (NASA) as part of the Air Quality Applied Sciences Team (AQAST) program and by the Office of Biological and Environmental Research of the Office of Science in the U.S. Department of Energy in support of the Ganges Valley Aerosol Experiment (GVAX). The Argonne National Laboratory is operated by UChicago Argonne, LLC, under contract no. DE-AC02-06CH11357 with the U.S. Department of Energy. JPN emissions are developed by the Environment Research and Technology Development Fund (grant nos. JPMEERF20222001, JPMEERF20165001 and JPMEERF20215005) of the Environmental Restoration and Conservation Agency provided by Ministry of the Environment of Japan, and the FRIEND (Fine Particle Research Initiative in East Asia Considering National Differences) project through the National Research Foundation of Korea (NRF) funded by the Ministry of Science and ICT (grant no. 2020M3G1A1114622).
This compilation of the MIXv2 inventory has been supported by NOAA Cooperative Agreement with CIRES (grant nos. NA17OAR4320101 and NA22OAR4320151).
This research has been supported by the National Key Research and Development Program of China (grant no. 2022YFC3700605), the Environmental Restoration and Conservation Agency of Japan (grant nos. S-12, S-20, JPMEERF21S12012, JPMEERF20222001, JPMEERF20165001, and JPMEERF20215005), the Japan Society for the Promotion of Science (grant no. 19K12303), the U.S. Department of Energy (grant no. DE-AC02-06CH11357), the National Research Foundation of Korea (grant no. 2020M3G1A1114622), and the Cooperative Institute for Research in Environmental Sciences (grant nos. NA17OAR4320101 and NA22OAR4320151).
This paper was edited by Arthur Chan and reviewed by three anonymous referees.
Adam, M. G., Tran, P. T. M., Bolan, N., and Balasubramanian, R.: Biomass burning-derived airborne particulate matter in Southeast Asia: A critical review, J. Hazard. Mater., 407, 124760, https://doi.org/10.1016/j.jhazmat.2020.124760, 2021.
Akagi, S. K., Yokelson, R. J., Wiedinmyer, C., Alvarado, M. J., Reid, J. S., Karl, T., Crounse, J. D., and Wennberg, P. O.: Emission factors for open and domestic biomass burning for use in atmospheric models, Atmos. Chem. Phys., 11, 4039–4072, https://doi.org/10.5194/acp-11-4039-2011, 2011.
Andreae, M. O. and Merlet, P.: Emission of trace gases and aerosols from biomass burning, Global Biogeochem. Cy., 15, 955–966, 2001.
Anwar, M. N., Shabbir, M., Tahir, E., Iftikhar, M., Saif, H., Tahir, A., Murtaza, M. A., Khokhar, M. F., Rehan, M., Aghbashlo, M., Tabatabaei, M., and Nizami, A.-S.: Emerging challenges of air pollution and particulate matter in China, India, and Pakistan and mitigating solutions, J. Hazard. Mater., 416, 125851, https://doi.org/10.1016/j.jhazmat.2021.125851, 2021.
Carter, W. P. L.: Development of a database for chemical mechanism assignments for volatile organic emissions, J. Air Waste Manage. Assoc., 65, 1171–1184, 2015.
Chatani, S., Yamaji, K., Sakurai, T., Itahashi, S., Shimadera, H., Kitayama, K., and Hayami, H.: Overview of Model Inter-Comparison in Japan's Study for Reference Air Quality Modeling (J-STREAM), Atmosphere, 9, 19, https://doi.org/10.3390/atmos9010019, 2018.
Chatani, S., Shimadera, H., Itahashi, S., and Yamaji, K.: Comprehensive analyses of source sensitivities and apportionments of PM2.5 and ozone over Japan via multiple numerical techniques, Atmos. Chem. Phys., 20, 10311–10329, https://doi.org/10.5194/acp-20-10311-2020, 2020.
Chen, L., Gao, Y., Zhang, M., Fu, J. S., Zhu, J., Liao, H., Li, J., Huang, K., Ge, B., Wang, X., Lam, Y. F., Lin, C.-Y., Itahashi, S., Nagashima, T., Kajino, M., Yamaji, K., Wang, Z., and Kurokawa, J.: MICS-Asia III: multi-model comparison and evaluation of aerosol over East Asia, Atmos. Chem. Phys., 19, 11911–11937, https://doi.org/10.5194/acp-19-11911-2019, 2019.
Crippa, M., Guizzardi, D., Muntean, M., Schaaf, E., Dentener, F., van Aardenne, J. A., Monni, S., Doering, U., Olivier, J. G. J., Pagliari, V., and Janssens-Maenhout, G.: Gridded emissions of air pollutants for the period 1970–2012 within EDGAR v4.3.2, Earth Syst. Sci. Data, 10, 1987–2013, https://doi.org/10.5194/essd-10-1987-2018, 2018.
Crippa, M., Guizzardi, D., Butler, T., Keating, T., Wu, R., Kaminski, J., Kuenen, J., Kurokawa, J., Chatani, S., Morikawa, T., Pouliot, G., Racine, J., Moran, M. D., Klimont, Z., Manseau, P. M., Mashayekhi, R., Henderson, B. H., Smith, S. J., Suchyta, H., Muntean, M., Solazzo, E., Banja, M., Schaaf, E., Pagani, F., Woo, J.-H., Kim, J., Monforti-Ferrario, F., Pisoni, E., Zhang, J., Niemi, D., Sassi, M., Ansari, T., and Foley, K.: The HTAP_v3 emission mosaic: merging regional and global monthly emissions (2000–2018) to support air quality modelling and policies, Earth Syst. Sci. Data, 15, 2667–2694, https://doi.org/10.5194/essd-15-2667-2023, 2023.
Elguindi, N., Granier, C., Stavrakou, T., Darras, S., Bauwens, M., Cao, H., Chen, C., Denier van der Gon, H. A. C., Dubovik, O., Fu, T. M., Henze, D. K., Jiang, Z., Keita, S., Kuenen, J. J. P., Kurokawa, J., Liousse, C., Miyazaki, K., Müller, J. F., Qu, Z., Solmon, F., and Zheng, B.: Intercomparison of Magnitudes and Trends in Anthropogenic Surface Emissions From Bottom-Up Inventories, Top-Down Estimates, and Emission Scenarios, Earths Future, 8, e2020EF001520, https://doi.org/10.1029/2020EF001520, 2020.
Feng, Z., Xu, Y., Kobayashi, K., Dai, L., Zhang, T., Agathokleous, E., Calatayud, V., Paoletti, E., Mukherjee, A., Agrawal, M., Park, R. J., Oak, Y. J., and Yue, X.: Ozone pollution threatens the production of major staple crops in East Asia, Nature Food, 3, 47–56, 2022.
Field, R. D., van der Werf, G. R., Fanin, T., Fetzer, E. J., Fuller, R., Jethva, H., Levy, R., Livesey, N. J., Luo, M., Torres, O., and Worden, H. M.: Indonesian fire activity and smoke pollution in 2015 show persistent nonlinear sensitivity to El Niño-induced drought, P. Natl. Acad. Sci. USA, 113, 9204–9209, 2016.
Fiore, A. M., Naik, V., and Leibensperger, E. M.: Air Quality and Climate Connections, J. Air Waste Manage. Assoc., 65, 645–685, 2015.
Gao, M., Han, Z., Liu, Z., Li, M., Xin, J., Tao, Z., Li, J., Kang, J.-E., Huang, K., Dong, X., Zhuang, B., Li, S., Ge, B., Wu, Q., Cheng, Y., Wang, Y., Lee, H.-J., Kim, C.-H., Fu, J. S., Wang, T., Chin, M., Woo, J.-H., Zhang, Q., Wang, Z., and Carmichael, G. R.: Air quality and climate change, Topic 3 of the Model Inter-Comparison Study for Asia Phase III (MICS-Asia III) – Part 1: Overview and model evaluation, Atmos. Chem. Phys., 18, 4859–4884, https://doi.org/10.5194/acp-18-4859-2018, 2018.
Geng, G., Zheng, Y., Zhang, Q., Xue, T., Zhao, H., Tong, D., Zheng, B., Li, M., Liu, F., Hong, C., He, K., and Davis, S. J.: Drivers of PM2.5 air pollution deaths in China 2002–2017, Nat. Geosci., 14, 645–650, 2021.
Georgoulias, A. K., van der A, R. J., Stammes, P., Boersma, K. F., and Eskes, H. J.: Trends and trend reversal detection in 2 decades of tropospheric NO2 satellite observations, Atmos. Chem. Phys., 19, 6269–6294, https://doi.org/10.5194/acp-19-6269-2019, 2019.
Hammer, M. S., van Donkelaar, A., Li, C., Lyapustin, A., Sayer, A. M., Hsu, N. C., Levy, R. C., Garay, M. J., Kalashnikova, O. V., Kahn, R. A., Brauer, M., Apte, J. S., Henze, D. K., Zhang, L., Zhang, Q., Ford, B., Pierce, J. R., and Martin, R. V.: Global Estimates and Long-Term Trends of Fine Particulate Matter Concentrations (1998–2018), Environ. Sci. Technol., 54, 7879–7890, 2020.
Hou, Y., Wang, L., Zhou, Y., Wang, S., Liu, W., and Zhu, J.: Analysis of the tropospheric column nitrogen dioxide over China based on satellite observations during 2008–2017, Atmos. Pollut. Res., 10, 651–655, 2019.
Huang, X., Li, M., Li, J., and Song, Y.: A high-resolution emission inventory of crop burning in fields in China based on MODIS Thermal Anomalies/Fire products, Atmos. Environ., 50, 9–15, 2012a.
Huang, X., Song, Y., Li, M., Li, J., Huo, Q., Cai, X., Zhu, T., Hu, M., and Zhang, H.: A high-resolution ammonia emission inventory in China, Global Biogeochem. Cy., 26, GB1030, https://doi.org/10.1029/2011GB004161, 2012b.
Itahashi, S., Yumimoto, K., Kurokawa, J.-i., Morino, Y., Nagashima, T., Miyazaki, K., Maki, T., and Ohara, T.: Inverse estimation of NOx emissions over China and India 2005–2016: contrasting recent trends and future perspectives, Environ. Res. Lett., 14, 124020, https://doi.org/10.1088/1748-9326/ab4d7f, 2019.
Itahashi, S., Ge, B., Sato, K., Fu, J. S., Wang, X., Yamaji, K., Nagashima, T., Li, J., Kajino, M., Liao, H., Zhang, M., Wang, Z., Li, M., Kurokawa, J., Carmichael, G. R., and Wang, Z.: MICS-Asia III: overview of model intercomparison and evaluation of acid deposition over Asia, Atmos. Chem. Phys., 20, 2667–2693, https://doi.org/10.5194/acp-20-2667-2020, 2020.
Jacob, D. J. and Winner, D. A.: Effect of climate change on air quality, Atmos. Environ., 43, 51–63, 2009.
Janssens-Maenhout, G., Crippa, M., Guizzardi, D., Dentener, F., Muntean, M., Pouliot, G., Keating, T., Zhang, Q., Kurokawa, J., Wankmüller, R., Denier van der Gon, H., Kuenen, J. J. P., Klimont, Z., Frost, G., Darras, S., Koffi, B., and Li, M.: HTAP_v2.2: a mosaic of regional and global emission grid maps for 2008 and 2010 to study hemispheric transport of air pollution, Atmos. Chem. Phys., 15, 11411–11432, https://doi.org/10.5194/acp-15-11411-2015, 2015.
Janssens-Maenhout, G., Crippa, M., Guizzardi, D., Muntean, M., Schaaf, E., Dentener, F., Bergamaschi, P., Pagliari, V., Olivier, J. G. J., Peters, J. A. H. W., van Aardenne, J. A., Monni, S., Doering, U., Petrescu, A. M. R., Solazzo, E., and Oreggioni, G. D.: EDGAR v4.3.2 Global Atlas of the three major greenhouse gas emissions for the period 1970–2012, Earth Syst. Sci. Data, 11, 959–1002, https://doi.org/10.5194/essd-11-959-2019, 2019.
Jiang, Z., Worden, J. R., Worden, H., Deeter, M., Jones, D. B. A., Arellano, A. F., and Henze, D. K.: A 15-year record of CO emissions constrained by MOPITT CO observations, Atmos. Chem. Phys., 17, 4565–4583, https://doi.org/10.5194/acp-17-4565-2017, 2017.
Kang, Y., Liu, M., Song, Y., Huang, X., Yao, H., Cai, X., Zhang, H., Kang, L., Liu, X., Yan, X., He, H., Zhang, Q., Shao, M., and Zhu, T.: High-resolution ammonia emissions inventories in China from 1980 to 2012, Atmos. Chem. Phys., 16, 2043–2058, https://doi.org/10.5194/acp-16-2043-2016, 2016.
Kim, J., Jeong, U., Ahn, M.-H., Kim, J. H., Park, R. J., Lee, H., Song, C. H., Choi, Y.-S., Lee, K.-H., Yoo, J.-M., Jeong, M.-J., Park, S. K., Lee, K.-M., Song, C.-K., Kim, S.-W., Kim, Y. J., Kim, S.-W., Kim, M., Go, S., Liu, X., Chance, K., Chan Miller, C., Al-Saadi, J., Veihelmann, B., Bhartia, P. K., Torres, O., Abad, G. G., Haffner, D. P., Ko, D. H., Lee, S. H., Woo, J.-H., Chong, H., Park, S. S., Nicks, D., Choi, W. J., Moon, K.-J., Cho, A., Yoon, J., Kim, S.-k., Hong, H., Lee, K., Lee, H., Lee, S., Choi, M., Veefkind, P., Levelt, P. F., Edwards, D. P., Kang, M., Eo, M., Bak, J., Baek, K., Kwon, H.-A., Yang, J., Park, J., Han, K. M., Kim, B.-R., Shin, H.-W., Choi, H., Lee, E., Chong, J., Cha, Y., Koo, J.-H., Irie, H., Hayashida, S., Kasai, Y., Kanaya, Y., Liu, C., Lin, J., Crawford, J. H., Carmichael, G. R., Newchurch, M. J., Lefer, B. L., Herman, J. R., Swap, R. J., Lau, A. K. H., Kurosu, T. P., Jaross, G., Ahlers, B., Dobber, M., McElroy, C. T., and Choi, Y.: New Era of Air Quality Monitoring from Space: Geostationary Environment Monitoring Spectrometer (GEMS), B. Am. Meteorol. Soc., 101, E1–E22, 2020.
Klausbruckner, C., Annegarn, H., Henneman, L. R. F., and Rafaj, P.: A policy review of synergies and trade-offs in South African climate change mitigation and air pollution control strategies, Environ. Sci. Policy, 57, 70–78, 2016.
Koukouli, M. E., Theys, N., Ding, J., Zyrichidou, I., Mijling, B., Balis, D., and van der A, R. J.: Updated SO2 emission estimates over China using OMI/Aura observations, Atmos. Meas. Tech., 11, 1817–1832, https://doi.org/10.5194/amt-11-1817-2018, 2018.
Krotkov, N. A., McLinden, C. A., Li, C., Lamsal, L. N., Celarier, E. A., Marchenko, S. V., Swartz, W. H., Bucsela, E. J., Joiner, J., Duncan, B. N., Boersma, K. F., Veefkind, J. P., Levelt, P. F., Fioletov, V. E., Dickerson, R. R., He, H., Lu, Z., and Streets, D. G.: Aura OMI observations of regional SO2 and NO2 pollution changes from 2005 to 2015, Atmos. Chem. Phys., 16, 4605–4629, https://doi.org/10.5194/acp-16-4605-2016, 2016.
Kurokawa, J. and Ohara, T.: Long-term historical trends in air pollutant emissions in Asia: Regional Emission inventory in ASia (REAS) version 3, Atmos. Chem. Phys., 20, 12761–12793, https://doi.org/10.5194/acp-20-12761-2020, 2020.
Kurokawa, J. and Ohara, T.: REASv3 emission inventory, NIES [data set], https://www.nies.go.jp/REAS/index.html, last access: April 2022.
Lee, D.-G., Lee, Y.-M., Jang, K.-W., Yoo, C., Kang, K.-H., Lee, J.-H., Jung, S.-W., Park, J.-M., Lee, S.-B., Han, J.-S., Hong, J.-H., and Lee, S.-J.: Korean National Emissions Inventory System and 2007 Air Pollutant Emissions, Asian Journal of Atmospheric Environment, 5, 278–291, 2011.
Lei, Y., Zhang, Q., He, K. B., and Streets, D. G.: Primary anthropogenic aerosol emission trends for China, 1990–2005, Atmos. Chem. Phys., 11, 931–954, https://doi.org/10.5194/acp-11-931-2011, 2011.
Li, C., McLinden, C., Fioletov, V., Krotkov, N., Carn, S., Joiner, J., Streets, D., He, H., Ren, X., Li, Z., and Dickerson, R. R.: India Is Overtaking China as the World's Largest Emitter of Anthropogenic Sulfur Dioxide, Sci. Rep., 7, 14304, https://doi.org/10.1038/s41598-017-14639-8, 2017.
Li, K., Jacob, D. J., Liao, H., Zhu, J., Shah, V., Shen, L., Bates, K. H., Zhang, Q., and Zhai, S.: A two-pollutant strategy for improving ozone and particulate air quality in China, Nat. Geosci., 12, 906–910, 2019.
Li, M., Zhang, Q., Streets, D. G., He, K. B., Cheng, Y. F., Emmons, L. K., Huo, H., Kang, S. C., Lu, Z., Shao, M., Su, H., Yu, X., and Zhang, Y.: Mapping Asian anthropogenic emissions of non-methane volatile organic compounds to multiple chemical mechanisms, Atmos. Chem. Phys., 14, 5617–5638, https://doi.org/10.5194/acp-14-5617-2014, 2014.
Li, M., Liu, H., Geng, G., Hong, C., Liu, F., Song, Y., Tong, D., Zheng, B., Cui, H., Man, H., Zhang, Q., and He, K.: Anthropogenic emission inventories in China: a review, Natl. Sci. Rev., 4, 834–866, 2017a.
Li, M., Zhang, Q., Kurokawa, J.-I., Woo, J.-H., He, K., Lu, Z., Ohara, T., Song, Y., Streets, D. G., Carmichael, G. R., Cheng, Y., Hong, C., Huo, H., Jiang, X., Kang, S., Liu, F., Su, H., and Zheng, B.: MIX: a mosaic Asian anthropogenic emission inventory under the international collaboration framework of the MICS-Asia and HTAP, Atmos. Chem. Phys., 17, 935–963, https://doi.org/10.5194/acp-17-935-2017, 2017b.
Li, M., Klimont, Z., Zhang, Q., Martin, R. V., Zheng, B., Heyes, C., Cofala, J., Zhang, Y., and He, K.: Comparison and evaluation of anthropogenic emissions of SO2 and NOx over China, Atmos. Chem. Phys., 18, 3433–3456, https://doi.org/10.5194/acp-18-3433-2018, 2018.
Li, M., Zhang, Q., Zheng, B., Tong, D., Lei, Y., Liu, F., Hong, C., Kang, S., Yan, L., Zhang, Y., Bo, Y., Su, H., Cheng, Y., and He, K.: Persistent growth of anthropogenic non-methane volatile organic compound (NMVOC) emissions in China during 1990–2017: drivers, speciation and ozone formation potential, Atmos. Chem. Phys., 19, 8897–8913, https://doi.org/10.5194/acp-19-8897-2019, 2019.
Li, M., Kurokawa, J., Zhang, Q., Woo, J. H., Morikawa, T., Chatani, S., Lu, Z., Song, Y., Geng, G., Hu, H., Kim, J., Cooper, O. R., and McDonald, B. C.: MIXv2.3 emission inventory for Asia, NOAA CSL [data set], https://csl.noaa.gov/groups/csl4/modeldata/data/Li2023/, last access: October 2023.
Li, M., Kurokawa, J., Zhang, Q., Woo, J. H., Morikawa, T., Chatani, S., Lu, Z., Song, Y., Geng, G., Hu, H., Kim, J., Cooper, O. R., and McDonald, B. C.: MIXv2.3 emission inventory for Asia, Tsinghua University [data set], http://meicmodel.org/dataset-mixv2, last access: February 2024.
Liu, F., Zhang, Q., Tong, D., Zheng, B., Li, M., Huo, H., and He, K. B.: High-resolution inventory of technologies, activities, and emissions of coal-fired power plants in China from 1990 to 2010, Atmos. Chem. Phys., 15, 13299–13317, https://doi.org/10.5194/acp-15-13299-2015, 2015.
Liu, F., Zhang, Q., van der A, R. J., Zheng, B., Tong, D., Yan, L., Zheng, Y., and He, K.: Recent reduction in NOx emissions over China: synthesis of satellite observations and emission inventories, Environ. Res. Lett., 11, 114002, https://doi.org/10.1088/1748-9326/11/11/114002, 2016.
Lu, Z. and Streets, D. G.: Increase in NOx Emissions from Indian Thermal Power Plants during 1996–2010: Unit-Based Inventories and Multisatellite Observations, Environ. Sci. Technol., 46, 7463–7470, 2012.
Lu, Z., Zhang, Q., and Streets, D. G.: Sulfur dioxide and primary carbonaceous aerosol emissions in China and India, 1996–2010, Atmos. Chem. Phys., 11, 9839–9864, https://doi.org/10.5194/acp-11-9839-2011, 2011.
McDuffie, E. E., Smith, S. J., O'Rourke, P., Tibrewal, K., Venkataraman, C., Marais, E. A., Zheng, B., Crippa, M., Brauer, M., and Martin, R. V.: A global anthropogenic emission inventory of atmospheric pollutants from sector- and fuel-specific sources (1970–2017): an application of the Community Emissions Data System (CEDS), Earth Syst. Sci. Data, 12, 3413–3442, https://doi.org/10.5194/essd-12-3413-2020, 2020.
MEIC team: MEICv2.0 emission inventory, Tsinghua University [data set], http://meicmodel.org.cn/?page_id=560, last access: June 2022.
Miyazaki, K., Eskes, H., Sudo, K., Boersma, K. F., Bowman, K., and Kanaya, Y.: Decadal changes in global surface NOx emissions from multi-constituent satellite data assimilation, Atmos. Chem. Phys., 17, 807–837, https://doi.org/10.5194/acp-17-807-2017, 2017.
Mo, Z., Shao, M., and Lu, S.: Compilation of a source profile database for hydrocarbon and OVOC emissions in China, Atmos. Environ., 143, 209–217, 2016.
Paliwal, U., Sharma, M., and Burkhart, J. F.: Monthly and spatially resolved black carbon emission inventory of India: uncertainty analysis, Atmos. Chem. Phys., 16, 12457–12476, https://doi.org/10.5194/acp-16-12457-2016, 2016.
Phillips, D.: Ambient Air Quality Synergies with a 2050 Carbon Neutrality Pathway in South Korea, Climate, 10, 1, https://doi.org/10.3390/cli10010001, 2022.
Qu, Z., Henze, D. K., Li, C., Theys, N., Wang, Y., Wang, J., Wang, W., Han, J., Shim, C., Dickerson, R. R., and Ren, X.: SO2 Emission Estimates Using OMI SO2 Retrievals for 2005–2017, J. Geophys. Res.-Atmos., 124, 8336–8359, 2019.
Saari, R. K., Selin, N. E., Rausch, S., and Thompson, T. M.: A self-consistent method to assess air quality co-benefits from U.S. climate policies, J. Air Waste Manage. Assoc., 65, 74–89, 2015.
Samset, B. H., Lund, M. T., Bollasina, M., Myhre, G., and Wilcox, L.: Emerging Asian aerosol patterns, Nat. Geosci., 12, 582–584, 2019.
Shan, Y., Huang, Q., Guan, D., and Hubacek, K.: China CO2 emission accounts 2016–2017, Scientific Data, 7, 54, https://doi.org/10.1038/s41597-020-0393-y, 2020.
Shi, Y. and Yamaguchi, Y.: A high-resolution and multi-year emissions inventory for biomass burning in Southeast Asia during 2001–2010, Atmos. Environ., 98, 8–16, 2014.
Shibata, Y. and Morikawa, T.: Review of the JCAP/JATOP Air Quality Model Study in Japan, Atmosphere, 12, 943, https://doi.org/10.3390/atmos12080943, 2021.
Simon, H., Beck, L., Bhave, P. V., Divita, F., Hsu, Y., Luecken, D., Mobley, J. D., Pouliot, G. A., Reff, A., Sarwar, G., and Strum, M.: The development and uses of EPA's SPECIATE database, Atmos. Pollut. Res., 1, 196–206, 2010.
Song, Y., Liu, B., Miao, W., Chang, D., and Zhang, Y.: Spatiotemporal variation in nonagricultural open fire emissions in China from 2000 to 2007, Global Biogeochem. Cy., 23, GB2008,, https://doi.org/10.1029/2008GB003344, 2009.
Song, Y., Liu, M., and Huang, X.: PKU-NH3, Peking University [data set], http://meicmodel.org.cn/?page_id=1772&lang=en, last access: June 2022a.
Song, Y., Liu, M., and Huang, X.: PKU-Biomass, Peking University [data set], http://meicmodel.org.cn/?page_id=1772&lang=en, last access: June 2022b.
Stavrakou, T., Müller, J.-F., Bauwens, M., and De Smedt, I.: Sources and Long-Term Trends of Ozone Precursors to Asian Pollution, in: Air Pollution in Eastern Asia: An Integrated Perspective, edited by: Bouarar, I., Wang, X., and Brasseur, G. P., Springer International Publishing, Cham, https://doi.org/10.1007/978-3-319-59489-7_8, 2017.
Sun, W., Shao, M., Granier, C., Liu, Y., Ye, C. S., and Zheng, J. Y.: Long-Term Trends of Anthropogenic SO2, NOx, CO, and NMVOCs Emissions in China, Earths Future, 6, 1112–1133, 2018.
Takahashi, M., Feng, Z., Mikhailova, T. A., Kalugina, O. V., Shergina, O. V., Afanasieva, L. V., Heng, R. K. J., Majid, N. M. A., and Sase, H.: Air pollution monitoring and tree and forest decline in East Asia: A review, Sci. Total Environ., 742, 140288, https://doi.org/10.1016/j.scitotenv.2020.140288, 2020.
The Emissions Database for Global Atmospheric Research team: EDGARv6 emission inventory, European Commission, Joint Research Centre (JRC) [data set], https://edgar.jrc.ec.europa.eu/dataset_ap61, last access: October 2022.
Van Damme, M., Clarisse, L., Franco, B., Sutton, M. A., Erisman, J. W., Wichink Kruit, R., van Zanten, M., Whitburn, S., Hadji-Lazaro, J., Hurtmans, D., Clerbaux, C., and Coheur, P.-F.: Global, regional and national trends of atmospheric ammonia derived from a decadal (2008–2018) satellite record, Environ. Res. Lett., 16, 055017, https://doi.org/10.1088/1748-9326/abd5e0, 2021.
van der A, R. J., Mijling, B., Ding, J., Koukouli, M. E., Liu, F., Li, Q., Mao, H., and Theys, N.: Cleaning up the air: effectiveness of air quality policy for SO2 and NOx emissions in China, Atmos. Chem. Phys., 17, 1775–1789, https://doi.org/10.5194/acp-17-1775-2017, 2017.
van der Werf, G. R., Randerson, J. T., Giglio, L., van Leeuwen, T. T., Chen, Y., Rogers, B. M., Mu, M., van Marle, M. J. E., Morton, D. C., Collatz, G. J., Yokelson, R. J., and Kasibhatla, P. S.: Global fire emissions estimates during 1997–2016, Earth Syst. Sci. Data, 9, 697–720, https://doi.org/10.5194/essd-9-697-2017, 2017.
van der Werf, G., Randerson, J., and Giglio, L.: GFEDv4s emission inventory, Global Fire Emissions Database, https://globalfiredata.org/, last access: October 2022.
von Schneidemesser, E. and Monks, P. S.: Air quality and climate – synergies and trade-offs, Environ. Sci.-Proc. Imp., 15, 1315–1325, 2013.
Warner, J. X., Dickerson, R. R., Wei, Z., Strow, L. L., Wang, Y., and Liang, Q.: Increased atmospheric ammonia over the world's major agricultural areas detected from space, Geophys. Res. Lett., 44, 2875–2884, https://doi.org/10.1002/2016GL072305, 2017.
Wong, C.-M., Vichit-Vadakan, N., Kan, H., and Qian, Z.: Public Health and Air Pollution in Asia (PAPA): A Multicity Study of Short-Term Effects of Air Pollution on Mortality, Environ. Health Persp., 116, 1195–1202, 2008.
Woo, J.-H., Choi, K.-C., Kim, H. K., Baek, B. H., Jang, M., Eum, J.-H., Song, C. H., Ma, Y.-I., Sunwoo, Y., Chang, L.-S., and Yoo, S. H.: Development of an anthropogenic emissions processing system for Asia using SMOKE, Atmos. Environ., 58, 5–13, 2012.
Xiao, Q., Li, M., Liu, H., Fu, M., Deng, F., Lv, Z., Man, H., Jin, X., Liu, S., and He, K.: Characteristics of marine shipping emissions at berth: profiles for particulate matter and volatile organic compounds, Atmos. Chem. Phys., 18, 9527–9545, https://doi.org/10.5194/acp-18-9527-2018, 2018.
Xie, Y., Dai, H., Xu, X., Fujimori, S., Hasegawa, T., Yi, K., Masui, T., and Kurata, G.: Co-benefits of climate mitigation on air quality and human health in Asian countries, Environ. Int., 119, 309–318, 2018.
Yin, L., Du, P., Zhang, M., Liu, M., Xu, T., and Song, Y.: Estimation of emissions from biomass burning in China (2003–2017) based on MODIS fire radiative energy data, Biogeosciences, 16, 1629–1640, https://doi.org/10.5194/bg-16-1629-2019, 2019.
Yuan, B., Shao, M., Lu, S., and Wang, B.: Source profiles of volatile organic compounds associated with solvent use in Beijing, China, Atmos. Environ., 44, 1919–1926, 2010.
Zhang, C., Liu, C., Hu, Q., Cai, Z., Su, W., Xia, C., Zhu, Y., Wang, S., and Liu, J.: Satellite UV-Vis spectroscopy: implications for air quality trends and their driving forces in China during 2005–2017, Light-Sci. Appl., 8, 100, https://doi.org/10.1038/s41377-019-0210-6, 2019.
Zhang, Q., Streets, D. G., Carmichael, G. R., He, K. B., Huo, H., Kannari, A., Klimont, Z., Park, I. S., Reddy, S., Fu, J. S., Chen, D., Duan, L., Lei, Y., Wang, L. T., and Yao, Z. L.: Asian emissions in 2006 for the NASA INTEX-B mission, Atmos. Chem. Phys., 9, 5131–5153, https://doi.org/10.5194/acp-9-5131-2009, 2009.
Zhang, X., Wu, Y., Liu, X., Reis, S., Jin, J., Dragosits, U., Van Damme, M., Clarisse, L., Whitburn, S., Coheur, P.-F., and Gu, B.: Ammonia Emissions May Be Substantially Underestimated in China, Environ. Sci. Technol., 51, 12089–12096, https://doi.org/10.1021/acs.est.7b02171, 2017.
Zhang, Y., Cooper, O. R., Gaudel, A., Thompson, A. M., Nédélec, P., Ogino, S.-Y., and West, J. J.: Tropospheric ozone change from 1980 to 2010 dominated by equatorward redistribution of emissions, Nat. Geosci., 9, 875–879, 2016.
Zhang, Y., West, J. J., Emmons, L. K., Flemming, J., Jonson, J. E., Lund, M. T., Sekiya, T., Sudo, K., Gaudel, A., Chang, K.-L., Nédélec, P., and Thouret, V.: Contributions of World Regions to the Global Tropospheric Ozone Burden Change From 1980 to 2010, Geophys. Res. Lett., 48, e2020GL089184, https://doi.org/10.1029/2020GL089184, 2021.
Zhao, Y., Nielsen, C. P., Lei, Y., McElroy, M. B., and Hao, J.: Quantifying the uncertainties of a bottom-up emission inventory of anthropogenic atmospheric pollutants in China, Atmos. Chem. Phys., 11, 2295–2308, https://doi.org/10.5194/acp-11-2295-2011, 2011.
Zhao, Y., Nielsen, C. P., McElroy, M. B., Zhang, L., and Zhang, J.: CO emissions in China: Uncertainties and implications of improved energy efficiency and emission control, Atmos. Environ., 49, 103–113, 2012.
Zhao, Y., Zhang, J., and Nielsen, C. P.: The effects of recent control policies on trends in emissions of anthropogenic atmospheric pollutants and CO2 in China, Atmos. Chem. Phys., 13, 487–508, https://doi.org/10.5194/acp-13-487-2013, 2013.
Zheng, B., Huo, H., Zhang, Q., Yao, Z. L., Wang, X. T., Yang, X. F., Liu, H., and He, K. B.: High-resolution mapping of vehicle emissions in China in 2008, Atmos. Chem. Phys., 14, 9787–9805, https://doi.org/10.5194/acp-14-9787-2014, 2014.
Zheng, B., Tong, D., Li, M., Liu, F., Hong, C., Geng, G., Li, H., Li, X., Peng, L., Qi, J., Yan, L., Zhang, Y., Zhao, H., Zheng, Y., He, K., and Zhang, Q.: Trends in China's anthropogenic emissions since 2010 as the consequence of clean air actions, Atmos. Chem. Phys., 18, 14095–14111, https://doi.org/10.5194/acp-18-14095-2018, 2018.
Zheng, B., Chevallier, F., Yin, Y., Ciais, P., Fortems-Cheiney, A., Deeter, M. N., Parker, R. J., Wang, Y., Worden, H. M., and Zhao, Y.: Global atmospheric carbon monoxide budget 2000–2017 inferred from multi-species atmospheric inversions, Earth Syst. Sci. Data, 11, 1411–1436, https://doi.org/10.5194/essd-11-1411-2019, 2019.
Zheng, B., Cheng, J., Geng, G., Wang, X., Li, M., Shi, Q., Qi, J., Lei, Y., Zhang, Q., and He, K.: Mapping anthropogenic emissions in China at 1 km spatial resolution and its application in air quality modeling, Sci. Bull., 66, 612–620, 2021.
Zhou, Y., Xing, X., Lang, J., Chen, D., Cheng, S., Wei, L., Wei, X., and Liu, C.: A comprehensive biomass burning emission inventory with high spatial and temporal resolution in China, Atmos. Chem. Phys., 17, 2839–2864, https://doi.org/10.5194/acp-17-2839-2017, 2017.
- Abstract
- Introduction
- Methods and inputs
- Results and discussion
- Inter-comparisons with other bottom-up and top-down emission estimates
- Concluding remarks
- Data availability
- Author contributions
- Competing interests
- Disclaimer
- Special issue statement
- Acknowledgements
- Financial support
- Review statement
- References
- Supplement