the Creative Commons Attribution 4.0 License.
the Creative Commons Attribution 4.0 License.
 | 28 Mar 2024
Influence of lower-tropospheric moisture on local soil moisture–precipitation feedback over the US Southern Great Plains
Gaoyun Wang
Rong Fu
Paul A. Dirmeyer
Joseph A. Santanello
Guiling Wang
Kaighin McColl
Land–atmosphere coupling (LAC) has long been studied, focusing on land surface and atmospheric boundary layer processes. However, the influence of humidity in the lower troposphere (LT), especially that above the planetary boundary layer (PBL), on LAC remains largely unexplored. In this study, we use radiosonde observations from the US Southern Great Plains (SGP) site and an entrained parcel buoyancy model to investigate the impact of LT humidity on LAC there during the warm season (May–September). We quantify the effect of LT humidity on convective buoyancy by measuring the difference between the 2–4 km vertically integrated buoyancy with the influence of background LT humidity and that without it. Our results show that, under dry soil conditions, anomalously high LT humidity is necessary to produce the buoyancy profiles required for afternoon precipitation events (APEs). These APEs under dry soil moisture cannot be explained by commonly used local LAC indices such as the convective triggering potential and low-level humidity index (CTP HILow), which do not account for the influence of the LT humidity. On the other hand, consideration of LT humidity is unnecessary to explain APEs under wet soil moisture conditions, suggesting that the boundary layer moisture alone could be sufficient to generate the required buoyancy profiles. These findings highlight the need to consider the impact of LT humidity, which is often decoupled from the humidity near the surface and is largely controlled by moisture transport, in understanding land–atmospheric feedbacks under dry soil conditions, especially during droughts or dry spells over the SGP.
- Article
(3735 KB) - Full-text XML
-
Supplement
(562 KB) - BibTeX
- EndNote


Land–atmosphere coupling (LAC) plays an important role in determining local and regional climate variability, including surface temperature, humidity, cloud, precipitation, and climate extremes such as drought and floods, especially during the warm season over interior continents (e.g., Fernando et al., 2016; Koster et al., 2004, 2006; Guo et al., 2006; Wang et al., 2007; Roundy and Santanello, 2017; Santanello et al., 2009; Konings et al., 2010; Song et al., 2016; Roundy et al., 2013). To provide a consistent characterization of LAC, the international Global Energy and Water Exchanges (GEWEX) project developed the Local Land-Atmosphere Coupling (LoCo) initiative to coordinate and promote process-level metrics that quantify and characterize LAC (Santanello et al., 2018). The LoCo initiative develops a suite of integrative metrics to quantify the complex relationships and feedback between the land surface and atmosphere. For example, the mixing diagram approach (Santanello et al., 2009) relates the daytime coevolution of 2 m potential temperature and humidity to the energy and water budgets and growth of the planetary boundary layer (PBL). The convective triggering potential and low-level humidity index (CTP HILow; Findell and Eltahir, 2003a) characterize the lower-tropospheric lapse rate and dew point depression of the PBL for convection. The heated condensation framework (HCF, Tawfik et al., 2015a, b) diagnoses the contribution of surface fluxes to convective initiation based on temperature and humidity profiles. The soil moisture–precipitation (SM–P) feedback is one of the most extensively studied land–atmospheric feedbacks in the literature (e.g., Koster et al., 2004; Ferguson and Wood, 2010; Roundy and Santanello, 2017; Santanello et al., 2018), particularly regarding its effects on the frequency and intensity of convective precipitation (e.g., Taylor, 2015; Tuttle and Salvucci, 2016; Yin et al., 2015).
LoCo investigates the links in the chain coupling soil moisture with the PBL, which connect through surface fluxes, 2 m temperature and humidity, PBL growth and entrainment, cloud, and precipitation. However, the humidity in the lower troposphere (LT) above the PBL, i.e., ∼ 2–4 km above ground level (a.g.l.), is not explicitly included in previous research. Recent research indicates that specific humidity in the LT (qLT) plays a central role in triggering (or developing) deep convection in the tropics, subtropics, and mid-latitudes during the warm season (Bretherton et al., 2004; Holloway and Neelin, 2009; Zhang and Klein, 2010; Zhuang et al., 2018) and in the convective initiation driven by land surface heating (Tawfik et al., 2015a, b). The lateral entrainment of qLT dominates buoyancy above the PBL, which is crucial for deep convection development, while entrainment of air at the cloud base has a stronger influence on shallow convection (Holloway and Neelin, 2009; Mapes et al., 2006).
A moist LT can enhance convection by entraining moist air plumes, while low LT humidity can dilute moist plumes originating from the PBL, thereby interfering with the surface influence on convection and precipitation. Thus, qLT determines whether shallow convection can develop into deep convection locally (Schiro et al., 2016; Zhang and Klein, 2010; Zhuang et al., 2017, 2018) and the occurrence and intensity of mesoscale convection (Schiro et al., 2018). qLT is influenced by moisture transport from the PBL (which is largely influenced by the land surface), horizontal moisture advection, and subsidence that mixes dry air from aloft. Therefore, it is important to study the relative influences of land surfaces versus large-scale atmospheric circulation on rainfall and clouds.
The Department of Energy's Atmospheric Radiation Measurement (DOE ARM) project has been pivotal in providing comprehensive datasets for investigating land–atmosphere interactions over the past 2 decades (e.g., Zhang and Klein, 2010; Santanello et al., 2018). Among the various ARM sites, the Southern Great Plains (SGP) site stands out as the project's inaugural site and one of the most heavily instrumented sites. The SGP region is also widely known as a hotspot of land–atmosphere interactions, as evidenced by numerous past studies (e.g., Wakefield et al., 2019; Santanello et al., 2018; Dirmeyer et al., 2006; Koster et al., 2004, 2006; Guo et al., 2006). This study aims to quantify the impact of LT humidity on the SM–P relationship and local LAC at the SGP site by utilizing an entrained parcel buoyancy model (Zhuang et al., 2018) and the correlation between LT humidity and near-surface humidity. The dataset and methods are described in Sect. 2. The results are reported in Sect. 3. Discussion and conclusions are provided in Sect. 4.
2.1 Dataset
This study focuses on the local warm season (May–September) when thermodynamically driven convection is most prevalent and land surface feedback plays an important role in determining precipitation (Myoung and Nielsen-Gammon, 2010). Unless stated otherwise, all measurements are taken at the DOE ARM SGP central facility (CF) in northern–central Oklahoma (36.60° N, 97.48° W) and the region within a 50 km radius of the CF for 2001–2018. Below are the specific details about the datasets used in this study.
2.1.1 Sounding profiles
Sounding profile data at the SGP CF were obtained through balloon sonde observation. These data are available four times daily at 05:30, 11:30, 17:30, and 23:30 local standard time (LST). We only use the 11:30 LST sounding data as they best represent the precondition of afternoon convection. Because the vertical levels vary with each sounding, data were re-gridded into a uniform vertical resolution of 20 m to facilitate composite analysis. Profiles of the dry-bulb temperature (T), dew point temperature (Td), and atmospheric pressure (p) were used to calculate the mixing ratio (r), specific humidity (q), and buoyancy (b) using the entrained parcel model (described in Sect. 2.2.1). The data used are available online at Atmospheric Radiation Measurement (ARM) user facility (2001).
2.1.2 Soil moisture
The fractional water index (FWI) is a normalized measurement specifically developed for the Campbell 229-L soil moisture sensor and ranges from 0 for very dry soil to 1 for saturated soil (Schneider et al., 2003). The FWI can capture soil wetness independently of soil texture, so it standardizes the observation and allows for intercomparison between different sites with different soil types. Most root biomass in the SGP region and its vicinity is within the top 30 cm of the soil profile (e.g., Raz-Yaseef et al., 2015). Because evapotranspiration, a vital link in the SM–P relationship, is heavily influenced by plant and root zone soil moisture, we used the FWI at 25 cm measurement depth provided by the Oklahoma Mesonet Soil Moisture (OKMSOIL) value-added product (VAP) (Atmospheric Radiation Measurement (ARM) user facility, 1998). These data have a 30 min resolution, and we use the average FWI during 06:00–12:00 LST to represent soil moisture conditions before afternoon precipitation at a daily scale. Wet soils are defined as those with a FWI greater than 0.7, which is considered optimal for the plant, and dry soils are defined as having a FWI smaller than 0.4, which could result in water stress and plant wilting (Illston et al., 2008; Wakefield et al., 2019).
2.1.3 Precipitation
The Arkansas-Red Basin River Forecast Center (ABRFC) precipitation data are based on WSR-88D Nexrad radar precipitation estimates and rain gauge reports with extensive quality control (Fulton et al., 1998). This is an hourly gridded data product and is available at Atmospheric Radiation Measurement (ARM) user facility (2016). We used spatially averaged data over the region within a 50 km radius of the SGP CF for this study.
2.1.4 PBL height
PBL height data are obtained from the ARM's Planetary Boundary Layer Height (PBLHT) value-added products derived from radiosonde data using the algorithm developed by Liu and Liang (2010). These data are available at Atmospheric Radiation Measurement (ARM) user facility (2015).
2.2 Quantifying contributions of surface and LT humidity to convective buoyancy
Previous research on local land–atmosphere interaction mainly focused on the influences of surface flux and moisture in the PBL on convection initiation and precipitation, such as those related to HCF and mixing diagram metrics. The CTP HILow metric considers the effect of lapse rate 100–300 hPa (or about 2–4 km) above ground level (a.g.l.) on vertically integrated buoyancy in the LT (i.e., CTP) and humidity of the PBL (i.e., HILow), but it does not account for the impact of LT moisture.
Isolating the local influence from other factors in observations presents a significant challenge. Understanding the relationship between near-surface and upper-level information could be crucial for addressing this. In this study, we first examine the correlation between the q profile in the LT and the mixed-layer humidity (qm), defined as the average q in the 0–1 km a.g.l. mixed layer, to assess the potential influence of land surface on LT moisture (Fig. 1). We choose mixed-layer humidity over humidity directly above the surface to represent the land surface moisture condition because (1) radiosonde measurements near the surface are often more susceptible to errors and local disturbances, which could skew the representation of actual surface moisture conditions; (2) at noon, the 0–1 km mixed layer offers a more representative snapshot of the land surface moisture by capturing the integrated effect of surface evaporation and convective mixing processes; (3) we observe strong correlations, exceeding 0.95 (p<0.05), between the q near the surface and qm. However, this correlation diminishes with increasing height above the PBL. Notably, the LT humidity above 2 km maintains a significant correlation with qm, suggesting a potential influence from the surface. To isolate the effect of the land surface on LT humidity, we establish a “land-coupled LT humidity profile qLC” for 2–4 km a.g.l., which is linked to land surface moisture conditions. This profile is derived using a linear regression between the q(h,t) profile within this layer (2 km 4 km) and qm(t). In our regression model, represented by the equation , y is the q at a given height and time q(h,t) and x is qm(t), with a(h) and b(h) being the linear coefficients at each height level. By solving a(h) and b(h) for each height level in the LT, we can then calculate the land-coupled LT humidity as the fitted LT humidity, i.e., .
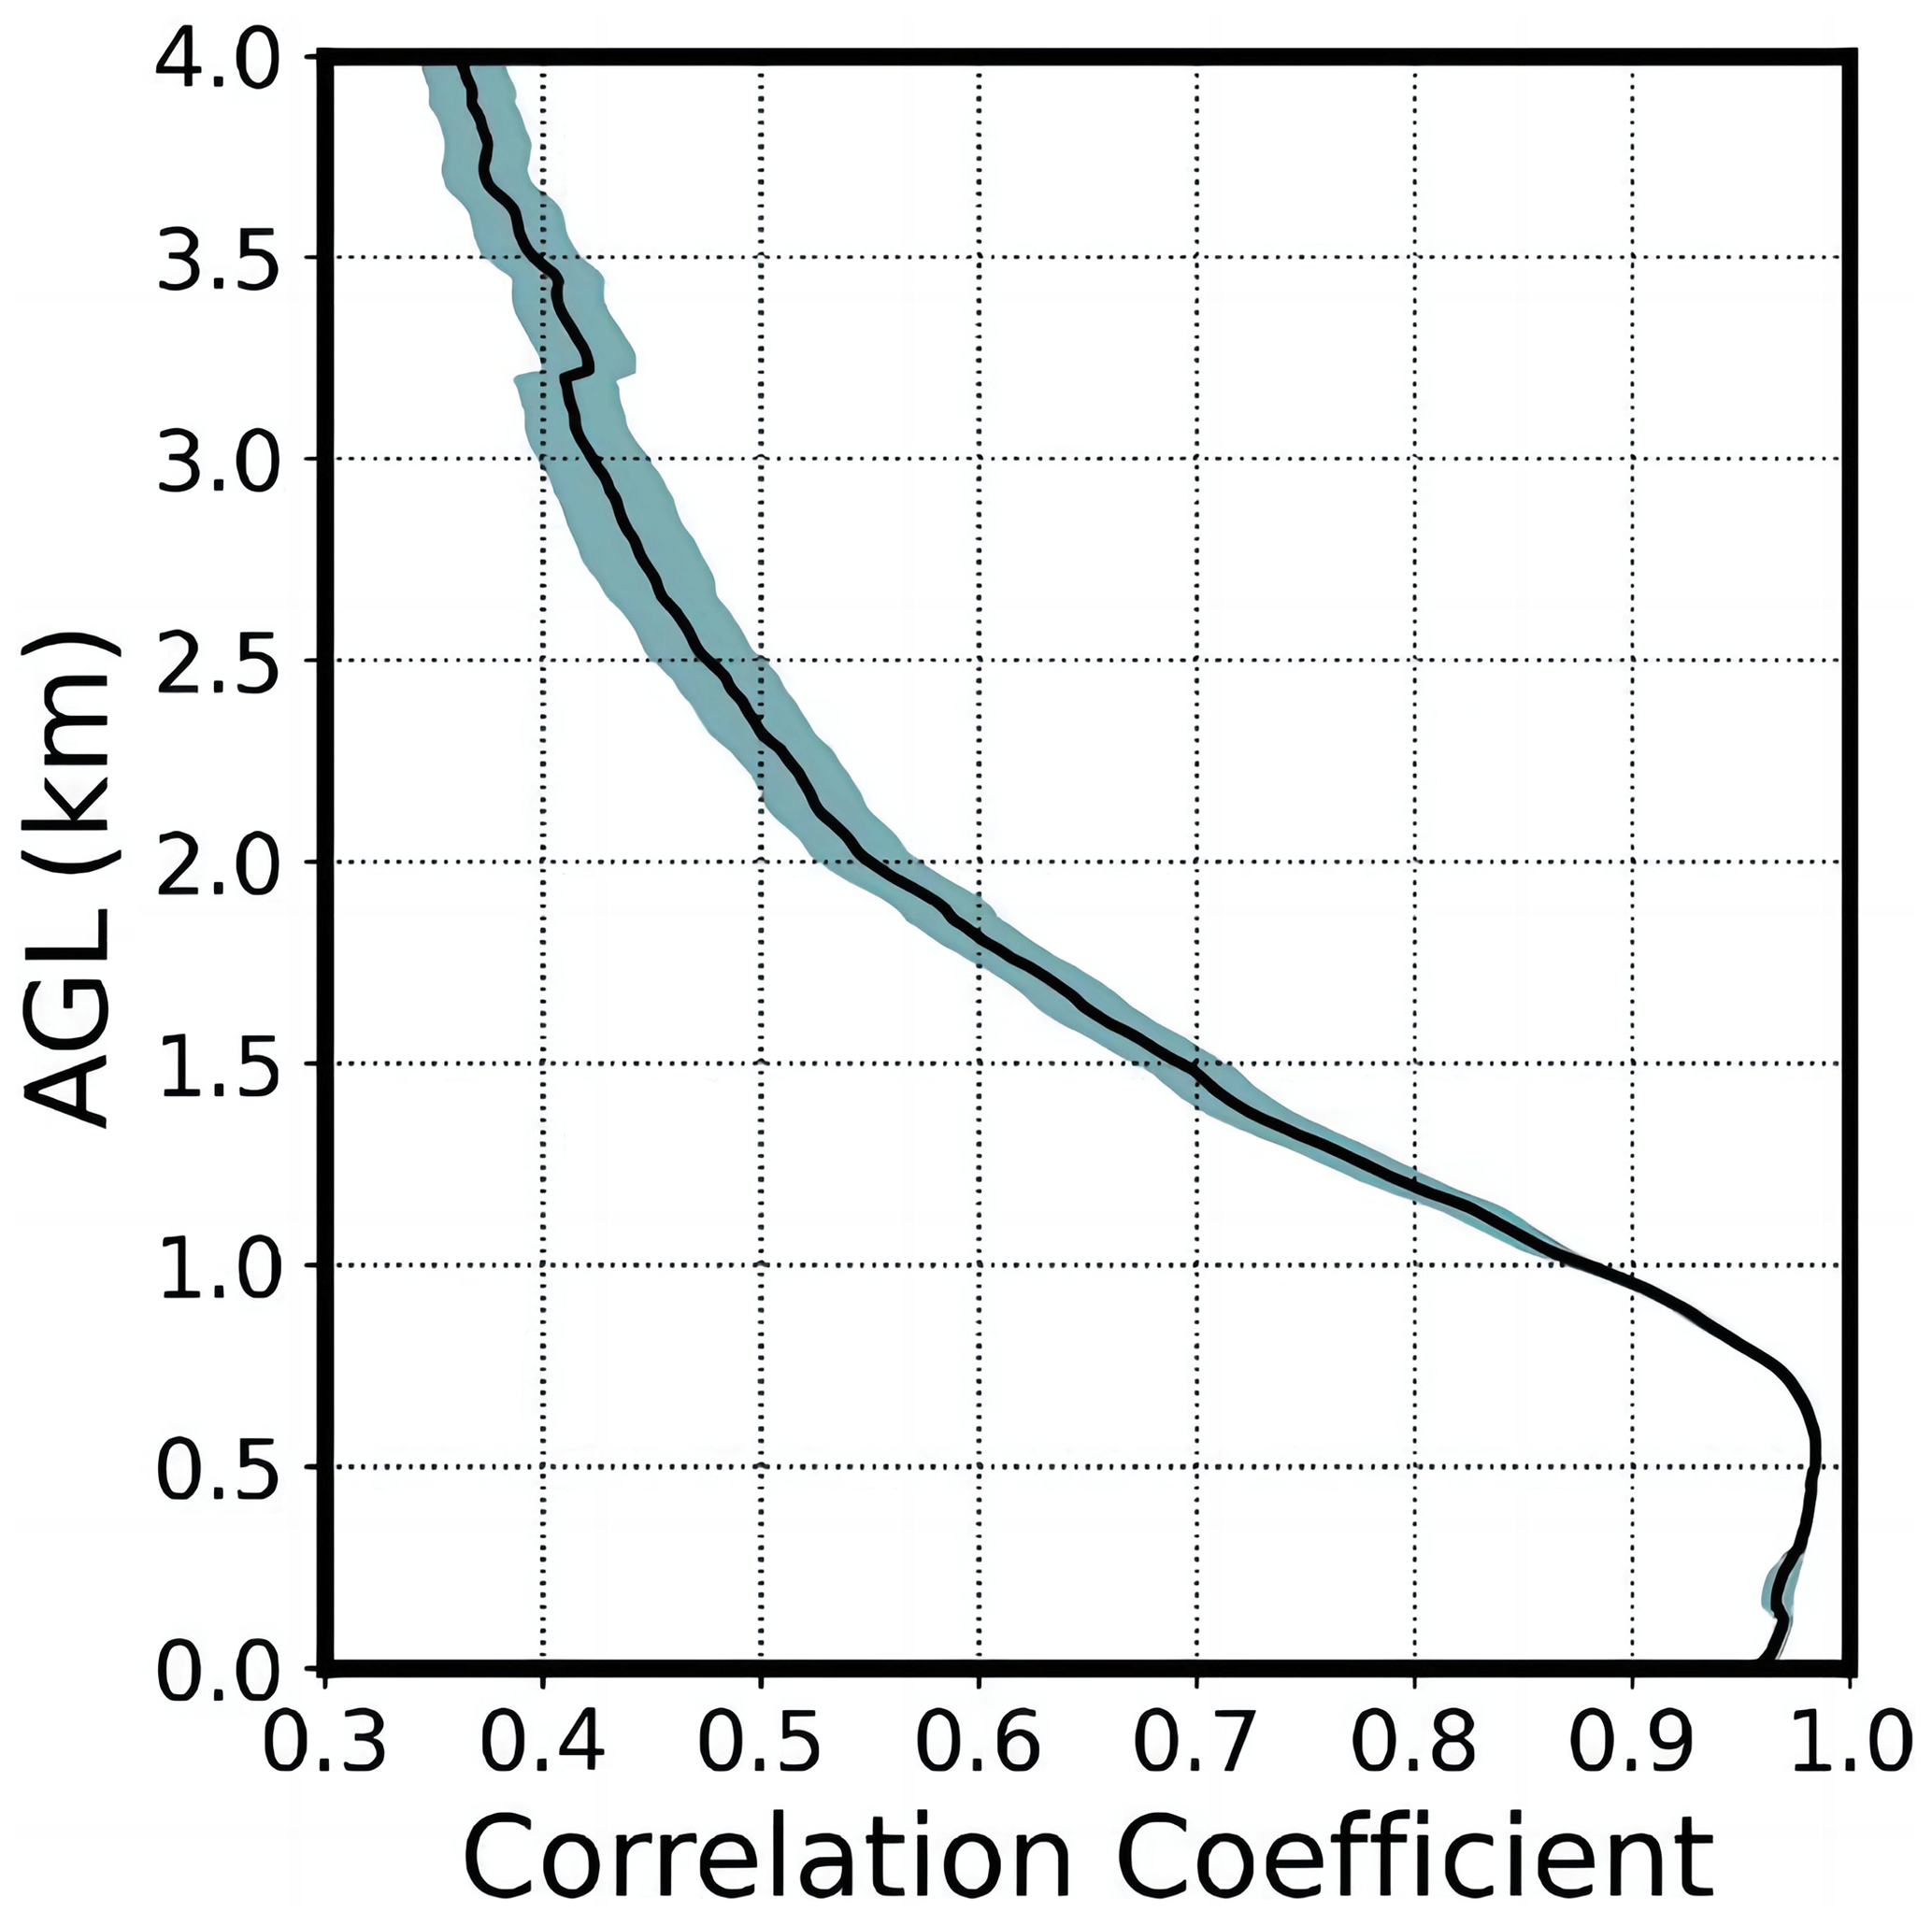
Figure 1Correlation coefficient profiles between the specific humidity (q) at each vertical level from 0 to 4 km a.g.l. and the mean q in the mixed layer (0–1 km a.g.l.). The correlation coefficients are calculated for the warm season of each year. The black line indicates the average value of 18 years, and the green shade shows the standard error. All correlation coefficients at 0–4 km for all 18 years are significant at the 0.05 level.
To quantify the direct influence of LT moisture on convective buoyancy, we adopt an entraining parcel model used in Zhuang et al. (2018). In this model, the air parcel is lifted with the initial condition of an average value within the mixed layer. The ascending air parcel then goes through three processes at each vertical level: a dry adiabatic process (the parcel ascends without interacting with the environment, entropy conservation), an entrainment process (which interacts with ambient air, enthalpy conservation), and a precipitation process (which releases condensate, temperature conservation). We apply the deep-inflow-A entrainment (DIA) scheme which has been shown to more realistically represent the buoyancy profile required for deep convection compared to the other assumptions of the lateral entrainment rates such as the constant fractional entrainment rate scheme (e.g., Holloway and Neelin, 2009; Schiro et al., 2016; Siebesma et al., 2007). The DIA scheme uses an entrainment rate inversely proportional to the altitude (αz−1) for simplicity. All condensates formed from the previous two processes are set to fall out in the precipitation process (pseudo-adiabatic process). Finally, buoyancy is calculated by , where Tpv and Tev are the virtual temperatures of the parcel and the environment, respectively. Details of this model are provided in Zhuang et al. (2018).
To quantify the influence of LT humidity on the lateral entrainment of the convection and, consequently, the buoyancy of the convective air parcel, we consider two q profiles for the lateral entrainment process: (1) the observed humidity profile (qR) and (2) the land-coupled humidity profile (qLC). The qLC below 2 km a.g.l. equals the observed q, and qLC between 2 and 4 km a.g.l. is a coupled LT humidity profile constructed from the regression between q and the averaged q in the mixed layer. Since the effect of entrainment accumulates continuously after the parcel is lifted, we calculate the buoyancy profile with qR as the humidity profile (bR) and that with qLC as the humidity profile (bLC), and then we use the vertical integral of their difference in the LT (2–4 km a.g.l.), , to quantify the additional effect of LT moisture variation on the parcel buoyancy that is not coupled with the PBL. We also calculate the integral of buoyancy based on qLC, i.e., , to assess the land-coupled effect on convection. To make the results comparable, we apply a normal percentile transform (Wilks, 2011) to obtain standardized scores of the BLT, which we use for further analysis.
2.3 Identify dry or wet soil regimes and coupled afternoon precipitation events
The CTP HILow framework developed by Findell and Eltahir (2003a) is commonly used to identify the atmospheric preference of an LAC state. CTP is calculated by integrating the difference between moist adiabat temperature and the ambient temperature profile from 100 to 300 hPa a.g.l. It is a measure of the energy available for convection, and the 100–300 hPa a.g.l. is a critical level for the development of the daytime boundary layer. HILow, on the other hand, indicates the pre-existing moisture of the very lower atmosphere and is defined as HI. In this framework, a wet soil advantage regime occurs when the atmospheric state is closer to the wet adiabatic lapse rate, resulting in a low CTP and large latent heat flux (small HILow). Conversely, a dry soil advantage regime occurs when the temperature profile is close to the dry adiabatic lapse rate with weak thermal stability (high CTP) and the soil provides less water vapor but more heat. This condition favors convection lifted by the boundary layer growth due to high sensible heat fluxes at the surface (Ek and Holtslag, 2004; Huang and Margulis, 2011; Gentine et al., 2013).
We adopt a modified CTP HILow framework proposed by Wakefield et al. (2019) using the standardized score of CTP HILow. We first calculate CTP and HILow using sounding data at 11:30 LST and the average FWI during 06:00–12:00 LST. Then, dry-coupling cases are defined as days with an anomalously high CTP (higher than the climatological CTP for our analysis period) over dry soil (FWI < 0.4), which is similar to the dry soil advantage regime in Findell and Eltahir (2003a, b); wet-coupling cases, on the other hand, are characterized by an anomalously low HILow over wet soil (FWI > 0.7), which corresponds to a moisture-abundant, energy-limited regime where the atmospheric profile is likely near-moist-adiabatic (Findell and Eltahir, 2003a, b). The wet soil condition is expected to promote precipitation recycling through the addition of moist static energy via evapotranspiration and provides a continuous supply of low-level moisture.
Since LAC would mostly affect the thermodynamically driven afternoon convection, we focus on the morning (06:00–13:00 LST), afternoon (14:00–20:00 LST), and evening (21:00–24:00 LST) precipitation events in our analysis. Afternoon precipitation events (APEs) are identified as daily samples that meet the following two criteria: (1) daily precipitation peaks during the afternoon hours defined above, and (2) the afternoon precipitation is at least twice as large as the morning precipitation and also greater than the evening precipitation (filter out organized precipitation). The cases not categorized as APEs are referred to as non-APEs afterward. We obtain a total of 368 APEs from the 2172 soundings. We further select APEs associated with either dry-coupling or wet-coupling conditions, resulting in 94 dry-coupling APEs and 79 wet-coupling APEs. These account for 24.2 % of the total of 388 dry-coupling cases and 20.3 % of the total of 389 wet-coupling cases, respectively. The comparable number of APEs for both dry- and wet-coupling conditions aligns with the finding of Findell and Eltahir (2003b) that the SGP is in the transitional region where negative and positive feedback days occurred with a similar frequency. In addition, our analysis also shows that (Fig. S1 in the Supplement), within all 368 APEs, 16 instances exhibit a HILow lower than 5 °C – a threshold established in Findell and Eltahir (2003a, b). Among these, eight are wet-coupling APEs and have a significantly higher FWI compared to the other groups. This suggests that the low HILow values observed before noon in these cases are likely influenced by soil moisture evaporation rather than purely controlled by atmospheric factors. Furthermore, one of these cases is categorized as a dry-coupling APE and seven as “other APEs”, which are APEs not categorized as either dry-coupling or wet-coupling APEs. These cases likely represent “atmospherically controlled days”, as per the CTP–HILow framework, and only account for a small fraction (∼ 2.2 %) of all the APEs we identified.
3.1 Thermodynamic preconditions for APEs under the dry- and wet-coupling regimes
To identify favorable atmospheric conditions for coupling APEs, we evaluate the differences in temperature (T), specific humidity (q), and relative humidity (RH) at 11:30 LST between averaged local coupling APEs and non-APE cases in the warm seasons (May to September), as shown in Fig. 2. Regardless of soil moisture conditions and coupling regimes, APEs are always associated with a wetter lower troposphere (0–4 km) than non-APEs. For dry-coupling regimes, the increases in q and RH in the PBL and the LT associated with APEs are also stronger than those with the non-APEs, especially between 0.5 and 3.5 km a.g.l., and the contrast between APEs and non-APEs in dry-coupling regimes is larger than that for wet-coupling regimes. These humidity differences are expected, as more humid preconditions favor the occurrence of APEs. Note that the greatest contrast between the RH of APEs and that of non-APEs occurs between 1 and 3.5 km a.g.l. (above the PBL), which is the combined result of high q and decreasing T over this layer, highlighting the possible strong influence of LT humidity on deep convection.
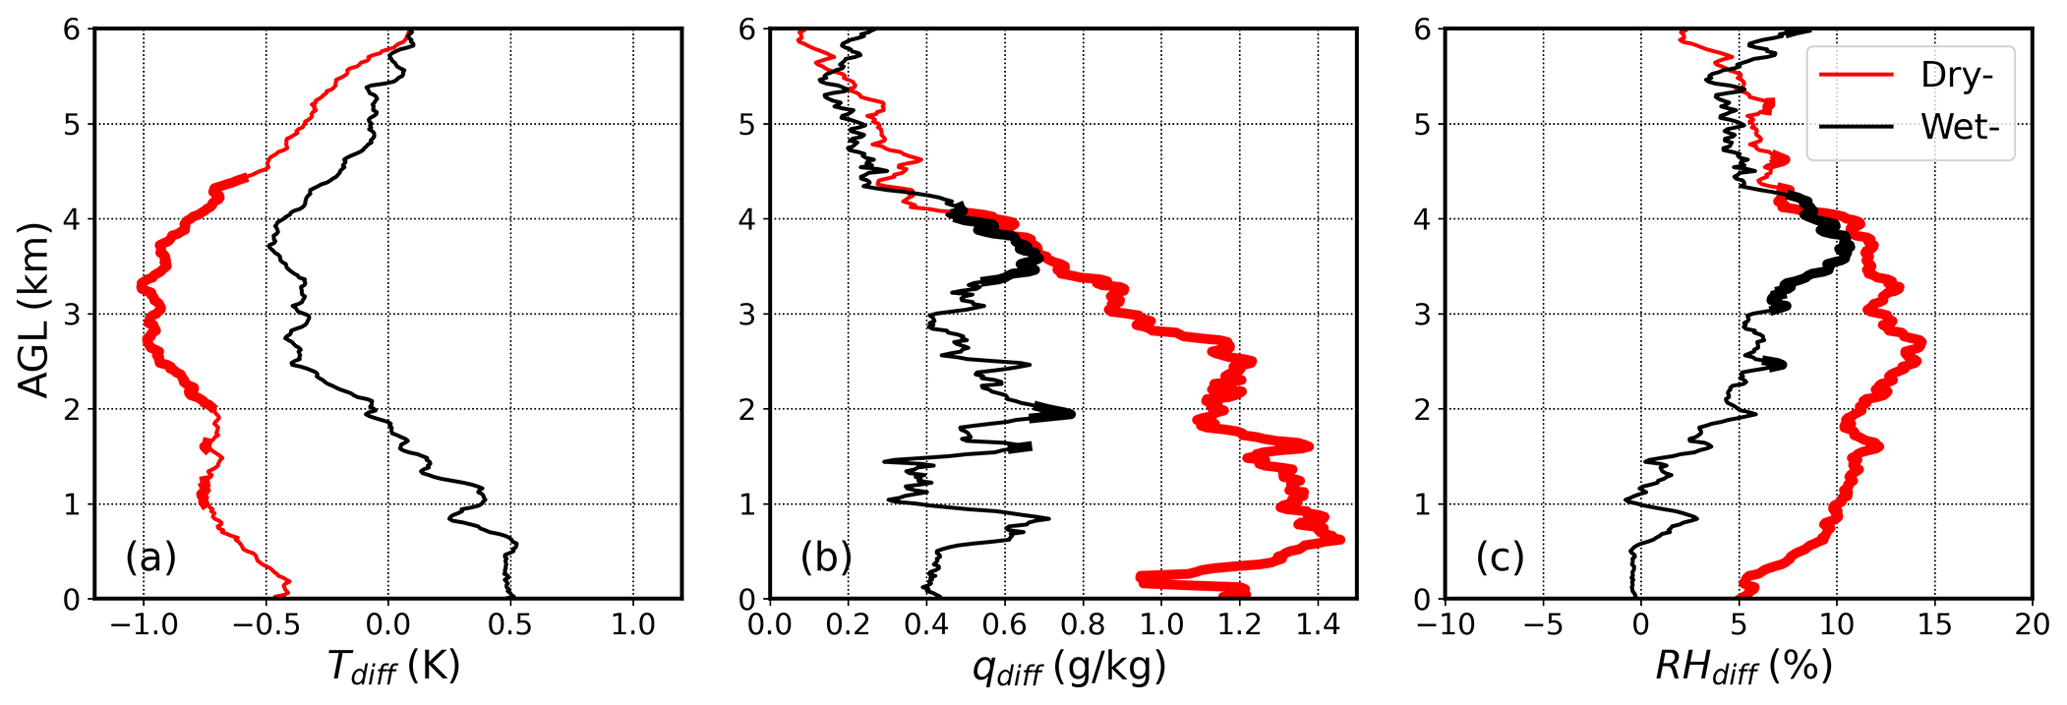
Figure 2Composite difference of (a) temperature (Tdiff), (b) specific humidity (qdiff), and (c) relative humidity (RHdiff) profiles between APEs and non-APEs for dry-coupling (red lines) and wet-coupling (black lines) cases. The thicker portions of the lines indicate where the differences are statistically significant at the 0.05 level.
In contrast, the sign of the temperature difference between APEs and non-APEs below 1.7 km a.g.l. varies between the dry-coupling and wet-coupling regimes. For the dry-coupling regimes, the average temperature of APEs is lower than that of non-APEs. This is presumably due to the stronger surface sensible flux and less stable atmosphere (a steep lapse rate or a faster decrease in temperature with height) associated with APEs than non-APEs under the dry-coupling regime. For the wet-coupling regime, the average temperature of the APEs is warmer than that of the non-APEs below 1.7 km a.g.l. This is consistent with a weaker lapse rate associated with a more humid environment, presumably due to vertical mixing of shallow convection, in the APEs than in the non-APEs. Above 1.7 km a.g.l., the temperature of the APEs is lower than that of the non-APEs for both the dry- and wet-coupling regimes, as expected from less stable thermodynamic conditions in the APEs than in the non-APEs.
To investigate the differences in atmospheric conditions that favor APEs under the dry- versus wet-coupling regimes, we compare the composite differential profiles of RH, q, and T between the dry- and wet-coupling APEs, as shown in Fig. 3. In general, T is higher for APEs under dry-coupling regimes than under wet-coupling regimes (Fig. 3a), especially in the PBL (below 2 km). This can be attributed to stronger sensible heat flux and temperature mixing over a dry surface. Notably, there is a significant difference in LT specific humidity between dry- and wet-coupling regimes (Fig. 3b), with the q associated with APEs slightly lower below 1 km a.g.l. under dry-coupling regimes than under wet-coupling regimes but higher above 1 km, especially between 2 and 3 km a.g.l. This suggests that APEs require entrainment of higher LT moisture under dry-coupling regimes than under wet-coupling regimes. Both Figs. 2b and 3b suggest that higher LT specific humidity is needed for APEs under dry-coupling regimes than under wet-coupling regimes. Moreover, RH associated with dry-coupling regimes is less than that of wet-coupling regimes in the PBL (Fig. 3c), as expected from a drier PBL over a dry surface. However, such an RH difference becomes smaller and eventually disappears in the LT (2–4 km). This is because the lower RH in the dry-coupling regimes is mainly due to a warmer T below 2 km a.g.l. (Fig. 3b), whereas, above 2 km a.g.l., the higher q and slightly warmer T in the dry-coupling regimes balance each other out and lead to a similar RH to the wet-coupling regimes.
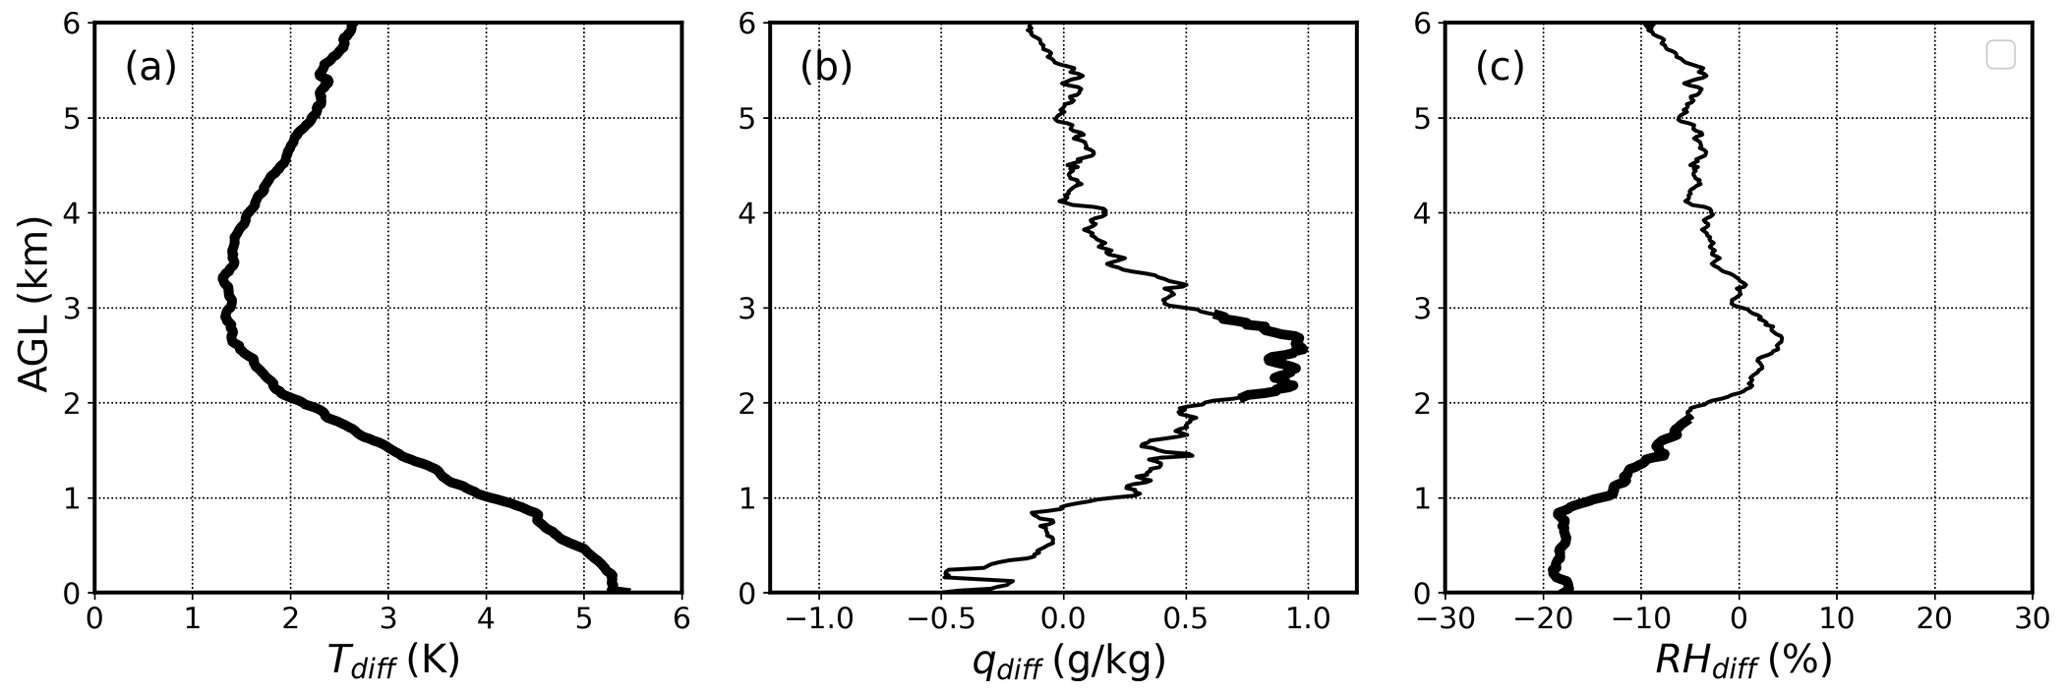
Figure 3Composite difference of (a) temperature (Tdiff), (b) specific humidity (qdiff), and (c) relative humidity (RHdiff) between dry- and wet-coupling APEs (dry minus wet). The thicker portions of the lines indicate where the differences are statistically significant at the 0.05 level.
Recent studies on the SM–P relationship have highlighted the greater impact of soil moisture anomalies on boundary layer stability and precipitation formation than on the ambient moisture (e.g., Seneviratne et al., 2010; Santanello et al., 2018). To investigate how humidity affects the preconditioning of the convective environment and how it impacts instability in the dry- and wet-coupling regimes, we use an entraining parcel model to calculate buoyancy profiles for bR and bLC, respectively, with parcels originating in the mixed layer. We then compute differences in the integral buoyancy between the bR and bLC profiles for the 2–4 km a.g.l. range to explore the influence of LT humidity-related convective thermodynamic instability.
To evaluate the atmospheric thermodynamic structure associated with the BLT, we evaluate the composite average sounding profiles based on three terciles of the BLT in the warm season as shown in Fig. 4. The BLT values for the three terciles range from −55.8 to −8.8, from −8.8 to 10.2, and from 10.0 to 72.8 J kg−1, respectively. It is noteworthy that the temperature and dew point are similar among these three terciles of the BLT near the surface (below 900 hPa) but clearly different from above 900 hPa up to at least 400 hPa a.g.l., which indicates the importance of LT humidity.
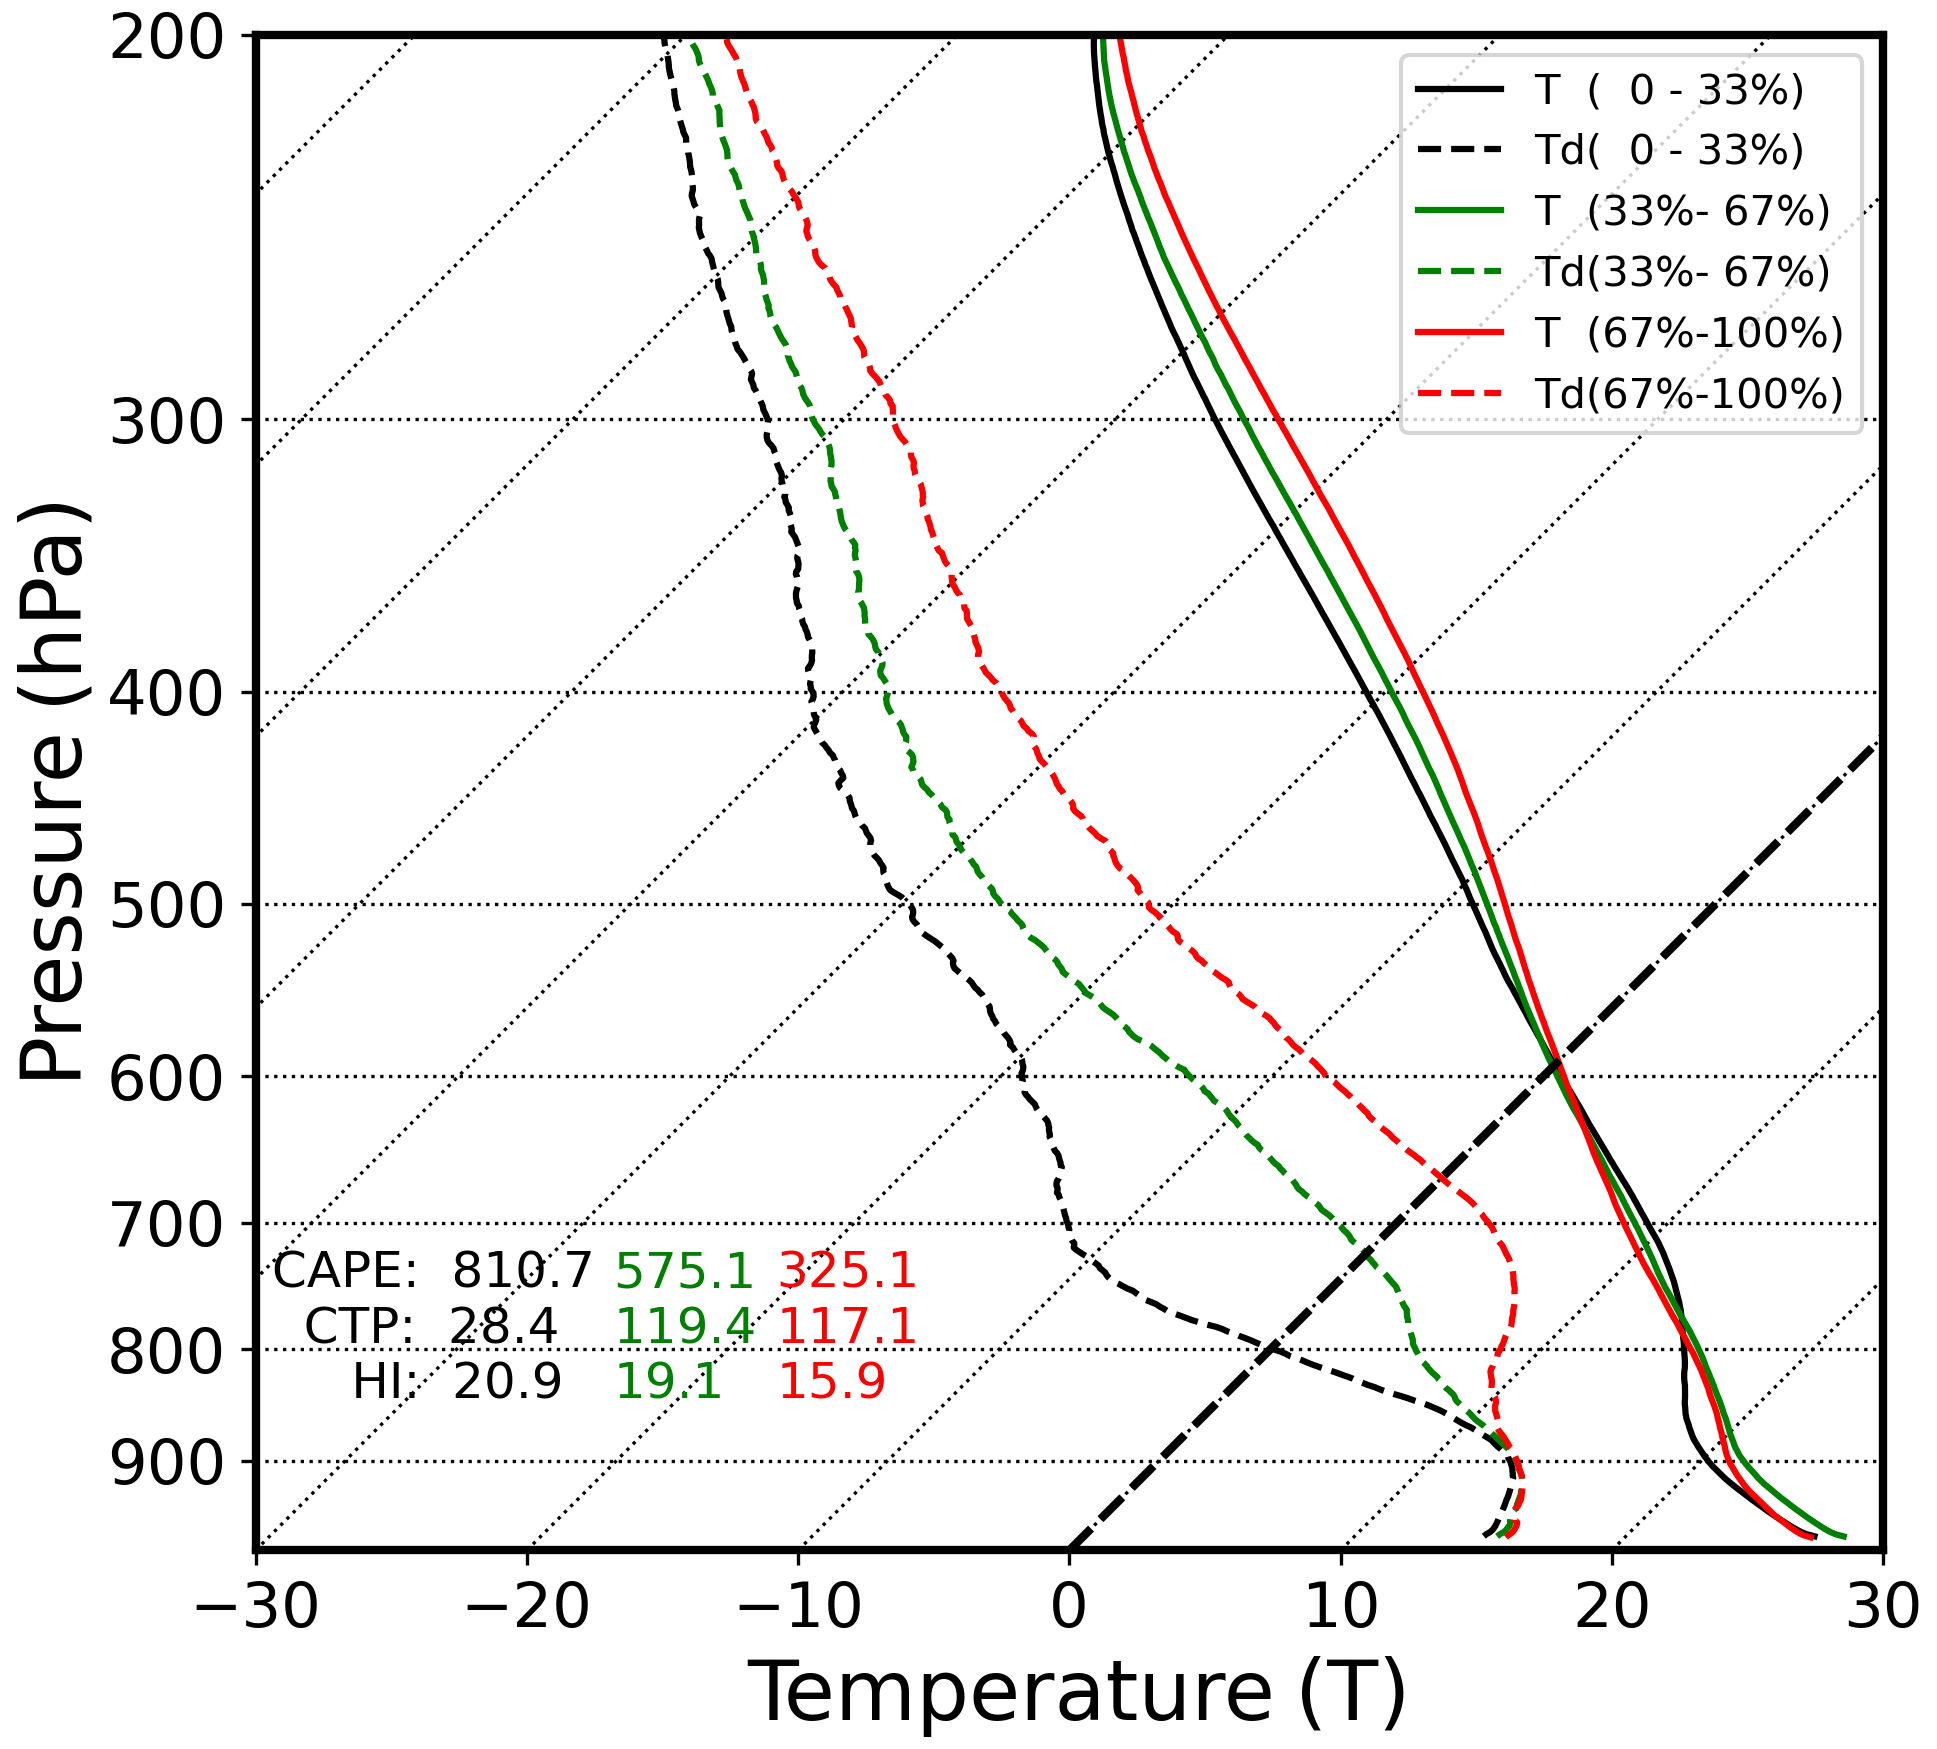
Figure 4Composite temperature (T; solid line) and dew point temperature (Td; dash line) profiles at the ARM SGP site for all days during May–September from 2001 to 2018 above the 950 hPa level, based on the BLT tercile: 0 %–33 % (lower BLT, black), 33 %–67 % (medium BLT, green), and 67 %–100 % bins (higher BLT, red).
For the lower tercile (0 %–33 %) of the BLT, dew point values are substantially lower than those for the middle and upper terciles of the BLT. The sharp decrease in dew point values with height, the near-constant temperature, and the large gap between the temperature and dew point profiles at 700–900 hPa suggest strong dry shallow convection. For the middle tercile, dew point and temperature decrease gradually with a height between 900 and 700 hPa, and the gap between the dew point and temperature profiles is smaller than those for the lower tercile of the BLT. These features suggest a mixture of dry and moist shallow convection. For the upper tercile of the BLT (67 %–100 %), dew point values are nearly constant from the surface to 700 hPa, and the humidity of the free troposphere, as indicated by the gap between the temperature and dew point profiles, is substantially wetter (implying a higher RH) than for the middle and lower terciles of the BLT. These features suggest that moist shallow convection dominates LT. Higher dew point values between 700 and 500 hPa also suggest a more humid middle troposphere associated with the upper BLT tercile than with the middle and lower BLT terciles. Thus, Fig. 4 suggests that BLT variations are strongly influenced by the humidity in the lower and middle troposphere.
3.2 The influence of LT humidity on afternoon precipitation under different LAC regimes
To investigate the effect of the LT humidity versus land surface air humidity on APEs, we evaluate the probability distribution of APEs as a function of the BLT and BLC for dry- and wet-coupling APEs, respectively, in Fig. 5. BLC is usually more negative over dry soil (Fig. 5b) than over wet soil (Fig. 5a) and therefore usually more negative over a dry PBL than over a wet PBL. Figure 5b shows that dry-coupling APEs occur more frequently with a negative BLC (69 %) and a positive BLT (77 %), indicating that the influence of a more humid LT can override the influence of surface air aridity. For the land surface, favoring local precipitation (BLC>0), dry-coupling APEs occur more frequently with a positive BLT (26 %) than with a negative BLT (5 %). For the wet-coupling conditions, 57 % of APEs occur with a positive BLT, while 31 % occur with a humid PBL precondition (Fig. 5a). Overall, for dry-coupling cases, more APEs are associated with a humid LT (positive BLT) than with humid surface air (positive BLC), but this trend is not evident for wet-coupling cases.
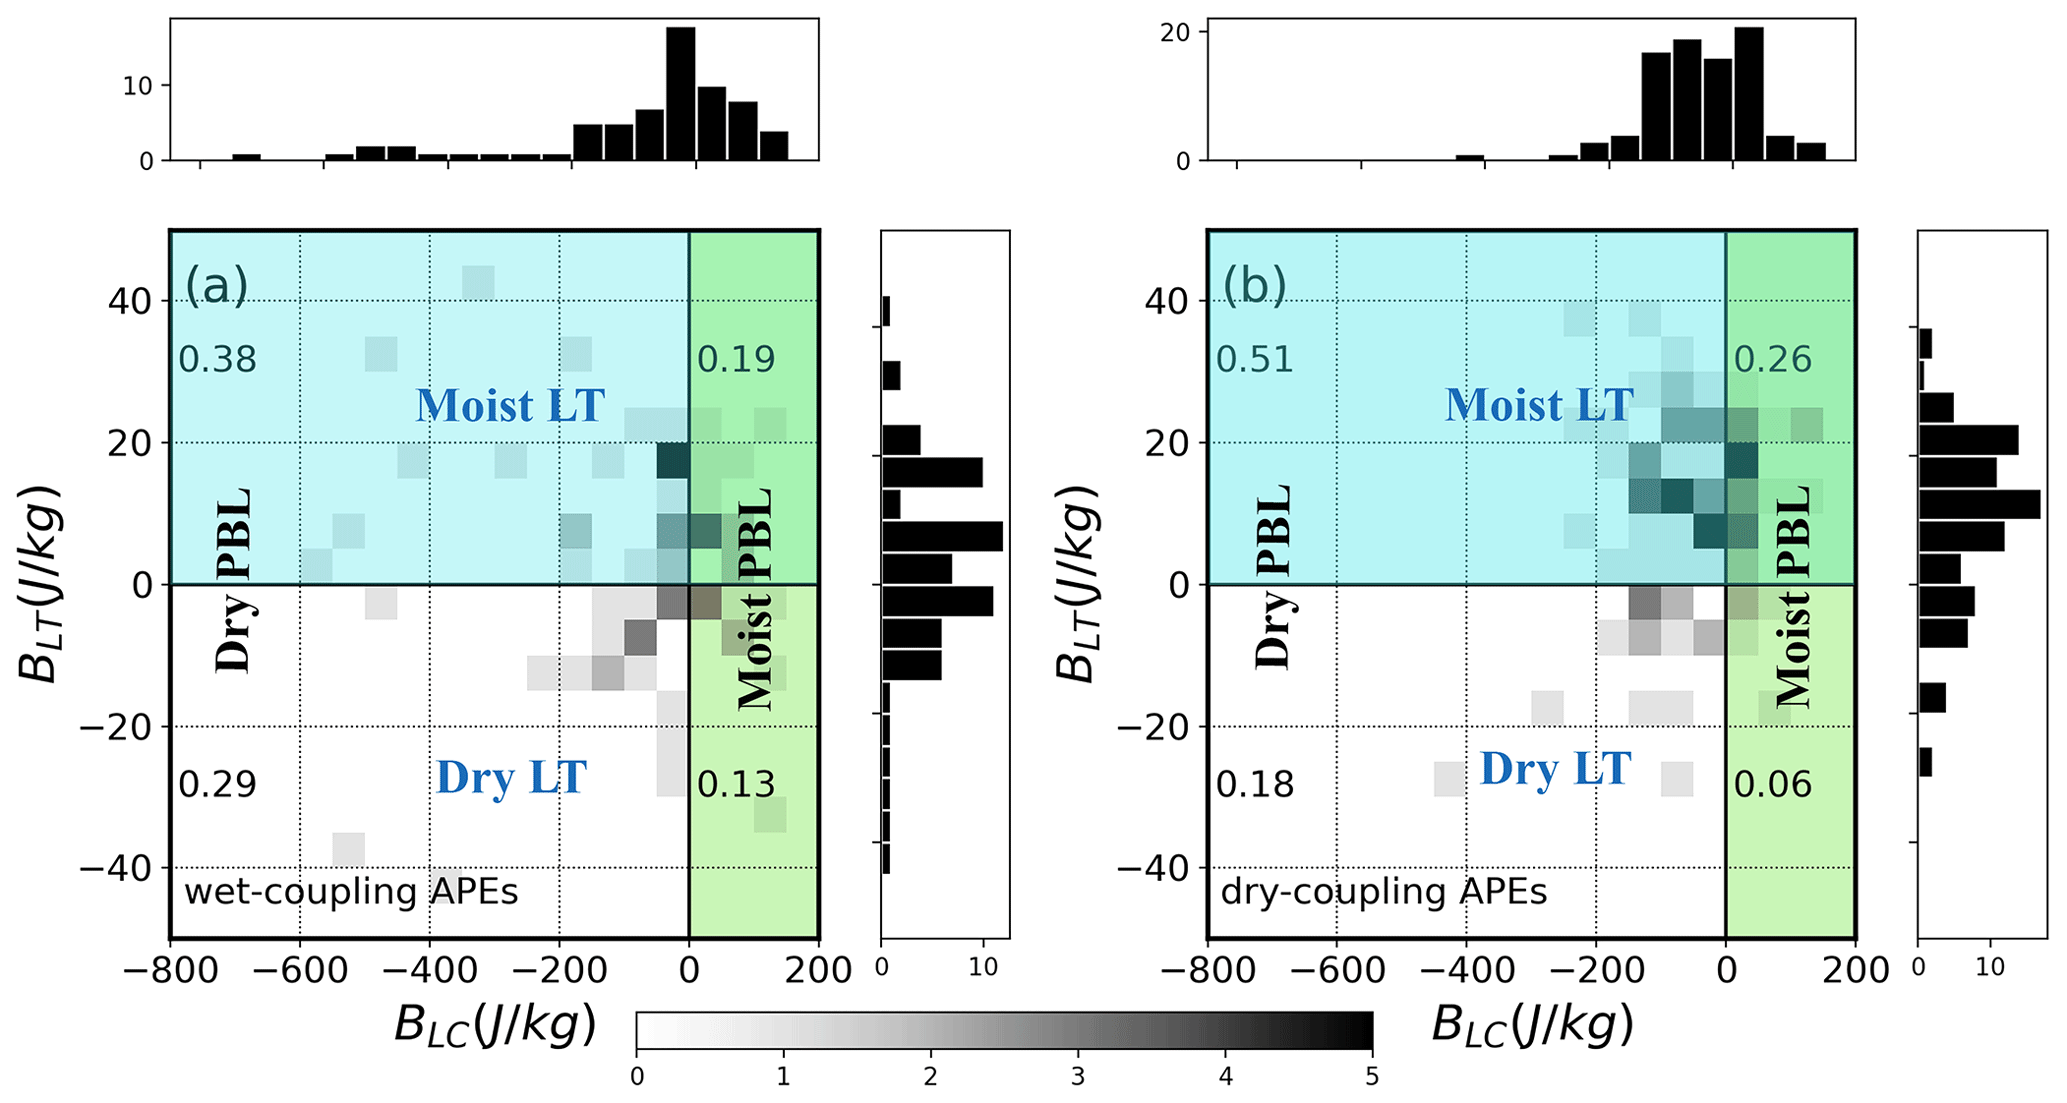
Figure 5Joint frequency distributions of (a) wet-coupling APEs and (b) dry-coupling APEs as a function of the BLT (representing the contribution of LT humidity to convective buoyancy) and BLC (representing the contribution of surface humidity), with white shades representing no APEs and the darkest shades representing more than five APEs occurring in each BLC–BLT bin. The number indicates the fraction in each quadrant.
To evaluate the influence of LT humidity on LAC in the CTP HILow framework, we compare the joint distribution of all APEs, wet-coupling APEs, and dry-coupling APEs, respectively, as a function of BLT scores and HILow scores (Fig. 6) using a normal percentile transform (Wilks, 2011). Larger-than-normal BLT (humid LT) values were associated with 61 % of all the APEs, regardless of the PBL humidity. Smaller-than-normal HILow (humid PBL) occurred in 63 % of all the APEs, regardless of the LT humidity. About 40 % of all the APEs occur under both humid PBL and humid LT. Thus, the probabilities of APEs occurring under either a humid PBL or a humid LT are similar, with a preference for APEs to occur under both humid PBL and humid LT conditions. For dry-coupling conditions, 76 % of the APEs occur under a humid LT versus 59 % under a humid PBL. Therefore, APEs appear to prefer a humid LT more than a humid PBL under dry-coupling conditions, but this preference is not found under wet-coupling conditions. This result is consistent with the findings in Fig. 5.
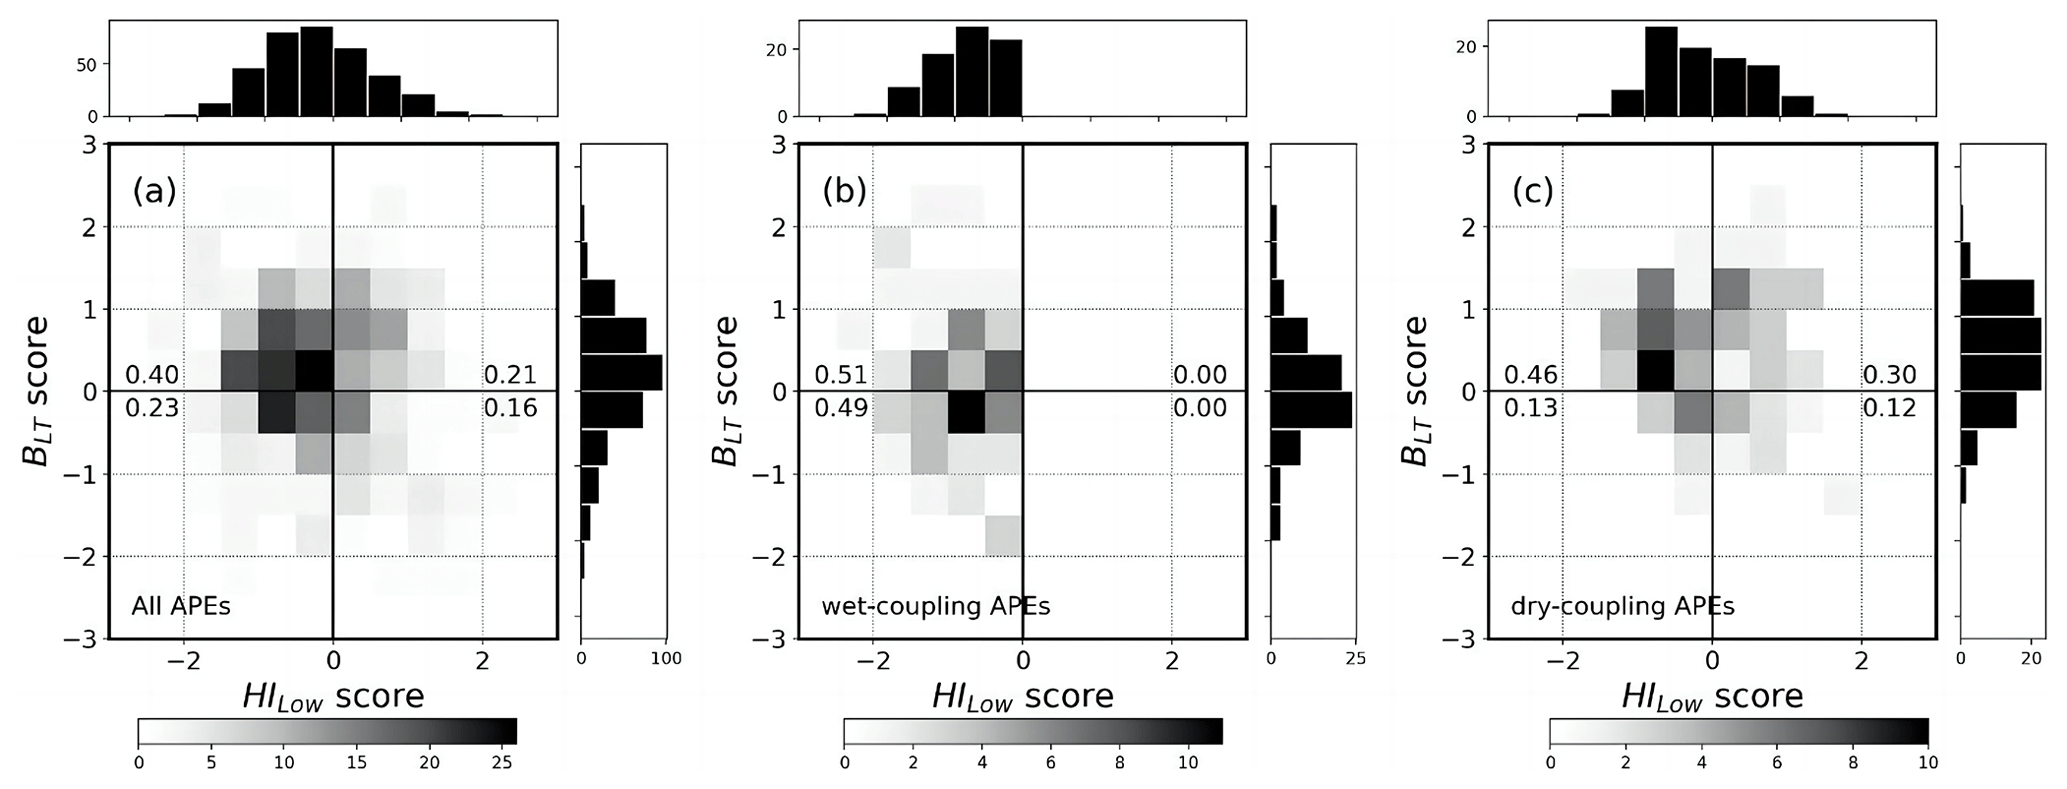
Figure 6Joint distribution of (a) all APEs, (b) wet-coupling APEs, and (c) dry-coupling APEs as functions of the BLT score and the HILow score. The number indicates the fraction in each quadrant.
To further investigate how the LT humidity or BLT can affect the probability of APEs under the dry-coupling and wet-coupling regimes, respectively, we present three statistical measures of APEs as a function of the BLT in Fig. 7. Figure 7a shows that, for the dry-coupling cases, the fractional occurrence of APEs (defined as the proportion of APEs relative to all dry-coupling cases) in each BLT bin increases with BLT up to its 70th percentile, with a significant correlation (R=0.65, p<0.05). For the wet-coupling cases, the fractional occurrence of the APEs peaks when BLT is between the 30th and 70th percentiles. Thus, APEs appear to prefer higher LT humidity under dry coupling than under wet coupling.
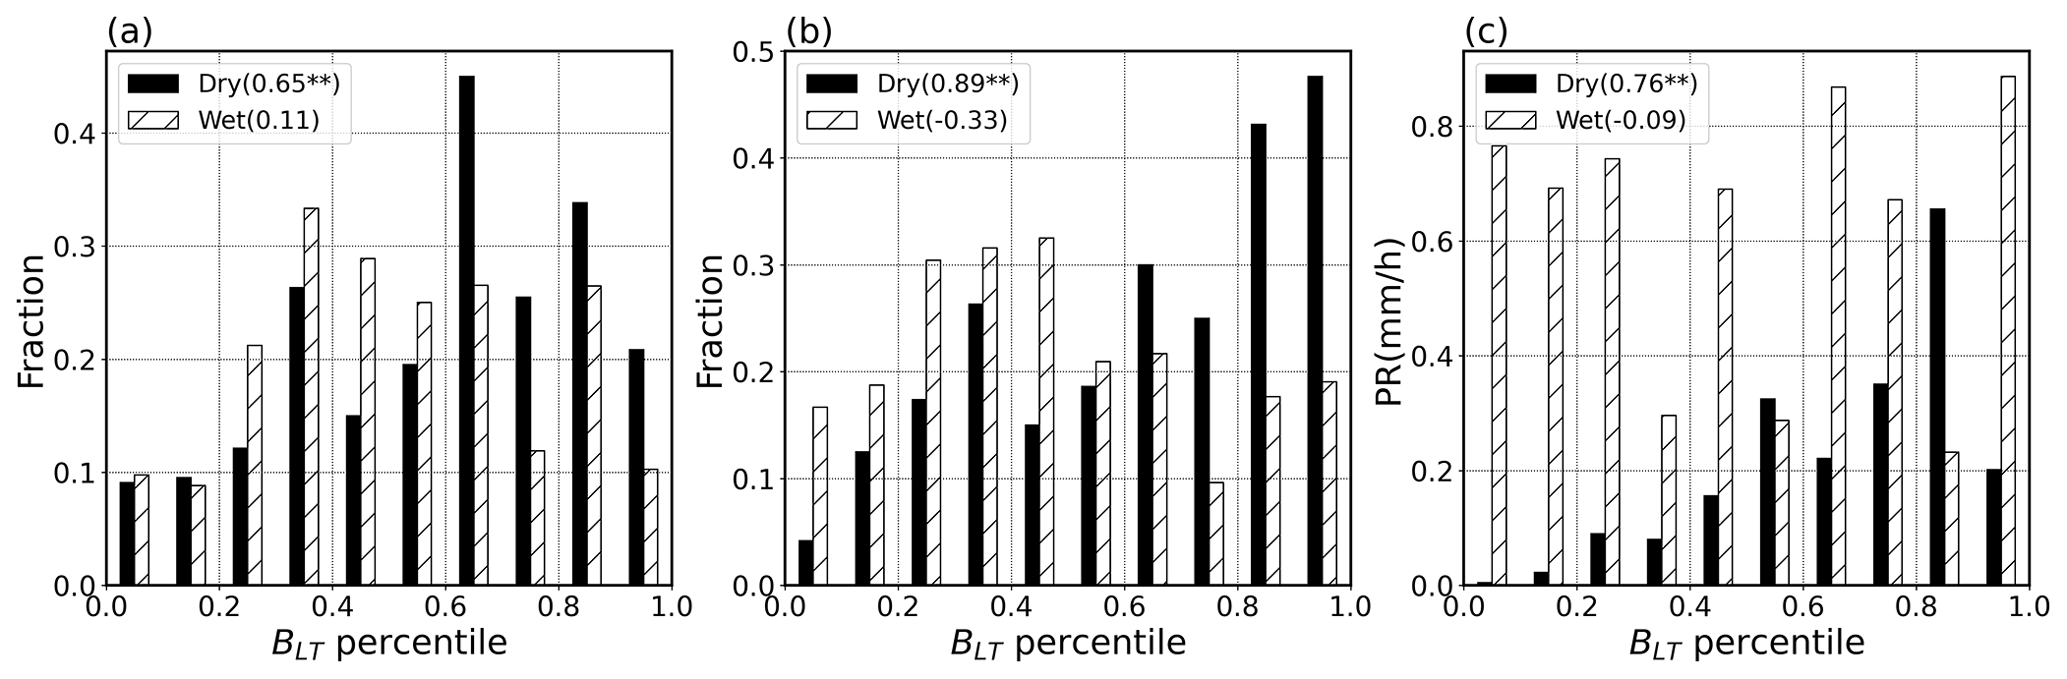
Figure 7(a) The fraction of wet- (dry-) coupling APEs over wet- (dry-) coupling cases ( or ) in each BLT bin for the dry- and wet-coupling cases, respectively. (b) Same as panel (a) but for the percentage of wet- or dry-coupling APEs relative to all the APEs ( and ). (c) Same as panel (a) but for the mean afternoon precipitation rate (PR). The correlation coefficients between BLT percentiles and the fraction or PR are listed for the dry- and wet-coupling cases, respectively; correlation coefficients between BLT percentiles and the y-axis value significant at the 0.05 level are marked with two asterisks.
Next, we explore how BLT affects the partition of dry-coupling and wet-coupling APEs. Figure 7b shows that the proportion of the dry-coupling APEs relative to all the APEs increases with BLT, with a strong correlation (R=0.89, p<0.05). The proportion ranges from 0.04 at the bottom 10 % to 0.47 at the top 10 % of the BLT. However, the proportion of wet-coupling APEs per BLT bin peaks at lower- to medium-BLT percentiles (30 %–50 %) and decreases almost monotonically with an increasing BLT from 50 % to 100 %.
We also investigate how BLT affects rain rates associated with dry-coupling and wet-coupling APEs, respectively. Figure 7c shows a clear increase in the rain rate with BLT for the dry-coupling APEs, except for the 90th to 100th percentiles of the BLT, where there are few APE samples. In contrast, we find no clear dependence of the rain rate on BLT for the wet-coupling APEs. Thus, our findings suggest that a high BLT tends to increase the frequency and intensity of the dry-coupling APEs as well as the relative frequency of dry-coupling APEs compared to wet-coupling APEs.
In addition, we evaluate the variations of deep convection (cloud top height (CTH) > 8 km), shallow convection (CTH < 3 km), and convective congestus (CTH between 3 and 8 km) associated with APEs based on hourly precipitation and cloud fraction following Zhuang et al. (2017). In general, APEs associated with all three convective types increase with BLT under dry-coupling conditions (Fig. S2). Under wet-coupling conditions, APEs associated with deep convection do not exhibit a clear dependence on BLT. However, APEs associated with shallow convection decrease with increasing BLT, while those associated with congestus increase with increasing BLT. These results imply that the increase in BLT can lead to a deepening of shallow convection into congestus due to reduced buoyancy dilution caused by entraining wetter LT air for wet-coupling convection.
Land–atmosphere interactions occur when local land surface and subsurface conditions influence the moisture and energy budgets of the overlying atmosphere. The relative impacts of soil moisture on convective precipitation can vary depending on the atmospheric conditions. In this study, we compared the difference in RH, q, and T profiles between APEs and non-APEs under both dry- and wet-coupling conditions.
Our initial analysis revealed that APEs had an overall wetter PBL and LT (0–4 km a.g.l.) than non-APEs, especially under dry-coupling regimes. The RH difference between APEs and non-APEs in the LT was driven by differences in both q and T, with dry-coupling APEs exhibiting lower humidity in the PBL than wet-coupling APEs. However, as the altitude increases, the difference in RH between dry- and wet-coupling APEs decreases due to the increasing difference in q and a decreasing difference in T. Above 4 km a.g.l., the difference in q becomes zero. Therefore, we could infer the importance of LT humidity in the SM–P relationship, and the APEs under dry-coupling conditions necessitate more LT humidity than those under wet-coupling conditions.
To further investigate the influence of LT humidity on the SM–P relationship, we employ an entraining parcel model and a new metric BLT, which measures the 2–4 km vertical integral of the difference between buoyancy calculated from the observed humidity profile and that correlated with (regressed against) the average specific humidity in the PBL. Statistical analysis reveals that the wetter LT and normal PBL were associated with larger BLT values, whereas a drier LT was linked to smaller BLT values. Moreover, there is a higher likelihood of APEs occurring with a positive BLT percentile under dry-coupling conditions, while this relationship is not apparent for the probability distribution of the BLT percentile for wet-coupling APEs. Additionally, as the BLT percentile increases, the frequency of dry-coupling APEs also increases, whereas the opposite tendency was observed for wet-coupling APEs. In the meantime, the ratio of dry-coupling APEs to all APEs increases with the BLT percentile, while this tendency is the opposite for the ratio of wet-coupling APEs to all APEs. Regarding precipitation, the average rain rate tends to rise with an increasing BLT percentile under dry-coupling conditions, but this trend is not significant for wet-coupling APEs. Overall, our results indicate that the impact of LT humidity differs between dry- and wet-coupling APEs, with dry-coupling APEs being more influenced by LT humidity compared to wet-coupling APEs.
The Great Plains low-level jet (GPLLJ) is widely acknowledged as a primary mechanism responsible for the regional-scale water vapor transport from the Gulf of Mexico during May–September. The GPLLJ creates a thermodynamic environment that facilitates convection and precipitation, making it a key factor in initiating and sustaining mesoscale weather phenomena (e.g., Higgins et al., 1997; Hodges and Pu, 2019; Mo et al., 1997; Pu et al., 2016; Pu and Dickinson, 2014; Weaver and Nigam, 2008). It is well established that the GPLLJ can enhance the occurrence of nocturnal convective precipitation in the SGP (Pu and Dickinson, 2014). However, our findings imply that the moisture carried by the GPLLJ could also play an important role in generating local diurnal afternoon precipitation when it reaches the region during the daytime, particularly under dry soil conditions. This result is consistent with Ford et al. (2015) in that soil moisture feedback to precipitation could potentially manifest itself over wetter- and drier-than-normal soils, depending on the overall synoptic and dynamic conditions, and precipitation favors dry soil when the low-level jet is present. Therefore, these results collectively suggest that the GPLLJ plays a significant role in alleviating drought conditions in the SGP by influencing both diurnal and nocturnal precipitation.
Our study not only presents new insights into the role of LT humidity in the SM–P relationship but also serves as a quantitative elucidation of the negative feedback behavior discussed in Findell and Eltahir (2003b) using the CTP-HILow framework. Specifically, they highlighted the topographic and dynamical circumstances that commonly result in a moist air layer originating from the elevated Mexican plateau, typically with its base around 850 hPa. This moist layer, while not captured by the HILow metric, can be detected by our approach. However, there are still limitations in our work. One key concern is the potential uncertainties introduced by constructing the land-coupled LT humidity profile via linear regression. Such uncertainties arise mainly from the linear model's inherent assumptions, including the constancy of relationships under varying conditions and the potential oversight of nonlinearity. A more thorough investigation into the model's residuals and additional sensitivity analyses could provide deeper insights into these uncertainties. Furthermore, our categorization of APEs may not always be associated with convective precipitation, given that it relies solely on the region-average precipitation data. Improving the classification of APEs, possibly by integrating convection classification results from radar observations, could lead to more precise interpretations. This study only focuses on a single location, i.e., the SGP. Thus, expanding research to include a variety of climatic zones would be crucial for assessing the broader applicability of our methods and conclusions. Our future work will also involve investigating the primary source of LT humidity and employing both BLT and CTP HILow as atmospheric indicators to identify global regions with diverse LT humidity–SM–P relationships, thereby advancing our understanding of LAC on a broader scale.
Codes developed for generating the results of this study can be provided by the corresponding author upon reasonable request.
Data were obtained from the Atmospheric Radiation Measurement (ARM) user facility, a U.S. Department of Energy (DOE) Office of Science User Facility managed by the Biological and Environmental Research Program. ARM data can be accessed openly via https://www.arm.gov/data/ (ARM Data Center, 2024). The Sect. 2.1 dataset lists detailed links to the specific data products used in this study.
The supplement related to this article is available online at: https://doi.org/10.5194/acp-24-3857-2024-supplement.
RF designed the research. RF, YZ, and GW developed the methodology. GW performed the formal analysis and wrote the initial draft. All the authors reviewed and edited the draft.
The contact author has declared that none of the authors has any competing interests.
Publisher’s note: Copernicus Publications remains neutral with regard to jurisdictional claims made in the text, published maps, institutional affiliations, or any other geographical representation in this paper. While Copernicus Publications makes every effort to include appropriate place names, the final responsibility lies with the authors.
We thank Kirsten Findell and an anonymous reviewer for their constructive comments.
Gaoyun Wang was supported by the China Scholarship Council (grant no. 201806010052). Rong Fu and Yizhou Zhuang were supported by the National Oceanic and Atmospheric Administration-Climate Program Office (NOAA-CPO) (grant no. NA20OAR4310426) and the National Science Foundation (NSF) (grant no. AGS-2214697). Paul A. Dirmeyer was supported by the National Aeronautics and Space Administration (NASA) (grant no. 80NSSC21K1801). Joseph A. Santanello was supported by funding from NASA HQ and PM Jared Entin.
This paper was edited by Joshua Fu and reviewed by Kirsten Findell and one anonymous referee.
ARM Data Center: https://www.arm.gov/data/, last access: 24 September 2020.
Atmospheric Radiation Measurement (ARM) user facility: Oklahoma Mesonet Soil Moisture (OKMSOIL), ARM Data Center [data set], https://www.arm.gov/capabilities/science-data-products/vaps/okmsoil (last access: 12 June 2020), 1998.
Atmospheric Radiation Measurement (ARM) user facility: Balloon-Borne Sounding System (SONDEWNPN), ARM Data Center [data set], https://doi.org/10.5439/1595321, 2001.
Atmospheric Radiation Measurement (ARM) user facility: Planetary Boundary Layer Height (PBLHTSONDE1MCFARL), ARM Data Center [data set], https://doi.org/10.5439/1991783, 2015.
Atmospheric Radiation Measurement (ARM) user facility: Arkansas-Red Basin River Forecast Center (ABRFCPCPQPE), ARM Data Center [data set], https://www.arm.gov/capabilities/science-data-products/vaps/abrfc (last access: 16 November 2019), 2016.
Bretherton, C. S., Peters, M. E., and Back, L. E.: Relationships between water vapor path and precipitation over the tropical oceans, J. Climate, 17, 1517–1528, https://doi.org/10.1175/1520-0442(2004)017<1517:RBWVPA>2.0.CO;2, 2004.
Dirmeyer, P. A., Koster, R. D., and Guo, Z.: Do Global Models Properly Represent the Feedback between Land and Atmosphere?, J. Hydrometeorol., 7, 1177–1198, https://doi.org/10.1175/JHM532.1, 2006.
Ek, M. B. and Holtslag, A. A. M.: Influence of soil moisture on boundary layer cloud development, J. Hydrometeorol., 5, 86–99, https://doi.org/10.1175/1525-7541(2004)005<0086:IOSMOB>2.0.CO;2, 2004.
Ferguson, C. R. and Wood, E. F.: An evaluation of satellite remote sensing data products for land surface hydrology: Atmospheric infrared sounder, J. Hydrometeorol., 11, 1234–1262, https://doi.org/10.1175/2010JHM1217.1, 2010.
Fernando, D. N., Mo, K. C., Fu, R., Pu, B., Bowerman, A., Scanlon, B. R., Solis, R. S., Yin, L., Mace, R. E., Mioduszewski, J. R., Ren, T., and Zhang, K.: What caused the spring intensification and winter demise of the 2011 drought over Texas?, Clim. Dynam., 47, 3077–3090, https://doi.org/10.1007/s00382-016-3014-x, 2016.
Findell, K. L. and Eltahir, E. A. B.: Atmospheric controls on soil moisture-boundary layer interactions. Part I: Framework development, J. Hydrometeorol., 4, 552–569, https://doi.org/10.1175/1525-7541(2003)004<0552:ACOSML>2.0.CO;2, 2003a.
Findell, K. L. and Eltahir, E. A. B.: Atmospheric Controls on Soil Moisture-Boundary Layer Interactions. Part II: Feedbacks within the Continental United States, J. Hydrometeorol., 4, 570–583, https://doi.org/10.1175/1525-7541(2003)004<0570:ACOSML>2.0.CO;2, 2003b.
Ford, T. W., Rapp, A. D., and Quiring, S. M.: Does afternoon precipitation occur preferentially over dry or wet soils in Oklahoma?, J. Hydrometeorol., 16, 874–888, https://doi.org/10.1175/JHM-D-14-0005.1, 2015.
Fulton, R. A., Breidenbach, J. P., Seo, D. J., Miller, D. A., and O'Bannon, T.: The WSR-88D rainfall algorithm, Weather Forecast., 13, 377–395, https://doi.org/10.1175/1520-0434(1998)013<0377:TWRA>2.0.CO;2, 1998.
Gentine, P., Holtslag, A. A. M., D'Andrea, F., and Ek, M.: Surface and atmospheric controls on the onset of moist convection over land, J. Hydrometeorol., 14, 1443–1462, https://doi.org/10.1175/JHM-D-12-0137.1, 2013.
Guo, Z., Dirmeyer, P. A., Koster, R. D., Bonan, G., Chan, E., Cox, P., Gordon, C. T., Kanae, S., Kowalczyk, E., Lawrence, D., Liu, P., Lu, C. H., Malyshev, S., McAvaney, B., McGregor, J. L., Mitchell, K., Mocko, D., Oki, T., Oleson, K. W., Pitman, A., Sud, Y. C., Taylor, C. M., Verseghy, D., Vasic, R., Xue, Y., and Yamada, T.: GLACE: The Global Land-Atmosphere Coupling Experiment. Part II: Analysis, J. Hydrometeorol., 7, 611–625, https://doi.org/10.1175/JHM511.1, 2006.
Higgins, R. W., Yao, Y., Yarosh, E. S., Janowiak, J. E., and Mo, K. C.: Influence of the Great Plains Low-Level Jet on Summertime Precipitation and Moisture Transport over the Central United States, J. Climate, 10, 481–507, https://doi.org/10.1175/1520-0442(1997)010<0481:IOTGPL>2.0.CO;2, 1997.
Hodges, D. and Pu, Z.: Characteristics and variations of low-level jets in the contrasting warm season precipitation extremes of 2006 and 2007 over the Southern Great Plains, Theor. Appl. Climatol., 136, 753–771, https://doi.org/10.1007/s00704-018-2492-7, 2019.
Holloway, C. E. and Neelin, D. J.: Moisture vertical structure, column water vapor, and tropical deep convection, J. Atmos. Sci., 66, 1665–1683, https://doi.org/10.1175/2008JAS2806.1, 2009.
Huang, H. Y. and Margulis, S. A.: Investigating the impact of soil moisture and atmospheric stability on cloud development and distribution using a coupled large-eddy simulation and land surface model, J. Hydrometeorol., 12, 787–804, https://doi.org/10.1175/2011JHM1315.1, 2011.
Illston, B. G., Basara, J. B., Fisher, D. K., Elliott, R., Fiebrich, C. A., Crawford, K. C., Humes, K., and Hunt, E.: Mesoscale monitoring of soil moisture across a statewide network, J. Atmos. Ocean. Technol., 25, 167–182, https://doi.org/10.1175/2007JTECHA993.1, 2008.
Konings, A. G., Katul, G. G., and Porporato, A.: The rainfall-no rainfall transition in a coupled land-convective atmosphere system, Geophys. Res. Lett., 37, L14401, https://doi.org/10.1029/2010GL043967, 2010.
Koster, R. D., Dirmeyer, P. A., Guo, Z., Bonan, G., Chan, E., Cox, P., Gordon, C. T., Kanae, S., Kowalczyk, E., Lawrence, D. and Liu, P.: Regions of strong coupling between soil moisture and precipitation, Science, 305, 1138–1140, https://doi.org/10.1126/science.1100217, 2004.
Koster, R. D., Guo, Z., Dirmeyer, P. A., Bonan, G., Chan, E., Cox, P., Davies, H., Gordon, C. T., Kanae, S., Kowalczyk, E., Lawrence, D., Liu, P., Lu, C. H., Malyshev, S., McAvaney, B., Mitchell, K., Mocko, D., Oki, T., Oleson, K. W., Pitman, A., Sud, Y. C., Taylor, C. M., Verseghy, D., Vasic, R., Xue, Y., and Yamada, T.: GLACE: The Global Land-Atmosphere Coupling Experiment. Part I: Overview, J. Hydrometeorol., 7, 590–610, https://doi.org/10.1175/JHM510.1, 2006.
Liu, S. and Liang, X. Z.: Observed diurnal cycle climatology of planetary boundary layer height, J. Climate, 23, 5790–5809, https://doi.org/10.1175/2010JCLI3552.1, 2010.
Mapes, B., Tulich, S., Lin, J., and Zuidema, P.: The mesoscale convection life cycle: Building block or prototype for large-scale tropical waves?, Dynam. Atmos. Oceans, 42, 3–29, https://doi.org/10.1016/j.dynatmoce.2006.03.003, 2006.
Mo, K. C., Paegle, J. N., and Higgins, R. W.: Atmospheric processes associated with summer floods and droughts in the central United States, J. Climate, 10, 3028–3046, https://doi.org/10.1175/1520-0442(1997)010<3028:APAWSF>2.0.CO;2, 1997.
Myoung, B. and Nielsen-Gammon, J. W.: The convective instability pathway to warm season drought in Texas. Part I: The role of convective inhibition and its modulation by soil moisture, J. Climate, 23, 4461–4473, https://doi.org/10.1175/2010JCLI2946.1, 2010.
Pu, B. and Dickinson, R. E.: Diurnal Spatial Variability of Great Plains Summer Precipitation Related to the Dynamics of the Low-Level Jet, J. Atmos. Sci., 71, 1807–1817, https://doi.org/10.1175/JAS-D-13-0243.1, 2014.
Pu, B., Dickinson, R. E., and Fu, R.: Dynamical connection between Great Plains low-level winds and variability of central Gulf States precipitation, J. Geophys. Res.-Atmos., 121, 3421–3434, https://doi.org/10.1002/2015JD024045, 2016.
Raz-Yaseef, N., Billesbach, D. P., Fischer, M. L., Biraud, S. C., Gunter, S. A., Bradford, J. A., and Torn, M. S.: Vulnerability of crops and native grasses to summer drying in the U.S. Southern Great Plains, Agr. Ecosyst. Environ., 213, 209–218, https://doi.org/10.1016/j.agee.2015.07.021, 2015.
Roundy, J. K. and Santanello, J. A.: Utility of Satellite Remote Sensing for Land–Atmosphere Coupling and Drought Metrics, J. Hydrometeorol., 18, 863–877, https://doi.org/10.1175/jhm-d-16-0171.1, 2017.
Roundy, J. K., Ferguson, C. R., and Wood, E. F.: Temporal Variability of Land-Atmosphere Coupling and Its Implications for Drought over the Southeast United States, J. Hydrometeorol., 14, 622–635, https://doi.org/10.1175/JHM-D-12-090.1, 2013.
Santanello, J. A., Peters-Lidard, C. D., Kumar, S. V., Alonge, C., and Tao, W.: A Modeling and Observational Framework for Diagnosing Local Land–Atmosphere Coupling on Diurnal Time Scales, J. Hydrometeorol., 10, 577–599, https://doi.org/10.1175/2009JHM1066.1, 2009.
Santanello, J. A., Dirmeyer, P. A., Ferguson, C. R., Findell, K. L., Tawfik, A. B., Berg, A., Ek, M., Gentine, P., Guillod, B. P., Van Heerwaarden, C., Roundy, J., and Wulfmeyer, V.: Land–Atmosphere Interactions: The LoCo Perspective, B. Am. Meteorol. Soc., 99, 1253–1272, https://doi.org/10.1175/BAMS-D-17-0001.1, 2018.
Schiro, K. A., Neelin, J. D., Adams, D. K., and Lintner, B. R.: Deep convection and column water vapor over tropical land versus tropical ocean: A comparison between the amazon and the tropical Western Pacific, J. Atmos. Sci., 73, 4043–4063, https://doi.org/10.1175/JAS-D-16-0119.1, 2016.
Schiro, K. A., Ahmed, F., Giangrande, S. E., and David Neelin, J.: GoAmazon2014/5 campaign points to deep-inflow approach to deep convection across scales, P. Natl. Acad. Sci. USA, 115, 4577–4582, https://doi.org/10.1073/pnas.1719842115, 2018.
Schneider, J. M., FIsher, D. K., Elliott, R. L., Brown, G. O., and Bahrmann, C. P.: Spatiotemporal variations in soil water: First results from the ARM SGP CART network, J. Hydrometeorol., 4, 106–120, https://doi.org/10.1175/1525-7541(2003)004<0106:SVISWF>2.0.CO;2, 2003.
Seneviratne, S. I., Corti, T., Davin, E. L., Hirschi, M., Jaeger, E. B., Lehner, I., Orlowsky, B., and Teuling, A. J.: Investigating soil moisture–climate interactions in a changing climate: A review, Earth Sci. Rev., 99, 125–161, https://doi.org/10.1016/j.earscirev.2010.02.004, 2010.
Siebesma, A. P., Soares, P. M. M., and Teixeira, J.: A Combined Eddy-Diffusivity Mass-Flux Approach for the Convective Boundary Layer, J. Atmos. Sci., 64, 1230–1248, https://doi.org/10.1175/JAS3888.1, 2007.
Song, H. J., Ferguson, C. R., and Roundy, J. K.: Land-atmosphere coupling at the southern great plains atmospheric radiation measurement (ARM) field site and its role in anomalous afternoon peak precipitation, J. Hydrometeorol., 17, 541–556, https://doi.org/10.1175/JHM-D-15-0045.1, 2016.
Tawfik, A. B., Dirmeyer, P. A., and Santanello, J. A.: The heated condensation framework. Part I: Description and southern great plains case study, J. Hydrometeorol., 16, 1929–1945, https://doi.org/10.1175/JHM-D-14-0117.1, 2015a.
Tawfik, A. B., Dirmeyer, P. A., and Santanello, J. A.: The heated condensation framework. Part II: Climatological behavior of convective initiation and land-atmosphere coupling over the conterminous United States, J. Hydrometeorol., 16, 1946–1961, https://doi.org/10.1175/JHM-D-14-0118.1, 2015b.
Taylor, C. M.: Detecting soil moisture impacts on convective initiation in Europe, Geophys. Res. Lett., 42, 4631–4638, https://doi.org/10.1002/2015GL064030, 2015.
Tuttle, S. and Salvucci, G.: Atmospheric science: Empirical evidence of contrasting soil moisture-precipitation feedbacks across the United States, Science, 352, 825–828, https://doi.org/10.1126/science.aaa7185, 2016.
Wakefield, R. A., Basara, J. B., Furtado, J. C., Illston, B. G., Ferguson, C. R., and Klein, P. M.: A modified framework for quantifying land–atmosphere covariability during hydrometeorological and soil wetness extremes in oklahoma, J. Appl. Meteorol. Clim., 58, 1465–1483, https://doi.org/10.1175/JAMC-D-18-0230.1, 2019.
Wang, G., Kim, Y., and Wang, D.: Quantifying the strength of soil moisture–precipitation coupling and its sensitivity to changes in surface water budget, J. Hydrometeorol., 8, 551–570, https://doi.org/10.1175/JHM573.1, 2007
Weaver, S. J. and Nigam, S.: Variability of the Great Plains Low-Level Jet: Large-Scale Circulation Context and Hydroclimate Impacts, J. Climate, 21, 1532–1551, https://doi.org/10.1175/2007JCLI1586.1, 2008.
Wilks, D. S.: Statistical methods in the atmospheric sciences, 3rd edn., Academic Press, 676 pp., ISBN 9780123850225, 2011.
Yin, J., Albertson, J. D., Rigby, J. R., and Porporato, A.: Land and atmospheric controls on initiation and intensity of moist convection: CAPE dynamics and LCL crossings, Water Resour. Res., 51, 8476–8493, https://doi.org/10.1002/2015WR017286, 2015.
Zhang, Y. and Klein, S. A.: Mechanisms Affecting the Transition from Shallow to Deep Convection over Land: Inferences from Observations of the Diurnal Cycle Collected at the ARM Southern Great Plains Site, J. Atmos. Sci., 67, 2943–2959, https://doi.org/10.1175/2010jas3366.1, 2010.
Zhuang, Y., Fu, R., Marengo, J. A., and Wang, H.: Seasonal variation of shallow-to-deep convection transition and its link to the environmental conditions over the Central Amazon, J. Geophys. Res., 122, 2649–2666, https://doi.org/10.1002/2016JD025993, 2017.
Zhuang, Y., Fu, R., and Wang, H.: How do environmental conditions influence vertical buoyancy structure and shallow-to-deep convection transition across different climate regimes?, J. Atmos. Sci., 75, 1909–1932, https://doi.org/10.1175/JAS-D-17-0284.1, 2018.